
Rockfall Vulnerability of a Rural Road Network—A Methodological Approach in the Harz Mountains, Germany


Applied Physical Geography, Faculty II—Natural and Social Sciences, University of Vechta, 49377 Vechta, Germany
*
Author to whom correspondence should be addressed.
Geosciences 2022, 12(4), 170; https://doi.org/10.3390/geosciences12040170
Submission received: 23 February 2022
/
Revised: 25 March 2022
/
Accepted: 11 April 2022
/
Published: 13 April 2022
(This article belongs to the Special Issue Landslide Monitoring and Mapping)
Abstract
:Mass movements are linked to increasing amounts of damage and disruptions to transportation infrastructures. A valid risk assessment in order to reduce future costs is not always appropriate, as adequate information on landslide data is missing. The presented study estimates the rockfall susceptibility on a rural road network in the Harz mountains using a bivariate statistical method (information value method). The model is validated using a receiver operating characteristic (ROC) analysis. In addition, the vulnerability of the road network is estimated using vulnerability indicators. The susceptibility model assigns a high or very high susceptibility to 23% of the area in the road network corridor. The relevant road sections are linked to high slope values, NE orientations of road sections, and low-to-moderate vulnerability values. The highest vulnerability values can be found on marginal road sections with high average daily traffic volumes. The combination of the presented methods proposes an easily applicable estimate of vulnerability where conventional methods (i.e., vulnerability curves, matrices) cannot be implemented.
1. Introduction
Mass movements are complex processes, variable in size and movement mechanisms [1,2,3]. In many countries, high socioeconomic losses are linked to landslides [4,5,6]. Considering linear infrastructures such as transportation lines, the occurrence of mass movements results in cost-intensive damage and disruptions to important routes providing essential goods and services [7,8].
In general, different types of mass movements involving rocks can be distinguished: falls, topples, slides, and spreads. Rockfalls are movements where fragments of variable size detach from the solid rock and fall, roll, or bounce in a fast downward movement. Topples are movements where rock masses collapse in a rotational movement due to jointing and a basal detachment. Slides can be categorized according to the sliding surface, translational slides for movements on a planar surface and rotational slides if the sliding surfaces are curved [1,2,3].
In general, landslide susceptibility is defined as the spatial probability of a landslide occurring [9,10]. For that purpose, geo-environmental factors are taken at mapped landslide locations to identify potential areas of failure [11]. Depending on the availability and the quality of the data, as well as the scale of the study area, different methods can be applied [9,12]. In general, qualitative and quantitative methods can be distinguished [11]. Whereas qualitative (heuristic) methods are based on expert opinion, quantitative methods use statistical or deterministic approaches to estimate landslide susceptibility. Statistical methods can be subdivided into bivariate and multivariate. While, in bivariate statistics, landslide densities are combined with weighted factors, in multivariate statistics, correlations and interactions of these factors are considered [13,14]. For regional scales, bivariate statistical methods are well established [13,14,15], among which are the information value method [16,17] and the weights-of-evidence [18].
In comparison to susceptibility, vulnerability is not as clearly defined. In general, vulnerability includes a degree of loss of a given element or a set of elements at risk [12,19]. When considering the vulnerability of a road network, the degree of loss is reinterpreted as a reduction in road network serviceability [20]. Methods to quantify vulnerability vary depending on the elements at risk. Whereas the vulnerability of people concerns the fatalities and injuries of people, physical vulnerability refers to the damage of buildings, utilities, and infrastructure [12,19]. Different approaches can be distinguished to quantify physical vulnerability. The most common include vulnerability matrices, curves, and indicators [21,22]. While vulnerability matrices estimate the degree of loss based on damages, vulnerability curves are used to quantify potential damages by a monetary value. Vulnerability indicators were originally applied in social vulnerability and can be described as “variables which are operational representations of a characteristic or quality of the system able to provide information regarding the susceptibility, coping capacity and resilience of a system to an impact of an albeit ill-defined event” [23].
In the south of Lower Saxony, the dispositioning and triggering factors of landslides, as well as mitigation measures and related costs, have been studied before [24,25,26]. However, a resilient model to estimate the susceptibility or vulnerability of the road network in the Harz mountains is missing. The susceptibility of landslides in the Harz mountains on a larger regional scale has been modeled before using the information value method [25].
In the present study, a GIS-based rockfall susceptibility is assessed and mapped in addition to the vulnerability of the rural road network corridor in the Western Harz mountains. For the susceptibility modeling, the information value method is applied. Afterward, the model is tested with a receiver operating characteristic (ROC) analysis. The vulnerability is assessed using an indicator-based-method. The presented methods are combined for a preliminary risk assessment, especially when loss data are not available.
2. Study Area
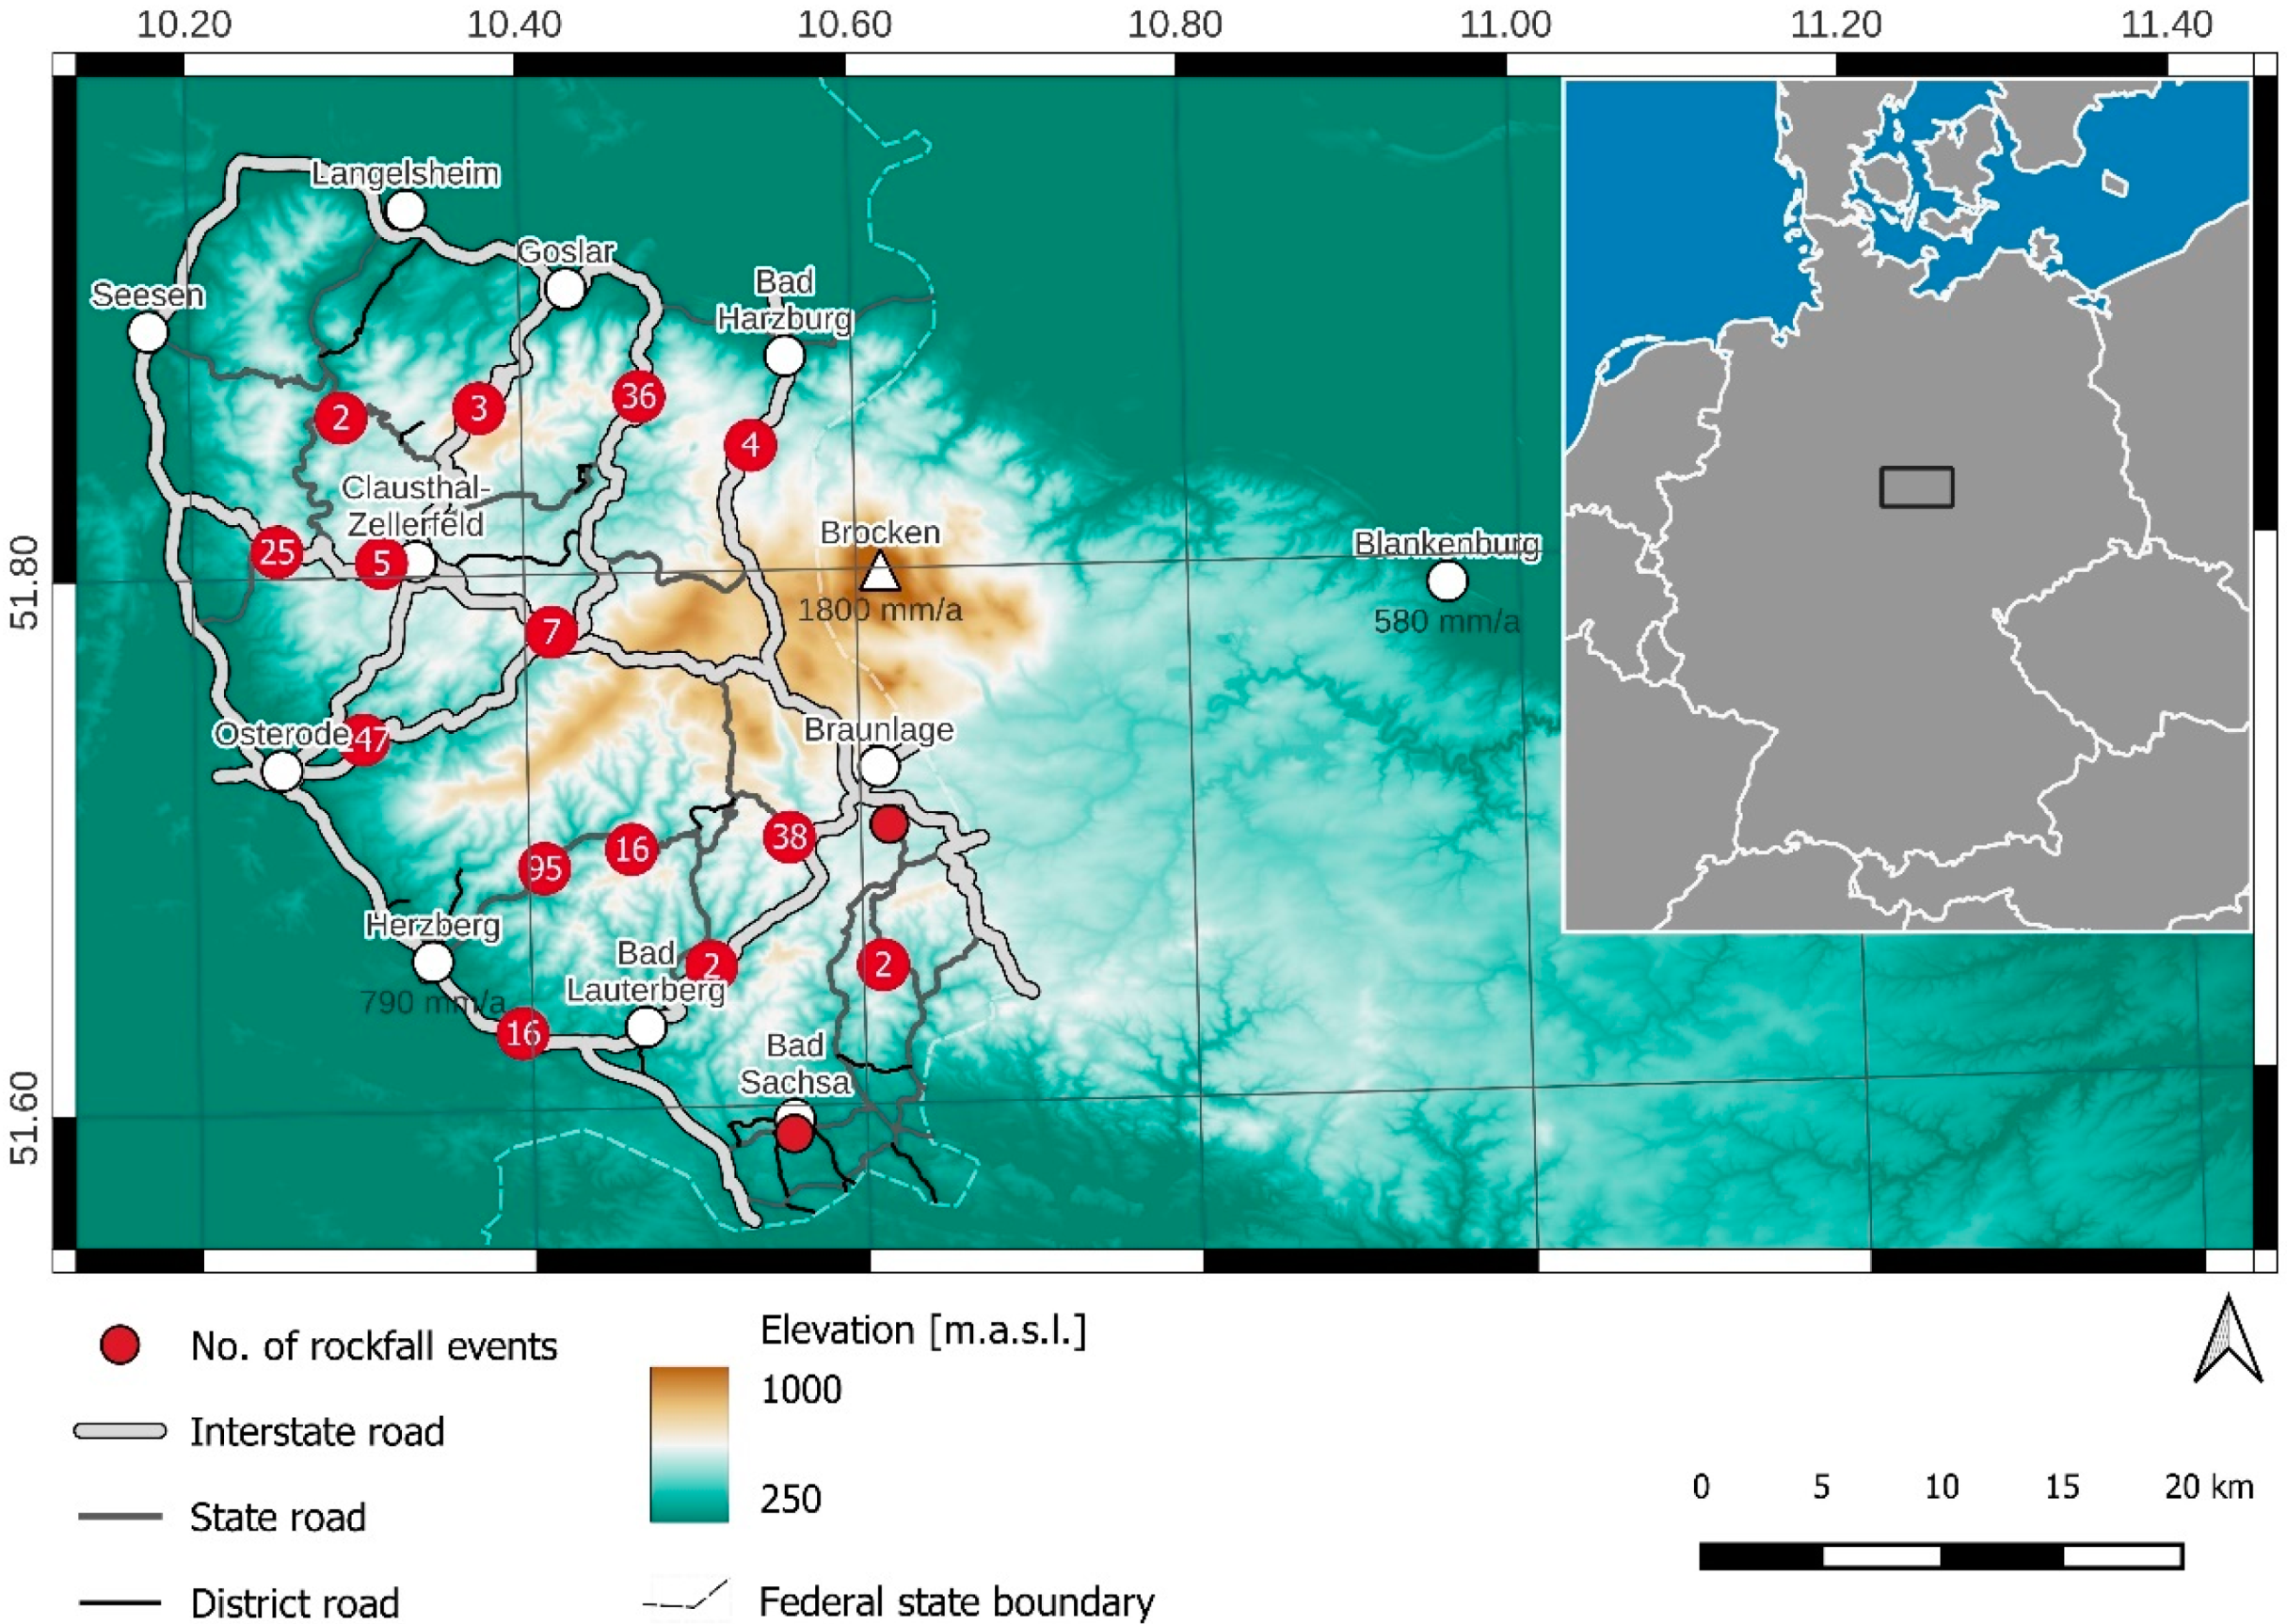
The Harz Mountains are part of the Central Uplands in Germany, with an area of approximately 2200 km2. The area is part of the federal states of Lower Saxony, Saxony-Anhalt, and, to a minor extent, Thuringia. In general, the mountain range strikes in the NNE-SSW direction, and the elevation varies between 130 and 1140 m a.s.l, with the Brocken as highest summit in the region.
The climate of the Harz mountains can be described as temperate continental with precipitation all-year-round, with slightly higher precipitation in summer than in winter. Annual precipitation at the Harz mountains from the years 1990 to 2020 varied between 320 and 2700 mm/a. Due to the westward movement of low-pressure zones, precipitation sums decrease from West to East and from high to low elevations. For instance, at the Brocken summit, the mean annual precipitation was 1800 mm/a, in Herzberg, at the SW margin of the Harz mountains, 790 mm/a, and in Blankenburg, on the NE margin, 580 mm/a between the years 1990 and 2020 (stations displayed in Figure 1) [27].
The Harz mountains are composed of Paleozoic sedimentary rocks, especially from the Devonian and Carboniferous, which show occasionally metamorphic recrystallizations due to low-temperature and low-pressure conditions. In addition, granites can be found near the plutons at the Brocken summit and the valley of the river Oker. In the valleys, the rocks are covered with alluvial and glacial deposits [28].
The modern road network in the Harz mountains can already be found on historical maps of the region (Prussian Survey, 1877–1912), except for roads tracing historical trains lines or local bypasses that have been created to reduce traffic volumes in town centers. In general, the road network is closely linked to the valleys as efforts in road construction have been minimized in that manner. Road-cuts have been created by rock blasting or material removal by hand on the interior slope of the road. Then, the removed material was used to create the exterior slope with a leveled road surface [4,29]. With an increasing traffic volume, the existing roads were expanded in the same manner.
Rockfalls are particularly linked to the over-steepened interior slopes of the road side, whereas landslides occur at the exterior slope, especially when materials for road construction are not sufficiently consolidated.
3. Materials and Methods
3.1. Rockfall Data
In the western part of the Harz mountains, n = 351 rockfall events have been registered. A high percentage of the dataset is extracted from the German Landslide Database [30]. Rockfall events in the region have been registered since 1874, with the youngest events being reported in June 2021. Most information is gathered from the scientific and geotechnical literature, as well as studies from state inventories and web archives, in addition to newspaper and web reports. The data include information related to landslide and rockfall characteristics, dimensions and dynamics, and soil and lithologic, as well as geomorphometric, properties. In order to condense the dataset, archive studies have been executed to enrich the dataset with information about reparation and mitigation measures.
Information on the block size of rockfalls is collected in Table 1. The block size for rockfall events is noted as the maximum length of block edges and varies between very small (<10 cm) and intermediate size (50–100 cm).
In addition, n = 65 mitigation sites are reported at road sections in the area. For these sites, only general information on the type of information is available (i.e., material removal and road repair works). In combination with rockfalls, n = 416 events were the base for the susceptibility modeling (cf. Figure 1). The rockfalls are linked to an area of 4.2 km2, which is approximately 10% of the analyzed road corridor area. In addition, n = 277 mass movements have been registered in the Harz mountains that are not rockfalls, with most of them being linked to subsidence of the exterior slope of the road. These events were excluded from the susceptibility modeling.
3.2. Thematic Maps
In order to model the rockfall susceptibility, various geo-environmental factors are used in a GIS-based analysis. Existing rockfall events are used to infer spatial propensities for future rockfalls. The selection of susceptibility factors depends on the study area, landslide types, and failure mechanisms [12]. For this study, the following factors were used: elevation, slope angle, material characteristics (geotechnical classification), orientation of road section and distance from faults, annual precipitation, and number of ice days.
3.2.1. Morphometry
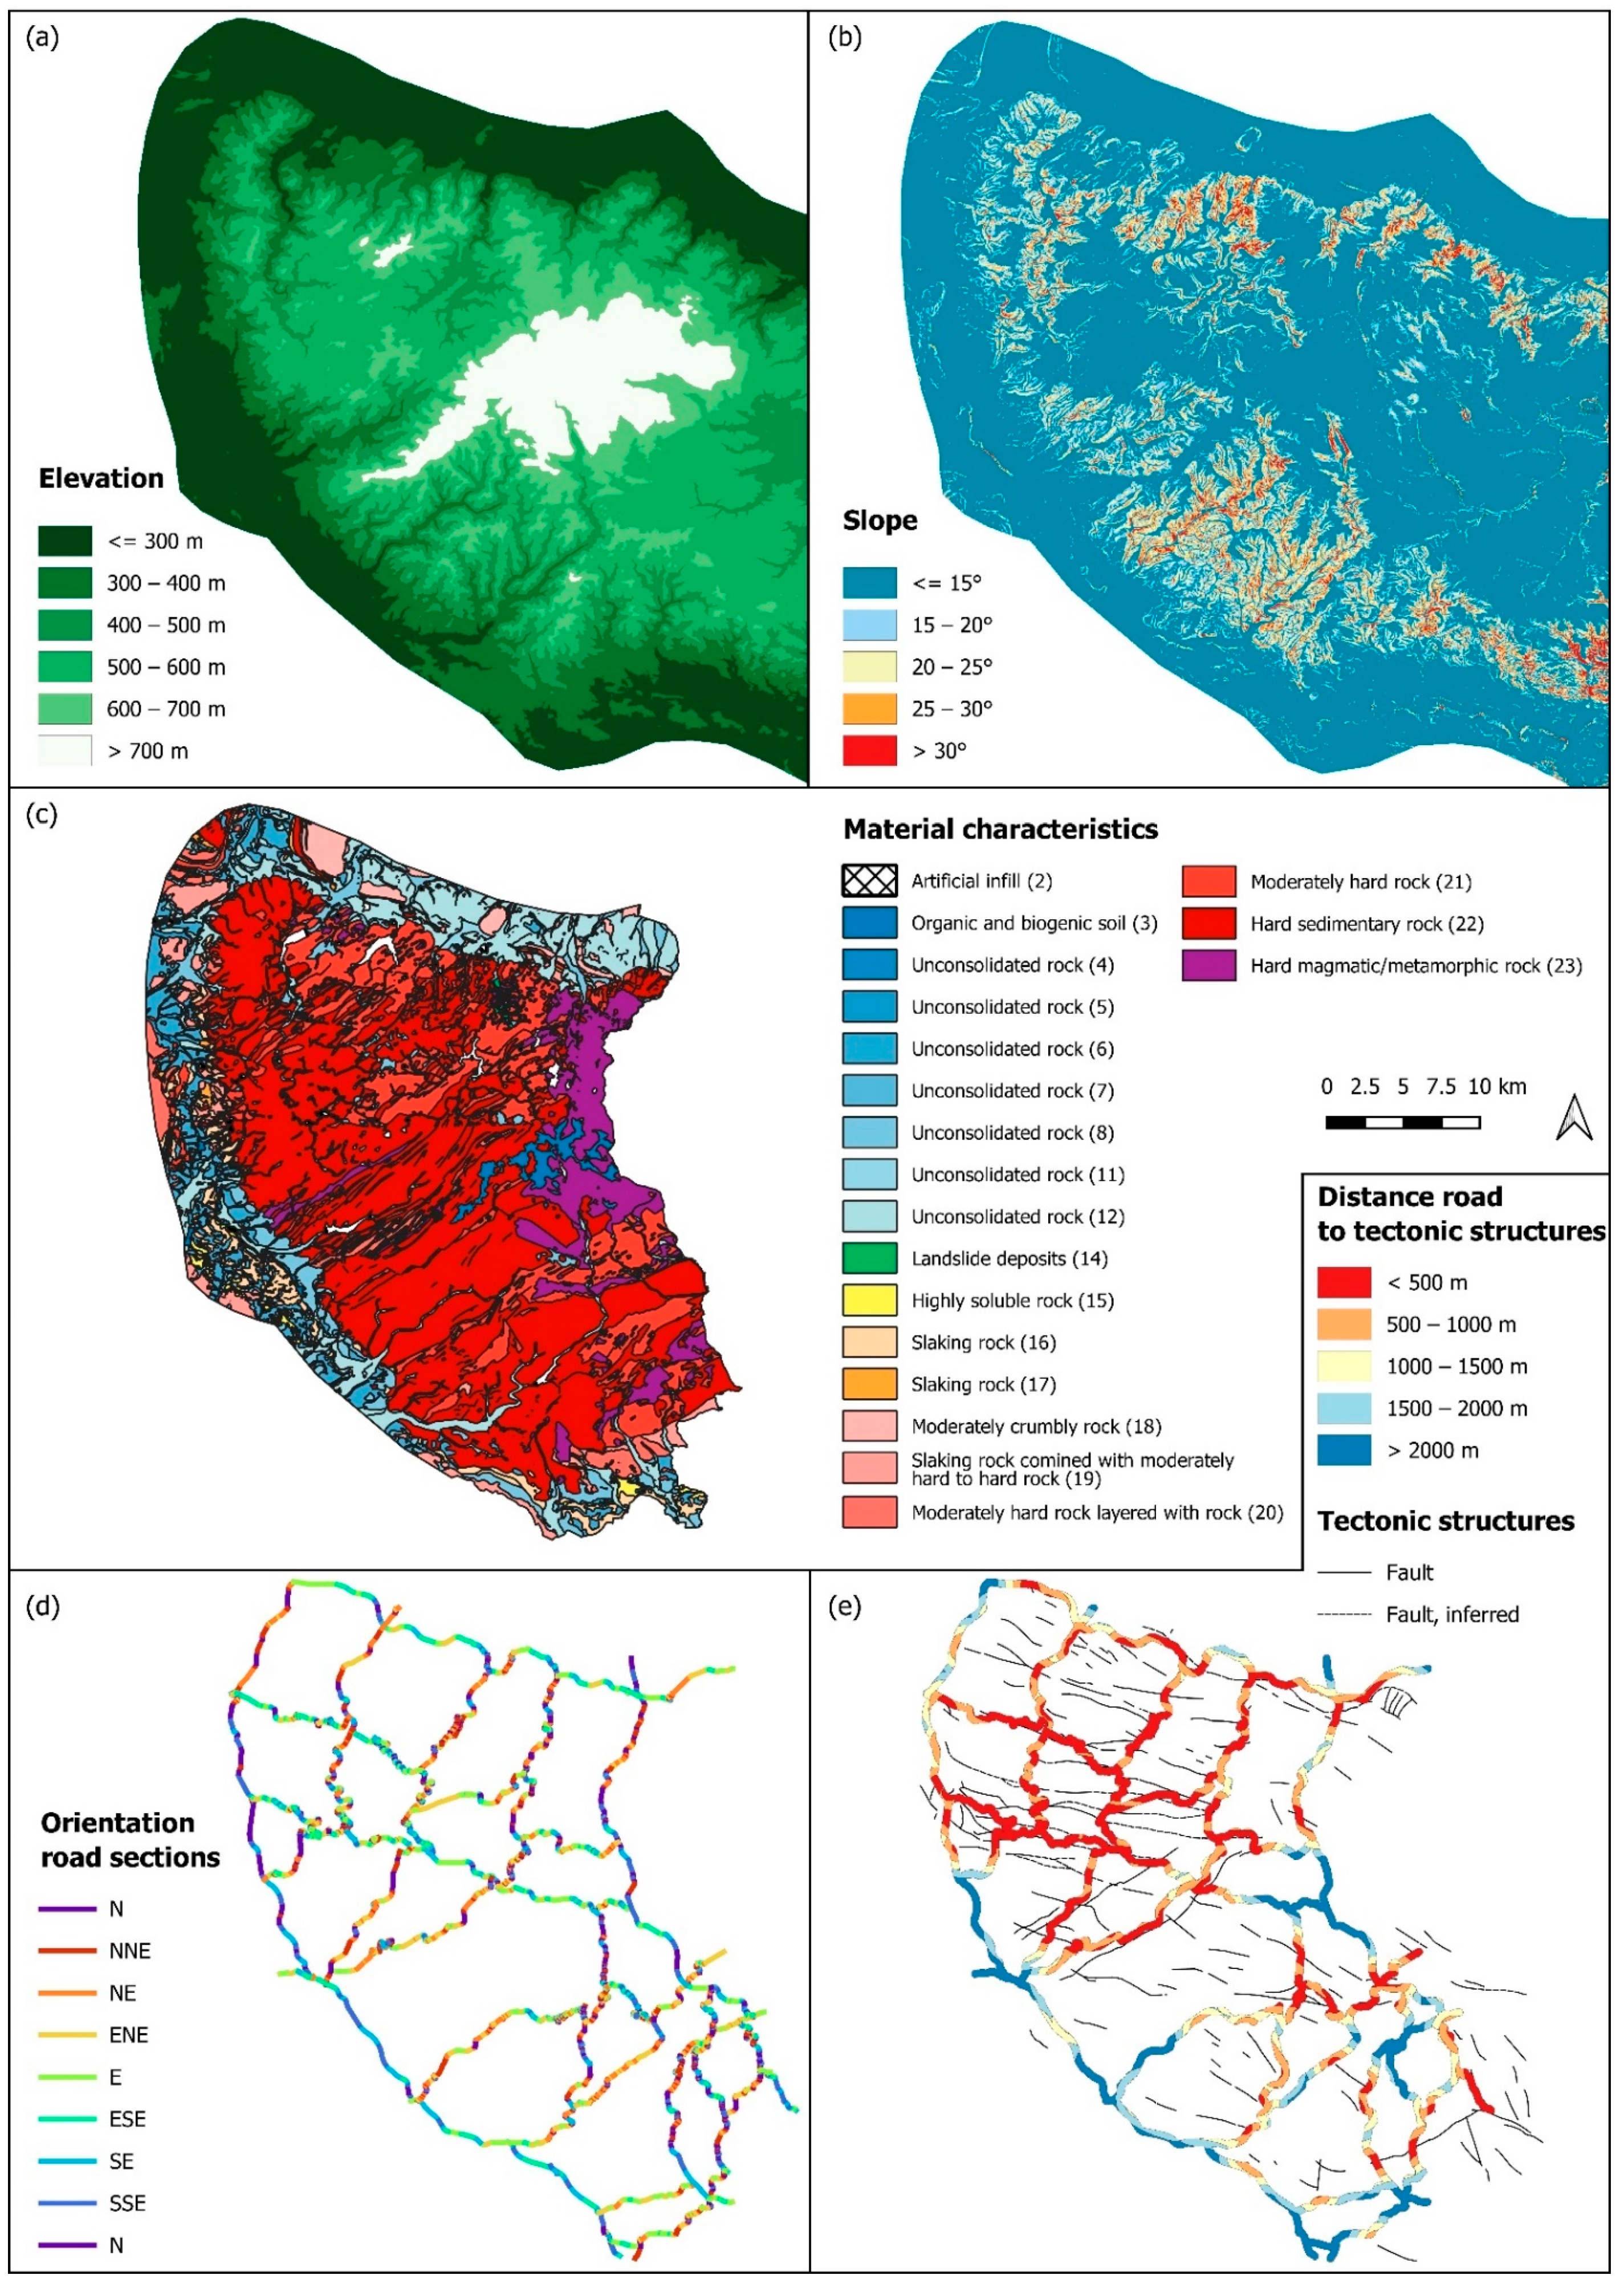
As morphometric factors, elevation and the slope angle were considered. The elevation data have a ground resolution of 20 m [31]. The elevation in the Harz mountains varies between 130 and 1120 m.a.s.l. (Figure 2a). The majority of rockfalls are registered at elevations of <300 m (17%) resp. at 300–400 m (75%). As rockfalls are closely linked to cut slopes, the elevation of these events is closer to the elevation of the valley bottoms.
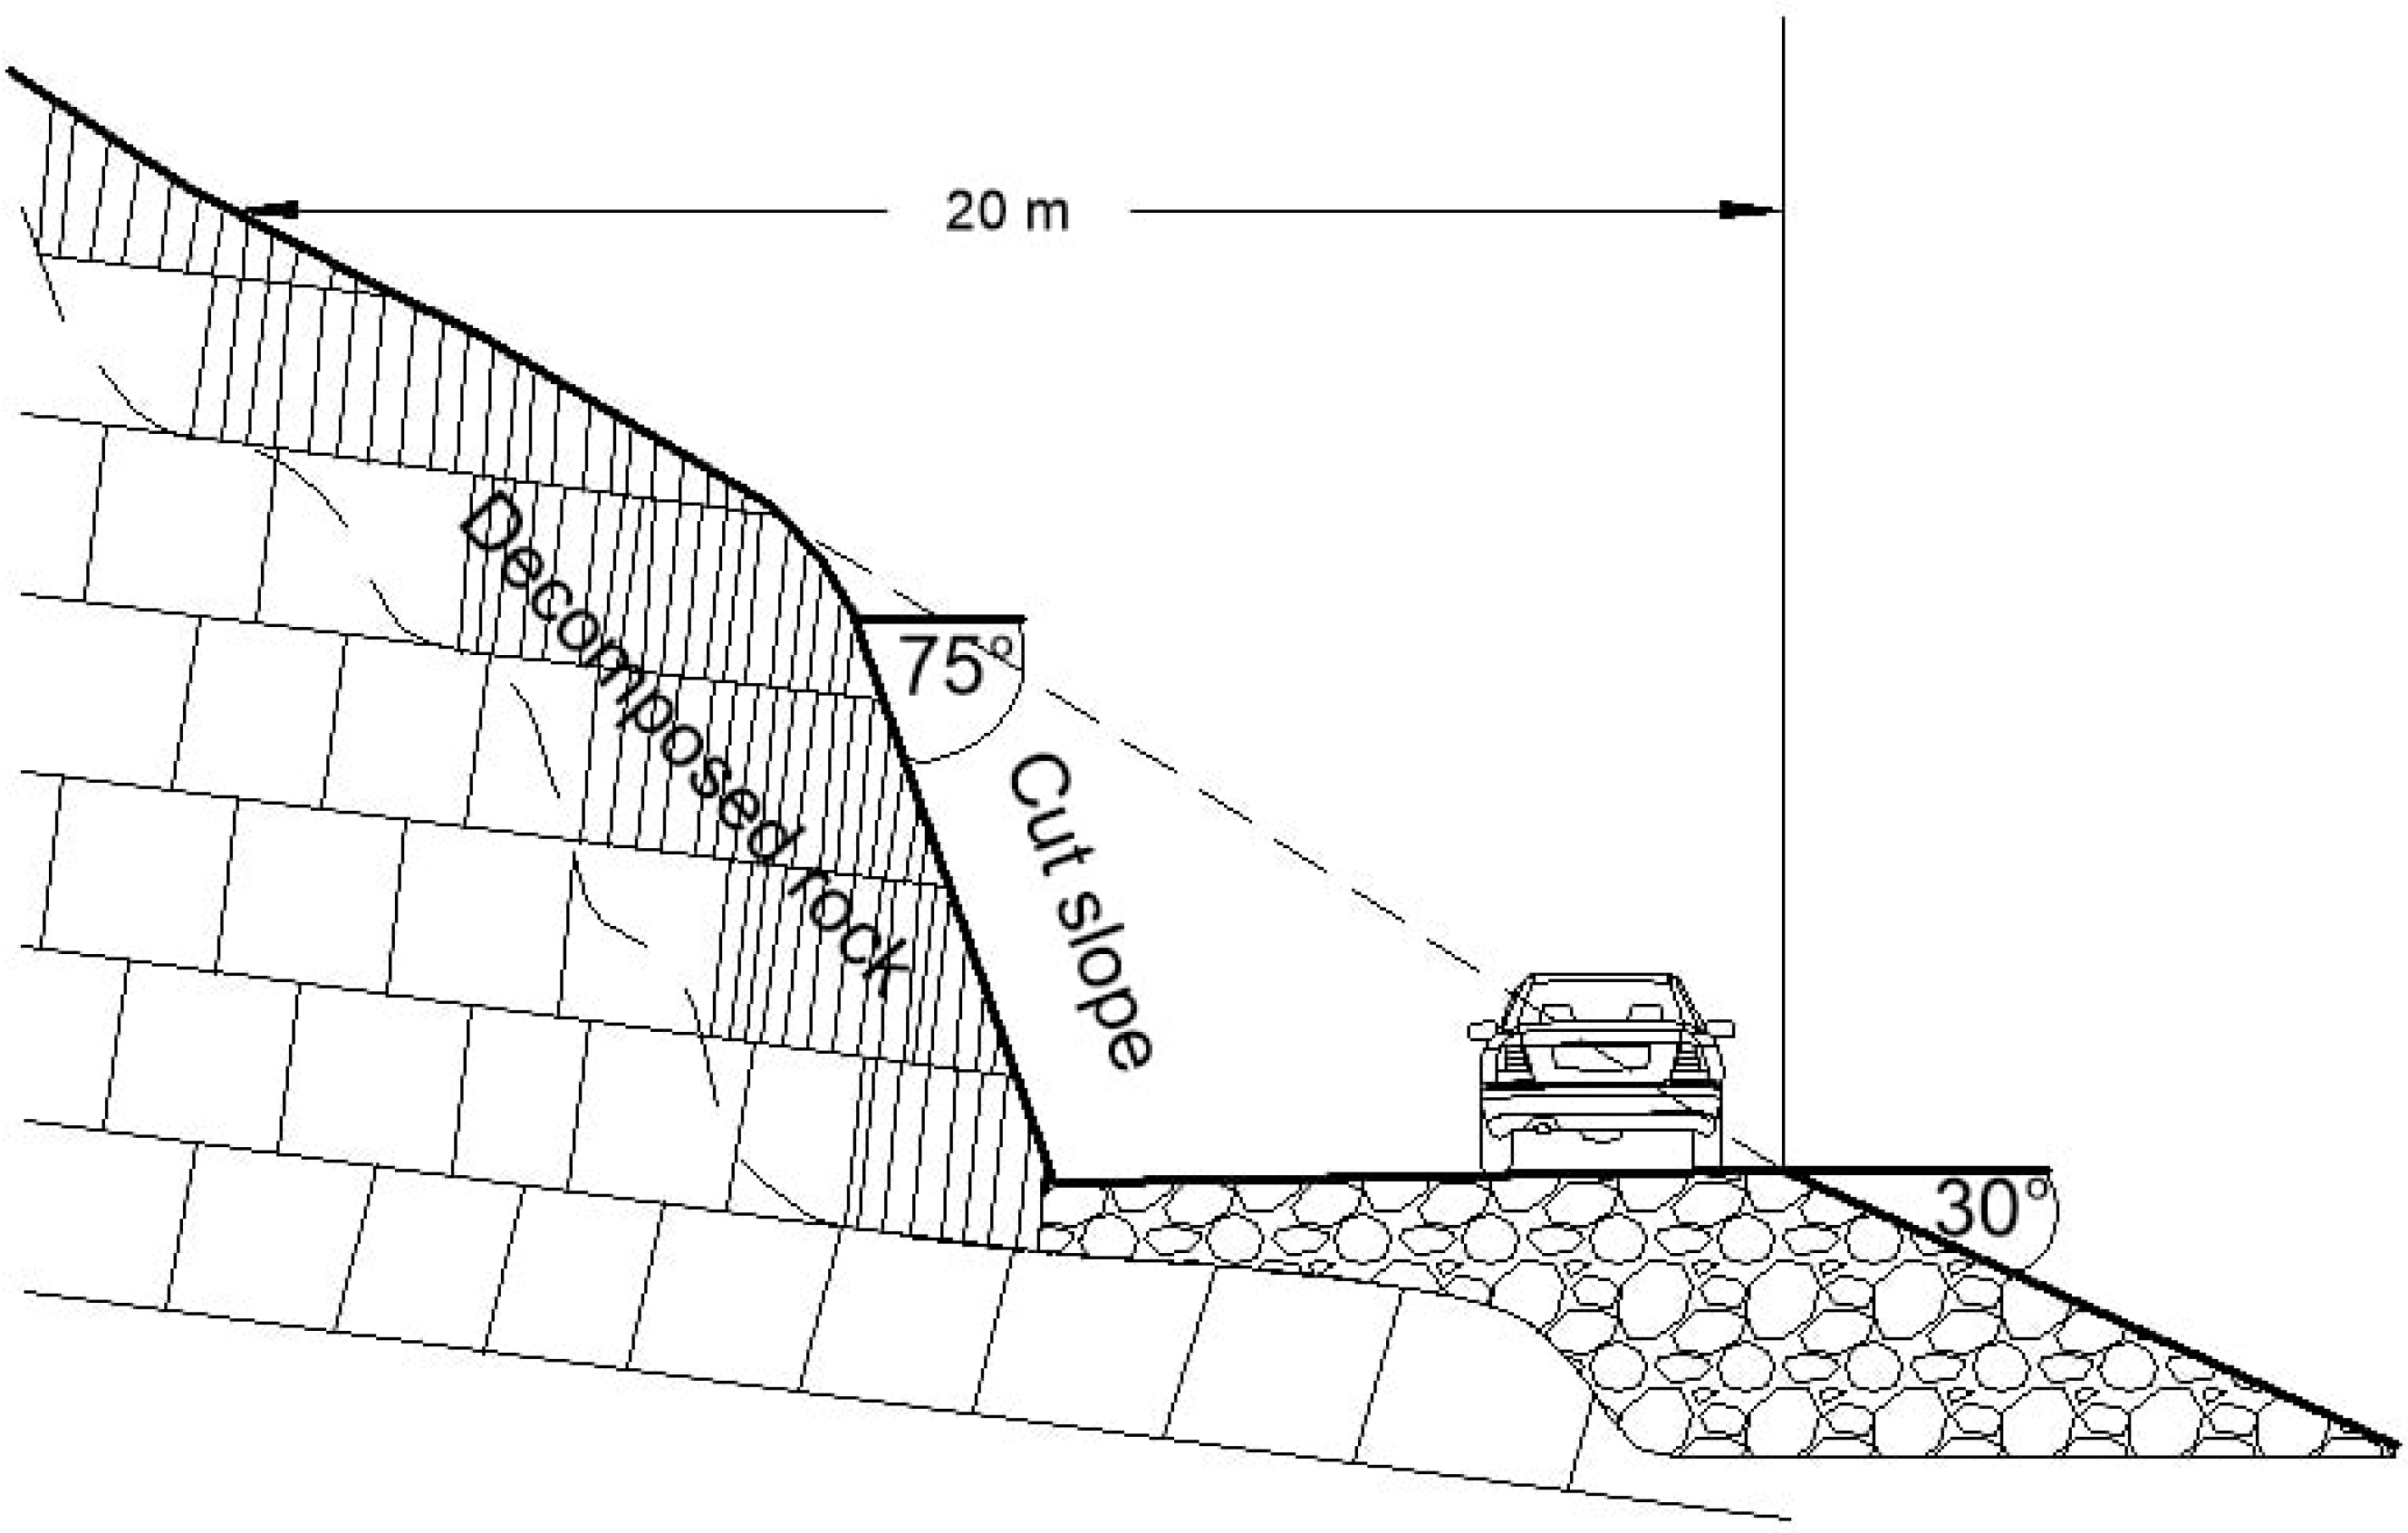
From the elevation data, the slope angle was calculated in QGIS (Figure 2b). The slope angle varies between 0 (flat) and 58°. Most rockfall events are registered at angles of <15°, 15–20°, and 20–25° (23, 20, resp. 31%). These slope values in the road corridor must be considered underestimated, due to the ground resolution of the elevation data of 20 m. Figure 3 illustrates the situation: the steep-cut slopes (slope angle ~75°), created during road construction, are not displayed in the elevation model; instead, a slope angle of 30° is registered.
3.2.2. Material Characteristics
Information on material characteristics was extracted from the engineering geological map of Lower Saxony with a scale of 1:50,000 [32]. The map was produced from the equally scaled geological map and displays the ground material type at a depth of 2 m beneath the surface. This implies that covering deposits with an estimated depth of less than 2 m are not mapped. In the map, 23 different ground material types are distinguished; 18 can be found in the Harz mountains area. Table 2 describes the occurring materials, and Figure 2c shows their distribution in the area. The majority of rockfalls occurred in ground types 22 (sedimentary rocks, 53%), 11, and 12 (incohesive unconsolidated rock 35% resp. 9%).
3.2.3. Structural Geology
The structural features in the Harz mountains often coincide with the valleys of the Harz mountains and therefore affect the orientation of the road network. Hence, orientation of the road sections was used as a measure of tectonic influence.
The orientation was noted as a direction between 0 and 180°. The values were noted as the true direction, not the strike direction. The road sections affected by rockfalls were oriented to Northern and Eastern directions (N—10%, NNE—8%, NE—51% and ENE—20%; Figure 2d). Most rockfalls occurred at road sections with a NE resp. ENE orientation (52 resp. 20%).
In addition to the road segment orientation, the distance to tectonic faults was determined. Tectonic faults were taken from the Geologic Map of Lower Saxony 1:200,000 [33]. The distances varied between 0 and 2800 m. The majority of rockfalls could be observed at distances of less than 1000 m from structural faults (51%).
3.2.4. Meteorological Conditions
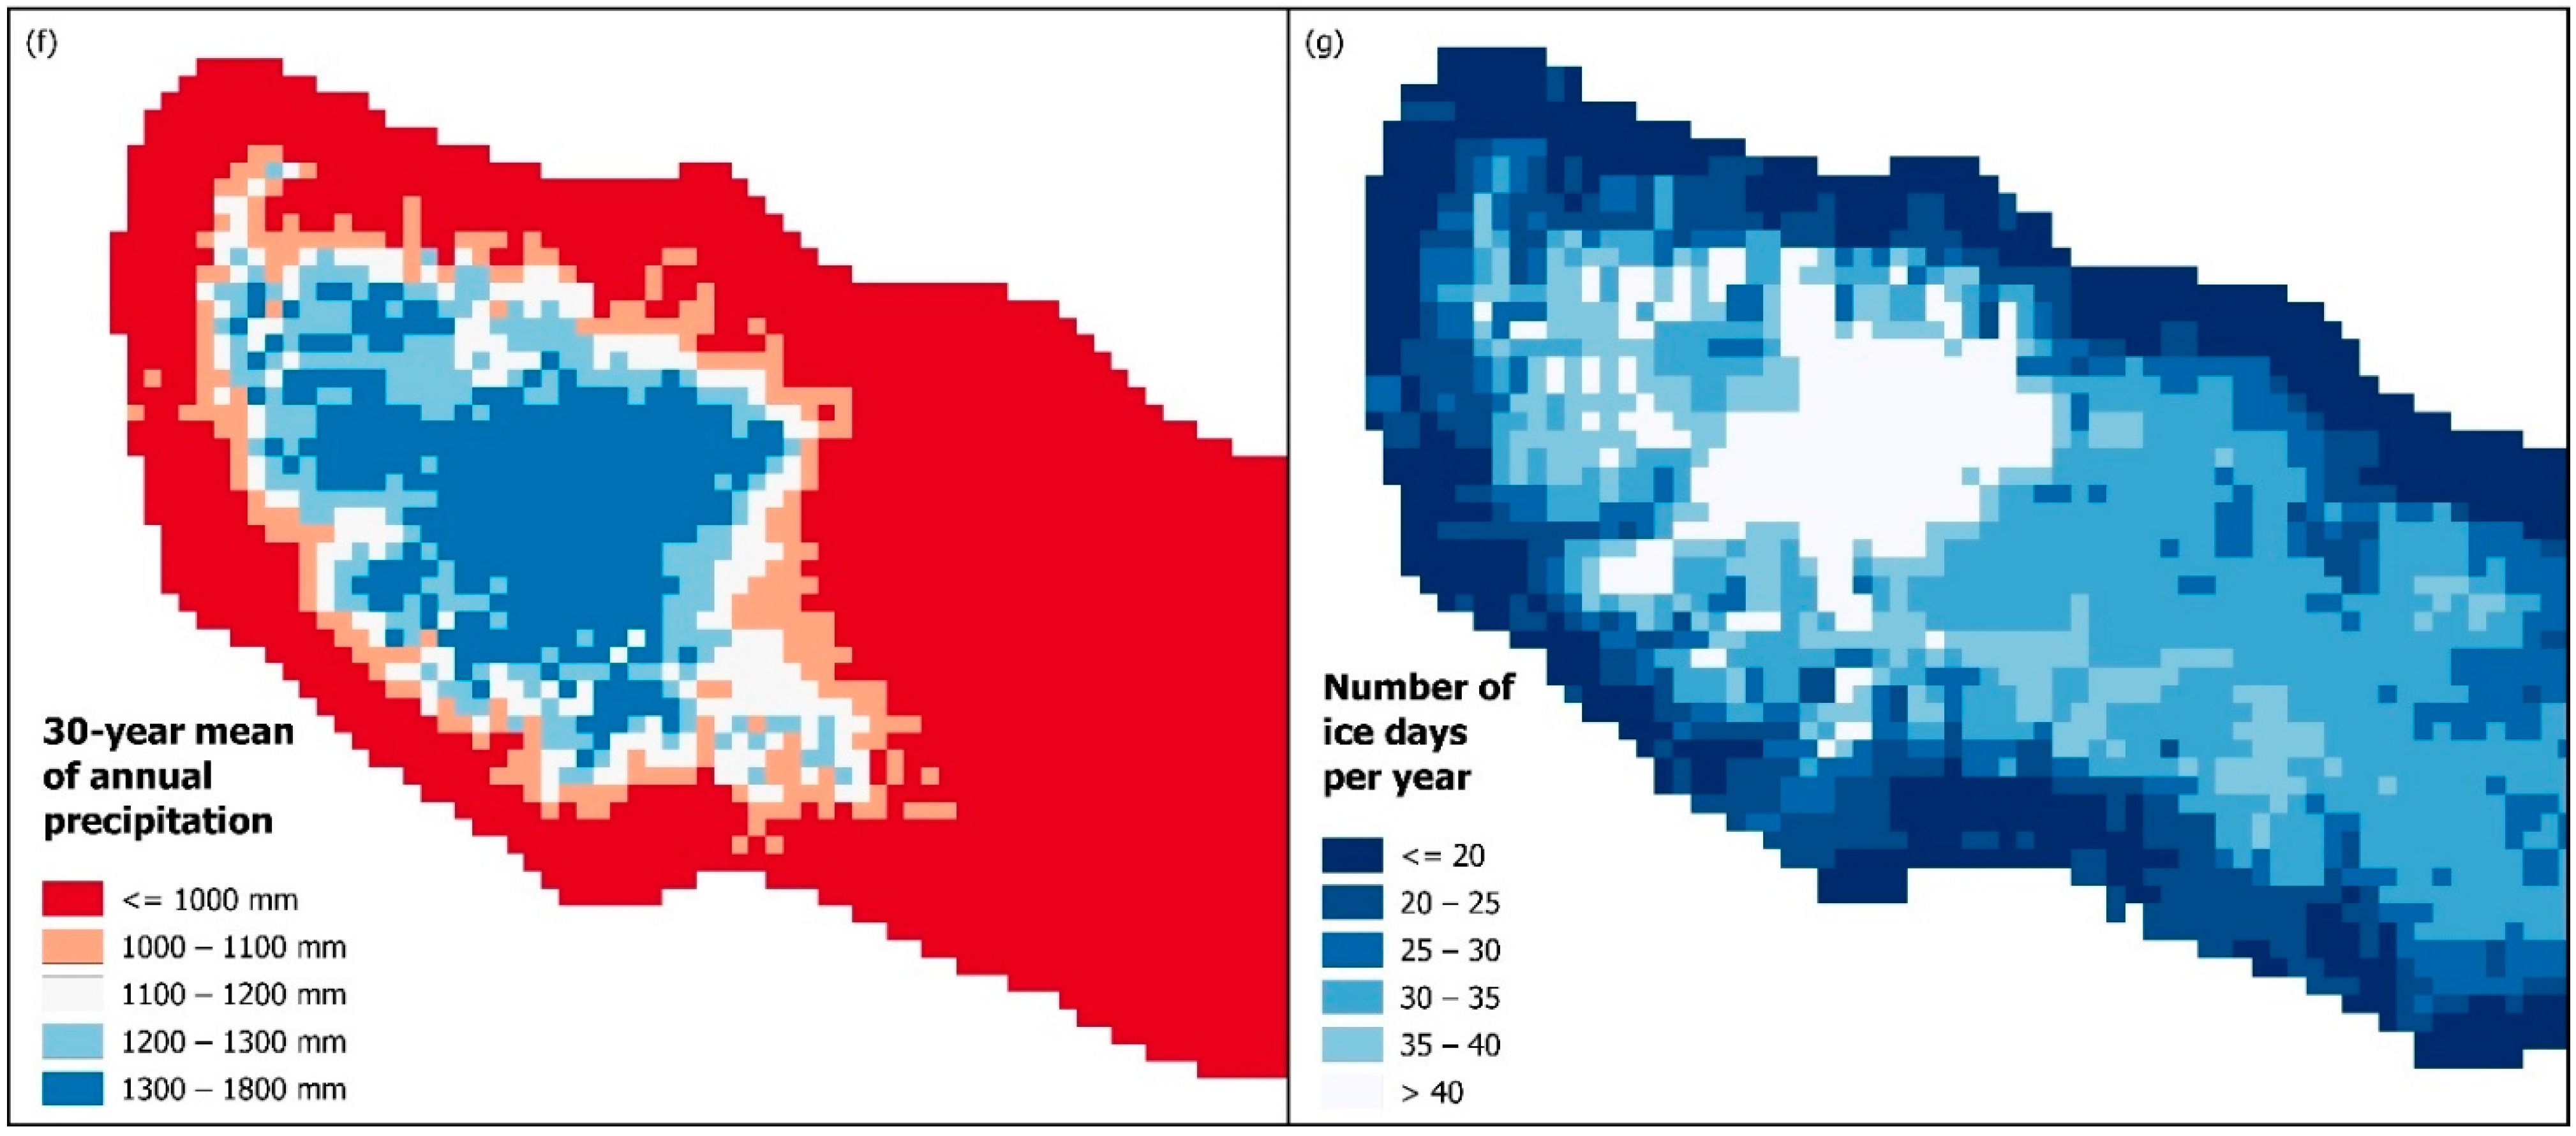
Meteorological data were extracted as raster data with a resolution of 1 × 1 km [27]. For precipitation, the 30-year mean of annual sums between 1991 and 2020 was considered. Precipitation in the region can be considered as predisposing as well as triggering [34]. The 30-year annual mean was calculated from raster data of monthly precipitation sums [27]. Values varied between 430 and 1750 mm/a (Figure 2f). Rockfall events occurred especially at precipitation sums of 1000–1200 mm/a (79%).
In addition to annual precipitation sums, the mean annual number of ice days was used. For an ice day, the maximum air temperature was below 0 °C. The mean value was calculated from raster data of annual values between 1991 and 2020 [27]. Annual sums of ice days varied between 14 and 60 days. The majority of landslides could be found with 20–25 ice days (42%) and 35–40 ice days (32%).
3.3. Susceptibiliy Modeling and Model Validation
For the rockfall susceptibility model, a bivariate statistical approach, i.e., information value method, was used. In this method, a weighted value (IV) was calculated from the categorized factors. The information value for each class Xi is calculated in the following form [17]:
where Ni is the number of pixels in class Xi, N is the total number of pixels affected by rockfalls in the area, S is the number of pixels in class Xi, and N is the total number of pixels in the area. The natural logarithm of the quotient results in an easier interpretation of the result.
If the information value is negative and the rockfall density is lower than average, positive values indicate a density higher than average of registered rockfall events. This implies that areas with positive information values are more susceptible for rockfalls, and the higher the value, the more likely slope instabilities become [24,35]. In classes where an information value could not be calculated (no rockfall pixels in the relevant class), the information value was set to −10.
A rockfall susceptibility index for each pixel is then calculated by:
The described method was performed using a portion of the rockfall dataset in a GIS environment using QGIS software [36]. The susceptibility index was calculated in a road corridor of 100 m with the road corridor centered. Finally, the susceptibility was categorized using natural breaks.
In order to validate the susceptibility model, the data not used for modeling were taken for model testing. Testing of the model was performed to evaluate the reliability of the model. For that purpose, a receiver-operating characteristic (ROC) plot was prepared [37]. The plot displays the false positive rate versus the true positive rate. From the calculated area under the curve (AUC), the success rate of the model can be evaluated. The AUC varies between 0.5 and 1. From values close to 1 of the AUC, a good fit of the model could be inferred [37]. The rockfall data were not chosen randomly (cf. [15,24]); instead, mitigation sites were selected (n = 65). The set of mitigation sites summed up to 0.48 km2, whereas the training data covered 0.17 km2.
3.4. Assessment of Road Network Vulnerability to Rock Falls
For the vulnerability assessment, the road network was subdivided into 139 road sections. The sections were set according to the road information data pool of Lower Saxony (NWSIB) [38]. In general, a road section marked a segment between two road intersections, for instance, an intersection of interstate and district road. The road network vulnerability was estimated with the indicator-based method (IBM) [20,23]. Vulnerability factors were chosen, weighted, and summarized. For each road section, the vulnerability index (VIs) was calculated as follows:
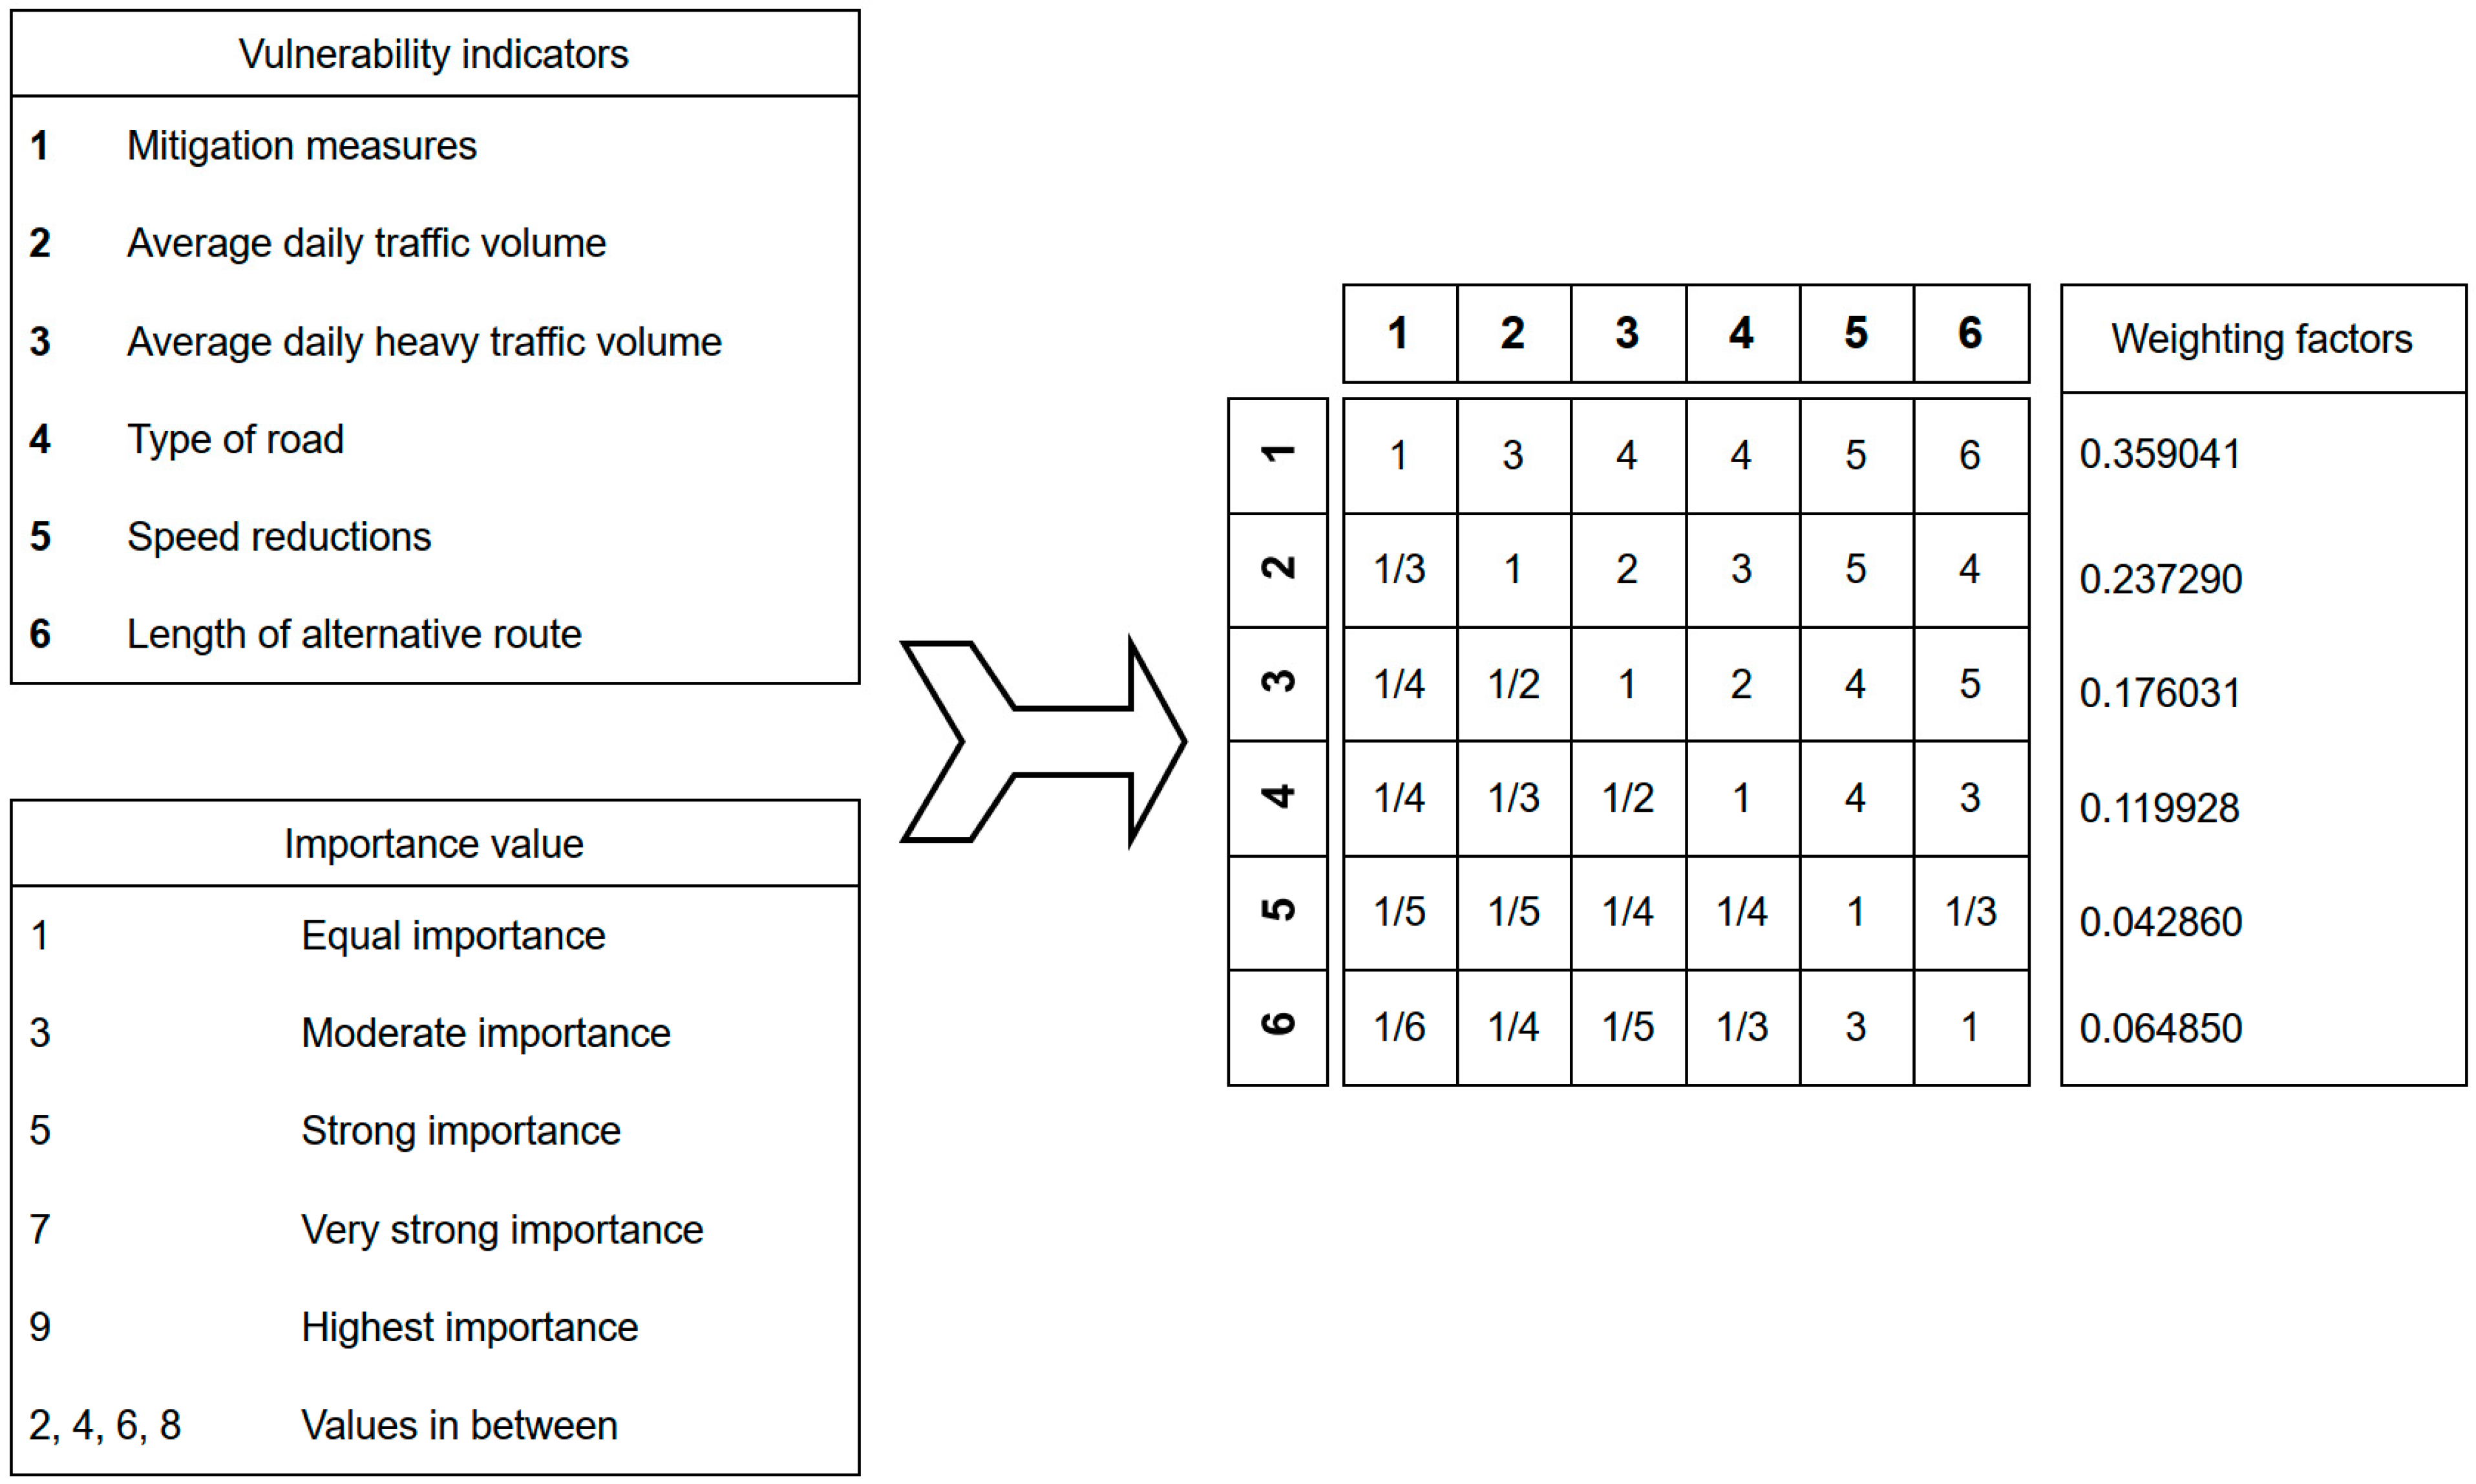
where wi is the weighted factor of the indicator and Ji is the indicator value of the vulnerability factor. The chosen vulnerability factors were mitigation measures, average daily traffic volume, the average daily heavy traffic volume, the type of road, speed reductions, and length of alternative routes. Mitigation measures were categorized according to the type of applied mitigation (i.e., scaling and trimming or structural measures). When structural measures were applied, the percentage of the retained road length versus affected road length was considered. The average daily traffic volumes were taken from the map of traffic volumes of Lower Saxony of 2015 [38]. The road type was determined according to the state authority for road construction and traffic (NLStBV) and the number of lanes and road width were extracted from aerial photographs [39]. The speed reductions were estimated in terms of length and type of speed limit. Afterward, the percentage of speed reductions was calculated by comparing it to the speed limit of 100 km/h, which applies to roads without structural separated lanes [40]. The speed limit values were extracted from OSM data [41]. Alternative routes were determined with OSM routing [42]. The length of the alternative route was expressed as a percentage of the length of the original road section. The categories of the vulnerability factors are summarized in Table 3.
The weighting factors were determined with an analytical hierarchy process (AHP) [43]. In the first step in the process, the factors were compared to each other and were ranked with a value between 1 and 9 resp. the reciprocal, according to their importance. The value 1 implies that the factors are equally important, a value of 3 marks a moderate importance, a value of 5 marks a strong importance, a value of 7 marks a very strong importance, and a value of 9 marks a very high importance. The values were listed in a matrix and the eigenvector values were calculated in a simplified calculation. Figure 4 displays the vulnerability factors and the analytical hierarchy process for the weighting factors.
4. Results
4.1. Landslide Susceptibilty
The calculated information values vary between −5.13 and 2.00 (if values of −10.0 are not considered). For the single factors, the highest values are in the classes of 300–400 m elevation (1.36), slope of 25–30° (2.00), material class of hard sedimentary rocks (22; 0.62), a road orientation to the NE (1.53), a distance of 500–1000 m to tectonic faults (0.37), a mean annual precipitation sum of 1000–1100 mm (1.72), and an annual mean of 20–25 ice days (0.83). The calculated information values are listed in Table 4.
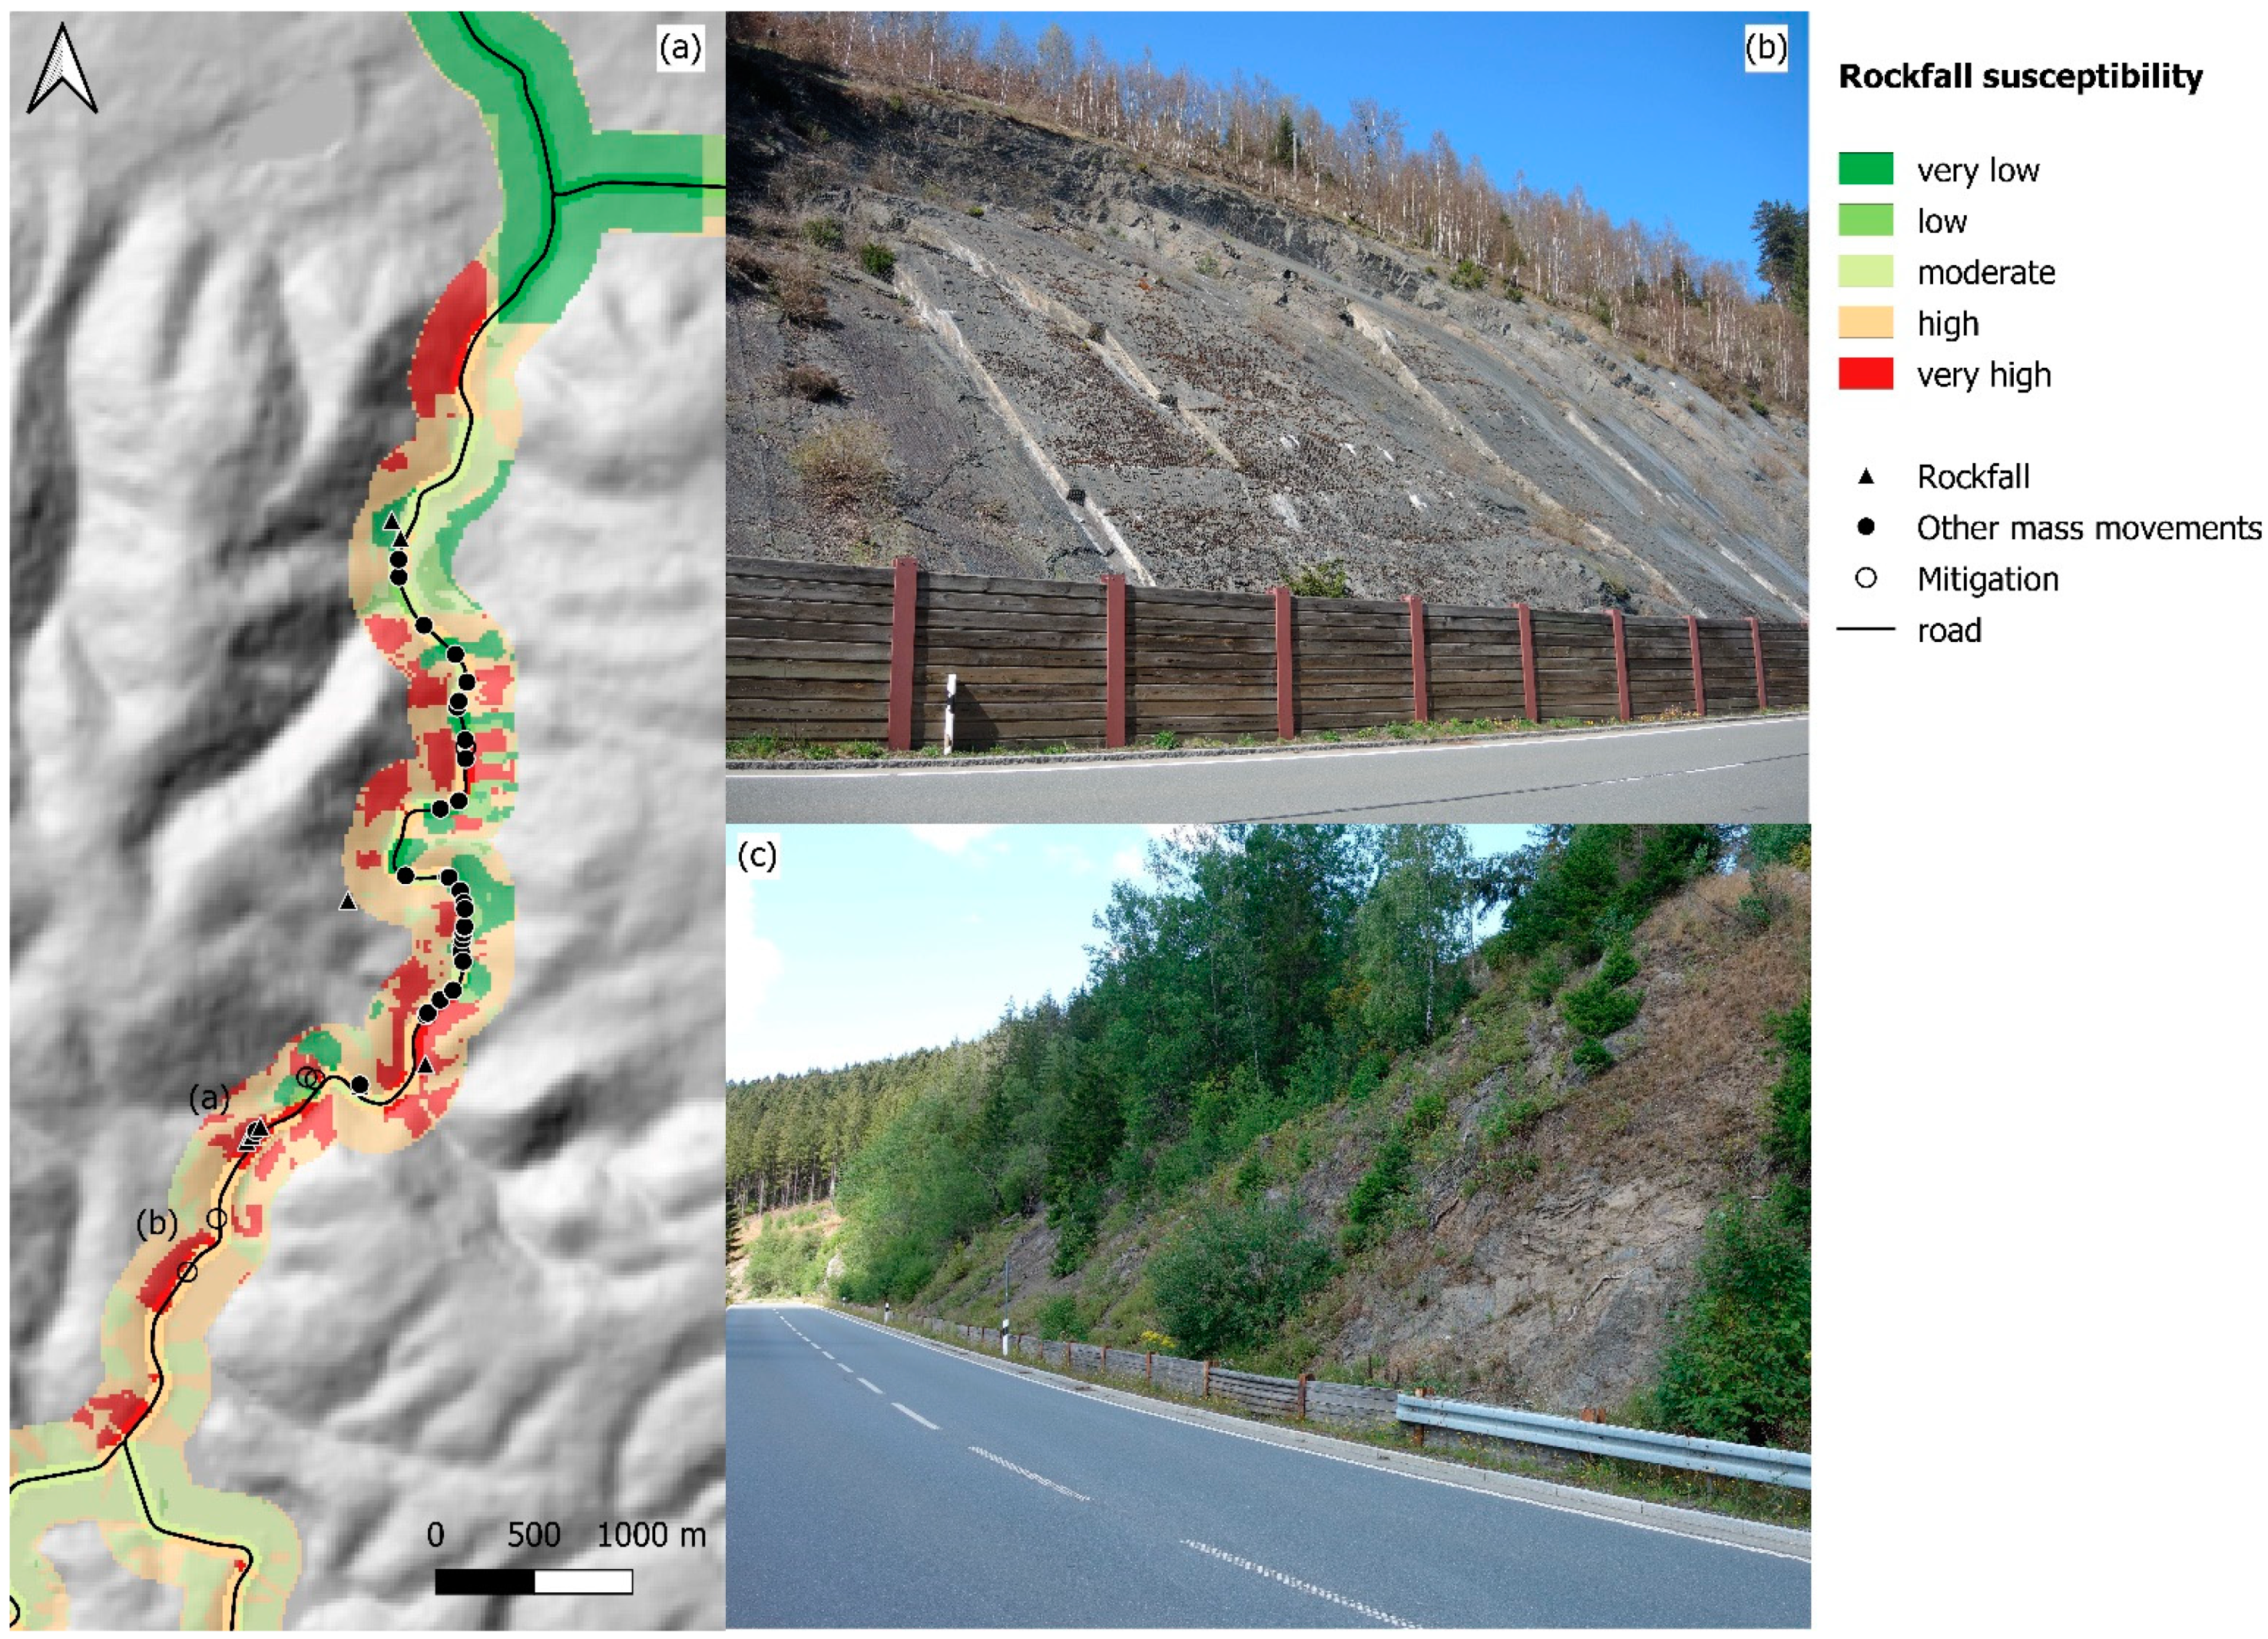
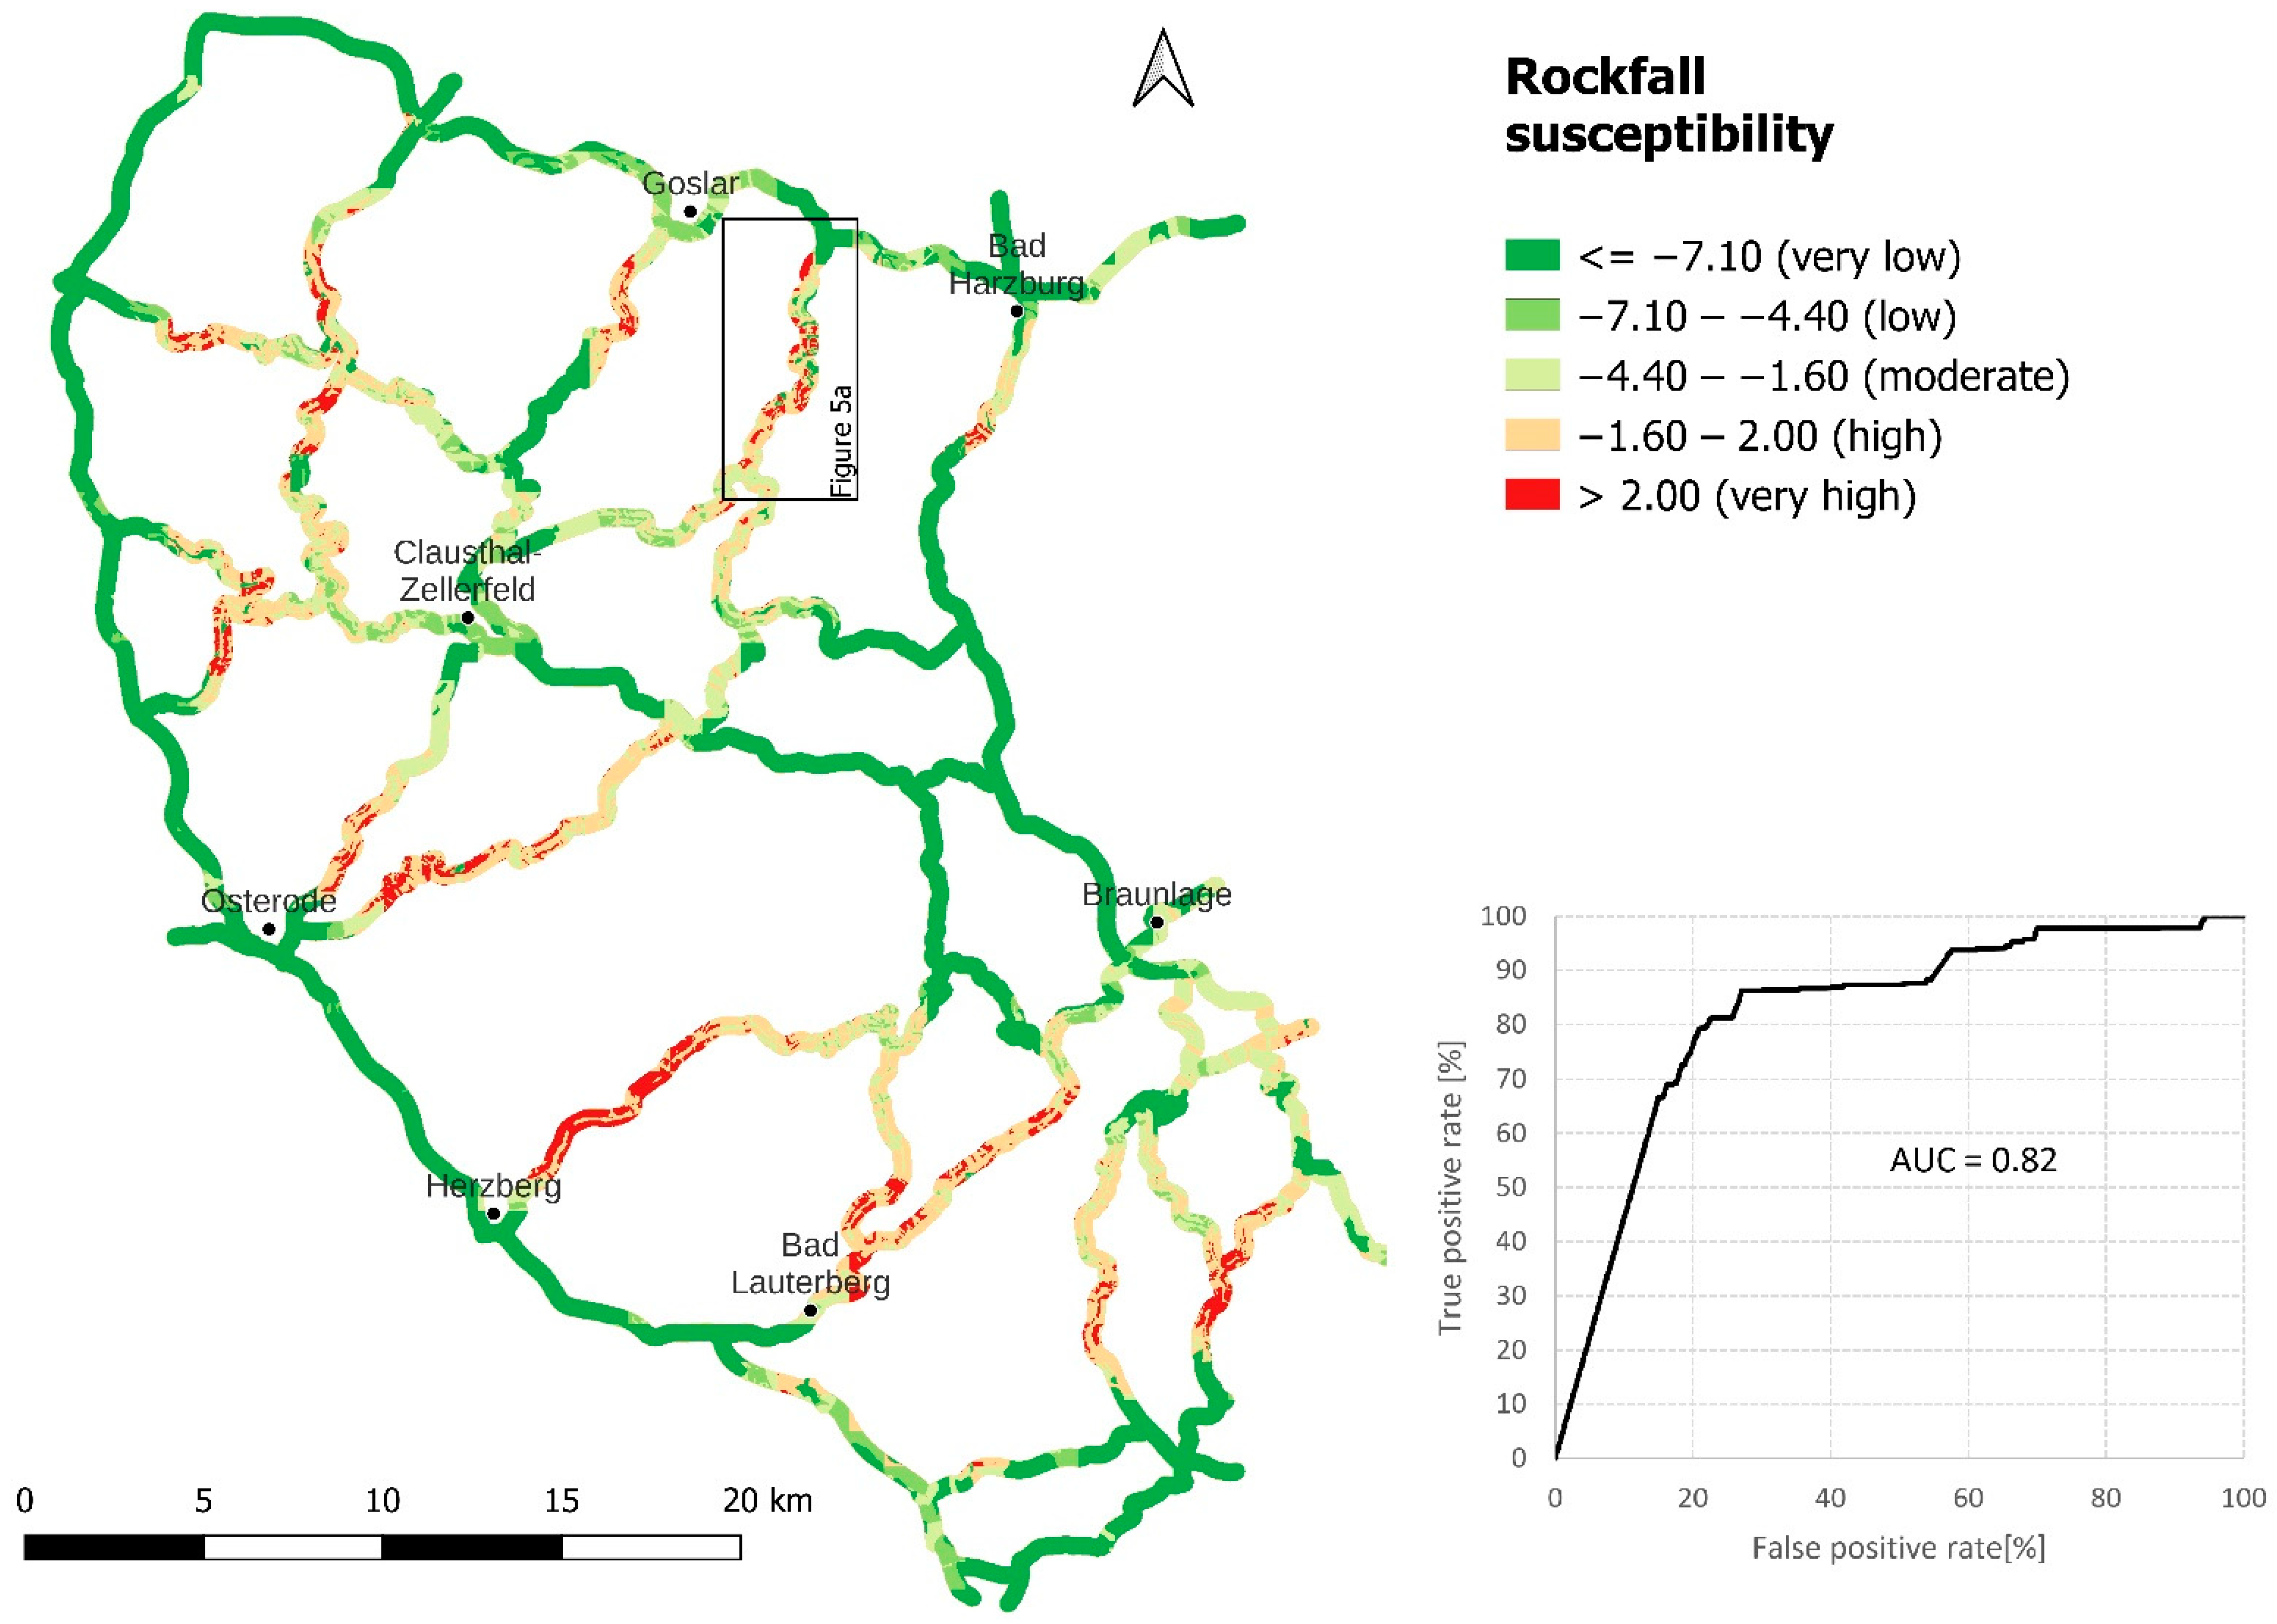
To 55% of the road network area, a very low or low susceptibility is assigned (46% very low, 9% low) in the classification. A moderate susceptibility is calculated for 22% of the area; in the categories of high and very high susceptibility, 19% resp. 4% of the area can be found. Highly susceptible road sections are linked to high slope values with hard sedimentary rock cropping out and road sections of a NE orientation. Figure 5 shows an example for a road section (see Figure 6 for the location of the road segment) with high and very high susceptibility. The slopes in the photographs are located at elevations of ~420 m, with slope angles of >25° and hard sedimentary rock. In Figure 5, further mass movements that cannot be categorized as rockfalls are displayed along the road. Most of them are linked to subsidence of the exterior slope of the rock.
Overall, the model validation by receiver operating characteristic (ROC) analysis reveals an area of 82% under the ROC curve (cf. Figure 6).
4.2. Landslide Vulnerability
According to Formula (3), the vulnerability index theoretically may vary between −0.400 and 1.300. The lowest value can be calculated for the road section with complete structural mitigation at rockfall sites, low traffic volumes, with a preferably wide road, high speed reductions due to speed limits, and with a short length of alternative routes in the case of road closure. The highest values accordingly are reached for no mitigation, high traffic volumes, and narrow roads without any speed limits and with long alternative roads in the case of closure.
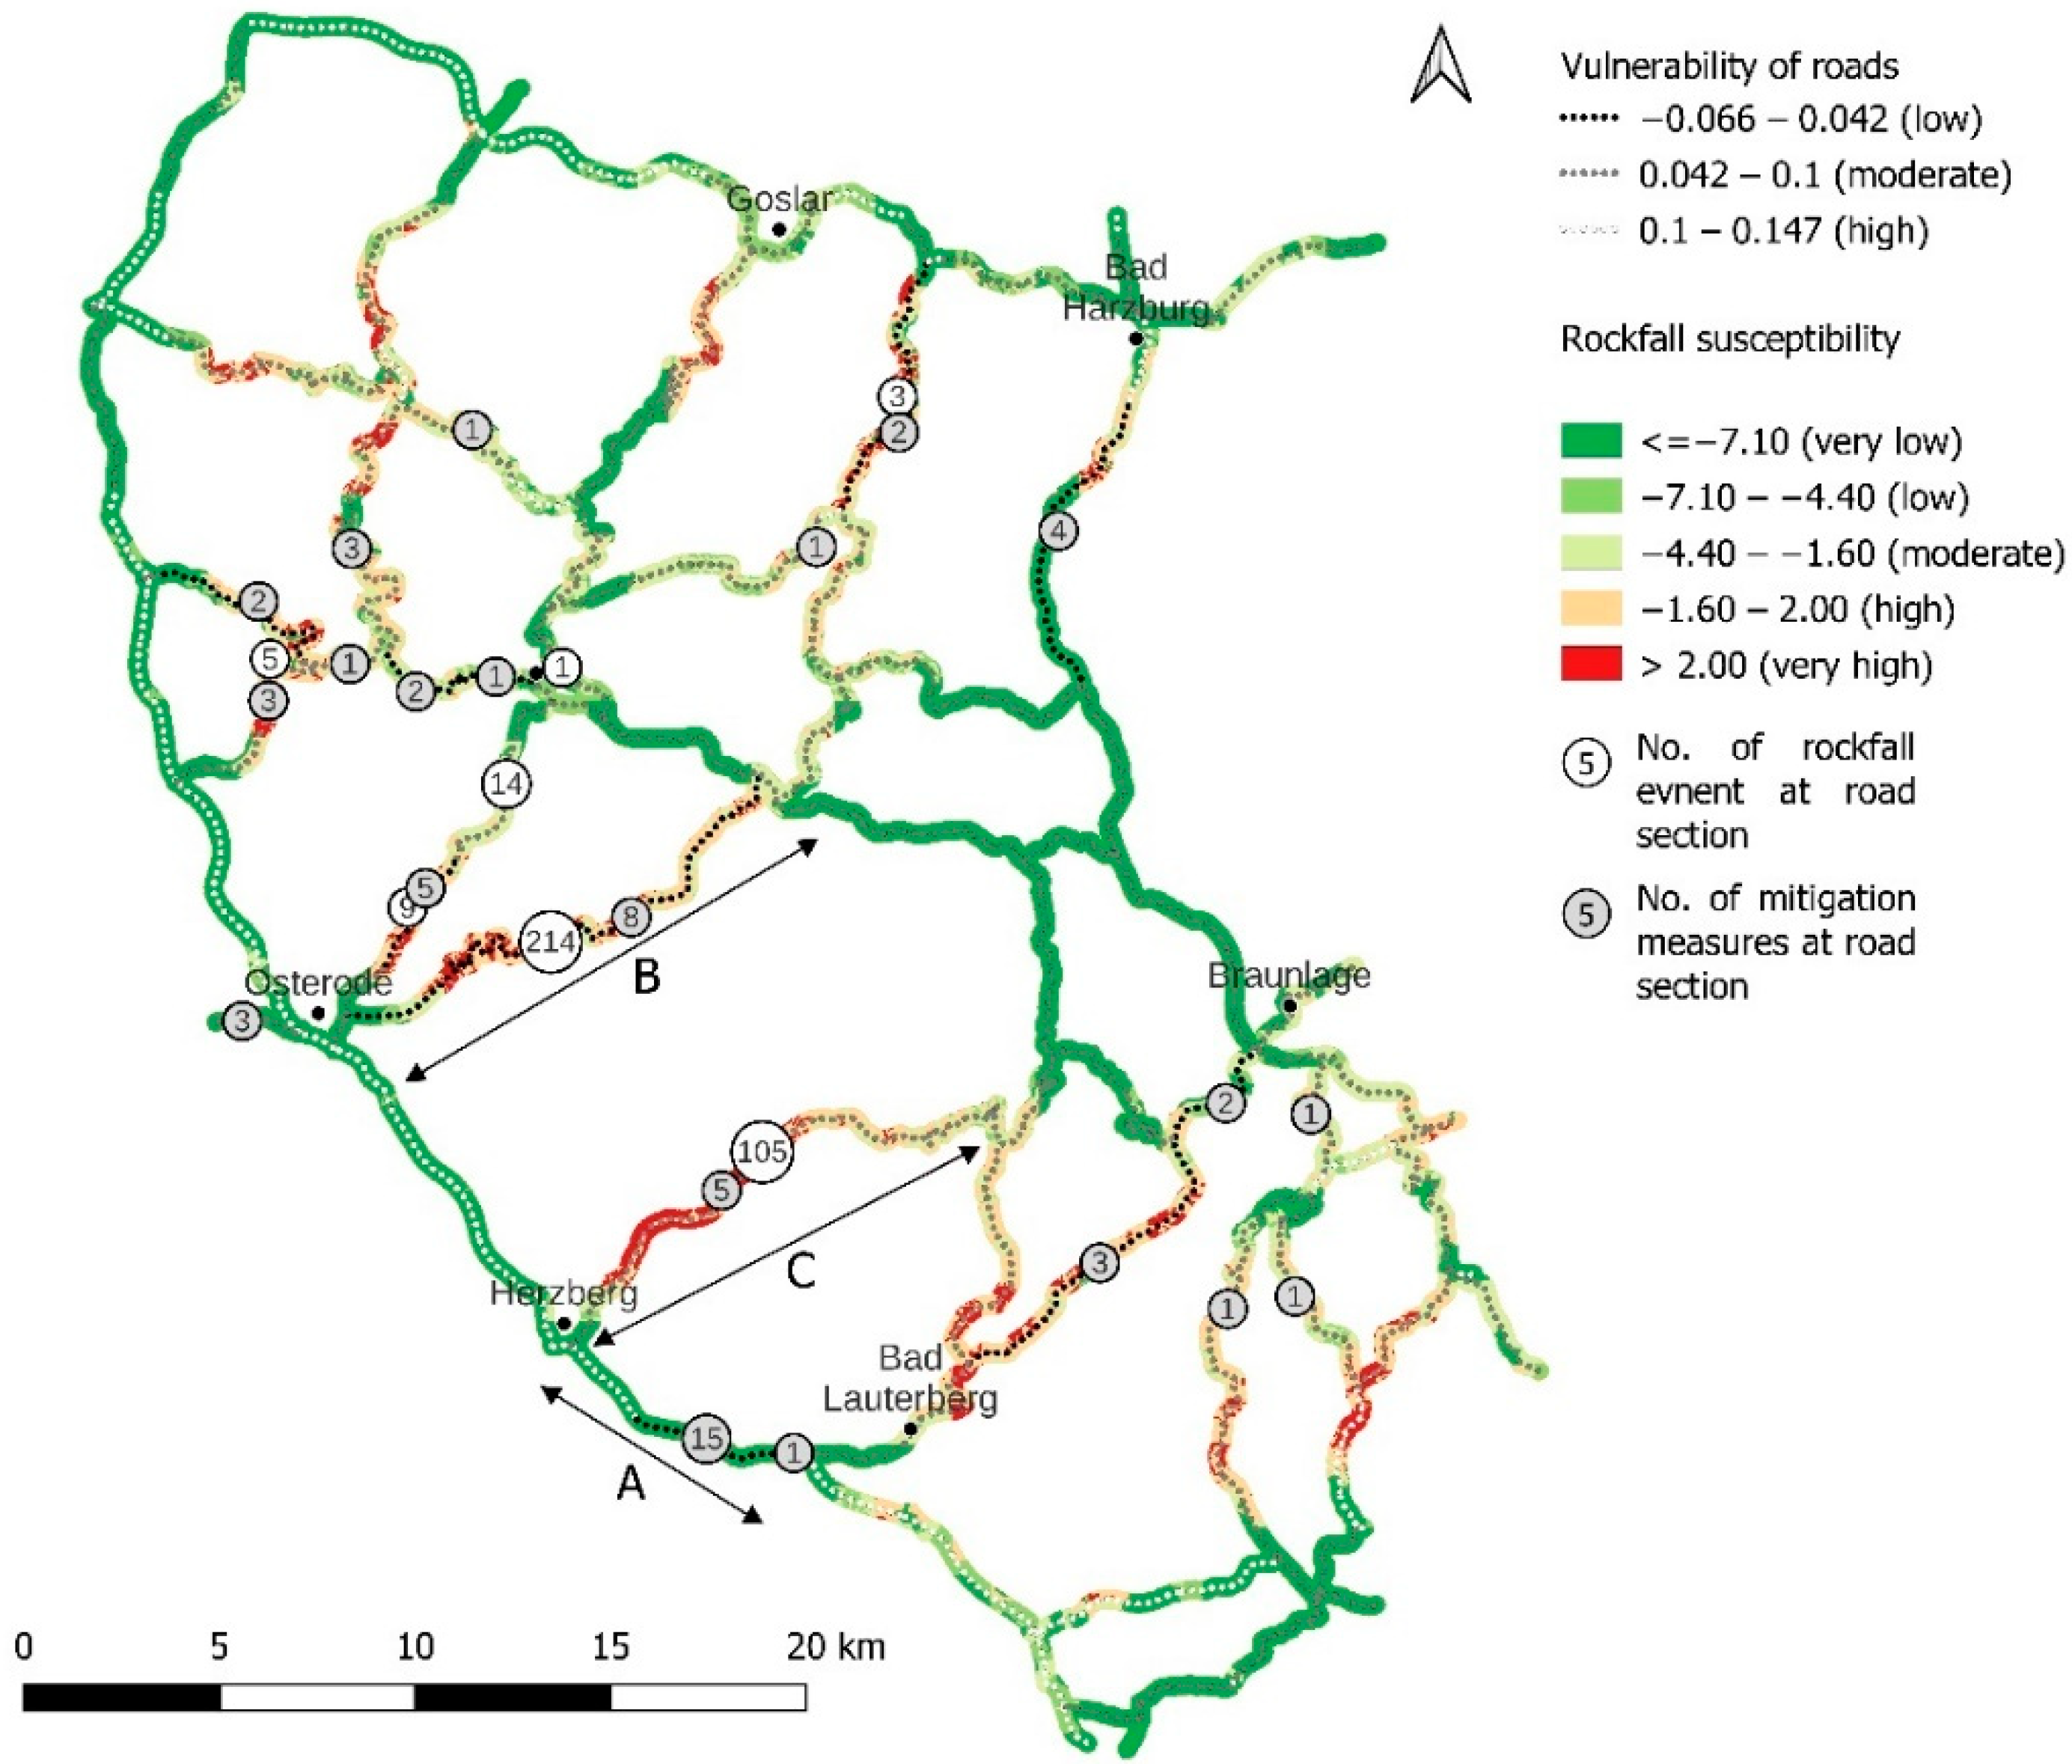
The calculated values are not reflected in the theoretical ones with minimum and maximum indices at the road sections of −0.066 and 0.147, respectively. The determined values are categorized in three evenly distributed classes (Figure 7). The highest values of vulnerability indicators of >0.1 are linked to road sections on the marginal roads of the Harz mountains with mean daily traffic volumes of >12,000 vehicles per day. The susceptibility at these sections can be categorized very low. An exception is the road section marked with an A in Figure 7. Due to the high number of structural mitigation measures on this section (n = 15), the vulnerability is one of the lowest. Low vulnerability values can be found on roads connecting the internal with the external roads. The road sections are often characterized by low average daily traffic volumes of <4000 with adequate road widths, partly complemented by speed limits and structural mitigation. On one of these sections, the highest number of rockfalls is registered with 214 events (B in Figure 7), resulting in a high modeled susceptibility. In general, road sections with a high or very high susceptibility are linked to comparably low vulnerability indicators, except for the road section with 105 rockfalls. The section is mapped with a moderate indicator value (C in Figure 7).
5. Discussion
For the road network of the western Harz mountains the susceptibility to rockfalls was modeled using an information value method and the vulnerability of the road network was assessed with an indicator-based method.
The road susceptibility was modeled using a bivariate statistical approach. The information value method offered an easily applicable approach to estimate landslide as well as rockfall susceptibility. In the method, the interconnected dependencies of the factors were not considered [12], compared to multivariate statistical approaches. Therefore, the factors should be independent from each other. In 2014, the information values were already used in the area of southern Lower Saxony [24], revealing good results. The study mentioned that susceptibility estimation in the Harz mountains might be underrepresented due to a lack of data [24]. The susceptibility model presented here was tested with a receiver operation characteristic analysis, producing an AUC of 0.82, implying a good quality of the model.
In the present study, the factors for susceptibility mapping were chosen based on regional and methodological backgrounds. Usually in susceptibility mapping, land cover is applied as the modeling factor. The land cover along the Harz mountains road network is dominated by (coniferous) woodland. Therefore, land use was eliminated, as only road sections were considered for modeling. In addition to elevation, slope, material characteristics, and distance from faults, the orientation of the road segments was selected. Due to the resolution of the elevation data, slope values must be considered underestimated; therefore, sites of rockfalls can be found at sites of <30°. A large number of rockfalls can be observed at distances to faults of 500–1500 m. These values question the influence of the mapped tectonic faults. The geologic maps, from which the faults were extracted, have been created by several authors across time (1920s to 1990s). As a result, tectonic faults might be incomplete and incoherent. In addition, field observation suggests highly fractured rocks independent of the distance to faults. Overall, no alternative data are available to estimate rock strength, which is considered a crucial variable in rockfall susceptibility [12]. The orientation is chosen to represent the tectonic influence in valley formation. The general strike of bedding and foliation is directed to the NE, which coincides with the class of NE-oriented road showing the highest rockfall susceptibility. The foliated surfaces usually dipped to the SE [28], making rockfall events more likely at SE-facing slopes. The road section with the highest number of registered rockfalls (n = 214), as well as the road in the Oker valley in the northern part of the Harz (n = 3 rockfalls), exhibit SE-facing slopes. The listed factors are completed with the 30-year mean of annual precipitation sums and the average number of ice days. While short-term peaks of precipitation sums can be considered as a trigger for landslides in the area [34,44], long-term values contribute to the predisposing of landslides. The landslide densities in the relevant classes suggest that values of <1200 mm/a influence the soil moisture and therefore influence the predisposition to landslides; for higher values, a saturation of soil moisture is reached. The number of ice days is used to represent frost–thaw cycles, which might contribute to the weathering of rocks as a predisposing factor [12], as well as a triggering factor [34].
For the vulnerability assessment, an indicator-based model is used. In general, in estimating the physical vulnerability of road infrastructure, the application of vulnerability curves is more established [45]. Indicator-based methods for landslide vulnerability have been used in assessing the vulnerability of buildings [46]. In the presented study, vulnerability is not expressed as a degree of loss. Instead, the approach can be used to estimate the propensity of the road network undergoing any type of damage. A disadvantage may be that the size of a damaging event is not considered. This implies that the vulnerability is indicated with the same value whether many small rockfalls or one big event occurs.
The presented method can be useful, especially when information on the impact of landslides is lacking. In addition, it can be used to visualize the vulnerability of elements at risk, in the present study for a rural road network. However, vulnerability indicators strongly depend on the set of selected factors. The average daily traffic volumes and type of road (width) are considered as key variables to assess road infrastructure vulnerability [12]. In a client-based approach for the quantification of a road network susceptibility in Austria, the length of alternative routes was implemented [7]. Therefore, the applied indicators for the vulnerability assessment were average daily traffic volumes, road type, and alternative routing. In addition, negative scores have been used for speed reductions on the road segments. Speed limits are considered as additional mitigation measures. As the direct impact of a rockfall against a travelling car can be considered unlikely due to low traffic volumes, it is more probable that a travelling car hits a block in the aftermath of a rockfall event. The incident of the car hitting the block depends on the travelling speed of the car then. A speed reduction of 50% reduces the distance to 25% of the original breaking distance. Additional applied mitigation measures have not been considered for the vulnerability assessment, as the record of measures appears to be incomplete.
6. Conclusions
In the present study, the rockfall susceptibility was estimated for the road network in the western part of the Harz mountains using a bivariate statistical approach (information value method). The susceptibility model afterward was validated with a receiver operating characteristic (ROC) analysis. Susceptibility mapping revealed a high susceptibility for 23% of the road network corridor. In addition, the vulnerability of the road network was determined using the indicator-based method. The indicator values were weighted with an analytical hierarchy process. The combined map showed a discrepancy between susceptibility and vulnerability. While a high vulnerability could be located on the SW and N margin of the road network, the internal roads showed a low vulnerability. Roads connecting the internal road with the margin of the Harz mountains exploited high and very high susceptibility values. These roads were strongly linked to high slopes and a NE orientation.
The applied methods for susceptibility and vulnerability assessment are easily reproduceable for other road networks. The combination of susceptibility and vulnerability gives public decision-makers an overview of susceptibility hotspots in addition to vulnerable road sections. The map provides insights to managing and planning future mitigation measures. The vulnerability indicators are easily adaptable and weighting factors might be edited according to planning needs.
Author Contributions
Conceptualization, A.W.; writing—original draft preparation, A.W.; supervision, B.D. All authors have read and agreed to the published version of the manuscript.
Funding
The research work was funded by the Ministry of Science and Culture of Lower Saxony, MWK76ZN1504, 2016–2019—“Niedersächsisches Vorab” as well as the German Research Foundation, DFG DA 452/5-1 and 5-2.
Institutional Review Board Statement
Not applicable.
Informed Consent Statement
Not applicable.
Data Availability Statement
The data presented in this study are available on request from the corresponding author.
Conflicts of Interest
The authors declare no conflict of interest. The funders had no role in the design of the study; in the collection, analyses, or interpretation of data; in the writing of the manuscript, or in the decision to publish the results.
References
- Varnes, D.J. Slope movement types and processes. In Landslides: Analysis and Control; Schuster, R.L., Krizek, Eds.; Special Report 176; Transportation Research Board, National Academy of Sciences: Washington, DC, USA, 1978; pp. 11–33. [Google Scholar]
- Cruden, D.M.; Varnes, D.J. Landslide Types and Processes. In Landslides: Investigation and Mitigation; Turner, A.K., Schuster, R.L., Eds.; Special Report 247; Transportation Research Board, National Academy of Sciences: Washington, DC, USA, 1996; pp. 36–75. [Google Scholar]
- Hungr, O.; Leroueil, S.; Picarelli, L. The Varnes classification of landslide types, an update. Landslides 2014, 11, 167–194. [Google Scholar] [CrossRef]
- Klose, M.; Maurischat, P.; Damm, B. Landslide impacts in Germany: A historical and socioeconomic perspective. Landslides 2016, 13, 183–199. [Google Scholar] [CrossRef]
- Schuster, R.L. Socioeconomic Significance of Landslides. In Landslides: Investigation and Mitigation; Turner, A.K., Schuster, R.L., Eds.; Special Report 247; Transportation Research Board, National Academy of Sciences: Washington, DC, USA, 1996; pp. 12–35. [Google Scholar]
- Kjekstad, O.; Highland, L. Economic and Social Impacts of Landslides. In Landslides—Disaster Risk Reduction; Sassa, K., Canuti, P., Eds.; Springer: Berlin/Heidelberg, Germany, 2009; pp. 573–587. [Google Scholar]
- Schlögl, M.; Richter, G.; Avian, M.; Thaler, T.; Heiss, G.; Lenz, G.; Fuchs, S. On the nexus between landslide susceptibility and transport infrastructure—An agent-based approach. Nat. Hazards Earth Syst. Sci. 2019, 19, 201–219. [Google Scholar] [CrossRef] [Green Version]
- Bíl, M.; Kubeček, J.; Andrášik, R. An epidemiological approach to determining the risk of road damage due to landslides. Nat. Hazards 2014, 73, 1323–1335. [Google Scholar] [CrossRef]
- Van Westen, C.J.; Castellanos, E.; Kuriakose, S.L. Spatial data for landslide susceptibility, hazard, and vulnerability assessment: An overview. Eng. Geol. 2008, 102, 112–131. [Google Scholar] [CrossRef]
- Guzzetti, F.; Reichenbach, P.; Ardizzone, F.; Cardinali, M.; Galli, M. Estimating the quality of landslide susceptibility models. Geomorphology 2006, 81, 166–184. [Google Scholar] [CrossRef]
- Van Westen, C.J.; Van Asch, T.W.J.; Soeters, R. Landslide hazard and risk zonation—Why is it still so difficult? Bull. Eng. Geol. Environ. 2006, 65, 167–184. [Google Scholar] [CrossRef]
- Corominas, J.; Van Westen, C.; Frattini, P.; Cascini, L.; Malet, J.-P.; Fotopoulou, S.; Catani, F.; Van Den Eeckhaut, M.; Mavrouli, O.; Agliardi, F.; et al. Recommendations for the quantitative analysis of landslide risk. Bull. Eng. Geol. Environ. 2014, 73, 209–263. [Google Scholar] [CrossRef]
- Soeters, R.; Van Westen, C.J. Slope instability recognition, analysis and zonation. In Landslides: Investigation and Mitigation; Turner, A.K., Schuster, R.L., Eds.; Special Report 247; Transportation Research Board, National Academy of Sciences: Washington, DC, USA, 1996; pp. 129–177. [Google Scholar]
- Süzen, M.L.; Doyuran, V. A comparison of the GIS based landslide susceptibility assessment methods: Multivariate versus bivariate. Environ. Geol. 2004, 45, 665–679. [Google Scholar] [CrossRef]
- Pellicani, R.; Argentiero, I.; Spilotro, G. GIS-based predictive models for regional-scale landslide susceptibility assessment and risk mapping along road corridors. Geomat. Nat. Hazards Risk 2017, 8, 1012–1033. [Google Scholar] [CrossRef] [Green Version]
- Kobashi, S.; Suzuki, M. Hazard Index for the Judgment of Slope Stability in the Rokko Mountain Region; Band 1; Interpraevent: Graz, Austria, 1988; pp. 223–233. [Google Scholar]
- Yin, K.L.; Yan, T.Z. Statistical prediction models for slope instability of metamorphosed rocks. In Proceedings of the 5th International Symposium on Landslides, Lausanne, Switzerland, 10–15 July 1988; pp. 1269–1272. [Google Scholar]
- Bonham-Carter, G.F.; Agterberg, F.P.; Wright, D.F. Weights of evidence modeling: A new approach to mapping mineral potential. In Statistical Applications in the Earth Sciences; Agterberg, F.P., Bonham-Carter, G.F., Eds.; Geological Survey of Canada: Ottawa, ON, Canada, 1989; pp. 171–183. [Google Scholar]
- Papathoma-Köhle, M. Vulnerability curves vs. vulnerability indicators: Application of an indicator-based methodology for debris-flow hazards. Nat. Hazards Earth Syst. Sci. 2016, 16, 1771–1790. [Google Scholar] [CrossRef] [Green Version]
- Berdica, K. An introduction to road vulnerability: What has been done, is done and should be done. Transp. Policy 2002, 9, 117–127. [Google Scholar] [CrossRef]
- Papathoma-Köhle, M.; Gems, B.; Sturm, M.; Fuchs, S. Matrices, curves and indicators: A review of approaches to assess physical vulnerability to debris flows. Earth Sci. Rev. 2017, 171, 272–288. [Google Scholar] [CrossRef]
- Kappes, M.S.; Papathoma-Köhle, M.; Keiler, M. Assessing physical vulnerability for multi-hazards using an indicator-based methodology. Appl. Geogr. 2012, 32, 577–590. [Google Scholar] [CrossRef]
- Birkmann, J. Indicators and Criteria for Measuring Vulnerability: Theoretical Bases and Requirements. Measuring Vulnerability to Natural Hazards: Towards Disaster Resilient Societies; UNU-Press: Tokyo, Japan, 2006; pp. 55–77. [Google Scholar]
- Klose, M.; Gruber, D.; Damm, B.; Gerold, G. Spatial databases and GIS as tools for regional landslide susceptibility modeling. Z. Geomorphol. 2014, 58, 1–36. [Google Scholar] [CrossRef]
- Rupp, S.; Wohlers, A.; Damm, B. Long-term relationship between landslide occurrences and precipitation in southern Lower Saxony and northern Hesse. Z. Geomorphol. 2018, 61, 327–338. [Google Scholar] [CrossRef]
- Jaeger, A.K.; Klose, M.; Damm, B. Landslides along highways: GIS-based inventory and planning issues. In Proceedings of the EGU General Assembly 2015, Vienna, Austria, 12–17 April 2015; p. 1541. Available online: https://meetingorganizer.copernicus.org/EGU2015/EGU2015-1541.pdf (accessed on 6 February 2020).
- Deutsche Wetterdienst (DWD) Climate Data Center (CDC). Hourly Station Observations of Wind Direction 10 m above Ground in Degree for Germany. Available online: https://cdc.dwd.de/portal/ (accessed on 6 February 2020).
- Mohr, K. Geologie und Minerallagerstätten des Harzes; Schweizerbart: Stuttgart, Germany, 1978. [Google Scholar]
- Damm, B. Hangrutschungen im Mittelgebirgsraum—Verdrängte “Naturgefahr”? Z. Angew. Geogr. 2000, 24, 27–34. [Google Scholar] [CrossRef]
- Damm, B.; Klose, M. The landslide database for Germany: Closing the gap at national level. Geomorphology 2015, 249, 82–93. [Google Scholar] [CrossRef]
- DSM (Digital Surface Model). Available online: https://data.opendataportal.at/ (accessed on 24 June 2021).
- Engineering Geological Map of Lower Saxony (1:50,000). Available online: https://nibis.lbeg.de/cardomap3/?TH=IGK50 (accessed on 6 February 2022).
- Geological Map of Lower Saxony (1:200,000). Available online: https://services.bgr.de/geologie/guek200 (accessed on 8 February 2022).
- Rupp, S.; Damm, B. A national rockfall dataset as a tool for analysing the spatial and temporal rockfall occurrence in Germany. Earth Surf. Process. Landf. 2020, 45, 1528–1538. [Google Scholar] [CrossRef]
- Zêzere, J.L. Landslide susceptibility assessment considering landslide typology. A case study in the area north of Lisbon (Portugal). Nat. Hazards Earth Syst. Sci. 2002, 2, 73–82. [Google Scholar] [CrossRef]
- QGIS. Available online: https://qgis.org/de/site/ (accessed on 8 February 2022).
- Beguería, S. Validation and Evaluation of Predictive Models in Hazard Assessment and Risk Management. Nat. Hazards 2006, 37, 315–329. [Google Scholar] [CrossRef] [Green Version]
- NLStBV (Federal State Authority for Road Construction and Traffic). Map of Traffic Volumes 2015 (1:250,000). 2017. Available online: https://www.strassenbau.niedersachsen.de/startseite/aufgaben/strassenverkehr/strassenverkehrszahlung/straenverkehrszaehlung.html (accessed on 6 February 2022).
- Google Earth. Available online: https://www.google.de/intl/de/earth/index.html (accessed on 8 February 2022).
- StVO (Road Traffic Regulations of Germany). 2013 § 3 Section 3.2. Available online: https://www.gesetze-im-internet.de/stvo_2013/__3.html (accessed on 6 February 2022).
- Geofabrik. Available online: http://www.geofabrik.de/ (accessed on 8 February 2022).
- OSM Routing. Available online: https://routing.openstreetmap.de/ (accessed on 6 February 2022).
- Saaty, T.L. The Analytic Hierarchy Process; McGraw Hill International: New York, NY, USA, 1980. [Google Scholar]
- Nissen, K.M.; Rupp, S.; Kreuzer, T.M.; Guse, B.; Damm, B.; Ulbrich, U. Quantification of meteorological conditions for rockfall triggers in Central Europe. Nat. Hazards Earth Syst. Sci. Discuss. 2021, 1–18. [Google Scholar] [CrossRef]
- Winter, M.G.; Smith, J.T.; Fotopoulou, S.D.; Pitilakis, K.; Mavrouli, O.; Corominas, J.; Argyroudis, S. An expert judgement approach to determining the physical vulnerability of roads to debris flow. Bull. Eng. Geol. Environ. 2014, 73, 291–305. [Google Scholar] [CrossRef]
- Papathoma-Köhle, M.; Neuhäuser, B.; Ratzinger, K.; Wenzel, H.; Dominey-Howes, D. Elements at risk as a frame-work for assessing the vulnerability of communities to landslides. Nat. Hazards Earth Syst. Sci. 2007, 7, 765–779. [Google Scholar] [CrossRef]
Figure 1.
Overview of landslides and road network in the Western Harz mountains. Values for the annual sum of precipitation are displayed as well.
Figure 1.
Overview of landslides and road network in the Western Harz mountains. Values for the annual sum of precipitation are displayed as well.

Figure 2.
Thematic maps used for susceptibility modeling: (a) elevation; (b) slope; (c) material characteristics; (d) orientation of road sections; (e) distance of road corridor (pixel value) to tectonic structures; (f) mean annual precipitation sum; (g) number of ice days per year.
Figure 2.
Thematic maps used for susceptibility modeling: (a) elevation; (b) slope; (c) material characteristics; (d) orientation of road sections; (e) distance of road corridor (pixel value) to tectonic structures; (f) mean annual precipitation sum; (g) number of ice days per year.


Figure 3.
Schematic profile to illustrate the underestimated slope values at road cuts in the Harz mountains. The steep-cut slope is not resolved in the elevation model of 20 m.
Figure 3.
Schematic profile to illustrate the underestimated slope values at road cuts in the Harz mountains. The steep-cut slope is not resolved in the elevation model of 20 m.

Figure 4.
Vulnerability indicators and the weighting factors determined with analytical hierarchy process.
Figure 4.
Vulnerability indicators and the weighting factors determined with analytical hierarchy process.

Figure 5.
(a) Rockfall susceptibility of the Oker valley. For better visibility, the susceptibility is shown in a 500 m corridor. In addition to rockfall and mitigation, other mass movements are displayed. The position of the photos (b,c) is shown in (a).
Figure 5.
(a) Rockfall susceptibility of the Oker valley. For better visibility, the susceptibility is shown in a 500 m corridor. In addition to rockfall and mitigation, other mass movements are displayed. The position of the photos (b,c) is shown in (a).

Figure 6.
Landslide susceptibility model and model validation for corridors of the Harz mountains road network using an information value. For better visibility, the road corridor is displayed with 500 m width. For modeling, a 100 m corridor was applied. Model validation resulted in an AUC of 0.83.
Figure 6.
Landslide susceptibility model and model validation for corridors of the Harz mountains road network using an information value. For better visibility, the road corridor is displayed with 500 m width. For modeling, a 100 m corridor was applied. Model validation resulted in an AUC of 0.83.

Figure 7.
Vulnerability of road sections in the Harz mountains in combination with the modeled landslide susceptibility, number of rockfalls, and mitigation measures at the road sections.
Figure 7.
Vulnerability of road sections in the Harz mountains in combination with the modeled landslide susceptibility, number of rockfalls, and mitigation measures at the road sections.


Table 1.
Block size characteristics of rockfall events. Block sizes indicate the maximum edge length.
Table 1.
Block size characteristics of rockfall events. Block sizes indicate the maximum edge length.
| Classes of Block Sizes | Number of Rockfalls in Class |
|---|---|
| <10 cm | 56 |
| 10–50 cm | 271 |
| 50–100 cm | 1 |
| ≥100 cm | 0 |
| No info | 23 |
Table 2.
Engineering-geological characterization of materials in the Harz mountains [32]. Where categories are merged, the ground types are displayed in brackets.
Table 2.
Engineering-geological characterization of materials in the Harz mountains [32]. Where categories are merged, the ground types are displayed in brackets.
| Ground Type | Category | Material Description |
|---|---|---|
| 2 | Artificial infill | Different types of material: natural soil mixed with artificial and waste materials |
| 3 | Organic and biogenic soils | Peat, sludge, organic silt |
| 4–8 | Cohesive unconsolidated rock | Silt to clay, partly peat (4) |
| Alluvial clay (5) | ||
| Loess, loess loam (6) | ||
| Till, solifluction deposits (8) | ||
| 11, 12 | Noncohesive unconsolidated rock | Dune sand, drift sand (11) |
| Fluvial and glacial-fluvial deposits (12) | ||
| 14 | Sub-recent deposits of mass movements | Separated blocks, weathered |
| 15 | Highly soluble rocks | Gypsum |
| 16–20 | Slaking rocks | Claystone, siltstone, marlstone with gypsum and limestone (16) |
| Claystone, siltstone, marlstone (17) | ||
| Dolostone, marlstone, limestone (18) | ||
| Marlstone, claystone, siltstone, sandstone (19) | ||
| Limestone, sandstone, greywacke (20) | ||
| 21, 22 | Sedimentary rocks | Limestone, sandstone, slate (21) |
| Limestone, sandstone, greywacke (22) | ||
| 23 | Metamorphic/Magmatic rocks | Basalt, granite, greenstone, gneiss |
Table 3.
Vulnerability indicators that were used for the vulnerability assessment and corresponding categories. The weighting factors were calculated with the analytical hierarchy process.
Table 3.
Vulnerability indicators that were used for the vulnerability assessment and corresponding categories. The weighting factors were calculated with the analytical hierarchy process.
| Vulnerability Indicator | Category | Indicator Value | Weighting Factor |
|---|---|---|---|
| Mitigation | Scaling and trimming | −0.10 | 0.359041 |
| <25% with structural measures 1 | −0.20 | ||
| 25–50% with structural measures 1 | −0.30 | ||
| >50% with structural measures 1 | −0.40 | ||
| Average daily traffic volume | <4000 | 0.10 | 0.237229 |
| 4000–8000 | 0.15 | ||
| 8000–12,000 | 0.20 | ||
| 12,000–16,000 | 0.25 | ||
| >16,000 | 0.30 | ||
| Average daily heavy traffic volume | <400 | 0.10 | 0.176031 |
| 400–800 | 0.15 | ||
| 800–1200 | 0.20 | ||
| 1200–1600 | 0.25 | ||
| >1600 | 0.30 | ||
| Type of road (width) | State road, narrow (5–7 m) | 0.35 | 0.119928 |
| State road, two lanes (6–8 m) | 0.25 | ||
| Interstate road, two lanes (6–9 m) | 0.25 | ||
| Interstate road, three lanes (11–12 m) | 0.15 | ||
| Interstate road, four lanes (14–16 m) | 0.10 | ||
| Speed reduction 2 | <20% | 0 | 0.042860 |
| 20–40% | −0.10 | ||
| 40–60% | −0.25 | ||
| 60–80% | −0.30 | ||
| >80% | −0.35 | ||
| Length of alternative routes 3 | <200% | 0.05 | 0.064850 |
| 200–500% | 0.10 | ||
| 500–1000% | 0.20 | ||
| 1000–2000% | 0.30 | ||
| >2000% | 0.35 |
1 Structural measures: nets, fences, and shotcrete 2 in percent in terms of length and the reduction in the speed limit of 100 km/h (applies to roads without structural separated lanes [42]). 3 Percentage of original length of road section.
Table 4.
Information values for susceptibility modeling; where a calculation of values was not possible (landslide area 0%), the values were set to −10.
Table 4.
Information values for susceptibility modeling; where a calculation of values was not possible (landslide area 0%), the values were set to −10.
| Factor | Classes | Information Value | Total Area (%) | Landslide Area (%) |
|---|---|---|---|---|
| Elevation | <300 m | −0.641473 | 34.59 | 18.21 |
| 300–400 m | 1.362817 | 20.28 | 79.24 | |
| 400–500 m | −5.127046 | 13.72 | 0.08 | |
| 500–600 m | −1.932988 | 17.05 | 2.47 | |
| 600–700 m | −10.000000 | 7.81 | 0.00 | |
| 700–800 m | −10.000000 | 4.85 | 0.00 | |
| >800 | −10.000000 | 1.71 | 0.00 | |
| Slope | <15° | −1.269577 | 82.08 | 23.06 |
| 15–20° | 0.834263 | 8.69 | 20.02 | |
| 20–25° | 1.743032 | 5.55 | 31.72 | |
| 25–30° | 2.003805 | 2.67 | 19.83 | |
| >30° | 1.678186 | 1.00 | 5.36 | |
| Material characteristics | 2 | −2.980840 | 1.54 | 0.08 |
| 3 | −10.000000 | 0.80 | 0.00 | |
| 4 | −10.000000 | 0.02 | 0.00 | |
| 5 | −10.000000 | 1.11 | 0.00 | |
| 6 | −10.000000 | 4.85 | 0.00 | |
| 8 | −10.000000 | 7.58 | 0.00 | |
| 11 | 0.424239 | 6.13 | 9.37 | |
| 12 | 0.535791 | 21.45 | 36.66 | |
| 14 | −10.000000 | 0.17 | 0.00 | |
| 15 | −10.000000 | 0.31 | 0.00 | |
| 16 | −10.000000 | 2.00 | 0.00 | |
| 17 | −10.000000 | 0.53 | 0.00 | |
| 18 | −10.000000 | 0.94 | 0.00 | |
| 19 | −10.000000 | 0.52 | 0.00 | |
| 20 | −10.000000 | 0.85 | 0.00 | |
| 21 | −2.446112 | 16.09 | 1.39 | |
| 22 | 0.616785 | 28.28 | 52.40 | |
| 23 | −4.303761 | 6.82 | 0.09 | |
| Road section orientation | N (0–11.25°) | −0.176030 | 13.04 | 10.93 |
| NNE (11.25–33.75°) | −0.391955 | 11.25 | 7.60 | |
| NE (33.75–56.25°) | 1.526976 | 12.03 | 55.39 | |
| ENE (56.25–78.75°) | 0.230975 | 13.54 | 17.05 | |
| E (78.75–101.25°) | −1.513952 | 14.19 | 3.12 | |
| ESE (101.25–123.75°) | −1.687862 | 11.82 | 2.19 | |
| SE (123.75–146.25°) | −1.875752 | 11.83 | 1.81 | |
| Distance to faults | <500 m | −0.712056 | 32.86 | 16.12 |
| 500–1000 m | 0.366012 | 24.26 | 34.98 | |
| 1000–1500 m | 0.3360609 | 14.79 | 20.69 | |
| 1500–2000 m | −0.1558190 | 12.66 | 10.84 | |
| >2000 m | 0.1182856 | 15.43 | 17.37 | |
| Precipitation | <1000 mm | −2.492298 | 36.48 | 3.02 |
| 1000–1100 mm | 1.723268 | 11.34 | 63.54 | |
| 1100–1200 mm | 0.437078 | 11.59 | 17.94 | |
| 1200–1300 mm | −0.514383 | 15.73 | 9.40 | |
| >1300 mm | −1.406148 | 24.86 | 6.09 | |
| Ice Days | <20 | −10.000000 | 21.80 | 0.00 |
| 20–25 | 0.827132 | 19.38 | 44.31 | |
| 25–30 | −0.446209 | 11.72 | 7.50 | |
| 30–35 | 0.023274 | 15.93 | 16.30 | |
| 35–40 | 0.668763 | 16.34 | 31.88 | |
| >40 | −10.000000 | 14.84 | 0.00 |
Publisher’s Note: MDPI stays neutral with regard to jurisdictional claims in published maps and institutional affiliations. |
© 2022 by the authors. Licensee MDPI, Basel, Switzerland. This article is an open access article distributed under the terms and conditions of the Creative Commons Attribution (CC BY) license (https://creativecommons.org/licenses/by/4.0/).
Share and Cite
MDPI and ACS Style
Wohlers, A.; Damm, B. Rockfall Vulnerability of a Rural Road Network—A Methodological Approach in the Harz Mountains, Germany. Geosciences 2022, 12, 170. https://doi.org/10.3390/geosciences12040170
AMA Style
Wohlers A, Damm B. Rockfall Vulnerability of a Rural Road Network—A Methodological Approach in the Harz Mountains, Germany. Geosciences. 2022; 12(4):170. https://doi.org/10.3390/geosciences12040170
Chicago/Turabian StyleWohlers, Annika, and Bodo Damm. 2022. "Rockfall Vulnerability of a Rural Road Network—A Methodological Approach in the Harz Mountains, Germany" Geosciences 12, no. 4: 170. https://doi.org/10.3390/geosciences12040170
Note that from the first issue of 2016, this journal uses article numbers instead of page numbers. See further details here.