
Numerical Simulation of the Tsunami Generated by a Potential Submarine Landslide in La Palma (Canary Islands) after the September 2021 Cumbre Vieja Eruption


Department of Física Aplicada I, ETSIA, Universidad de Sevilla, Carretera de Utrera km 1, D.P. 41013 Seville, Spain
Geosciences 2021, 11(12), 497; https://doi.org/10.3390/geosciences11120497
Submission received: 13 October 2021
/
Revised: 22 November 2021
/
Accepted: 3 December 2021
/
Published: 7 December 2021
(This article belongs to the Collection Tsunamis: From the Scientific Challenges to the Social Impact)
Abstract
:Cumbre Vieja volcano, located in La Palma Island (Canary Islands, Spain), erupted on 19 September 2021. Some papers have been published in the past in which the tsunamis generated by a potential massive landslide due to a collapse of one of the volcano flanks are investigated. However, a potential slide of the lava flow down the island slope has not been considered yet. A numerical model has been applied to simulate the propagation of the tsunami generated by such slide and to assess its consequences in the near field (Canary Islands and west coast of Africa). The model provides maps of maximum wave heights and arrival times of the tsunami, as well as time series of water surface elevation at several selected locations. Since the volume involved in such potential slide is a priori not known, several values were tested and their effects compared.
1. Introduction
Cumbre Vieja volcano (CCV) is located in La Palma (Canary Islands, Spain, see Figure 1). After one week of seismic activity in the area, it erupted on 29 September 2021 at 15:15 h local time. On 25 September, the west side of the main ash cone collapsed and new mouths were open. The lava flow reached the ocean on 29 September and started to create new land offshore (this land is locally denoted as fajana). This newly formed land reached the island slope on October 10th, and authorities worried about the possibility of a submarine landslide down the slope, which would create some swell (this was the word used in Spanish TV news). While this work is being written, the eruption continues alternating periods with higher and lower activity; new mouths are open, and new lava flows are arriving to the sea.
CVV has drawn a strong interest among the scientific community since the first published alarming work [1], in which the tsunami generated by a potential landslide from the western side of CCV was simulated. This work was strongly criticized (for instance, in [2]) because of the extremely large and non-justified landslide volume considered in the simulation and the linear wave model used. More recent works have considered volumes ranging from 20 to 80 km (see for instance [3]), which may be compared with the 500 km used in [1].
However, although the tsunamis generated by a landslide in the western side of CCV involving more or less exaggerated volumes have been simulated [1,3,4,5,6,7], this is not the case for a submarine landslide down the island slope. It would be caused by the accumulation of lava in the island shelf, which could eventually lead to the instability of this shelf and then produce a submarine slide of material down the island slope.
The purpose of the present paper consists of simulating the tsunami generated by such potential slide. A nonlinear hydrodynamic model is used. Since the volume involved in the slide is not known, several simulations were carried out to evaluate the consequences of varying involved volumes. The model used is described in Section 2; the results are presented and discussed in Section 3.
2. Materials and Methods
The 2D depth-averaged nonlinear barotropic hydrodynamic equations, which describe the propagation of surface shallow water gravity waves, are used in the present modeling work (see, for instance, [8]). They are:
where u and v are the depth averaged water velocities along the x and y axis, h is the depth of water below the mean sea level, is the displacement of the water surface above the mean sea level measured upwards, is the total water depth, is the Coriolis parameter (, where is the Earth rotational angular velocity and is latitude), g is acceleration due to gravity, is a mean value of water density and A is the horizontal eddy viscosity. and are friction stresses, which have been written in terms of a quadratic law:
where k is the bed friction coefficient. Essentially, these equations express mass and momentum conservation. Parameter values were set to and m/s [9,10], which are standard values.
This type of model represents a good compromise between accuracy and computational cost [11] and has been widely used to simulate tsunamis generated by earthquakes (see, for instance, [12,13,14], among many others), case in which the extension of the tsunami source is much larger than water depth. This is not the case for landslides since, now, the spatial extent of the source is usually not much larger than water depth. Three-dimensional models are then applied to obtain a detailed description of the flow field [15]. Depth-integrated models can still be applied but cannot give such a detailed flow description in the generation area [11].
All the equations are solved using explicit finite difference schemes [8] with second-order accuracy. In particular, the MSOU (Monotonic Second-Order Upstream) is used for the advective nonlinear terms in the momentum equations. The time step is fixed as 1 s to ensure stability.
Boundary conditions have to be specified. There is no water flow towards a dry grid cell. A flood/dry algorithm is required since, when the tsunami reaches the coast, new wet or dry grid cells may be generated due to run-up or rundown. The numerical scheme described in [16] was adopted. Wet grid cells are defined as those with a total water depth H larger than a threshold value typically set as a few centimeters. Dry cells are defined as cells where . Flooding and drying is implemented in the code via the calculation of the water velocity normal to the interface between wet and dry cells. The calculation is performed when the pressure gradient force is directed towards the dry cell. Otherwise, velocity is set to zero at this point. In the case of a non-zero velocity, the water level in the dry cell will increase, and the cell turns into a wet one once the water depth is larger than . In the present study, m has been fixed following [16] and our previous studies [9,10]. Nevertheless, runup calculations are not presented in this paper.
This methodology was successfully used in the past to simulate tsunami propagation in the Atlantic Ocean [9], Mediterranean Sea [10], Red Sea [17] and Caspian Sea [18].
Still waters (zero water elevations and velocities over all the domain) are used as initial conditions in all the domain. The methodology of Tinti [19] and Cecioni and Bellotti [11] was adopted to simulate a submarine landslide. Essentially, the motion of the sea bottom is provided as a known input to the hydrodynamic equations. The following term is added to the right hand side of the continuity Equation (Equation (1)):
where denotes the instantaneous sea surface elevation caused by the transit of the underwater landslide. This term is the link between the landslide model and the tsunami propagation model. The relation between and the local thickness of the slide at the sea bottom is calculated by the means of a transfer function according to:
with
where H is the local water depth, and is the length of the slide. If the transfer function is not used, then , which is a good approximation only if the slide length is much larger than the water depth. Using the transfer function attributes different potential to landslides of different and moving at different ocean depths. As a consequence, a shallow water slide will have a higher capacity of exciting waves (, and thus, ) than if it moves in the deep ocean (, and thus, ).
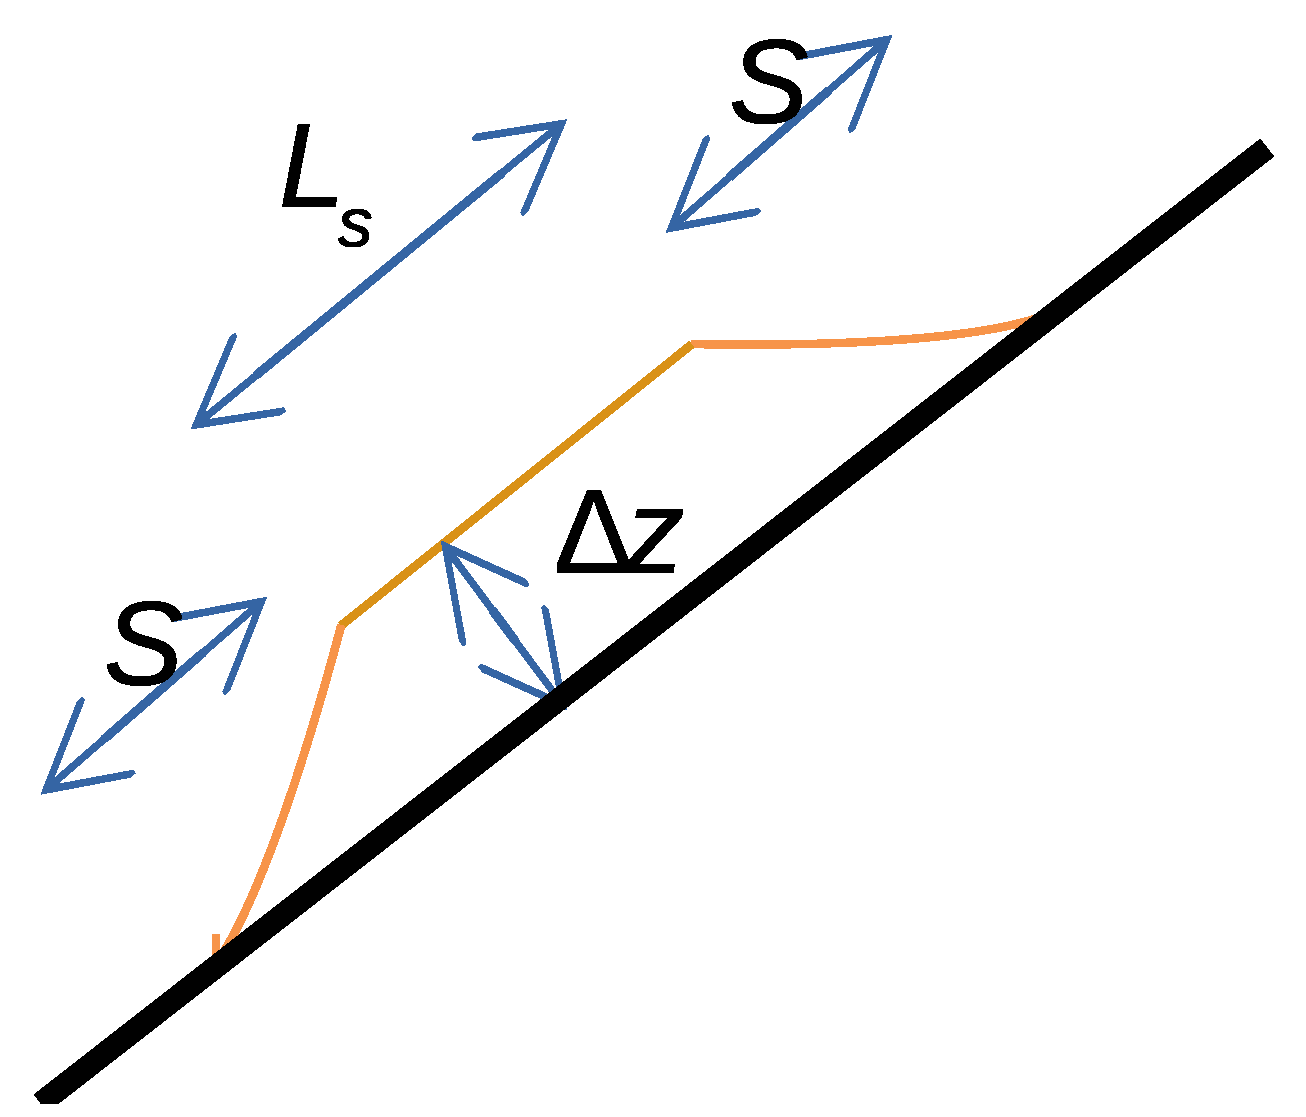
The shape of the slide is represented by a box form of length , width B and maximum thickness . To avoid sharp gradients in , the edges of the box form are smoothed along both sides over a distance equal to B from the central line and over a smoothing distance S by an exponential function in the front and rear end. The full details may be seen in [20]. The volume of the slide would then be given by the following Equation [20]:
where the factor 0.9 arises due to the smoothing. A side view of the slide is shown in Figure 2.
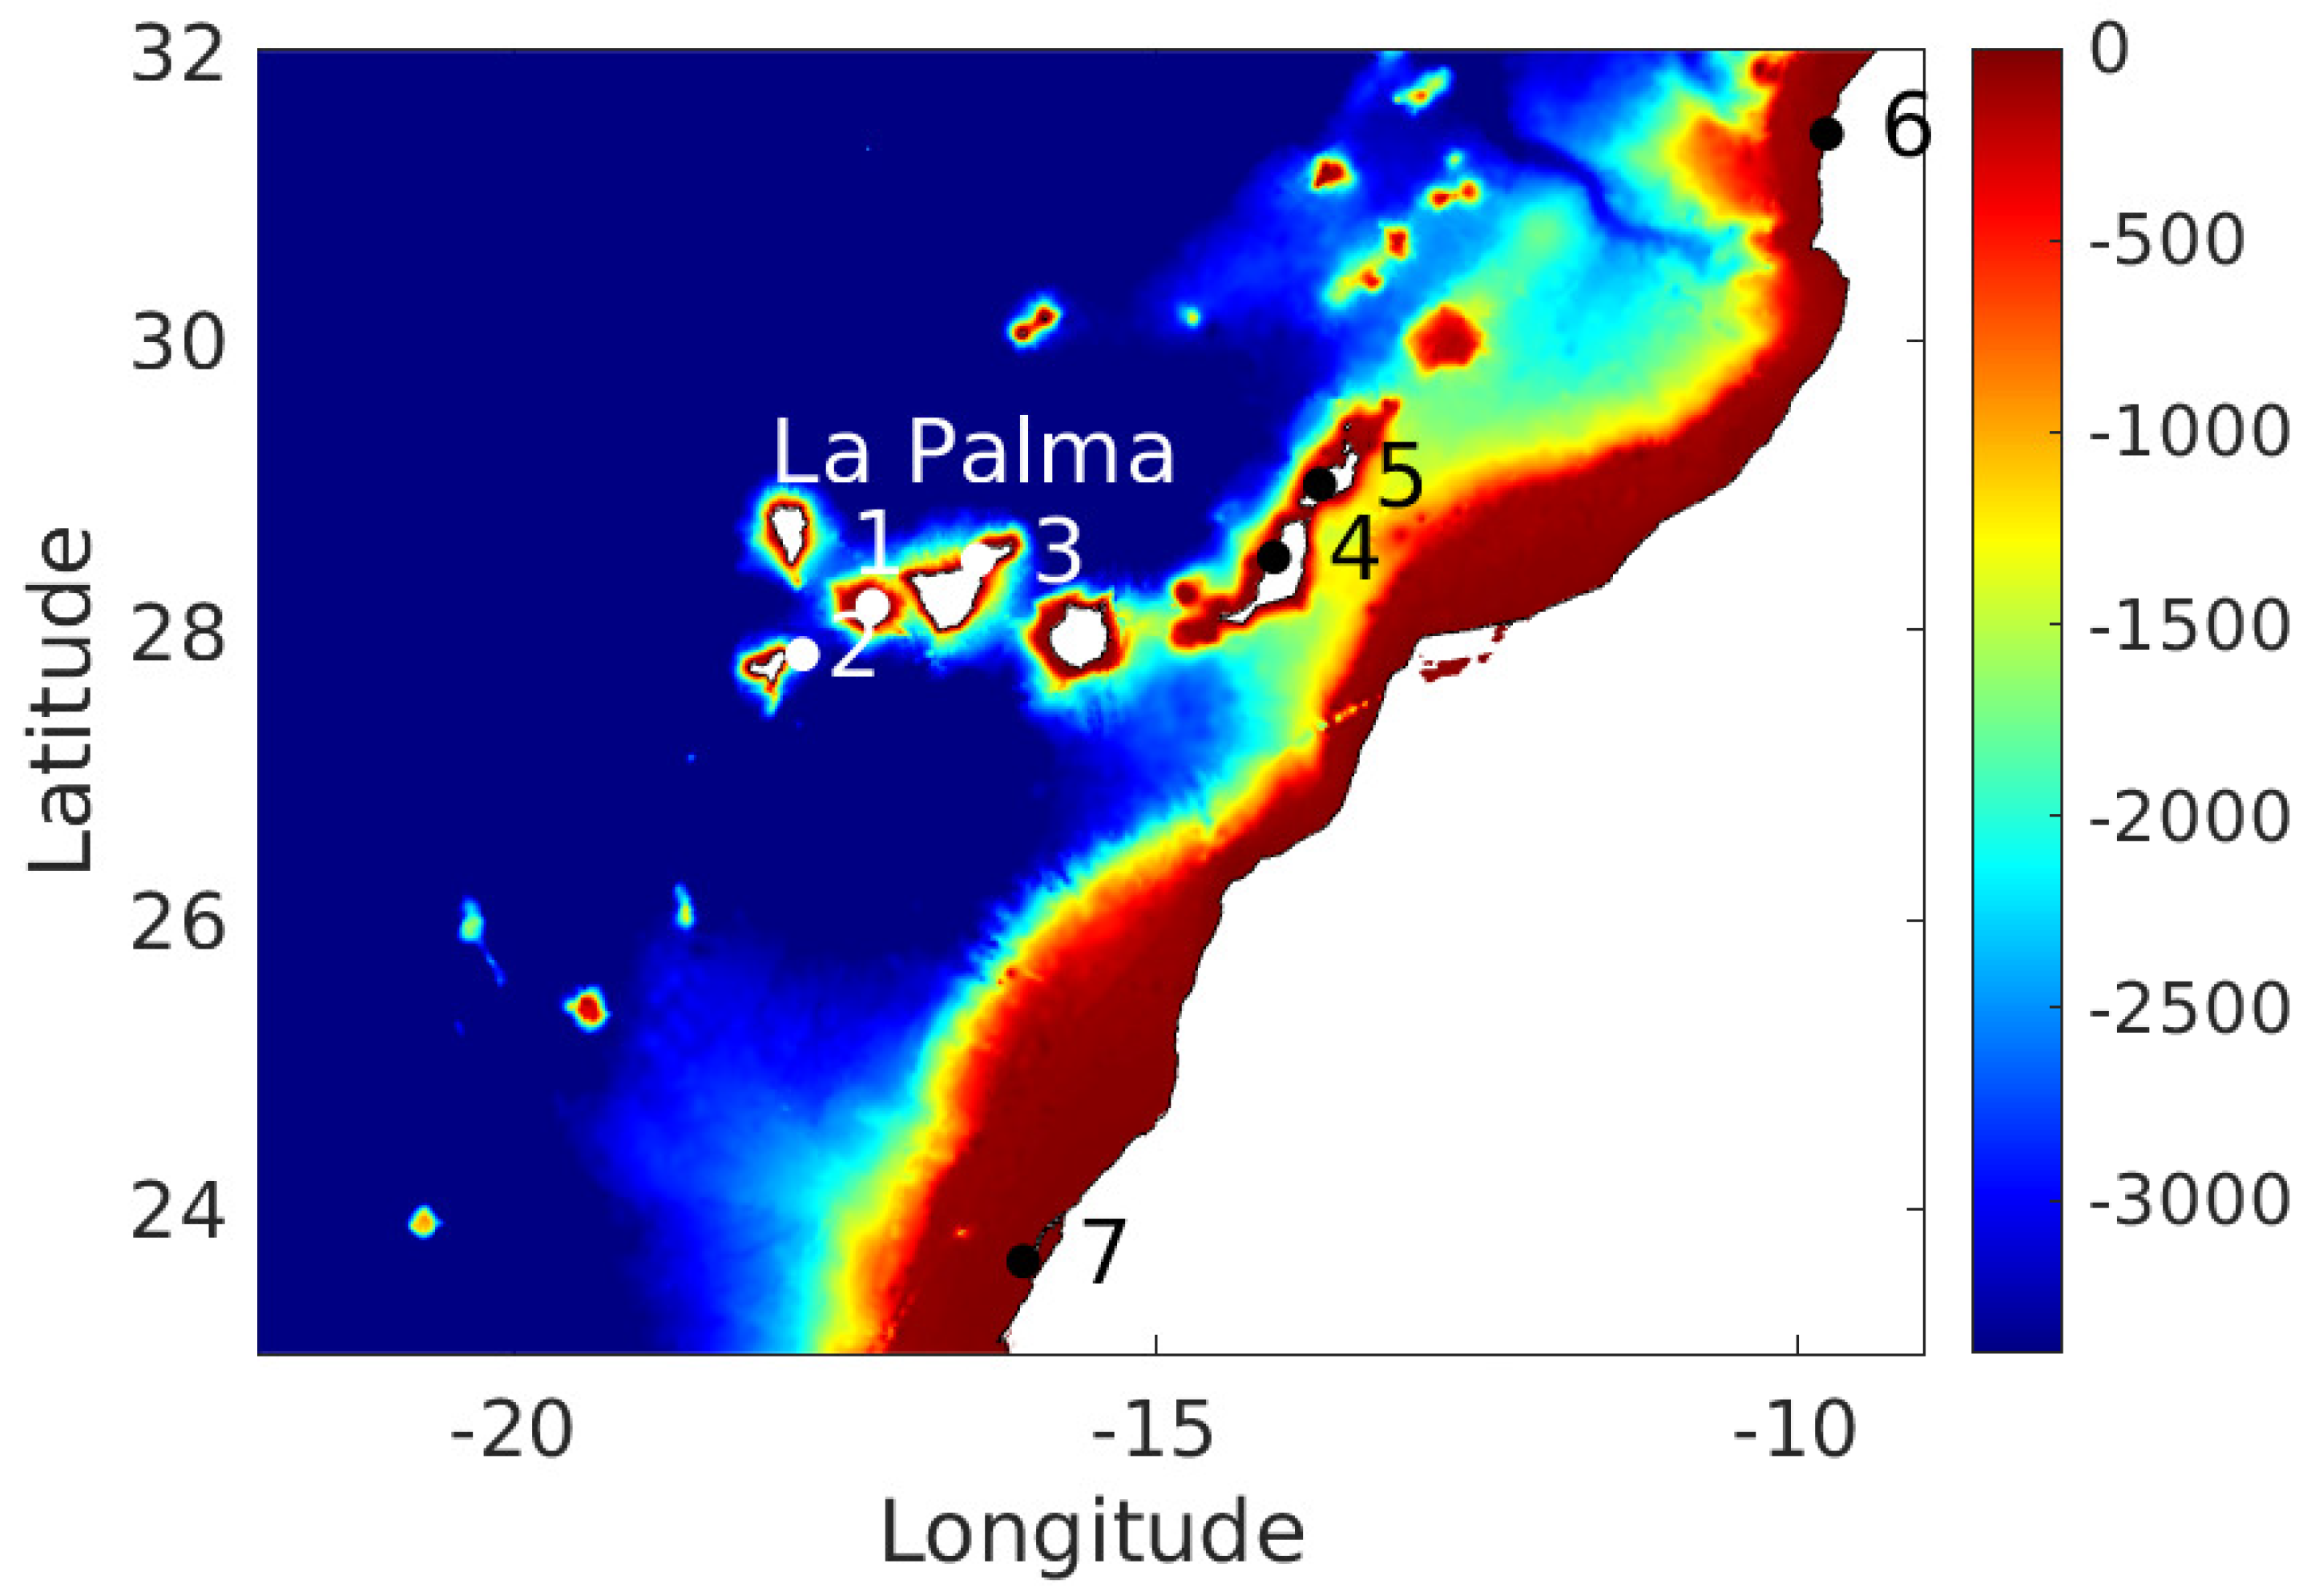
The model domain extends from 23° to 32° N and from 22° to 9° W, with a spatial resolution of 30 s of arc both in longitude and latitude. Topography was obtained from General Bathymetric Chart of the Oceans ((GEBCO) https://www.gebco.net, accessed on 13 October 2021) database. This is the highest resolution open bathymetric data available online and is presented in Figure 1, where the location of points where wave heights are extracted are also indicated. The model code was developed and written by the author in fortran. The running time is about 1 h for a 3 h long simulation on a desktop PC working with Ubuntu 18.04 operating system.
3. Results
As mentioned in the Introduction, a submarine landslide along the island slope is a possibility not discarded by experts and local authorities. It would be caused by the accumulation of lava in the island shelf, which could eventually lead to the instability of this shelf and then produce a submarine slide of material down the island slope.
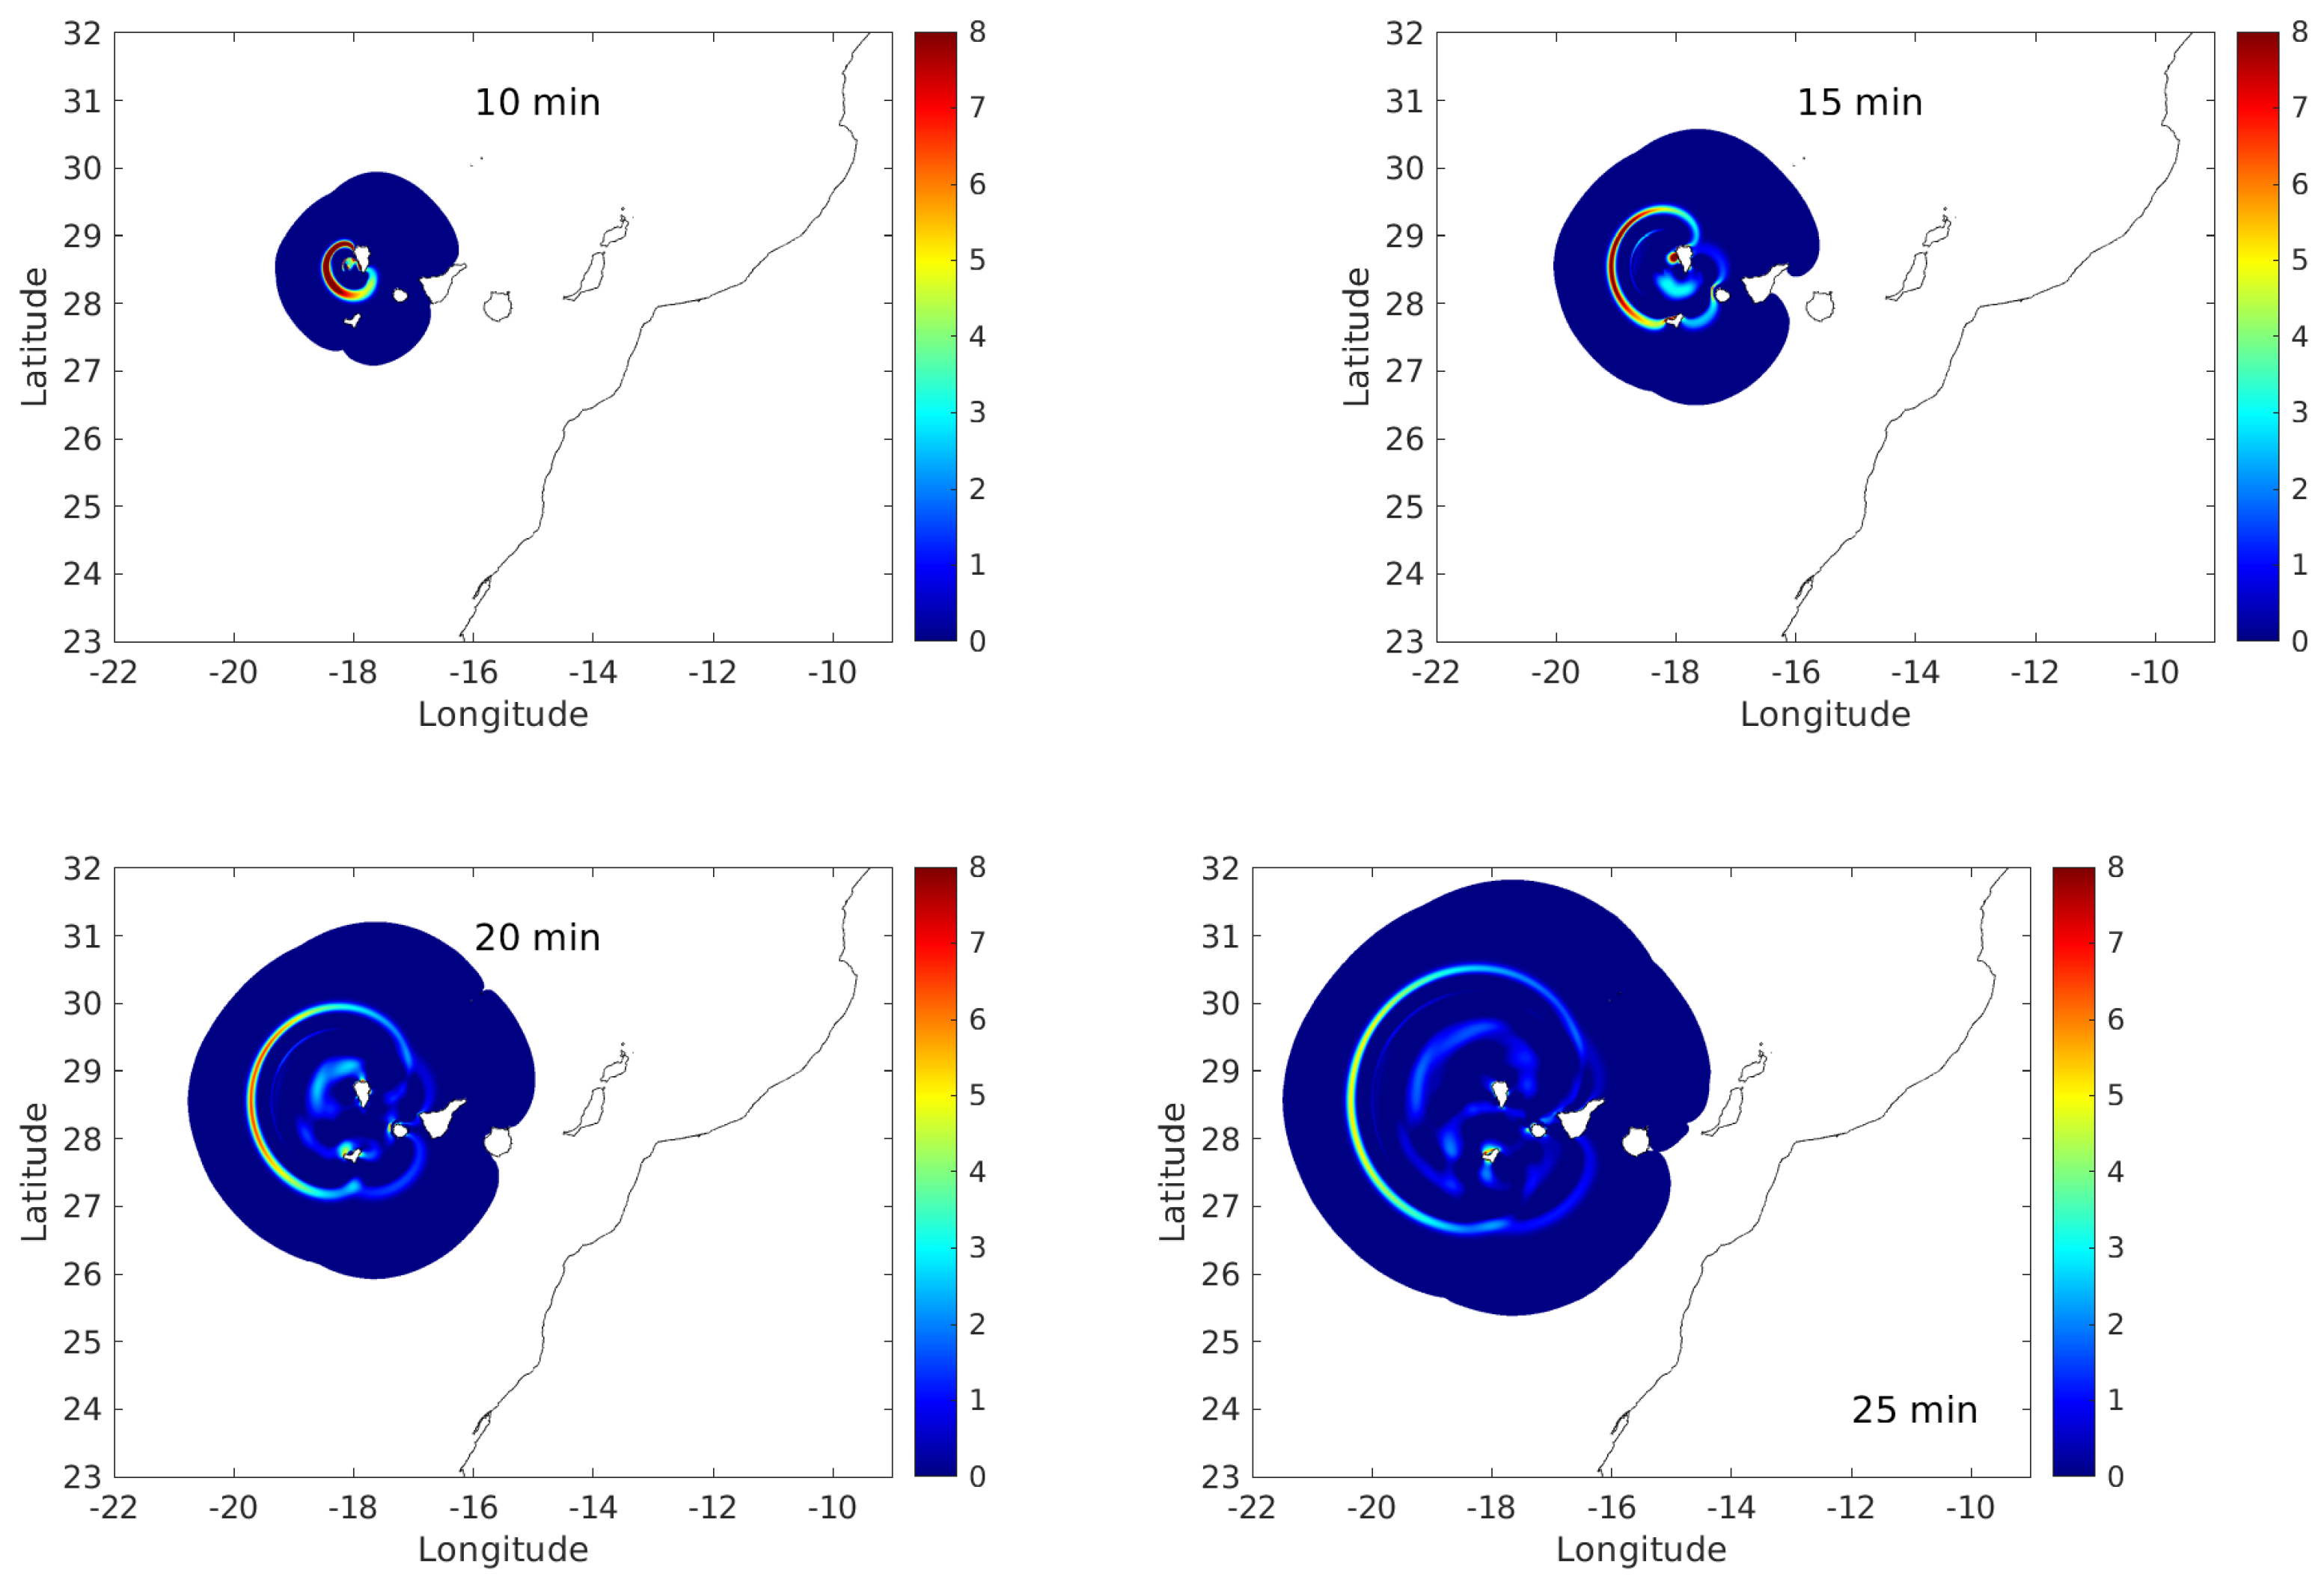
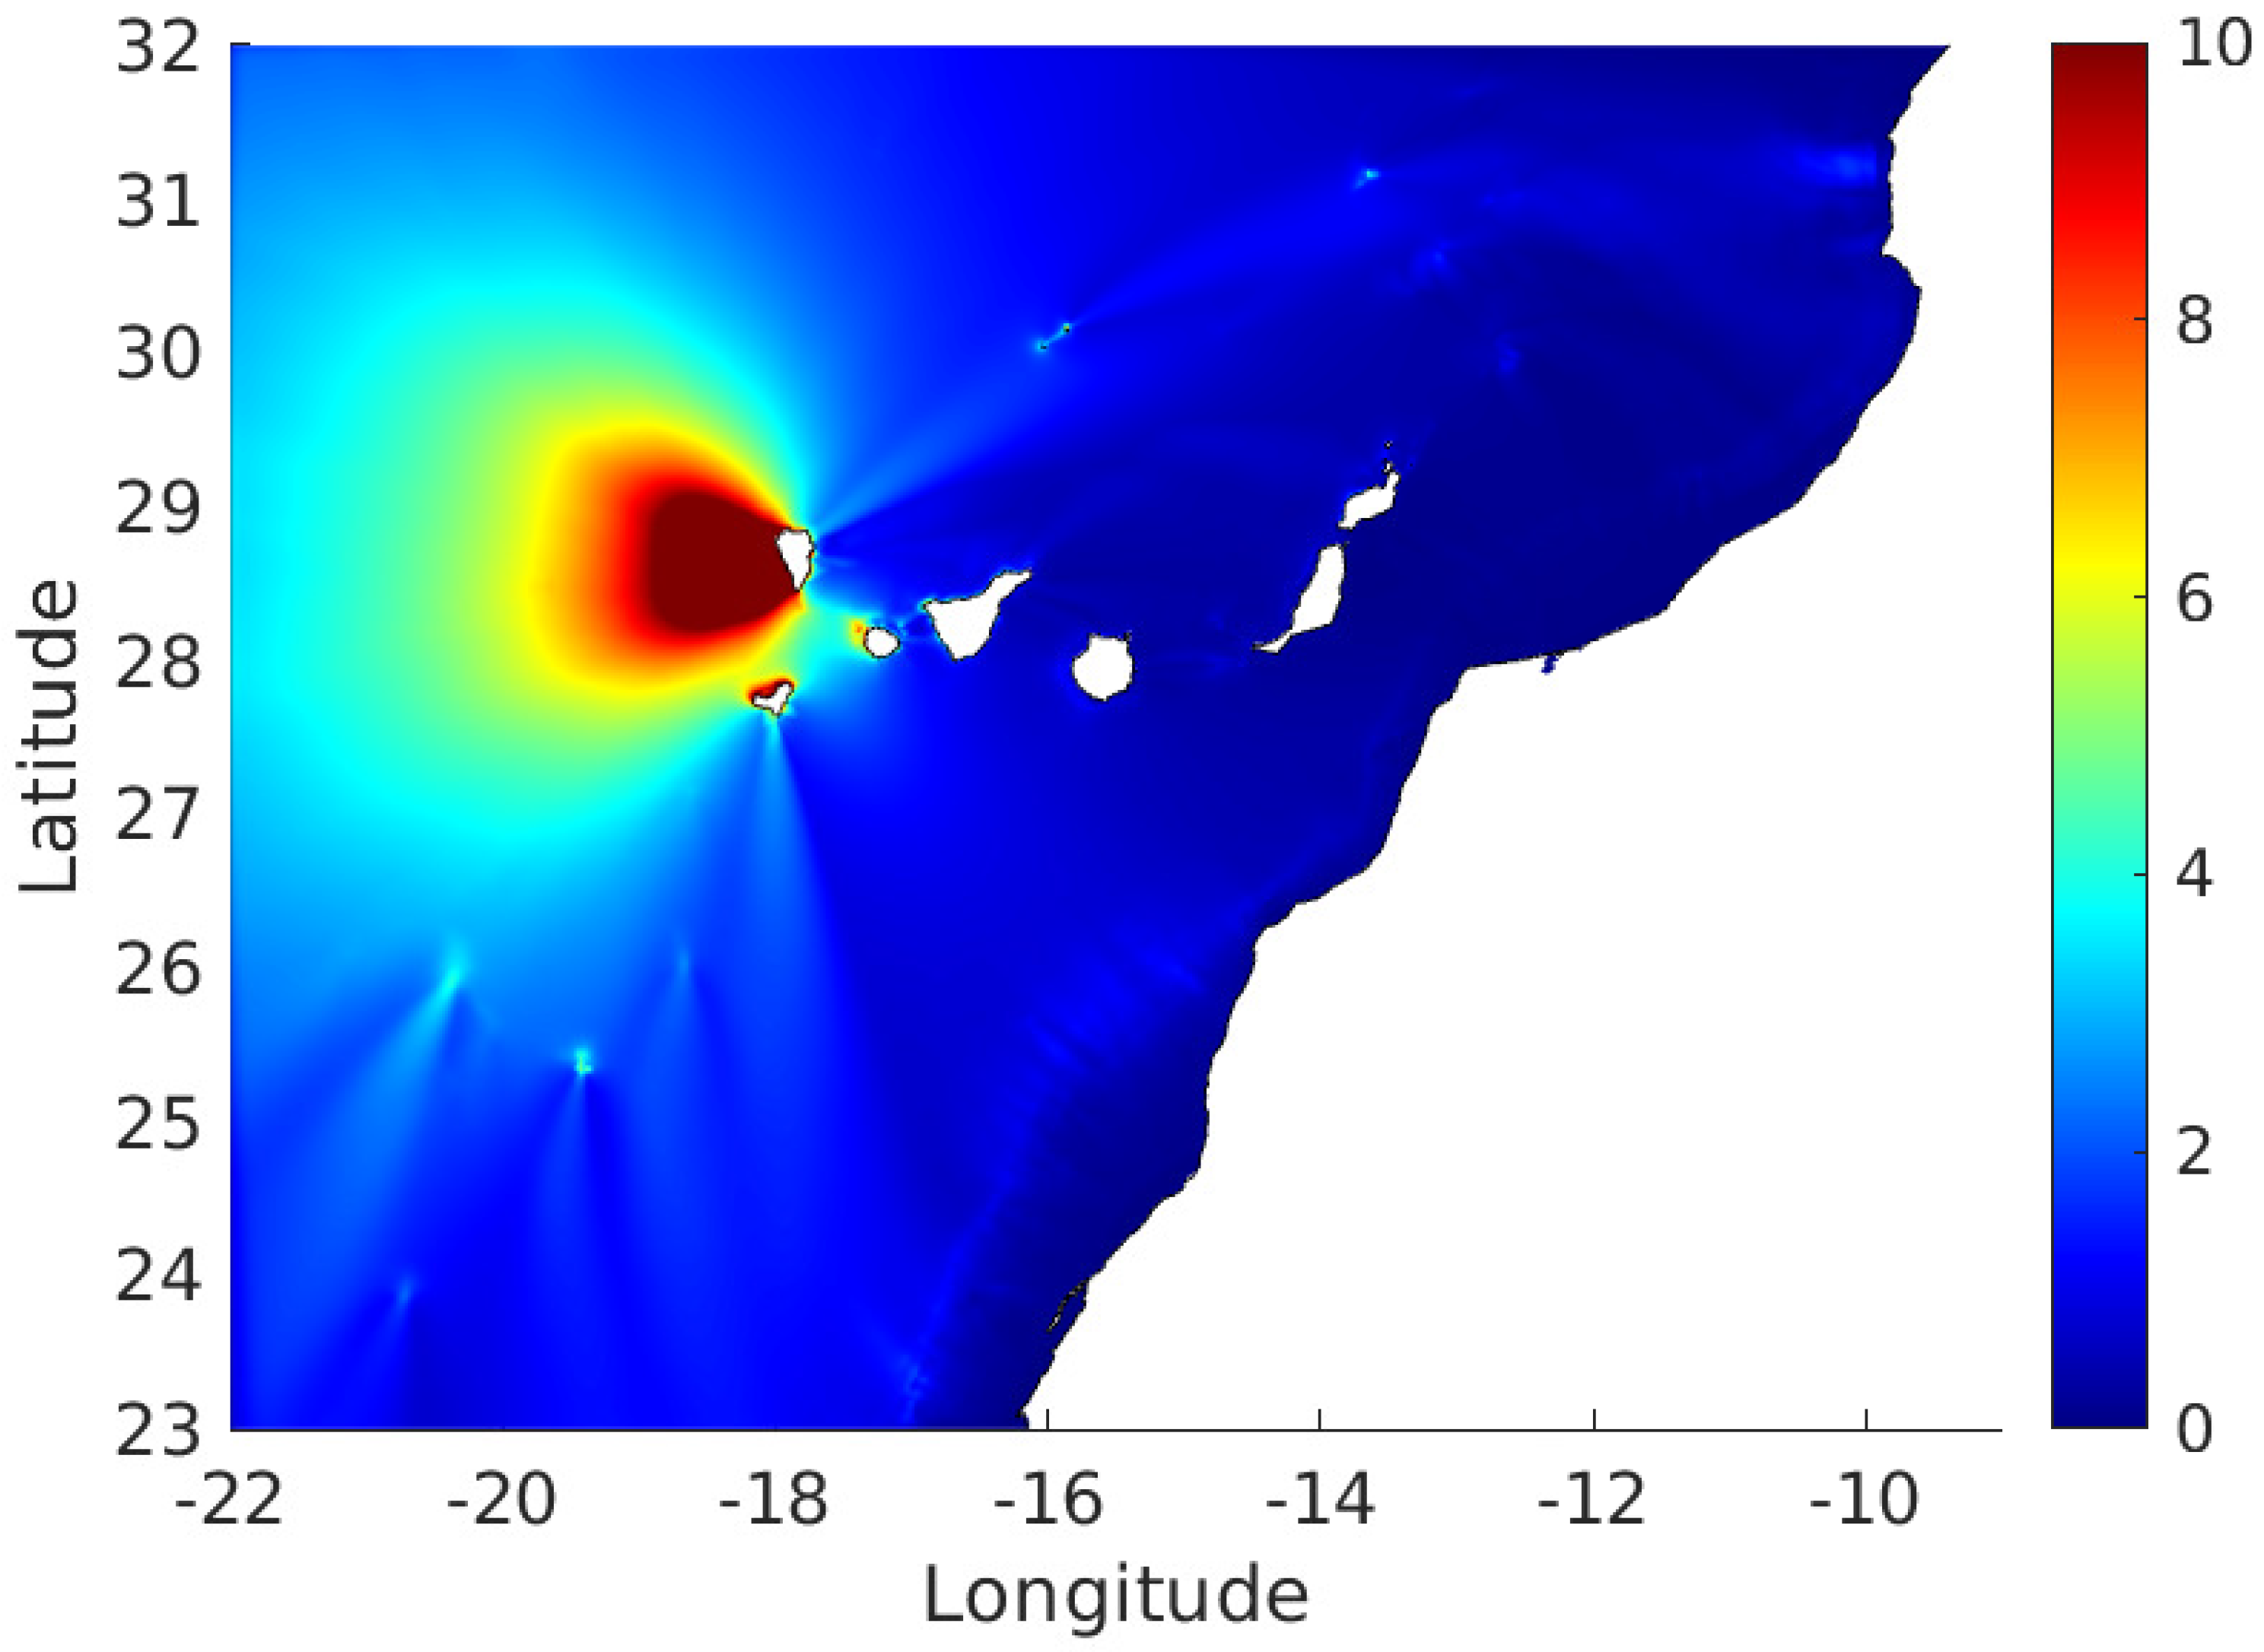
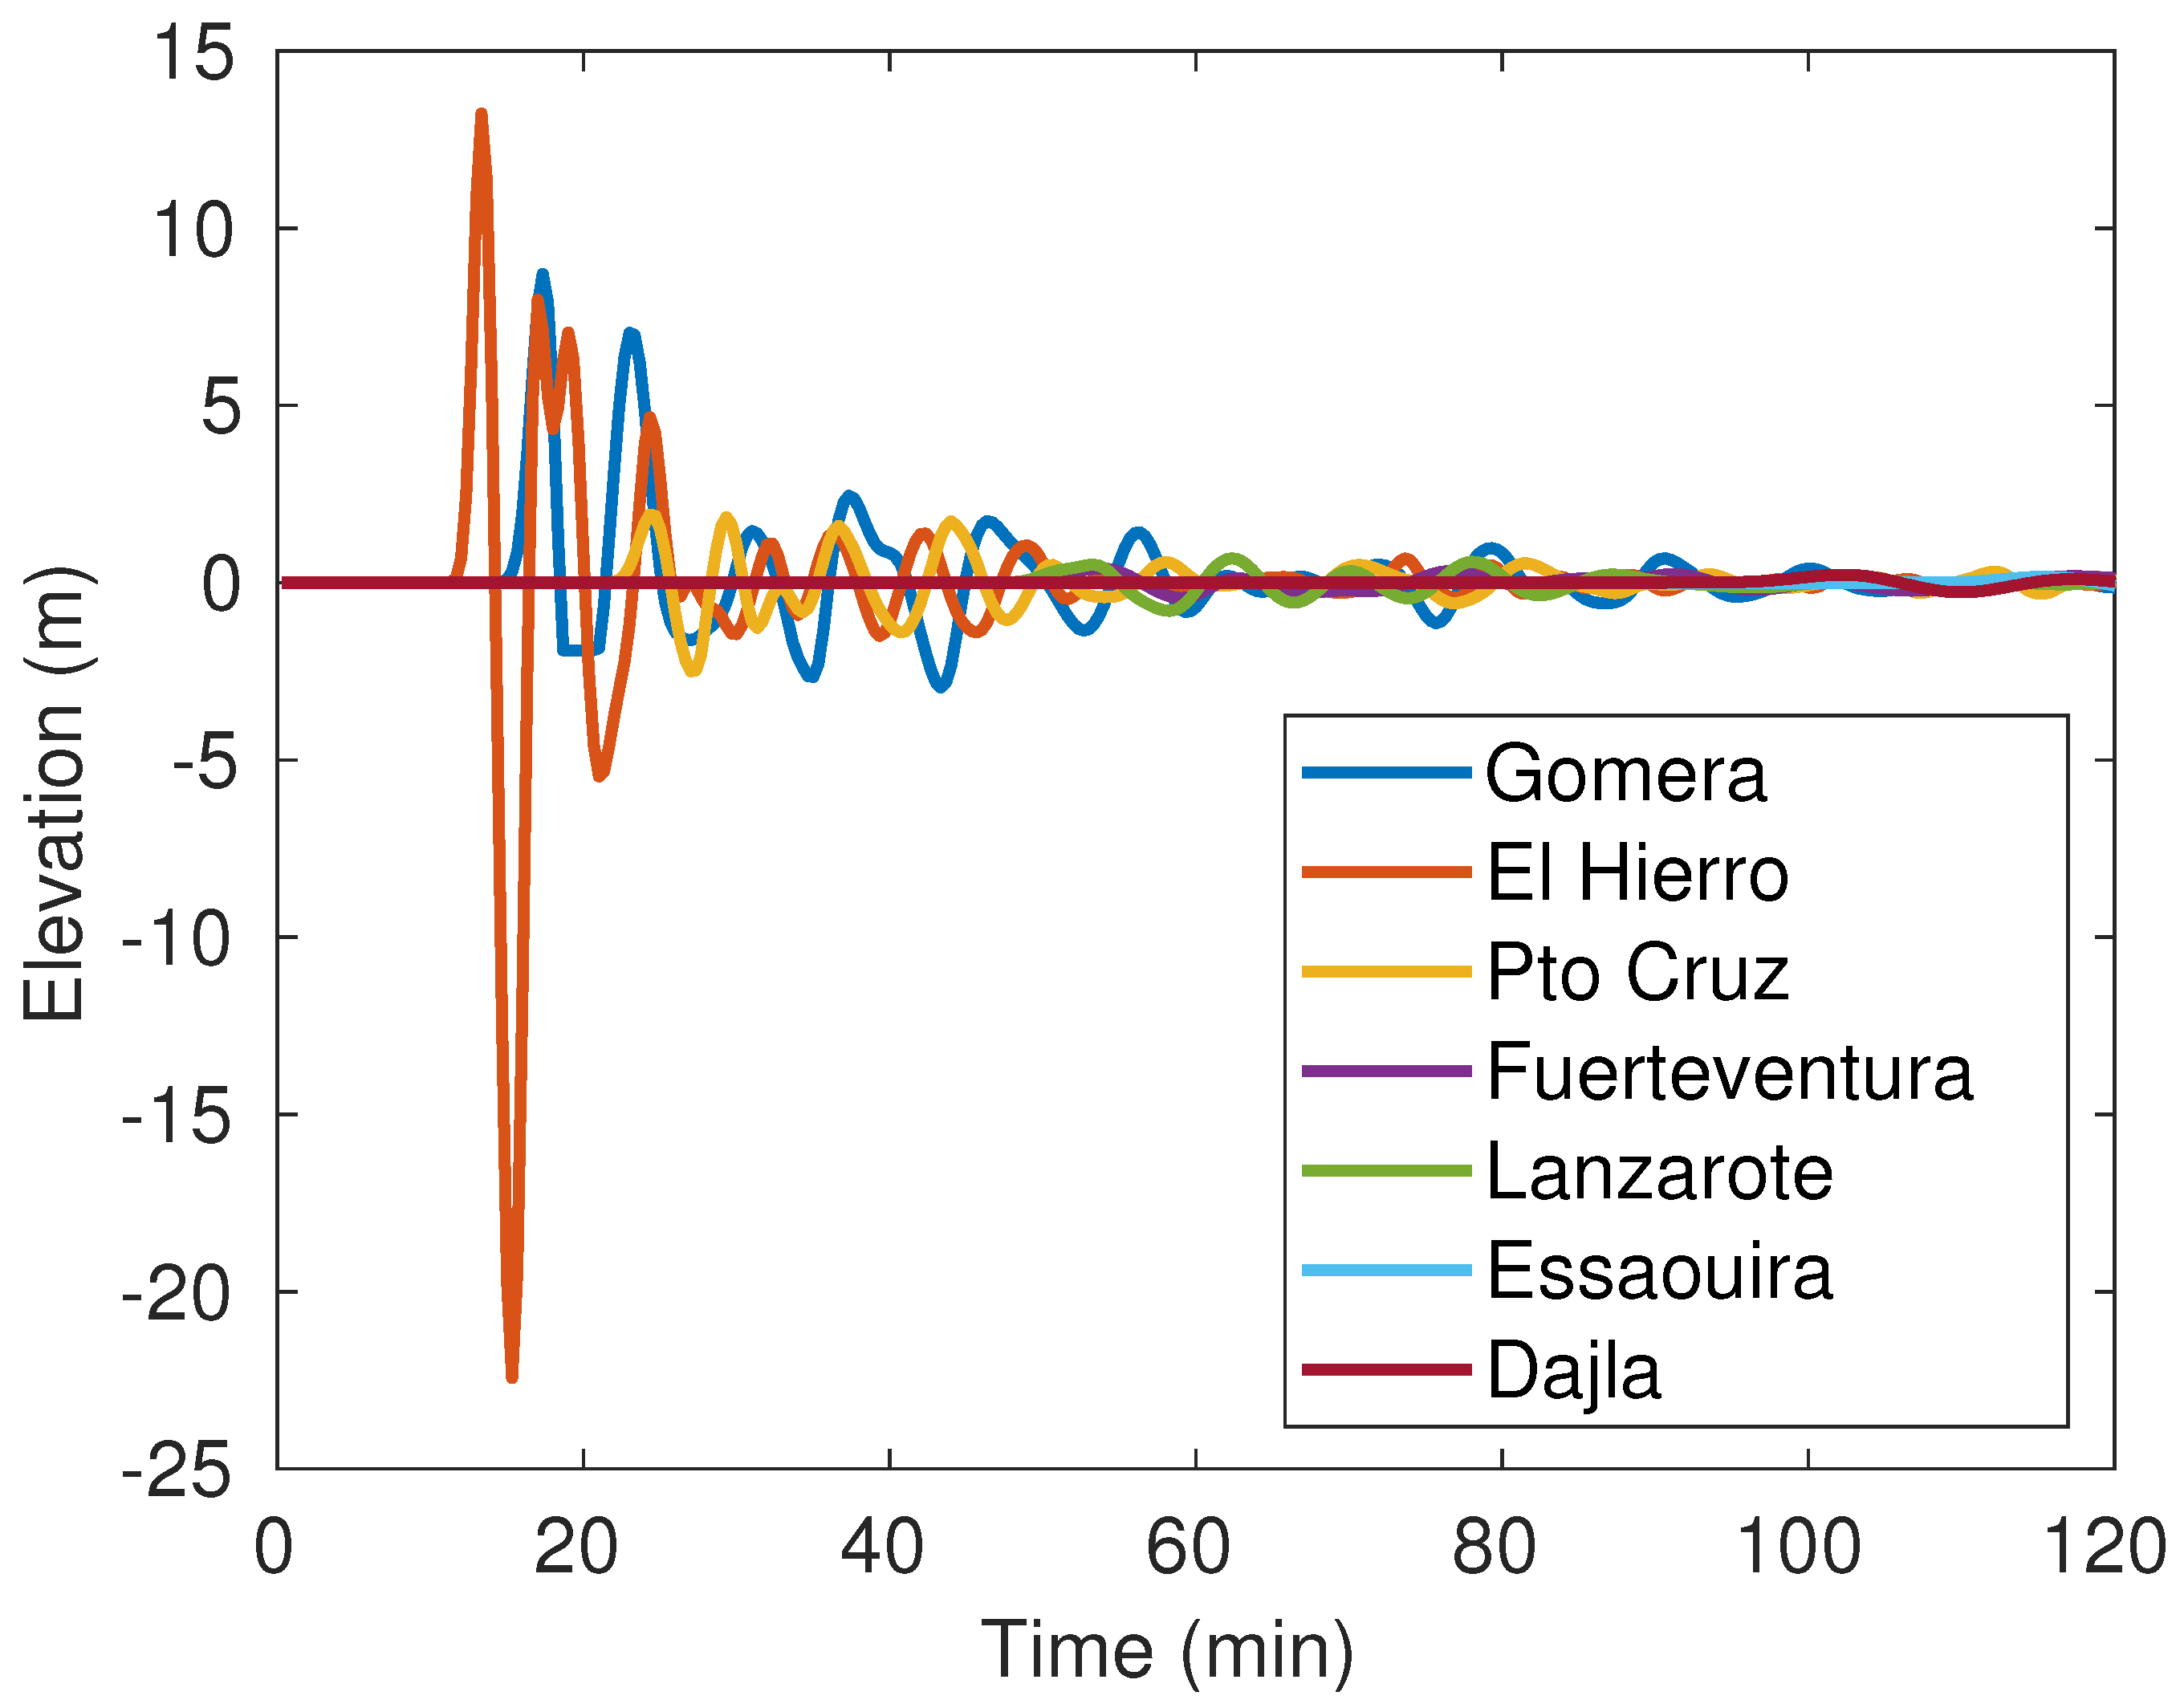
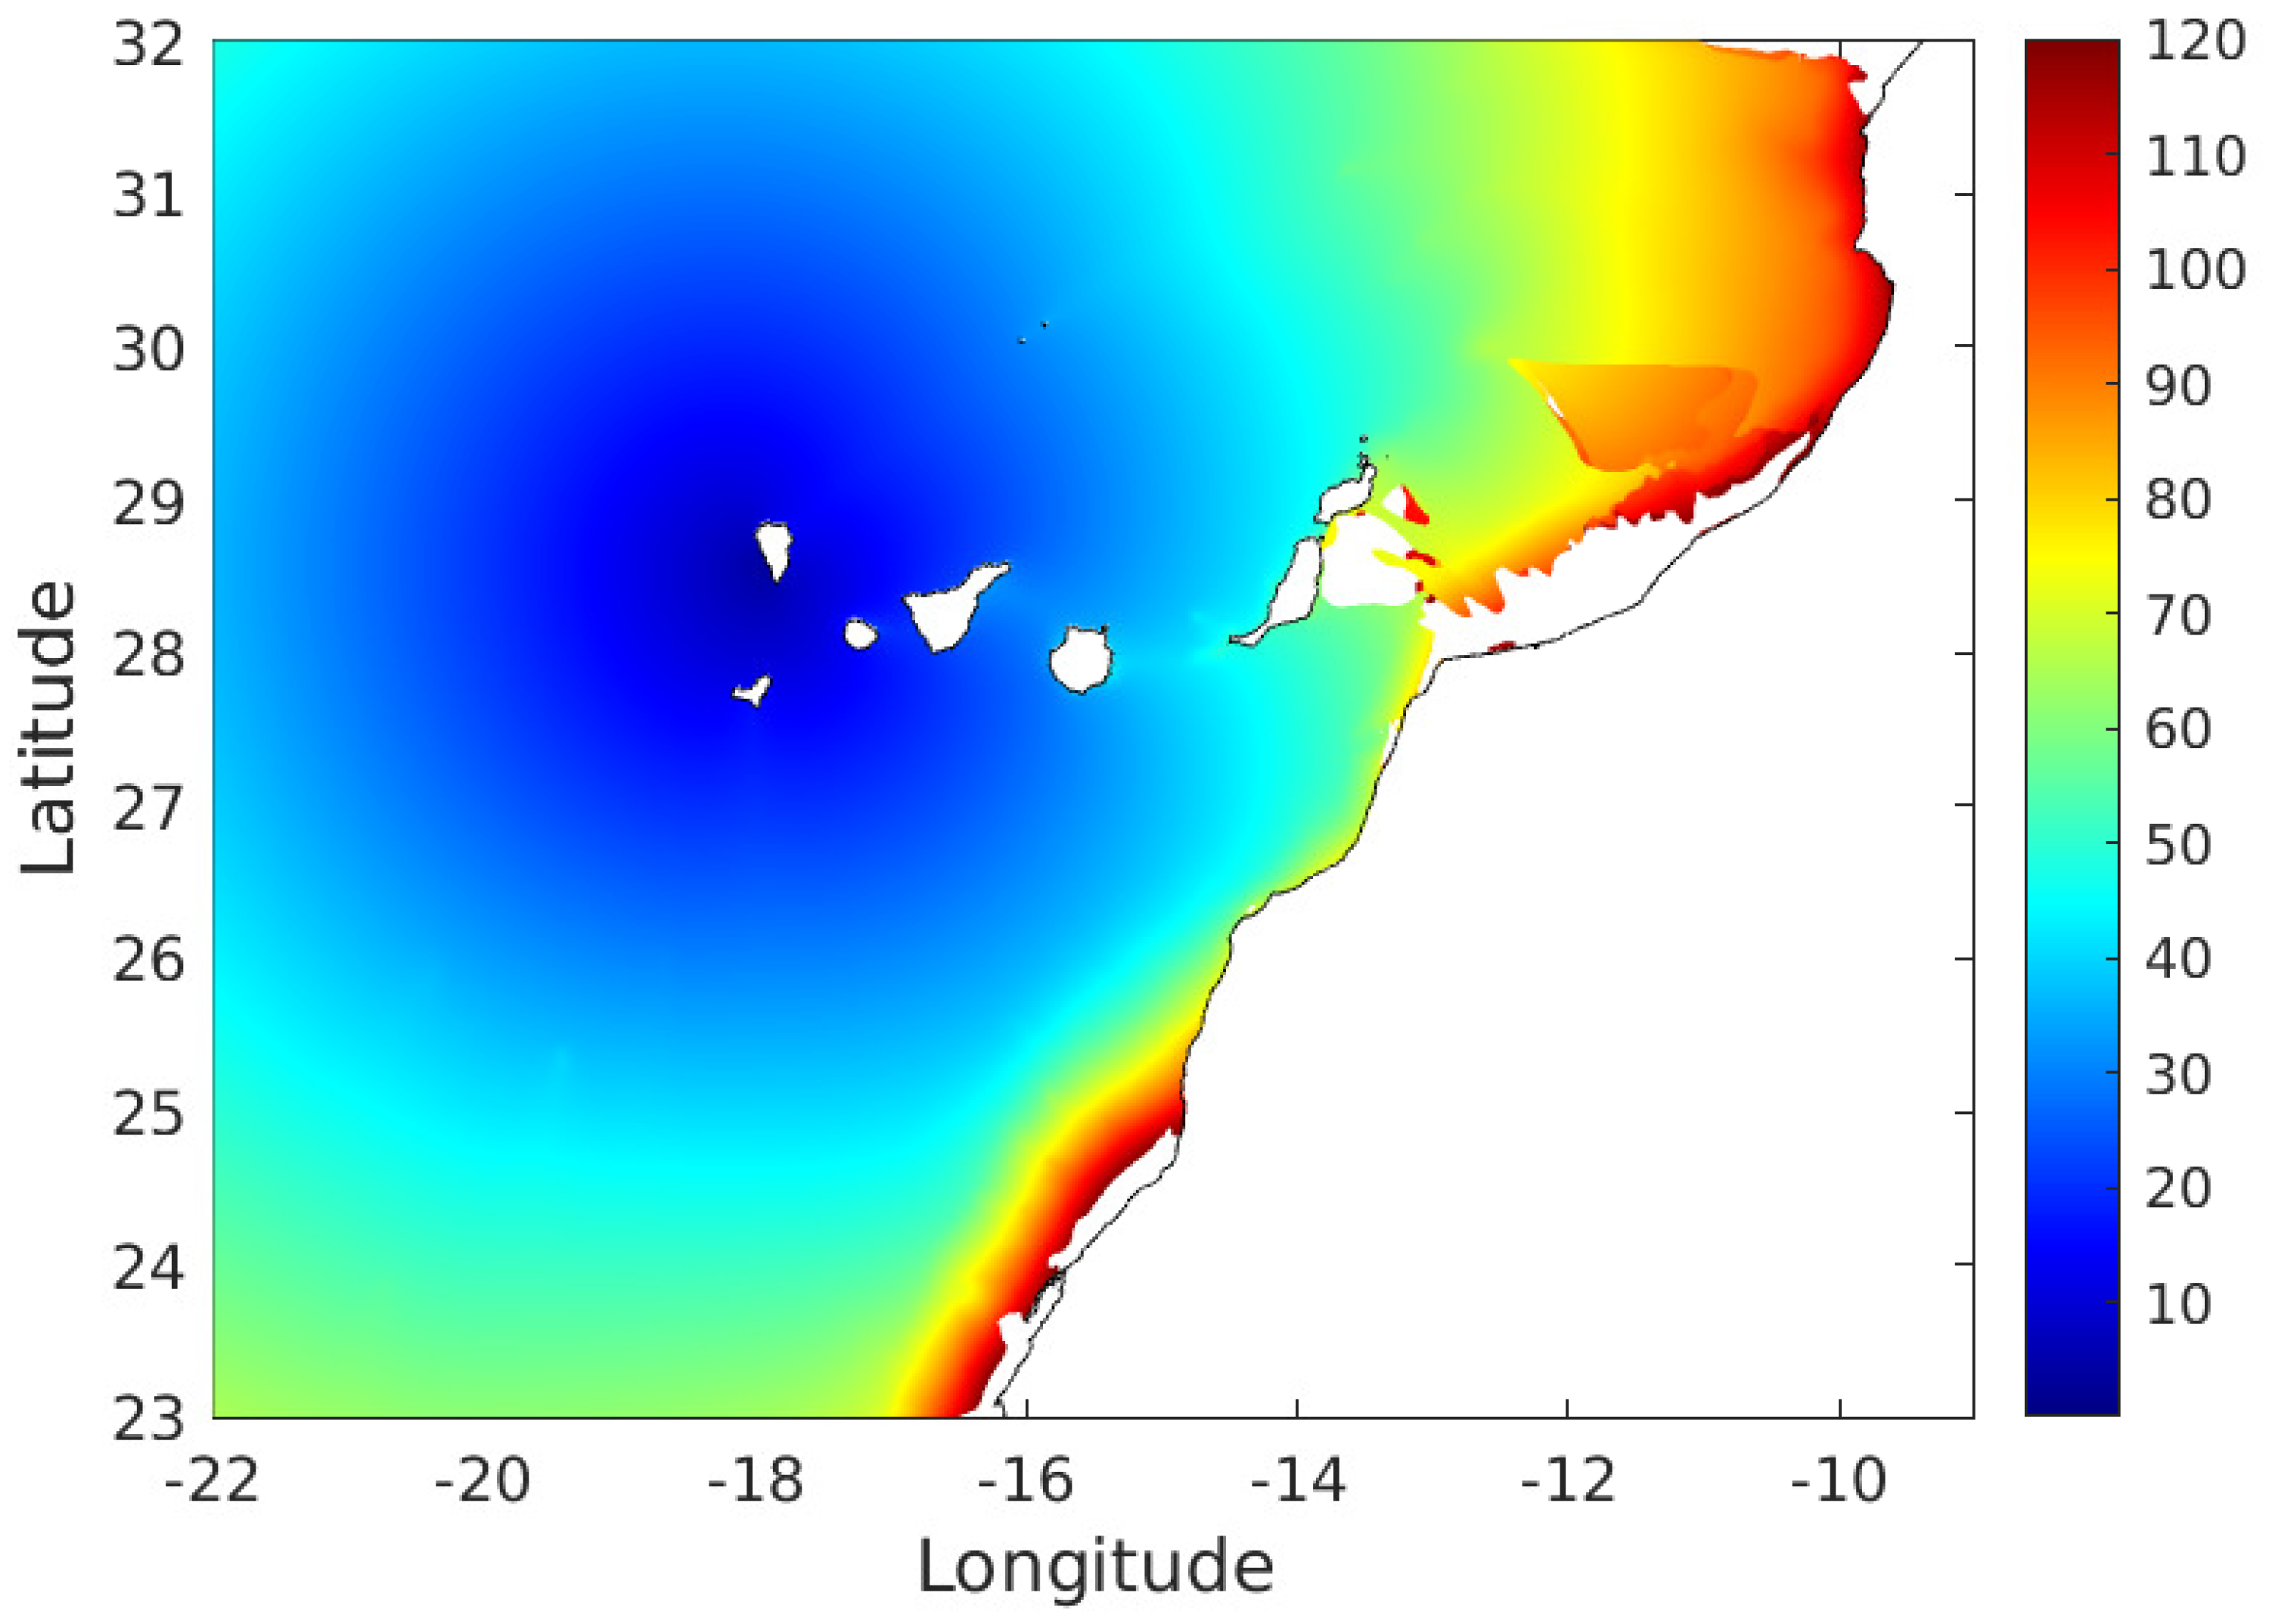
As an example, snapshots of sea surface elevations at several times after a slide are presented in Figure 3. The volume of this landslide was 4.5 km, significantly smaller than values used in previous works [1,3,4,5,6,7], but it still seems over-sized due to the narrow shelf of the island and the fact that the lava flow front is of the order of 1 km. Propagation of the tsunami in Figure 3 shows essentially the same features, as can be seen in the previous work cited above (although with smaller waves, obviously). Wave amplitudes are presented in Figure 4. The tsunami is mainly directed to the west due to the fact that the own island acts as a barrier that prevents propagation to the east. The wave amplitude decreases with distance to the source since the energy has to be distributed over a longer front. Thus, amplitude has decreased to about 4 m at −22° longitude. This tsunami would not have significant effects in far coastlines. Nevertheless, high waves are arriving to the close islands of Gomera and, mainly, El Hierro (see Figure 4). Actually, this may be clearly seen in Figure 5: the first wave arriving to El Hierro is about 13 m high; in the case of Gomera, its height is about 9 m. Much smaller waves arrive elsewhere.
Figure 6 shows the arrival time of the tsunami (defined as the arrival time of a 1 cm amplitude signal). While the close islands are reached in a few minutes, two hours are required by the tsunami to reach the African coastline. Some regions of Africa coast and the east of Lanzarote and Fuerteventura islands are even not reached by signals larger than 1 cm since such regions are sheltered by, mainly, Fuerteventura.
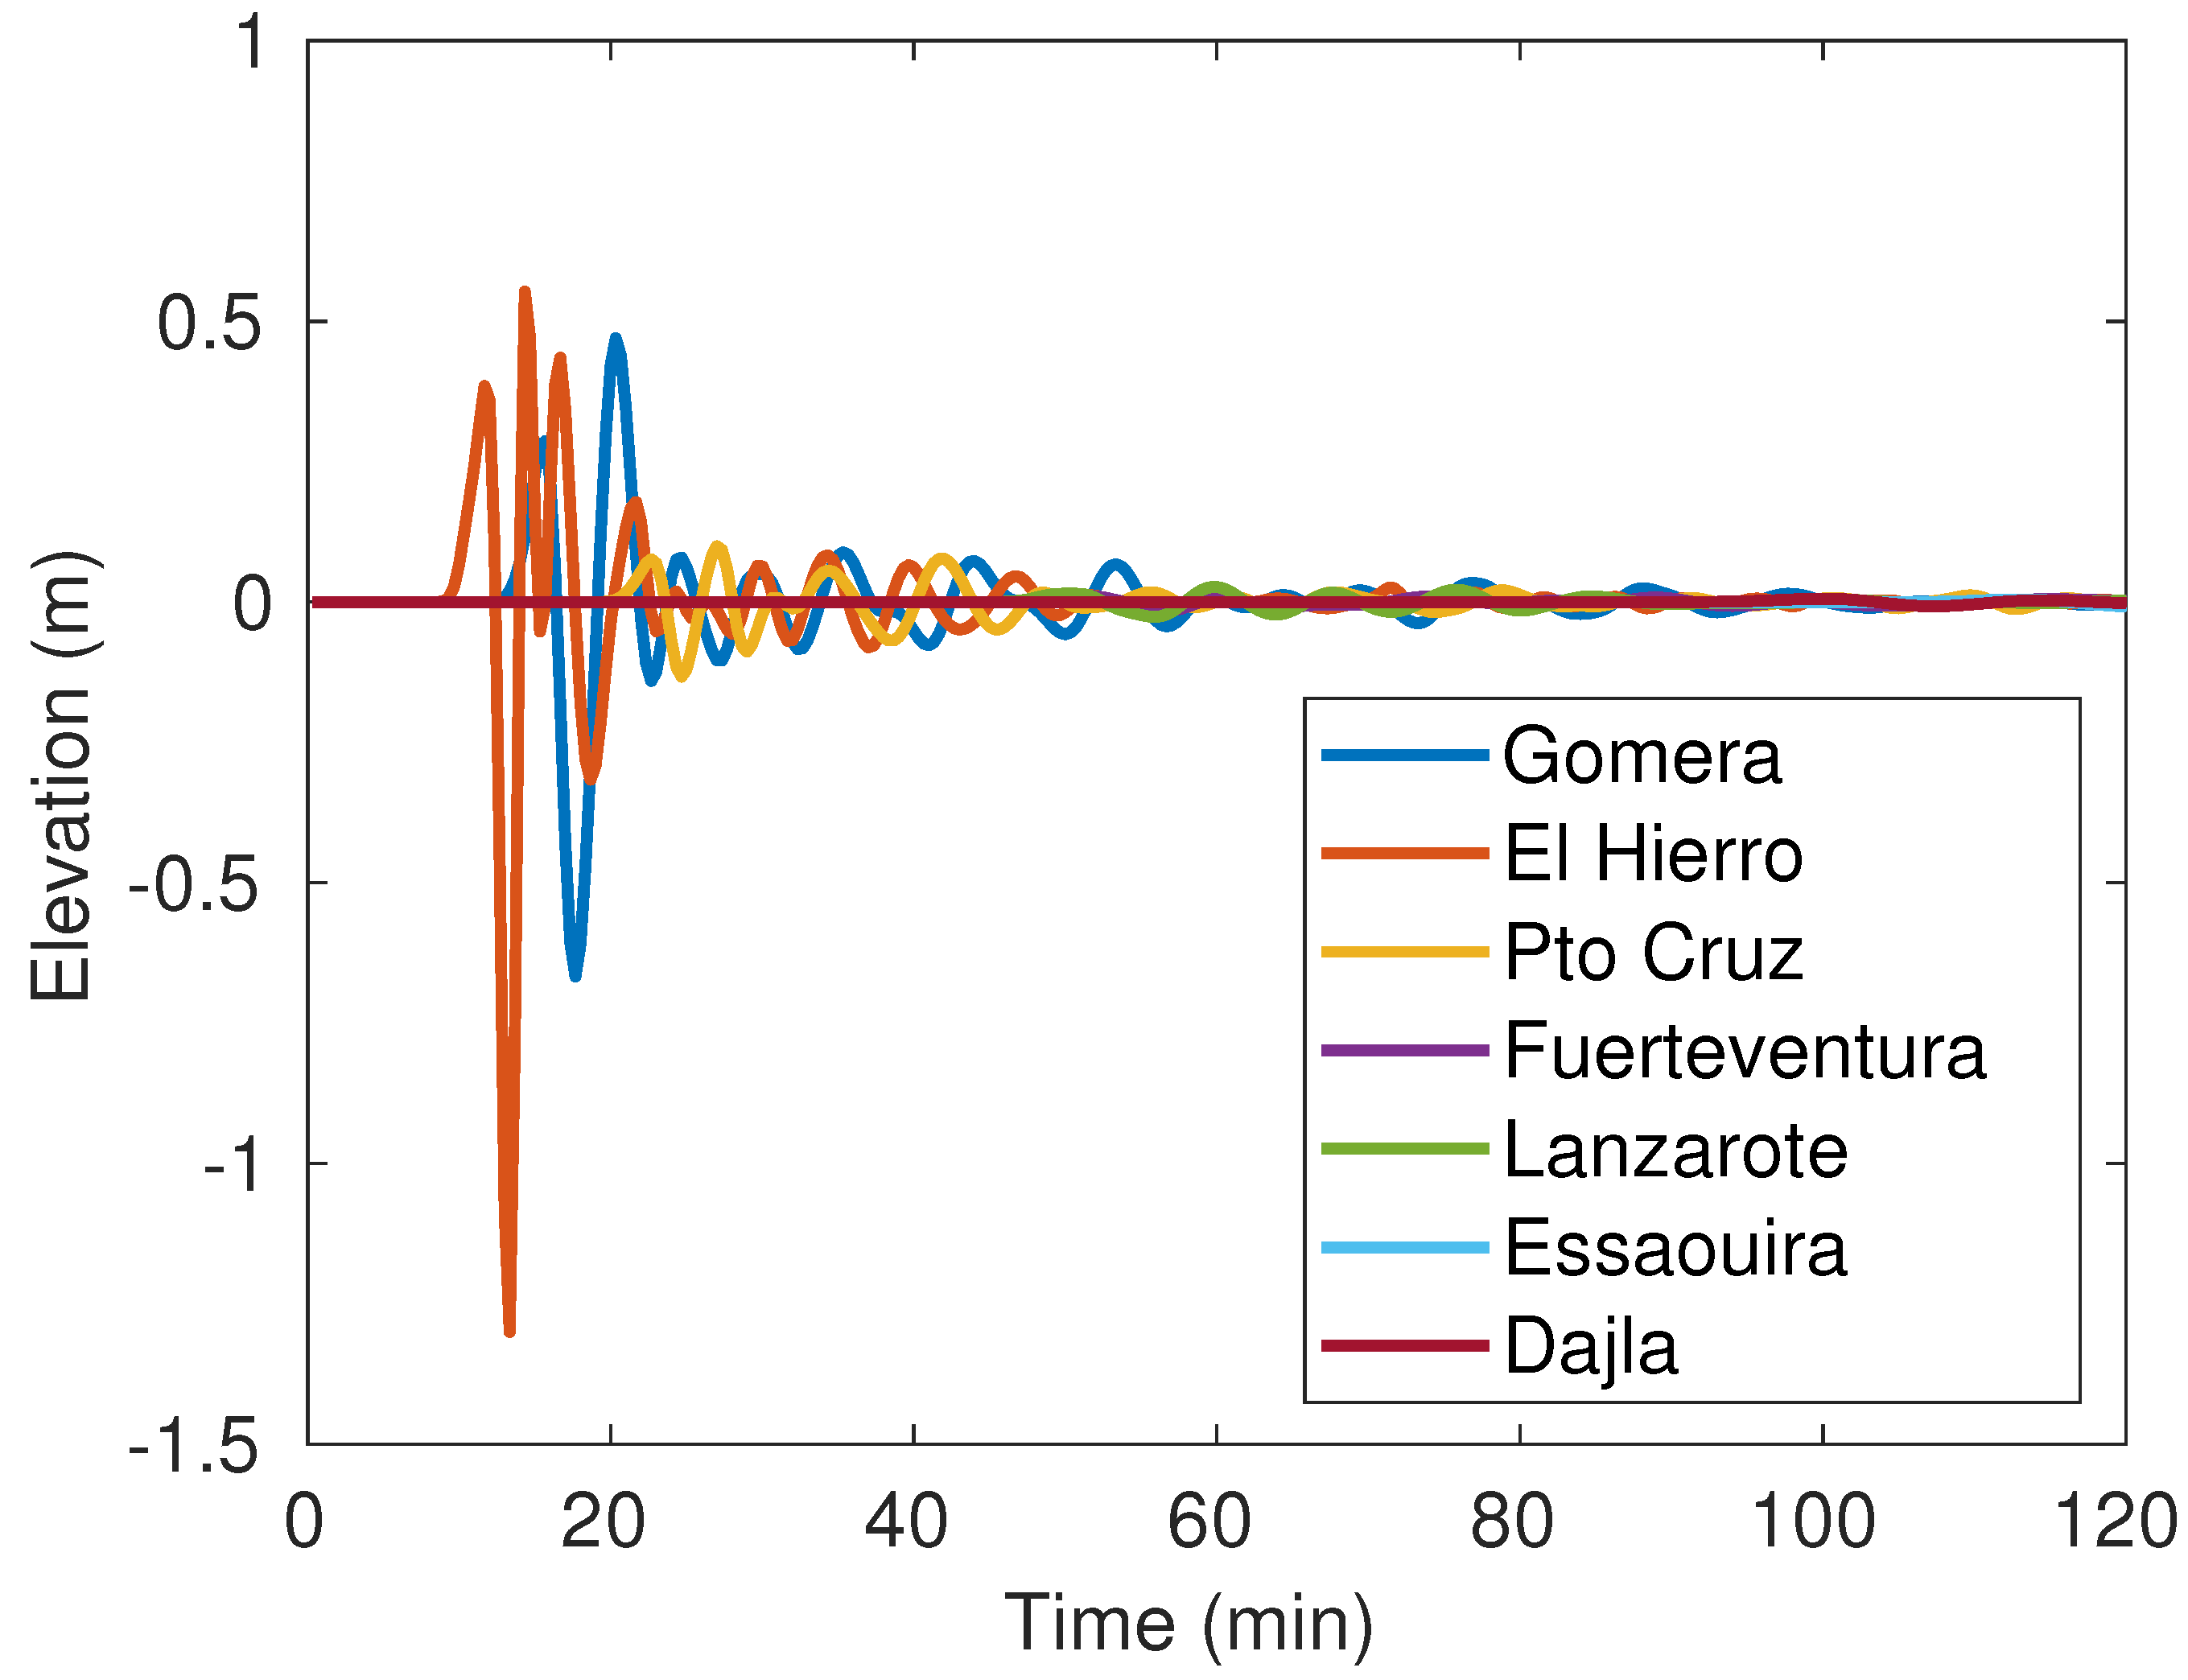
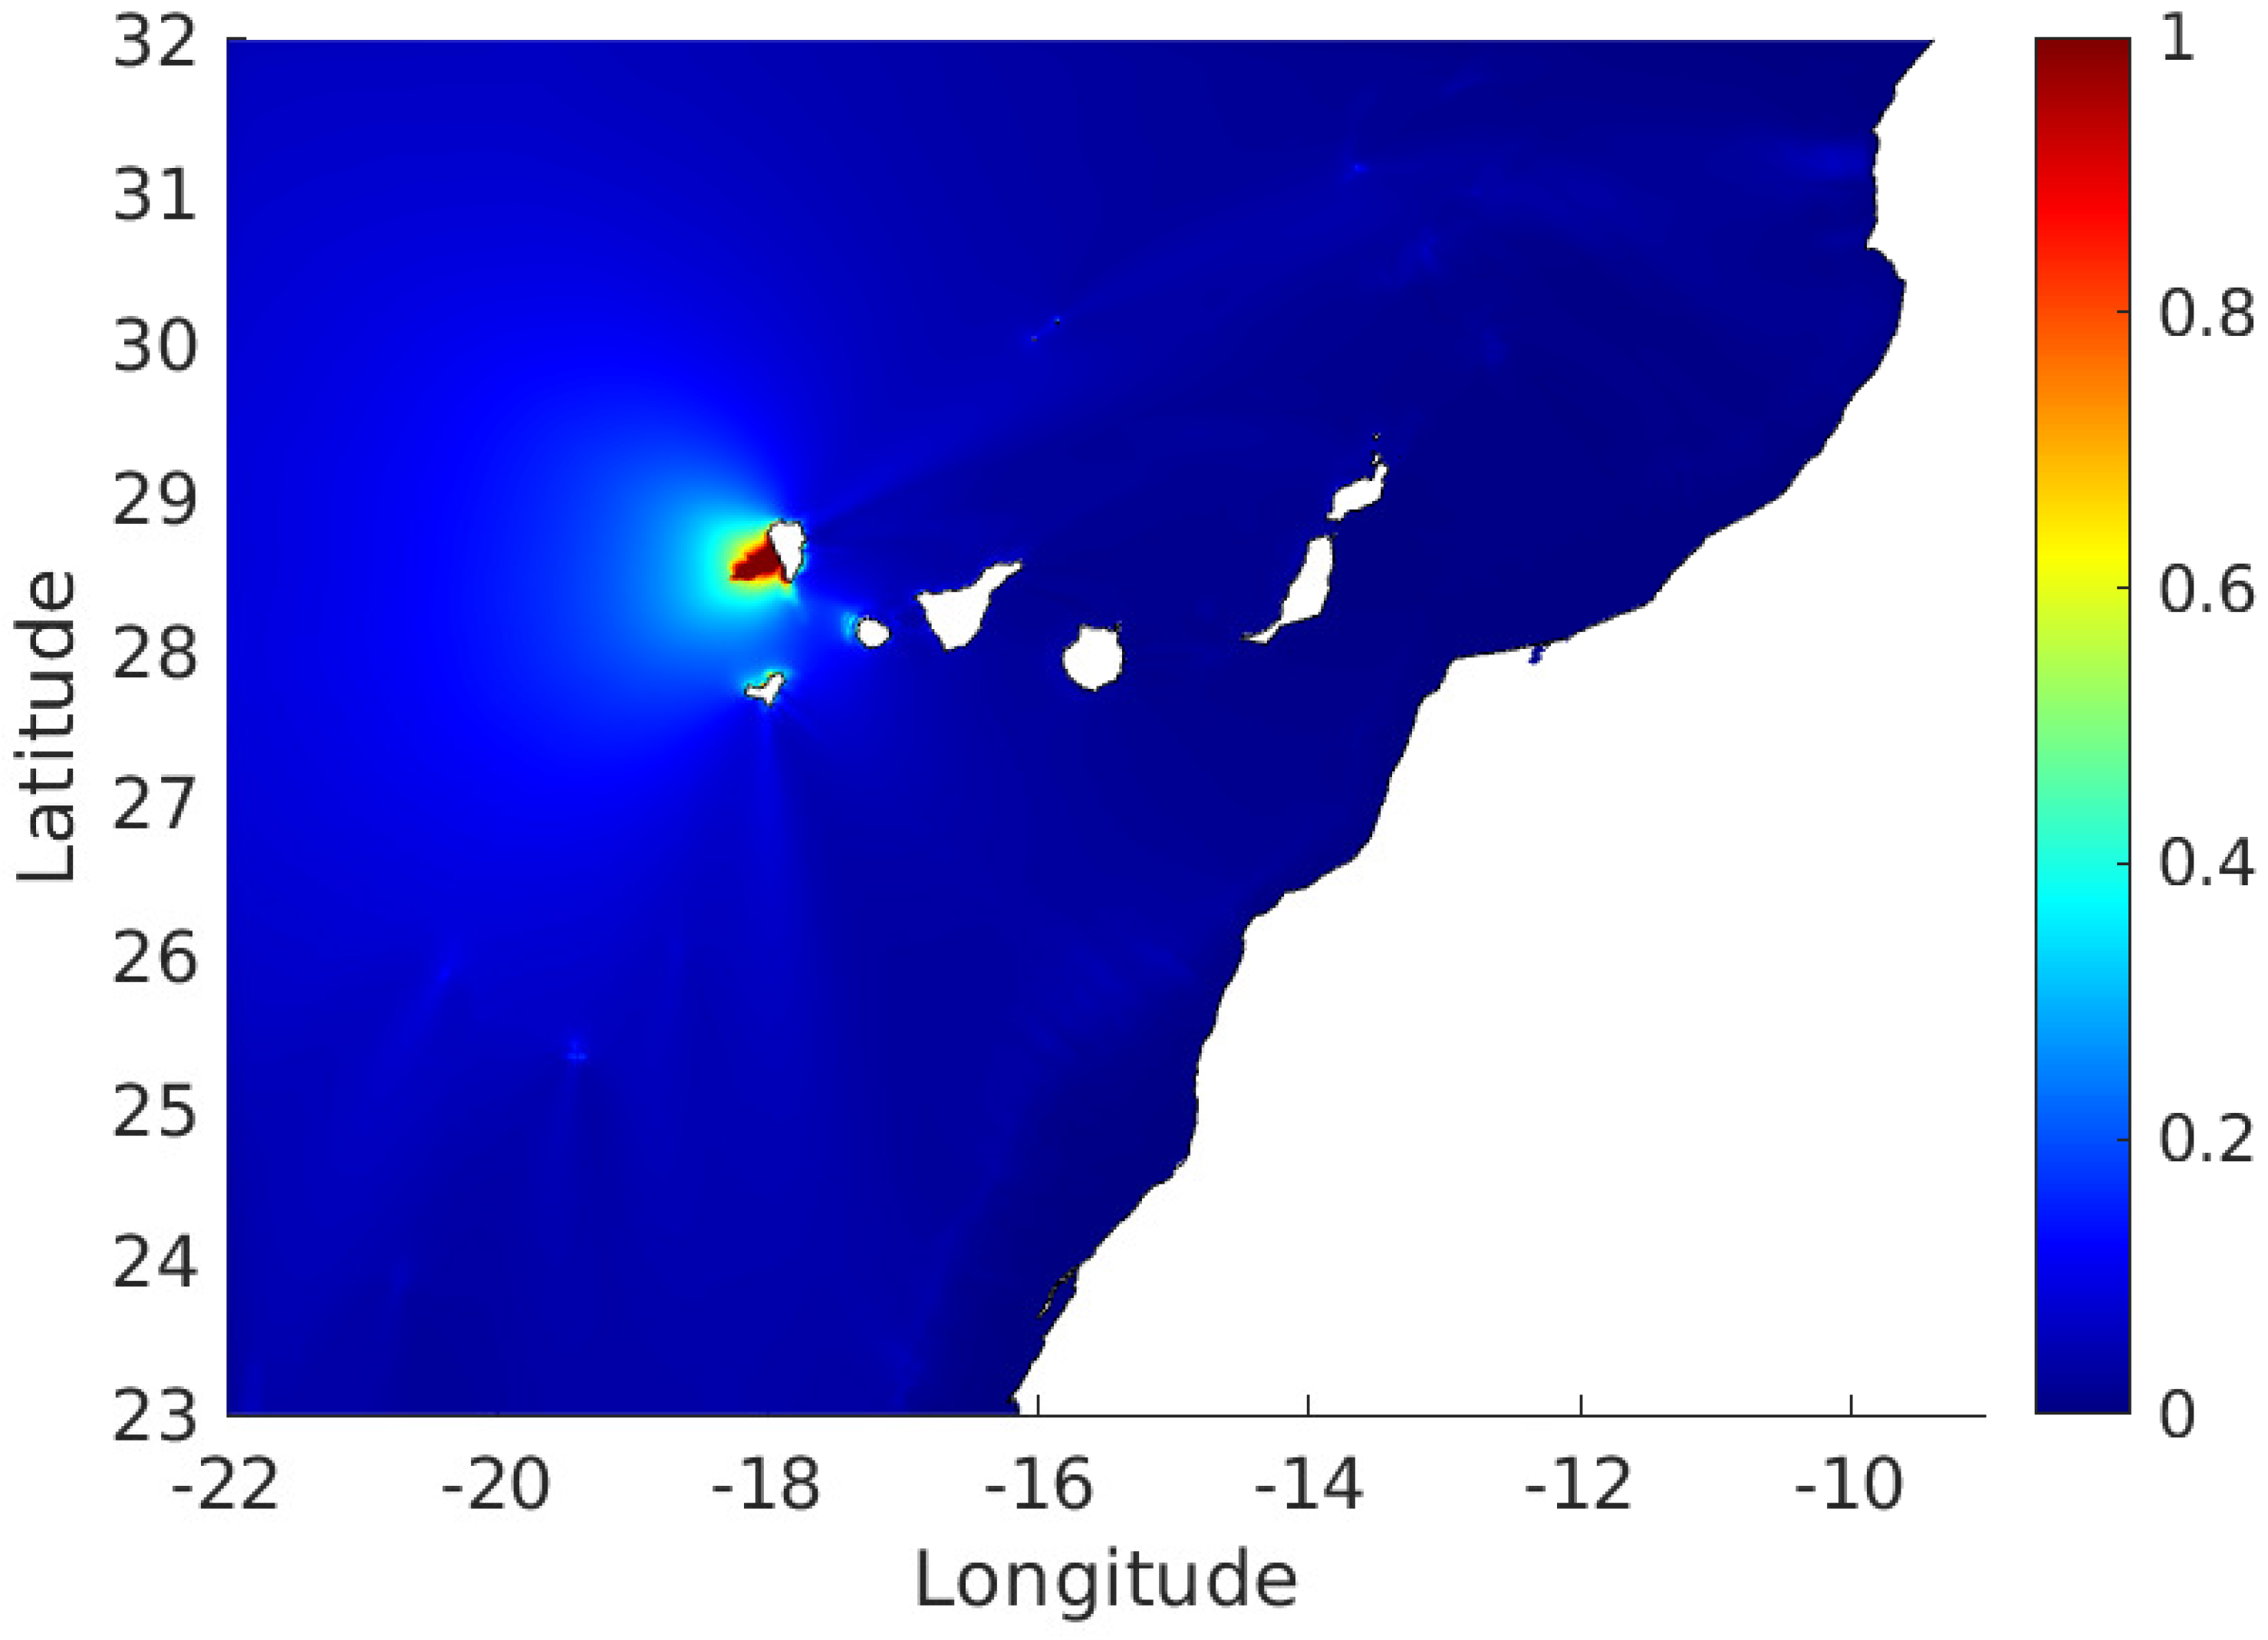
As commented above, this slide appears to be over-sized; thus, the results in Figure 4 and Figure 5 should be interpreted as upper bounds of the generated tsunamis. Using a width of the lava front equal to 1 km (close to reality as said before), a length of 1 km, a smoothing distance of 2 km and a maximum thickness of 50 m, the volume of the slide results 0.13 km (Equation (8)). In this case, the time series of surface elevations may be seen in Figure 7: the maximum wave height is about 0.5 m in Gomera and El Hierro islands, which does not pose any risk to the population. Maximum wave heights that are presented in Figure 8. It may be seen that the generated tsunami is essentially restricted to the generation region, being not significant far from this region.
It may be concluded that the tsunami generated by a submarine landslide involving a realistic (not over-sized) volume could affect the near islands of Gomera and El Hierro (mainly their north shores), but it would not propagate significantly far away from the Canary Islands (it would not even pose a threat to the African shoreline). Of course, the case would be the same with respect to Europe and American coasts. It should be noted that these landslide tsunamis are different to those originated by submarine earthquakes since the sizes of the tsunami sources are very different. In the present case, the source size is a few kilometers, while in the case of an earthquake in a fault, the tsunami source extends over a hundred of kilometers. Thus, these tsunamis propagate more efficiently away from the source. In addition, the tsunami energy per unit length of the wave front decreases with distance to the source, r, as since energy is distributed over circumferences of larger radii. Even if shoaling leads to an increase in wave height, the small waves computed in the model domain do not indicate that shoaling would lead to significant wave heights in distant coasts (Europe, Africa and America).
4. Conclusions
Potential tsunamis generated as a consequence of CVV eruption in September 2021 were simulated. A model including nonlinear terms and friction was used for this purpose. The considered tsunami generation mechanisms consisted of a submarine landslide of material down the island slope after the lava flow reached the border of the island shelf.
If realistic values for the slide dimensions are used, the slide volume would be much smaller than values used in previous studies (in at least two orders of magnitude). In this case, waves not higher than 0.5 m would be expected, which do not pose any risk to the population of the islands. Only the near islands of Gomera and El Hierro (mainly their north shores) could be affected, but the tsunami would not propagate significantly far away from the Canary Islands. It does not seem that any significant effect could be produced in distant coasts (Europe, Africa and America).
Funding
This research received no external funding.
Institutional Review Board Statement
Not applicable.
Informed Consent Statement
Not applicable.
Conflicts of Interest
The author declares no conflict of interest.
Abbreviations
The following abbreviations are used in this manuscript:
| CVV | Cumbre Vieja volcano |
| MSOU | Monotonic Second-Order Upstream |
References
- Ward, S.N.; Day, S. Cumbre Vieja volcano—Potential collapse and tsunami at La Palma, Canary Islands. Geophys. Res. Lett. 2001, 28, 3397–3400. [Google Scholar] [CrossRef]
- Mader, C.L. Modeling the La Palma landslide tsunami. Sci. Tsunami Hazards 2001, 19, 150–170. [Google Scholar]
- Abadie, S.; Paris, A.; Ata, R.; Roy, S.L.; Arnaud, G.; Poupardin, A.; Clous, L.; Heinrich, P.; Harris, J.; Pedreros, R.; et al. La Palma landslide tsunami: Calibrated wave source and assessment of impact on French territories. Nat. Hazards Earth Syst. Sci. 2020, 20, 3019–3038. [Google Scholar] [CrossRef]
- Gisler, G.R.; Weaver, G.M. SAGE calculations of the tsunami threat from La Palma. Sci. Tsunami Hazards 2006, 24, 288–301. [Google Scholar]
- Løvholt, F.; Pedersen, G.; Gisler, G. Oceanic propagation of a potential tsunami from the La Palma Island. J. Geophys. Res. 2008, 113, C09026. [Google Scholar] [CrossRef] [Green Version]
- Abadie, S.M.; Harris, J.C.; Grilli, S.T.; Fabre, R. Numerical modeling of tsunami waves generated by the flank collapse of the Cumbre Vieja Volcano (La Palma, Canary Islands): Tsunami source and near field effects. J. Geophys. Res. 2011, 117, C05030. [Google Scholar] [CrossRef]
- Arnaud, G.E.; Krien, Y.; Abadie, S.; Zahibo, N.; Dudon, B. How Would the Potential Collapse of the Cumbre Vieja Volcano in La Palma Canary Islands Impact the Guadeloupe Islands? Insights into the Consequences of Climate Change. Geosciences 2021, 11, 56. [Google Scholar] [CrossRef]
- Kowalik, Z.; Murty, T.S. Numerical Modelling of Ocean Dynamics; World Scientific: Singapore, 1993. [Google Scholar]
- Periáñez, R.; Abril, J.M. Modelling tsunami propagation in the Iberia-Africa plate boundary: Historical events, regional exposure and the case-study of the former Gulf of Tartessos. J. Mar. Syst. 2013, 111–112, 223–234. [Google Scholar] [CrossRef]
- Periáñez, R.; Abril, J.M. Modelling tsunamis in the Eastern Mediterranean Sea. Application to the Minoan Santorini tsunami sequence as a potential scenario for the biblical Exodus. J. Mar. Syst. 2014, 139, 91–102. [Google Scholar] [CrossRef]
- Cecioni, C.; Bellotti, G. Modeling tsunamis generated by submerged landslides using depth integrated equations. Appl. Ocean. Res. 2010, 32, 343–350. [Google Scholar] [CrossRef]
- Roger, J.; Hébert, H. The 1856 Djijelli (Algeria) earthquake and tsunami: Source parameters and implications for tsunami hazard in the Balearic Islands. Nat. Hazards Earth Syst. Sci. 2008, 8, 721–731. [Google Scholar] [CrossRef] [Green Version]
- Lima, V.V.; Mir, A.J.M.; Baptista, M.A.; Catalão, J.; Gonzalez, M.; Otero, L.; Olabarrieta, M.; Álvarez-Gómez, J.A.; Carreño, E. Impact of a 1755-like tsunami in Huelva, Spain. Nat. Hazard Earth Syst. Sci. 2010, 10, 139–148. [Google Scholar] [CrossRef] [Green Version]
- Harbitz, C.B.; Glimsdal, S.; Bazin, S.; Zamora, N.; Løvholt, F.; Bungum, H.; Smebye, H.; Gauer, H.P.; Kjekstad, O. Tsunami hazard in the Caribbean: Regional exposure derived from credible worst case scenarios. Cont. Shelf Res. 2012, 38, 1–23. [Google Scholar] [CrossRef]
- Grilli, S.T.; Vogelmann, S.; Watts, P. Development of a 3D numerical wave tank for modelling tsunami generation by underwater landslides. Eng. Anal. Bound. Elem. 2002, 26, 301–313. [Google Scholar] [CrossRef]
- Kampf, J. Ocean Modelling for Beginners; Springer: Berlin/Heidelberg, Germany, 2009. [Google Scholar]
- Abril, J.M.; Periáñez, R. A modelling study on tsunami propagation in the Red Sea: Historical events, potential hazards and spectral analysis. Ocean. Eng. 2017, 134, 1–12. [Google Scholar] [CrossRef]
- Periáñez, R.; Cortés, C. A modelling study on tsunami propagation in the Caspian Sea. Pure Appl. Geophys. 2019, 176, 3155–3166. [Google Scholar] [CrossRef]
- Tinti, S.; Pagnoni, G.; Zaniboni, F. The landslides and tsunamis of the 30th of December 2002 in Stromboli analyzed through numerical simulations. Bull. Volcanol. 2006, 68, 462–479. [Google Scholar] [CrossRef]
- Harbitz, C.B. Model simulations of tsunamis generated by the Storegga Slides. Mar. Geol. 1992, 105, 1–21. [Google Scholar] [CrossRef]
Figure 1.
Model domain. Points where wave heights are obtained: 1 Gomera; 2 El Hierro; 3 Pto de la Cruz (Tenerife Island); 4 Fuerteventura; 5 Lanzarote; 6 Essaouira; 7 Dajla.
Figure 1.
Model domain. Points where wave heights are obtained: 1 Gomera; 2 El Hierro; 3 Pto de la Cruz (Tenerife Island); 4 Fuerteventura; 5 Lanzarote; 6 Essaouira; 7 Dajla.

Figure 2.
Side view of the submarine slide. is length, S the smoothing distance in front and rear and its maximum thickness.
Figure 2.
Side view of the submarine slide. is length, S the smoothing distance in front and rear and its maximum thickness.

Figure 3.
Snapshots of sea surface elevation at different times after a slide of material along the island slope.
Figure 3.
Snapshots of sea surface elevation at different times after a slide of material along the island slope.

Figure 4.
Calculated maximum wave heights (m) for a 4.5 km submarine landslide.

Figure 5.
Time series of water surface elevations at selected points (Figure 1) for a 4.5 km slide down the island slope.
Figure 5.
Time series of water surface elevations at selected points (Figure 1) for a 4.5 km slide down the island slope.

Figure 6.
Calculated arrival time of a 1 cm signal (min) for a 4.5 km slide.

Figure 7.
Time series of water surface elevations at selected points (Figure 1) for a 0.13 km slide down the island slope.
Figure 7.
Time series of water surface elevations at selected points (Figure 1) for a 0.13 km slide down the island slope.

Figure 8.
Calculated maximum wave heights (m) for a 0.13 km submarine landslide.

Publisher’s Note: MDPI stays neutral with regard to jurisdictional claims in published maps and institutional affiliations. |
© 2021 by the author. Licensee MDPI, Basel, Switzerland. This article is an open access article distributed under the terms and conditions of the Creative Commons Attribution (CC BY) license (https://creativecommons.org/licenses/by/4.0/).
Share and Cite
MDPI and ACS Style
Periáñez, R. Numerical Simulation of the Tsunami Generated by a Potential Submarine Landslide in La Palma (Canary Islands) after the September 2021 Cumbre Vieja Eruption. Geosciences 2021, 11, 497. https://doi.org/10.3390/geosciences11120497
AMA Style
Periáñez R. Numerical Simulation of the Tsunami Generated by a Potential Submarine Landslide in La Palma (Canary Islands) after the September 2021 Cumbre Vieja Eruption. Geosciences. 2021; 11(12):497. https://doi.org/10.3390/geosciences11120497
Chicago/Turabian StylePeriáñez, Raúl. 2021. "Numerical Simulation of the Tsunami Generated by a Potential Submarine Landslide in La Palma (Canary Islands) after the September 2021 Cumbre Vieja Eruption" Geosciences 11, no. 12: 497. https://doi.org/10.3390/geosciences11120497
Note that from the first issue of 2016, this journal uses article numbers instead of page numbers. See further details here.