New Stress Reduction Factor for Evaluating Soil Liquefaction in the Coastal Area of Catania (Italy)


Department of Civil Engineering and Architecture, University of Catania, 95125 Catania, Italy
*
Author to whom correspondence should be addressed.
Geosciences 2021, 11(1), 12; https://doi.org/10.3390/geosciences11010012
Submission received: 23 October 2020
/
Revised: 19 December 2020
/
Accepted: 23 December 2020
/
Published: 28 December 2020
(This article belongs to the Special Issue Numerical Modeling in Geotechnical Engineering)
Abstract
:In this paper, a study concerning the soil liquefaction potential in the city of Catania is presented. The stress-based liquefaction analysis framework for cohesionless soil includes a function that describes fundamental aspects of dynamic site response, i.e., the shear stress reduction coefficient, rd, which depends on several factors (depth; earthquake and ground motion characteristics; dynamic soil properties). Various relationships of rd are reported in literature because of the importance of assessment of CSR. Herein, new variations of rd with depth have been obtained using different deterministic earthquake scenarios as input motion. The relationships are based on large numbers of site response analyses for different site conditions. The new relationships obtained have been used for the evaluation of the liquefaction potential in the area of the Catania Harbour. The liquefaction resistance has been evaluated by the horizontal stress index (KD) from seismic dilatometer Marchetti tests (SDMTs). Various correlations were developed to estimate the CRR from KD, expressed in form of CRR-KD curves to differentiate between liquefiable and non-liquefiable zones. In this study three different CRR-KD curves have been used.
1. Introduction
Soil liquefaction is a major cause of damage during earthquake [1]. Liquefaction is defined as the transformation of a granular material from solid to a liquefiable state as a consequence of increase pore pressure and reduced effective stress [2]. Thus, the evaluation of the susceptibility of a site to seismic-induced liquefaction is an important step in many geotechnical investigations. It may be assessed comparing the cyclic resistance ratio (CRR) to the cyclic shear stress ratio (CSR) due to the ground motion [3,4,5,6,7].
Estimates of the in situ CSR can be developed directly, using dynamic response analysis, but it is common in simplified analysis methods to develop estimates of the in situ CSR using empirical relationships [5]. One of the parameters to be evaluated is the stress reduction coefficient rd.
In this paper, new rd relationships are proposed for the eastern coastal plain of Catania area (Italy). The city of Catania, in South-Eastern Sicily, was affected by several destructive earthquakes of about magnitude 7.0 in past times. Extensive liquefaction effects occurred following the 1693 and 1818 strong earthquakes [8,9,10,11].
2. Shear Stress Reduction Factor: State-of-Art Review
The stress-based simplified procedure for evaluating soil liquefaction potential, originally developed by Seed and Idriss [12], compares the seismic demand of a soil layer (CSR) with the capacity of the soil to resist liquefaction (CRR). If CSR is greater than CRR, liquefaction can occur. The cyclic stress ratio CSR can be calculated by the following equation [3]:
where τav = average cyclic shear stress, amax = peak horizontal acceleration at the ground surface generated by the earthquake, g = acceleration of gravity, σv0 and σv0’= total and effective overburden stresses, and rd = stress reduction coefficient depending on depth.
The stress reduction coefficient rd is added to adjust for the flexibility of the soil profile because the soil does not respond as a rigid body [6].
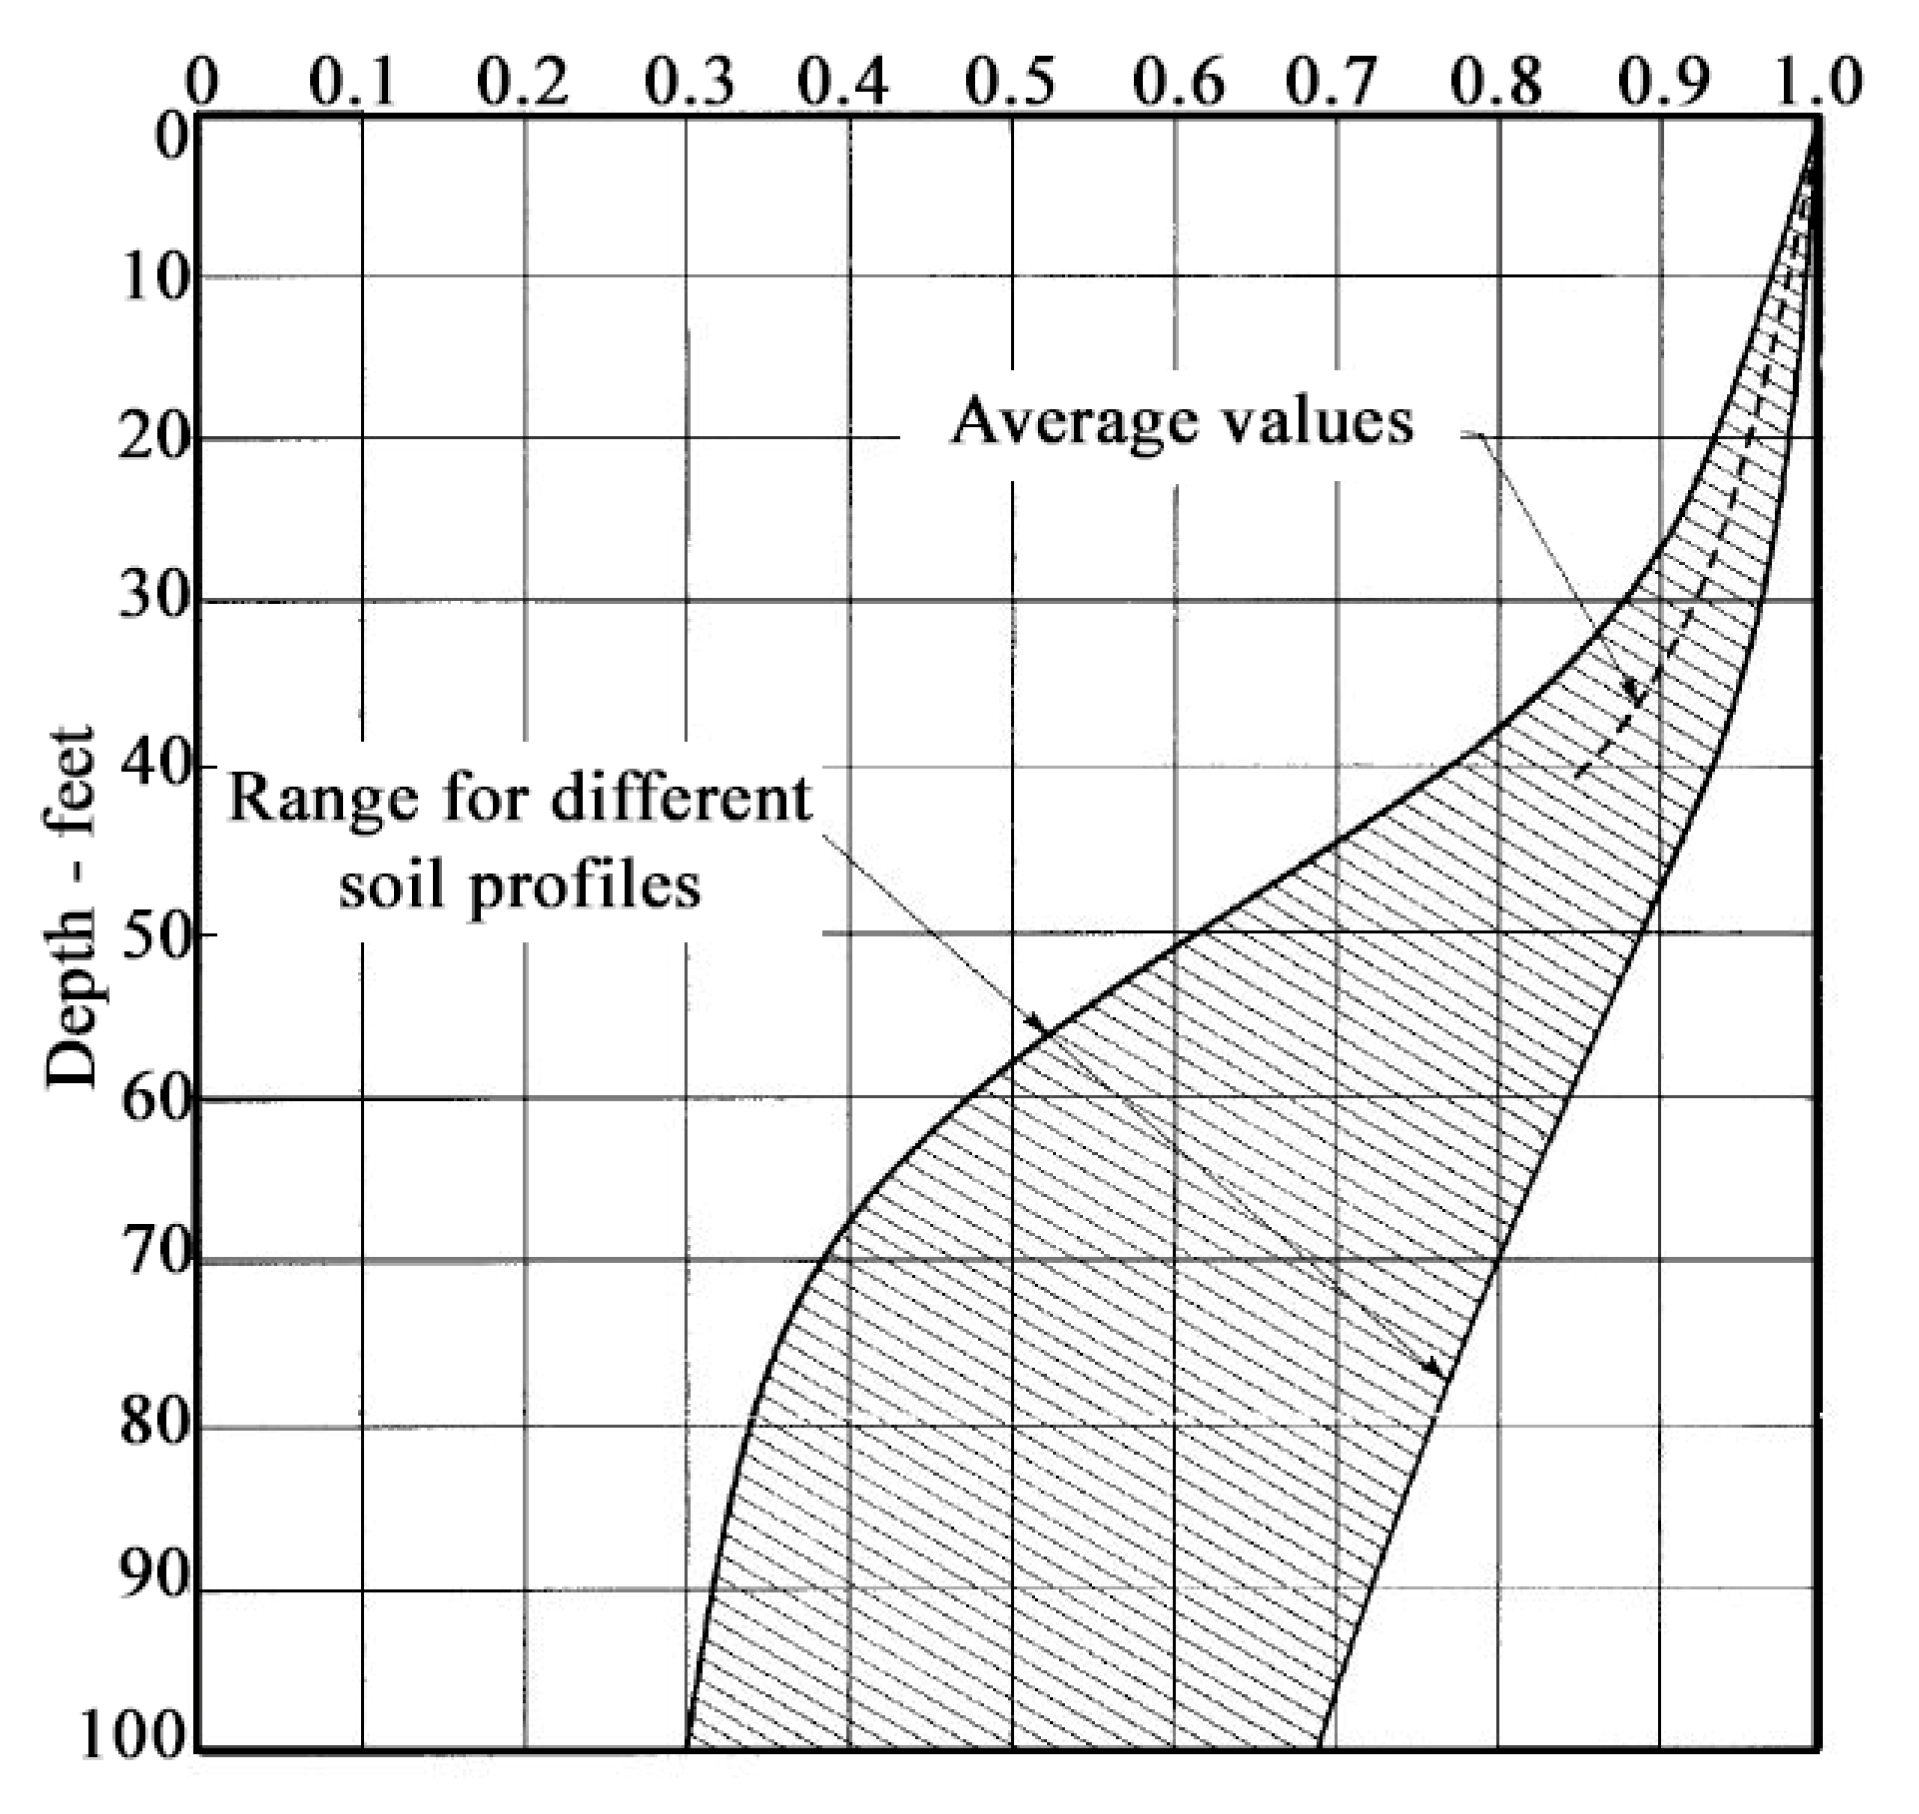
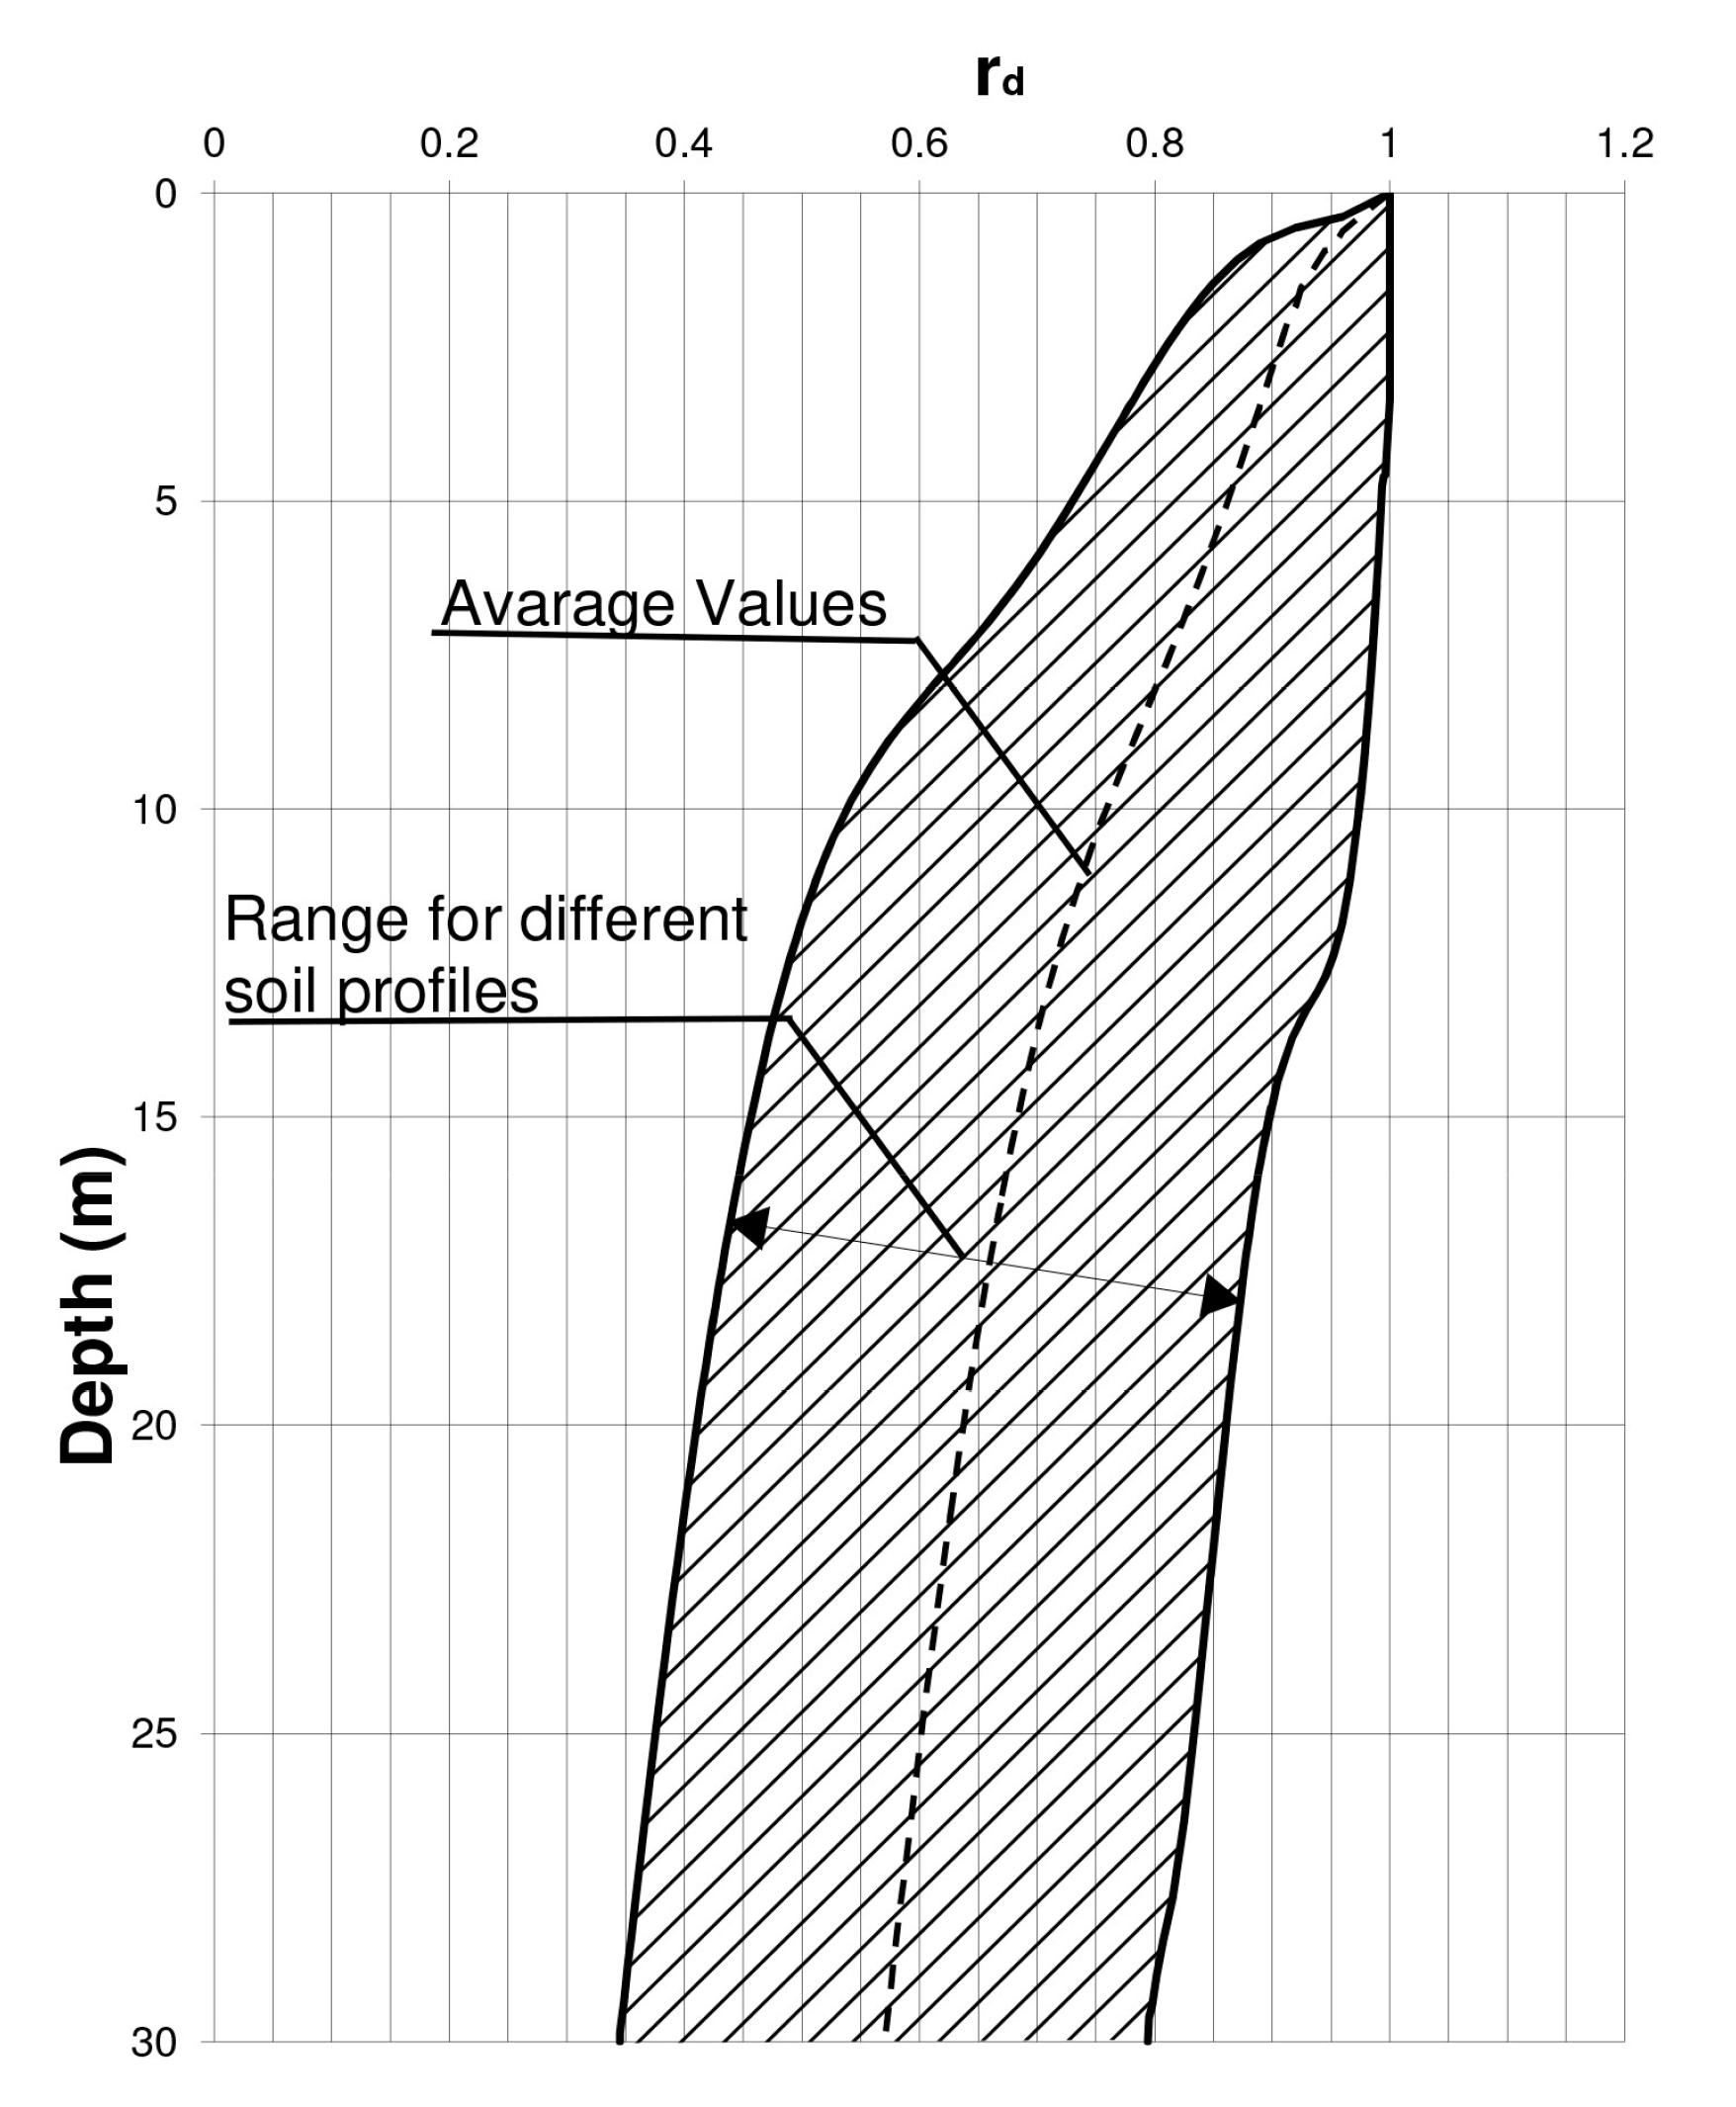
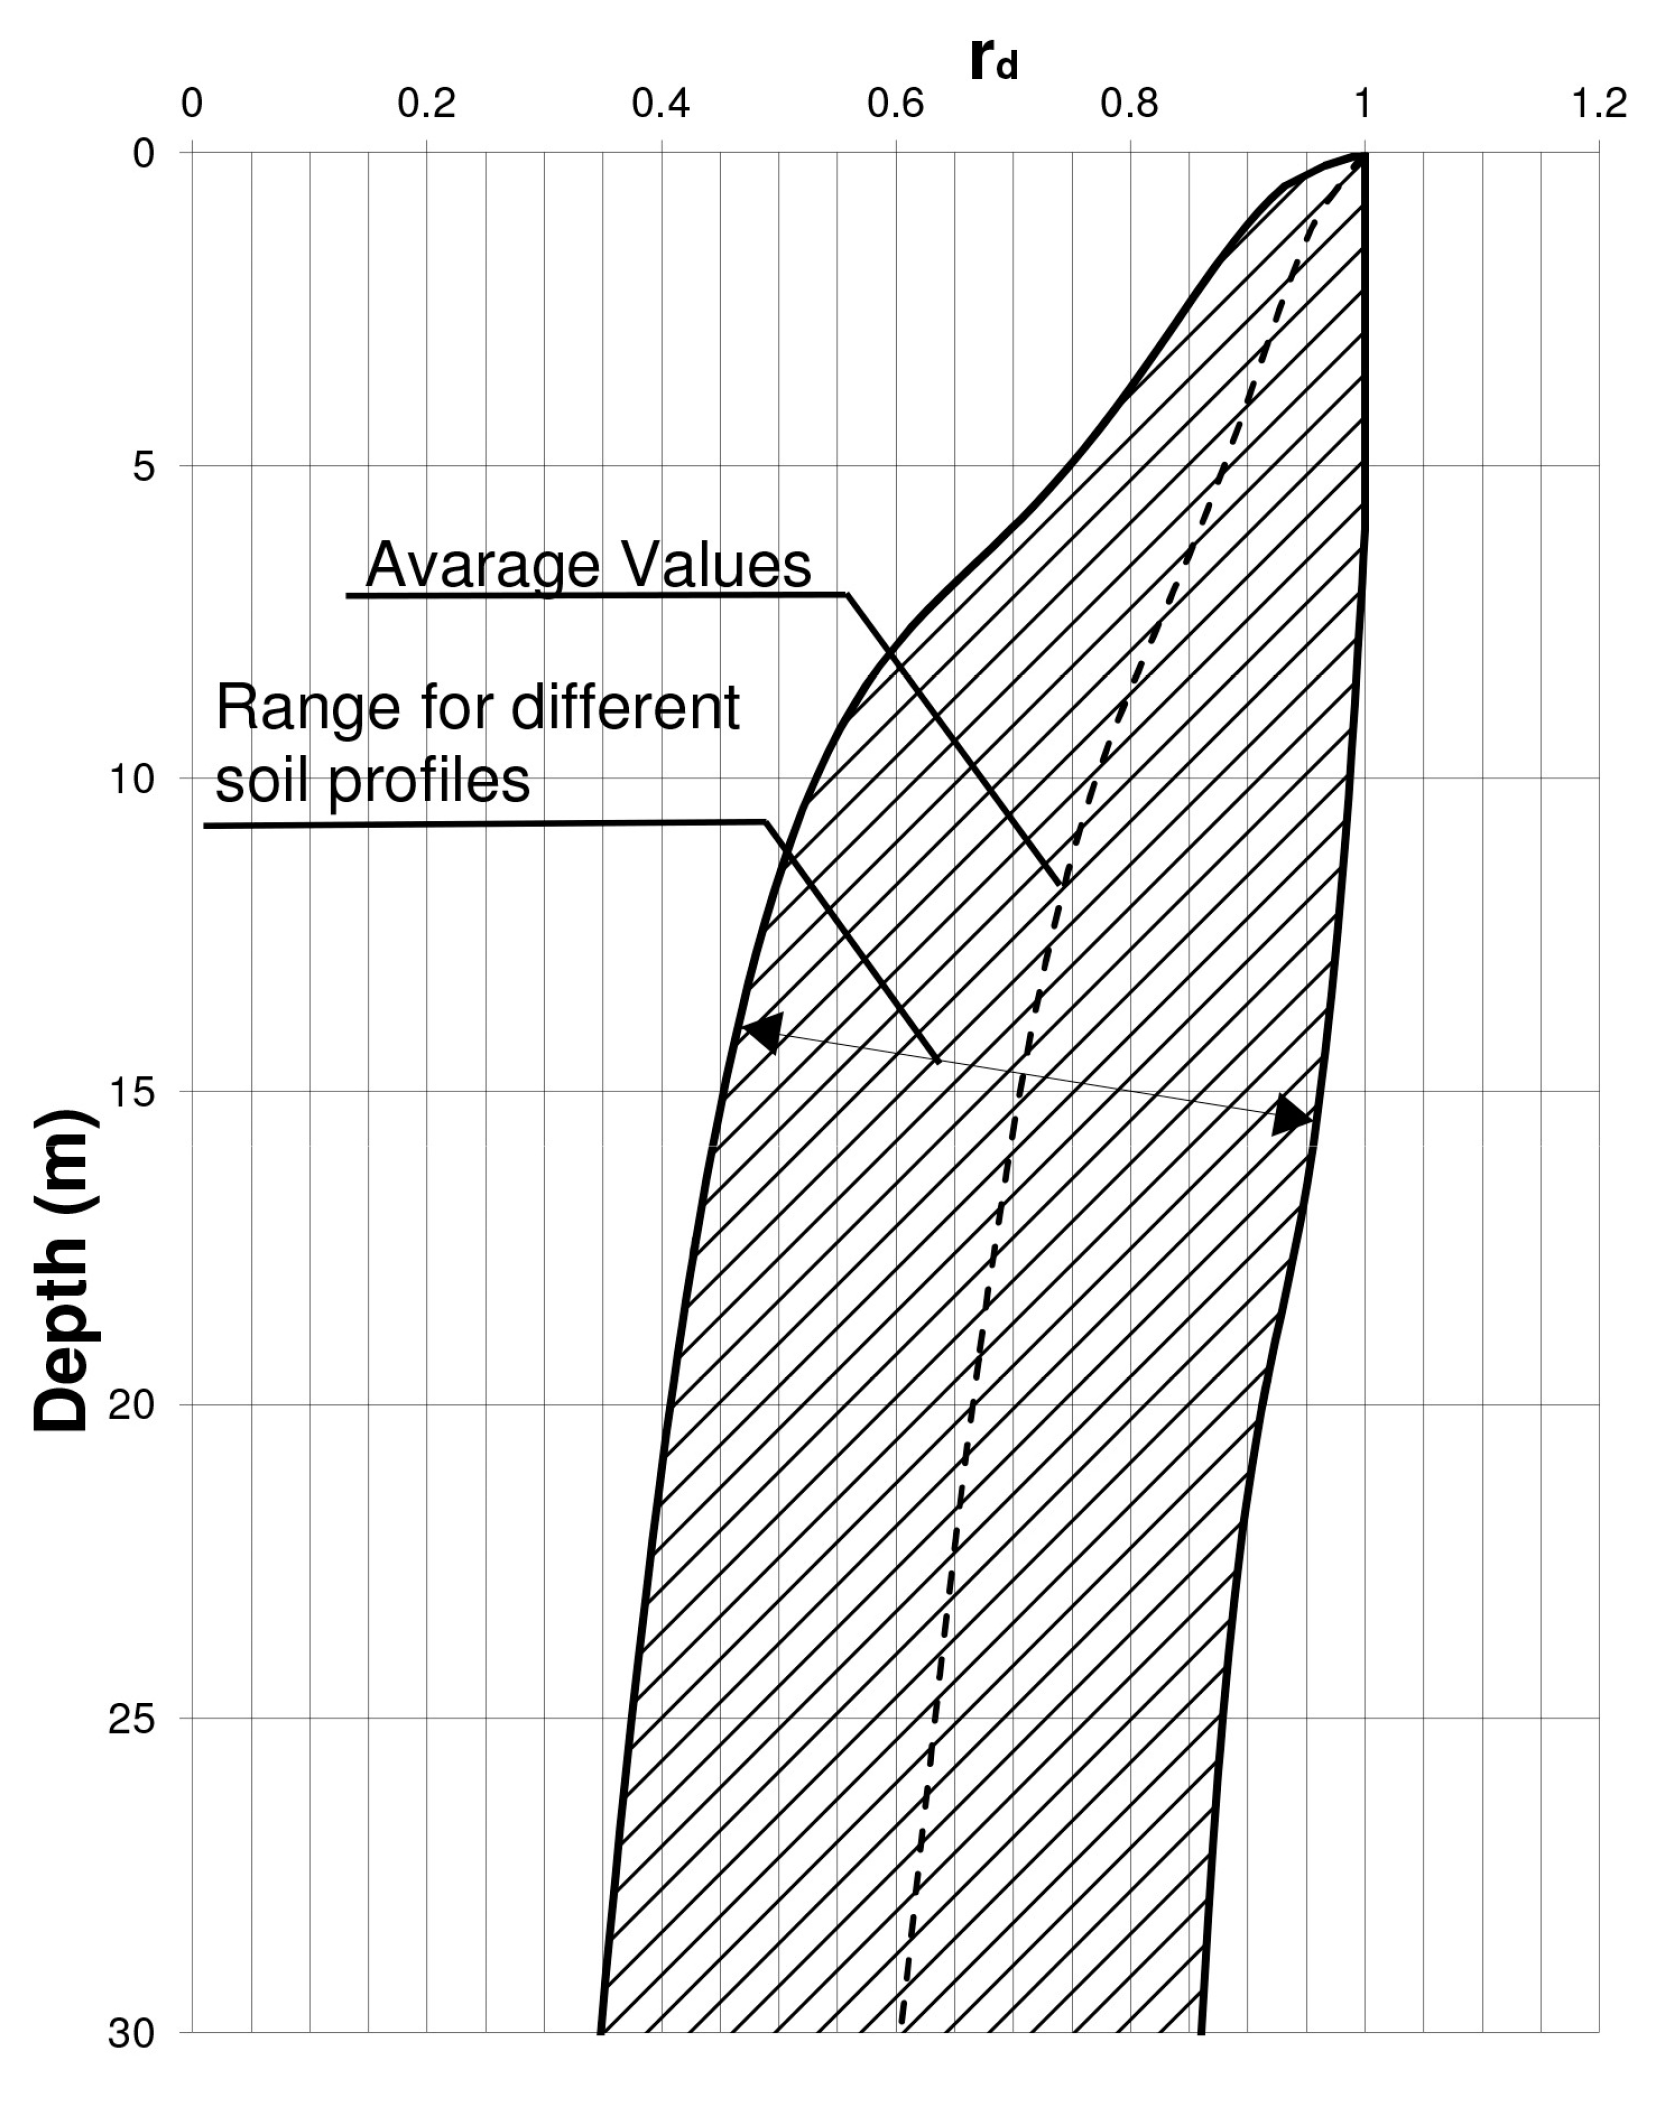
For routine practice the values of rd are estimated from the chart by Seed and Idriss [12] as shown in Figure 1.
This chart was determined using a limited number of input strong motion and soil profiles having sand in the upper ±15 m. The dashed line labeled “Average values” represents the recommended values of rd from the surface to a depth of 12 m (~40 ft) [5]. The value of rd decreases from a value of 1 at the ground surface to lower value at large depths.
The following equations can be used to estimate the average rd value given in the chart from the surface to a depth 30 m (~100 ft):
where z = depth below ground surface in meters.
The Equations (2a,b) were proposed by Liao and Whitman [13] and the Equation (2c) was proposed by Robertson and Wride [14]. Youd et al. [7] suggested the Equations (2a,b) for noncritical projects and did not recommend values of rd below a depth of 23 m. Indeed, the uncertainty of rd increases with depth and the simplified procedure is not well verified for depths greater than 15 m [14]. Moreover, the rd proposal of Seed and Idriss understates the variance and provides biased (generally high) estimation of rd between 3 and 15 m [1]. Unfortunately, it is the critical soil strata for evaluating soil liquefaction potential [1].
Several other relationships have been proposed because of the importance of assessment of CSR. Ishihara [15] performed a series of analyses using uniform soil profile and sinusoidal input motions and concluded that the parameter rd can be expressed as:
where VS = uniform soil shear wave velocity, w = frequency of excitation, z = depth. This relationship is plotted in Figure 2.
Another simple and widely used relationship is the one proposed by Iwasaki [16] in which the parameter rd is expressed through a linearly decreasing function with depth as:
This function was obtained applying six earthquake motions to two alluvial deposits.
Idriss [17], based on studies carried out by Golesorkhi [18], performed several hundred parametric site response analyses and proposed a rd relationship that takes into account the effects of earthquake magnitude and depth in the evaluation of rd.
For z ≤ 34 m the following equation was obtained:
where
For z > 34 m the following expression is more appropriate:
in which z = depth in meters and M = moment magnitude.
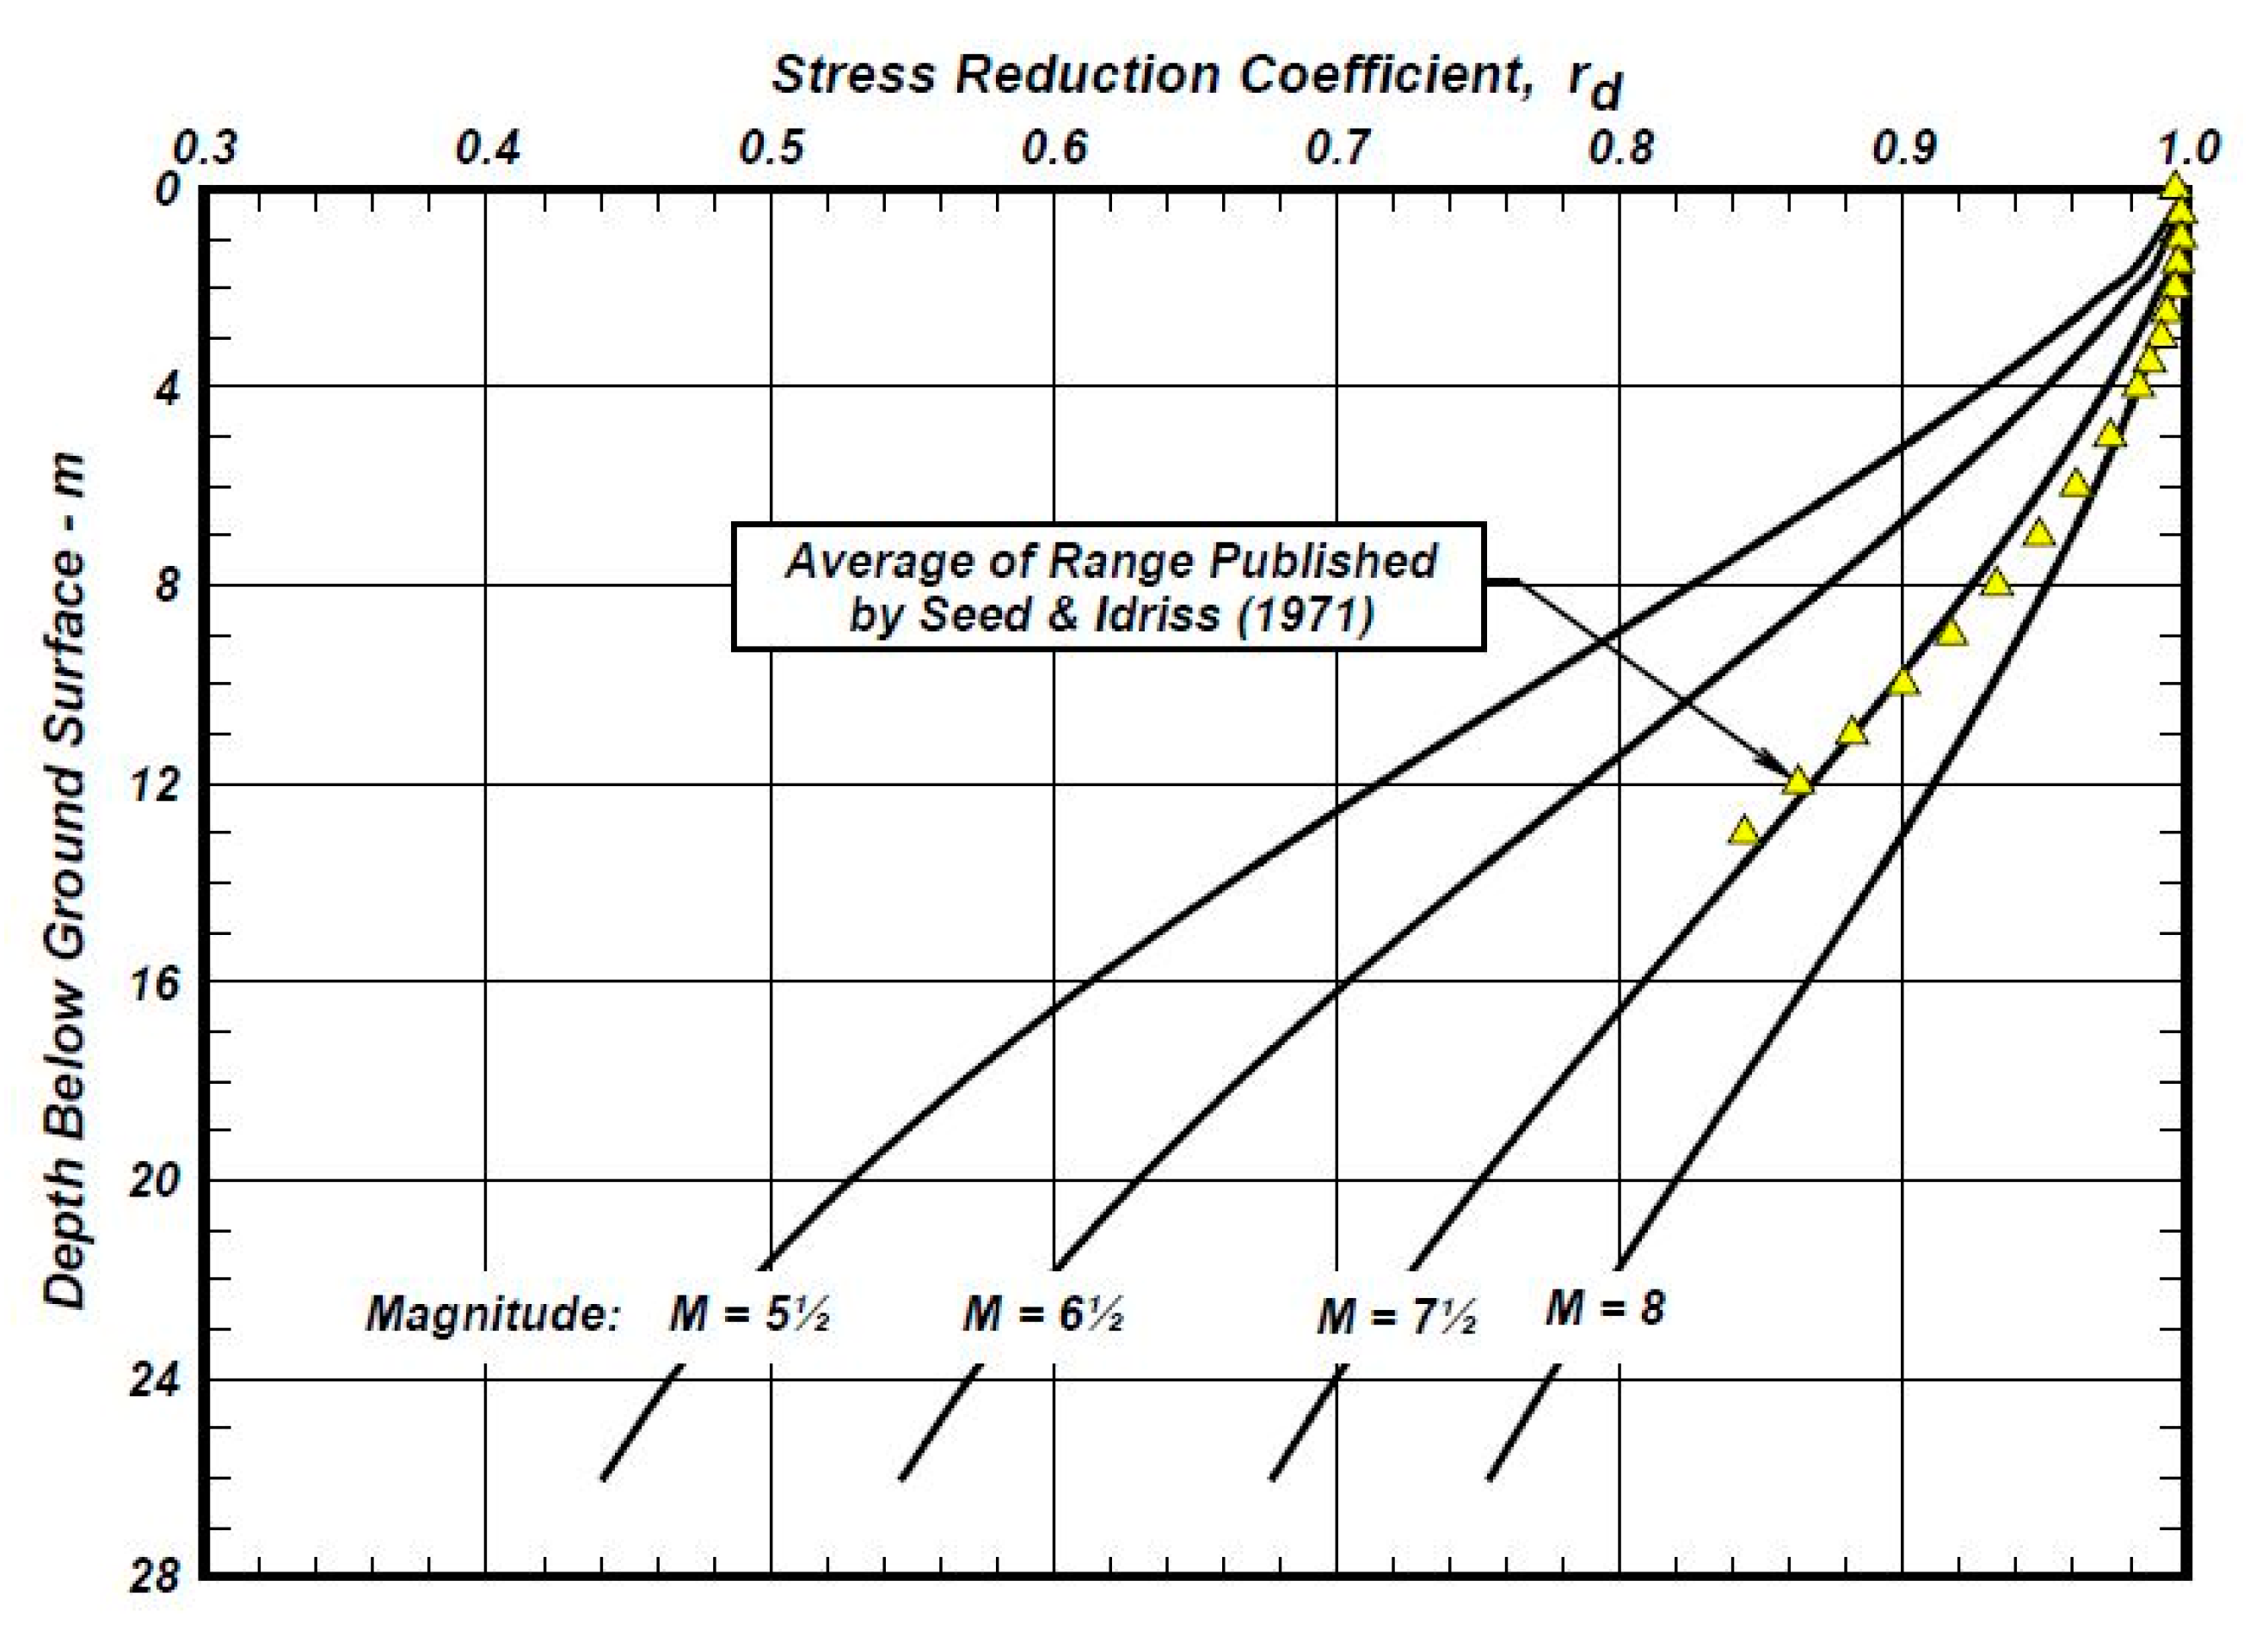
Plots of rd calculated using previous equation for M = 5½, 6½, 7½, and 8 are presented in Figure 3. Also shown is the average of the range published by Seed and Idriss [12].
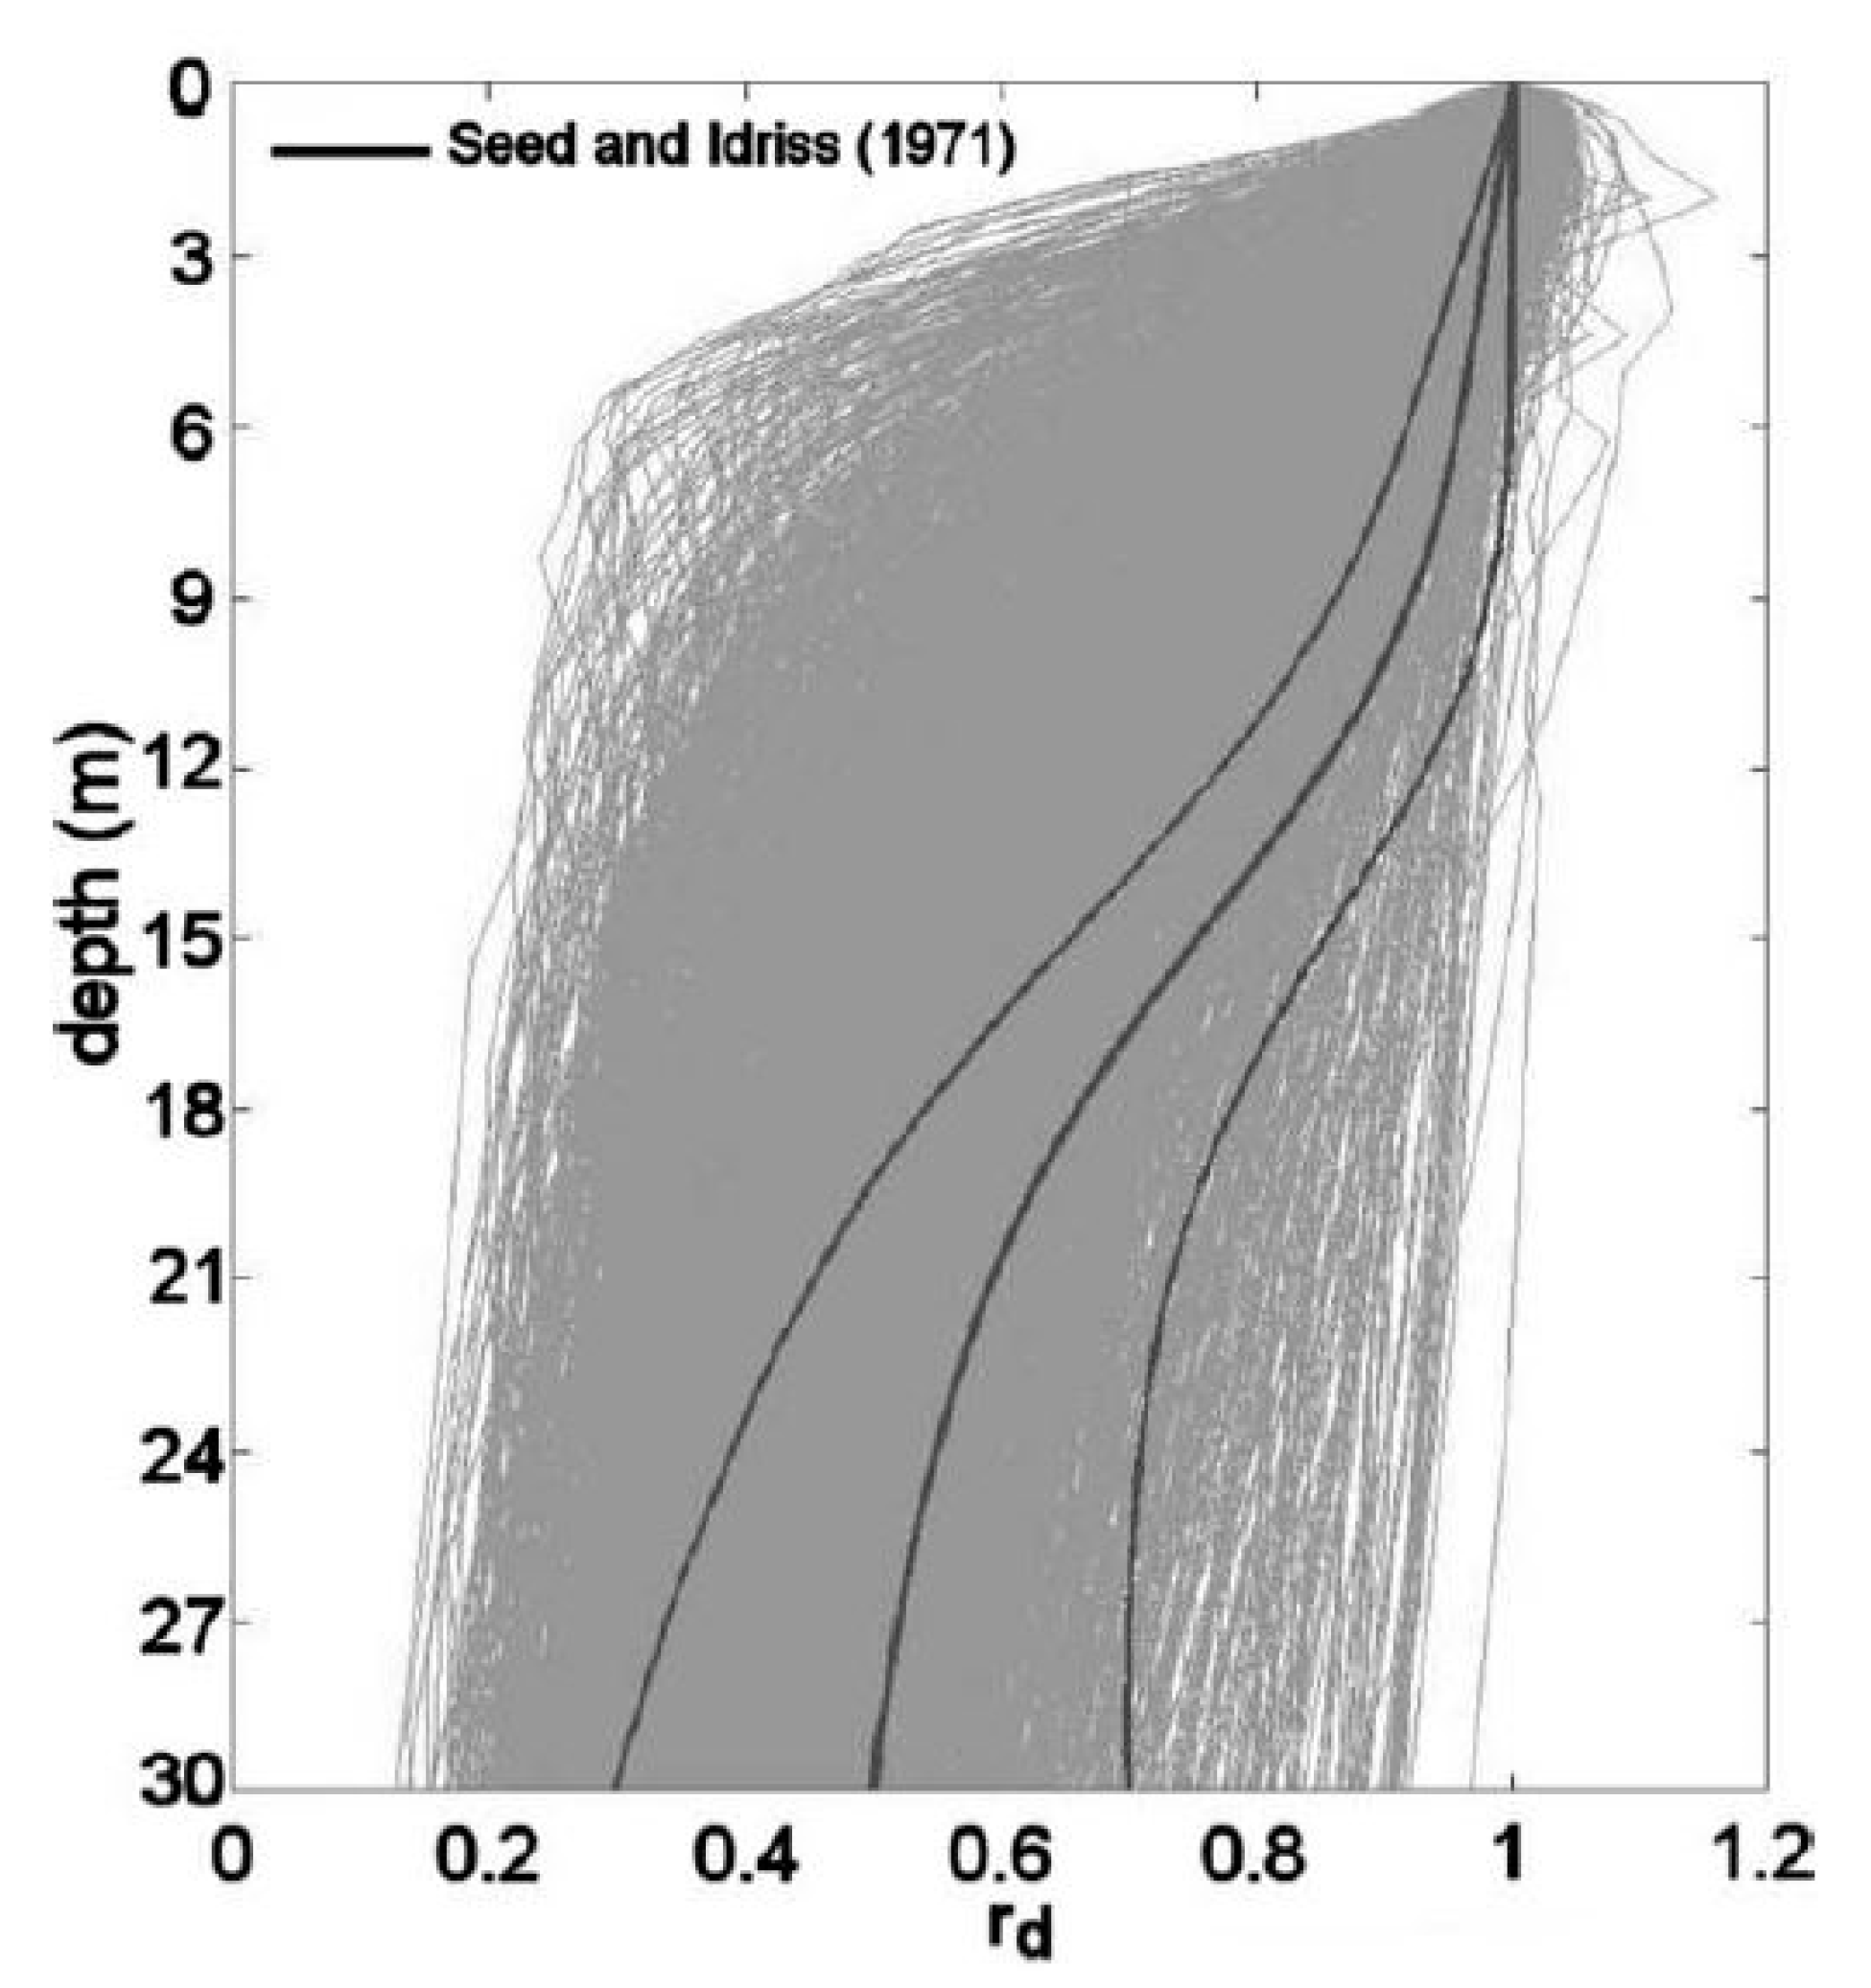
Cetin and Seed [5], using the Bayesian updating method, suggested new rd correlations as a function of depth, earthquake magnitude, intensity of shaking, and site stiffness. They performed a total of 2153 site response analyses by the equivalent linear method. The rd recommendations proposed by Seed and Idriss [12] are conservatively biased compared to over 80,000 point estimations of rd from 2153 cases as shown in Figure 4.
Another probabilistic relationship was developed by Kishida et al. [19,20] using Monte Carlo simulations. The relationship was based on about 23,000 analyses. The input parameters were PGA, the average shear wave velocity, and the spectral ratio parameter.
A recent study was performed by Lasley et al. [21]. They suggested a new rd relationship from equivalent-linear site response analyses. Several forms for rd were examined and the following form was selected for its simplicity and shape:
where α = limiting value of rd at large depths, β = variable that controls the curvature of the function at shallow depths, z = depth in meters and (1-α) = term that scales the exponential.
Two different sets of expression for α and β were proposed, one being a function of magnitude (Mw) and average shear-wave velocity in the upper 12 m of the profile (VS12) and the other solely being a function of MW. The first set of expressions for α and β is:
and the second set is:
where b1-b6 are regression coefficients.
3. Seismicity of the Catania Area
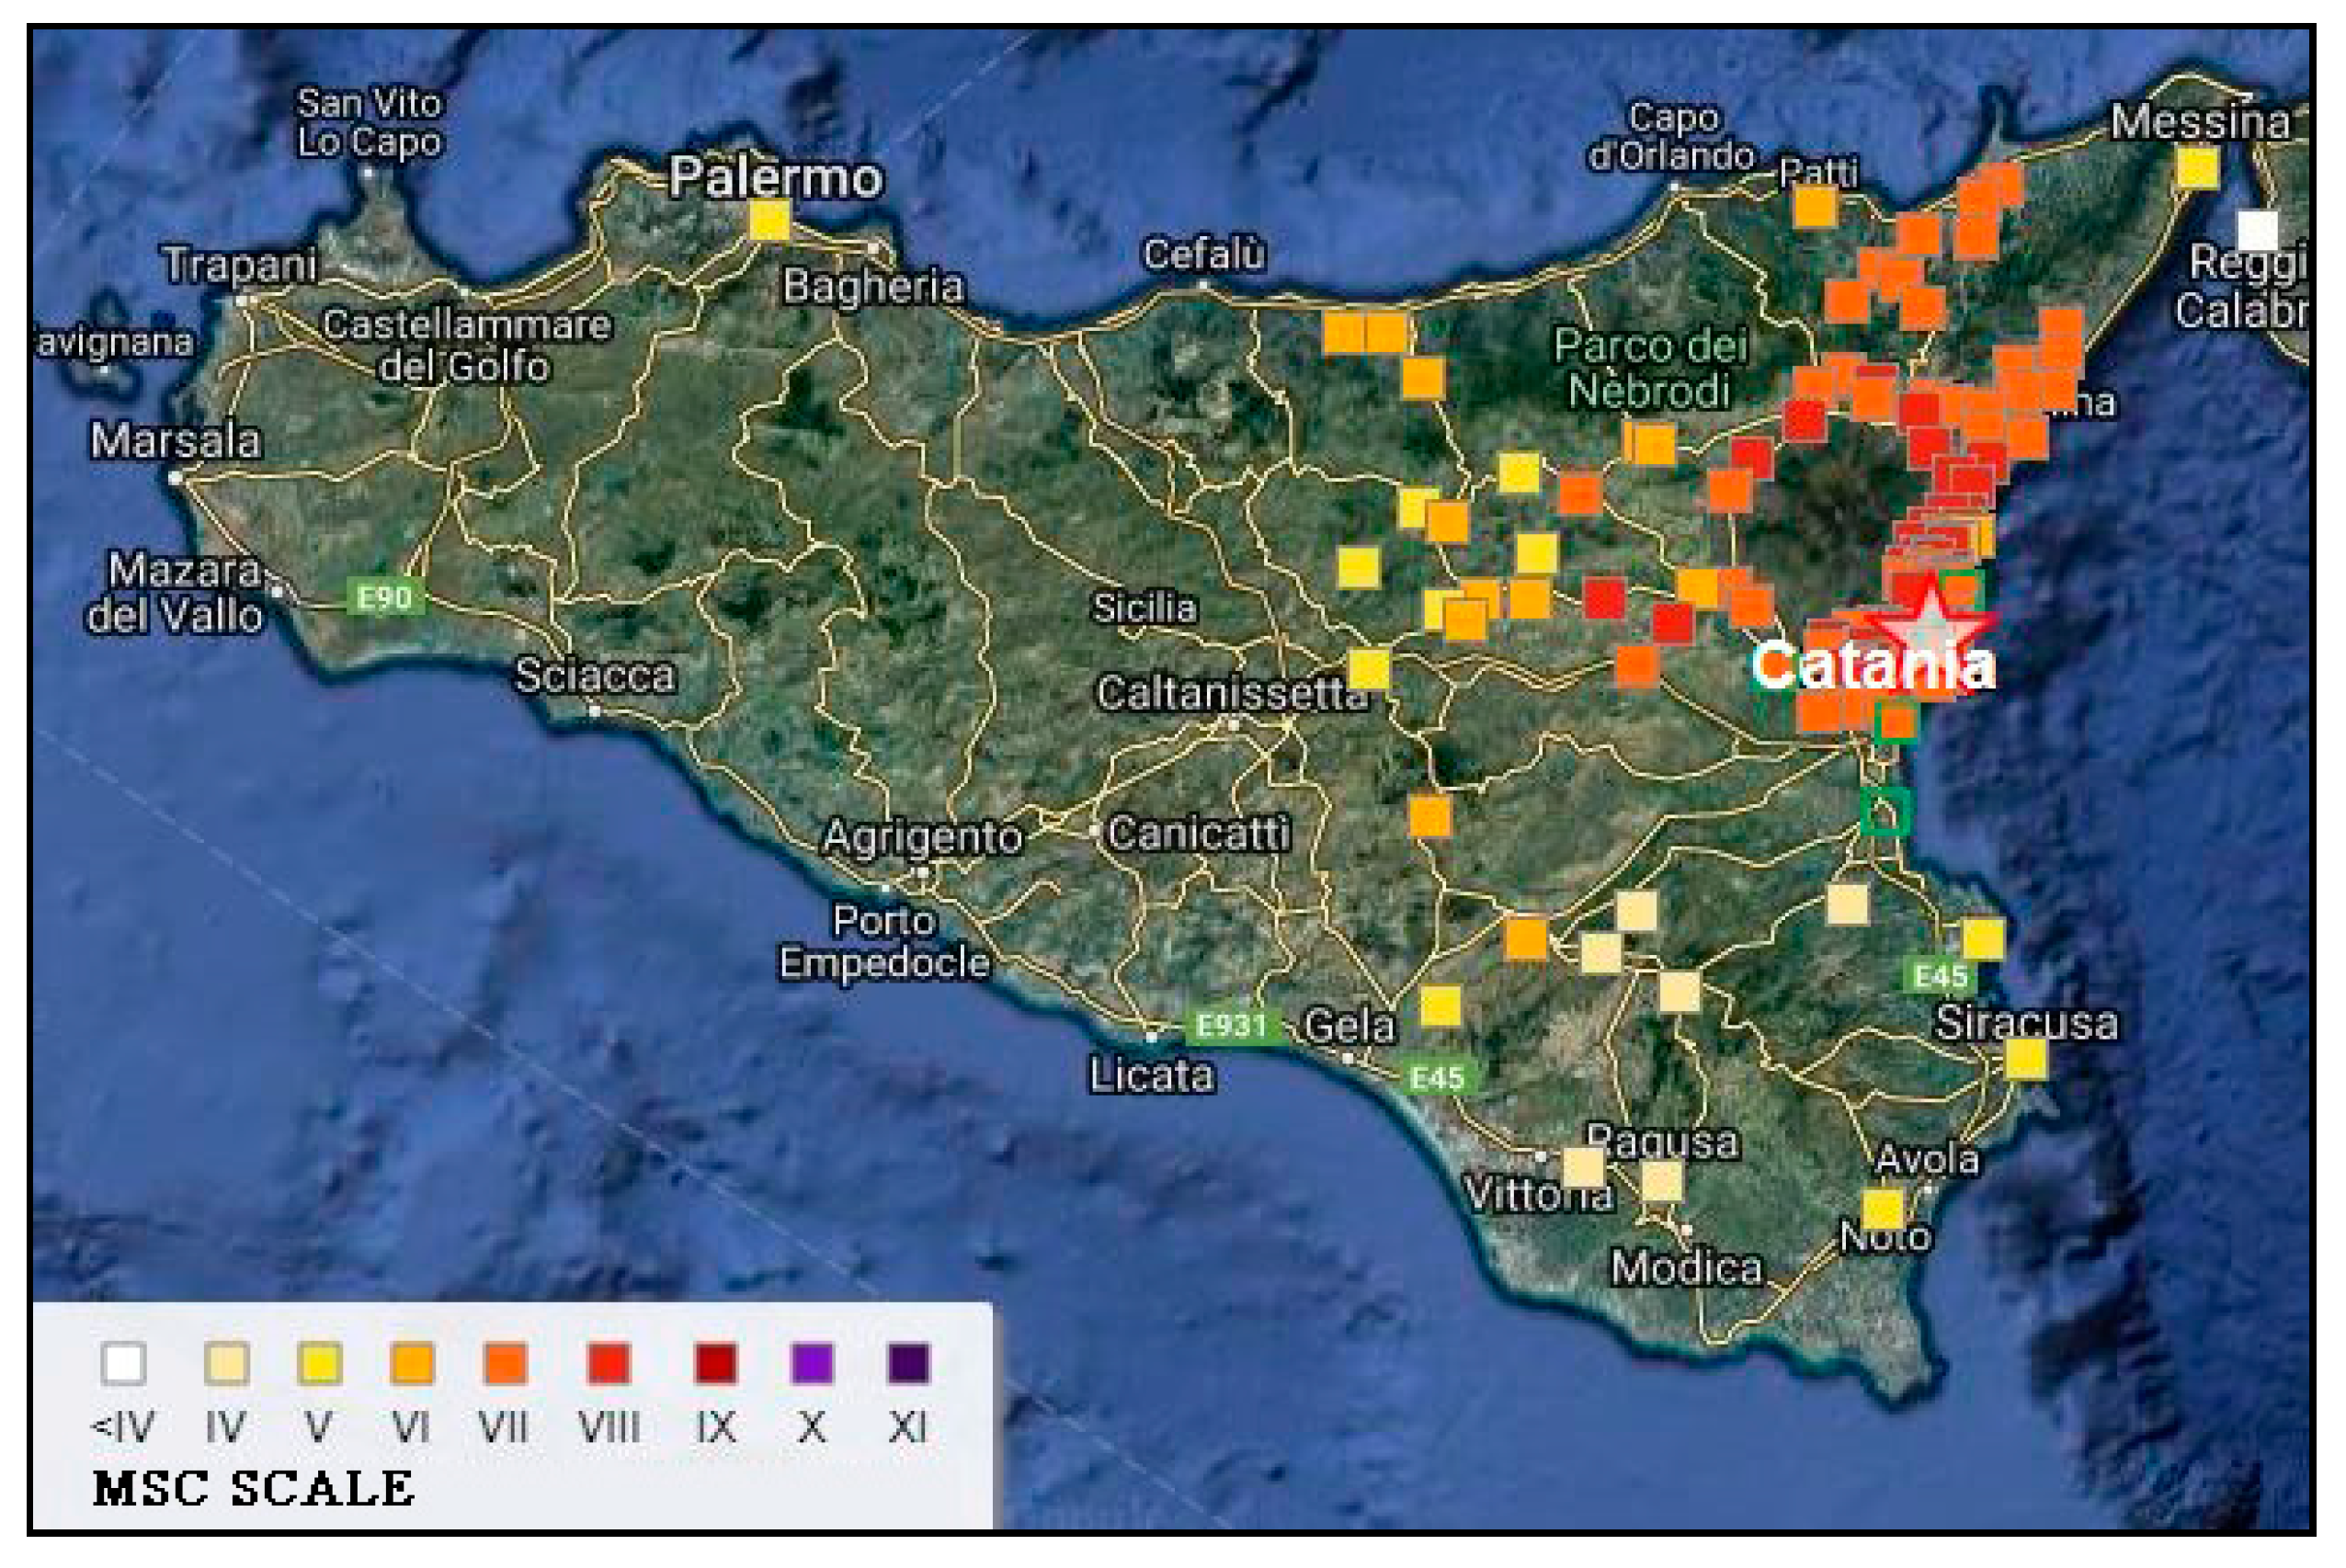
The city of Catania, in South-Eastern Sicily (Italy), is subjected to high seismic hazards. It was shaken by a number of strong earthquakes. In particular the events of February 1169, December 1542, January 1693, February 1818 and January 1848 produced relevant damages [22]. A repetition of events with similar characteristics would provide the additional risk of a damaging tsunami, as well as liquefaction phenomena around the coast [9,10,11].
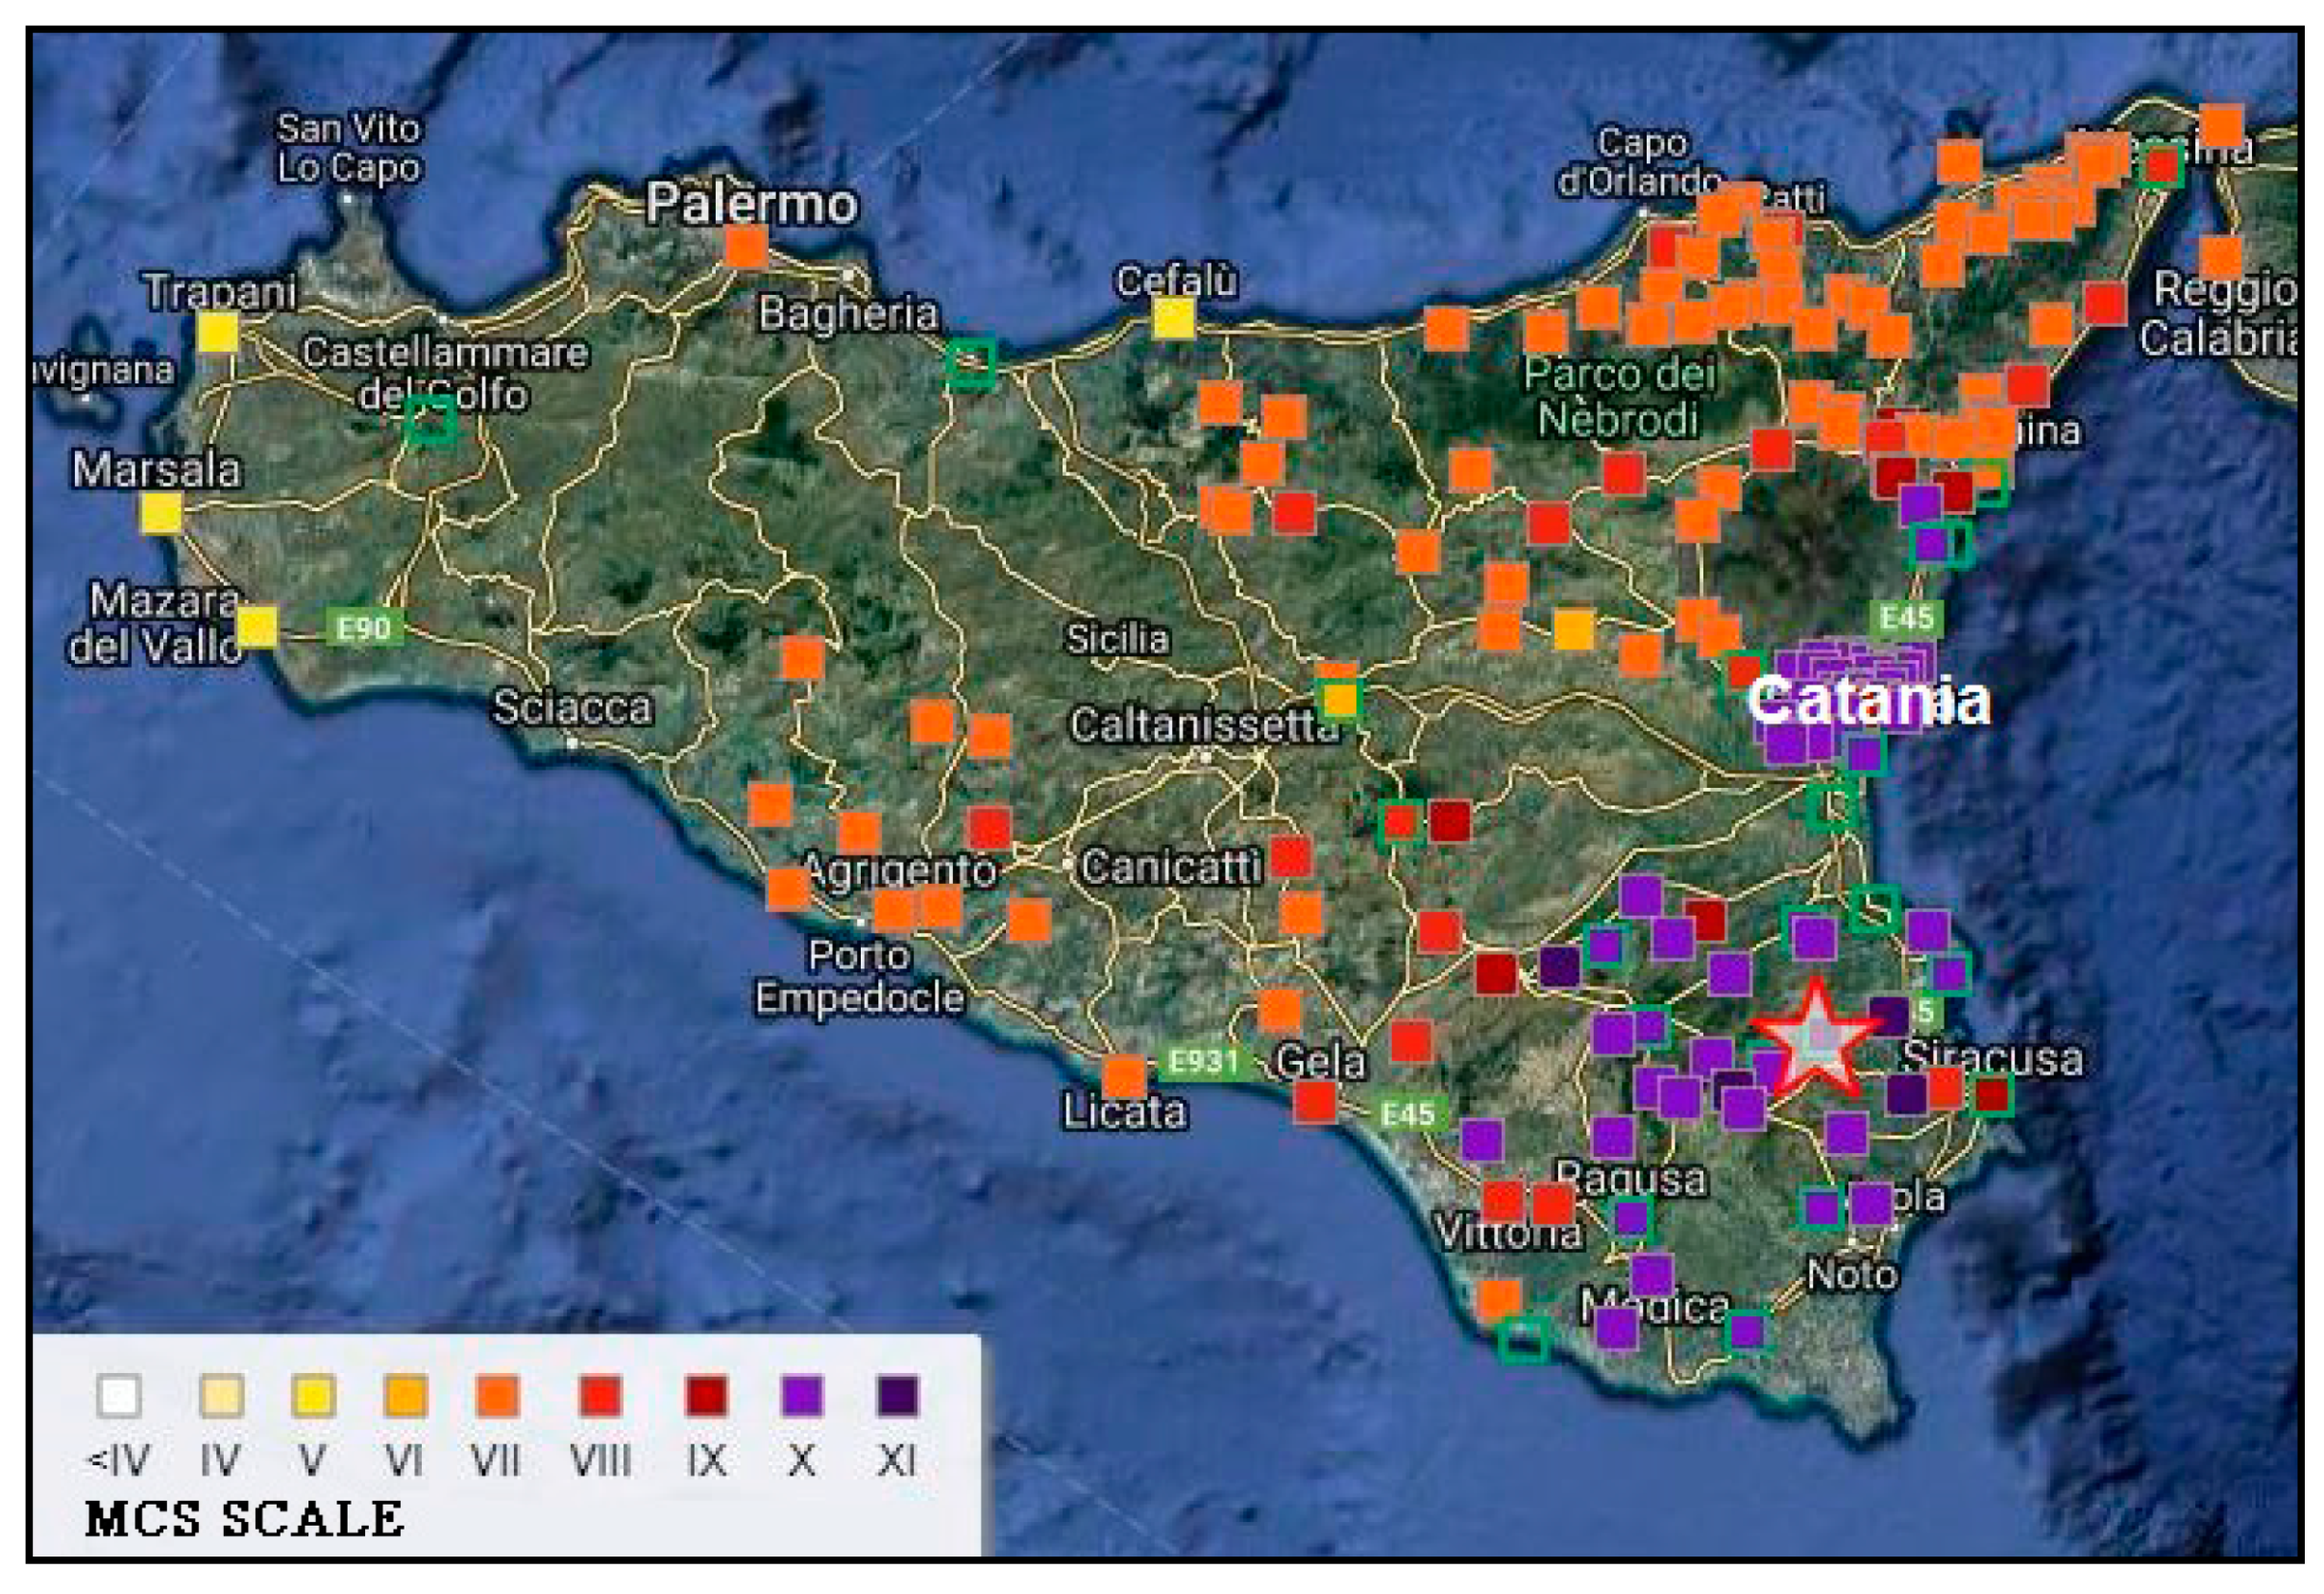
Seismic liquefaction phenomena were reported by historical sources [23,24,25] following the 1693 (MS = 7.0–7.3, Io = X–XI MCS) and 1818 (MS = 6.2, Io = IX MCS) strong earthquakes [26].
The most significant liquefaction features seem to have occurred in the Catania area, near Saint Giuseppe La Rena site, situated in the meisoseismal region of both events. These effects are significant for the implications on hazard assessment mainly for the alluvial flood plain just south of the city, where most industry and facilities are located [27].
The seismic events that occurred in January 1693 and February 1818 have been chosen as scenario earthquakes.
The Val di Noto earthquake of 11 January 1693 struck a vast territory of south-eastern Sicily and caused the partial, and in many cases total, destruction of 57 cities and 60,000 casualties [28,29,30,31]. The Etna earthquake that took place on 20 February 1818, was a moderate earthquake, but its effects were noticed over a vast area [9,32,33,34]
4. Site Response Analysis
Local site response analyses, as well as dynamic soil-structure interaction analyses, have been performed in Catania area (Sicily, Italy), which is recognized as a typical Mediterranean city at high seismic risk [35,36,37,38,39,40].
A database of about 1200 boreholes and water-wells is available in the data-bank of the Research Project: Detailed Scenarios and Actions for Seismic Prevention of Damage in the Urban Area of Catania [41]. The creation of the database provided the basis for the geotechnical zonation and seismic microzonation of the city of Catania [42,43]. Based on the geotechnical zonation, only the eastern coastal plain of Catania is susceptible to liquefaction because of the presence of saturated sand deposits in the uppermost 20 m. In this paper, new rd relationships are proposed for the eastern coastal plain of Catania.
Table 1 shows experimental sites and tests used to obtain new rd relationships.
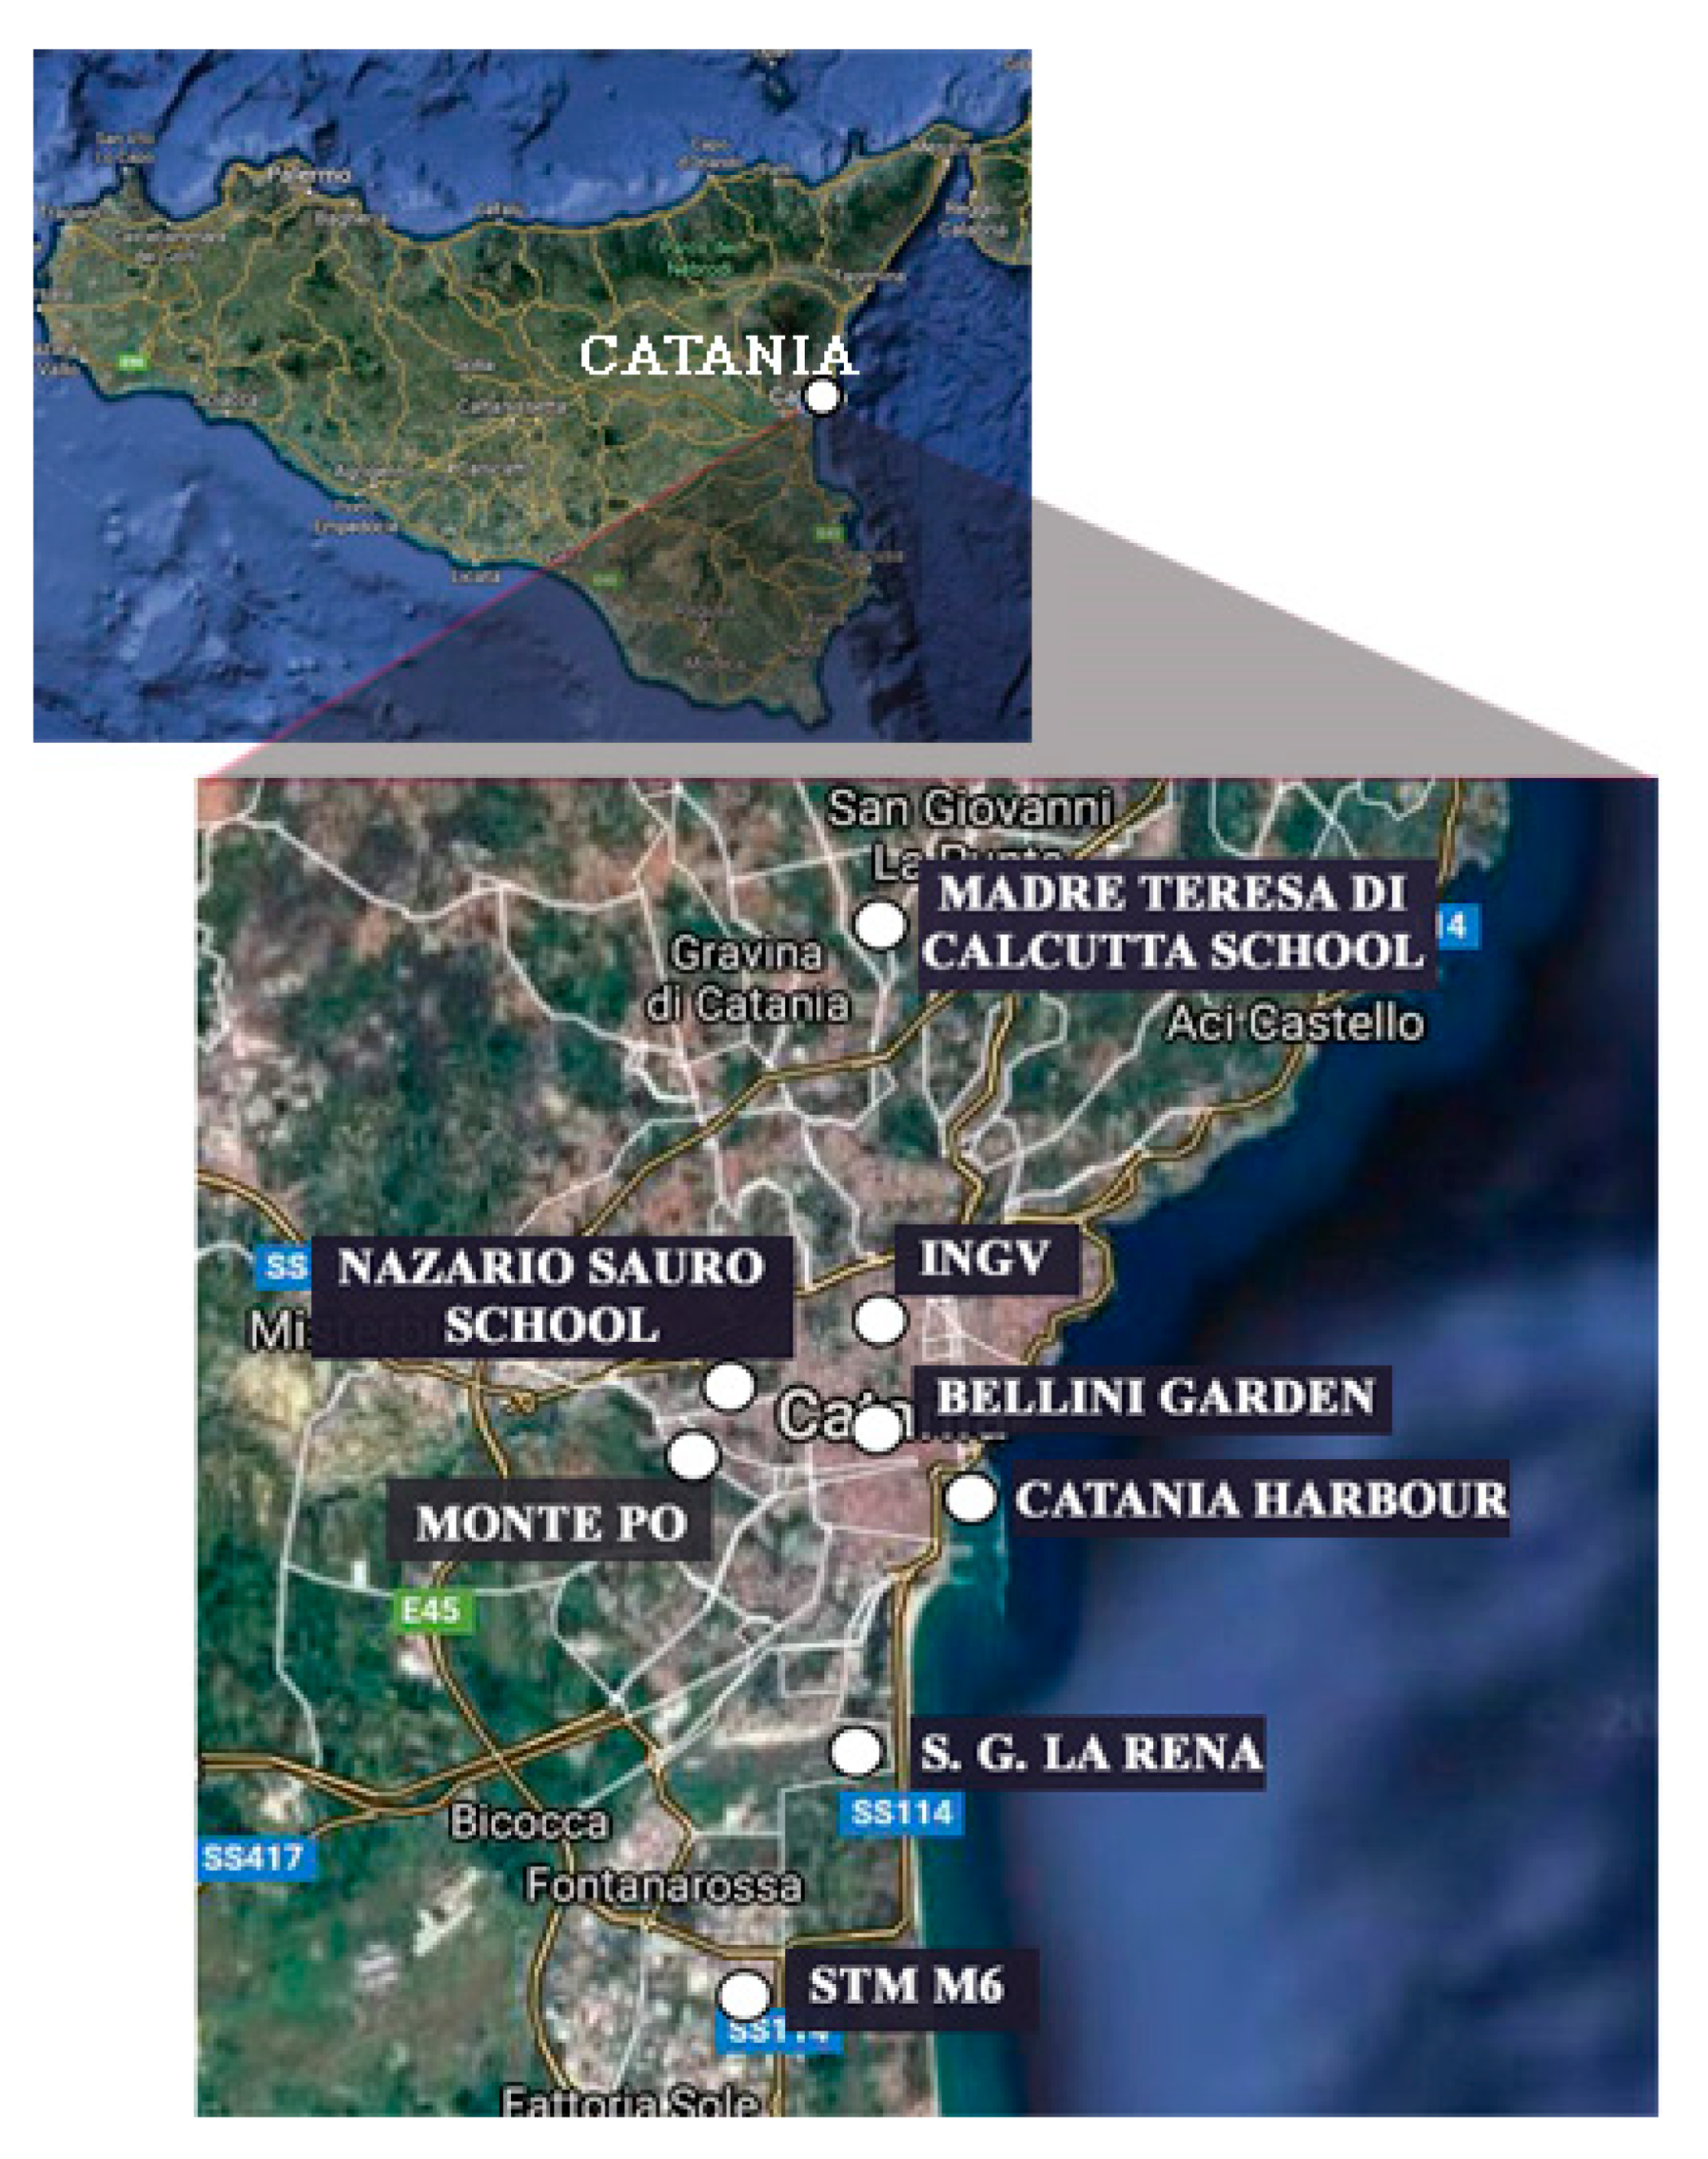
The locations of experimental sites are reported in Figure 7.
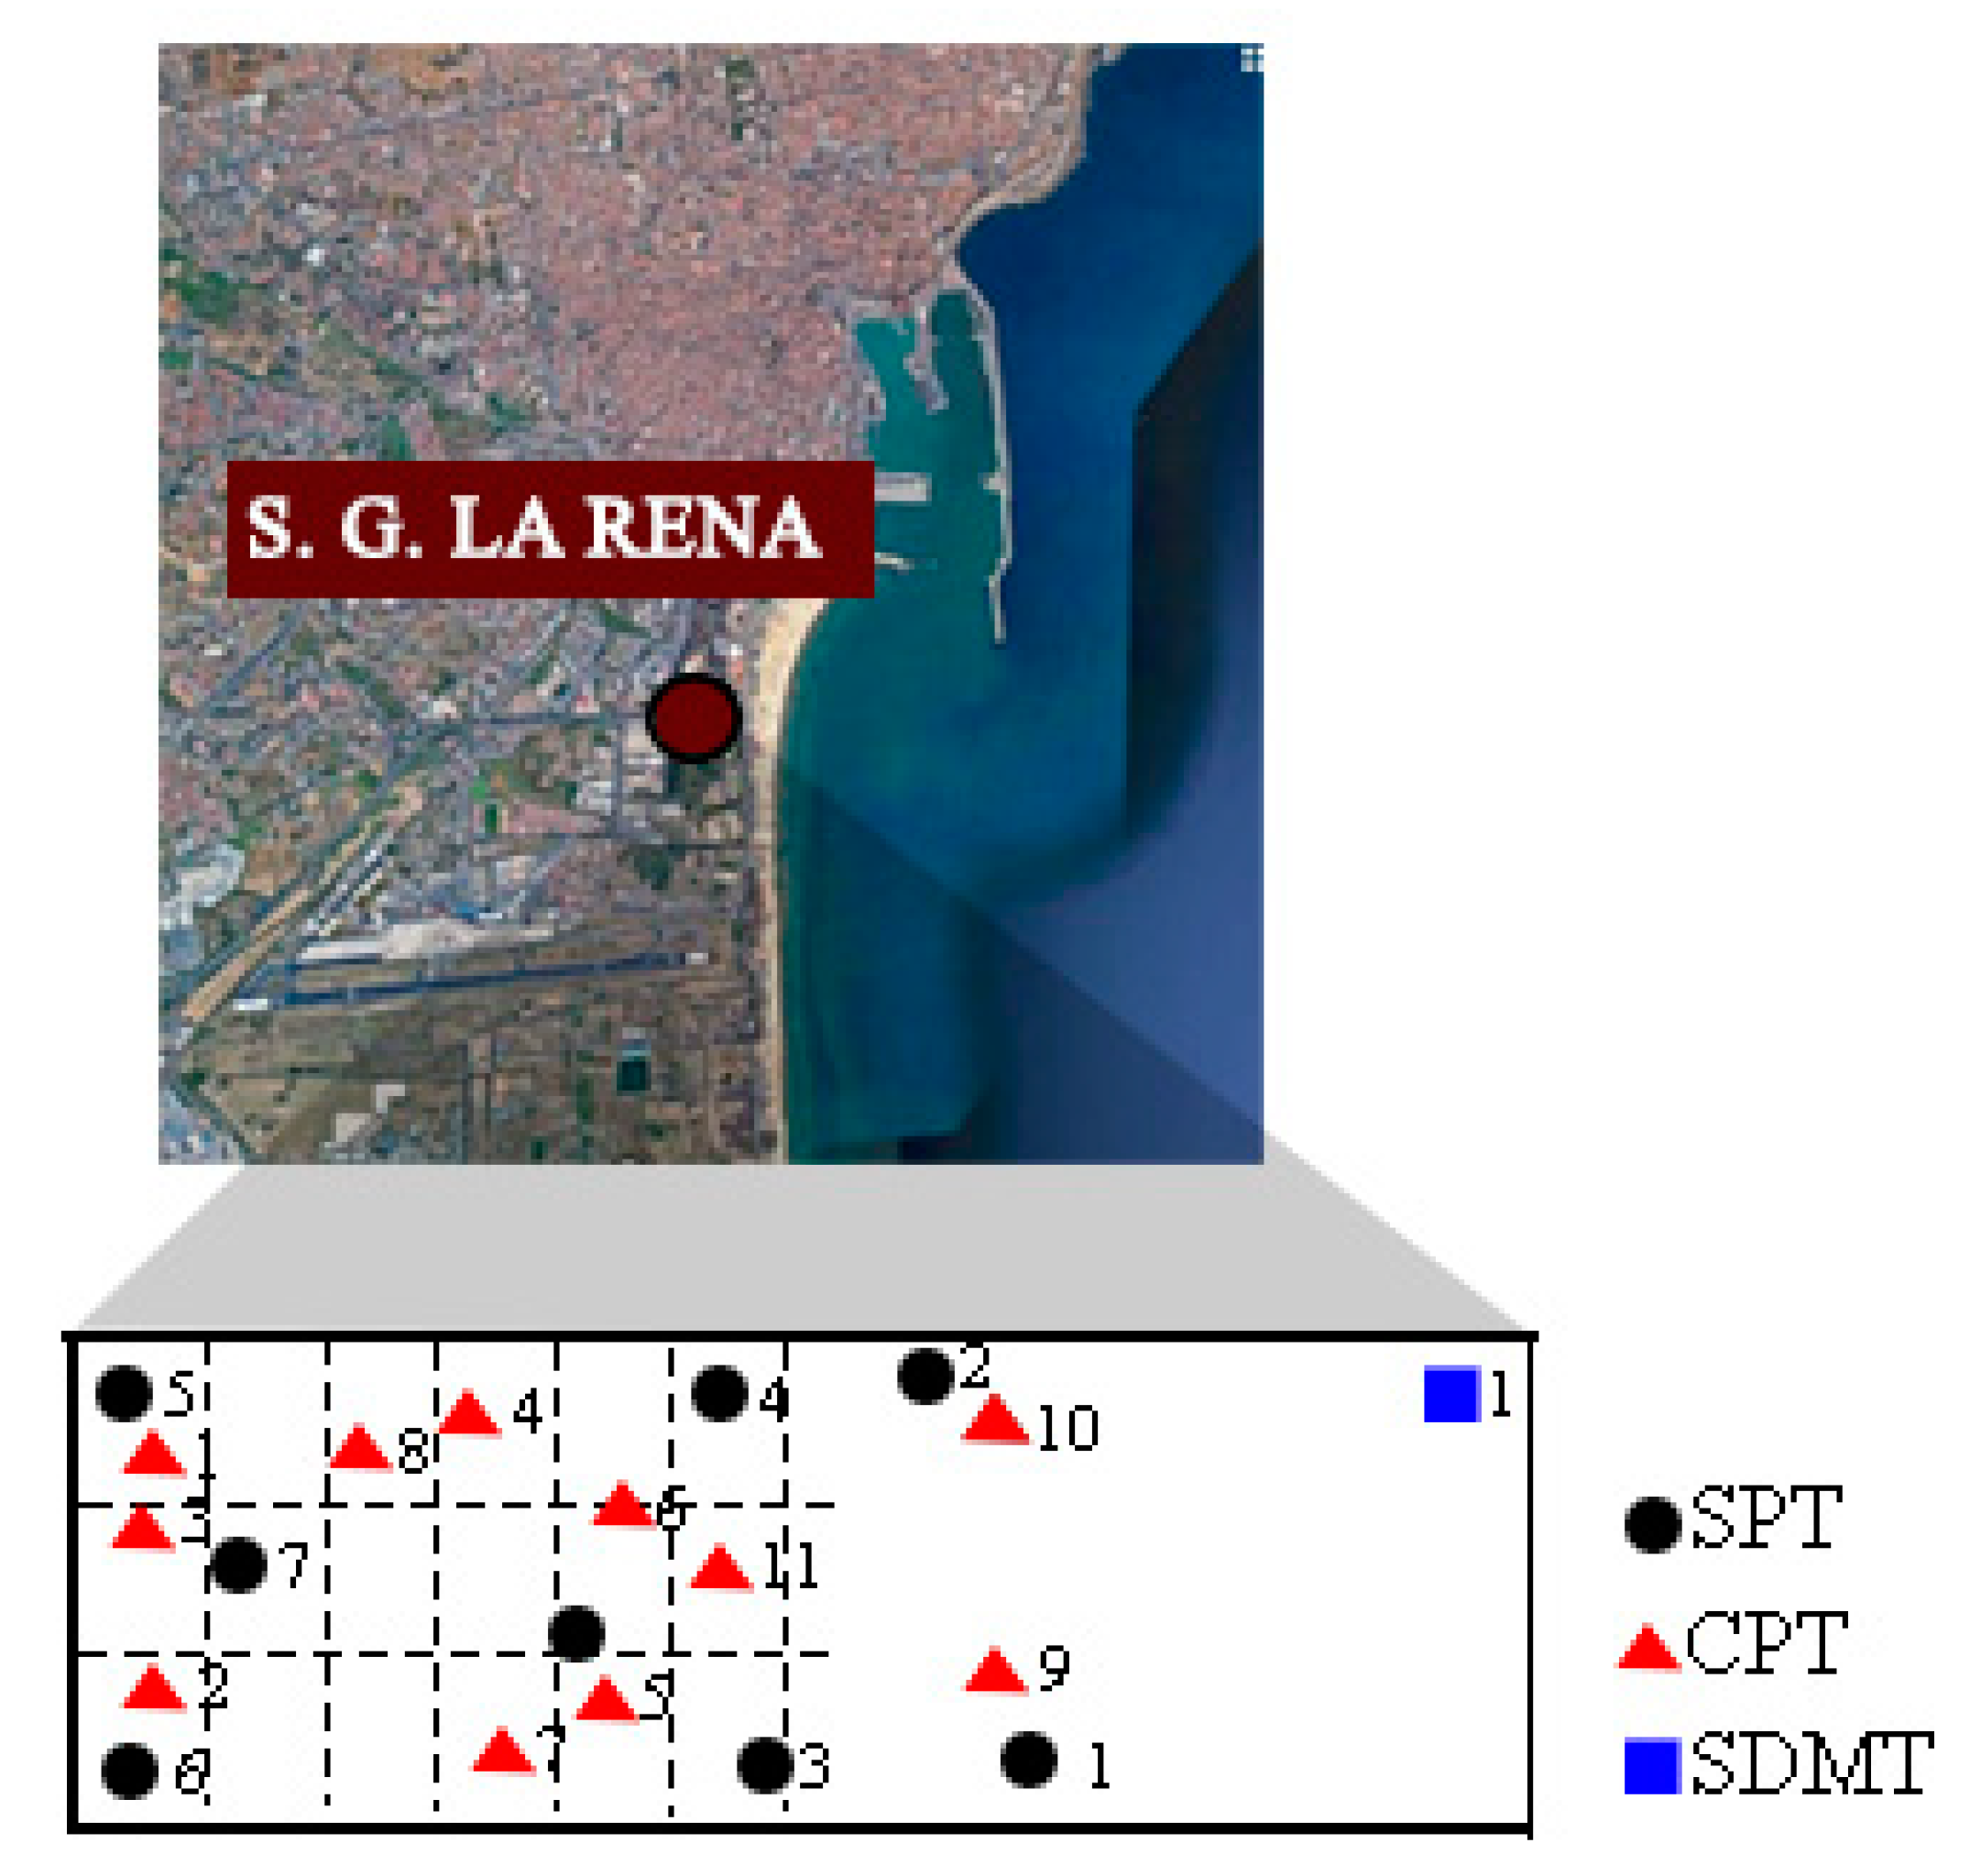
In the Saint Giuseppe La Rena site, eight boreholes (No. 418–425 of the database) were made. The depth of the boreholes varies from 8 to 30 m, the water table lies around 2 m below the ground surface and, for all of them, standard penetration tests (SPTs) date are available. Near the borings, eleven cone penetration tests (CPTs) were also made. More recently, at the same site, a seismic dilatometer Marchetti test (SDMT1) was performed. The SDMT1 has an effective depth of 23 m. The subsoil exploration revealed the presence of sand with a content of fine particles less than 30% for a depth of about 10 m.
The locations of the SPTs, CPTs, and SDMT1 are reported in Figure 8 [8]. Figure 9 shows an example of SPT profile.
In the Catania Harbour area five seismic dilatometer Marchetti tests (SDMT2-6) were performed. They have an effective depth of 30.50 m, 32.00 m, 31.00 m, 30.00 m, and 32.00 m.
Two seismic dilatometer tests, indicated as SDMT 7 and SDMT 8, were conducted from ground level to depths of 17.5 m and 29.5 m, respectively, in the Nazario Sauro school site. In addition, in the INGV (National Institute of Geophysics and Volcanology) site, a seismic dilatometer test (SDMT 9) was performed. It has an effective depth of 34.50 m. Other SDMT tests (SDMT 10-13) were carried out in Madre Teresa di Calcutta School (SDMT 10, depth of 29.50 m), STM M6 (SDMT 11, depth of 39.94 m), Bellini Garden (SDMT 12, depth of 30.44 m), and Monte Po (SDMT 13, depth of 12.50 m) sites. Figure 10 shows the location of the SDMTs in each experimental sites.
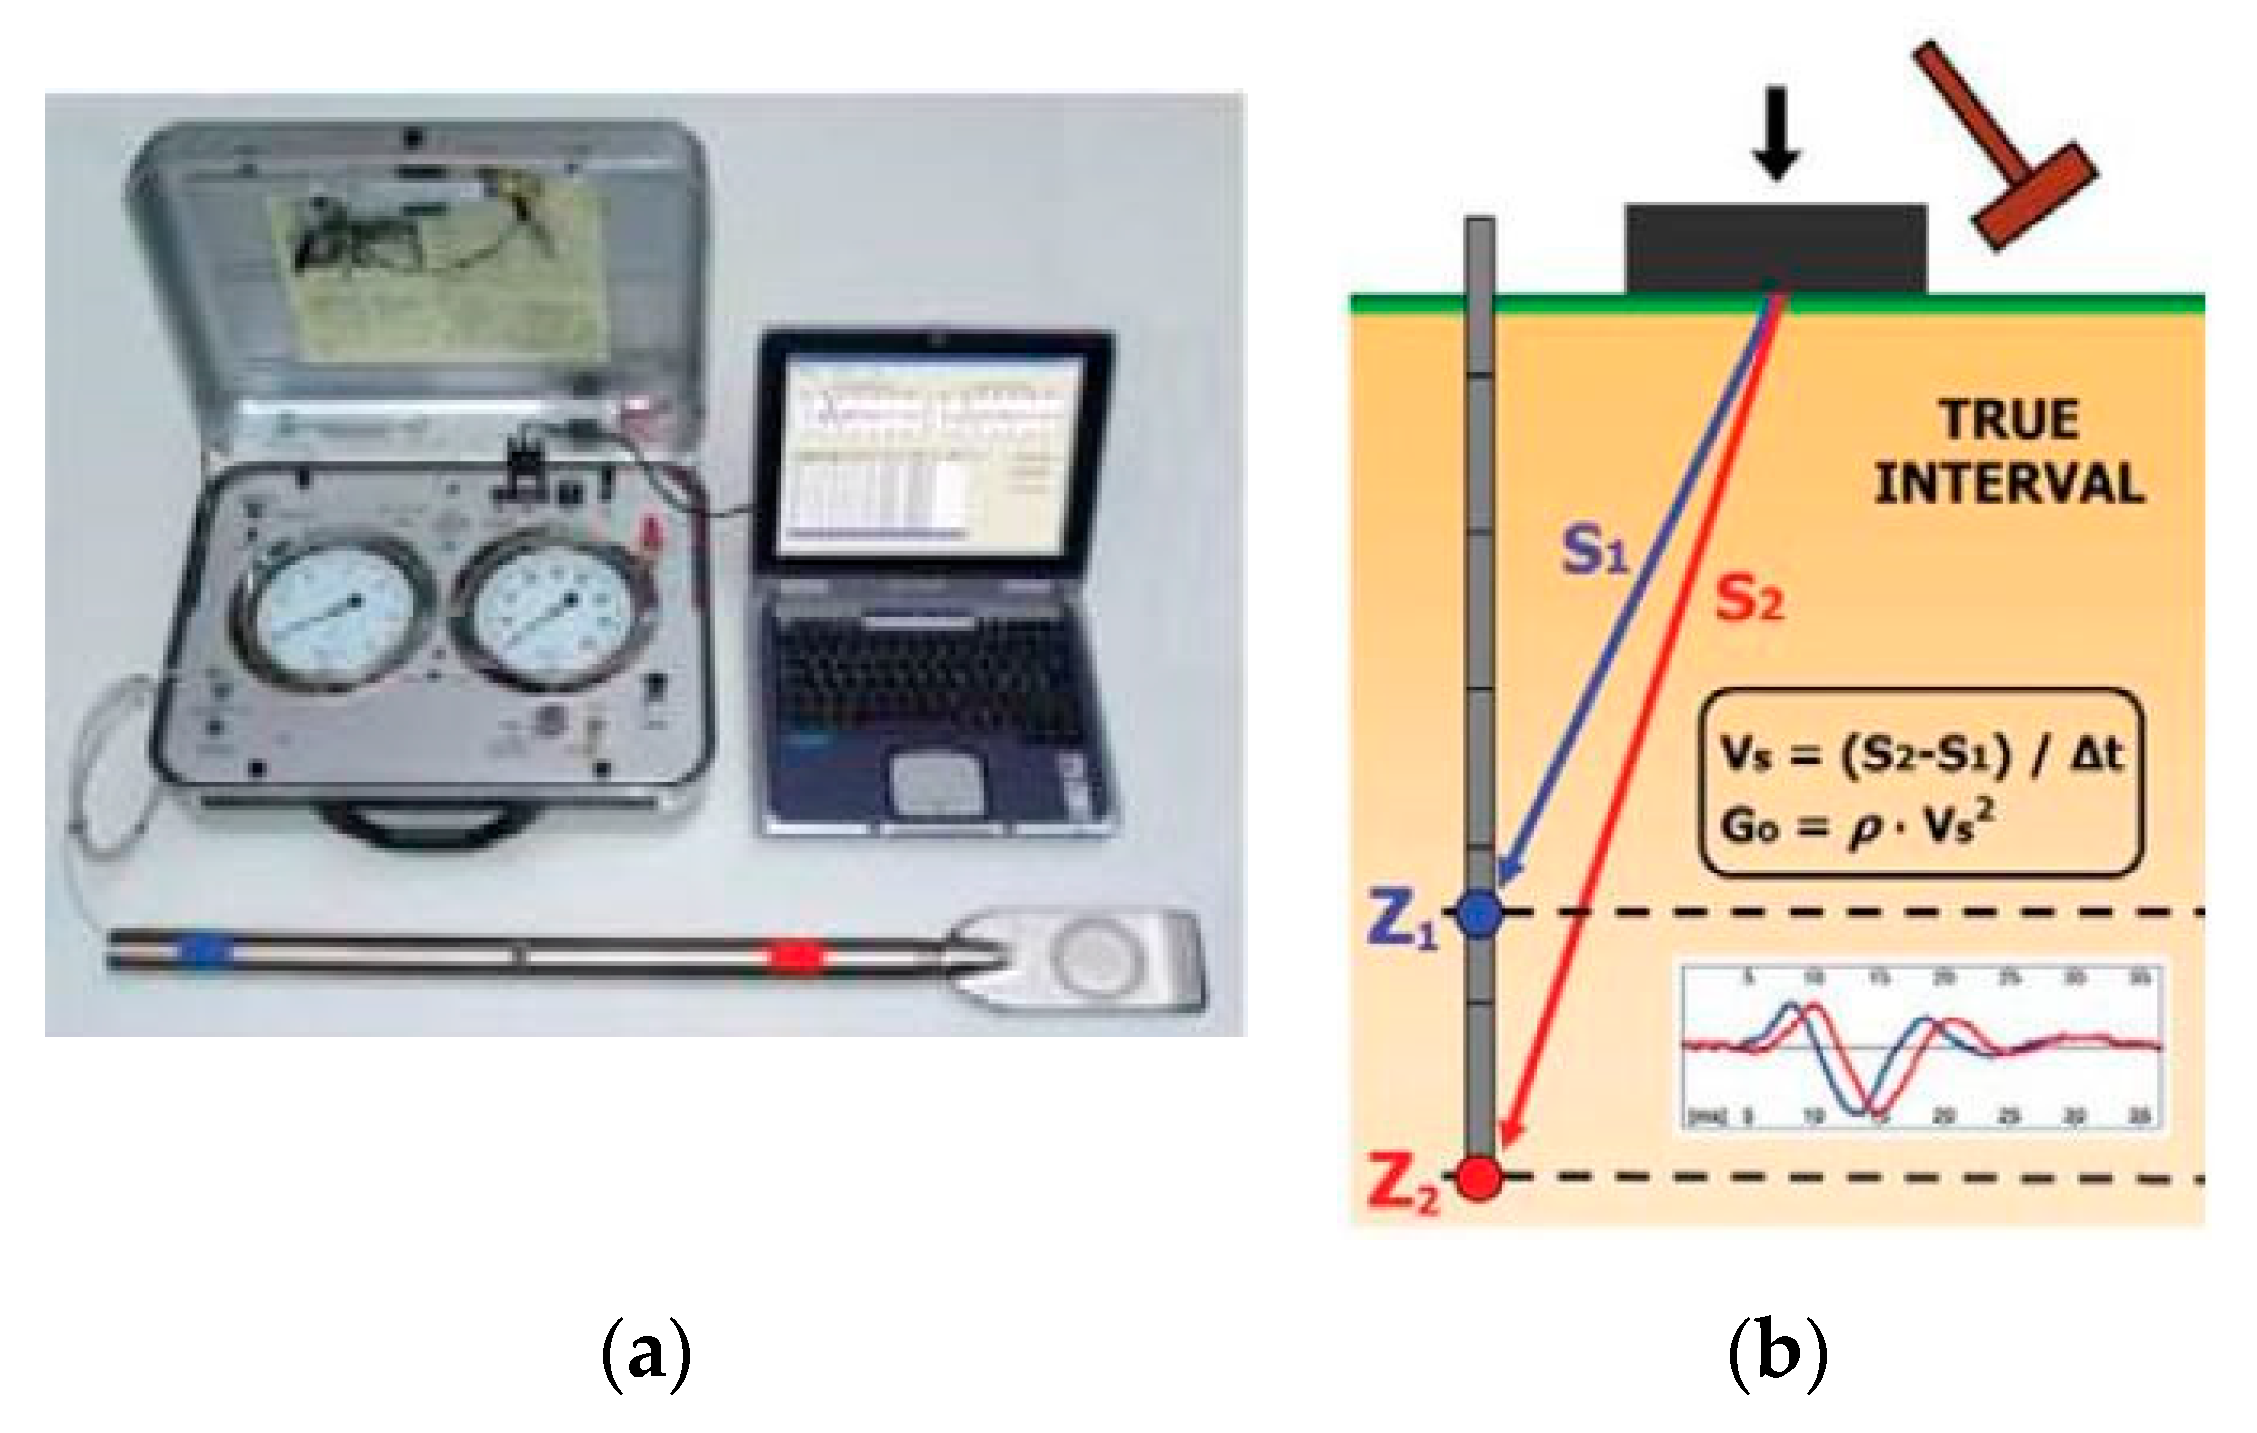
The SDMTs have been carried out with the aim to evaluate the soil profile of shear wave velocity for the site response analysis. VS measurements have been incorporated within a Marchetti flat dilatometer (DMT) by placing a velocity transducer in a connecting rod just above the blade. The seismic modulus is an instrumented tube housing two receivers at a distance of 0.50 m [8,30] (Figure 11).
The test configuration “two receivers”/“true interval” avoids the problem connected with the possible inaccurate determination of the “first arrival” time sometimes met with the “pseudo interval” configuration (one receiver) [8,30]. The energization is obtained by a swinging hammer, hitting horizontally a steel parallelepipedal base. The shear wave velocity Vs is the ratio between the difference of distance between the energy source and the two receivers and the measured delay time of the pulse from the upper to the lower receiver [8].
SDMT obtained parameters by the equipment shown in Figure 12 at the sites are: Id: material index; M: vertical drained constrained modulus; ϕ: angle of shear resistance; KD: horizontal stress index; VS: shear waves velocity; : small strain shear modulus.
Shear wave velocity plays a fundamental role in seismic analyses. It is widely recognized that NSPT-value and S-wave velocity of sands are variables dependent on several parameters such as combinations of effective stress, void ratio, soil fabric, etc. [44].
The possibility of using the standard penetration test blowcounts, in order to determine the VS, is based on the presence in the literature of several empirical correlations that relate VS and NSPT-values.
The following empirical correlations have been used to obtain the shear wave velocity profiles, as a function of depth, for each of the eight boreholes.
- (a)
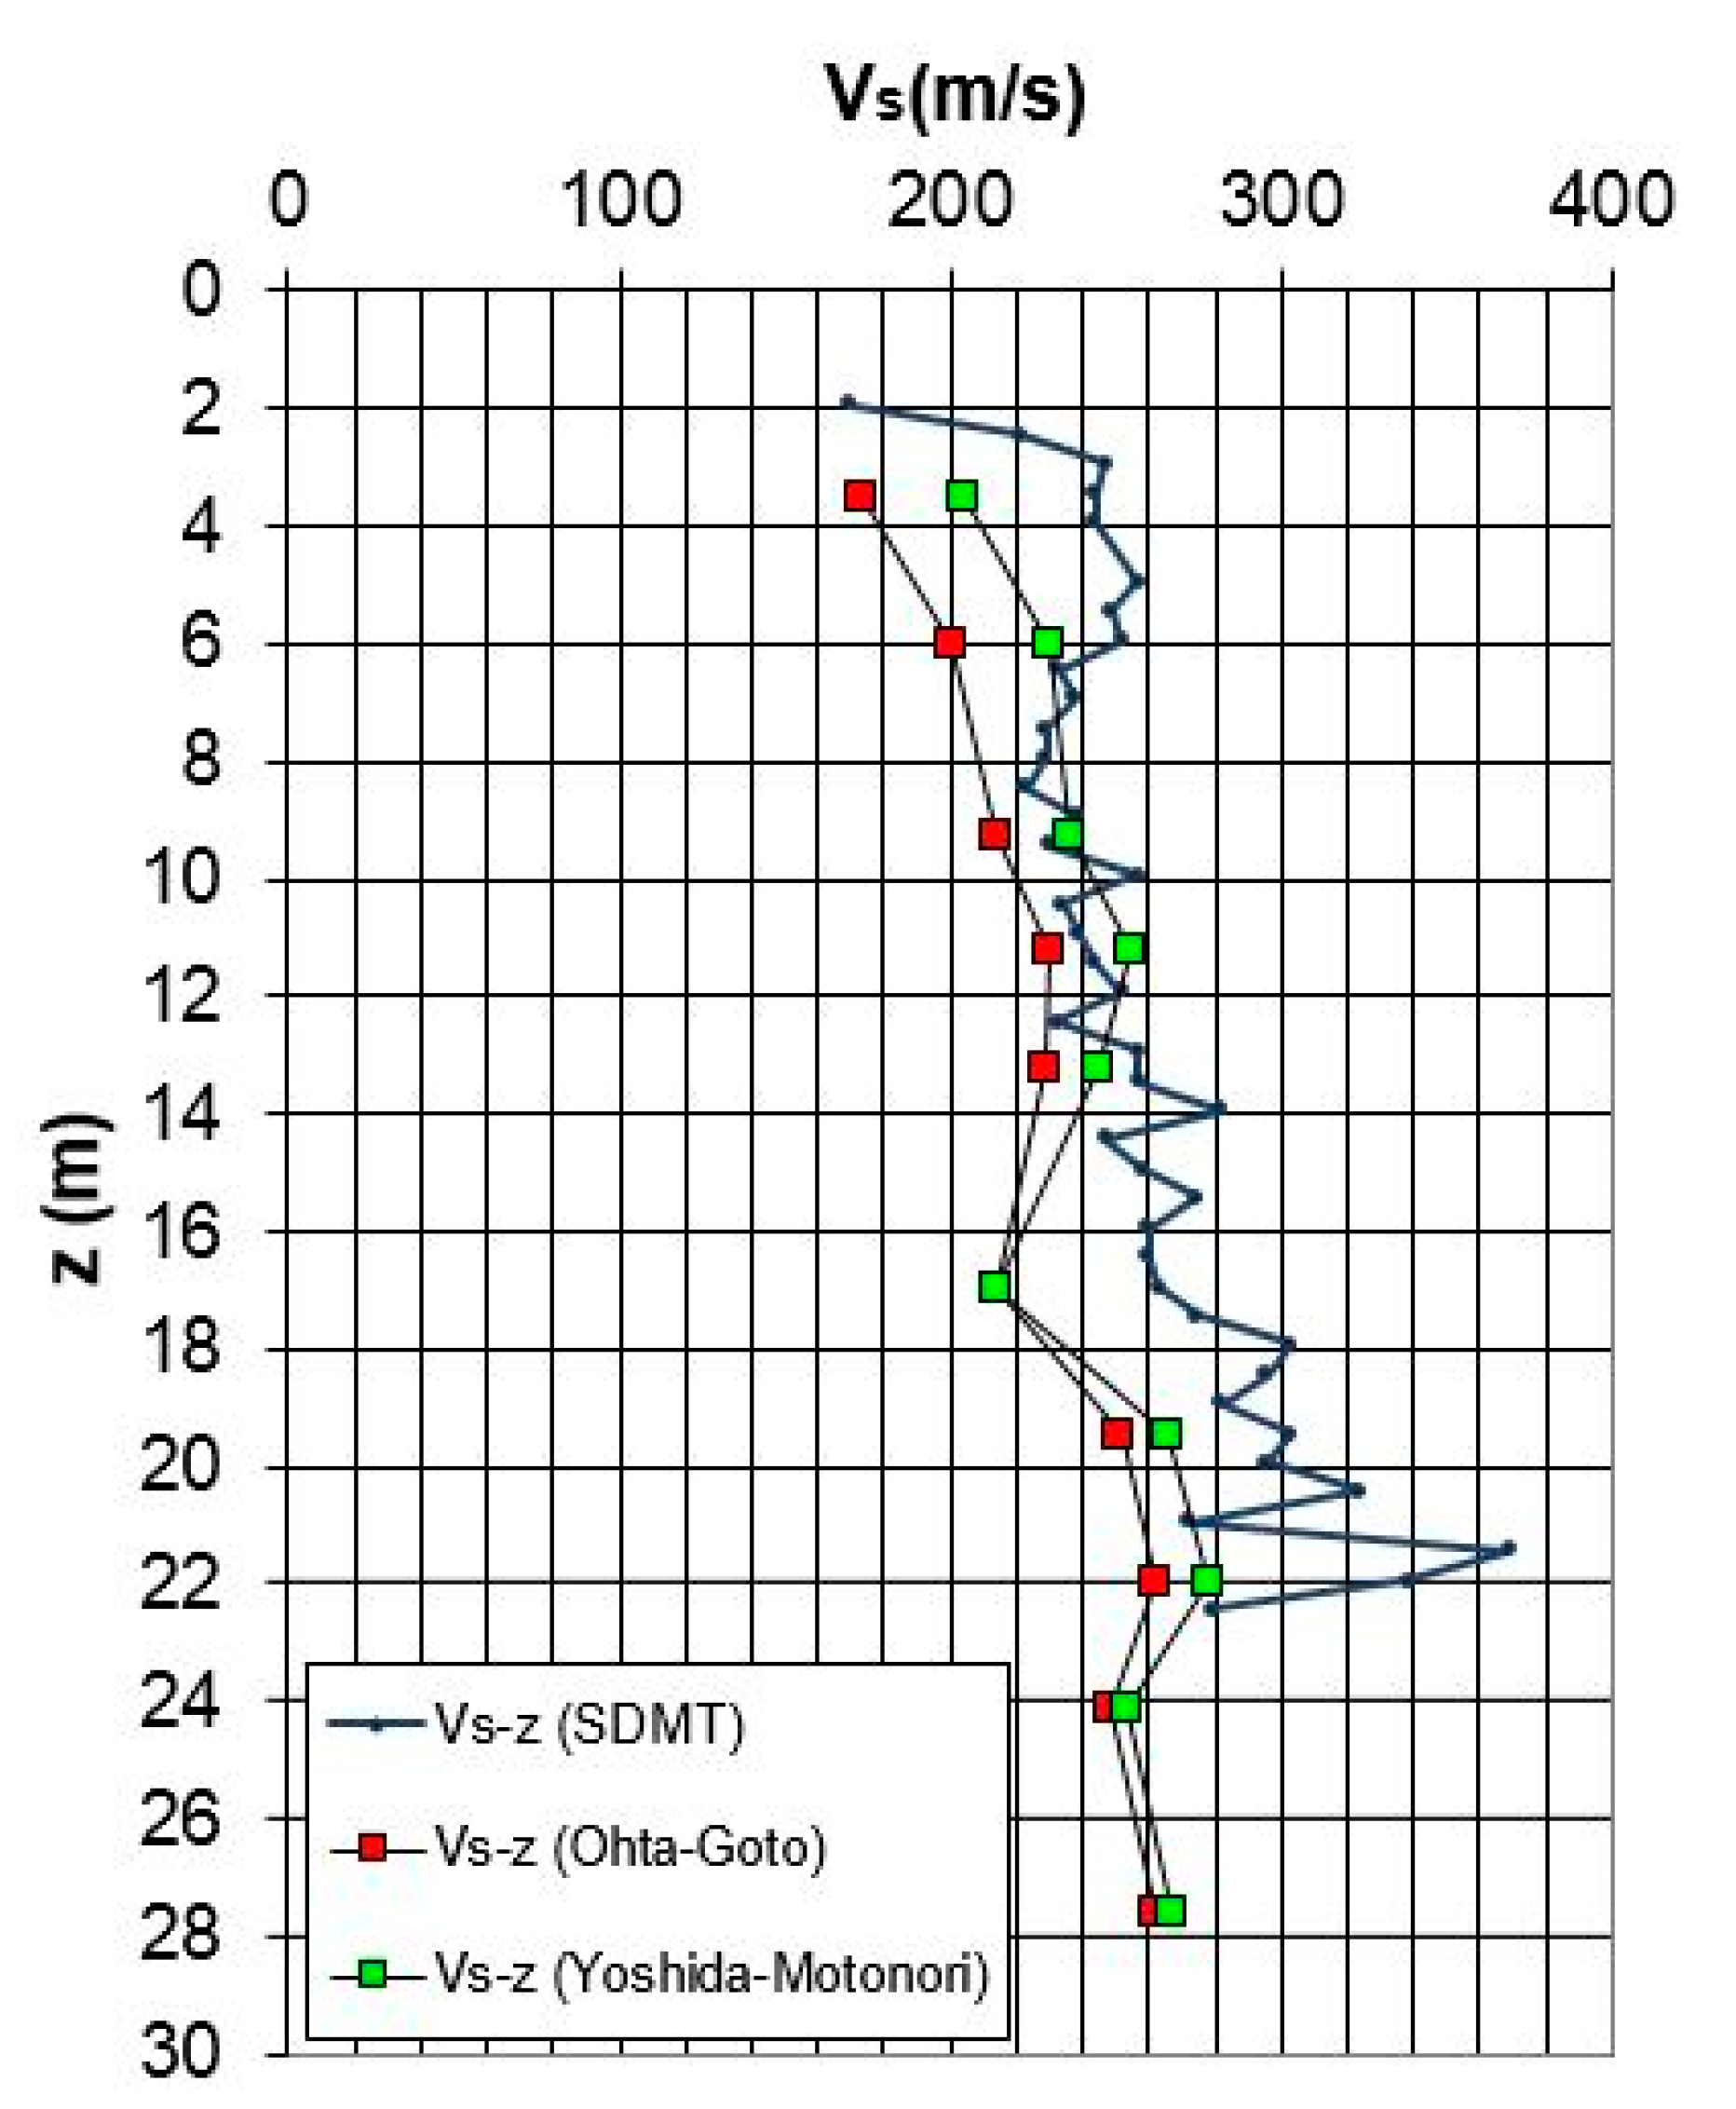
- Ohta and Goto [45]:where VS = shear wave velocity (m/s), NSPT = number of blows from SPT, z = depth in meters, = age factor (Holocene = 1.000, Pleistocene = 1.303), = geological factor (clays = 1.000, sands = 1.086).
- (b)
- Yoshida and Motonori [46]:where VS = shear wave velocity (m/s), NSPT = number of blows from SPT,geological factor (any soil 55, fine sand 49), σv0’ = effective vertical stress.
In Figure 13, the shear wave velocities are shown against depth for borehole 421, as an example, by Equations (9) and (10). Also shown is the shear wave velocity from SDMT1. It is possible to notice that the values obtained with the correlation of Yoshida and Motonori are slightly higher than values determined with the correlation of Ohta and Goto and closer than the values measured from the SDMT1. Thus, it was decided to choose for the seismic response analysis, the values of Vs calculated with the Equation (10), because they are more likely to adhere to the real values. Moreover, Equation (10) better captures the soil variability because it includes the unit weight of soil.
In addition to situ investigations, the following laboratory tests were carried out on undisturbed samples: n. 6 Resonant Column tests, n. 3 Direct shear tests, and n. 3 Triaxial tests.
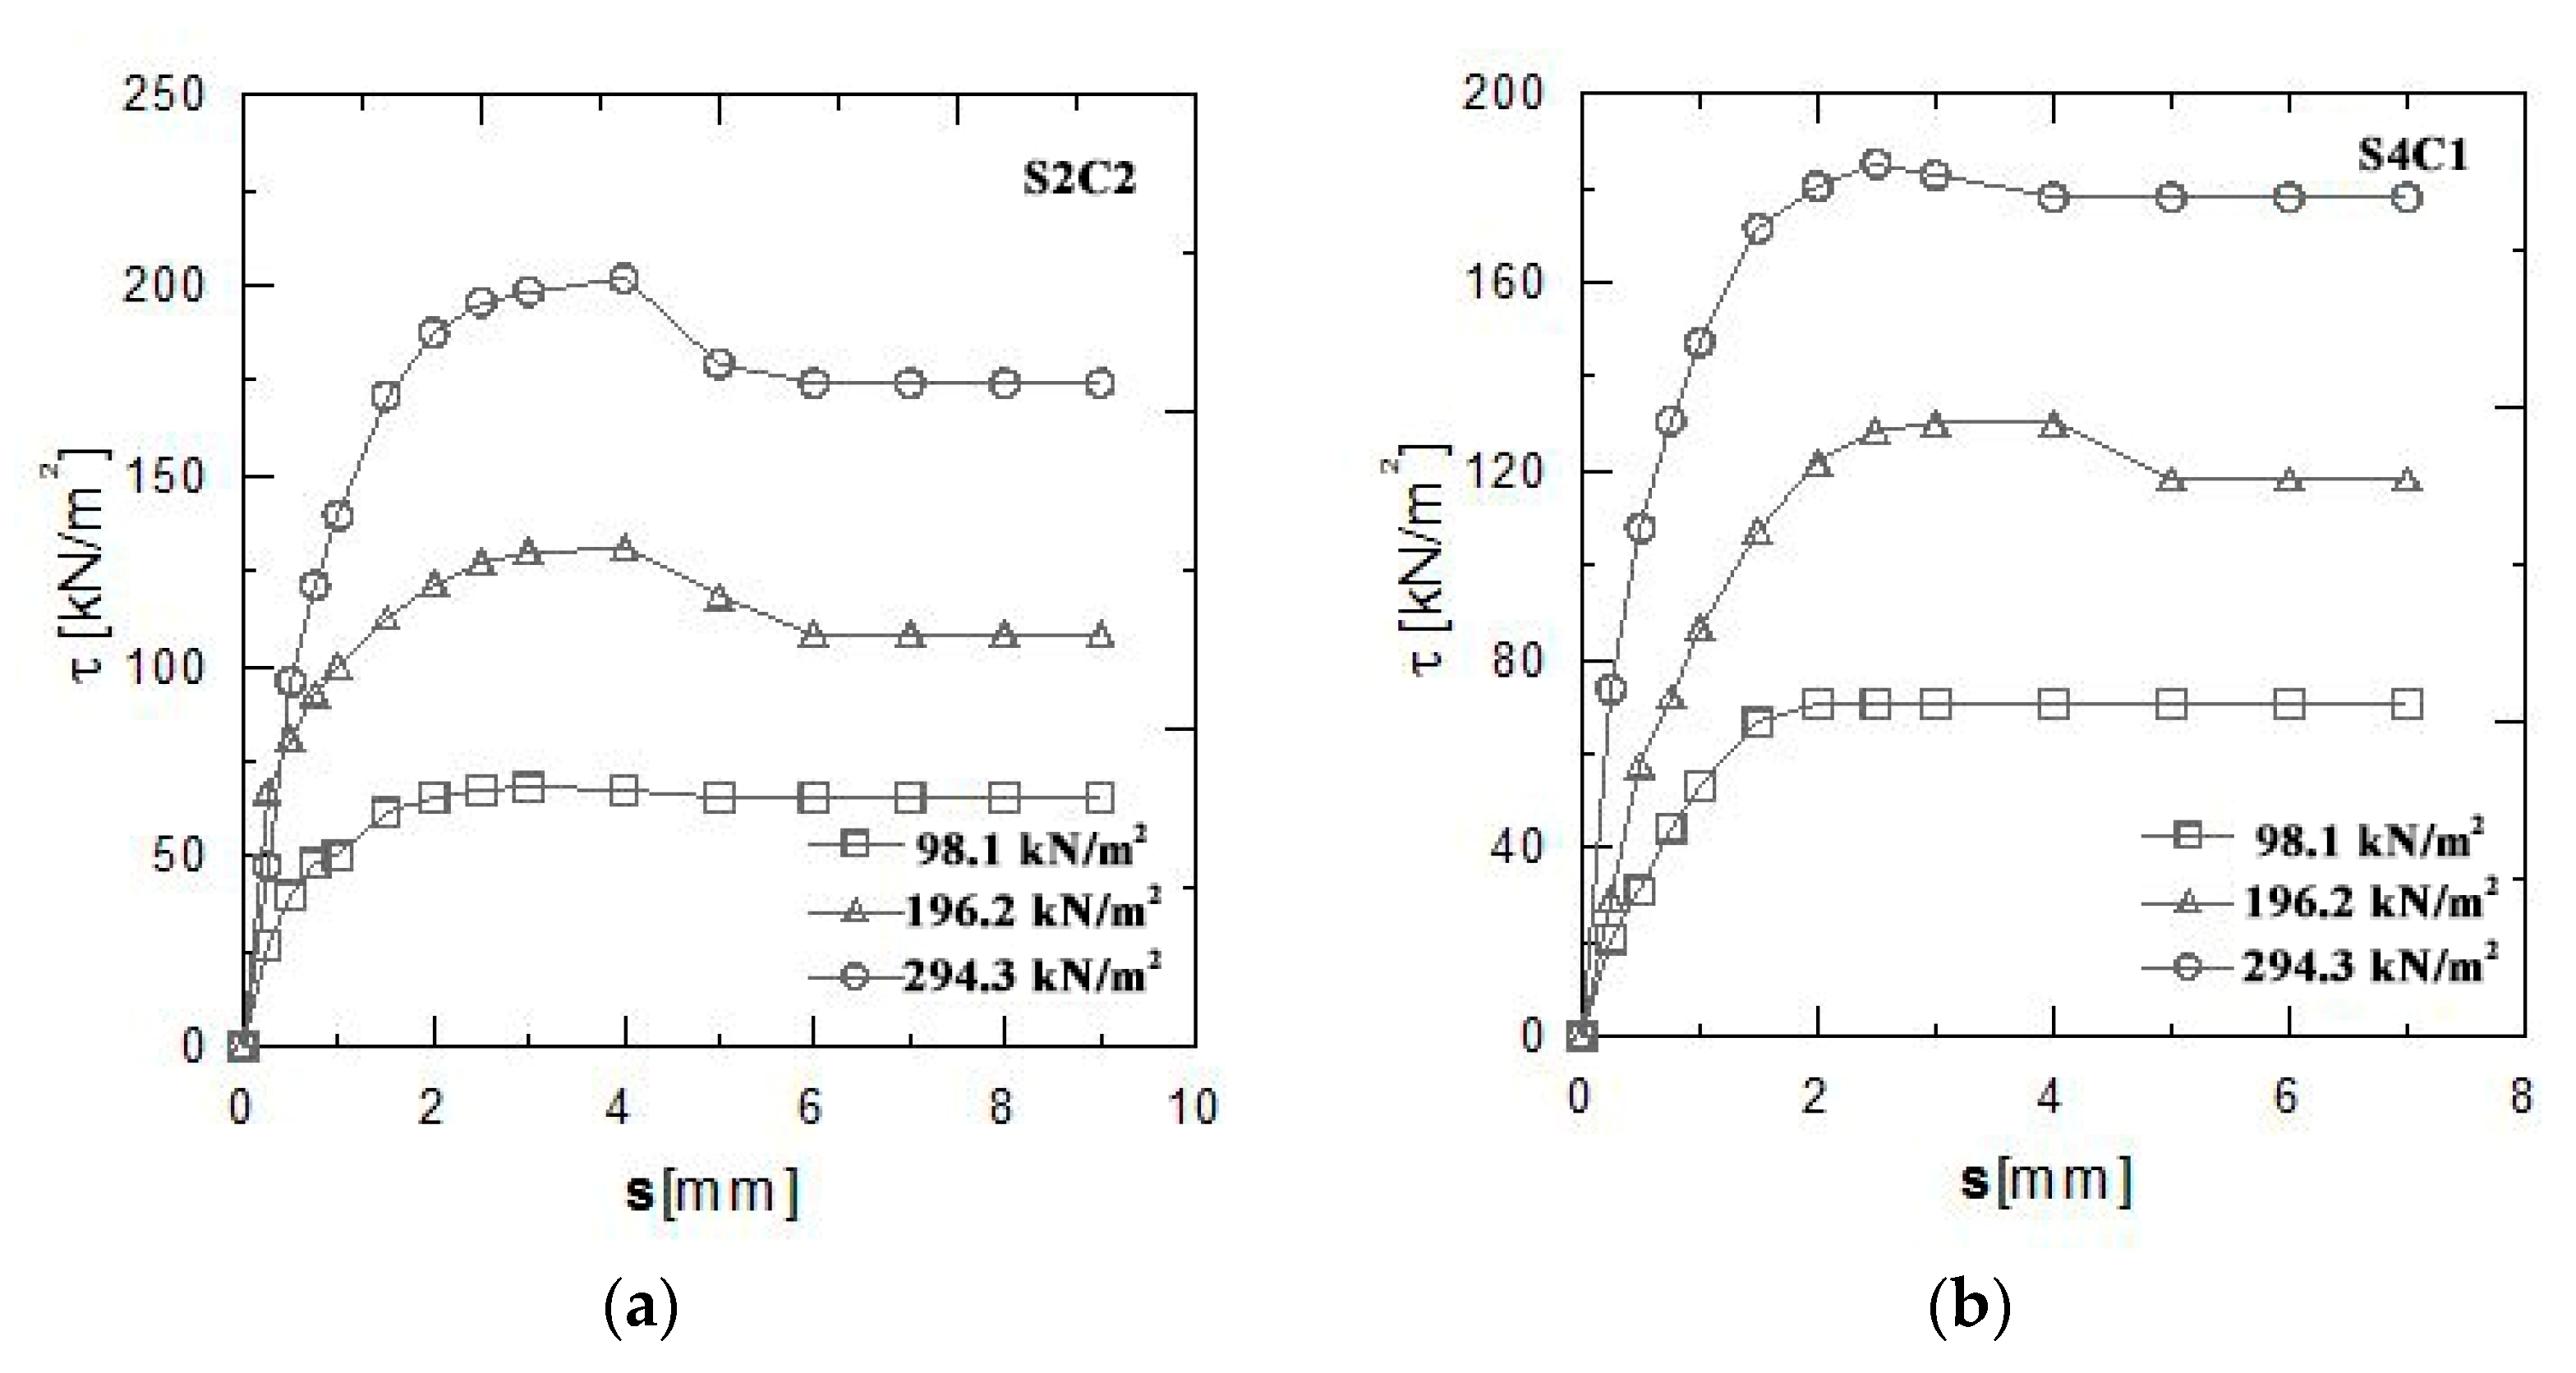
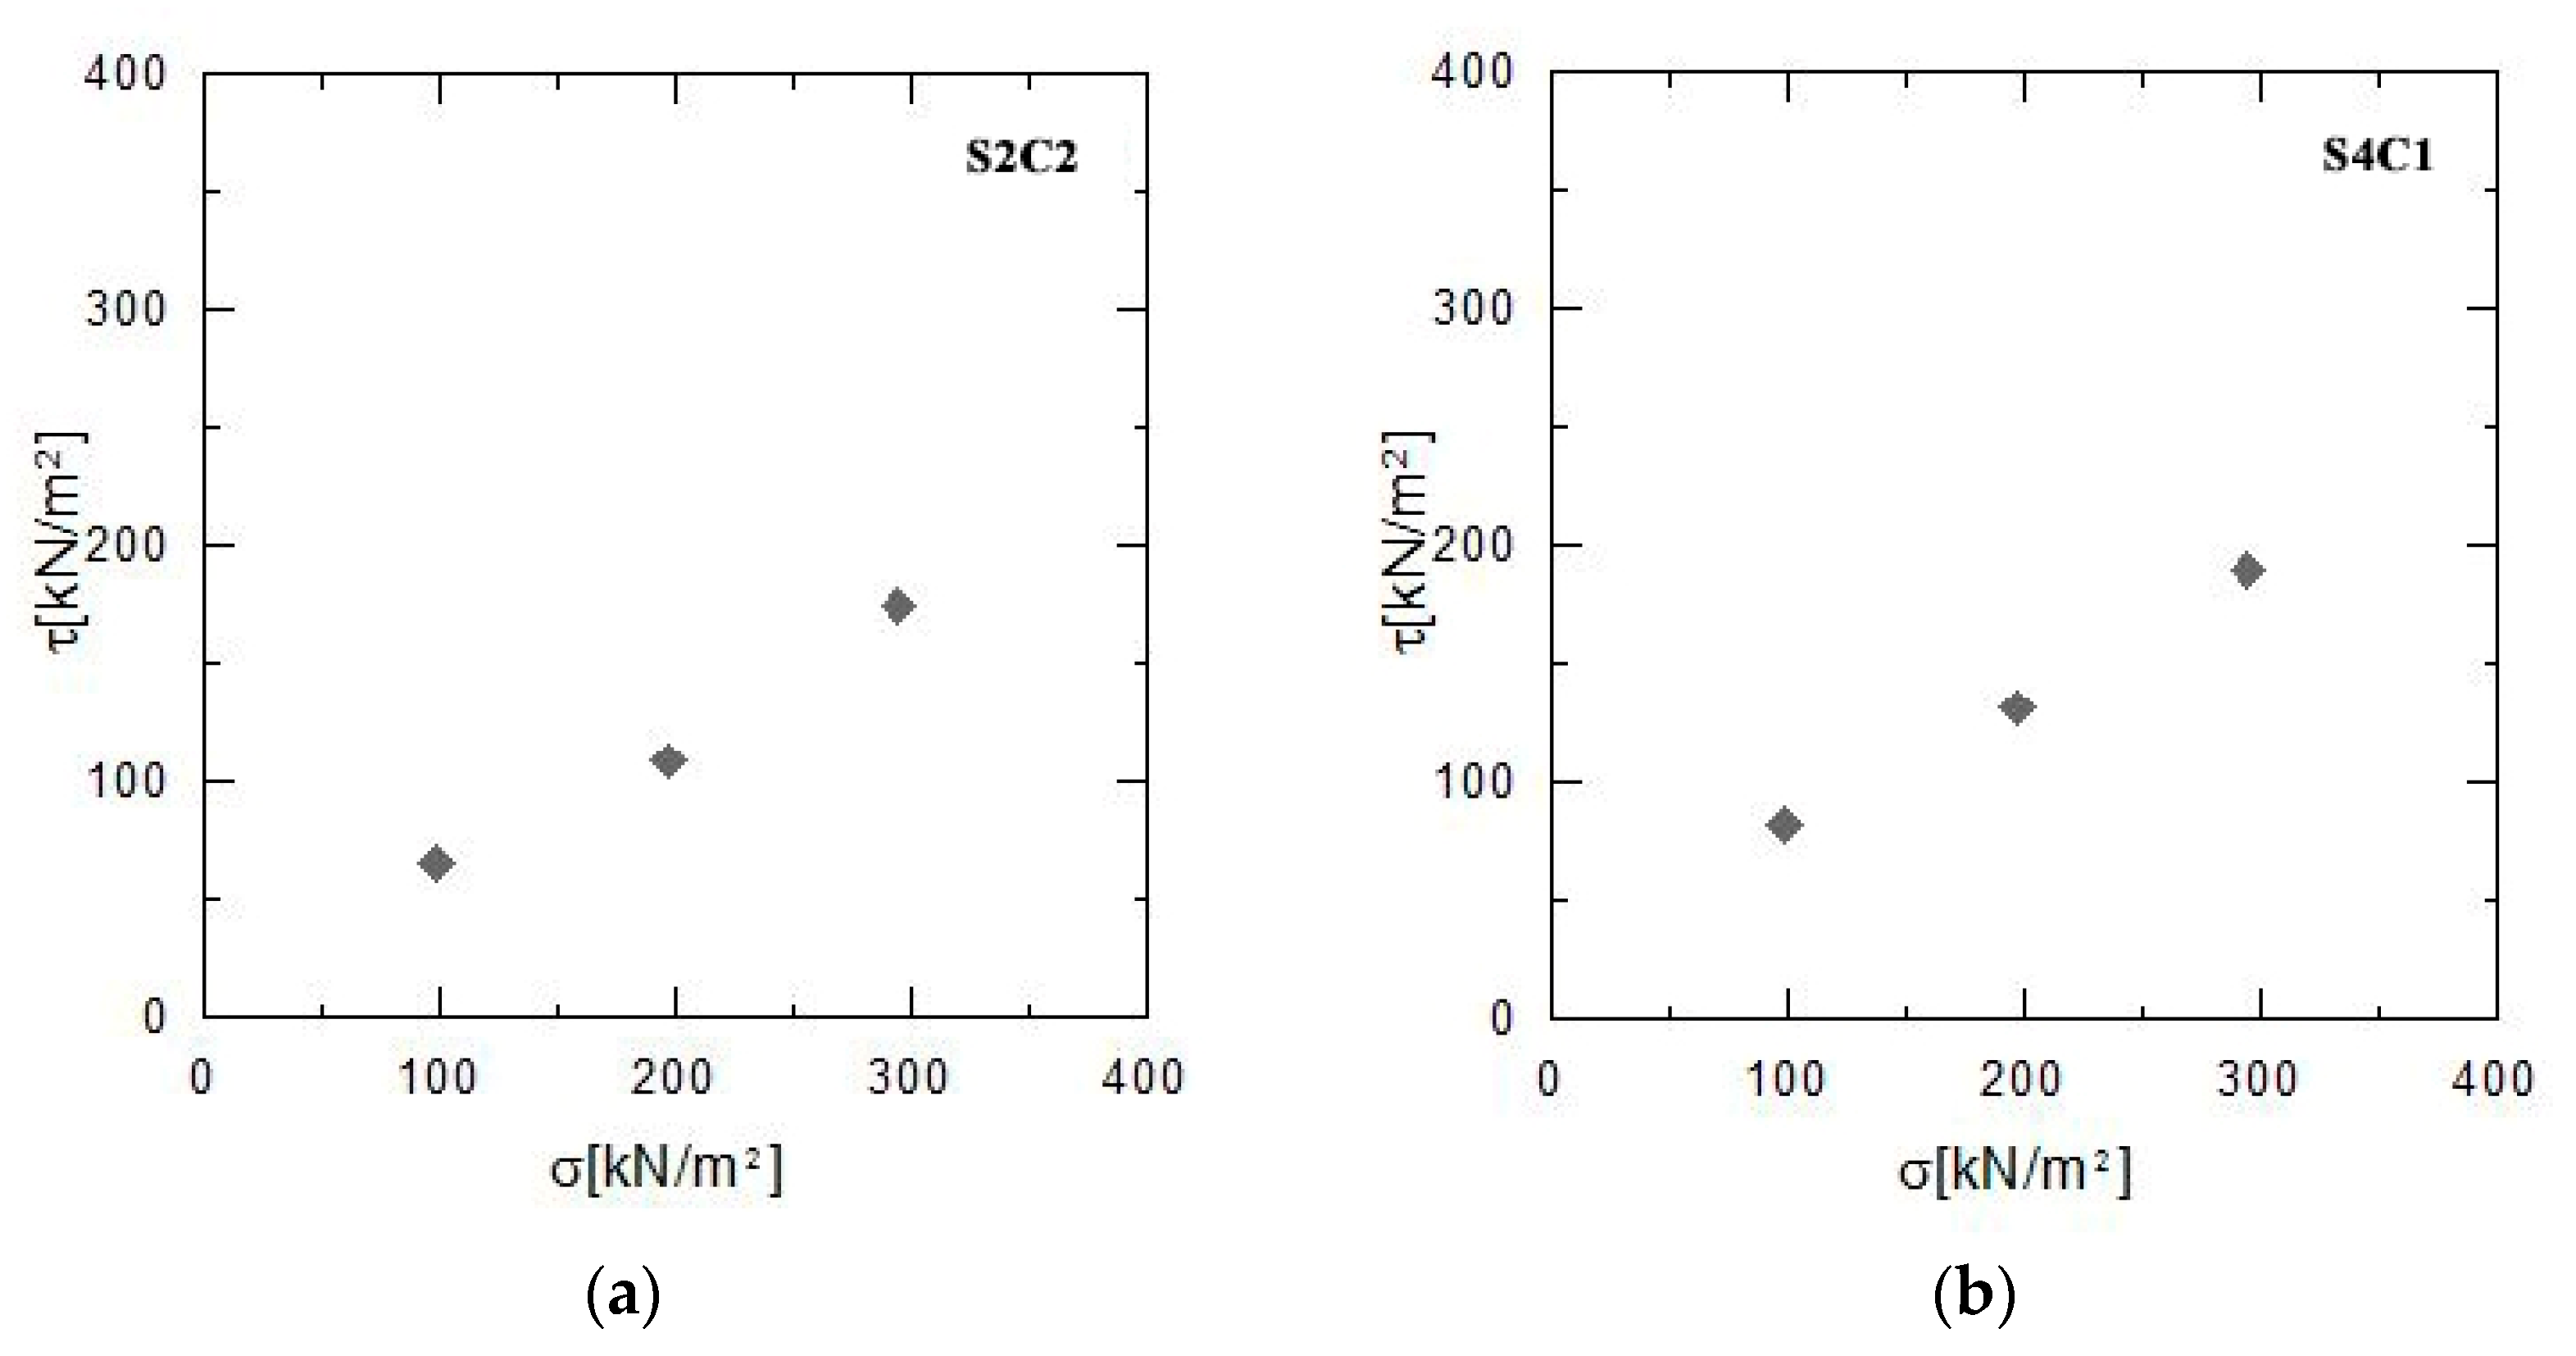
Results of direct shear tests are presented in Figure 14 and Figure 15 for S2C2 (retrieved at 13.20 m in SDMT2 borehole) and S4C1 (retrieved at 8.40 m in SDMT4 borehole) soil samples. Figure 14 shows the horizontal shear stress- horizontal displacement curves under different normal stress conditions (98.1 kN/m2, 196.2 kN/m2 and 294.3 kN/m2). The plots of shear stresses corresponding to failure versus normal stresses are shown in Figure 15.
The experimental results of resonant column tests were used to determine the empirical parameters of the equation proposed by Yokota et al. [47] to describe the shear modulus decay with shear strain level:
The values of α = 9 and β = 0.815 were obtained.
As suggested by Yokota et al. [47], the inverse variation of damping ratio with respect to the normalized shear modulus has an exponential form:
in which D(γ) = strain dependent damping ratio, γ = shear strain, η, λ = soil constants. The values of η = 80 and λ = 4 were obtained [48].
Local site response analyses have been performed using 1-D linear equivalent code STRATA [49] assuming the geometric and geological models of substrate as 1-D physical models.
The shear wave velocity profiles used for soil response analyses are obtained from SPTs date, available for all the eight boreholes (N°418–425), and from the seismic dilatometer tests (SDMT1-13). The values of the other parameters were taken from the geotechnical characterization obtained through in situ and laboratory tests performed.
The dynamic response model requires the knowledge of the depth of bedrock. The conventionally adopted depth of the bedrock corresponds to a VS value of 800 m/s (soil type A according to Italian technical regulations [50]). The criterion of choice adopted to evaluate the depth of bedrock consists in the linear interpolation of the shear waves profiles. The depth obtained is approximately 80 m which corresponds to a VS value of about 800 m/s.
During strong earthquakes the soil tends to behave as non-linear material. To take into account the soil non linearity, laws of shear modulus and damping ratio against strain have been inserted in the code.
The fourteen 1-D columns have been excited at the base using four seismograms. The chosen input motions are: three seismograms, called B3R3RAD, PT1R3, and PT6R3, evaluated assuming the source to be along the Hyblean-Maltese fault and generating the 1693 seismic ground motion scenario [51,52]; a seismogram evaluated assuming the source to be along the Hyblean-Maltese fault and generating the 1818 seismic ground motion scenario [51].
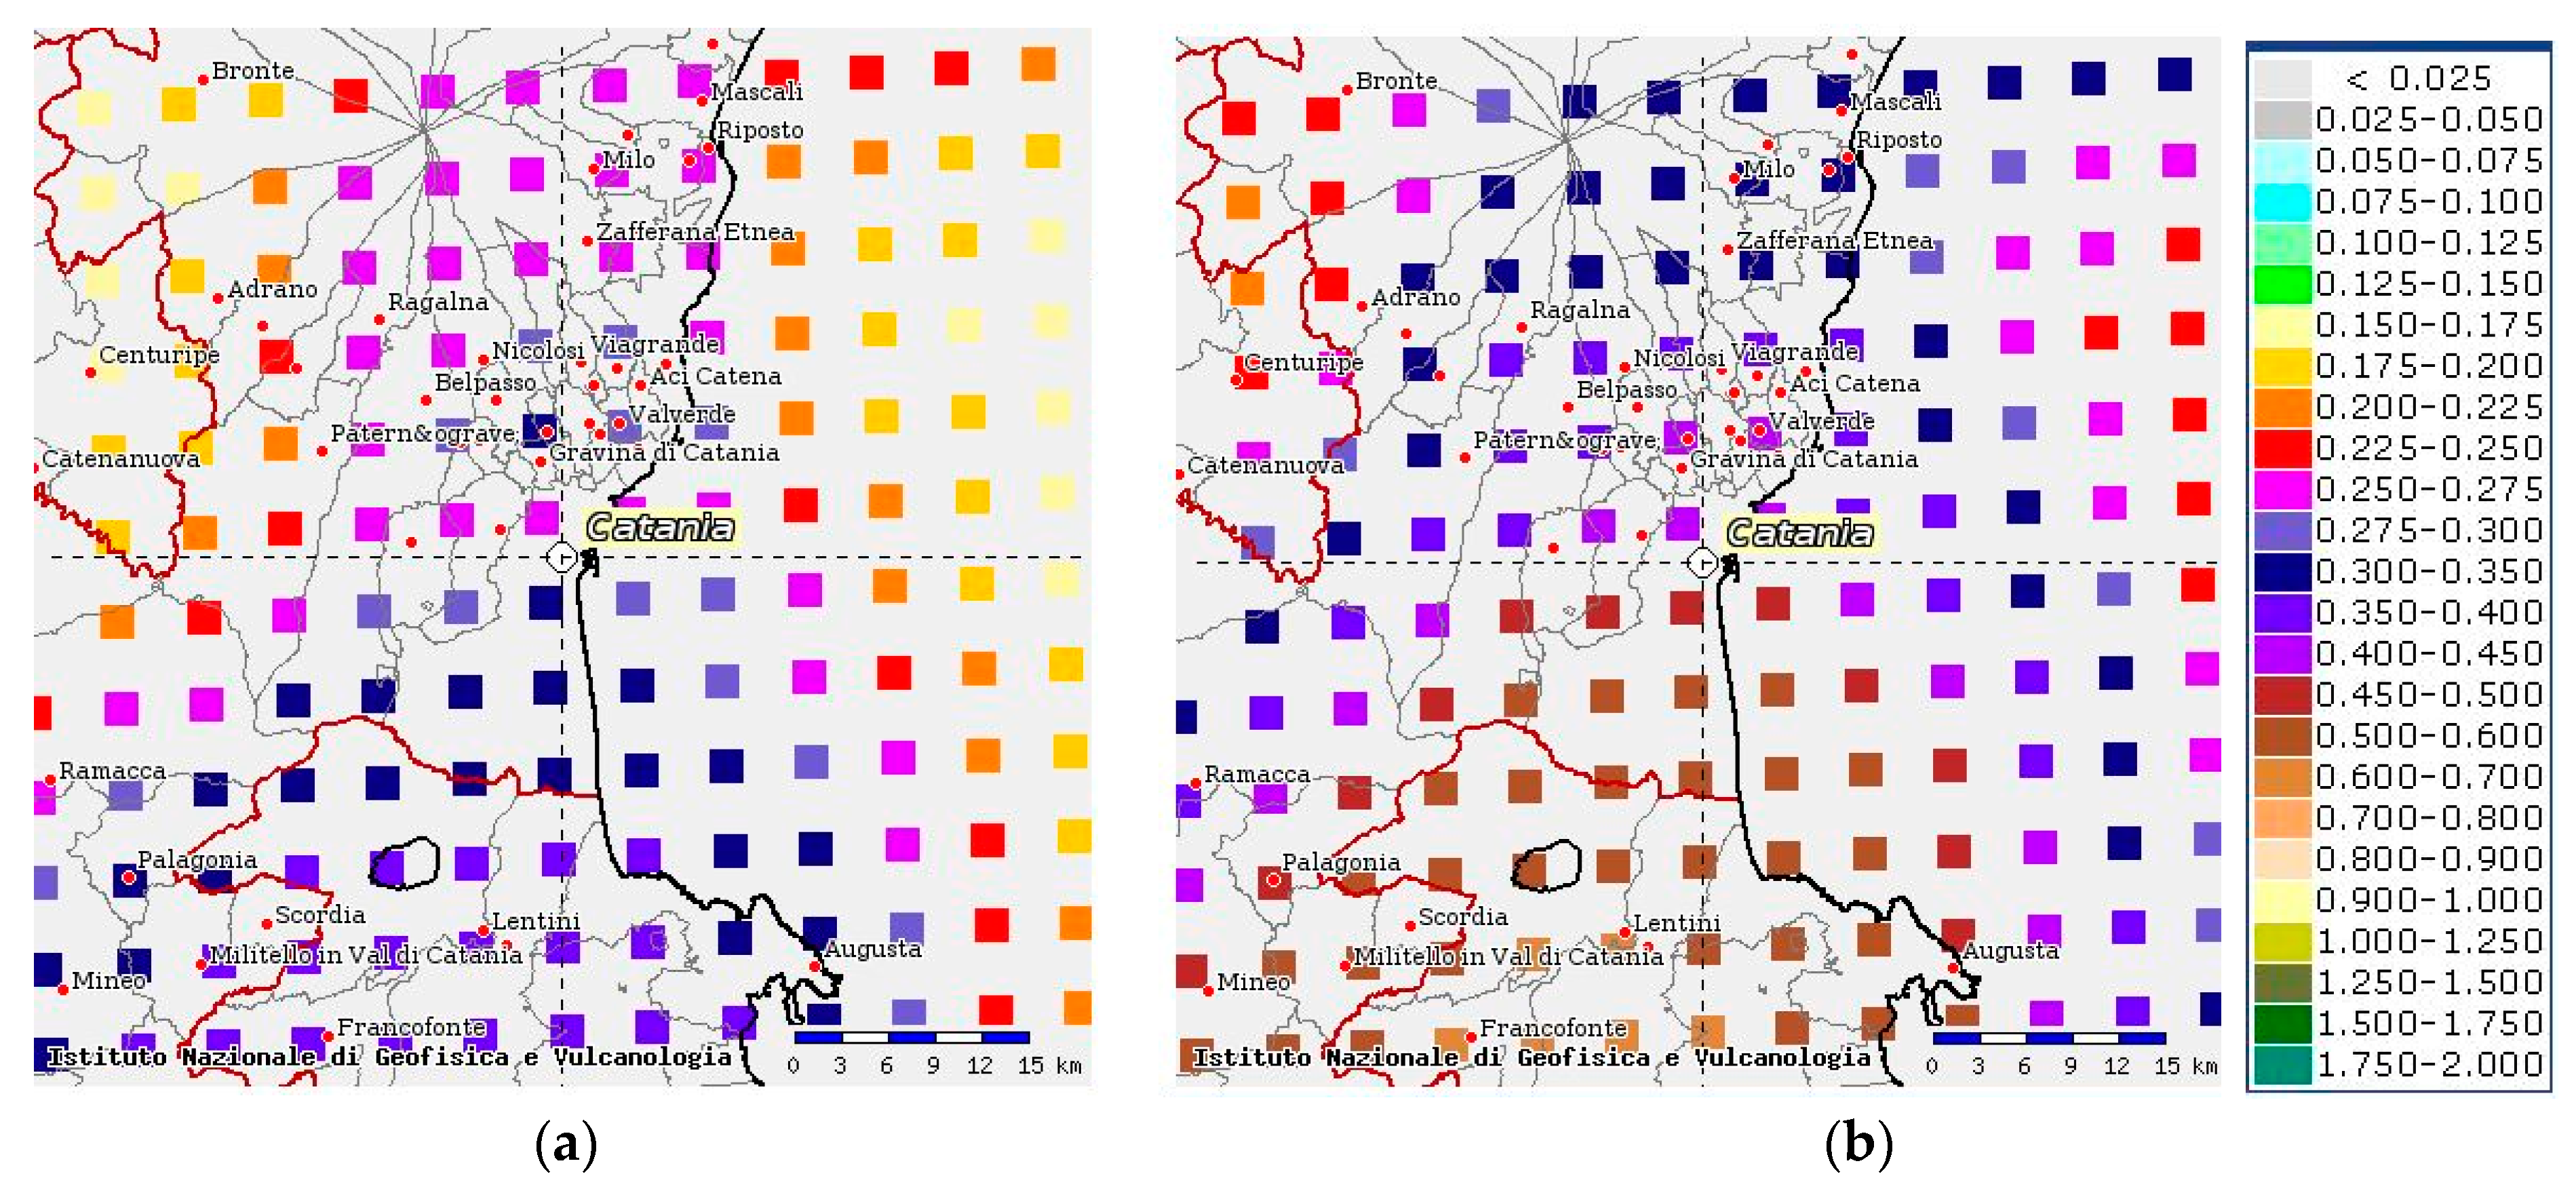
Based on the interactive seismic hazard maps of the city of Catania [53], the seismograms have been scaled to the maximum PGA of 0.3 g (corresponding to a return period of 975 years) and to the maximum PGA of 0.5 g (corresponding to a return period of 2475 years) by entering the scale factors in the STRATA code [49]. The interactive seismic hazard maps (Figure 16) were obtained by a probabilistic approach [53].
5. Shear Stress Reduction Factor rd in the Catania Area (Italy)
The procedure for computing the factor of safety against liquefaction is termed “simplified procedure.” Since its inception in the 1970s, it has been revised and updated by many authors. One of the parameters to be evaluated is the stress reduction coefficient, rd, as a parameter describing the ratio of cyclic stress for a flexible soil column to the cyclic stress for a rigid soil column [5] (Figure 19):
Herein, new stress reduction coefficient rd relationships are proposed for the eastern coastal plain of Catania area (Italy). They have been developed from equivalent-linear site response analyses performed on soil profiles obtained from SPTs date, available for eight boreholes (n. 418–425), and from seismic dilatometer tests (SDMT1-13). The seismic events of 1693 and 1818 have been chosen as scenario earthquakes.
According to the approach originally proposed by Seed and Idriss [12], the ranges of values of rd for sandy saturated soil profiles of eastern coastal Catania area have been determined. They are shown in the Figure 20 and Figure 21.
The dashed lines labelled “Average values” represent the recommended values of rd from the surface to a depth of 30 m. They can be approximated by Equations (14) and (15).
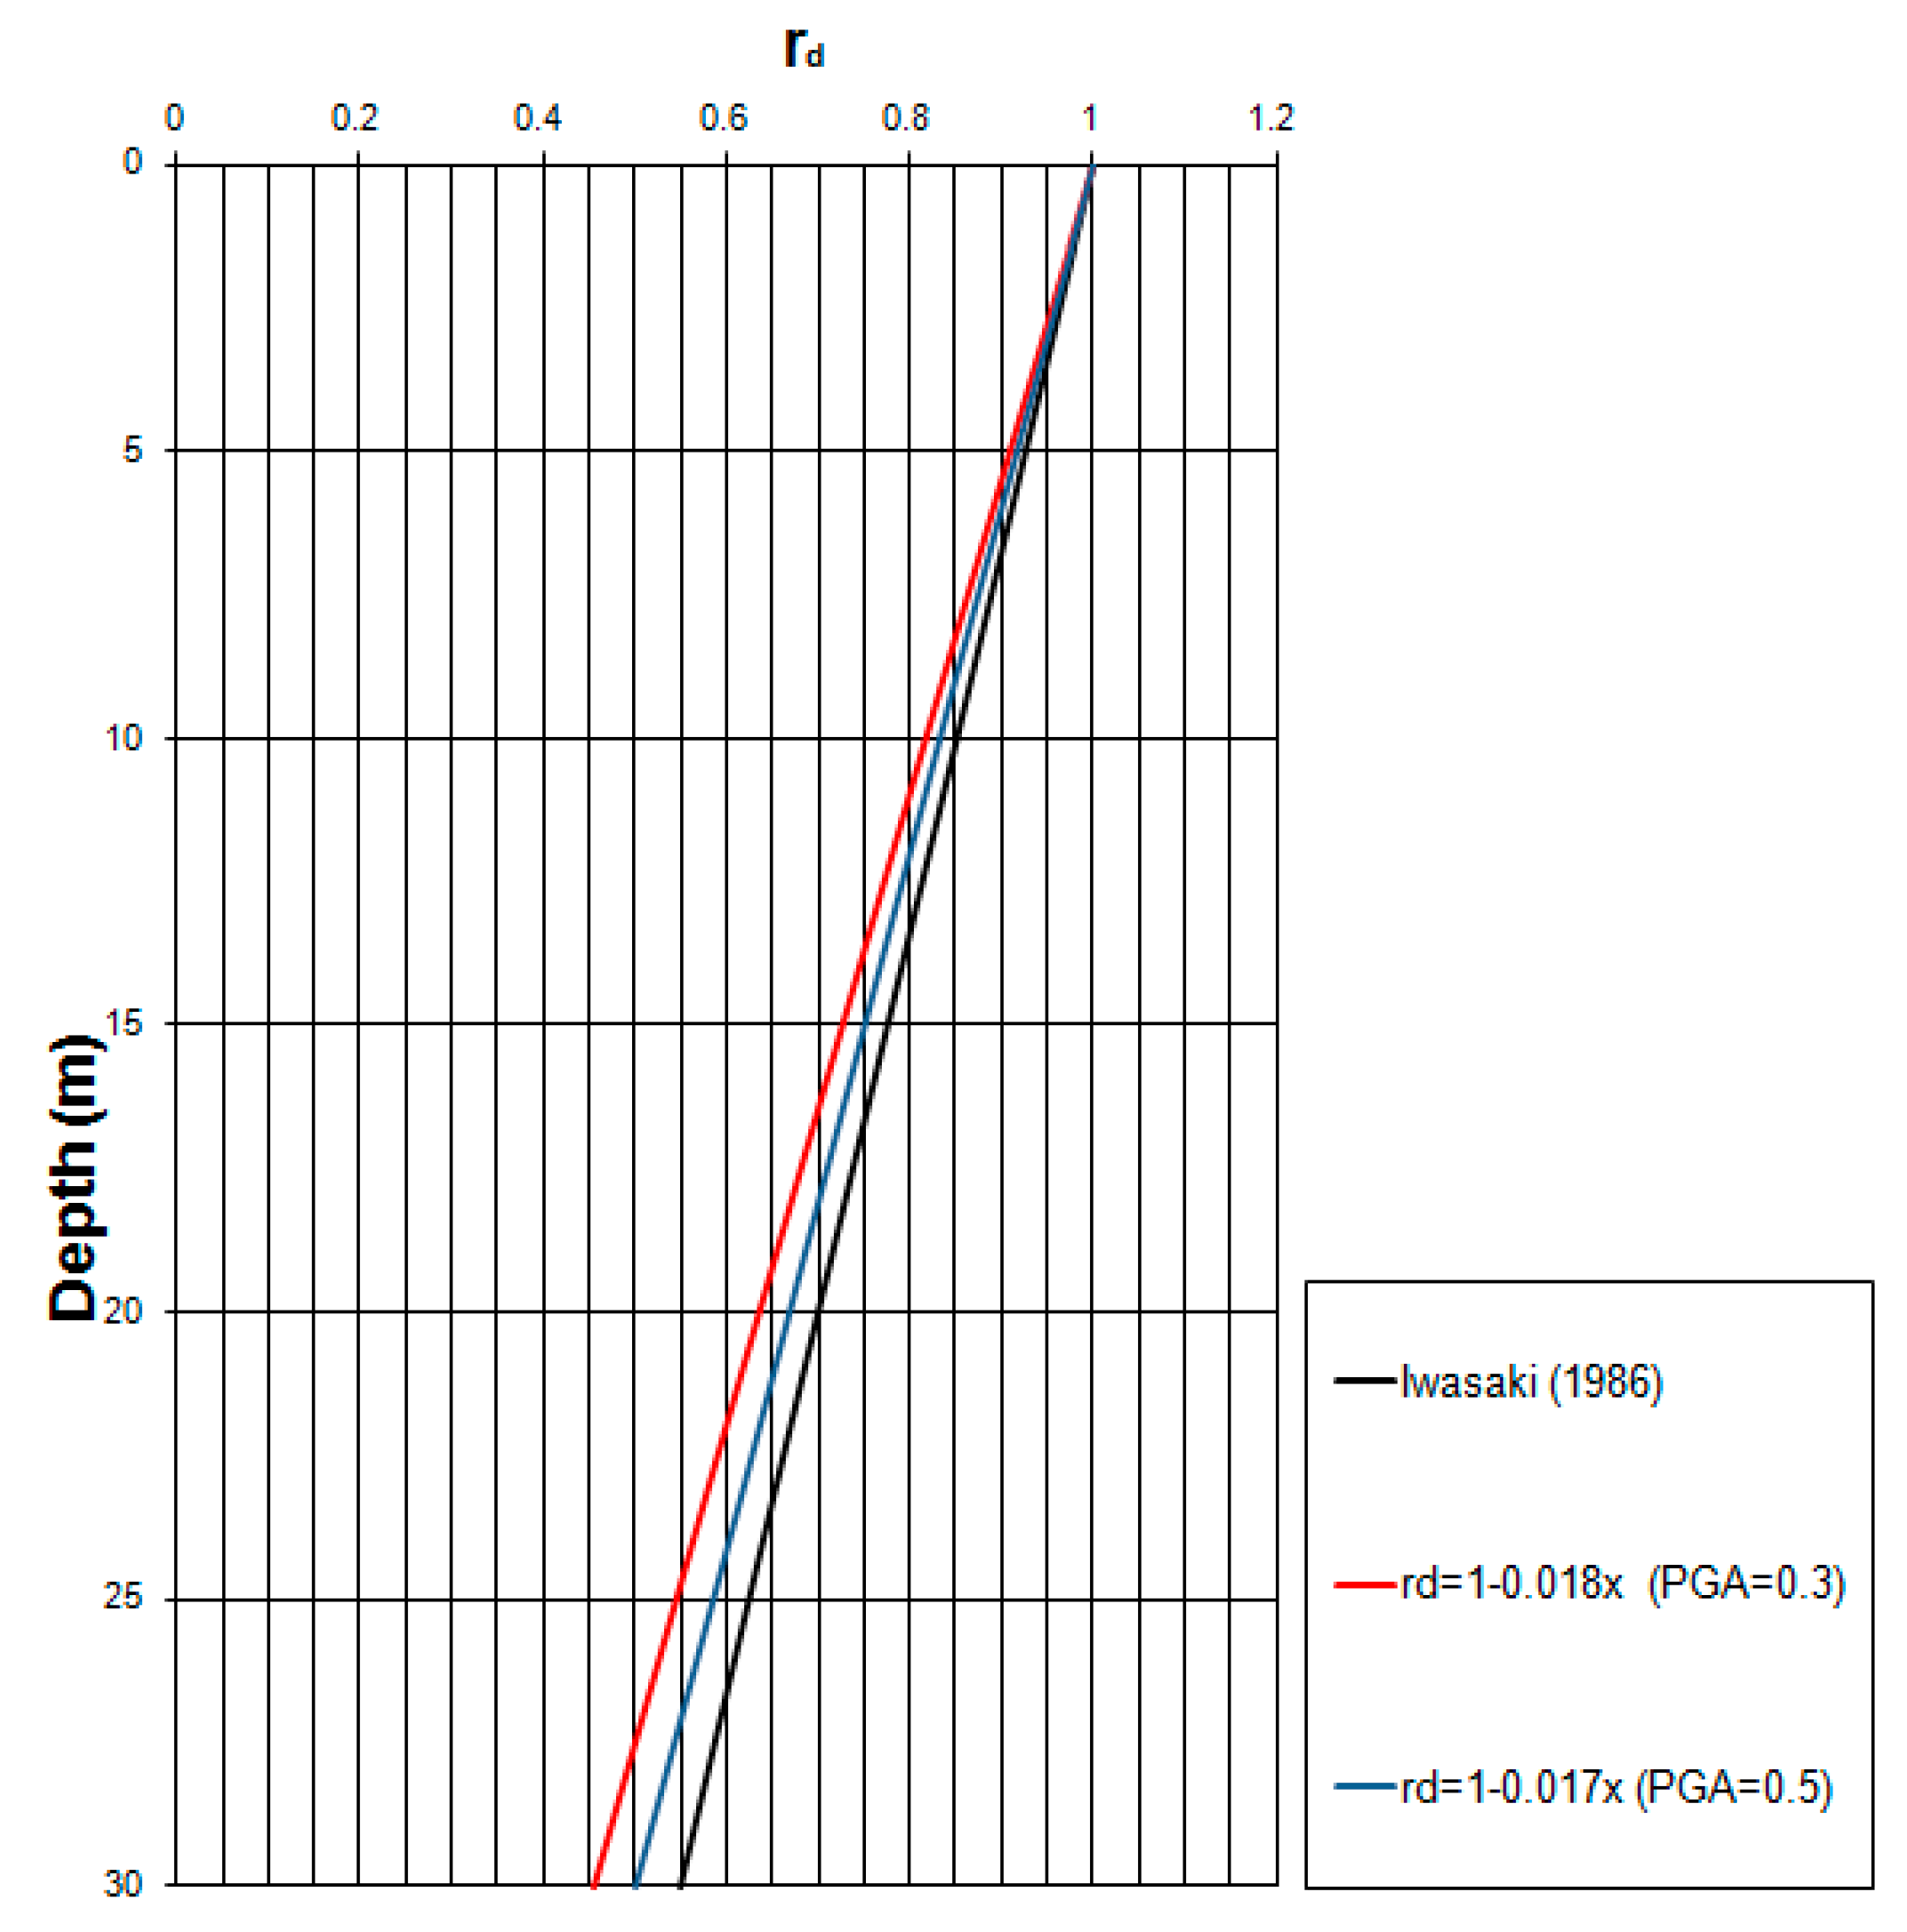
In the Figure 22, the rd relationships obtained for soil profiles of the Catania coastal area are compared to the relationship previously proposed by Iwasaki [16]. As can be seen from the chart, the latter provides slightly higher estimates of rd.
Moreover, the following two sets of equations can be used to estimate the average rd values, given in the Figure 20 and Figure 21, from the surface to a depth 30 m:
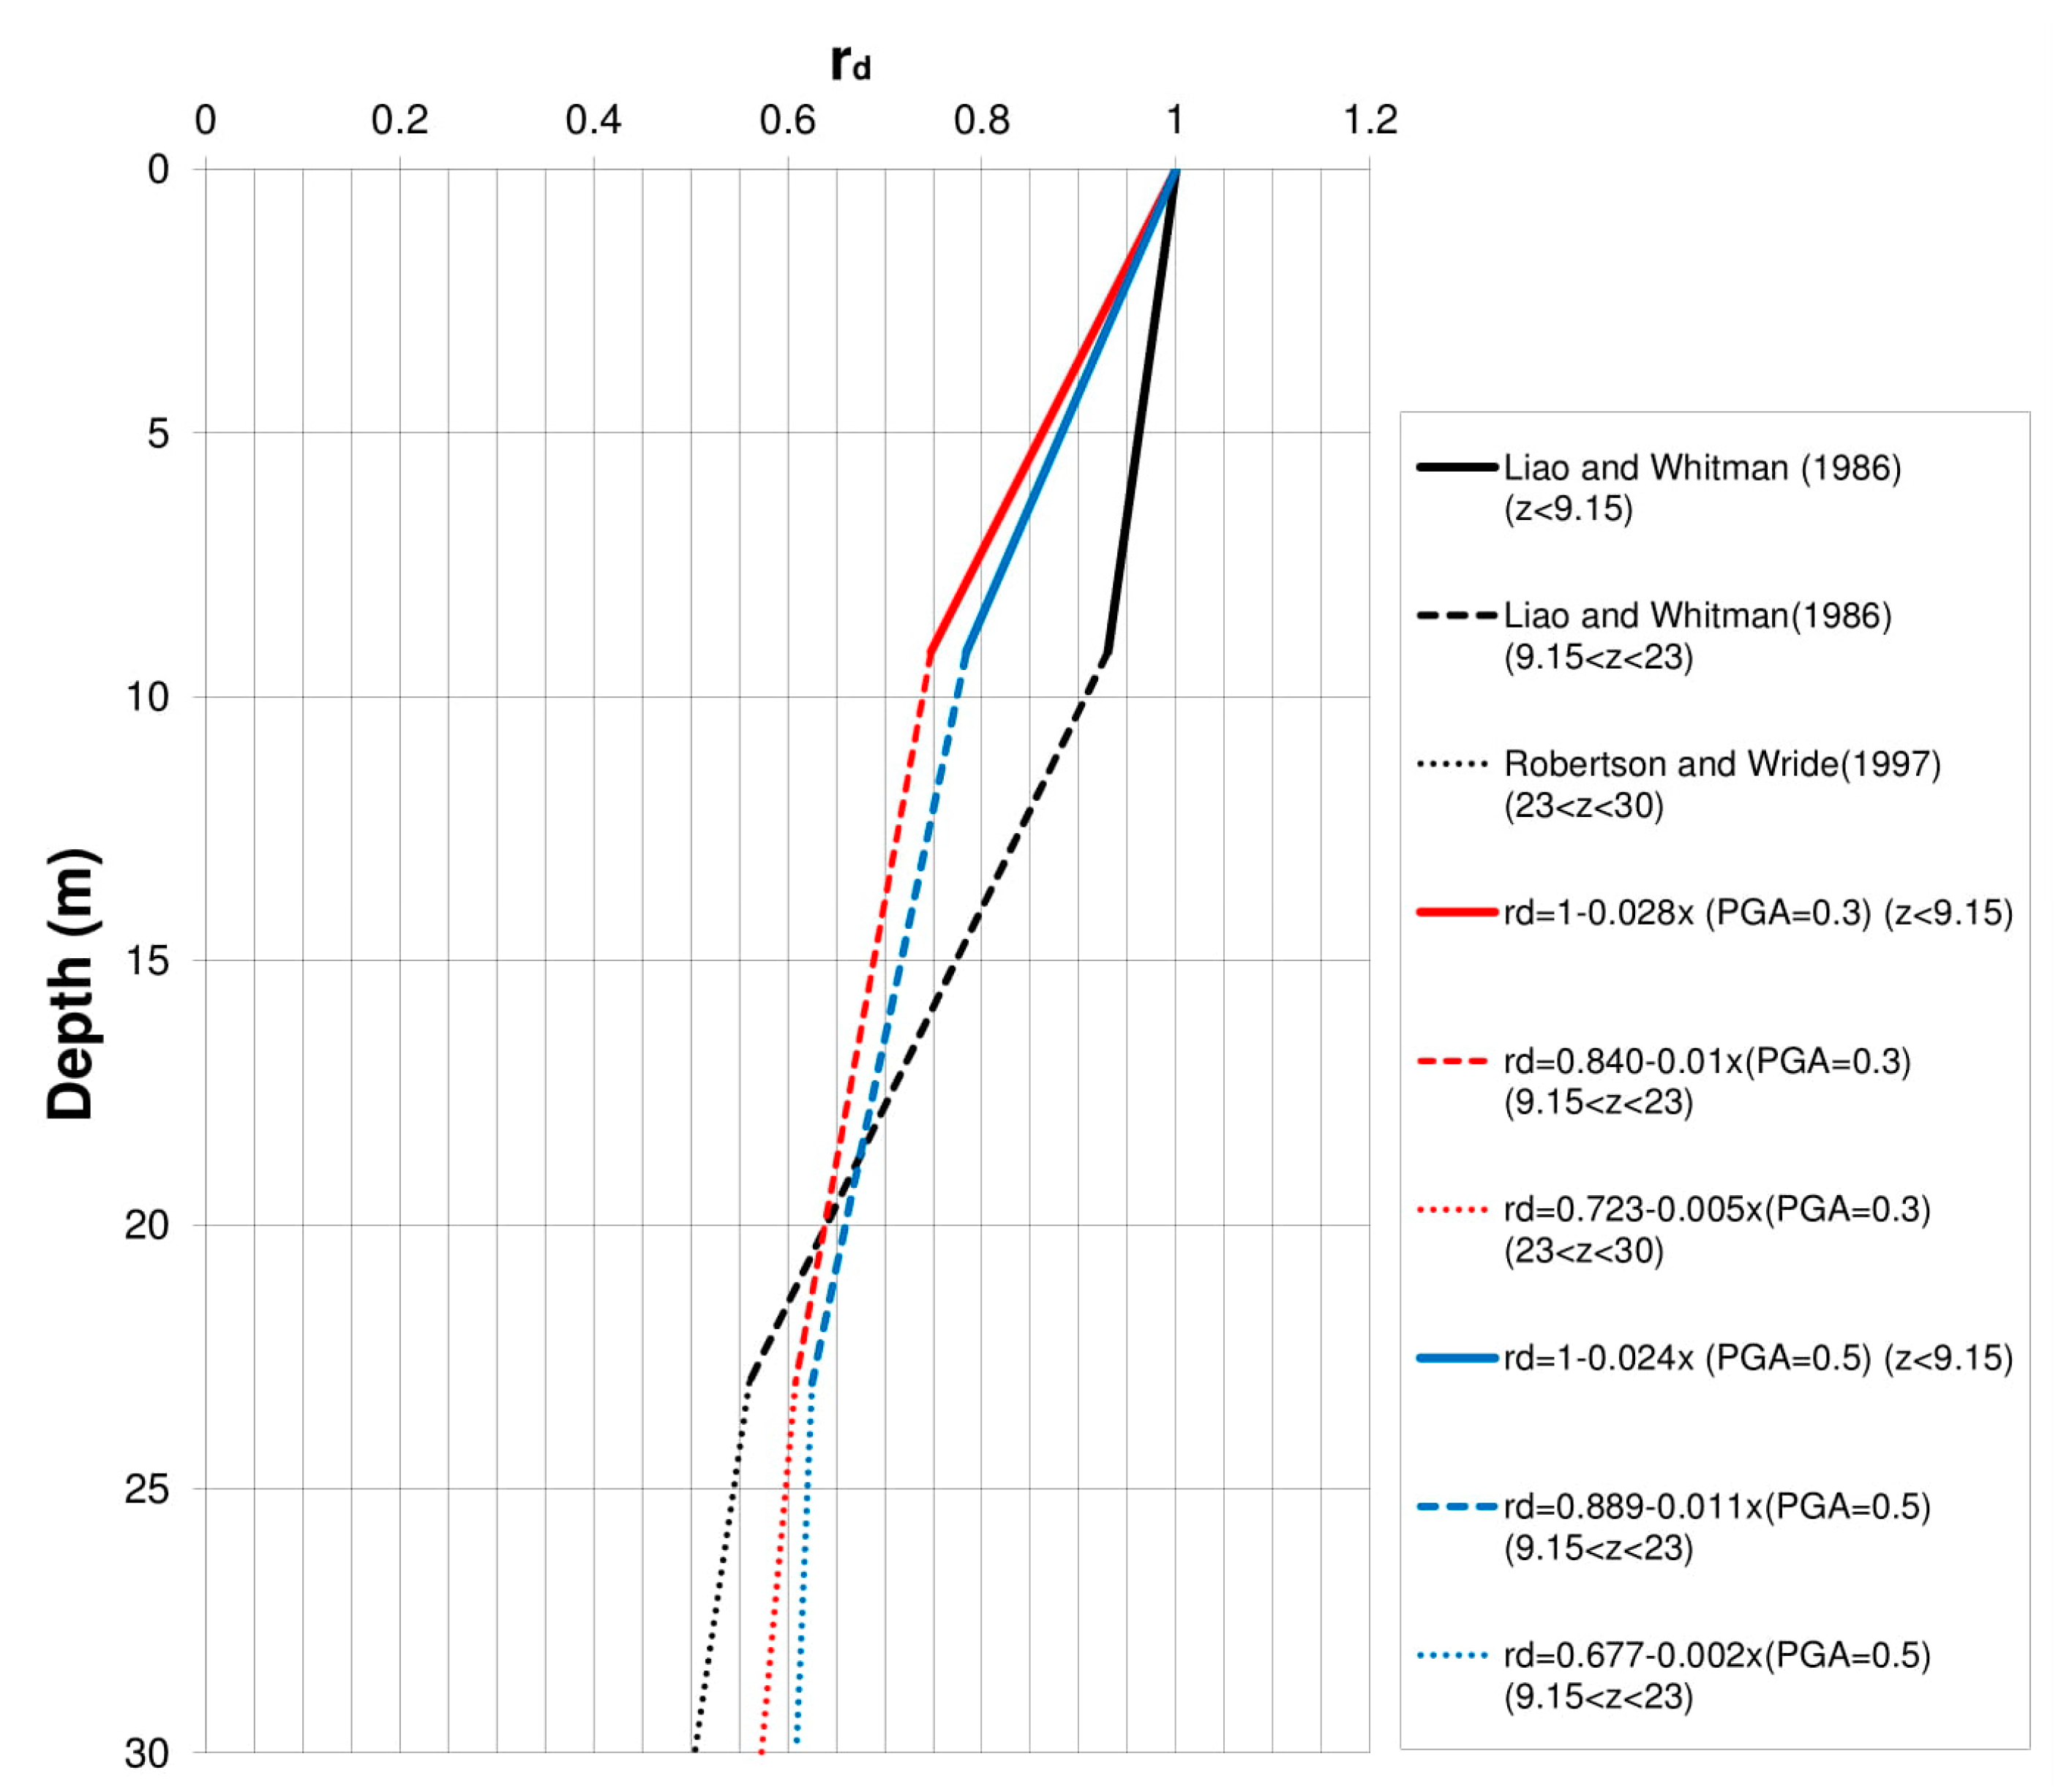
In the Figure 23, the suggested rd relationships are compared to relationships previously proposed by Liao and Whitman [13], and Robertson and Wride [14] from the chart of Seed and Idriss [12]. It is possible to observe that the rd proposal of Seed and Idriss [12] provides higher estimation of rd between 0 and 19 m.
Lastly, it is possible to notice that the Equations (14) and (16a–c) provide slopes of the straight lines slightly lower than that given by Equations (15) and (17a–c), respectively. This is due to the fact that during strong motion the soil tends to behave as non-linear.
6. Evaluation of Liquefaction Potential Using the Seismic Dilatometer Marchetti Tests (SDMTs) in the Catania Harbour (Italy)
The new rd relationships, more responsive to soil types examined, have been used for potential liquefaction evaluation in the Catania Harbour (Italy).
One way to quantify the potential for liquefaction is through the computation of the liquefaction resistance factor (FSL) profile given by the ratio of the cyclic resistance ratio CRR(z) to cyclic shear stress ratio CSR(z), where z is the depth of the deposit [54].
The cyclic shear stress ratio CSR is calculated by Equation (1). Moreover, the stress-based analysis framework includes a magnitude scaling factor (MSF). It allows to adjust the induced CSR during earthquake magnitude M to an equivalent CSR for an earthquake magnitude M = 7.5.
According to Youd et al. [7], the MSF is given by the following expression:
The cyclic resistance ratio CRR is commonly evaluated using empirical correlations with SPT and CPT. However, the latter are relatively insensitive to some factors that can influence the liquefaction resistance such as ageing, stress history, overconsolidation, and horizontal earth pressure coefficient. Instead, the dilatometer test could take better account of these factors in the evaluation of liquefaction resistance [55].
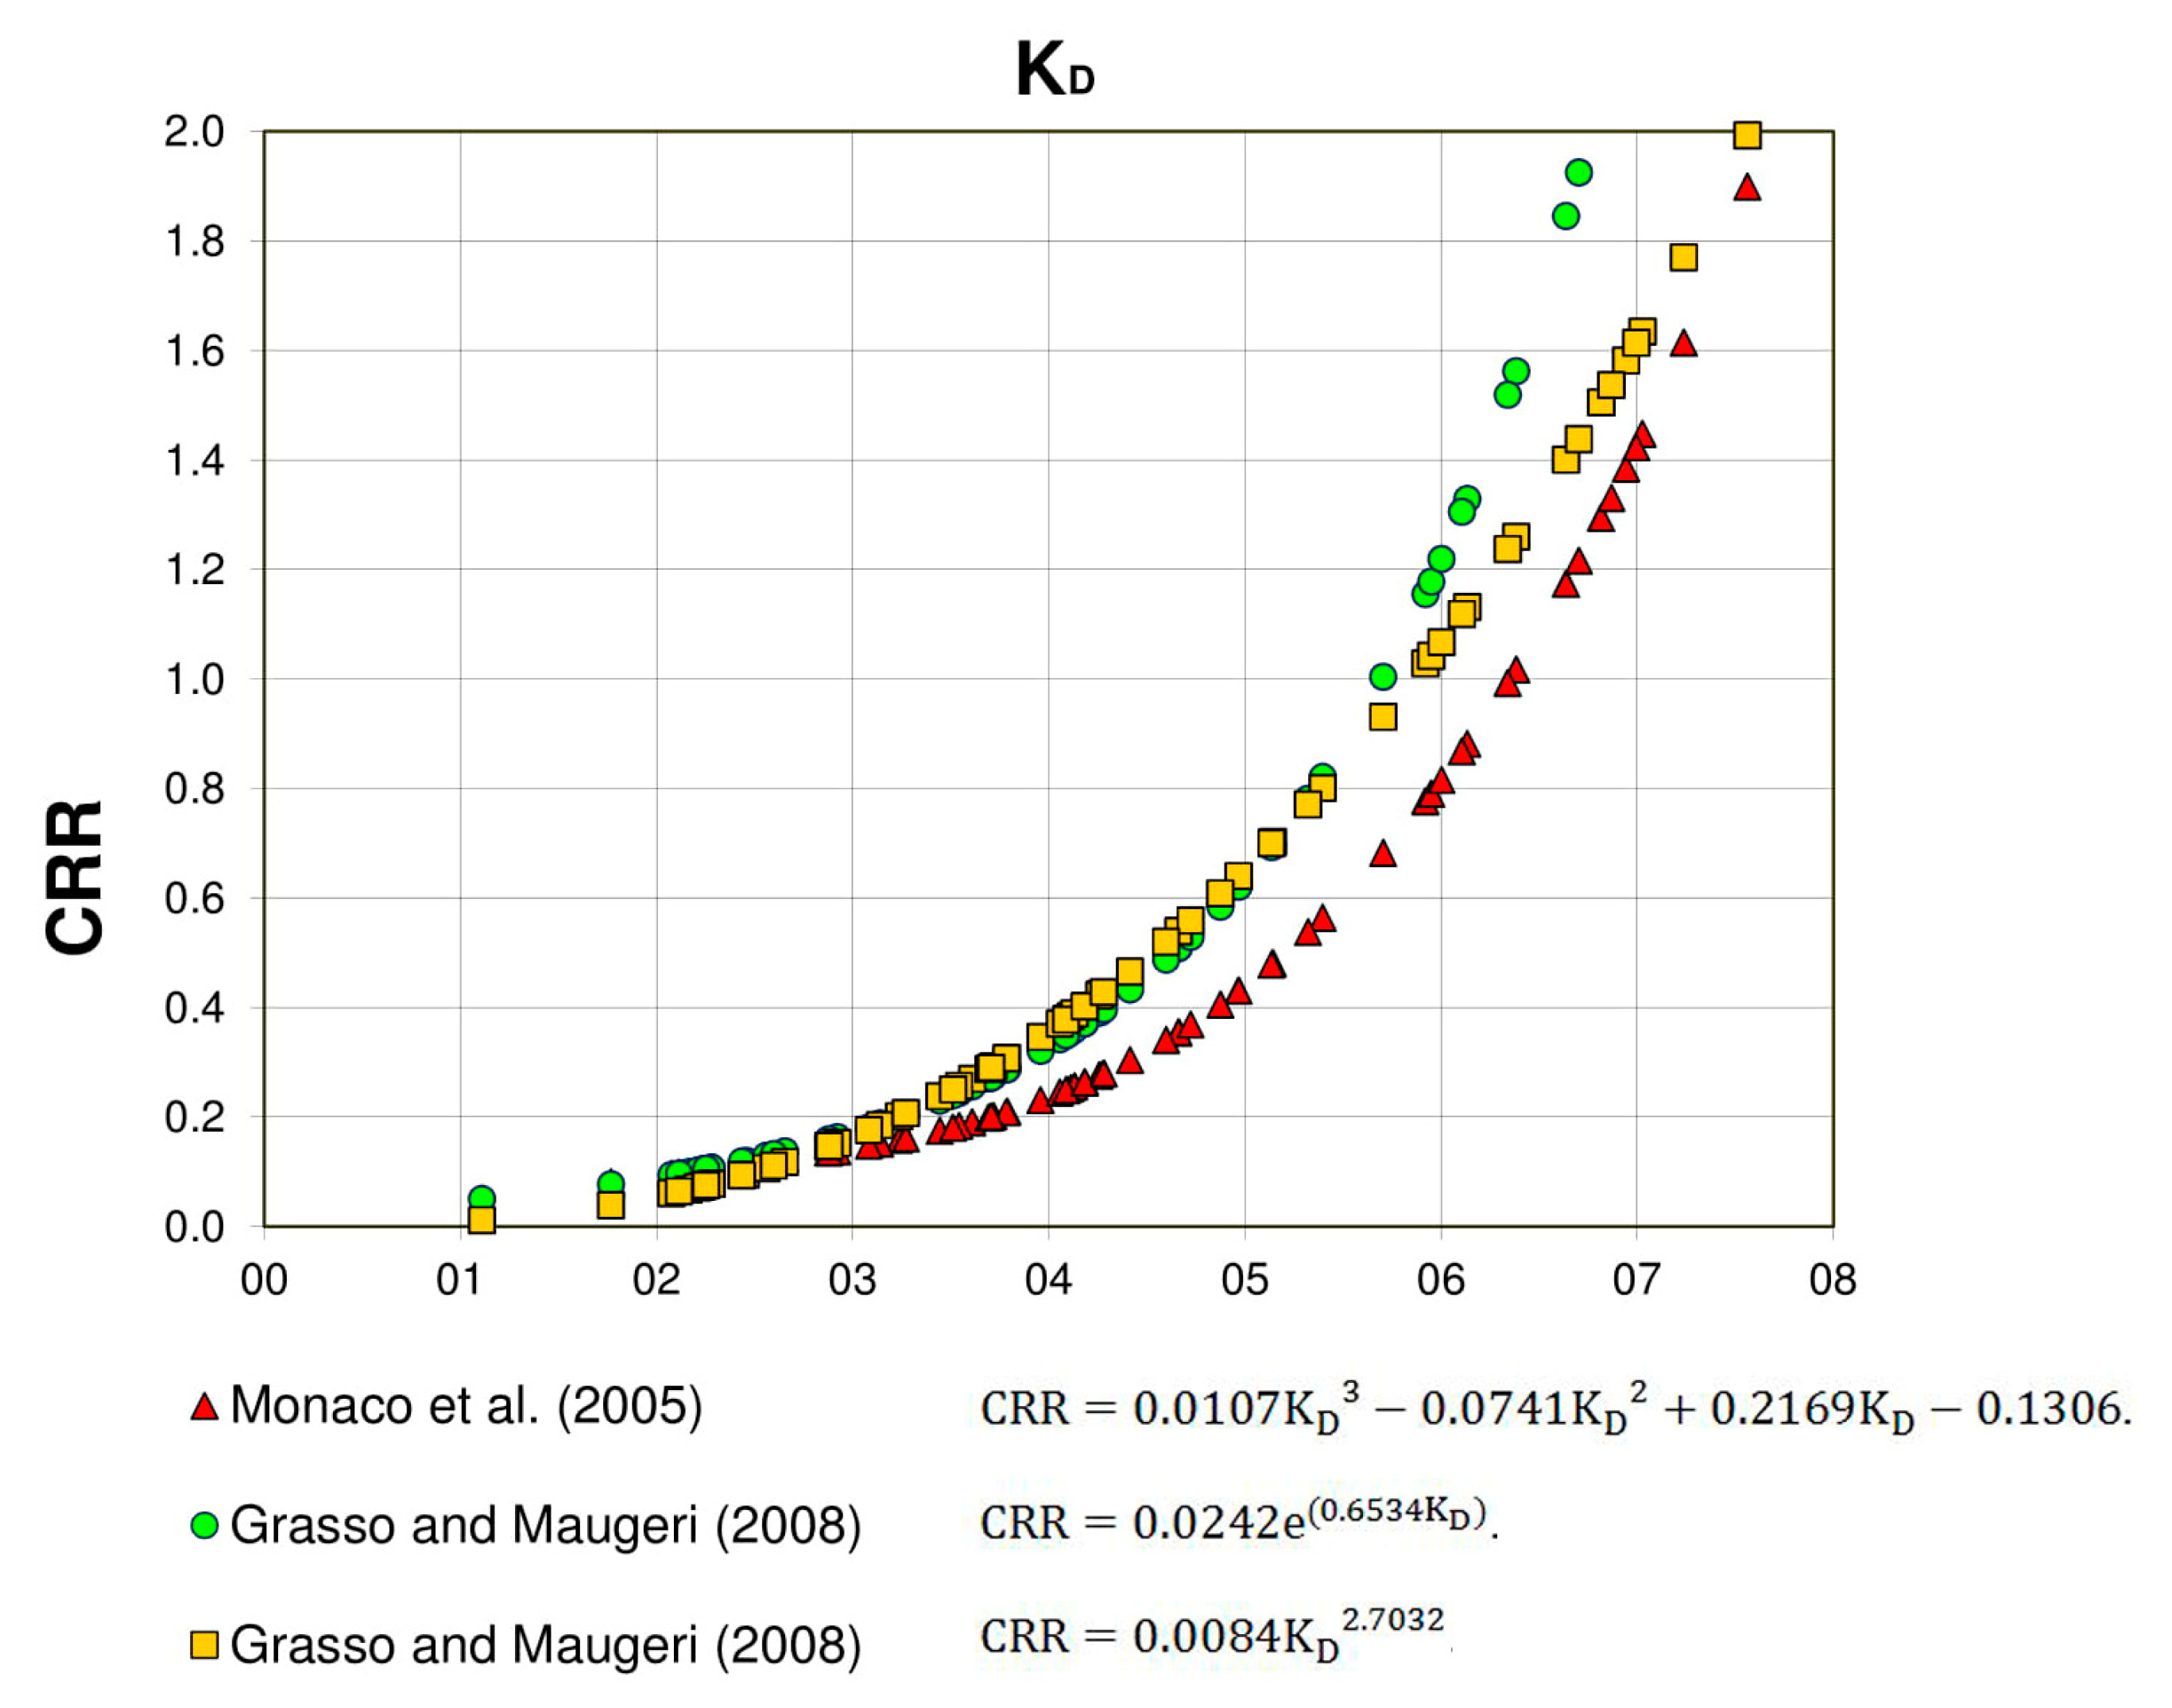
Marchetti [56] and later studies suggested that the horizontal stress index from DMT is a suitable parameter to evaluate the liquefaction resistance of sands [8]. In this paper three CRR-KD curves, approximated by the Equations (19)–(21), have been used.
The Equation (19) was proposed by Monaco et al. [57] and the Equations (20) and (21) were developed by Grasso and Maugeri [8].
Then it is possible to evaluate the liquefaction potential index (LPI). The LPI, proposed by Iwasaki et al. [58], provides a depth-weighted index of the potential for triggering of liquefaction at a site [59]. It is computed as:
where:
According to Iwasaki et al. [60], the level of liquefaction severity with respect to LPI is given in Table 2.
In this paper, the procedure described above has been applied to the 5 SDMTs date available in the Catania Harbour area (Figure 10).
To evaluate the CSR, the results obtained from the site response analysis using scaled seismograms of 1693 to the maximum PGA of 0.3 g have been taken. The values of the surface maximum accelerations, i.e., for PT1R3 seismogram, are reported in Table 3.
Thus, it has been decided to choose the values of 0.4g and 0.5g for the peak horizontal acceleration at the ground surface amax. The stress reduction coefficient rd and the magnitude scaling factor MSF have been given by the Equations (17a,b) and (18), respectively, and the values of the other parameters have been taken from the SDMTs date.
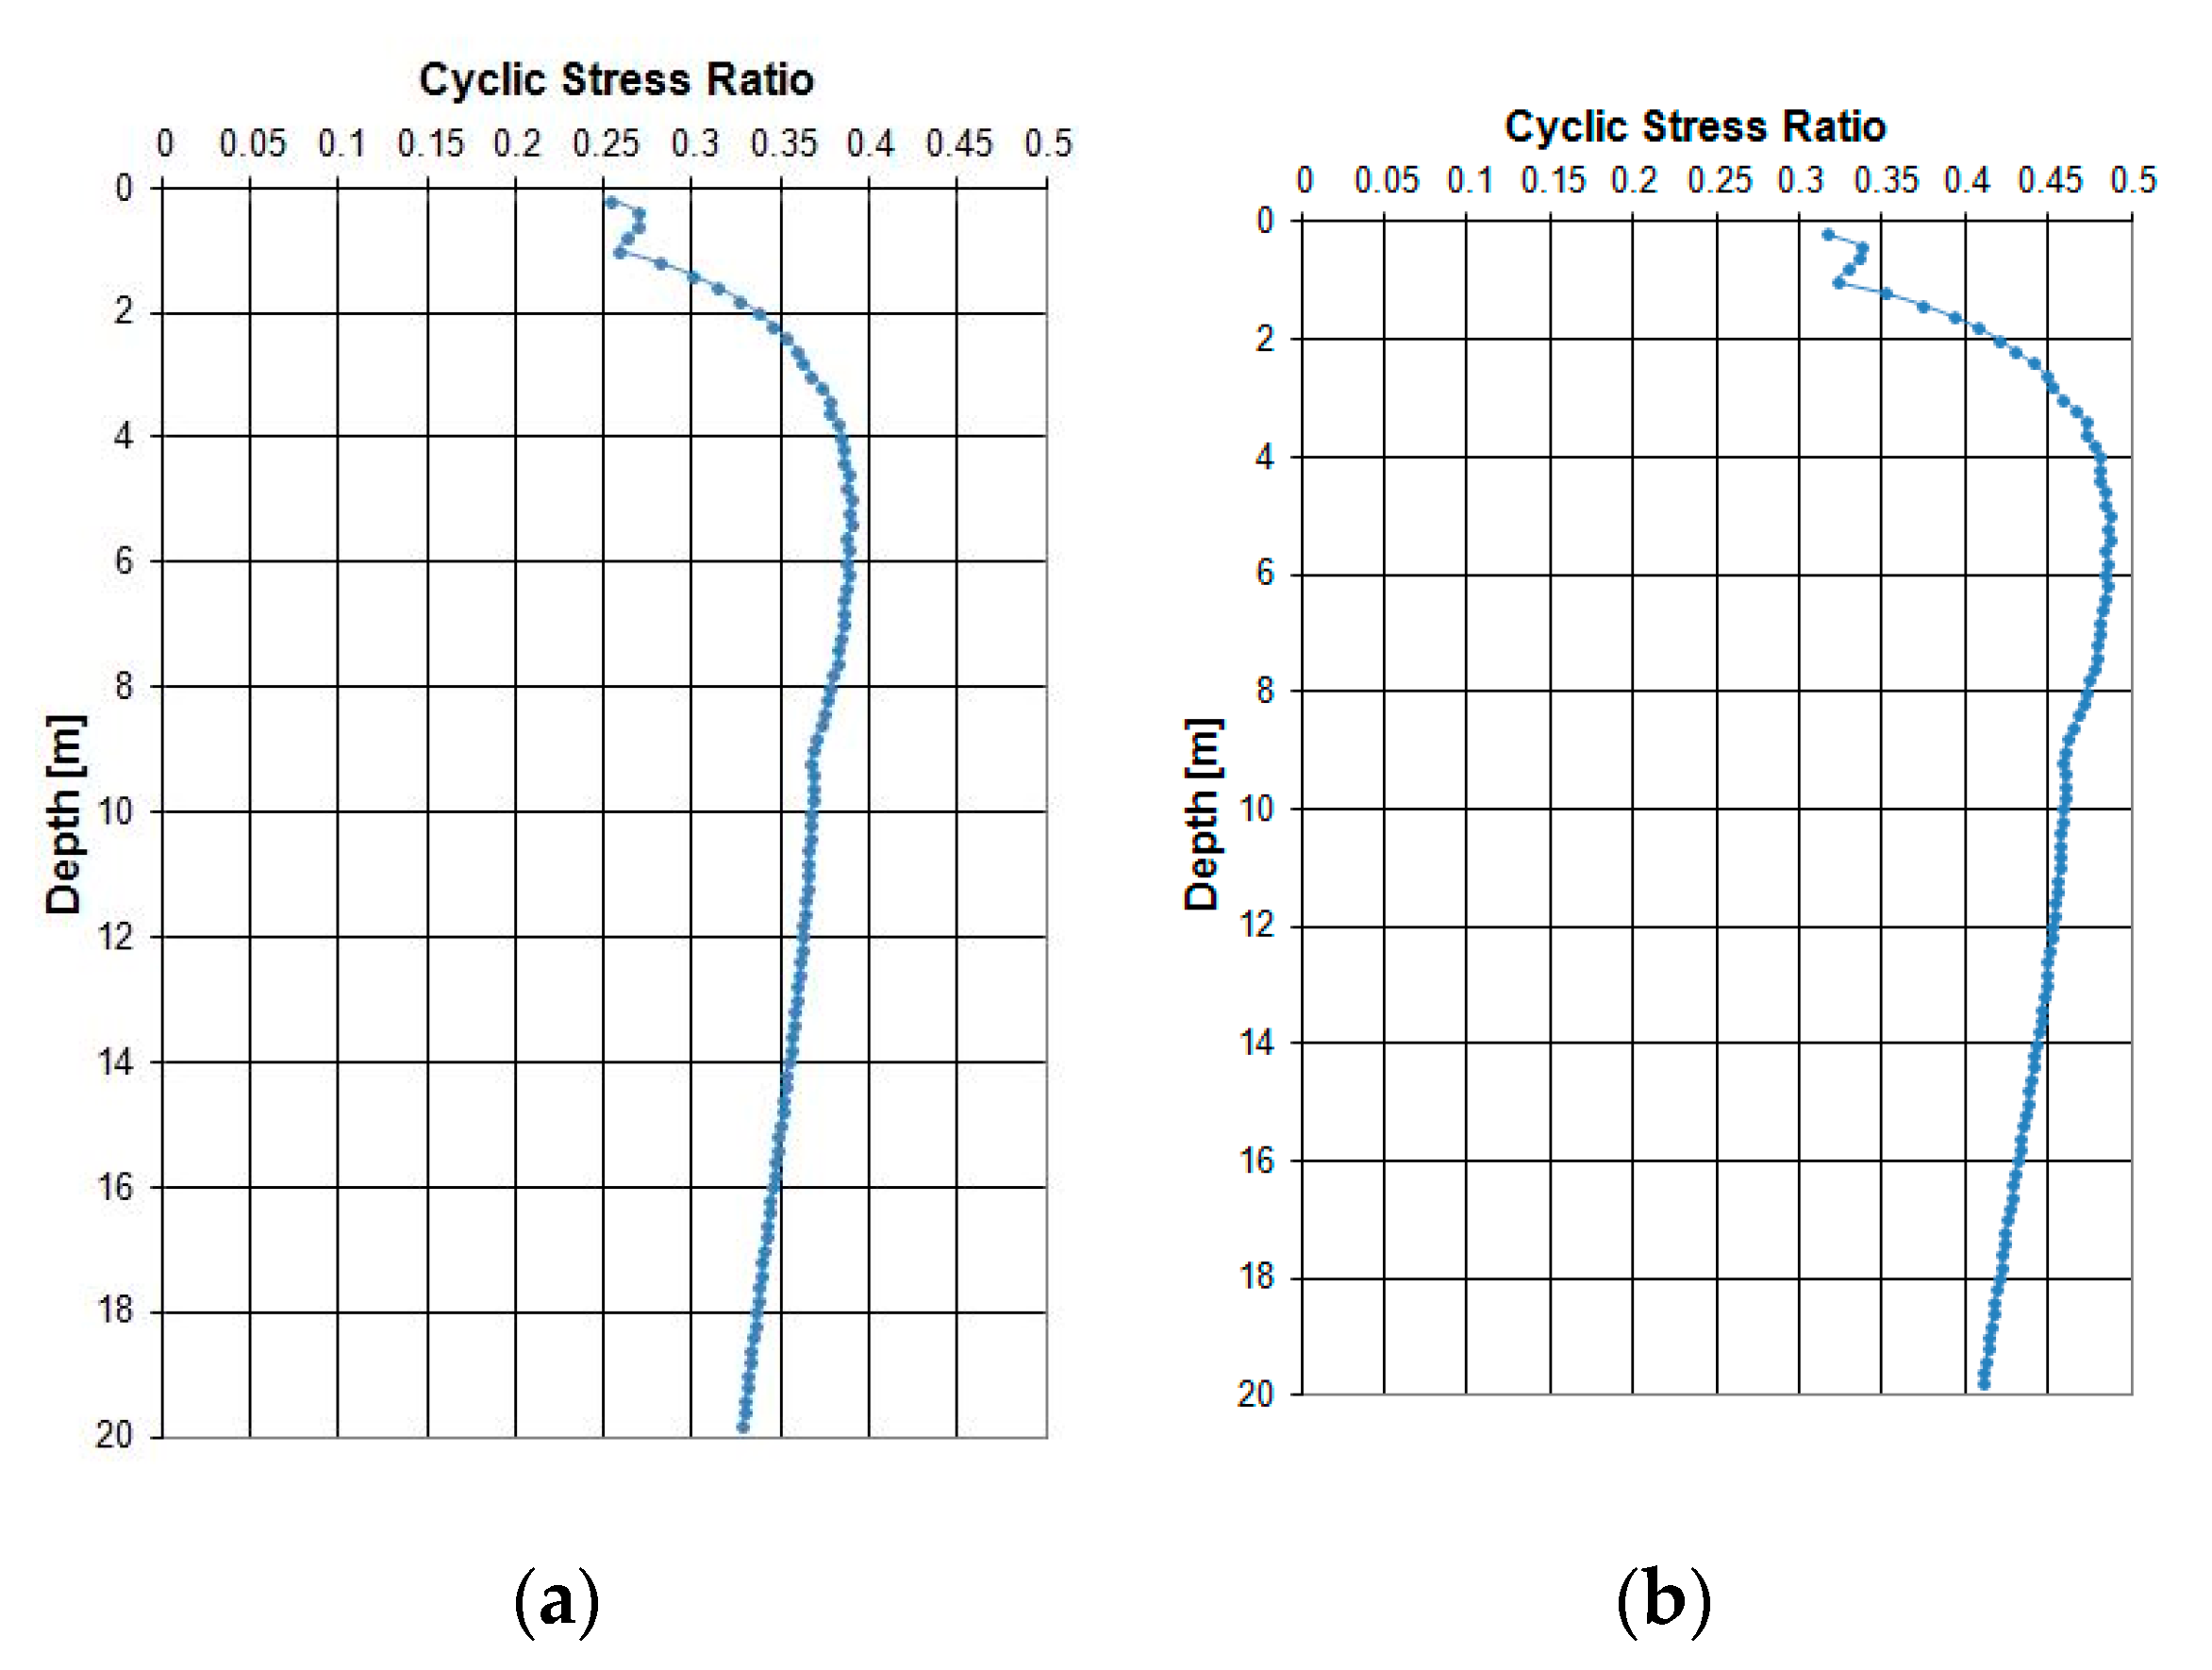
Typical CSR profiles obtained i.e., for SDMT2 are shown in Figure 24.
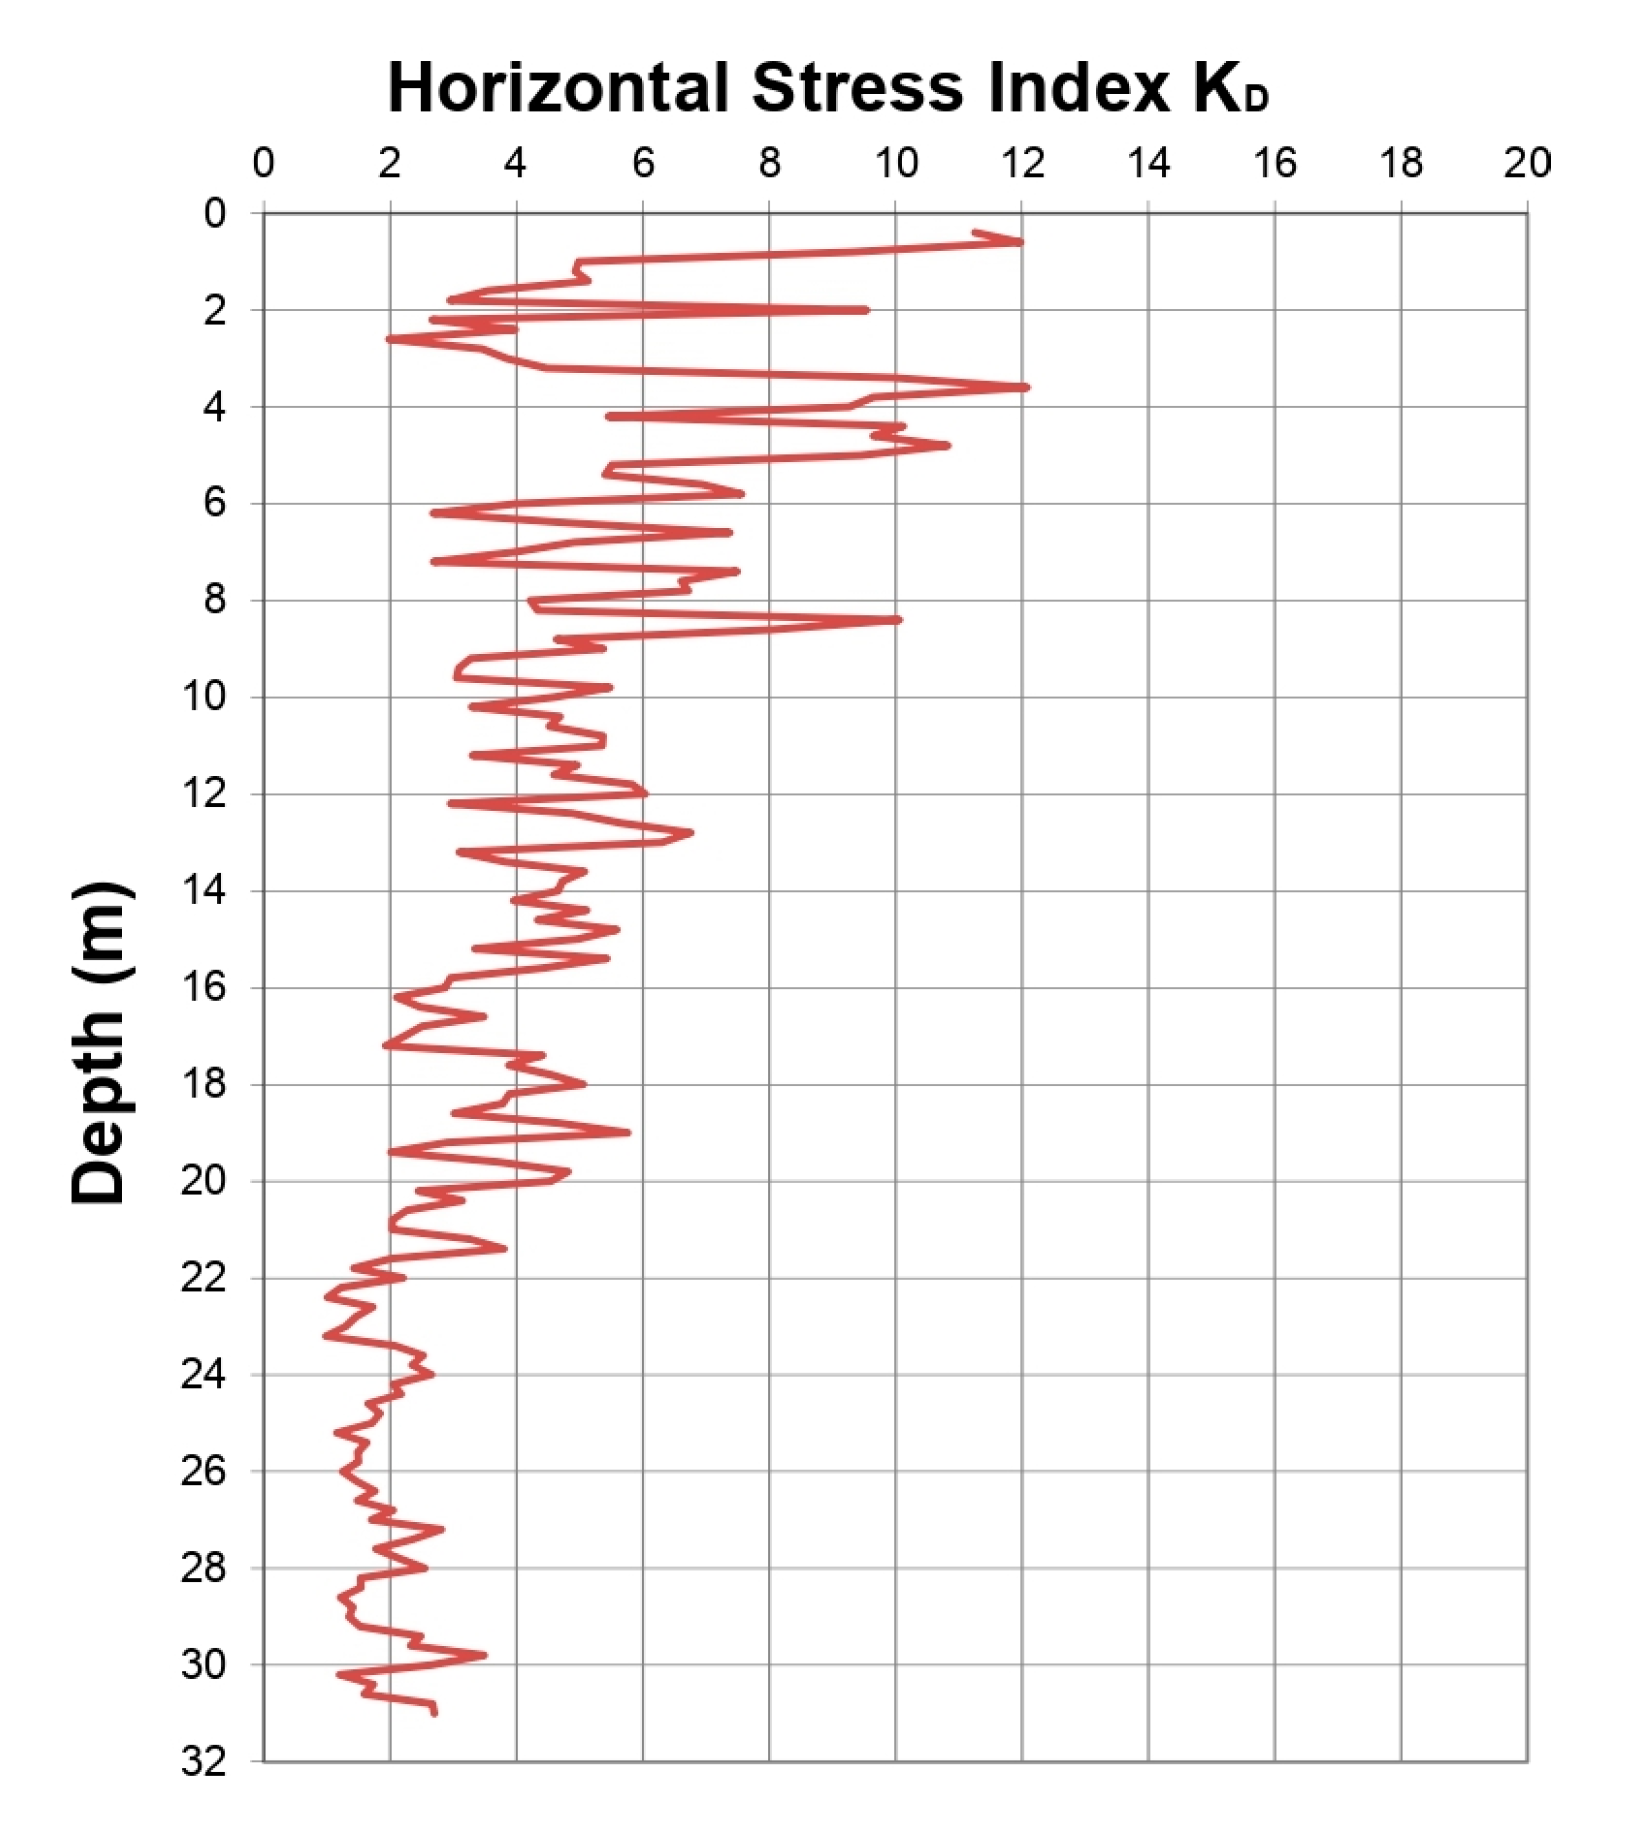
The CRR-KD curves, approximated by Equations (19)–(21), and the horizontal stress index KD of the 5 SDMTs have been used. Values of KD versus depth for SDMT4, as example, are shown in Figure 25.
The Figure 26 shows the CRR-KD trends i.e., for SDMT2.
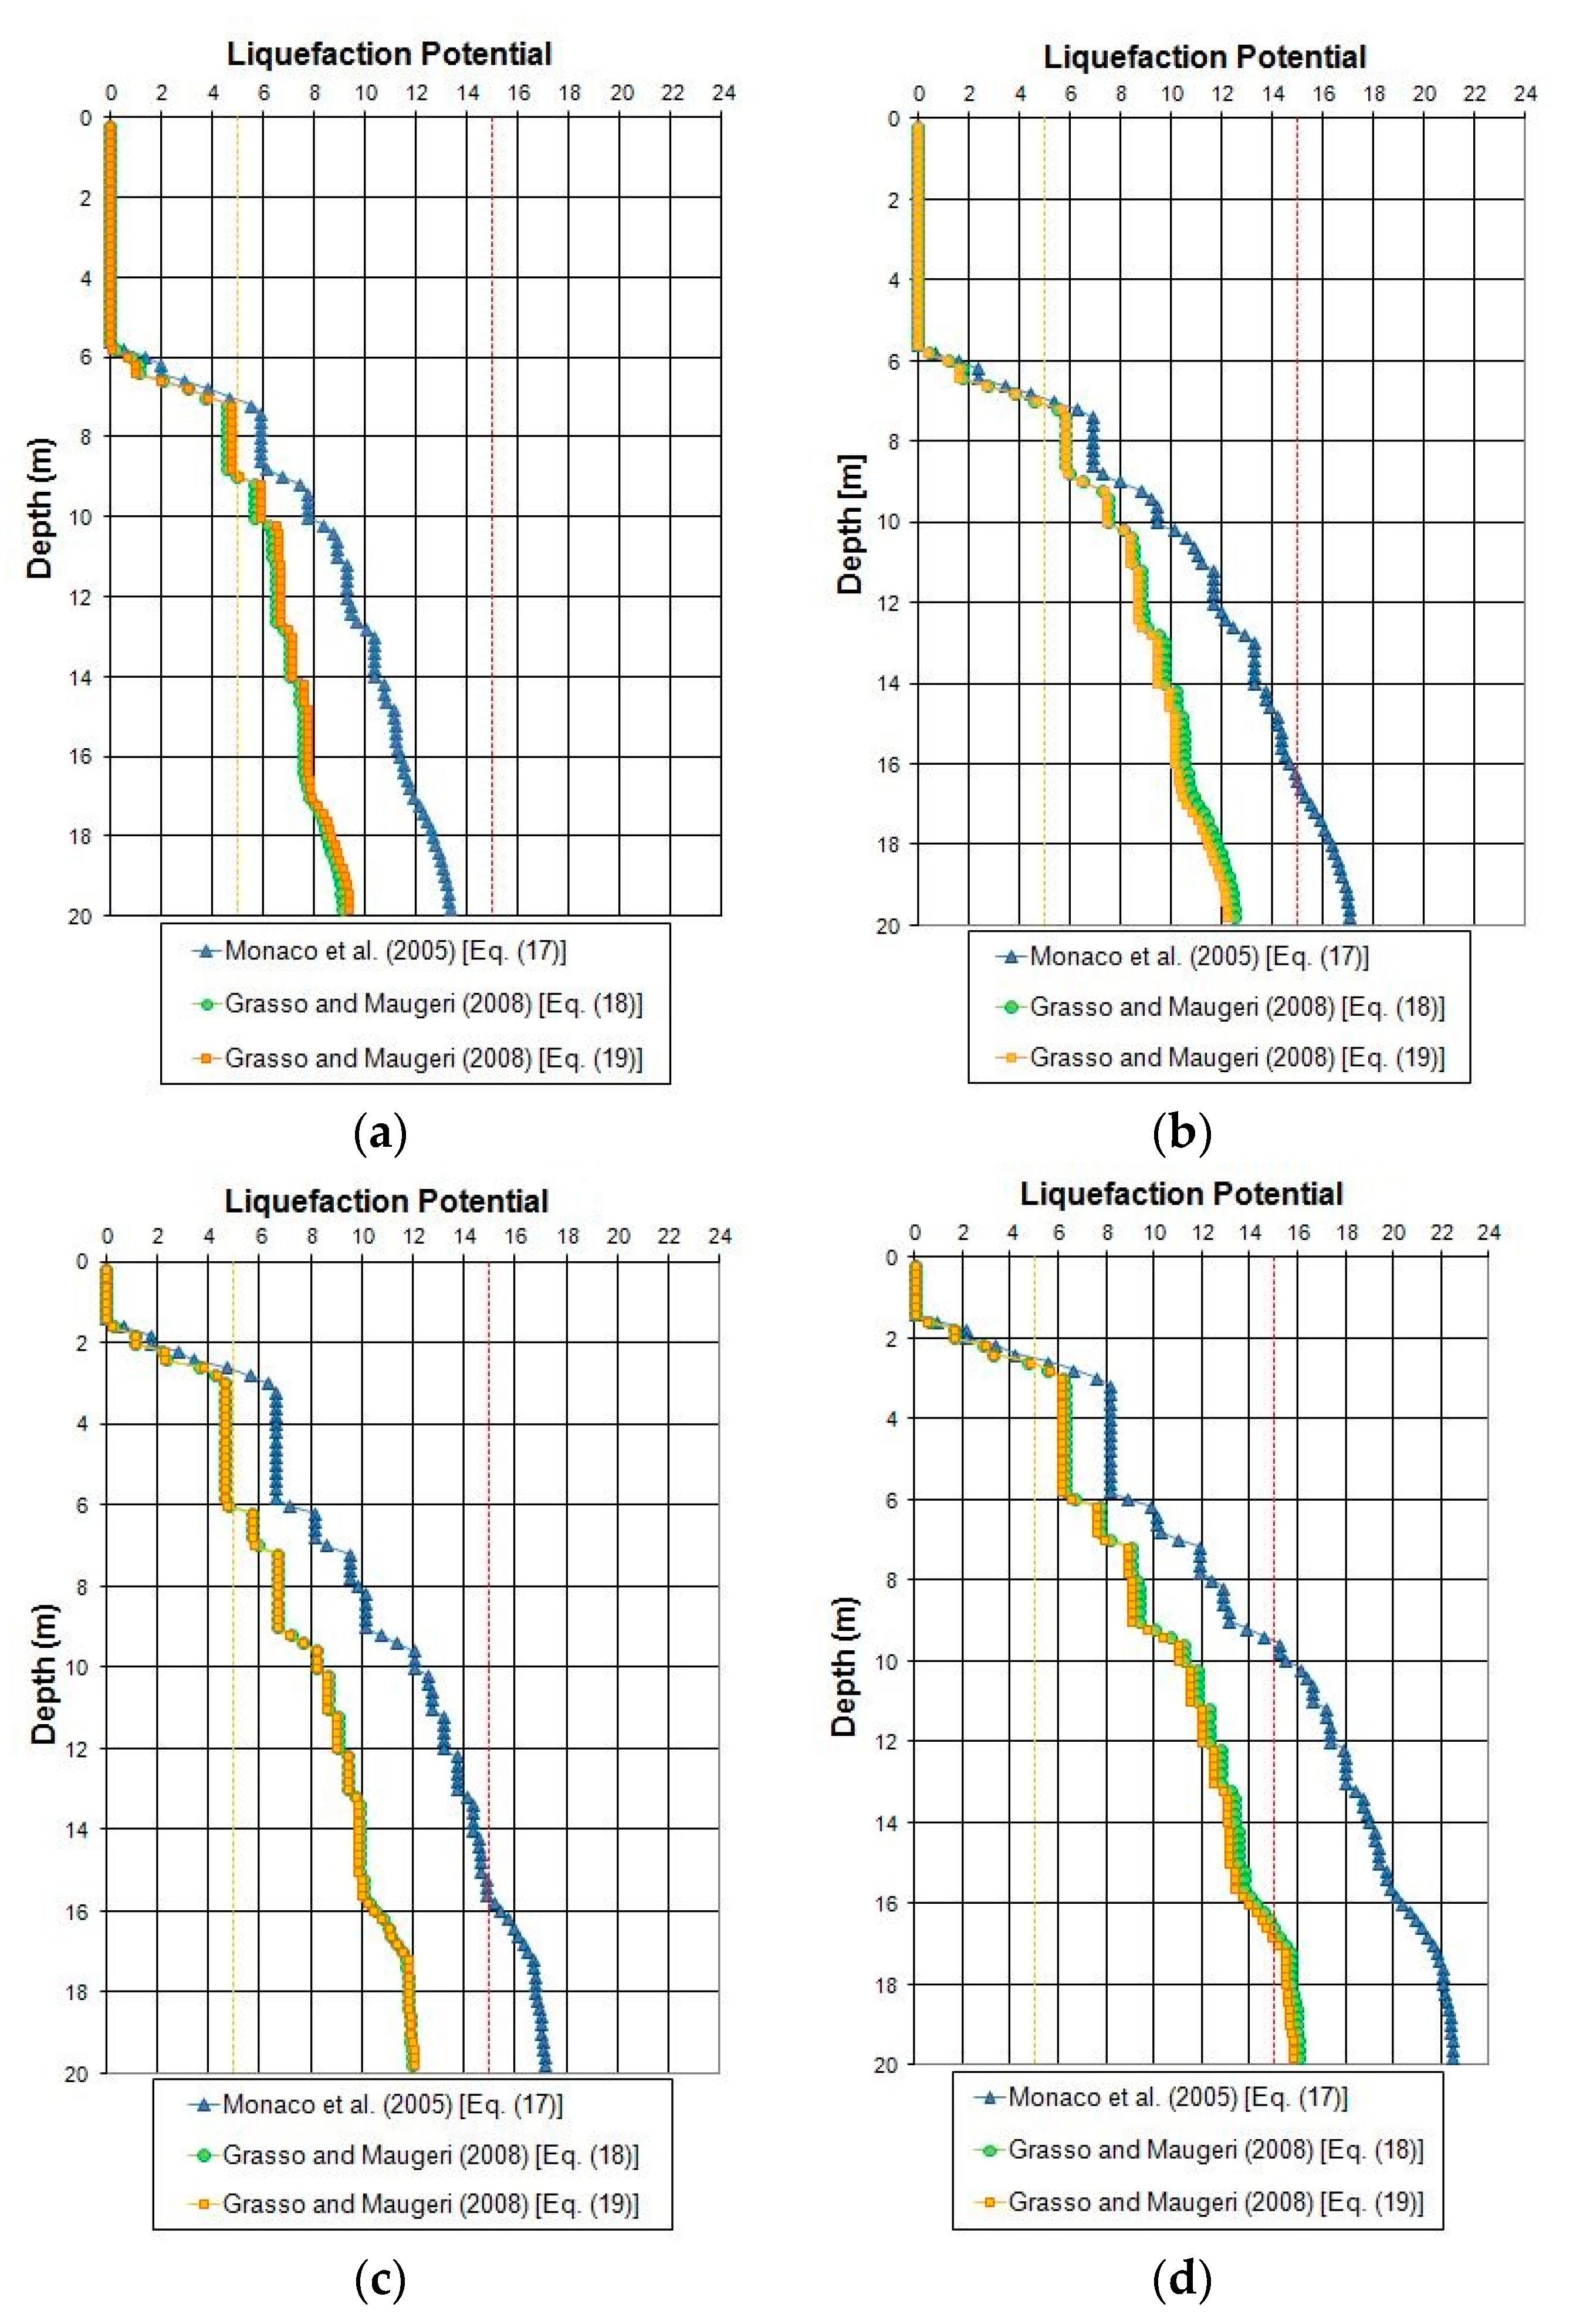
The liquefaction potential values obtained from SDMT2 and SDMT4 by Equation (22) are reported in Figure 27.
Based on the results obtained by the SDMT4, the LPI value is higher than 5 (high liquefaction potential) at the depth of about 3 m; while the results obtained by SDMT2 show a high liquefaction potential from the depth of about 7 m.
The liquefaction potential index at the depth of 20 m for the 5 SDMTs is summarized in Table 4.
It is possible to observe that the results obtained from the three CRR-KD curves are in good agreement and the level of liquefaction severity is generally high. However, lower LPI values are obtained from the SDMT5 and higher values from the SDMT4. Furthermore, results demonstrate that the ground acceleration is a crucial parameter in the evaluation of liquefaction potential: a 0.1g increase of amax produces a rise of about 25–50% in LPI.
7. Conclusions
In this paper, new variations of rd with depth have been obtained from equivalent-linear site response analyses performed on different profiles representative of eastern coastal plain of Catania area. To evaluate the soil profiles and the geotechnical characteristics, in situ and laboratory tests were performed.
Two different charts were determined analytically using a seismogram of 1818 and three seismograms of 1693 with PGA of 0.3g and 0.5g as input motion. The dashed range represents the range of rd values and the dashed line represents the recommended values of rd from the surface to a depth of 30 m.
Average values can be approximated by Equations (14), (15), (16a–c) and (17a–c).
Comparing the relationships obtained in this study to the relationships previously proposed by Iwasaki, Liao and Whitman and Robertson and Wride, it is possible to notice that the values of rd obtained here are lower.
This work has been used for the potential liquefaction evaluation in Catania Harbour because the new rd relationship is more responsive to soil type examined. The findings can be summarized as follows:
- (1)
- The results obtained from the three CRR-KD curves are in good agreement. However, it is possible to observe that the equation developed by Monaco provides LPI values slightly larger than those obtained from the equations proposed by Grasso and Maugeri;
- (2)
- The results show a high liquefaction potential from the depth of about 3–7 m;
- (3)
- Lower values of the liquefaction potential index are obtained from the SDMT4 and higher values from the SDMT3;
- (4)
- Finally, results demonstrate that the peak horizontal acceleration at the ground surface amax is an important parameter in the evaluation of liquefaction potential.
Author Contributions
Data curation, M.S.V.S.; methodology, S.G.; supervision, M.R.M. All authors have read and agreed to the published version of the manuscript.
Funding
This research work was funded by the MIUR (Ministry of Education, Universities and Research [Italy]) through the project entitled “eWAS: an early WArning System for cultural—heritage” (Project code: ARS01_00926/CUP J66C18000390005), financed with the PNR 2015-2020 (National Research Program).
Conflicts of Interest
The authors declare no conflict of interest.
References
- Seed, R.B.; Cetin, K.O.; Moss, R.E.S.; Kammerer, A.M.; Wu, J.; Pestana, J.M.; Reimer, M.F. Recent advances in soil liquefaction engineering and seismic site response evaluation. In Proceedings of the 4th International Conference and Symposium on Recent Advances in Geotechnical Earthquake Engineering and Soil Dynamics, San Diego, CA, USA, 31 March 2001. [Google Scholar]
- Marcuson, W.F. Definition of terms related to liquefaction. J. Geotech. Engrg. Div. 1978, 104, 1197–1200. [Google Scholar]
- Boulanger, R.W.; Idriss, I.M. CPT and SPT Based Liquefaction Triggering Procedures; Report No. UCD/CGM-14/01; Center for Geotechnical Modeling, Department of Civil and Environmental Engineering, College of Engineering, University of California: Davis, CA, USA, 2014. [Google Scholar]
- Boulanger, R.W.; Idriss, I.M. CPT-based liquefaction triggering procedure. J. Geotech. Geoenvir. Eng. 2015, 142, 2. [Google Scholar] [CrossRef]
- Cetin, K.O.; Seed, R.B. Nonlinear shear mass participation factor (rd) for cyclic shear stress ratio evaluation. Soil Dyn. Earthq. Eng. 2004, 24, 103–113. [Google Scholar] [CrossRef]
- Idriss, I.M.; Boulanger, R.W. Semi-empirical procedures for evaluating liquefaction potential during earthquakes. In Proceedings of the 11th IC SDEE/3rd ICEGE Proceedings, Berkeley, CA, USA, 7–9 January 2004; Volume 1, pp. 32–56. [Google Scholar] [CrossRef]
- Youd, T.L.; Idriss, I.M.; Andrus, R.D.; Arango, I.; Castro, G.; Christian, J.T.; Dobry, R.; Finn, W.D.L.; Harder, L.F.; Hynes, M.E.; et al. Liquefaction Resistance of Soils: Summary Report from the 1996 NCEER and 1998 NCEER/NSF Workshops on Evaluation of Liquefaction Resistance of Soils. J. Geotech. Geoenviron. Eng. 2001, 127, 817–833. [Google Scholar] [CrossRef] [Green Version]
- Grasso, S.; Maugeri, M. The Seismic Dilatometer Marchetti Test (SDMT) for Evaluating Liquefaction Potential under Cyclic Loading. In Proceedings of the IV Geotechnical Earthquake Engineering and Soil Dynamic, Sacramento, CA, USA, 18–22 May 2008; ISBN 978-0-7844-0975-6. [Google Scholar]
- Maugeri, M.; Grasso, S. Liquefaction potential evaluation at Catania Harbour (Italy). Wit Trans Built Environ. 2013, 1, 69–81. [Google Scholar] [CrossRef] [Green Version]
- Guidoboni, E.; Ferrari, G.; Mariotti, D.; Comastri, A.; Tarabusi, G.; Sgattoni, G.; Valensise, G. CFTI5Med, Catalogue of Strong Earthquakes in Italy (461 B.C.-1997) and Mediterranean Area (760 B.C.-1500). INGV 2018. [Google Scholar] [CrossRef]
- Guidoboni, E.; Ferrari, G.; Tarabusi, G.; Sgattoni, G.; Comastri, A.; Mariotti, D.; Ciuccarelli, C.; Bianchi, M.G.; Valensise, G. CFTI5Med, The new release of the catalogue of strong earthquakes in Italy and in Mediterranean area. Sci. Data 2019, 6, 80. [Google Scholar] [CrossRef]
- Seed, H.B.; Idriss, I.M. Simplified procedure for evaluating soil liquefaction potential. J. Soil Mech. Found. Div. 1971, 97, 1249–1273. [Google Scholar]
- Liao, S.S.C.; Whitman, R.V. Overburden Correction Factor for SPT in Sands. J. Geotech. Eng. 1986, 112, 373–377. [Google Scholar] [CrossRef]
- Robertson, P.K.; Wride, C.E. Cyclic Liquefaction and its Evaluation Based on the SPT and CPT. In Proceedings of the NCEER Workshop on Evaluation of Liquefaction Resistance of Soils, Salt Lake City, UT, USA, 5–6 January 1996; Technical Report No. NCEER-97-0022. pp. 41–88. [Google Scholar]
- Ishihara, K. Simple method of analysis for liquefaction of sand deposits during earthquakes. Soils Found. 1977, 17, 1–17. [Google Scholar] [CrossRef] [Green Version]
- Iwasaki, T. Soil liquefaction studies in Japan: State-of-the-art. Soil Dyn Earthquake Engng. 1986, 5, 2–68. [Google Scholar] [CrossRef]
- Idriss, I.M. An update to the Seed-Idriss simplified procedure for evaluating liquefaction potential. In Proceedings of the TRB Workshop on New Approaches to Liquefaction, Washington, DC, USA, 10 January 1999. [Google Scholar]
- Golesorkhi, R. Factor Influencing the Computational Determination of Earthquake-Induced Shear Stressed in Sandy Soils. Ph.D. Thesis, University of California, Berkeley, CA, USA, 1989. [Google Scholar]
- Kishida, T.; Boulanger, R.W.; Abrahamson, N.A.; Driller, M.W.; Wehling, T.M. Site effects for the Sacramento-San Joaquin Delta. Earthq. Spectra 2009, 25, 301–322. [Google Scholar] [CrossRef]
- Kishida, T.; Boulanger, R.W.; Abrahamson, N.A.; Driller, M.W.; Wehling, T.M. Seismic response of levees in Sacramento-San Joaquin Delta. Earthq. Spectra 2009, 25, 557–582. [Google Scholar] [CrossRef]
- Lasley, S.J.; Green, R.A.; Rodriguez-Marek, A. New stress reduction coefficient relationship for liquefaction triggering analyses. J. Geotech. Geoenvironmental Eng. 2016, 142, 06016013. [Google Scholar] [CrossRef]
- Bonaccorso, R.; Grasso, S.; Lo Giudice, E.; Maugeri, M. Cavities and hypogeal structures of the historical part of the City of Catania. Adv. Earthq. Eng. 2005, 14, 197–223. [Google Scholar]
- Baratta, M. I Terremoti d’Italia. Saggio di storia, Geografia e Bibliografia Sismica Italiana Con 136 Sismocartogrammi; Arnaldo Forni Editore: Rome, Italy, 1901. [Google Scholar]
- Del Giudice, F. Terremoti avvenuti nel Regno delle due Sicilie nel 1857. Annali Civili del Regno delle due Sicilie nel 1857. 1858. Available online: http://storing.ingv.it/cfti/cfti4/quakes/08443.html (accessed on 28 December 2020).
- Mercalli, G. I Terremoti Storici Italiani. Geologia d’Italia, Part III, Vulcani e Fenomeni Vulcanici in Italia; Vallardi Editore: Milan, Italy, 1883. [Google Scholar]
- Galli, P.; Meloni, F. Nuovo catalogo nazionale dei processi di liquefazione avvenuti in occasione dei terremoti storici in Italia. Quat. Ital. J. Quat. Sci. 1993, 6, 271–292. [Google Scholar]
- Castelli, F.; Grasso, S.; Lentini, V.; Massimino, M.R. In situ measuremnts for evaluating liquefaction potential under cyclic loading. In Proceedings of the 1st 1MEKO TC4 International Workshop on Metrology for Geotechnics, Benevento, Italy, 17–18 March 2016; pp. 79–84. [Google Scholar]
- Cavallaro, A.; Massimino, M.R.; Maugeri, M. Noto Cathedral: Soil and foundation investigation. Constr. Build. Mater. J. 2003, 17, 533–541. [Google Scholar] [CrossRef]
- Grasso, S.; Maugeri, M. Seismic Microzonation Studies for the City of Ragusa (Italy). Soil Dyn. Earthq. Eng. 2014, 56, 86–97. [Google Scholar] [CrossRef]
- Castelli, F.; Cavallaro, A.; Grasso, S. SDMT soil testing for the local site response analysis. In Proceedings of the 1st IMEKO TC4 International Workshop on Metrology for Geotechnics, Benevento, Italy, 17–18 March 2016; pp. 143–148. [Google Scholar]
- Castelli, F.; Cavallaro, A.; Ferraro, A.; Grasso, S. In situ and laboratory tests for site response analysis in the ancient city of Noto (Italy). In Proceedings of the 1st IMEKO TC4 International Workshop on Metrology for Geotechnics, Benevento, Italy, 17–18 March 2016; pp. 85–90, ISBN 978-929900750-1. [Google Scholar]
- Boschi, E.; Guidoboni, E.; Mariotti, D. Seismic effects of the strongest historical earthquakes in the Syracuse area. Ann. Geofis. 1995, 38, 223–253. [Google Scholar]
- Barbano, M.S.; Rigano, R. Earthquake sources and seismic hazard in Southeastern Sicily. Ann. Geofis. 2001, 44, 723–738. [Google Scholar]
- Imposa, S.; Lombardo, G. The Etna earthquake of February 20, 1818. In Atlas of Isoseismal Maps of Italian Earthquakes; Postpischl, D., Ed.; Quaderni de La Ricerca Scientifica: Bologna, Italy, 1985; pp. 80–81. [Google Scholar]
- Abate, G.; Corsico, S.; Massimino, M.R. FEM Modelling of the Seismic Behavior of a Tunnel-soil-Aboveground Building System: A Case History in Catania (Italy). Procedia Eng. 2016, 158, 380–385. [Google Scholar] [CrossRef] [Green Version]
- Abate, G.; Massimino, M.R.; Romano, S. Finite Element Analysis of DSSI Effects for a Building of Strategic Importance in Catania (Italy). Procedia Eng. 2016, 158, 374–379. [Google Scholar] [CrossRef] [Green Version]
- Caruso, S.; Ferraro, A.; Grasso, S.; Massimino, M.R. Site Response Analysis in eastern Sicily based on direct and indirect Vs measurements. In Proceedings of the 1st IMEKO TC4 International Workshop on Metrology for Geotechnics, Benevento, Italy, 17–18 March 2016; pp. 115–120, ISBN 978-929900750-1. [Google Scholar]
- Castelli, F.; Cavallaro, A.; Ferraro, A.; Grasso, S.; Lentini, V.; Massimino, M.R. Static and dynamic properties of soils in Catania (Italy). Ann. Geophys. 2018, 61, SE221. [Google Scholar] [CrossRef]
- Ferraro, A.; Grasso, S.; Massimino, M.R. Site effects evaluation in Catania (Italy) by means of 1-D numerical analysis. Ann. Geophys. 2018, 61, SE224. [Google Scholar] [CrossRef]
- Massimino, M.R.; Abate, G.; Corsico, S.; Louarn, R. Comparison Between Two Approaches for Non-linear FEM Modelling of the Seismic Behaviour of a Coupled Soil–Structure System. Geotech. Geol. Eng. 2019, 37, 1957–1975. [Google Scholar] [CrossRef]
- Maugeri, M. (Ed.) Seismic Prevention of Damage: A Case Study in a Mediterranean City; WIT Press: Southampton, UK, 2005; ISBN 1-84564-004-7. [Google Scholar]
- Grasso, S.; Maugeri, M. The Seismic Microzonation of the City of Catania (Italy) for the Maximum Expected Scenario Earthquake of January 11, 1693. Soil Dyn. Earthq. Eng. 2009, 29, 953–962. [Google Scholar] [CrossRef]
- Grasso, S.; Maugeri, M. The Seismic Microzonation of the City of Catania (Italy) for the Etna Scenario Earthquake (M = 6.2) of February 20, 1818. Earthq. Spectra 2012, 28, 573–594. [Google Scholar] [CrossRef]
- Kokusho, T.; Yoshida, Y. SPT N-value and S-wave velocity for gravely soils with different grain size distribution. Soils Found. 1997, 37, 105–113. [Google Scholar] [CrossRef] [Green Version]
- Ohta, Y.; Goto, N. Empirical Shear Wave Velocity Equations in Terms of Characteristic Soil Indexes. Earthq. Eng. Struct. Dyn. 1978, 6, 167–187. [Google Scholar] [CrossRef]
- Yoshida, Y.; Motonori, I. Empirical Formulas of SPT Blow-Counts for Gravelly Soils. In Proceedings of the ISOPT-1, Orlando, FL, USA, 20–24 March 1988; pp. 381–387. [Google Scholar] [CrossRef]
- Yokota, K.; Imai, T.; Konno, M. Dynamic Deformation Characteristics of Soils Determined by Laboratory Tests. Oyo Tec. Rep. 1981, 3, 13–37. [Google Scholar]
- Ferraro, A.; Grasso, S.; Maugeri, M.; Totani, F. Seismic response analysis in the southern part of the historic centre of the City of L’Aquila (Italy). Soil Dyn. Earthq. Eng. 2016, 88, 256–264. [Google Scholar] [CrossRef]
- Kottke, A.R.; Rathje, E.M. Technical Manual for STRATA; PEER Report 2008/10; University of California: Berkeley, CA, USA, 2008. [Google Scholar]
- NTC [2018] D. M. 17/01/2018. New Technical Standards for Buildings. Official Journal of the Italian Republic. 2018. Available online: https://www.gazzettaufficiale.it/eli/gu/2018/02/20/42/so/8/sg/pdf (accessed on 23 October 2020).
- Grasso, S.; Laurenzano, G.; Maugeri, M.; Priolo, E. Seismic response in Catania by different methodologies. Adv. Earthq. Eng. 2005, 14, 63–79. [Google Scholar]
- Laurenzano, G.; Priolo, E.; Klinc, P.; Vuan, A. Near fault earthquake scenarios for the February 20, 1818 M = 6.2 “Catanese” event. In Proceedings of the Fourth International Conference on Computer Simulation in Risk Analysis and Hazard Mitigation: “Risk Analysis 2004”, Rhodes, Greece, 27–29 September 2004; pp. 81–91. [Google Scholar]
- Meletti, C.; Montaldo, V. Stime di Pericolosità Sismica per Diverse Probabilità di Superamento in 50 Anni: Valori di Ag. Progetto DPC-INGV S1, Deliverable D2. 2007. Available online: http://esse1.mi.ingv.it/d2.html (accessed on 23 October 2020).
- Cavallaro, A.; Capilleri, P.P.; Grasso, S. Site characterization by dynamic in situ and laboratory tests for liquefaction potential evaluation during Emilia Romagna earthquake. Geosciences 2018, 8, 242. [Google Scholar] [CrossRef] [Green Version]
- Rollins, K.M.; Remund, T.K.; Amoroso, S. Evaluation of DMT-based liquefaction triggering curves based on field case histories. In Proceedings of the 5th International Conference on Geotechnical and Geophysical Site Characterisation, Queensland, Australia, 5–9 September 2016. [Google Scholar]
- Marchetti, S. Detection of liquefiable sand layers by means of quasi-static penetration test. In Proceedings of the 2nd European Symp. on Penetration Testing, Amsterdam, The Netherlands, 24–27 May 1982; Volume 2, pp. 689–695. [Google Scholar]
- Monaco, P.; Marchetti, S.; Totani, G.; Calabrese, M. Sand liquefiability assessment by Flat Dilatometer Test (DMT). In Proceedings of the XVI ICSMGE, Osaka, Japan, 12–16 September 2005; Volume 4, pp. 2693–2697. [Google Scholar]
- Iwasaki, T.; Tatsuoka, F.; Tokida, K.; Yasuda, S. A practical method for assessing soil liquefaction potential based on case studies at various sites in Japan. In Proceedings of the 2nd Int Conf on Microzonation for Safer Construction, Research and Application, San Francisco, CA, USA, 26 November–1 December 1978; Volume 1, pp. 885–896. [Google Scholar]
- NASEM-National Academies of Sciences, Engineering, and Medicine. State of the Art and Practice in the Assessment of Earthquake-Induced soil Liquefaction and Its Consequences; The National Academies Press: Washington, DC, USA, 2016. [Google Scholar] [CrossRef]
- Iwasaki, T.; Tokida, K.; Tatsuoka, F.; Watanabe, S.; Yasuda, S.; Sato, H. Microzonation for soil liquefaction potential using simplified methods. In Proceedings of the 3rd International Conference on Microzonation, Seattle, WA, USA, 28 June–1 July 1982; pp. 1319–1330. [Google Scholar]
- Chung, J.; Rogers, J. Simplified method for spatial evaluation of liquefaction potential in the St. Louis area. J. Geotech. Geoenvironmental Eng. 2011, 137, 505–515. [Google Scholar] [CrossRef]
- Dixit, J.; Dewaikar, D.M.; Jangrid, J.S. Assessment of liquefaction potential index for Mumbai City. Nat. Hazards Earth Sci. Syst. 2012, 12, 2759–2768. [Google Scholar] [CrossRef] [Green Version]
- Holzer, T.L.; Bennett, M.J.; Noce, T.E.; Padovani, A.C.; Tinsley, J.C., III. Liquefaction hazard mapping with LPI in the greater Oakland, California, area. Earthq. Spectra 2006, 22, 693–708. [Google Scholar] [CrossRef]
- Holzer, T.L.; Blair, J.L.; Noce, T.E.; Bennett, M.J. Predicted liquefaction of east bay fills during a repeat of the 1906 San Francisco earthquake. Earthq. Spectra 2006, 22, S261–S277. [Google Scholar] [CrossRef]
- Kim, H.S.; Kim, M.; Baise, L.G.; Kim, B. Local and regional evaluation of liquefaction potential index and liquefaction severity number for liquefaction-induced sand boils in Pohang, South Korea. Soil Dyn. Earthq. Eng. 2020, 106459. [Google Scholar] [CrossRef]
- Lenz, A.; Baise, L.G. Spatial variability of liquefaction potential in regional mapping using CPT and SPT data. Soil Dyn. Earthq. Eng. 2007, 27, 690–702. [Google Scholar] [CrossRef]
- Maurer, B.W.; Green, R.A.; Cubrinovski, M.; Brendon, A.; Bradley, B.A. Evaluation of the liquefaction potential index for assessing liquefaction hazard in Christchurch, New Zealand. J. Geotech. Geoenviron. Eng. 2014, 140, 04014032. [Google Scholar] [CrossRef]
- Muley, P.; Maheshwari, B.K.; Paul, D.K. Assessment of Liquefaction Potential Index for Roorkee Region. In Proceedings of the 16th Symposium on Earthquake Engineering, Indian Institute of Technology, Roorkee, India, 20–22 December 2018. [Google Scholar]
- Papathanassiou, G.; Pavlides, S.; Ganas, A. The 2003 Lefkada earthquake: Field observation and preliminary microzonation map based on liquefaction potential index for the town of Lefkada. Eng. Geol. 2005, 82, 12–31. [Google Scholar] [CrossRef]
- Sonmez, H. Modification of the liquefaction potential index and liquefaction susceptibility mapping for a liquefaction-prone area (Inegol, Turkey). Env. Geol. 2003, 44, 862–871. [Google Scholar] [CrossRef]
- Yalcin, A.; Gokceoglu, C.; Sonmez, H. Liquefaction severity map for Aksaray city center. Nat. Hazards Earth Syst. Sci. 2008, 8, 641–649. [Google Scholar] [CrossRef]
Figure 1.
Range of values of rd for different soil profiles (Modified from Seed and Idriss [12]).
Figure 1.
Range of values of rd for different soil profiles (Modified from Seed and Idriss [12]).

Figure 2.
Stress reduction coefficient versus depth (Modified from Ishihara [15]).
Figure 2.
Stress reduction coefficient versus depth (Modified from Ishihara [15]).

Figure 3.
Variation of the stress reduction coefficient with depth and earthquake magnitude (from Idriss and Boulanger [6]).
Figure 3.
Variation of the stress reduction coefficient with depth and earthquake magnitude (from Idriss and Boulanger [6]).

Figure 4.
rd results of the site response analyses. Also shown for comparison is the proposed rd range and recommendations of Seed and Idriss [12] (from Cetin and Seed [5]).


Figure 7.
Map of experimental sites in Catania area (Sicily, Italy).

Figure 8.
Location of standard penetration test (SPT), cone penetration tests (CPT), and seismic dilatometer Marchetti tests (SDMT) in the Saint Giuseppe La Rena site (Eastern coast of Catania, Sicily).
Figure 8.
Location of standard penetration test (SPT), cone penetration tests (CPT), and seismic dilatometer Marchetti tests (SDMT) in the Saint Giuseppe La Rena site (Eastern coast of Catania, Sicily).

Figure 9.
NSPT test results versus depth (borehole 421-SPT4).

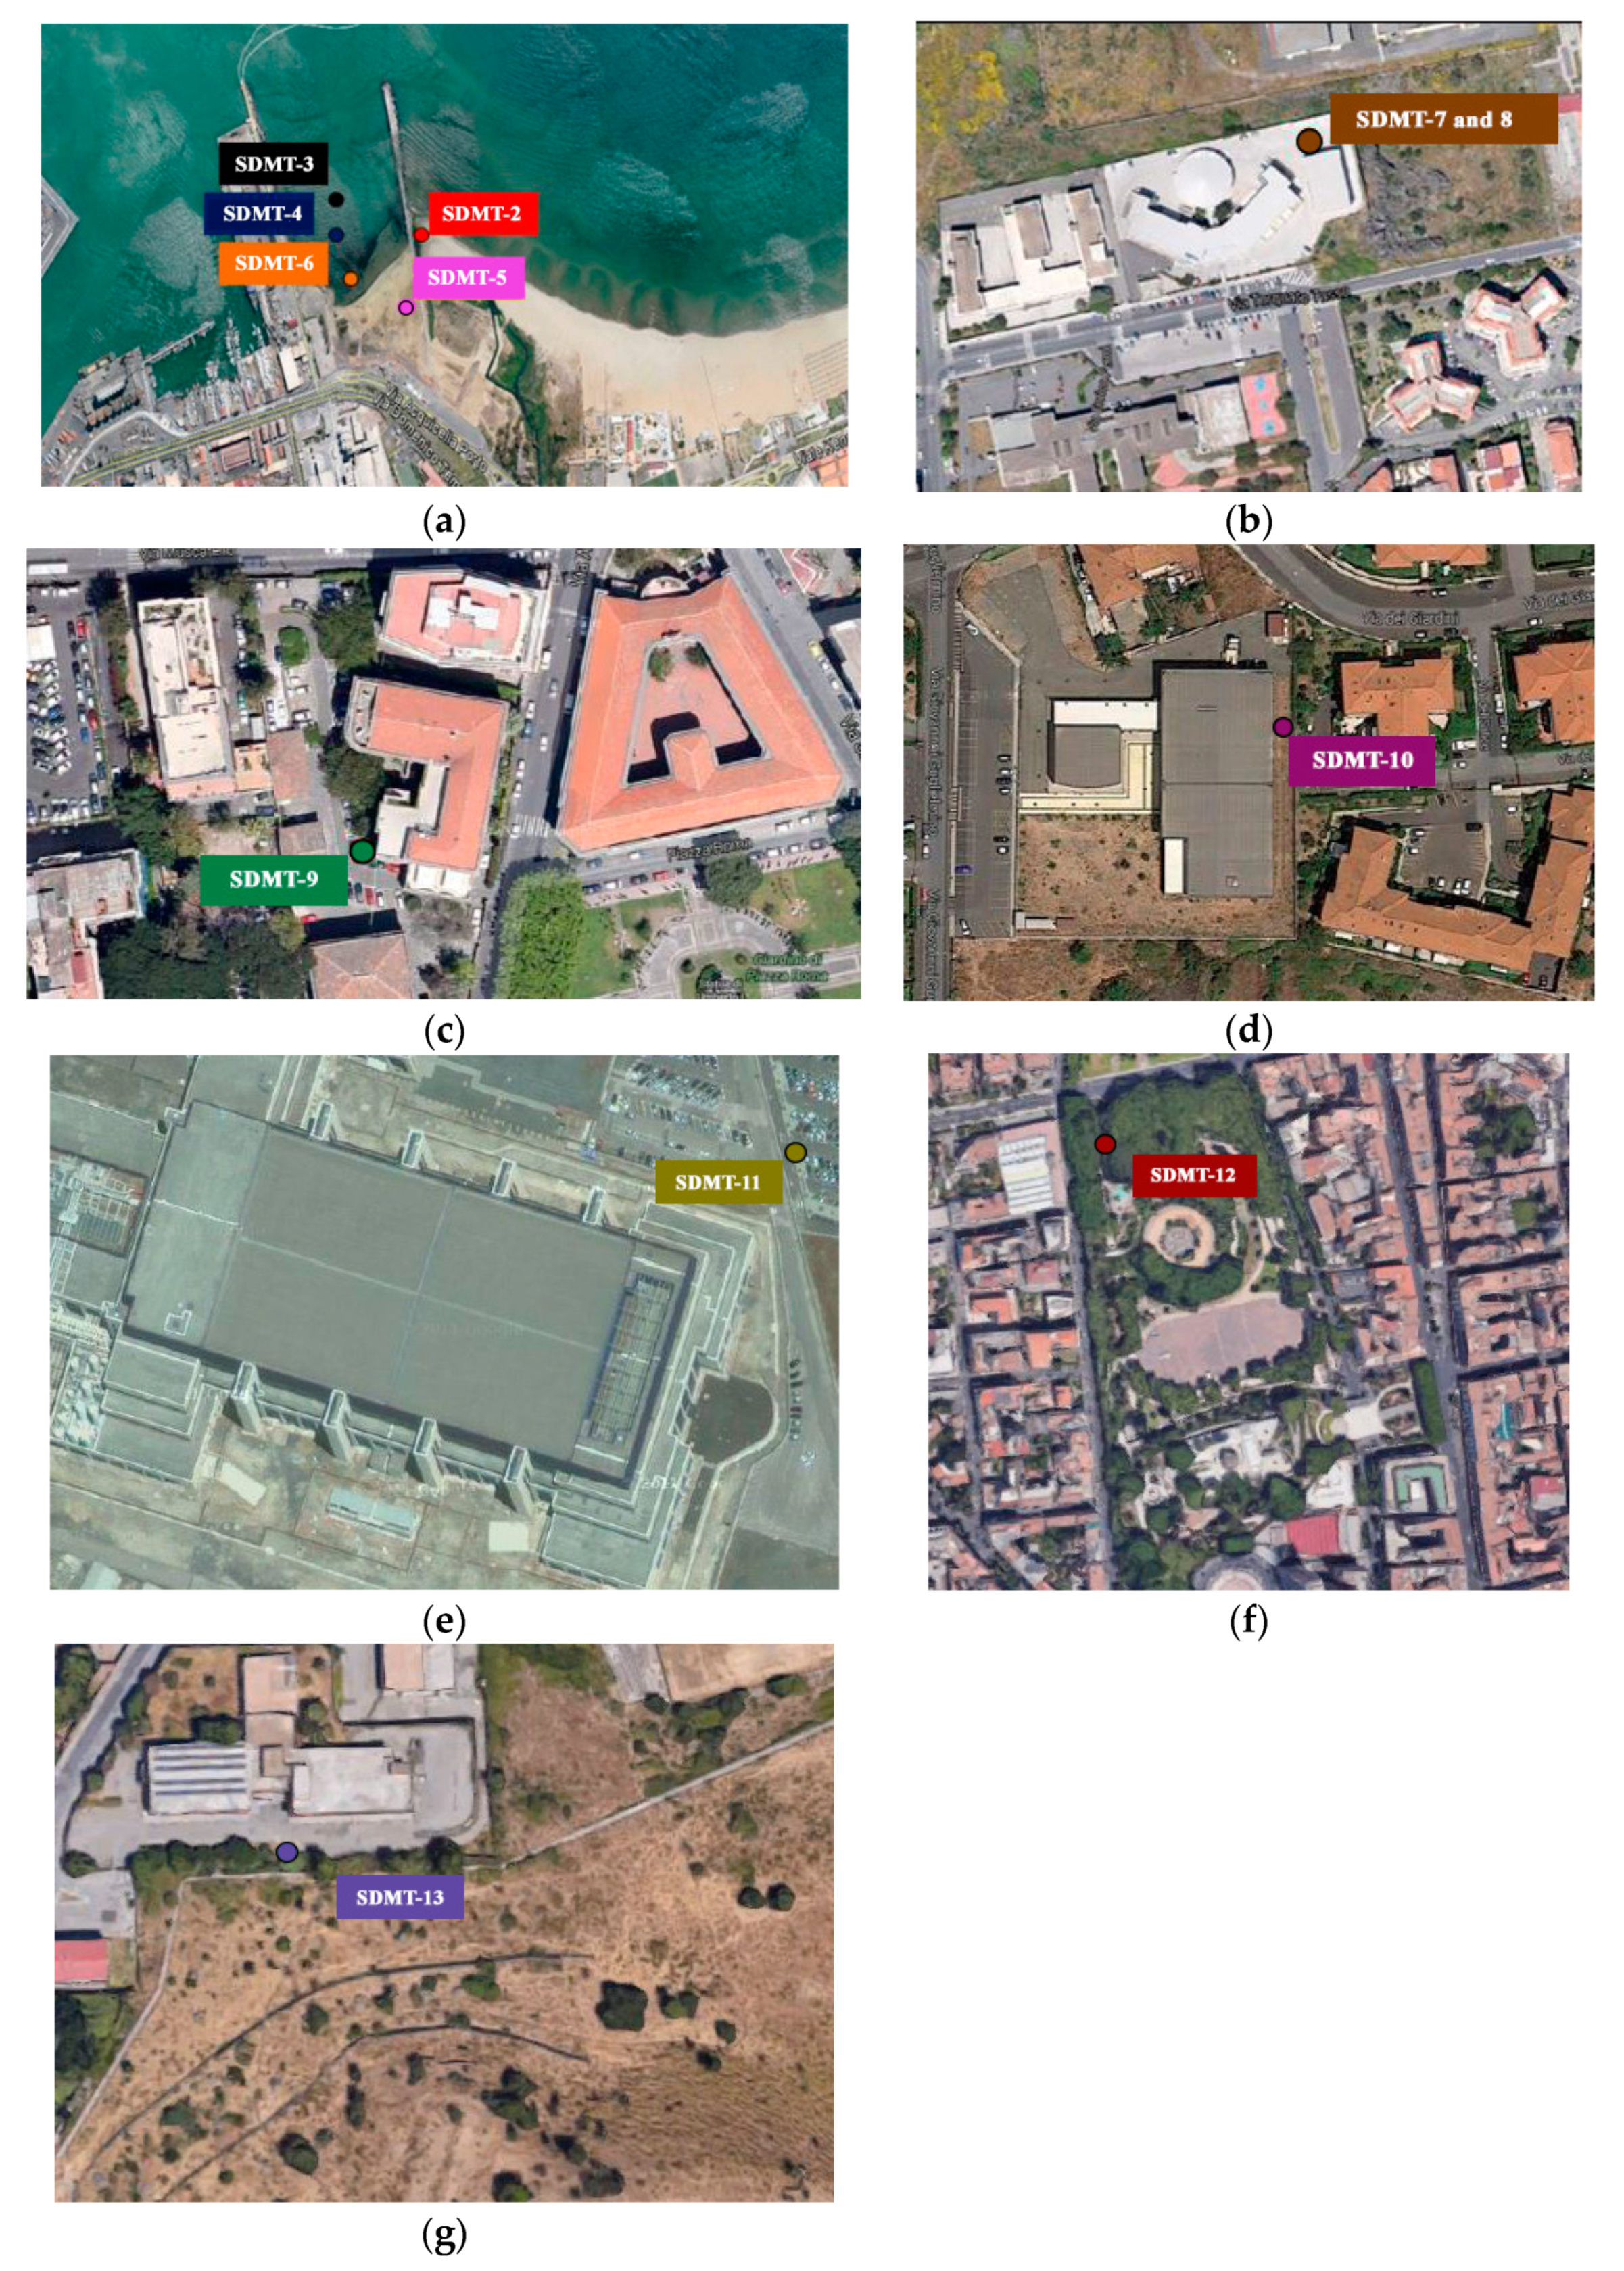
Figure 10.
Layout of SDMT tests: (a) Catania Harbour area; (b) Nazario Sauro School; (c) National Institute of Geophysics and Volcanology (INGV); (d) Madre Teresa di Calcutta School; (e) STM M6; (f) Bellini Garden; (g) Monte Po.
Figure 10.
Layout of SDMT tests: (a) Catania Harbour area; (b) Nazario Sauro School; (c) National Institute of Geophysics and Volcanology (INGV); (d) Madre Teresa di Calcutta School; (e) STM M6; (f) Bellini Garden; (g) Monte Po.

Figure 11.
Seismic dilatometer test: (a) SDMT equipment (blade and seismic module); (b) schematic test layout (From Castelli et al. [30]).
Figure 11.
Seismic dilatometer test: (a) SDMT equipment (blade and seismic module); (b) schematic test layout (From Castelli et al. [30]).

Figure 12.
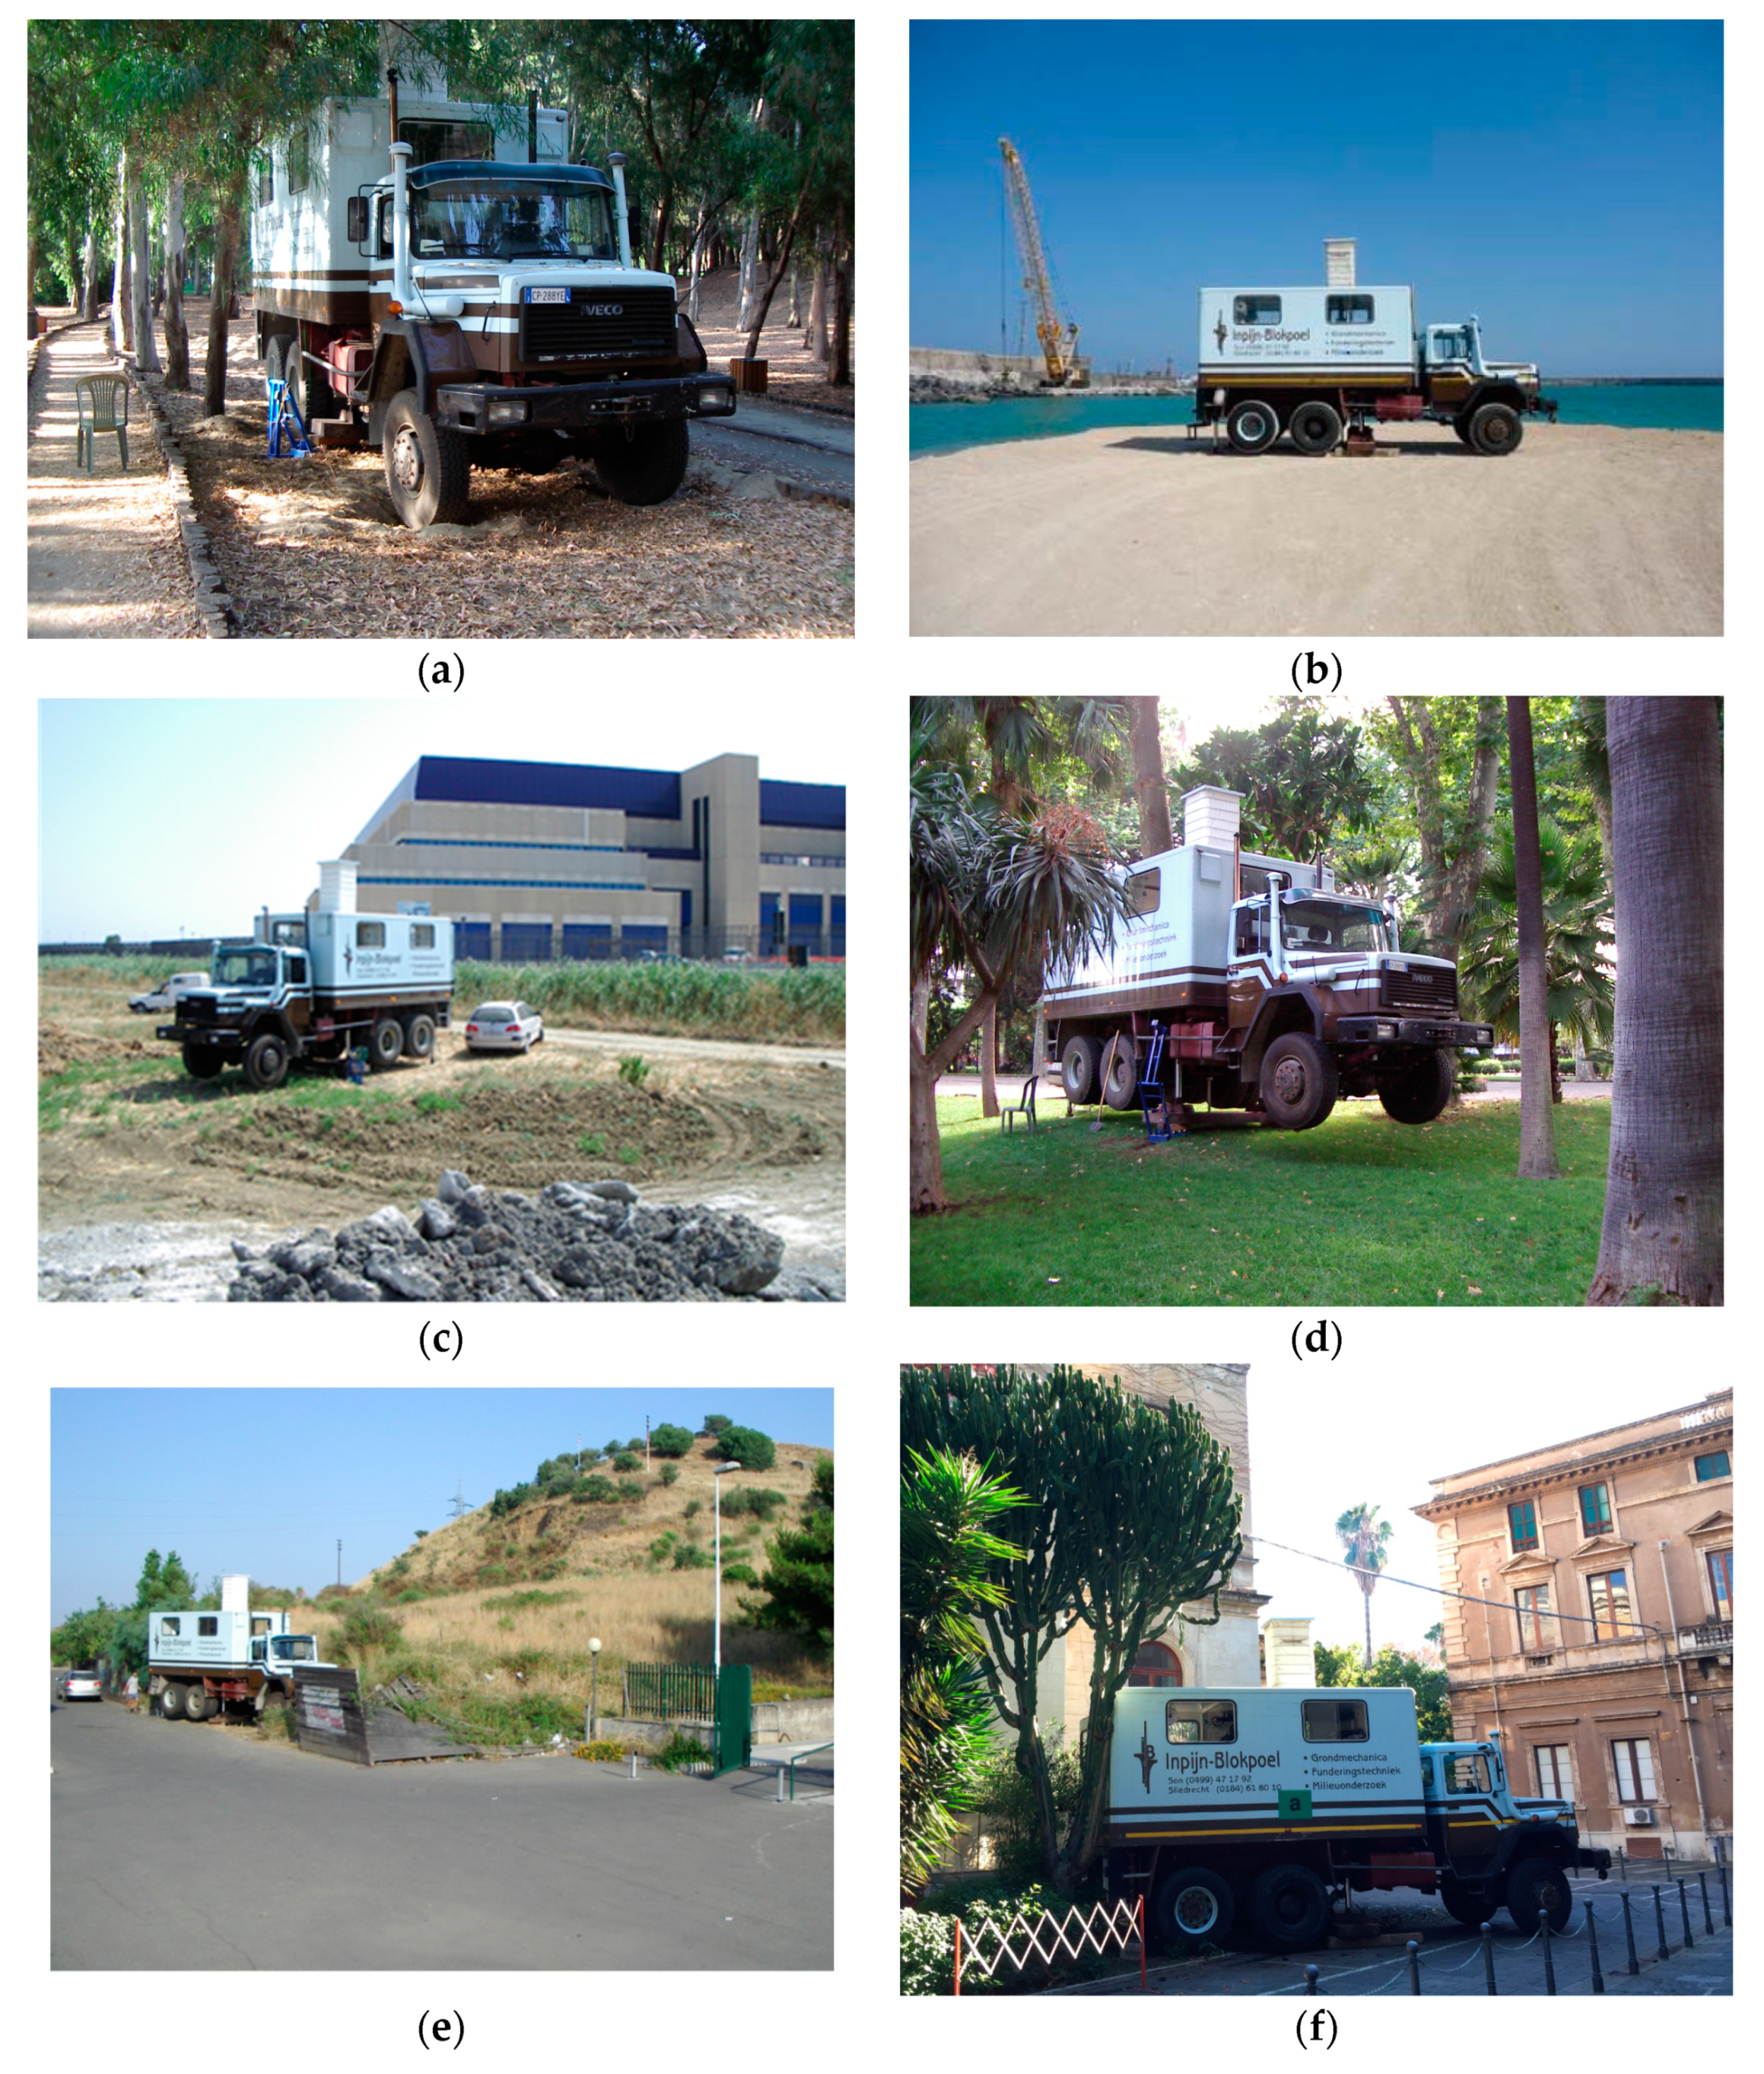
SDMT equipment (a) at the Saint Giuseppe La Rena site; (b) at the Catania Harbour site; (c) at STM M6 site; (d) at Bellini Garden site; (e) at Monte Po site; (f) at INGV site.
Figure 12.
SDMT equipment (a) at the Saint Giuseppe La Rena site; (b) at the Catania Harbour site; (c) at STM M6 site; (d) at Bellini Garden site; (e) at Monte Po site; (f) at INGV site.

Figure 13.
Comparison of VS determined from empirical correlations, Equations (9) and (10), and SDMT1.
Figure 13.
Comparison of VS determined from empirical correlations, Equations (9) and (10), and SDMT1.

Figure 14.
Horizontal shear stress- horizontal displacement curves under different normal stress conditions (98.1 kN/m2, 196.2 kN/m2 and 294.3 kN/m2): (a) S2C2 soil sample (retrieved at 13.20 m in SDMT2 borehole), (b) S4C1 soil sample (retrieved at 8.40 m in SDMT4 borehole).
Figure 14.
Horizontal shear stress- horizontal displacement curves under different normal stress conditions (98.1 kN/m2, 196.2 kN/m2 and 294.3 kN/m2): (a) S2C2 soil sample (retrieved at 13.20 m in SDMT2 borehole), (b) S4C1 soil sample (retrieved at 8.40 m in SDMT4 borehole).

Figure 15.
Shear stresses corresponding to failure versus normal stresses (a) S2C2 soil sample (retrieved at 13.20 m in SDMT2 borehole), (b) S4C1 soil sample (retrieved at 8.40 m in SDMT4 borehole).
Figure 15.
Shear stresses corresponding to failure versus normal stresses (a) S2C2 soil sample (retrieved at 13.20 m in SDMT2 borehole), (b) S4C1 soil sample (retrieved at 8.40 m in SDMT4 borehole).

Figure 16.
Interactive seismic hazard maps of the city of Catania: (a) 5% probability of exceedance in 50 years (return period of 975 years); (b) 2% probability of exceedance in 50 years (return period of 2475 years).
Figure 16.
Interactive seismic hazard maps of the city of Catania: (a) 5% probability of exceedance in 50 years (return period of 975 years); (b) 2% probability of exceedance in 50 years (return period of 2475 years).

Figure 17.
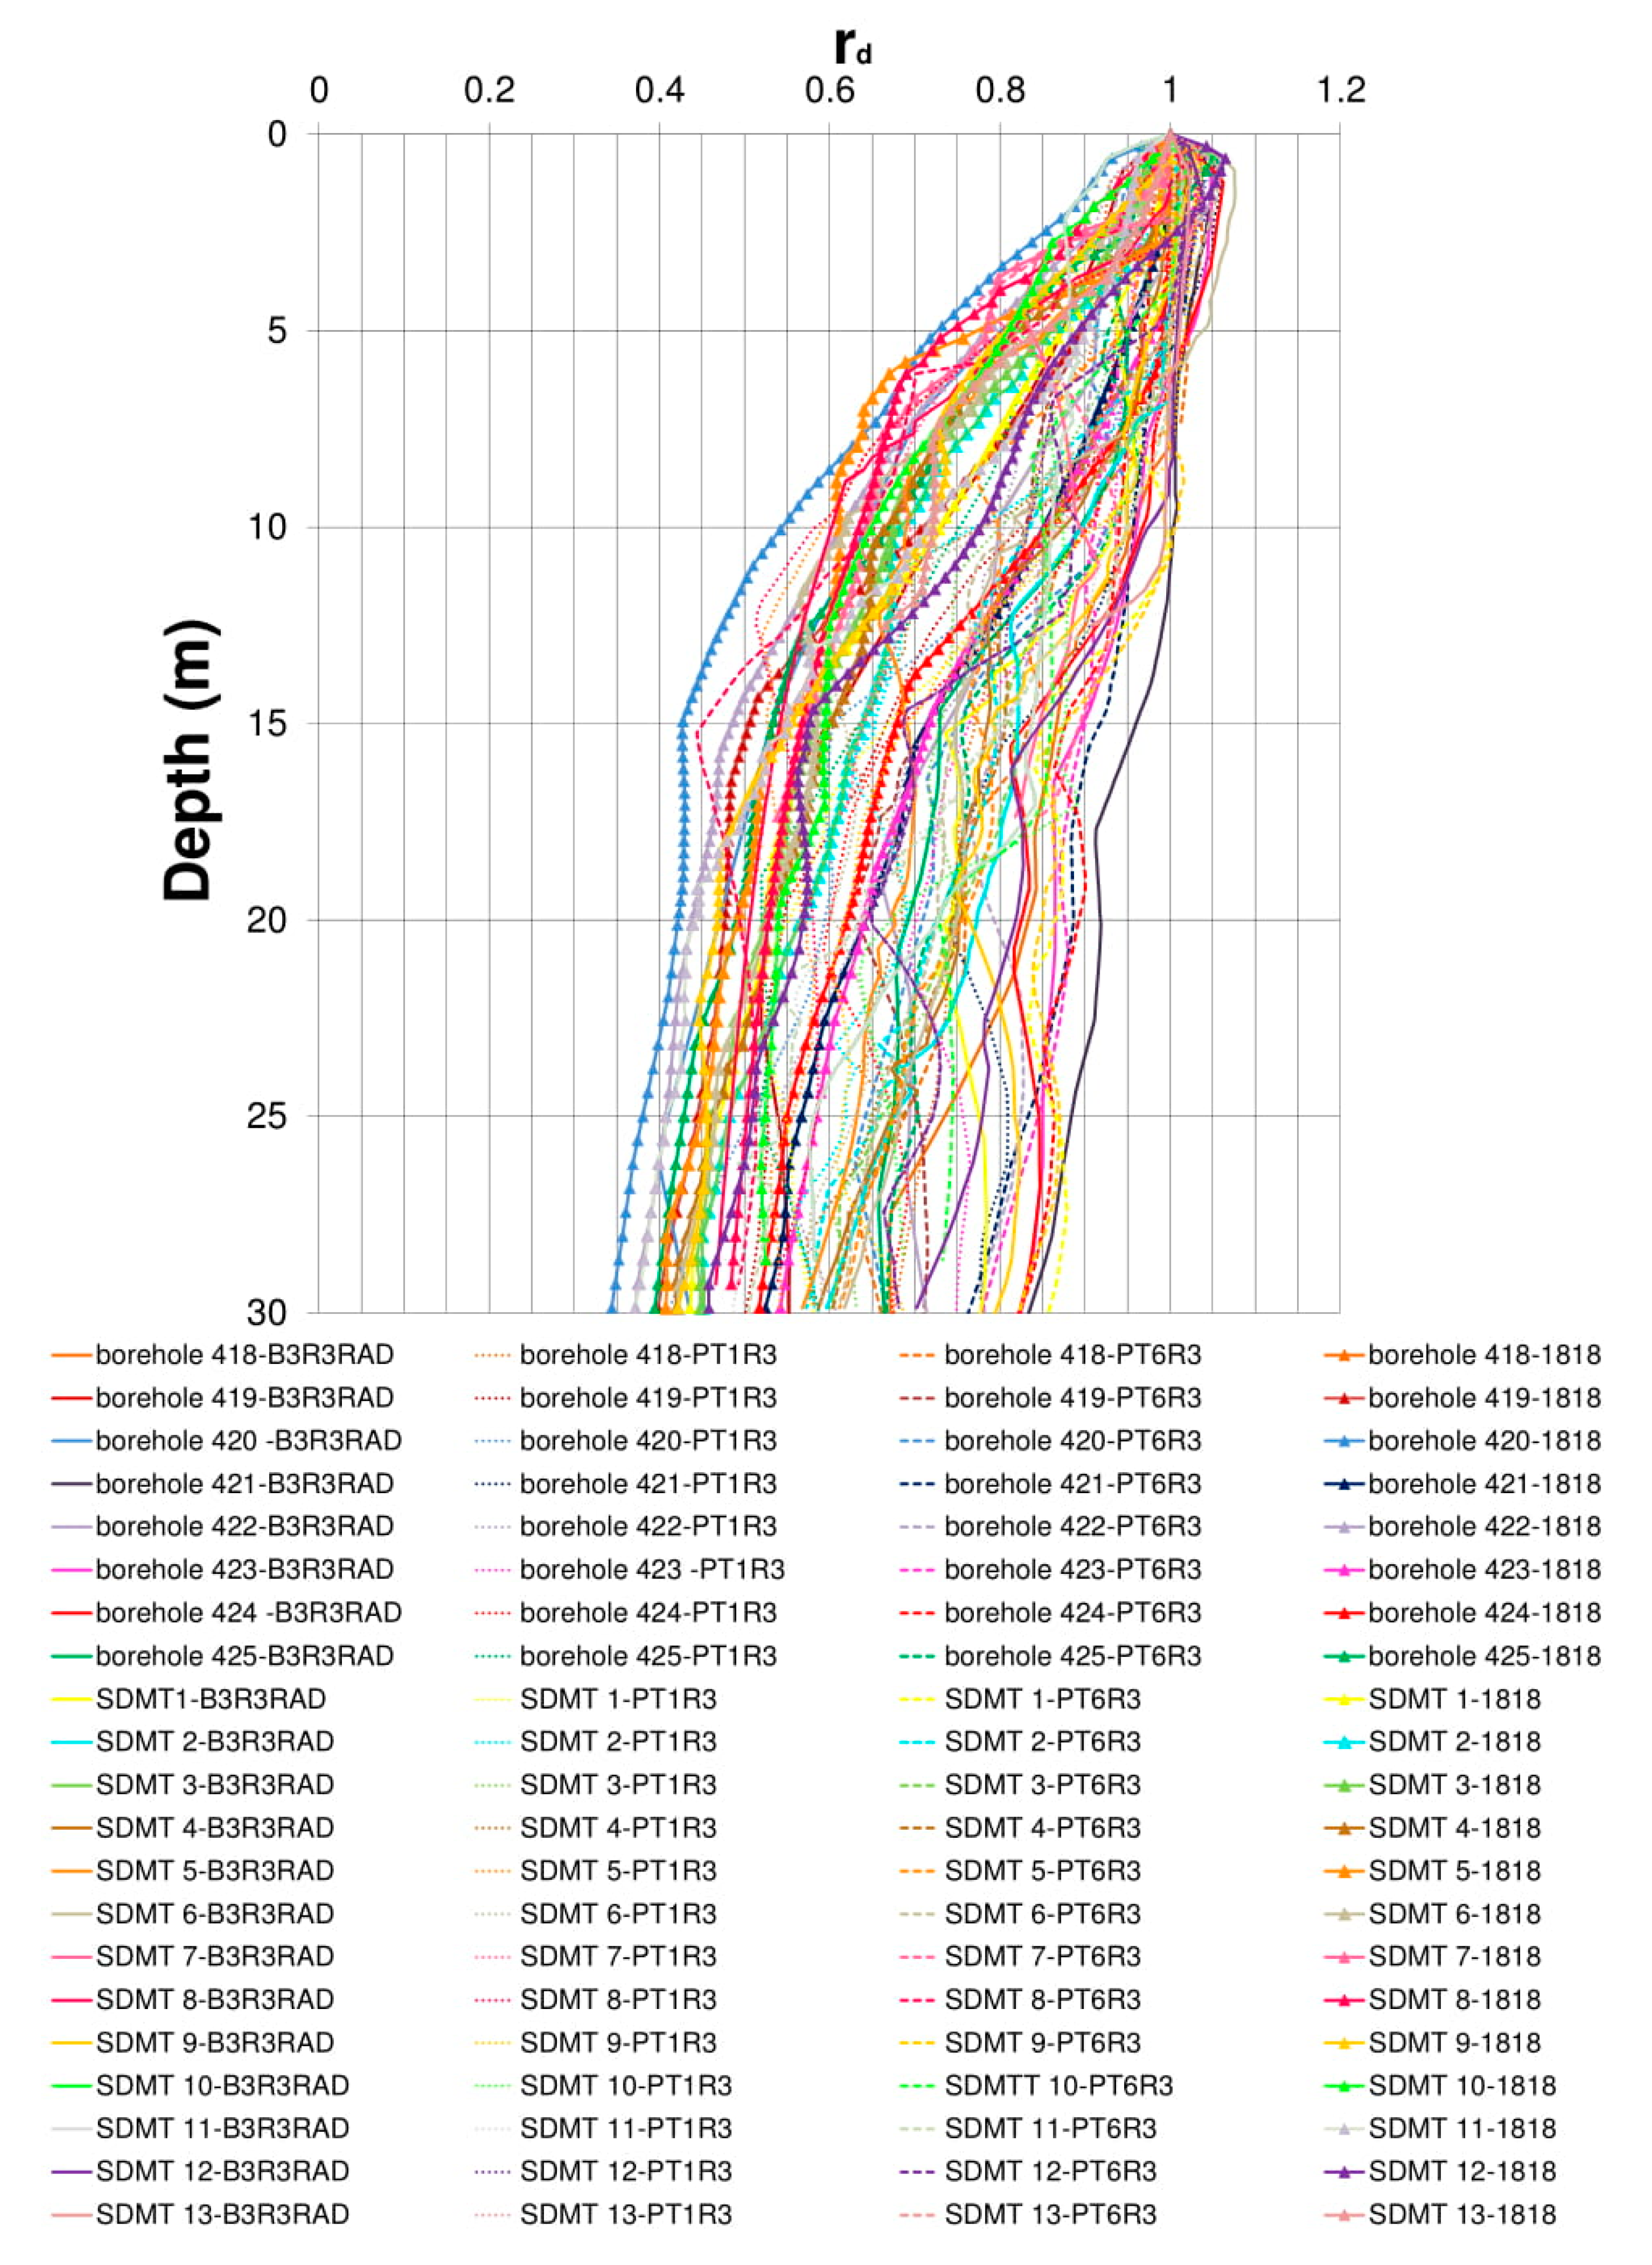
rd results from response analyses for different soil profiles (SPT1-8 and SDMT1-13) using as input 1693 and 1818 scaled synthetic seismograms to the maximum PGA of 0.3 g.
Figure 17.
rd results from response analyses for different soil profiles (SPT1-8 and SDMT1-13) using as input 1693 and 1818 scaled synthetic seismograms to the maximum PGA of 0.3 g.

Figure 18.
rd results from response analyses for different soil profiles (SPT1-8 and SDMT1-13) using as input the 1693 and 1818 scaled synthetic seismograms to the maximum PGA of 0.5 g.
Figure 18.
rd results from response analyses for different soil profiles (SPT1-8 and SDMT1-13) using as input the 1693 and 1818 scaled synthetic seismograms to the maximum PGA of 0.5 g.

Figure 19.
Schematic for determining maximum shear stress,, and the stress reduction coefficient, rd (from Idriss and Boulanger [6]).
Figure 19.
Schematic for determining maximum shear stress,, and the stress reduction coefficient, rd (from Idriss and Boulanger [6]).

Figure 20.
Range of values of rd for different soil profiles (SPT1-8 and SDMT1-13) using 1693 and 1818 scaled synthetic seismograms to the maximum PGA of 0.3 g.
Figure 20.
Range of values of rd for different soil profiles (SPT1-8 and SDMT1-13) using 1693 and 1818 scaled synthetic seismograms to the maximum PGA of 0.3 g.

Figure 21.
Range of values of rd for different soil profiles (SPT1-8 and SDMT1-13) using 1693 and 1818 scaled synthetic seismograms to the maximum PGA of 0.5 g.
Figure 21.
Range of values of rd for different soil profiles (SPT1-8 and SDMT1-13) using 1693 and 1818 scaled synthetic seismograms to the maximum PGA of 0.5 g.

Figure 22.
Comparison of rd relationship obtained by Iwasaki [16] and relationships proposed in this study.
Figure 22.
Comparison of rd relationship obtained by Iwasaki [16] and relationships proposed in this study.

Figure 23.
Comparison of rd relationships obtained by Liao and Whitman [13] and Robertson and Wride [14], and relationships proposed in this study.

Figure 24.
CRS profiles obtained for SDMT2: (a) using the peak horizontal acceleration at the ground surface of 0.4 g; (b) using the peak horizontal acceleration at the ground surface of 0.5 g.
Figure 24.
CRS profiles obtained for SDMT2: (a) using the peak horizontal acceleration at the ground surface of 0.4 g; (b) using the peak horizontal acceleration at the ground surface of 0.5 g.

Figure 25.
Horizontal stress index KD versus depth of the SDMT4, as example, performed in the Catania Harbour.
Figure 25.
Horizontal stress index KD versus depth of the SDMT4, as example, performed in the Catania Harbour.

Figure 26.
CRR-KD trends obtained from SDMT2 using the Equation (19) proposed by Monaco et al. [57] and the Equations (20) and (21) developed by Grasso and Maugeri [8].

Figure 27.
Liquefaction potential values obtained from: (a) SDMT2 and amax = 0.4 g; (b) SDMT2 and amax = 0.5 g; (c) SDMT4 and amax = 0.4 g; (d) SDMT4 and amax = 0.5 g.
Figure 27.
Liquefaction potential values obtained from: (a) SDMT2 and amax = 0.4 g; (b) SDMT2 and amax = 0.5 g; (c) SDMT4 and amax = 0.4 g; (d) SDMT4 and amax = 0.5 g.


Table 1.
Experimental sites and tests used to obtain new rd relationships in Catania area (Sicily, Italy).
Table 1.
Experimental sites and tests used to obtain new rd relationships in Catania area (Sicily, Italy).
| Experimental Sites | Tests |
|---|---|
| Saint Giuseppe La Rena | SPT 1 (borehole 418) |
| Saint Giuseppe La Rena | SPT 2 (borehole 419) |
| Saint Giuseppe La Rena | SPT 3 (borehole 420) |
| Saint Giuseppe La Rena | SPT 4 (borehole 421) |
| Saint Giuseppe La Rena | SPT 5 (borehole 422) |
| Saint Giuseppe La Rena | SPT 6 (borehole 423) |
| Saint Giuseppe La Rena | SPT 7 (borehole 424) |
| Saint Giuseppe La Rena | SPT 8 (borehole 425) |
| Saint Giuseppe La Rena | SDMT 1 |
| Catania Harbour | SDMT 2 |
| Catania Harbour | SDMT 3 |
| Catania Harbour | SDMT 4 |
| Catania Harbour | SDMT 5 |
| Catania Harbour | SDMT 6 |
| Nazario Sauro school | SDMT 7 |
| Nazario Sauro school | SDMT 8 |
| INGV building | SDMT 9 |
| Madre Teresa di Calcutta School | SDMT 10 |
| STM M6 | SDMT 11 |
| Bellini Garden | SDMT 12 |
| Monte Po | SDMT 13 |
Table 2.
Level of liquefaction severity [60]
Table 2.
Level of liquefaction severity [60]
| LPI | Level of Liquefaction Severity |
|---|---|
| 0 | Very low |
| 0 < LPI ≤ 5 | Low |
| 5 < LPI ≤ 15 | High |
| LPI > 15 | Very high |
Table 3.
Values of the surface maximum acceleration for the five SDMTs obtained from the site response analysis using the scaled PT1R3 seismogram to the maximum PGA of 0.3g.
Table 3.
Values of the surface maximum acceleration for the five SDMTs obtained from the site response analysis using the scaled PT1R3 seismogram to the maximum PGA of 0.3g.
| Surface Maximum Accelerations | |
|---|---|
| SDMT2 | 0.44g |
| SDMT3 | 0.43g |
| SDMT4 | 0.45g |
| SDMT5 | 0.49g |
| SDMT6 | 0.41g |
Table 4.
The liquefaction potential index from the five SDMTs for the three different CRR-KD curves using amax of 0.4g and 0.5g.
Table 4.
The liquefaction potential index from the five SDMTs for the three different CRR-KD curves using amax of 0.4g and 0.5g.
| Liquefaction Potential Index | ||||||
|---|---|---|---|---|---|---|
| amax | 0.4 g | 0.5 g | ||||
| CRR-KD curves | 1 | 2 | 3 | 1 | 2 | 3 |
| SDMT2 | 13.30 | 9.12 | 9.37 | 17.04 | 12.52 | 12.22 |
| SDMT3 | 12.44 | 7.48 | 7.80 | 16.47 | 11.06 | 10.59 |
| SDMT4 | 17.13 | 11.97 | 12.01 | 22.50 | 16.06 | 15.78 |
| SDMT5 | 7.50 | 3.36 | 3.53 | 11.13 | 6.02 | 5.41 |
| SDMT6 | 12.51 | 8.99 | 9.44 | 15.83 | 11.86 | 11.74 |
Publisher’s Note: MDPI stays neutral with regard to jurisdictional claims in published maps and institutional affiliations. |
© 2020 by the authors. Licensee MDPI, Basel, Switzerland. This article is an open access article distributed under the terms and conditions of the Creative Commons Attribution (CC BY) license (http://creativecommons.org/licenses/by/4.0/).
Share and Cite
MDPI and ACS Style
Grasso, S.; Massimino, M.R.; Sammito, M.S.V. New Stress Reduction Factor for Evaluating Soil Liquefaction in the Coastal Area of Catania (Italy). Geosciences 2021, 11, 12. https://doi.org/10.3390/geosciences11010012
AMA Style
Grasso S, Massimino MR, Sammito MSV. New Stress Reduction Factor for Evaluating Soil Liquefaction in the Coastal Area of Catania (Italy). Geosciences. 2021; 11(1):12. https://doi.org/10.3390/geosciences11010012
Chicago/Turabian StyleGrasso, Salvatore, Maria Rossella Massimino, and Maria Stella Vanessa Sammito. 2021. "New Stress Reduction Factor for Evaluating Soil Liquefaction in the Coastal Area of Catania (Italy)" Geosciences 11, no. 1: 12. https://doi.org/10.3390/geosciences11010012
Note that from the first issue of 2016, this journal uses article numbers instead of page numbers. See further details here.