Toward a High-Definition Remote Sensing Approach to the Study of Deserted Medieval Cities in the Near East


Department of Archaeology, University of West Bohemia, Sedláčkova 15, 306 14 Pilsen, Czech Republic
Geosciences 2020, 10(9), 369; https://doi.org/10.3390/geosciences10090369
Submission received: 27 August 2020
/
Revised: 10 September 2020
/
Accepted: 11 September 2020
/
Published: 16 September 2020
(This article belongs to the Special Issue Satellite, Aerial and Ground-Based Remote Sensing for Archaeological and Heritage Research)
Abstract
:The variability of currently available remote sensing datasets raises the question of which specific processing methods should be used for feature detection and feature extraction in both large and small-scale overhead images. In some cases, particular analyses allow us to carry out feature detection much more easily and effectively. The high-definition approach enables enhanced analysis of remote sensing data using all the spectral and graphical potential of multi-temporal ordered components. The deserted urban site of Kona Makhmūr, Iraqi Kurdistan, is taken as a case study to demonstrate this fine-grained approach. The analysis described in this paper is based on the complementary use of a variety of overlayed imagery, augmented by data from terrestrial surveys. The resulting map substantially enhances our knowledge of the built environment and the economic and environmental conditions of this early Islamic-period site. Spectral analysis of raster images allowed us to detect the real shapes of features, and with the addition of digital elevation model (DEM) (created via unmanned aerial system (UAV)) we were also able to interpret the state of preservation of the overground relics and the diachronic dynamics of their degradation.
1. Introduction
During recent decades, there has been an explosion in the variety of remote sensing datasets available for the Middle East area. In addition to historical aerial images and current remote sensing outputs, historical satellite imagery from open-access databases represents a unique source of information about a changing landscape. This paper offers an extended approach to the processing of remote sensing datasets, based on the development of graphic parameters and the application of various visualization algorithms on a multi-temporal remote sensing dataset in an intra-site context. The methodology introduced here is dubbed the high-definition approach and demonstrated using the case study of a deserted medieval town in Iraqi Kurdistan.
The Middle East landscape represents a very specific type of natural environment. The predominant dry steppes and extensive open plains, undisturbed by agricultural activity in some areas, can preserve a wide range of archaeological sites. These are often visible as very easily discovered relics in the field. Such features are detectable not only via direct or indirect feature indicators revealing the remains of objects hidden under the earth’s surface but also via direct detection of still-preserved parts above the surface. In the latter case, it is possible to work with the elevation topography of the site and document above-ground relics in three-dimensional space. In such situations, it is insufficient to use only one source. Rather, it is necessary to work with a multi-temporal dataset [1,2,3,4] for deep analyses of site morphology and identification of the preserved relief.
2. Case Study—Kona Makhmūr
In recent years, archaeological landscape projects carried out in the Middle East have typically covered a range of several hundred to thousands of square kilometers. Among the most extensive projects are: EAMENA—Endangered Archeology in the Middle East and North Africa (http://eamena.arch.ox.ac.uk); ASOR’s Cultural Heritage Initiative (https://www.asor-syrianheritage.org/); and CAMEL—the Center for Ancient Middle Eastern Landscapes (https://oi.uchicago.edu/research/camel/about-camel). These initiatives are mapping large areas of entire states, and their main aims are defined as the systematic localization of historical monuments and the evaluation of their state of preservation—with priority given to conflict areas. The documentation is primarily based on freely available remote sensing data. Due to the fairly good or favorable security situation there, most ongoing archaeological landscape projects focused on the mapping of sites within smaller-scale areas are located in the Kurdistan Region of northern Iraq. At present, there are about 10 ongoing landscape projects [5], and most aim both to document individual archaeological sites and historical monuments of selected areas and to produce comprehensive databases. These types of landscape projects provide unprecedented amounts of data for the reconstruction of historical development and settlement structures and land use—and hugely more than was available for previous surveys (Atlas of the Archaeological Sites in Iraq) [6]. The importance of remote sensing data (and, first and foremost, satellite images) as the most suitable technique for large-scale landscape prospection and feature detection in the Middle East has been described in studies by T. Wilkinson, R.H. Bewley, M.J. Fowler, D.L. Kennedy, S. Parcak, J. Ur, etc. [7,8,9,10,11,12,13,14,15,16]. The satellite images can be categorized, from a practical point of view, according to two basic criteria: Availability (commercial/freely available) and date of acquisition (archival/current). In most Middle East archaeological landscape projects, all four of the resulting categories of spaceborne imagery are applied.
A new approach to Middle East landscape documentation has evolved in recent years. With the wider availability of a variety of digital sources for landscape analysis, it has been possible to explore (in addition to the traditional documentation of sites and their surroundings) the more detailed morphological structure of sites. This high-definition approach has a firm place in urban settlement research (for example, in the ongoing project Medieval Urban Landscape in Northeastern Mesopotamia—MULINEM) [17]. Detailed in-site mapping is now limited not by the quality of the datasets but, most of all, by the capacity of pre-processing to exploit their interconnections’.
For any given project, the methodology is, of course, influenced by the type of landscape being analyzed and the chronological period of interest. For earlier sites (e.g., prehistoric flat sites), it is possible to use techniques based on the detection of surface feature indicators (soil, vegetation). Soil marks (anthropogenically influenced soils, that are mostly lighter in color) on the surface are a very typical marker of these anthropogenic features. For the recognition and documentation of this type of archaeological site, the choice of one reliable, highly informative source of remote sensing data, together with tell archeology, is sufficient. For example, the archaeological landscape of the Kurdistan region of Iraq is reliably represented in one single set of images of the historical satellite spy system CORONA, taken on 27 February 1968 [18].
The morphology of late sites (Sasanian or Islamic periods), on the other hand, can be characterized not only by the frequent preservation of above-ground relics of buildings, but also by a much more detailed distribution of soil, vegetation, and moisture characteristics than in the case of early flat settlements. For this reason, the researcher is often able to acquire a much deeper knowledge of the inner morphology of the settlement areas. In such situations, it is more efficient to search for and collect a wider range of remote sensing data, and thus obtain data that makes visible the whole spectrum of markers of anthropogenic features. In terms of the methodological approach, the main focus is to creatively exploit the diversity of remote sensing data and attempt to intensify their interconnections and general interpretation (something that cannot be done in projects that are based on the exploitation of a single data layer).
Satellite systems play a crucial role in the Middle East landscape archaeology. Site detection is only the first step. Depending on the type of archaeological project and the availability of data sources, researchers have to ask how deeply they want to analyze a site and how much information they want to obtain. In the past, Middle East landscape archeology was mainly tied to low-resolution satellite systems (CORONA, LANDSAT, etc.). Landscape archeology based on this type of data traditionally emphasized the basic mapping of individual sites in the form of known points or polygons on a map base and in the database system, without detailed documentation of individual features. In recent years, by incorporating historical data (high-resolution satellite images, aerial photographs, umanned aerial system (UAV) technology), landscape archeology has been able to offer a more detailed intra-site approach. Examining shadow and vegetation marks and the extent of anthrosols, which are detectable on data sources with a very high spatial resolution, alongside detailed elevation information, opens up new possibilities for detailed in-site documentation [17] (pp. 13–17). Data sources which have made a significant contribution to this methodological approach are the satellite systems KH-9 Hexagon and Orbview-3 (whose images from the period of 2003–2007 have been made available through the American USGS) and, above all, historical aerial photographs, which have been collected in the Middle East since the first half of the 20th century [19,20,21,22].
The archived aerial images, which are traditionally used, are images of the American U2 spy system operating from the 1950s to the 1970s. Each U2 mission produced very clear, high-resolution images. They can be obtained through the National Archives and Records Administration (NARA). In 2018 a spatial index for the declassified Middle Eastern missions in NARA for the period 1958–1960 was published by Jason Ur and Emily Hammer. Geospatial data for the spatial index is downloadable from the Harvard Dataverse [23]. As older sources, images from the GX Luftwaffe reconnaissance collection and collections of the British Royal Air Force and the US Air Force have been used. The resolution of those images is mostly under 1 m, and in most cases, in centimeters [20]. Historical aerial photographs, together with satellite imagery, create a basic database of input source data for more detailed analyses of morphological aspects of archaeological sites, and their most significant application is in the area of research on deserted or still-occupied urban units (Figure 1).
One crucial technique in the analysis of the detailed morphology of urban settlements is the use of elevation databases. In the Middle East region, the most common type of elevation datasets utilized during landscape research are digital elevation models (DEMs), extracted from freely available SRTM or ASTER data sources (https://earthexplorer.usgs.gov/). These elevation models have a resolution of 30 m, which is suitable for visualizing the elevation of geographically larger-scale areas. The ALOS Palsar Global Radar System offers a 12.5 × 12.5 m cell elevation model (https://www.asf.alaska.edu/sar-data/palsar/). The use of such models is insufficient in the case of detailed geomorphological analyses of intra-site features. Their usage as a base layer for the orthorectification of multi-temporal datasets is limited. As an alternative, digital elevation models extracted from stereo pairs of satellite imagery—and recently from the more and more frequent use of unmanned aerial systems (UAVs)—can be used. Such images can be used to create a highly accurate elevation model with a spatial resolution in centimeters. Over the past few years, this technique, which has become indispensable in archeology in general, has also been integrated into Middle Eastern archeology [17] (pp. 20–22). Its outputs often serve as background data for the mapping of very precise and detailed morphologies. However, no current UAV image is able to provide a historical dimension, which can only be obtained through a continuous study of archival aerial and satellite photographs.
Kona Makhmūr is located next to the modern town of Makhmūr, 65 km southwest of the Iraqi Kurdistan capital city, Erbil (coordinates: 35°46′21.10″ N, 43°35′42.42″ E). Its unique placement in the center of the very fertile historical province of Adiabene (northeastern Mesopotamia) indicates its key strategic position as an agricultural and trade center. The site was discovered in 2012 [24] and documented within the scope of the Medieval Urban Landscape in Northeastern Mesopotamia (MULINEM) research project during the years 2013–2015. It is characterized as a deserted medieval town dated to the 8th–9th century [17] (pp. 102–160) (Figure 2).
Within the MULINEM project, this site was subjected to a detailed, nondestructive archaeological survey, based primarily on the use of remote sensing data from historical aerial prospection. Its well-preserved anthropogenic microrelief is rather unique, as large parts of the site have not been used for agriculture. However, the site is currently endangered by the extensive development of the existing town of Makhmūr, which puts it into the category of immediately threatened sites. Before the arrival of archaeologists from the MULINEM project, the northwestern part of the site was destroyed by the construction of new buildings. Therefore, the analysis of this part was possible only on the basis of historical remote sensing data.
Within the processing of remote sensing data and geographical data, three main outputs were defined:
- (1)
- A topographic plan of the site (current state x historical state);
- (2)
- A digital elevation plan of the site in high resolution;
- (3)
- Detailed plans of selected anthropogenic relics and their reconstruction.
3. Materials and Processing Methodology
3.1. High-Definition Approach
The source data for the documentation of the spatial topography of the Kona Makhmūr site comprised datasets in various resolutions and on various geographical scales. For their deep prospection, the most appropriate methodical approach was to create a multilayered dataset from the available range of low- and high-resolution rasters (multi-temporal GIS). An important aspect of such a project was the maximally exact georeferencing of individual layers with respect to each other, to eliminate the spatial deflection of features during digitization. Another important factor influencing the analysis of input data was visual graphical processing. Basic original views often do not allow the visualization of all of the features captured in the image. Therefore, it was highly recommended to consider the process of application of combined visualization algorithms on each raster image prior to the formation of the final plan of the site (Figure 3).
3.1.1. Multi-Temporal Dataset Processing
In the case of Kona Makhmūr, datasets were sequentially analyzed, from those with the lowest resolution to those with high and very high resolutions. By georeferencing and orthorectifying the datasets, we were able to create a multi-temporal GIS project tracing the site in its various historical stages and on different scales, from the most general to the most detailed. To ensure that as many positional deviations as possible were eliminated, all individual layers were georeferenced and rectified to the most accurate topographic and hypsometric base layer—in this case, a ground control points layer (GCPs distribution was projected as a grid covering the site at regular intervals of 30 m), staked out directly in the field during the year 2015 by sub-metric GPS (Figure 4).
Another issue we had to deal with was the variable size of the remote sensing imagery stripes. The dimensions of the satellite CORONA stripe were not proportional to those of the images taken from the planes. This fact heavily influenced the possibilities of orthorectification. The highest standard deviations were recorded for the larger images, where the impact of image distortion was higher. For superior processing of large-format images (CORONA, Hexagon, Formosat-2), after the initial orthorectification, these images were cropped using a polygon of the site area and its close surroundings and re-orthorectified.
The first orthorectification used 4 GCPs (the corners of the images), a digital elevation model (DEM) with a resolution of 12.5 m, and a 1st order polynomial transformation. This method was applied to the stripes of large-format satellite imagery (CORONA, Hexagon, Formosat-2, WorldView-2). The freely available ESRI World Imagery layer was used as the base layer for GCPs detection. The topographical accuracy of all georeferenced layers was limited by the accuracy of this layer (field verification indicated a topographical deviation of 2.8 m). The total root mean square (TRMS) of images oscillated between 18.8 m and 9.6 m. In the following phases all the parameters were changed—mainly because high-resolution DEM (resolution 20 cm) was obtained from the UAV documentation and the GCPs taken directly in the field. The orthorectification was reprocessed to match the new methodological approach. A 2nd order polynomial transformation was used as the main processing method, the grid of measured GPS points (with the combination of 4 corner GCPs on large satellite stripes) was used as the GCPs. The base DEM with the resolution of 20 cm was obtained from the UAV photogrammetrical dataset. The total RMS error in the area of the site decreased significantly (6.4 m–1.1 m). The last phase of orthorectification re-processing was the intentional reduction of original large-format images. Only small parts of these images were used as the layers for orthorectification. After this processing phase we were largely able to eliminate the total RMS errors. (Table 1). As a superstructure of the basic visualization, the subsequently selected base layers were subjected to further processing. The use of visual filtering algorithms and the processing of elevation data into a differential digital elevation model proved to be highly effective.
3.1.2. Filter Visualization Algorithms
The raster data group used for the detection of archaeological features had a wide range of spatial resolutions, along with a non-uniform color classification format (panchromatic x multispectral data). For this reason, the application of filtering algorithms capable of working with the multivariate color spectrum option as well as variable cell size seemed to be most appropriate. By testing a wider range of filtering algorithms, the Sobel filter and High pass filter with the point spread and variation of the spectral parameters RGB and NIR were chosen as the most appropriate.
The Sobel filter (Sobel operator) was based on edge detection, and it was used to find areas of pixels in which the brightness changed significantly. Filters can only emphasize edges or lines of a certain orientation in the image. The Sobel filter emphasizes all horizontal and vertical edges and lines in the original image. This filter is, therefore, the ideal choice for morphologically heterogeneous features.
The High pass filter works on the principle of detecting edges and lines in the image, which were highlighted by filtering, while other areas were simply replaced with ‘uninteresting’ medium/neutral gray. The filter thereby separates high-contrast areas from low-contrast areas. In our case, it was used thus that the areas with low (no) contrast remained intact, and sharpening was really done only where there was some contrast. The algorithm was subsequently able to detect even relatively indistinct, hidden (weak) lines and able to transform them into a vector display successfully.
RGB—reclassifies the range of RGB spectral values to increase the visibility of individual features.
NIR—increases contrast visualization and vegetation detection.
These filtering visualization algorithms were also used for historical satellite and aerial images, resulting in an increase in the number of visible features compared to the originals without any graphic processing (Figure 5). Semi-automatic feature detection and extraction (OBIA) were also tested with filtered outputs. Segmentation settings were set to parameters of 60.0 scale level (edge algorithm), full lambda schedule (merge settings), and 35.0 merge level. The texture kernel was set to size 3. In this case, the detection of features was unequivocally more successful than with the original satellite and aerial images, but still, the ratio of correctly detected features was only 23% of all features (counted from the number of manually digitized features and verified in the field).
3.1.3. DEM–UAV Versus Stereoscopy of Satellite Images
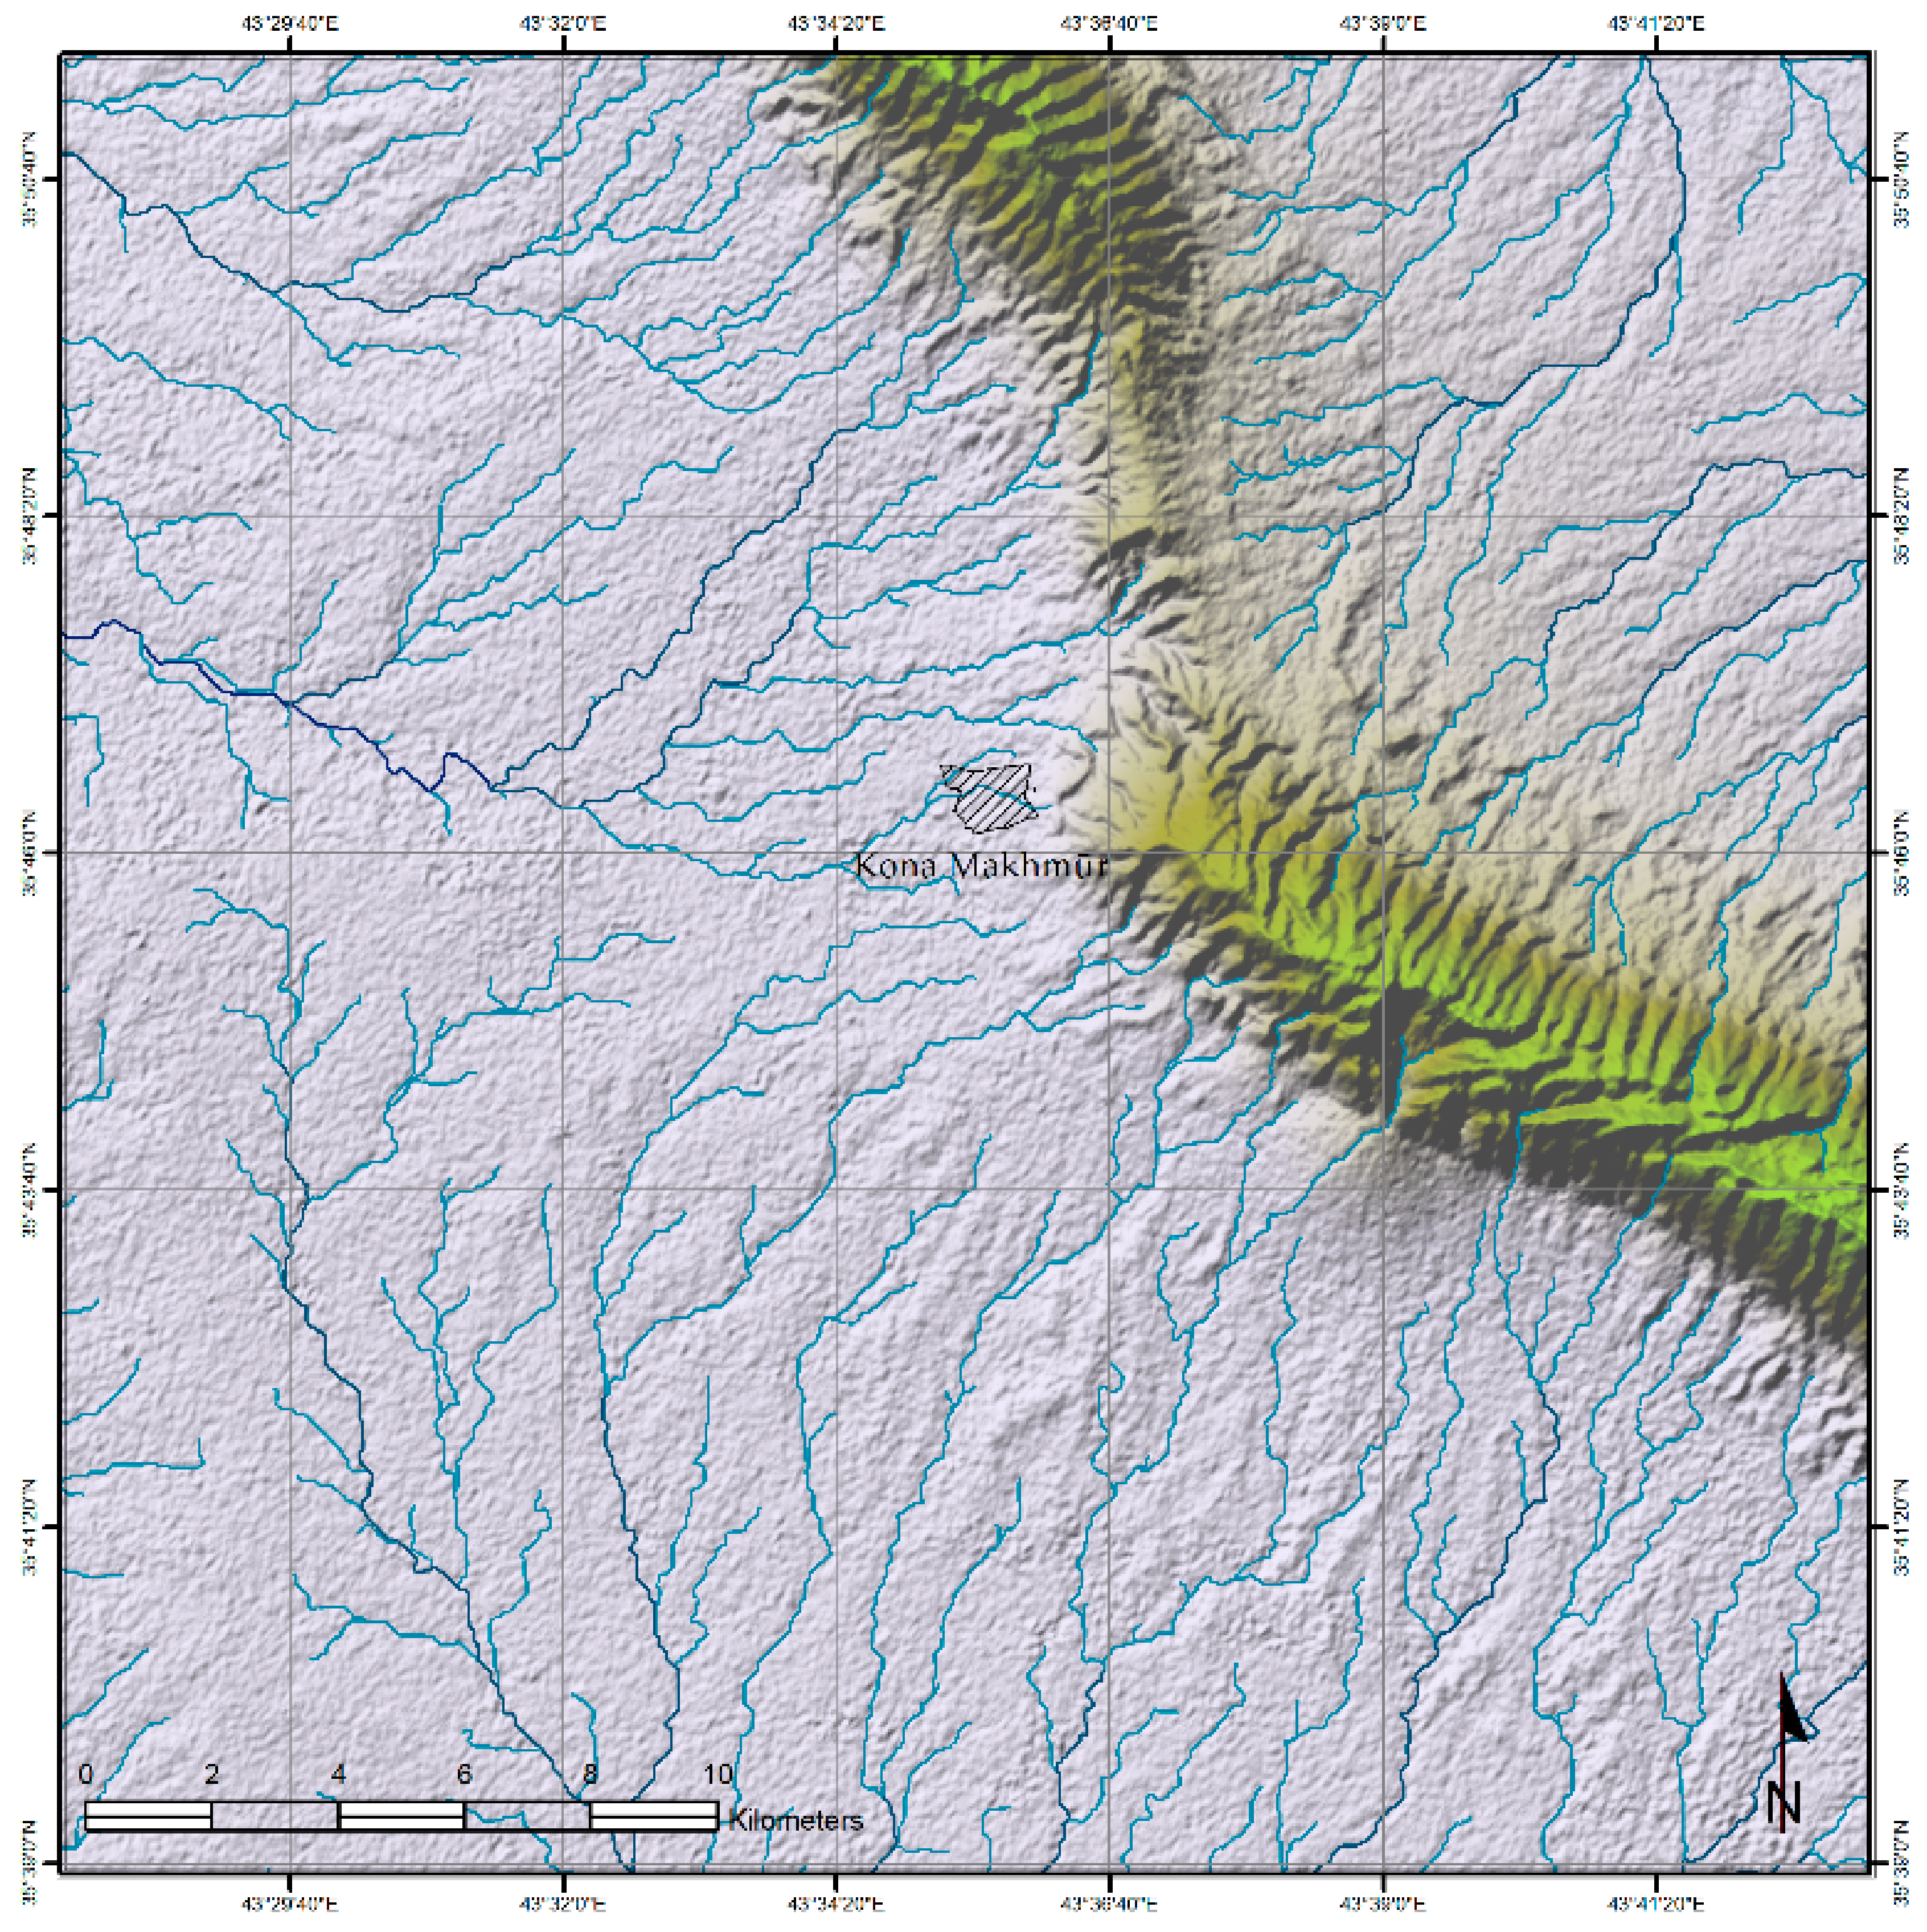
At the Kona Makhmūr site, the acquisition of elevation data depended on accessible data sources. Freely available data (SRTM, ALOS Palsar) were primarily used to generate an overview digital elevation model (DEM) covering the entire range of the site and the surrounding area. The resolution was set at 12.5 m. This model was very suitable for analysis of the landscape context of the site and for some of the morphometric analysis (hydrological reconstruction of the Kona Makhmūr site and its surroundings) (Figure 6).
For high-detail mapping, more accurate elevation models were created using the UAV data and by processing a stereo image of high-resolution satellite imagery. The stereo pair of satellite images were obtained through the Pleiades-2 system, which consisted of 2 satellites that image the earth’s surface for civilian as well as military purposes. The resolution of this system was 0.7 m, and the images were captured in the visible and near-infrared parts of the electromagnetic spectrum. For the Kona Makhmūr site, a digital model with a resolution of 1 m was created (at the Faculty of Civil Engineering, Czech Technical University in Prague). It was generated from 2 frames (acquisition dates: 12 November 2013 for the southern part and 10 December 2013 for the northern part) [25] (p. 140). This digital elevation model proved to be a suitable basis for the analysis of the elevation parameters of the site. At the same time, this model was used as an input source for the calculation and reconstruction of the hydrological network located in the surrounding area of Kona Makhmūr.
The elevation parameters obtained through the digital elevation model, generated from the UAV (the fully autonomous and easy-to-use mapping drone senseFly eBee Classic, operated by K. Pavelka, Faculty of Civil Engineering, Czech Technical University in Prague) were used as the base layer for the detailed intra-site morphological analyses. Two types of camera were used: VIS (Canon IXUS 127 HS) and NIR (Canon ELPH 110 HS). Both cameras were purchased together with the eBee device from a Swiss company senseFly, Cheseaux-sur-Lausanne, Switzerland (https://www.sensefly.com/drone/ebee-mapping-drone/). During 2 flight days, 1181 images were collected. There were 548 images were taken by the NIR camera, and 536 by the VIS camera, with a 5 cm GSD, and a further 97 images were taken by the VIS camera with a GSD of 3 cm. All the images were taken with a minimum overlap of 60% [17] (p. 14). Fly tracks in 2 different directions (north-south and east-west) and at 2 different flight altitudes (100 m and 150 m) were selected. The flight covered the whole 900 × 1200 m area of the site. The resolution of the generated orthophoto was 10 cm for the whole area, and some areas of interest were processed and exported in a resolution of 3–4 cm. A DEM with a resolution of 20 cm was created. The spatial accuracy of the orthophoto and DEM output was set according to the parameters of GPS, integrated in the eBee. The position difference was 2.4 m in this case. The GPC grid was used to reproject the outputs [17] (pp. 15–16).
3.1.4. DEM Visualization Algorithms
Due to the significant limitations of automatic or semi-automatic processing of remote sensing data and our resulting preference for manual analysis, the post-processing of elevation data outputs formed a necessary part of the analyses and description of the Kona Makhmūr site. The application of filter analysis (Sobel, High Pass) clearly made it easier to detect archaeological features and their morphological properties. However, these outputs were limited by the need to work in 2D space. The use of elevation data was a key strategy to increase the efficiency of the detection and mapping of anthropogenic objects in the field. Visualization algorithms were most often applied to aerial laser scanning data in archeology [26,27]. This inspired us to verify their effective use in satellite and unmanned aerial photography data. As a basic unit of elevation data display, the generated digital surface model (DSM) in the form of a hillshade was used. As test data, the UAV data and the digital elevation model, created from the Pleiades-2 stereo pair, were selected.
- Digital Differential Model
The digital differential model was produced at the Czech Technical University in Prague (J. Šedina). Its purpose was to increase the visibility of features. The Digital Differential Elevation Model (DDEM) was inspired by the method of creating a smoothed Digital Terrain Model (DTM) [28,29] when the original DEM was subtracted from a specially filtered identical model. The DDEM is made from a detailed DEM of the site, using a mask of predefined parameters. This mask was then applied to each pixel of the original DEM and gave the pixels new values by calculating the mask pixel average. In the case of the Kona Makhmūr dataset, a mask size of 200 m was selected [30] (p. 144), [31] (p. 340).
- PCA, LRM, Sky-View factor analysis
The application of airborne laser scanning visualization to a remote sensing dataset was a new approach to the graphical processing of a specific type of raster data. In this case too, both types of DEM (UAV, Pleiades) were chosen as the testing layers. All the computational operations were processed using the Relief Visualization Toolbox (RVT) (available at: http://iaps.zrc-sazu.si/en/rvt#v). Two visualizations—Local Relief Model (LRM) and Sky-View factor—were chosen in order to distinguish between feature concavity and convexity. Anisotropic Sky-View Factor indicated the shape of the features in the cross-section (and distinguishes concave and convex features using a black and white scale) while preserving the real image of the topography of the terrain. The Local Relief Model was created by calculating the difference between the two generated DEMs, one of which was modified using the so-called low-pass filter. This modification suppressed the elevation differences in terrain morphology and highlighted anthropogenic relics caused by local elevation differences on the resulting DEM. The Principal Component Analysis (PCA) worked primarily on the basis of the analysis of the principal components of sunlight and the search for factors with similar properties. The number of individual dimensions of the sun’s tilt was determined manually (it was typically in the range of 16 to 64). After applying the PCA, a number of visualization outputs were generated, of which the first contained 99% of the information from the whole file [32,33].
4. Results
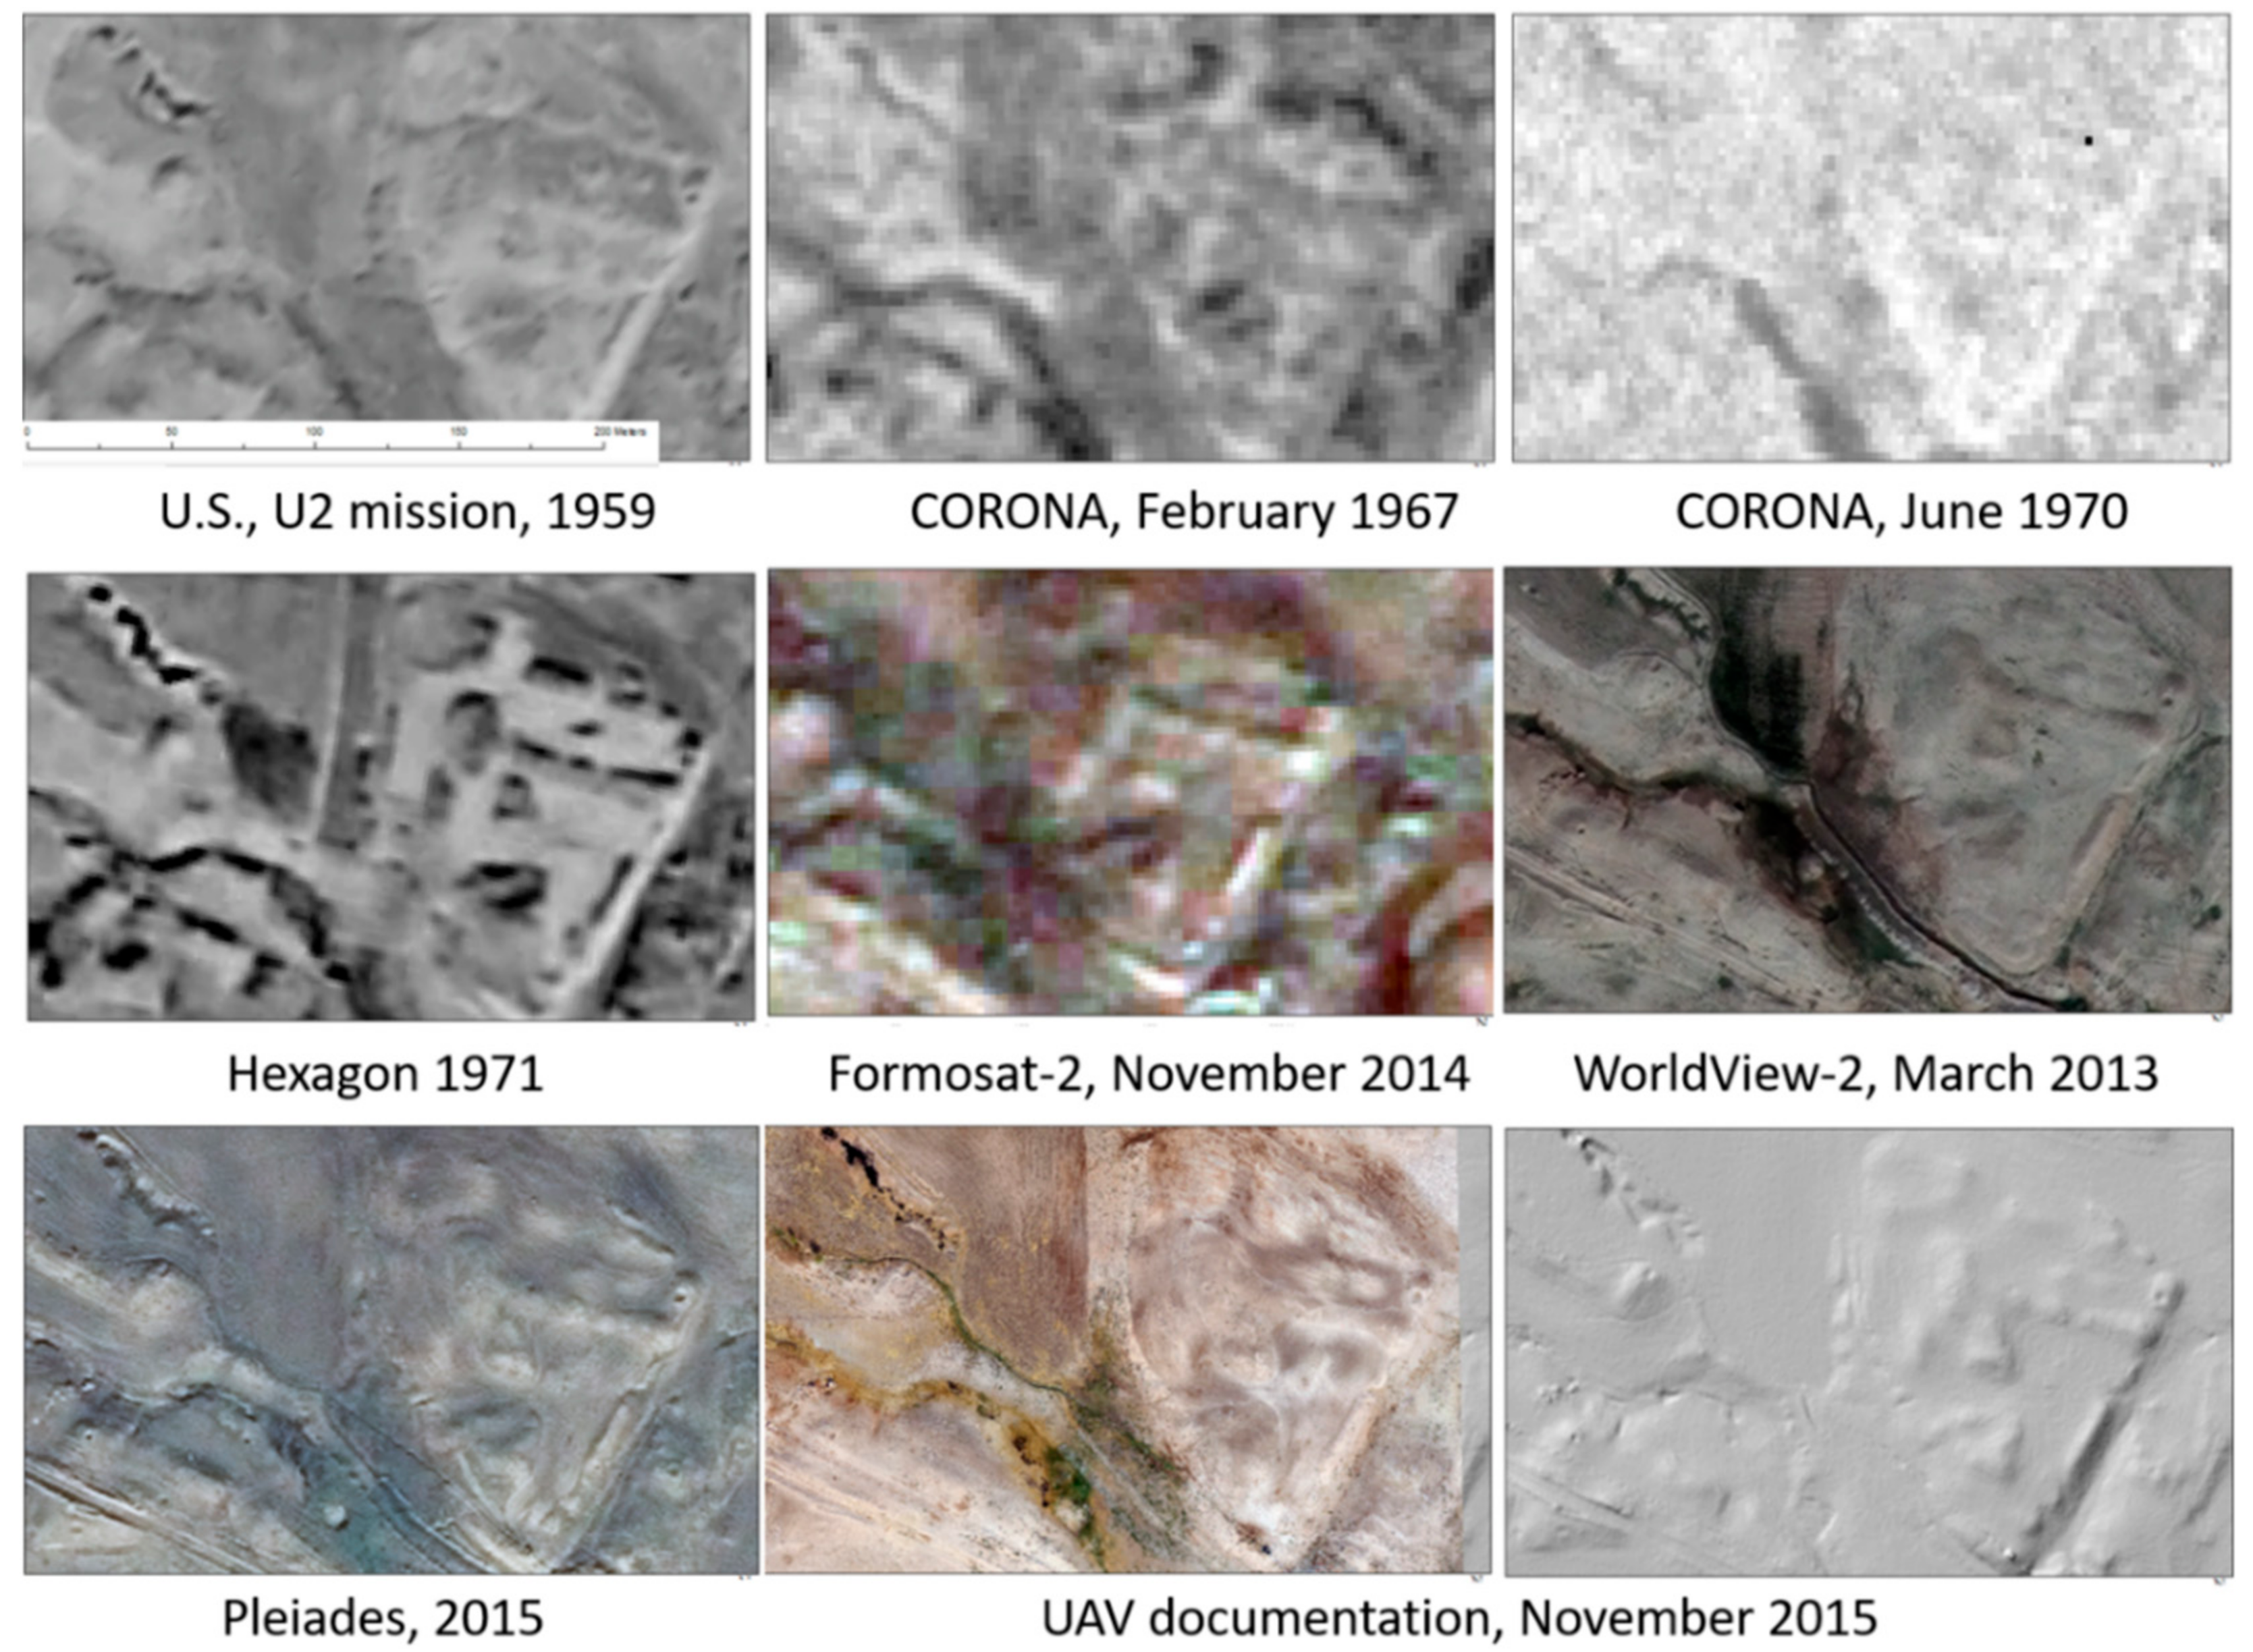
A preliminary assessment of the site (site borders and feature detection) was carried out using CORONA spy system images with a spatial resolution of 1.8–3.6 m. Detection of individual features based on this type of data was rather demanding, and the resulting site plan had significant deviations in edge detection and edge partitions. Comparison of the CORONA images with current satellite images, purchased from WorldView-2 (0.46 m resolution), enabled us to eliminate these errors, but only for features that have been preserved to the present (or until 2013, when the image was taken). As base data for the site analyses for earlier periods, historical aerial photographs were used to provide a record of features when they were better preserved. Geological and human processes—above all erosion and agricultural activity—have strongly influenced the site. By creating a chronological series of base data from the most recent to the oldest, it was possible to reconstruct the dynamics of feature preservation/degradation (Figure 7).
By tracking the visibility and the degree of feature preservation, it is obvious that many features have now succumbed to partial or total destruction. To detect the original morphological aspects of individual features, filtering algorithms were applied to a complete archival dataset. This effectively facilitates the detection of edges and border contours.
We first attempted to carry out a spatial analysis of Kona Makhmūr using automatic or semi-automatic extraction of features on the basis of their classification (feature morphology and color spectrum are two basic criteria used in this process). A very useful application of this technique was the detection of features of a predefined category in a non-urban environment. Auto-detection processes have proven to be very effective in cases of recognition of morphologically similar features whose reflectivity characteristics do not show too much variability (optimally, each object is characterized by one spectral and one morphological classification class). Another positive application is the analysis of the numerical representation of morphologically identical or similar elements in the landscape. In Middle East landscape archeology, this technique has been used in recent years to investigate the impact of looting on individual sites or to detect morphologically well-defined types of archaeological monuments (tells, tombs, etc.) [34,35,36,37].
Those projects primarily perform a pixel-based analysis, using freely available elevation models (SRTM, ASTER) as the background. Pixel classification is based on spectral-radiometric information processing of individual pixels of the raster backgrounds, without evaluating their neighborhood and relationships. For the urban environment, so-called object-oriented image analysis (OBIA) is much more useful. This form of classification goes beyond the spectral analysis of raster pixels, as well as aspects of textures, the morphology of objects, and similar attributes of individual pixels within an object (with its shape, textural, or topological (contextual) properties) [38,39]. It simulates, in a certain sense, the visual classification and interpretation of images by the human visual system. When analyzing a raster with the human eye, one does not work with individual pixels but associates them into homogeneous entities to assign them a certain interpretive meaning.
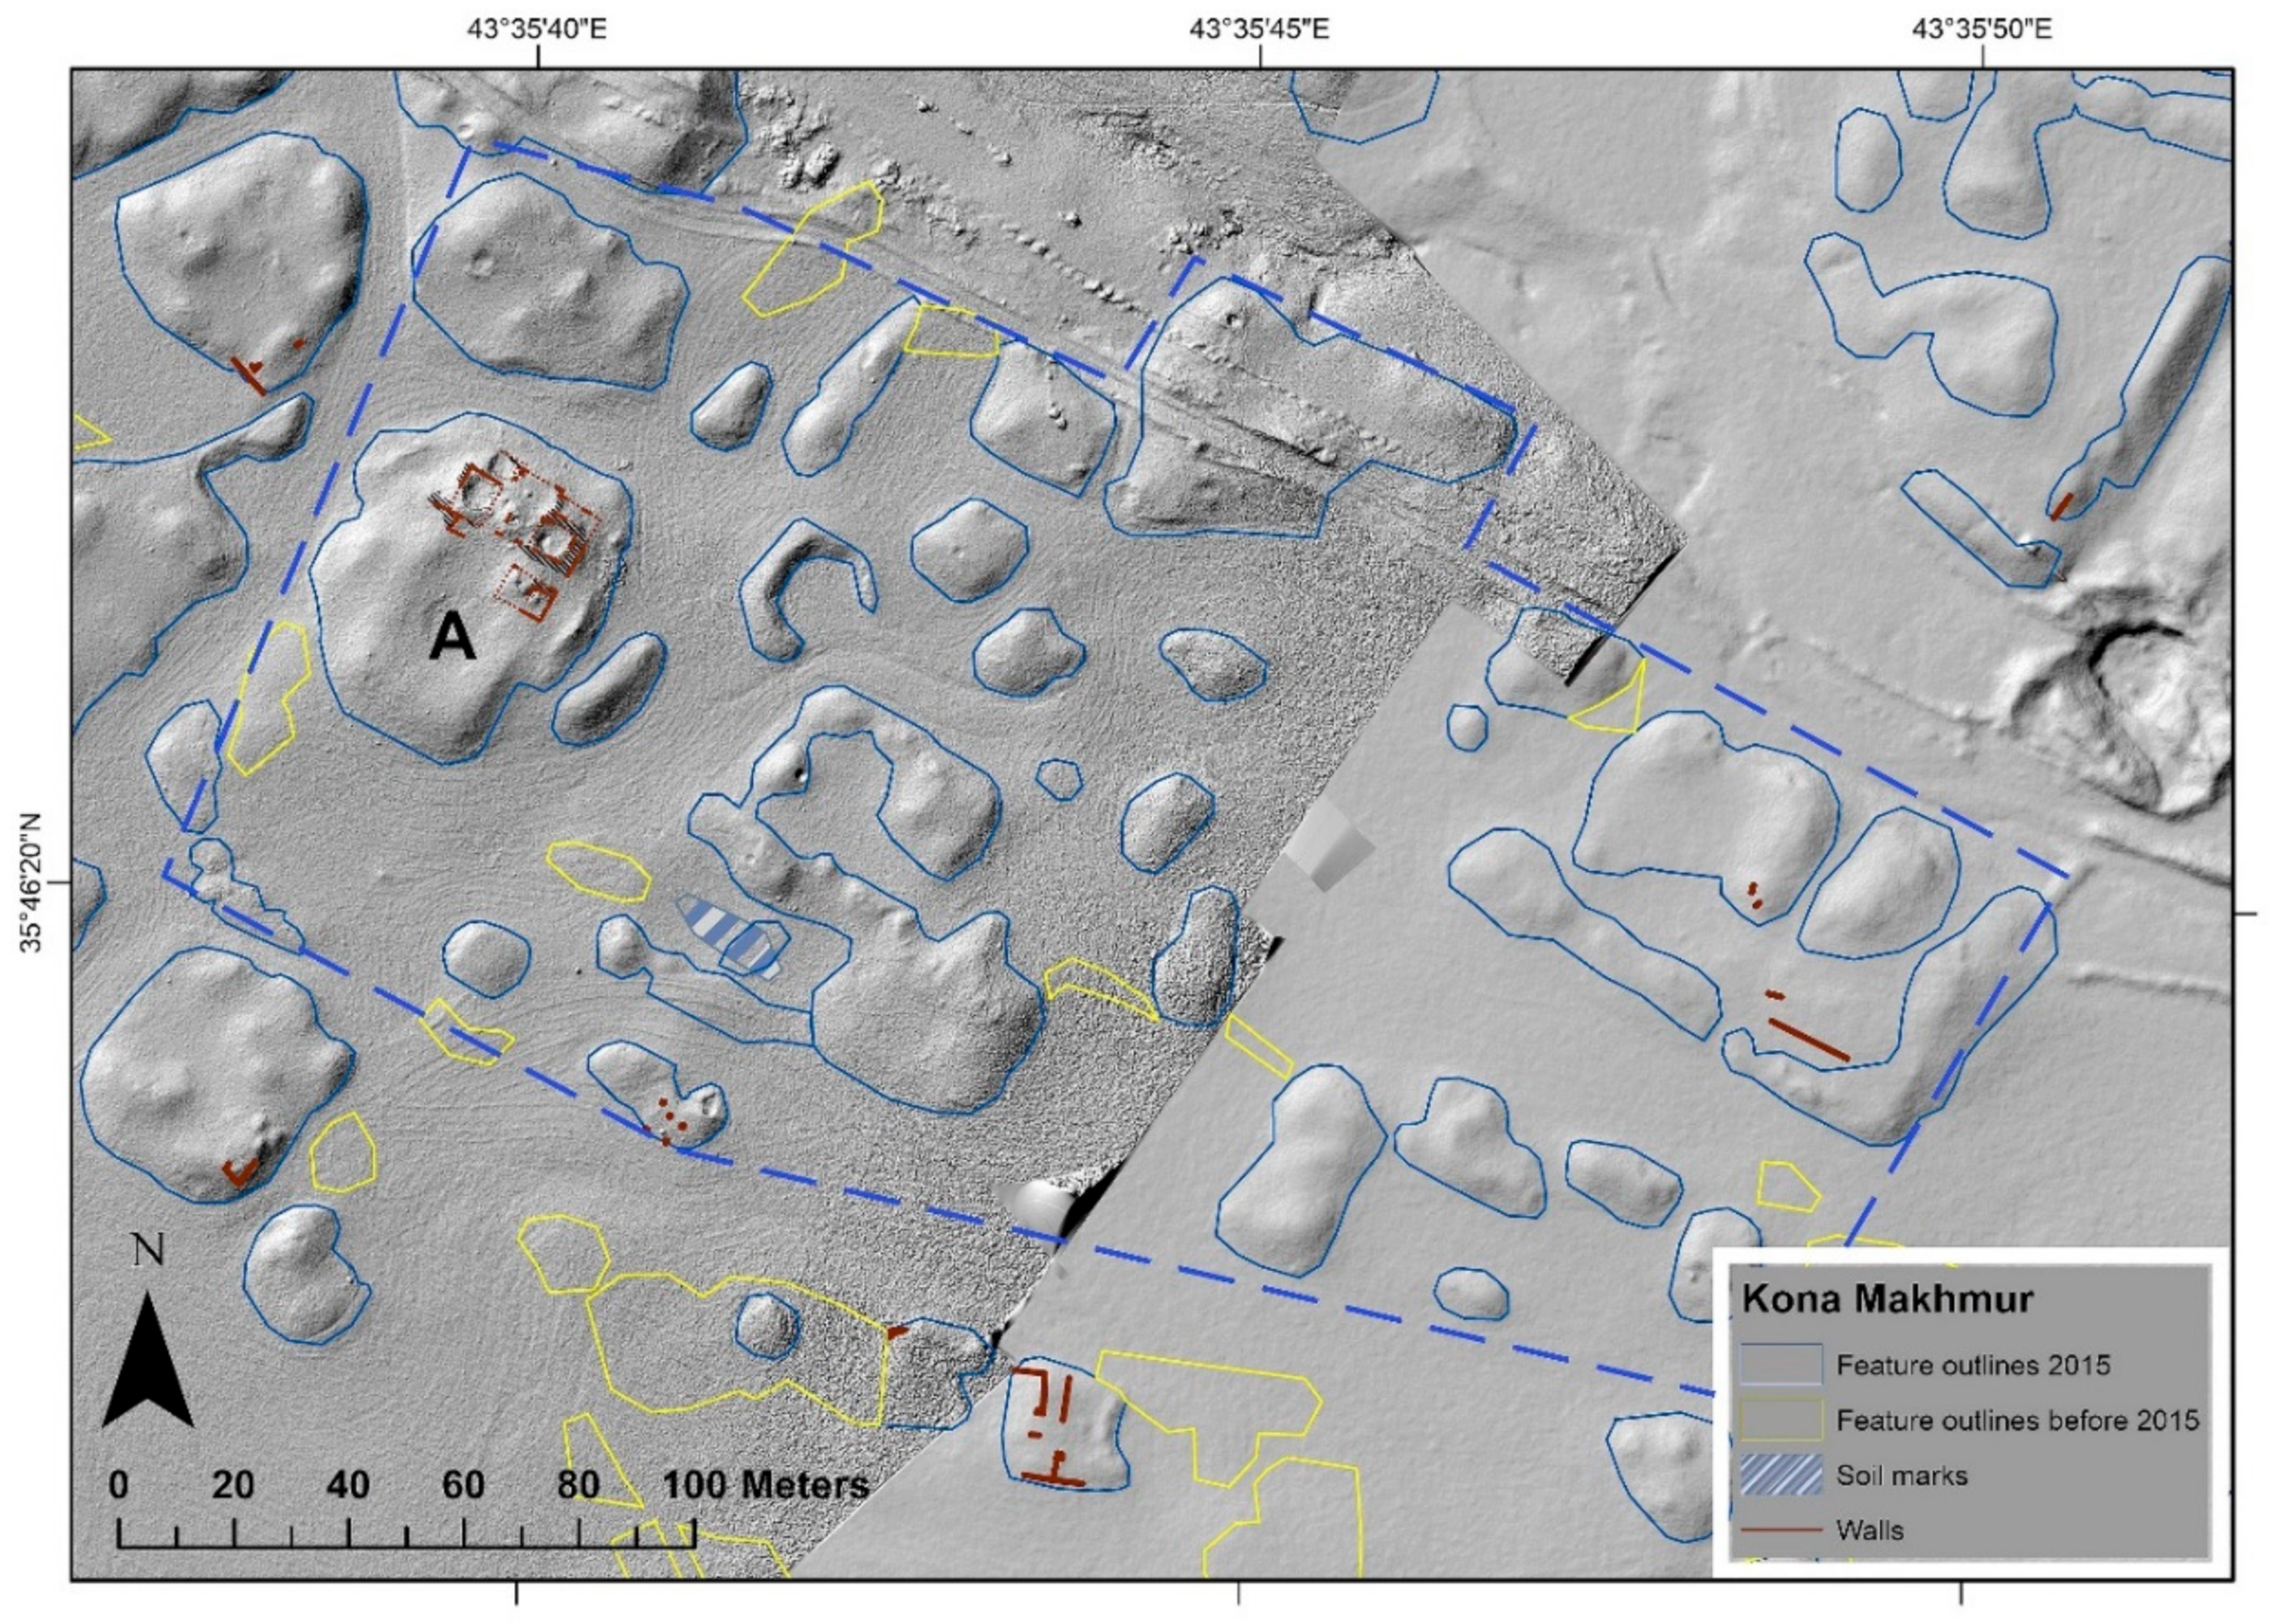
Within the Kona Makhmūr site, experiments with both types of automatic classification were applied but only detected around 20% of preserved above-ground relics. The rate of erroneous detection of non-anthropogenic features as parts of the site was very high. The dry steppe, where the various relics have a very similar spectral classification (based on the soil substrate, the spectrum is more or less at the level of a light brown shade), together with the high variability of the morphological categories of preserved relics placed quite close to each other, represents an inappropriate basis for automatic classification. All relics were, therefore, mapped, digitized, and interpreted manually (Figure 8). Interpretation in the form of manual identification of feature outlines takes into account the current state of the site and its changes, as well as soil and humidity marks.
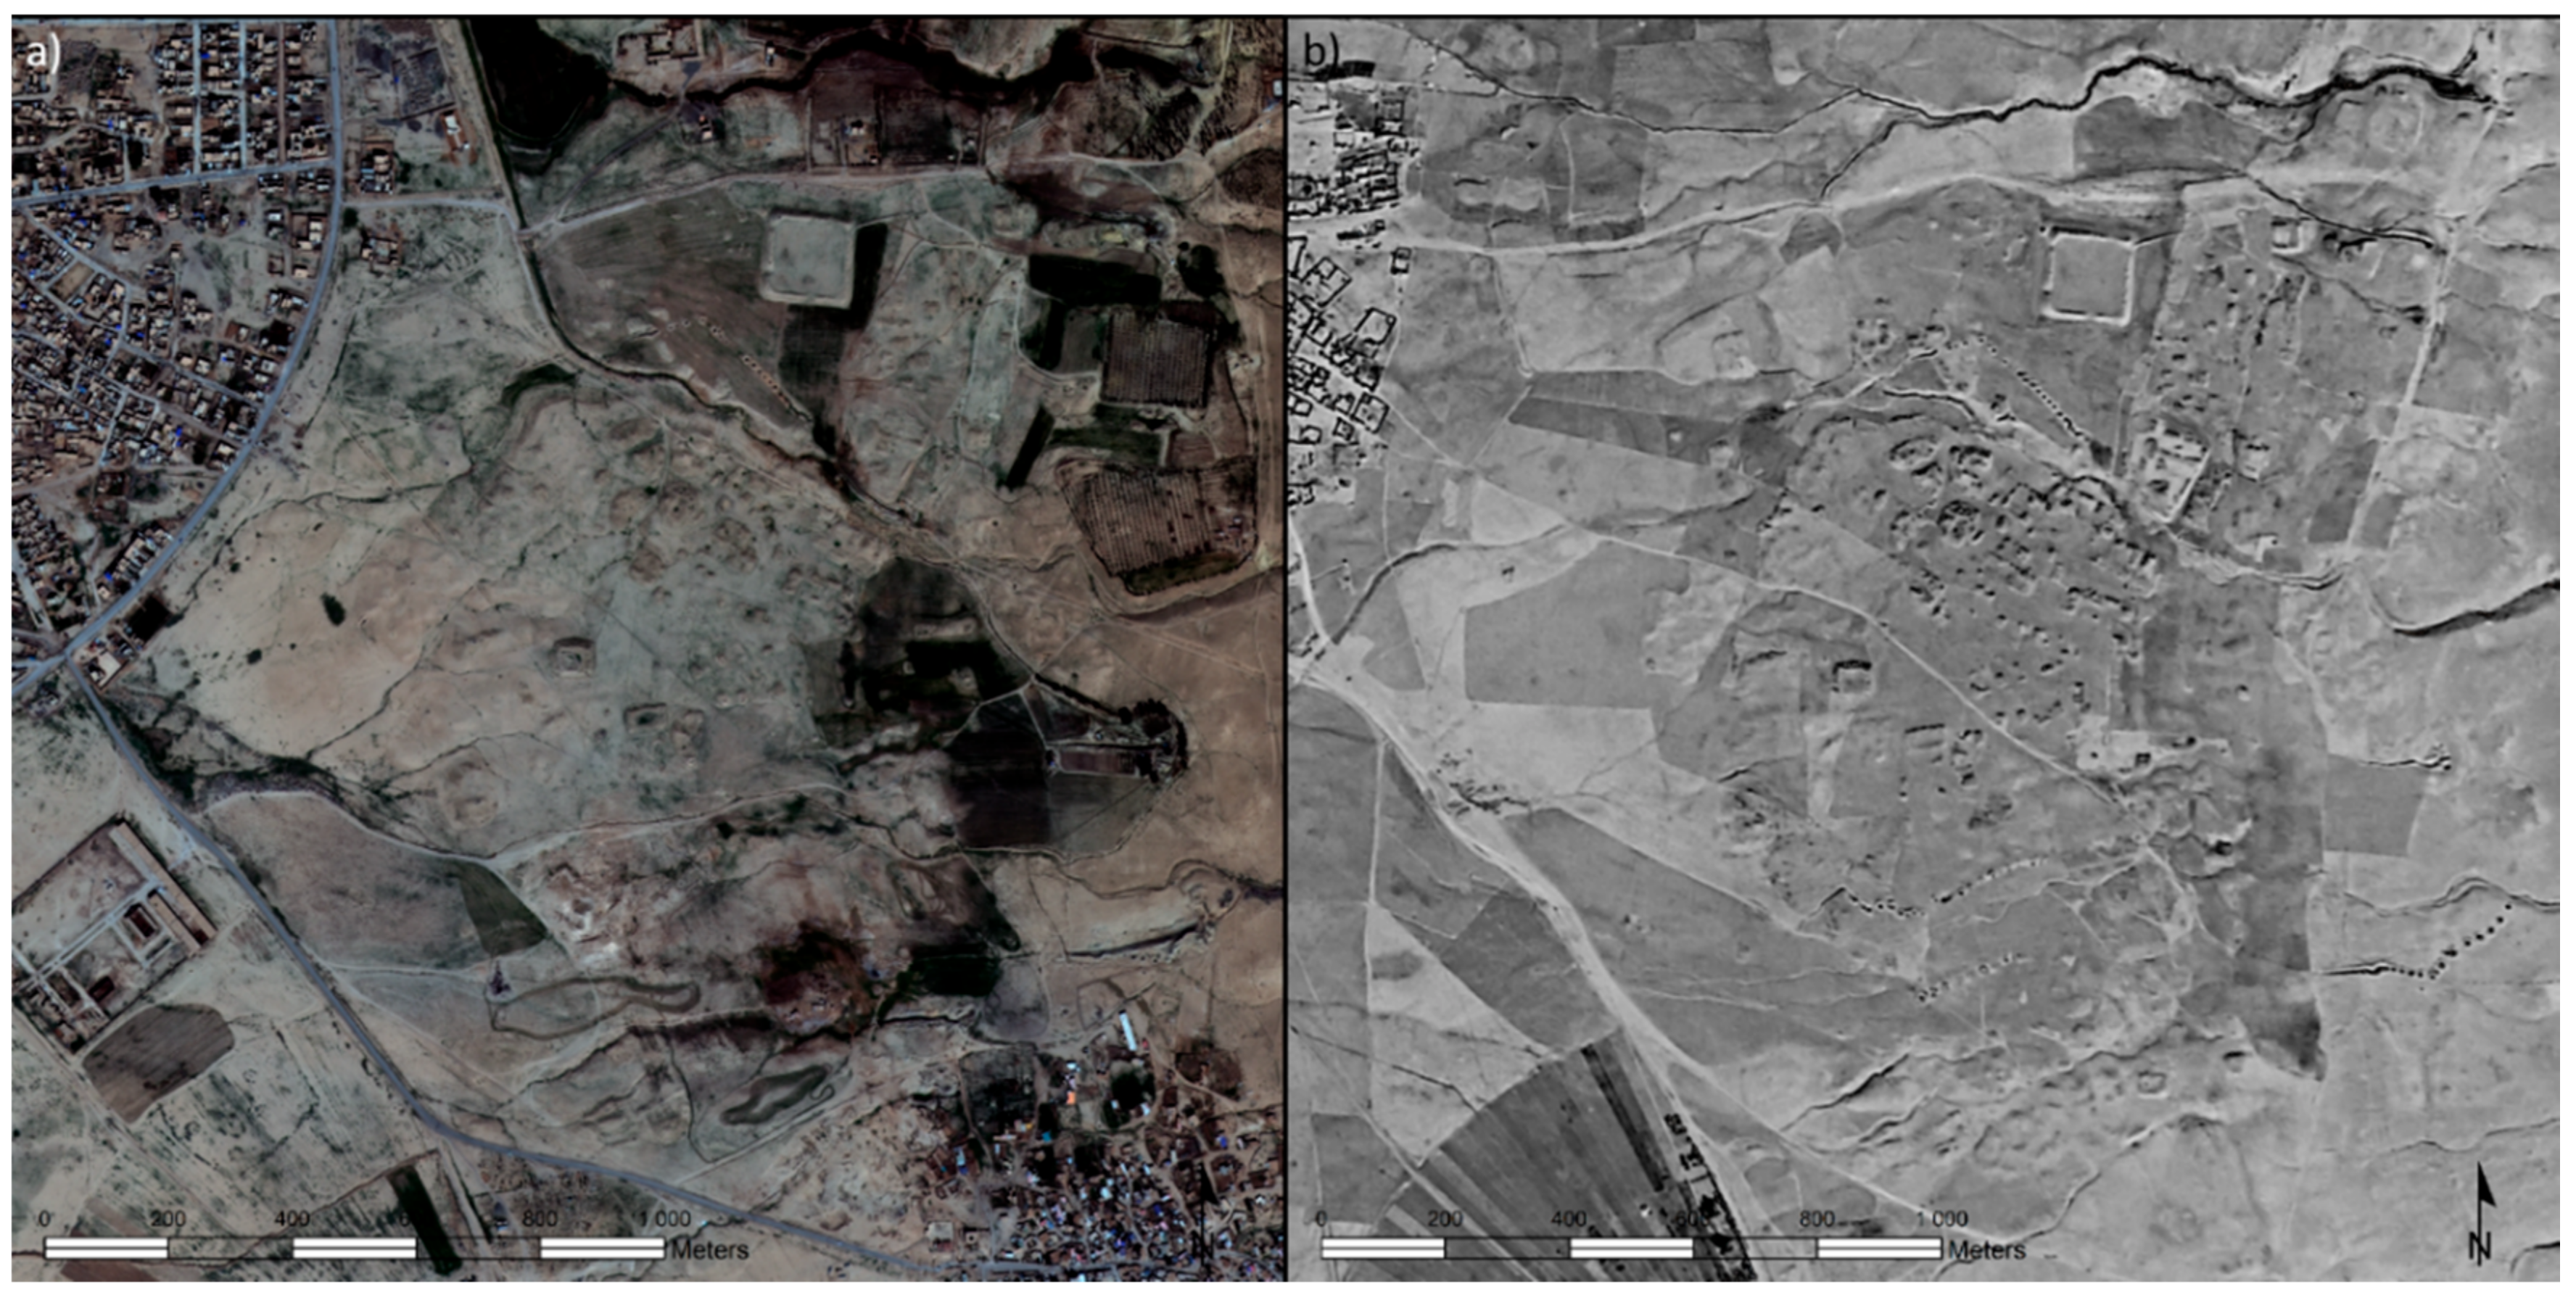
Documentation of Kona Makhmūr was carried out on two main levels: That of the current state of the site and that of the already extinct micro-relief. Historical aerial and archive satellite imagery enabled detailed documentation of complexes of subtle features that have already disappeared. Afterward, it was possible to create a site plan on a much more detailed scale and significantly extend the interpretation of features. Furthermore, it was possible to present the dynamics of the transformation process of the site, situated in typical natural conditions of the Middle East, by monitoring the gradual recession of relics (Figure 9).
During manual classification, the layers containing elevation information were used as one of the most important bases for successful recognition and interpretation of features. Two types of DEM were created: One to be used as a base layer for orthorectification and the other to be used as an interpretative layer for feature detection and intra-site documentation. The first DEM was generated using a stereopair of Pleiades-2 satellite system; the second was generated from the UAV photographical dataset.
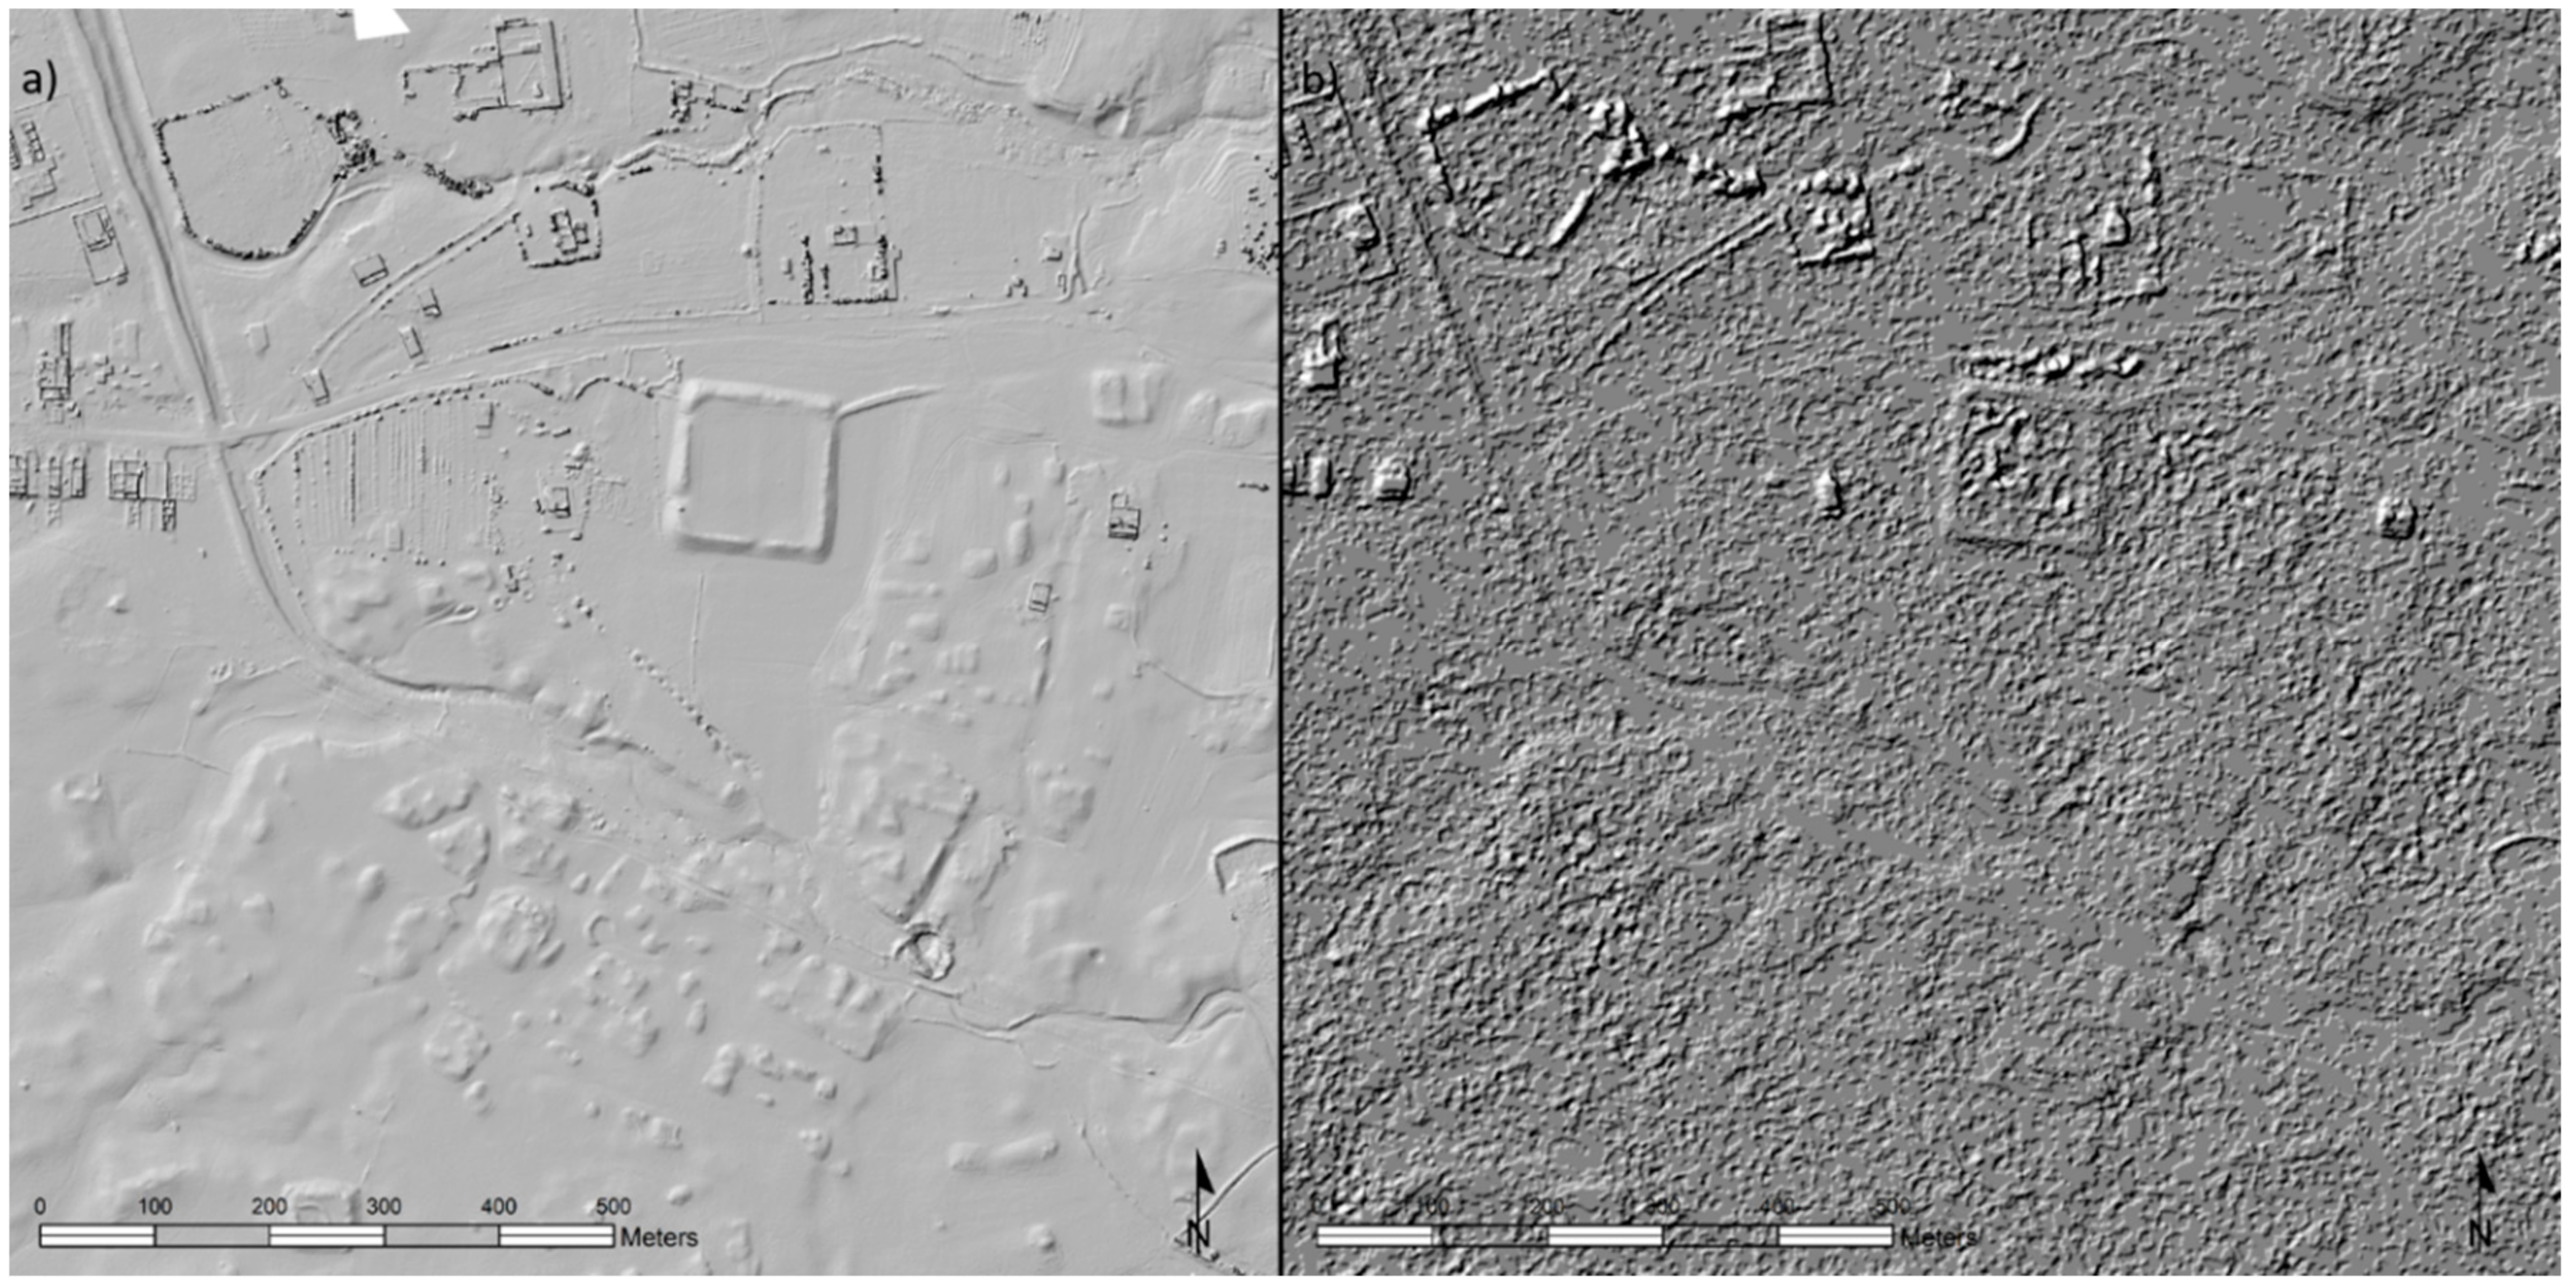
However, the digital elevation model extracted from the Pleiades-2 system proved to be insufficient for detailed in-situ feature detection. Above-ground relics, often preserved only as little elevations, ramparts, and thin lines of stone structures, required a more detailed and precise approach. The best way to obtain proper elevation data when dealing with this type of relic was to use UAV technology (Figure 10).
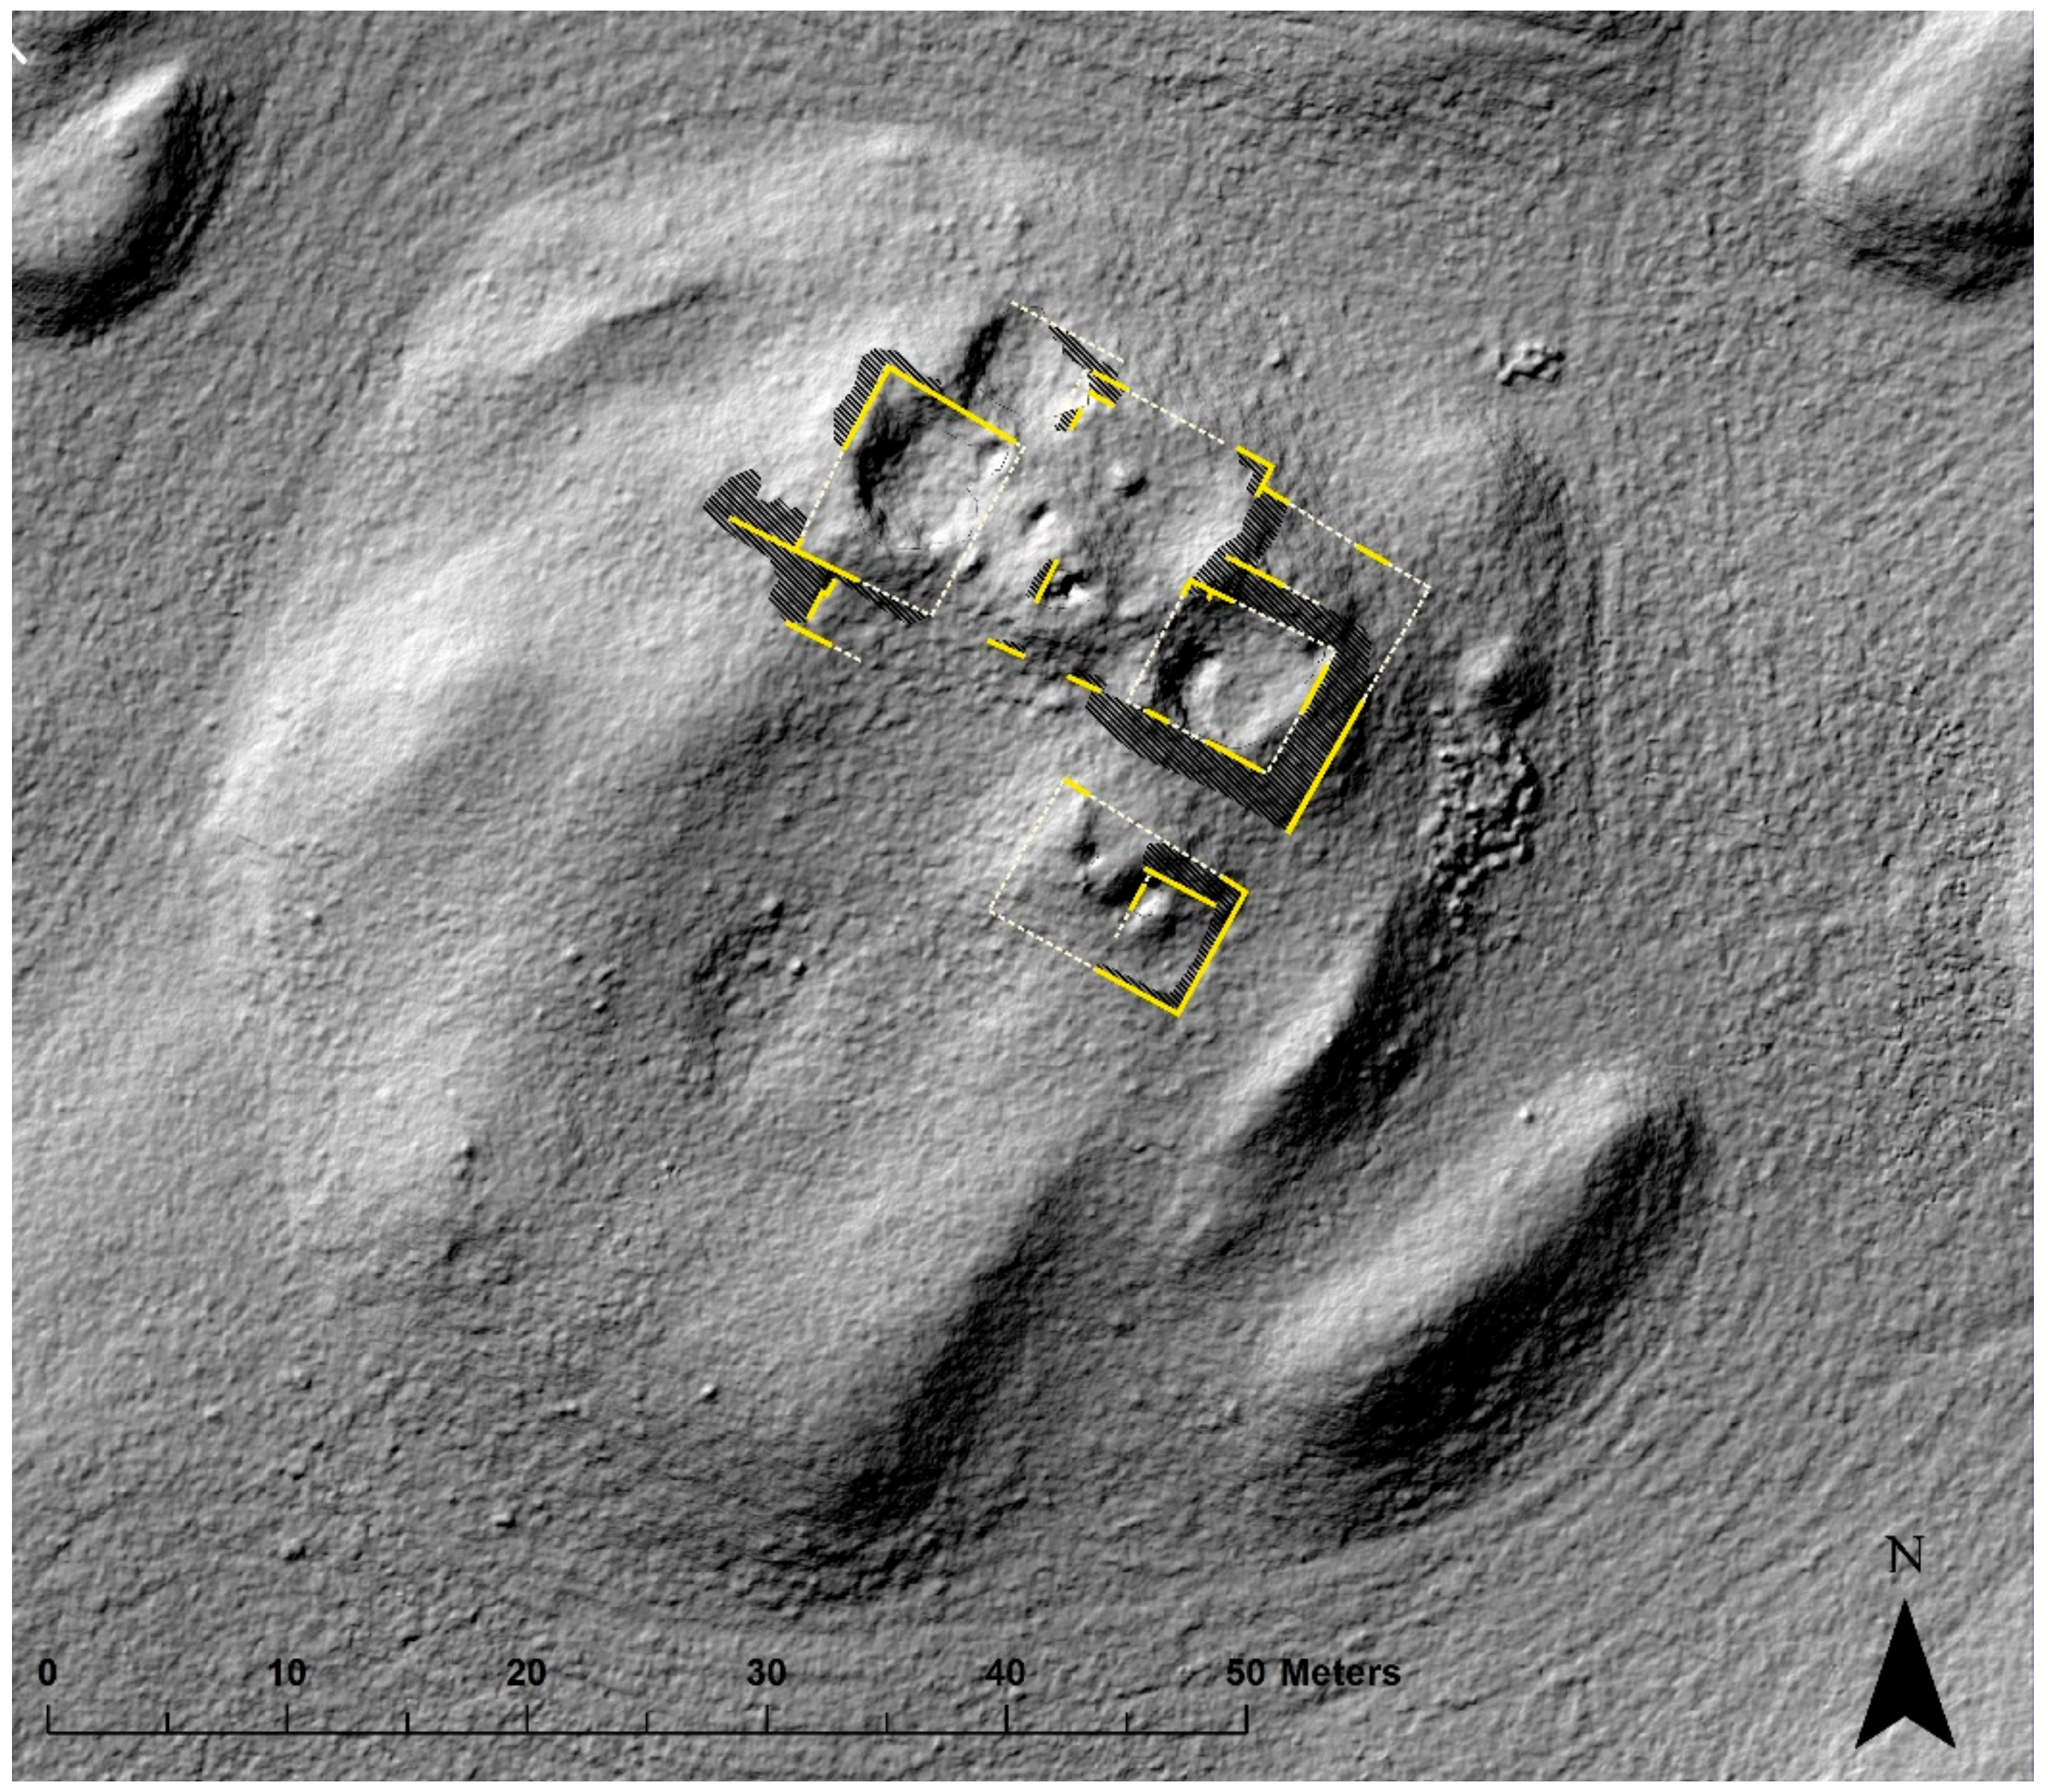
The usage of a DEM interpolated from the UAV photographic dataset greatly accelerated the identification of individual features and, above all, allowed us to identify the preserved parts of the above-ground relics throughout the whole site (Figure 11). To make the visualization more efficient, the elevation model was generated as a 20 cm-difference digital elevation model for the entire site, with a resolution of 6 cm for selected sections. This resolution, along with the 3 cm resolution of the orthophotomaps, was the highest raster data resolution created within the project. Comparing interpretative knowledge about the site obtained before and after the use of digital elevation data files, it is clear what a significant role they now play in analyzing and mapping large-scale urban sites. The 3D view allowed us to detect over-ground relics, which are difficult to notice in the field and to map them directly into the GIS environment. The mapped line of preserved parts of the above-ground masonry very effectively allowed us to interpret individual parts of the site (in combination with field walking) through nondestructive intervention.
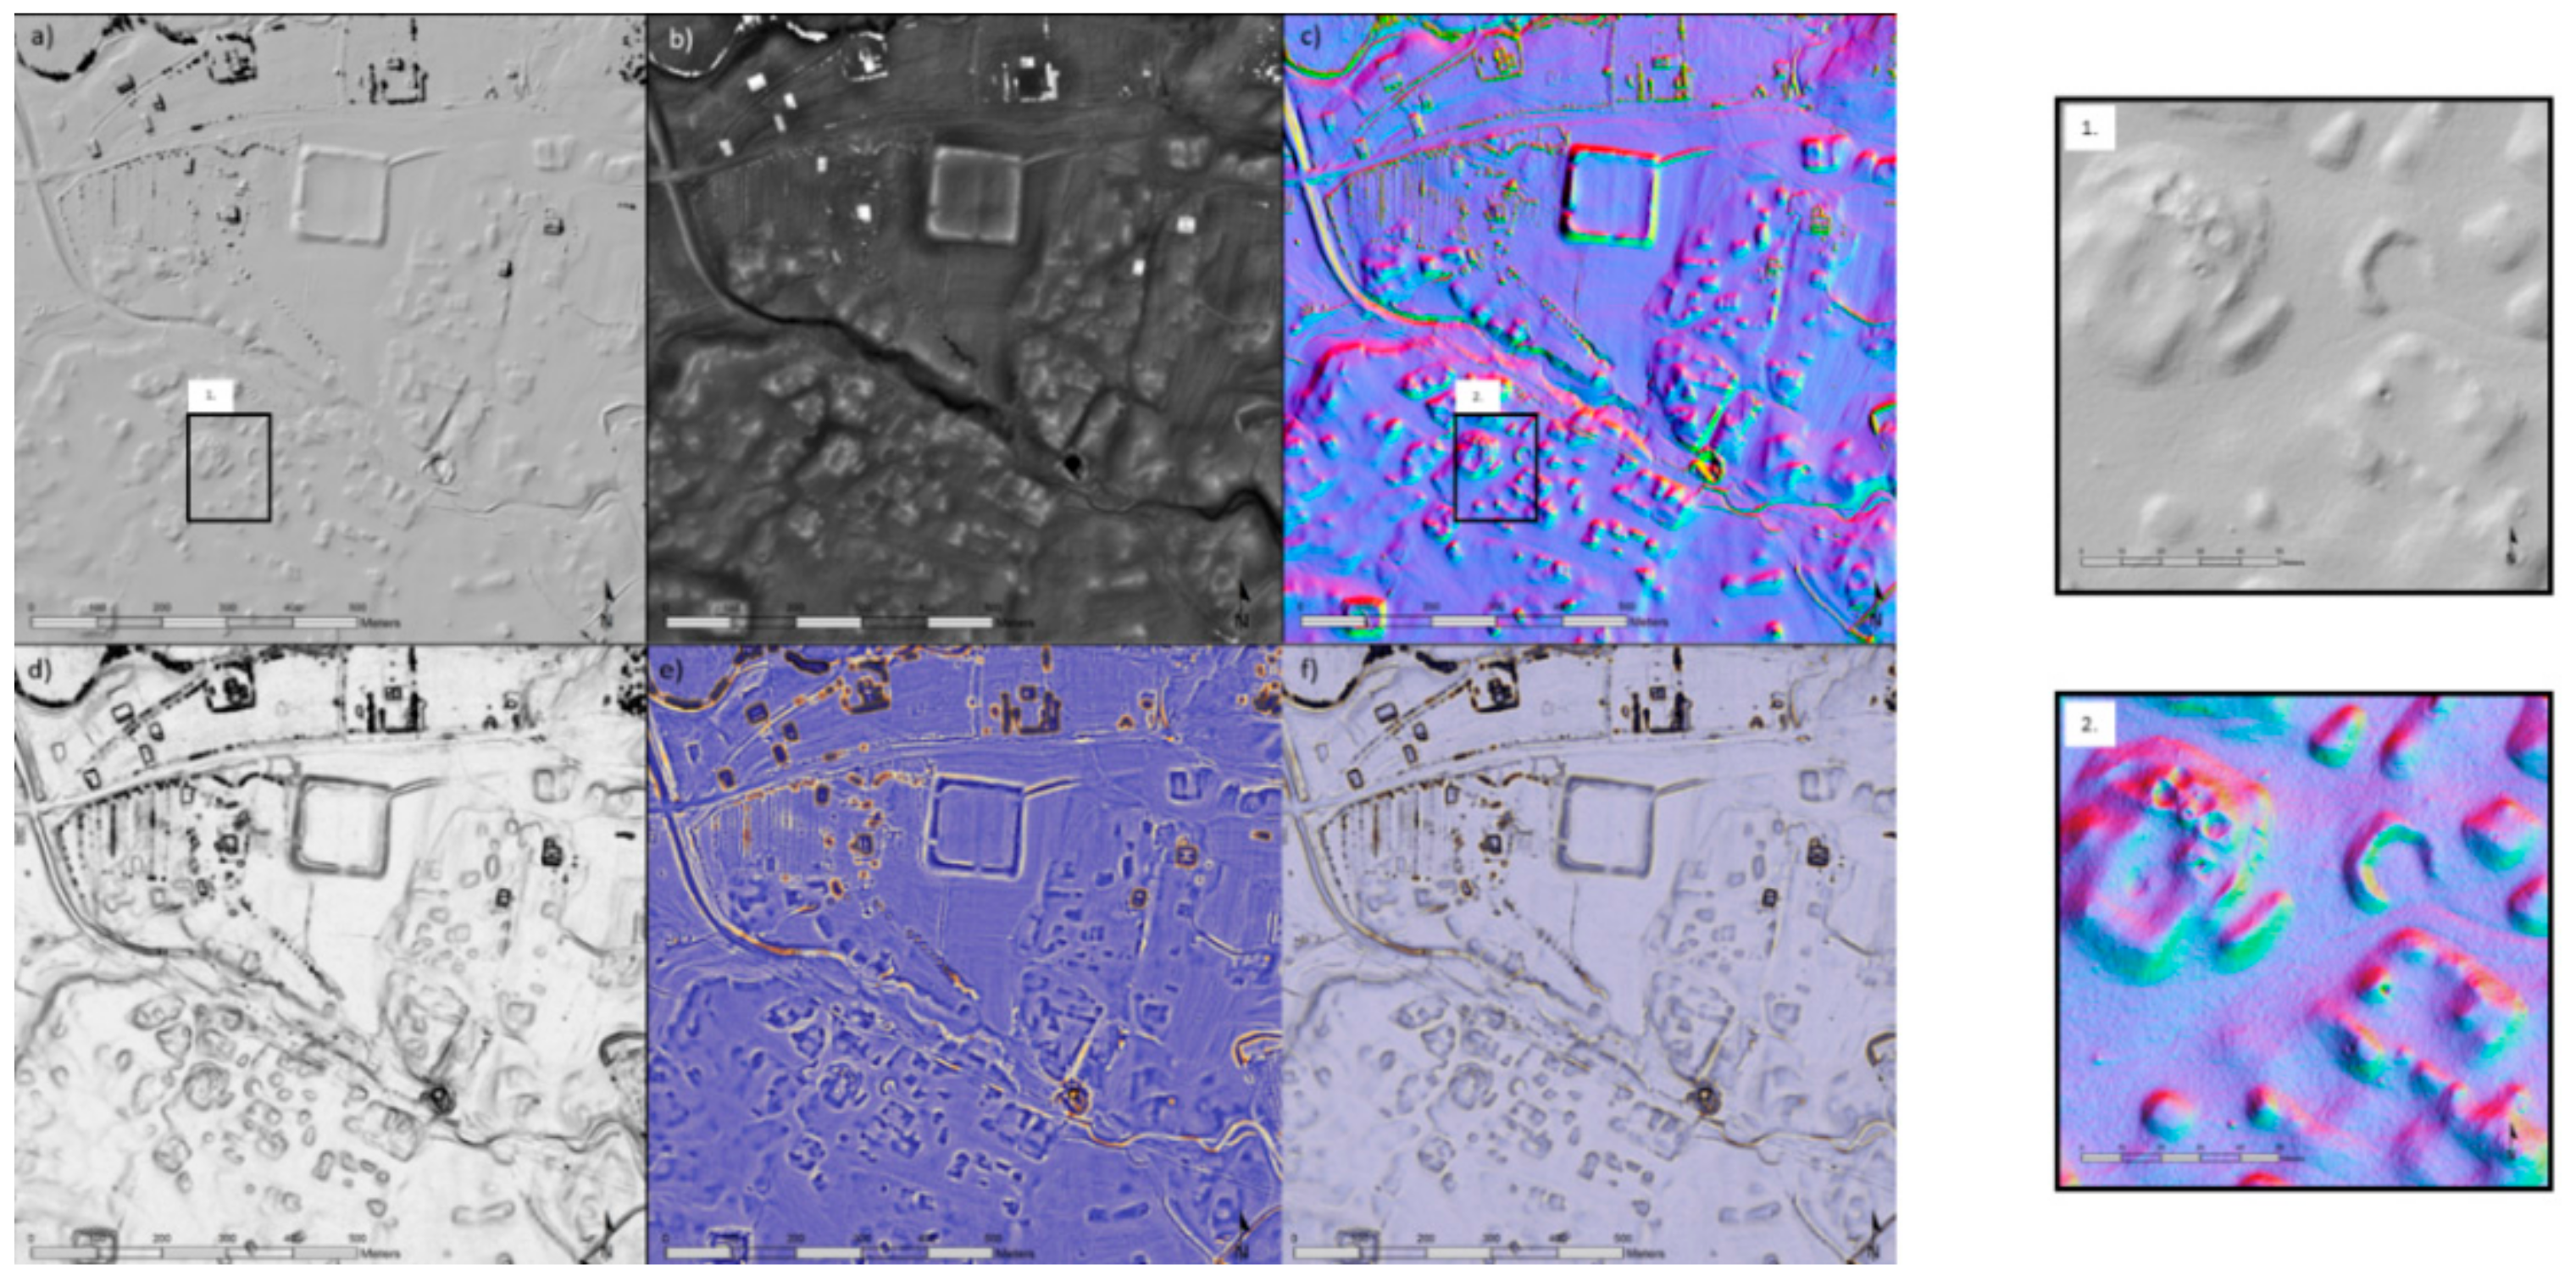
The final step in the high-definition approach was the use of a visualization algorithm to highlight feature visibility. Our evaluation of the use of DEM visualization algorithms clearly demonstrated an increase in the number of features detected (Figure 12). All applied forms of visualization showed improved visibility of features by manual detection and classification. The total number of detected features increased by 34%, from 128 primarily detected features to a final count of 206 features.
5. Conclusions
The political and social turmoil of recent years is turning Middle Eastern archaeology into much more of a protective component of historical heritage than it has ever been before. Extensive conflicts very often preclude full-scale archeological research: In many cases the only way to document and analyze archeological landscapes is to take an indirect approach based on remote sensing data. To achieve optimal results, it is necessary to combine a larger spectrum of remote sensing datasets—a practice only rarely seen in present-day research [40,41,42].
The use of contemporary remote sensing technologies in archeological research supports broader exploration of the Middle East landscape by focusing on detailed prospection and documentation of monuments on a large scale. In the past, landscape mapping through remote sensing primarily used freely available sources from historical satellite systems (CORONA). Over the last 10 years, the possibilities for site exploration based on remote data have multiplied. The use and availability of high-resolution data (both archive and current imagery) offers the possibility of thorough and detailed site mapping. With access to the archives of the KH-9 Hexagon and OrbView-3 systems, high-resolution historical aerial images from U2 spy planes, the Luftwaffe, the RAF, and the US Air Force, and, last but not least, with the use of UAV technology, the limits of the traditional methodological approach can be overcome and the landscape can be explored in much more detail than before (comp. A. Beck, 2013) [43].
The Middle Eastern landscape, as a semi-arid type of land cover, offers very convenient conditions for the detection and mapping of archaeological sites through remote sensing data. However, with the development of a wider range of data sources, a more advanced approach to data processing needs to be developed. The use of basic visualization imaging techniques is in many cases insufficient and needs to be upgraded. Applying a wider range of visualization algorithms, together with a combination of the widest range of data and multiple image types, we can detect a notably higher number of features. The method, described here as a high-definition approach, represents a new direction in fine-grained mapping of intra-site morphology. At its core is a multi-temporal remote sensing dataset underlaid by an accurate elevation model, and further consisting of a basic reference layer and other orthorectified layers with minimal topographical and hypsographical deviation. One of the main criteria in this processing approach is the selection of the DEM base layer. The high-definition approach is closely associated with the use of high-resolution inputs as the base layers. The 12.5 m resolution of the 2008 DEM (Alos Palsar) is too low for the accurate processing of remote sensing data (orthorectification) following deep intra-site documentation. To obtain optimal results, it is necessary to implement a DEM with a resolution of under 1 m. Elimination of topographic and elevation deviation is an iterative process requiring repeated re-georeferencing, orthorectification, and adjustment of the metric parameters of layers. In this way, more accurate localization can be achieved; however, there admittedly remains some deviation between the layers, caused by the shadow deformation of the surface.
A multi-temporal remote sensing dataset is an ideal basis for subsequent analyses and the creation of a comprehensive, synthesizing plan of a site. The detailed mapping of intra-site features required to create such a plan is sometimes far from easy. In this case, the semi-automatic extraction method fails, and it is increasingly time-efficient to use manual digitization. During this process, the capture of morphological properties of features is limited by their visibility.
The application of visualization algorithms for 3D raster data of satellite and aerial imaging is an important method to enable a geomorphometric analysis of irregular anthropogenic relief shapes, which are very typical of the Middle East. In the field of remote sensing, visualization algorithms are often used for feature detection within the post-processing of aerial laser scanning data. These visualization algorithms, working on the basis of pixel analysis and segmentation, can be fully and effectively used in the field of satellite and UAV data units. The high-definition approach, working on the basis of a combination of variable databases and efforts to maximize database utilization, precisely includes the procedure of the necessary combination of visualization outputs to detect the highest possible percentage of difficult-to-detect features. The use of the Sky-view factor visualization algorithm, in conjunction with the Local Relief Model algorithm, proved to be the most effective. Through these analyses, it was possible to increase the number of visible objects significantly and significantly refine the morphological parameters of known features or their parts. The ideal output is achieved by combining the results of 3D visualization analyses and filter analyses (especially those involving the Sobel filter).
The high-definition approach, as described above, is one form of detailed in-site analysis. However, in the case of Middle East projects, extensive variability in the degree of feature preservation makes it very difficult to determine a uniform approach. In the case of preserved above-ground relics, fast and effective field documentation plays an important role because of frequent damage to the site due to erosion or human activity. Kona Makhmūr is exactly that type of endangered site. The effectiveness of the high-definition approach is evidenced by the marked increase in the number of detected anthropogenic relics and the refinement of the interpretation plans of the locality.
Given the dynamic development of agriculture, infrastructure, and construction activity in the Middle East over recent decades, as well as the presence of military operations, remote sensing data (especially archive satellite imagery) is one of the most important information sources for the detection of sites that have been partially or totally destroyed. Freely available datasets are most often the primary source base for Middle East archaeological landscape projects, both to provide a basic understanding of the study area and for the initial analysis of the landscape.
The use of remote sensing data is also very important in historical heritage protection. In recent years, the number of conflicts in the Middle East has increased substantially, and many archaeological and historical monuments have come into immediate danger or have already succumbed to acts of willful destruction. Many areas are still inaccessible or subject to limited access. High-definition remote sensing offers an alternative approach for the documentation and analysis of these sites.
Funding
This work was supported by the Czech Science Foundation (GACR): [Registration Number 18-13296S] Monastic settlement as a socio-economic phenomenon in early Islamic Northern Mesopotamia.
Acknowledgments
The author is grateful to several remote sensing specialists—particularly K. Pavelka and J. Šedina of the Czech Technical University, and J. Ur for providing the U2 mission aerial image. The greatest thanks are due to K. Nováček for his kindness and valuable advice in the sphere of Middle East archaeology, and for his agreement to publish data from the ‘Medieval Urban Landscape in the Northeastern Mesopotamia’ project. The final thank goes to James Raymond for his excellent proofreading.
Conflicts of Interest
The author declares no conflict of interest.
References
- Athos, A.; Hadjimitsis, D.G.; Alexakis, D.D. Development of an image-based method for the detection of archaeological buried relics using multi-temporal satellite imagery. Int. J. Remote Sens. 2013, 34, 5979–5996. [Google Scholar]
- Moriarty, C.; Cowley, D.C.; Wade, T.; Nichol, C.J. Deploying multispectral remote sensing for multi-temporal analysis of archaeological crop stress at Ravenshall, Fife, Scotland. Archaeol. Prospect. 2019, 26, 33–46. [Google Scholar] [CrossRef] [Green Version]
- Nocerino, E.; Menna, F.; Remondino, F. Multi-temporal analysis of landscapes and urban areas International Archives of the Photogrammetry. ISPRS 2012, XXXIX-B4, 85–90. [Google Scholar]
- Orengo, H.A.; Conesa, F.C.; Garcia-Molsosa, A.; Lobo, A.; Green, A.S.; Madella, M.; Petrie, C.A. Automated detection of archaeological mounds using machine-learning classification of multisensor and multitemporal satellite data. Proc. Natl. Acad. Sci. USA 2020, 117, 18240–18250. [Google Scholar] [CrossRef] [PubMed]
- Kopanias, K.; MacGinnis, J.; Ur, J.A. Archaeological Projects in the Kurdistan Region in Iraq; The Directorate of Antiquities of Kurdistan: Erbil, Iraq, 2015. [Google Scholar]
- Wizārat, A. Directorate General of Antiquities. Atlas of the Archaeological Sites in Iraq, 1st ed.; Al-Jumhuriya Press, Al-Huria Printing House: Baghdad, Iraq, 1975. [Google Scholar]
- Beck, A.; Philip, G.; Abdulkarim, M.; Donoghue, D. Evaluation of Corona and Ikonos high resolution satellite imagery for archaeological prospection in western Syria. Antiquity 2007, 81, 161–175. [Google Scholar] [CrossRef] [Green Version]
- Fowler, J.F. Satellite Imagery and Archaeology. In Landscapes Through the Lens: Aerial Photographs and Historic Environment, 1st ed.; Cowley, D.C., Standring, R.A., Abicht, M.J., Eds.; Oxbow Books: Oxford, UK, 2010; pp. 99–110. [Google Scholar]
- Fowler, M.J.F. Declassified Intelligence Satellite Photographs. In Archaeology from Historical Aerial and Satellite Archives, 1st ed.; Hanson, W.S., Oltean, I.A., Eds.; Springer: London, UK, 2013; pp. 47–66. [Google Scholar]
- Hritz, C. Contributions of GIS and satellite-based remote sensing to landscape archaeology in the Middle East. J. Archaeol. Res. 2014, 22, 229–276. [Google Scholar]
- Kennedy, D.L. Aerial archaeology in the Middle East: The role of the military–past, present … and future. In Aerial Archaeology. Developing Future Practice (NATO Science Series 1, Life and Behavioural Science 337), 1st ed.; Bewley, R.H., Raçzkowski, W., Eds.; IOS Press: Amsterdam, The Netherlands, 2002; pp. 33–48, 346. [Google Scholar]
- Parcak, S. Satellite remote sensing methods for monitoring archaeological tells in the Middle East. J. Field Archaeol. 2004, 32, 65–81. [Google Scholar]
- Ur, J. CORONA Satellite Imagery and Ancient Near Eastern Landscapes. In Mapping Archaeological Landscapes from Space, 1st ed.; Comer, D.C., Harrower, M.J., Eds.; Springer: New York, NY, USA, 2013; pp. 19–29. [Google Scholar]
- Ur, J. Spying on the past: Declassified intelligence satellite photographs and near eastern landscapes. Near East. Archaeol. 2013, 76, 28–36. [Google Scholar]
- Wilkinson, T.J. Archaeological Landscapes of the Near East, 1st ed.; University of Arizona Press: Tucson, AZ, USA, 2003. [Google Scholar]
- Wilkinson, K.N.; Beck, A.R.; Philip, G. Satellite imagery as a resource in the prospection for archaeological sites in central Syria. Geoarchaeology 2006, 21, 735–750. [Google Scholar]
- Nováček, K.; Melčák, M.; Starkovaá, L.; Amin, N.A.M. Medieval Urban Landscape in Northeastern Mesopotamia, 1st ed.; Archaeopress archaeology; Archaeopress Publishing: Oxford, UK, 2016. [Google Scholar]
- Ur, J.; Jong de, L.; Giraud, J.; Osborne, J.F.; MacGinnis, J. Ancient cities and landscapes in the Kurdistan region of Iraq: The Erbil Plain Archaeological Survey 2012 season. Iraq 2013, 75, 89–118. Available online: https://dash.harvard.edu/handle/1/11510264 (accessed on 18 August 2020). [CrossRef] [Green Version]
- Housarová, E.; Šedina, J.; Pavelka, K. Study of Erbil Al-Qala citadel time changes by comparison of historical and contemporary image data. Eur. J. Remote Sens. 2019, 52, 202–208. [Google Scholar] [CrossRef] [Green Version]
- Bewley, R.H.; Kennedy, D.L. Historical aerial imagery in Jordan and the wider Middle East. In Archaeology from Historical Aerial and Satellite Archives, 1st ed.; Hanson, W.S., Oltean, I.A., Eds.; Springer: London, UK, 2013; pp. 221–242. [Google Scholar]
- Poidebard, A. La Trace de Rome Dans le Désert de Syrie: Le Limes de Trajan à la Conquête Arabe; Recherches Aériennes (1925–1932); P. Geuthner: Paris, France, 1934. [Google Scholar]
- Ur, J. Middle Eastern Archaeology from the Air and Space. Situ 2016, Fall, 1–4. [Google Scholar]
- Hammer, E.; Ur, J. Near Eastern Landscapes and Declassified U2 Aerial Imagery. Adv. Archaeol. Pract. 2018, 7, 107–126. [Google Scholar] [CrossRef] [Green Version]
- Nováček, K. Ard Hazza, ard Arbíl: Projekt výzkumu středověkých měst v oblasti mezi Velkým a Malým Zábem v severovýchodní Mezopotámii/Ard Hazza, ard Arbíl: A project of the research of medieval urban landscape between Great and Little Zab in northeastern Mesopotamia. In Materiální a Duchovní Kultura Východu v Proměnách Času, 1st ed.; Pecha, L., Ed.; Zapadočeska Univerzita Plzen: Pilsen, Czech Republic, 2012; pp. 77–87. [Google Scholar]
- Pavelka, K.; Šedina, J.; Pacina, J.; Plánka, L.; Karas, J.; Šafář, V. RPAS–Remotely Piloted Aicraft System, 1st ed.; České vysoké učení technické v Praze: Praha, Czech Republic, 2016. [Google Scholar]
- Štular, B.; Kokalj, Ž.; Oštir, K.; Nuninger, L. Visualization of lidar-derived relief models for detection of archaeological features. J. Archaeol. Sci. 2012, 39, 3354–3360. [Google Scholar]
- Kokalj, Ž.; Zakšek, K.; Oštir, K. Application of sky-view factor for the visualisation of historic landscape features in lidar-derived relief models. Antiquity 2015, 85, 263–273. [Google Scholar] [CrossRef]
- Doneus, M.; Briese, C.H. Full-waveform airborne laser scanning as a tool for archaeological reconnaissance. In From Space to Place: 2nd International Conference on Remote Sensing in Archaeology; Archaeopress: Oxford, UK, 2006; pp. 99–105. [Google Scholar]
- Hesse, R. Lidar-derived local relief models—A new tool for archaeological prospection. Archaeological Prospection 2010, 17, 67–72. [Google Scholar] [CrossRef]
- Faltýnová, M.; Pavelka, K.; Nový, P.; Šedina, J. Complex archaeological prospection using combination of nondestructive techniques. Int. Arch. Photogramm. Remote Sens. Spatial Inf. Sci. 2015, XL-5/W7, 141–146. [Google Scholar]
- Matoušková, E.; Starková, L.; Pavelka, K.; Nováček, K.; Šedina, J.; Faltýnová, M.; Housarová, E. Using remotely sensed data for documentation of archaeological sites in northeastern Mesopotamia. Int. Arch. Photogramm. Remote Sens. Spat. Inf. Sci. 2016, XLI-B5, 335–342. [Google Scholar]
- Devereux, B.; Amable, G.S.; Crow, P. Visualisation of LiDAR Terrain Models for Archaeological Feature Detection. Antiquity 2008, 82, 470–479. [Google Scholar] [CrossRef]
- Opitz, R.; Cowley, D.C. Interpreting Archaeological Topography: Airborne Laser Scanning, 3D Data and Ground Observation; Oxbow books: Oxford, UK, 2013. [Google Scholar]
- Casana, J. Satellite imagery-based analysis of archaeological looting in Syria. Near East. Archaeol. 2015, 78, 142–152. [Google Scholar] [CrossRef] [Green Version]
- Hritz, C. Remote sensing of cultural heritage in Iraq: A case study of Isin. Taarii Newsl. 2008, 3, 1–8. [Google Scholar]
- Casana, J. Regional-scale archaeological remote sensing in the age of big data: Automated site discovery vs. Brute force methods. Adv. Archaeol. Pract. 2017, 2, 222–233. [Google Scholar]
- Van Ess, M.; Becker, H.; Fassbinder, J.; Kiefl, R.; Lingenfelder, I.; Schreier, G.; Zevenbergen, A. Detection of looting activities at archaeological sites in Iraq using Ikonos imagery. In Angewandte Geoinformatik; Beiträge zum 18: AGIT-Symposium, 1st ed.; Strobl, J., Blaschkle, T., Griesebner, G., Eds.; Wiechmann: Salzburg, Austria; Heidelberg, Germany, 2006; pp. 669–678. [Google Scholar]
- Repaka, S.R.; Truax, D.D. Comparing spectral and object based approaches for classification and transportation feature extraction from high resolution multi-spectral imagery. In Proceedings of the ASPRS 2004 Annual Conference, Denver, CO, USA, 23–28 May 2004; Available online: http://www.ecognition.com/sites/default/files/312_asprs_2004_0204.pdf (accessed on 4 August 2020).
- Chakraborty, D.; Singh, S.; Dutta, D. Segmentation and classification of high spatial resolution images based on hölder exponents and variance. Geo-Spat. Inf. Sci. 2017, 20, 39–45. [Google Scholar]
- Gussone, M. Zur Methodik der Interpretation ’Multidisziplinärer Prospektionsergebnisse in Resafa Syrien; Exzellenzcluster 264 Topoi; Humboldt-Universität zu Berlin: Berlin, Germany, 2016; pp. 129–156. [Google Scholar]
- Thomas, D.C. The Ebb and Flow of the Ghūrid Empire; Sydney University Press: Sydney, Australia, 2018; pp. 249–308. [Google Scholar]
- Williams, T. Unmanned Aerial Vehicle Photography: Exploring the Medieval City of Merv, on the Silk Roads of Central Asia. Archaeol. Int. 2012, 15, 54–68. [Google Scholar]
- Beck, A.R.; Philip, G. The archaeological exploitation of declassified satellite photography in semi-arid environment. In Archaeology from Historical Aerial and Satellite Archives, 1st ed.; Hanson, W.S., Oltean, I.A., Eds.; Springer: London, UK, 2013; pp. 261–278. [Google Scholar]
Figure 1.
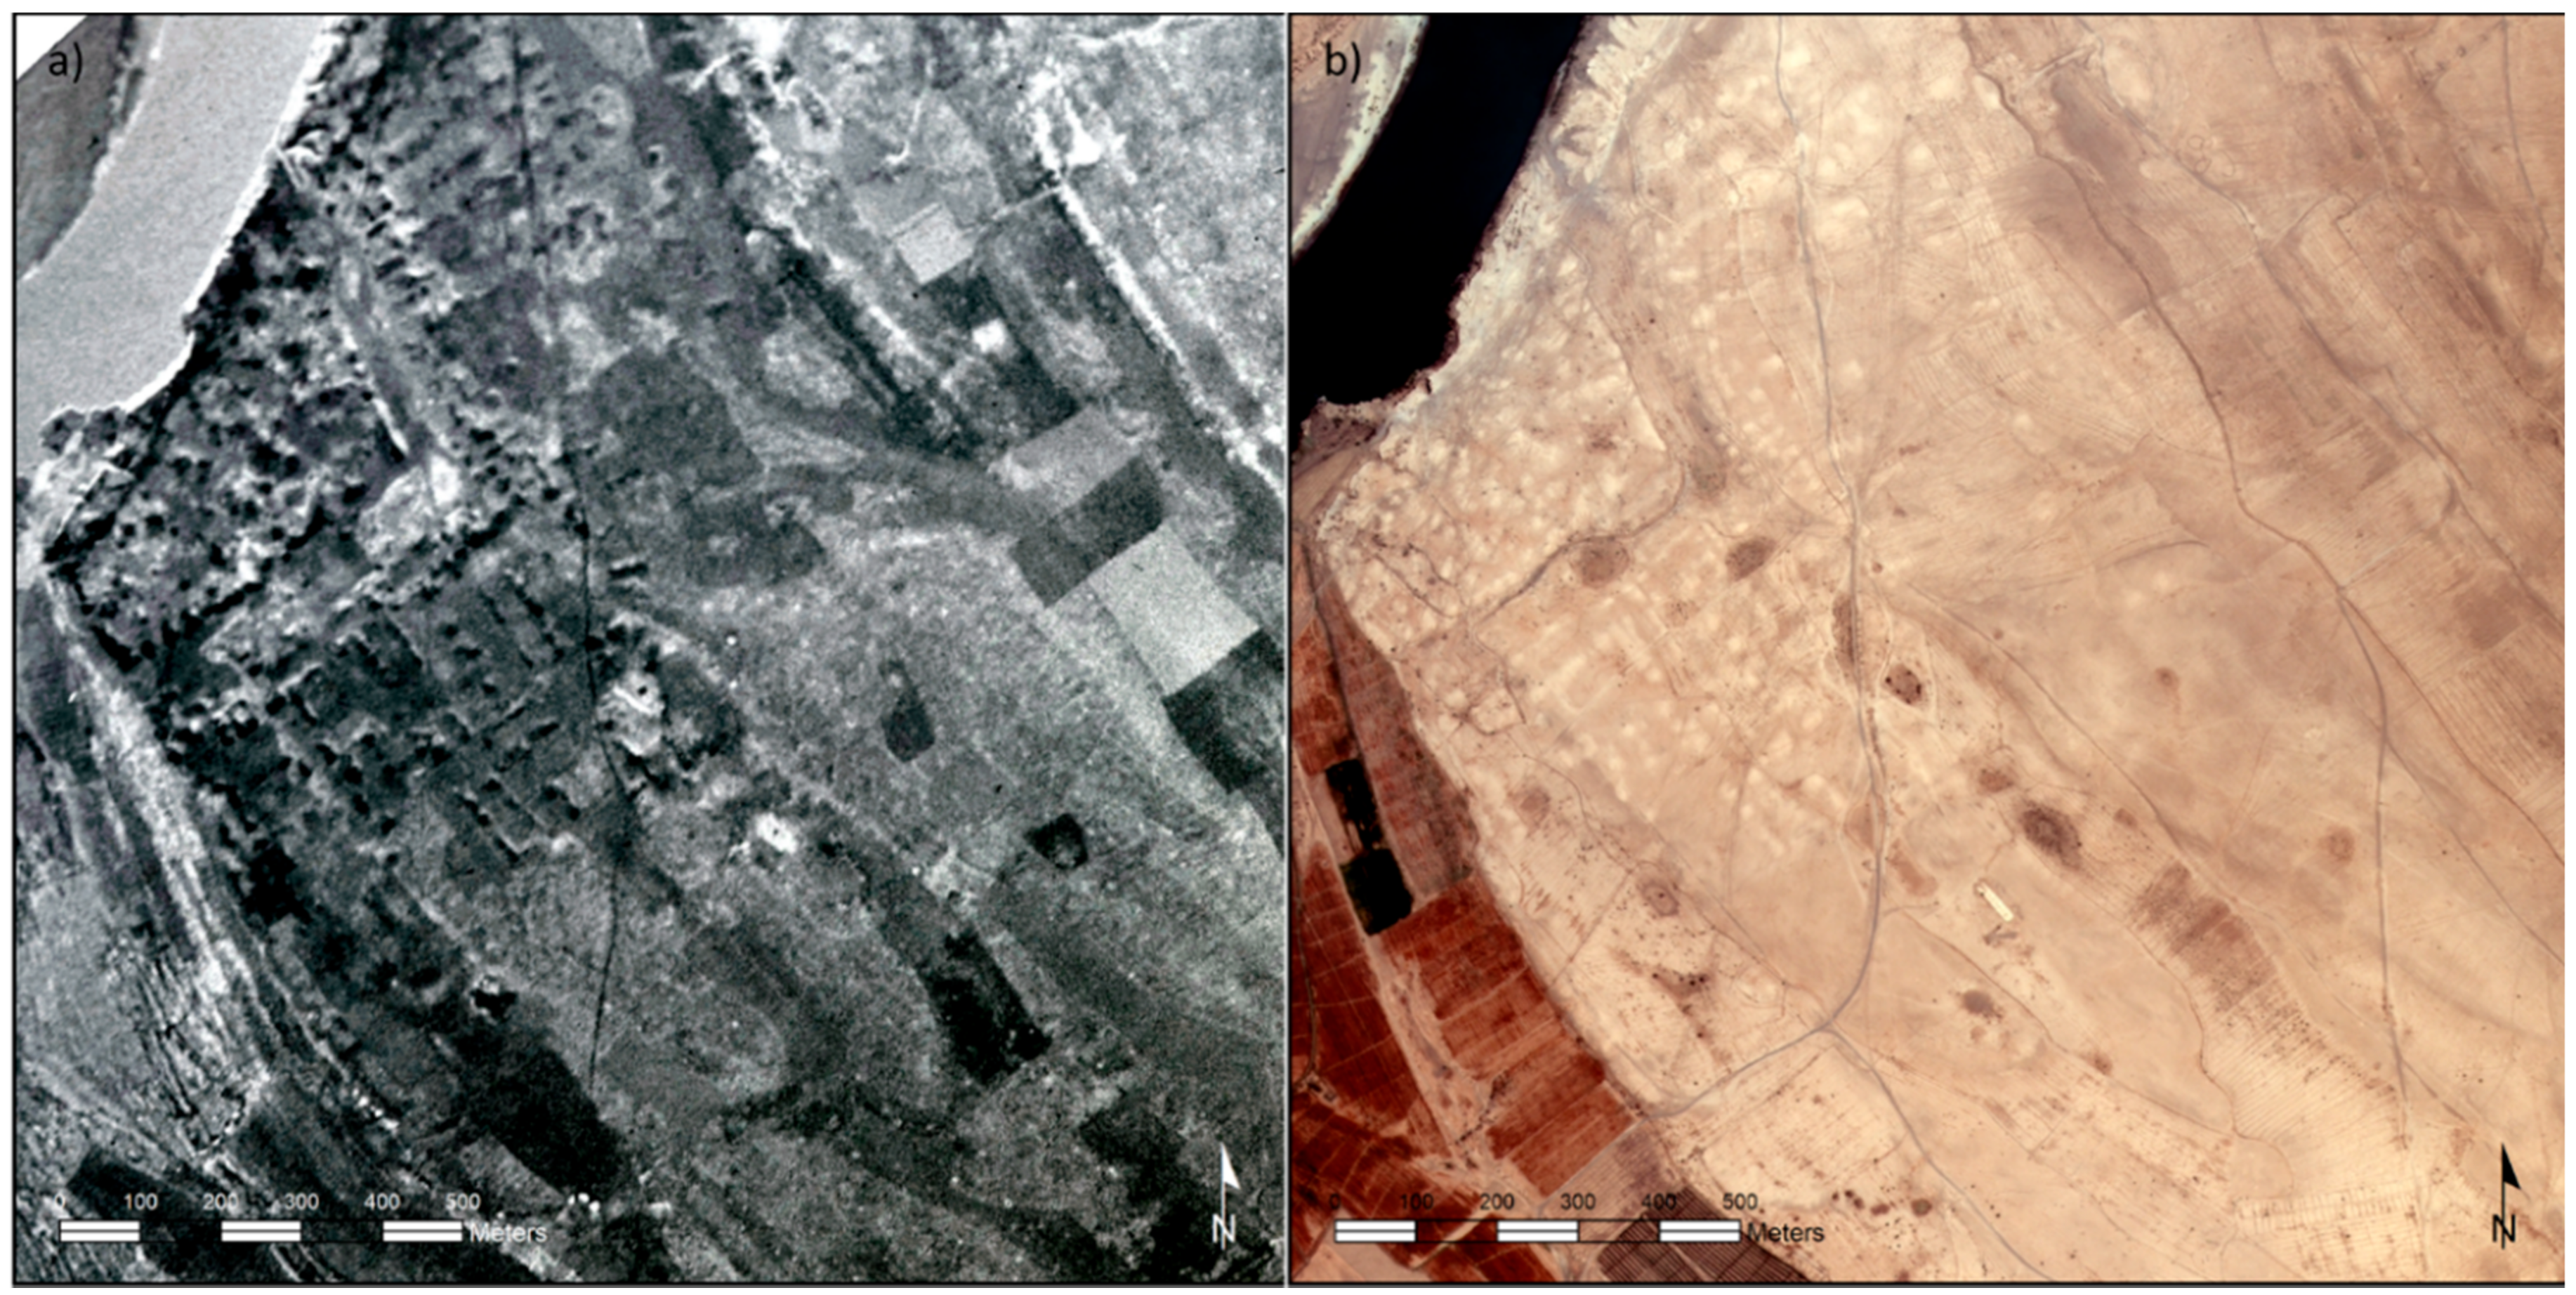
The importance of using historical aerial images: (a) Aerial image of a deserted medieval city located on the Tigris river, taken by the RAF in 1944; (b) the current state of the site—totally deserted (author: Lenka Starková).
Figure 1.
The importance of using historical aerial images: (a) Aerial image of a deserted medieval city located on the Tigris river, taken by the RAF in 1944; (b) the current state of the site—totally deserted (author: Lenka Starková).

Figure 2.
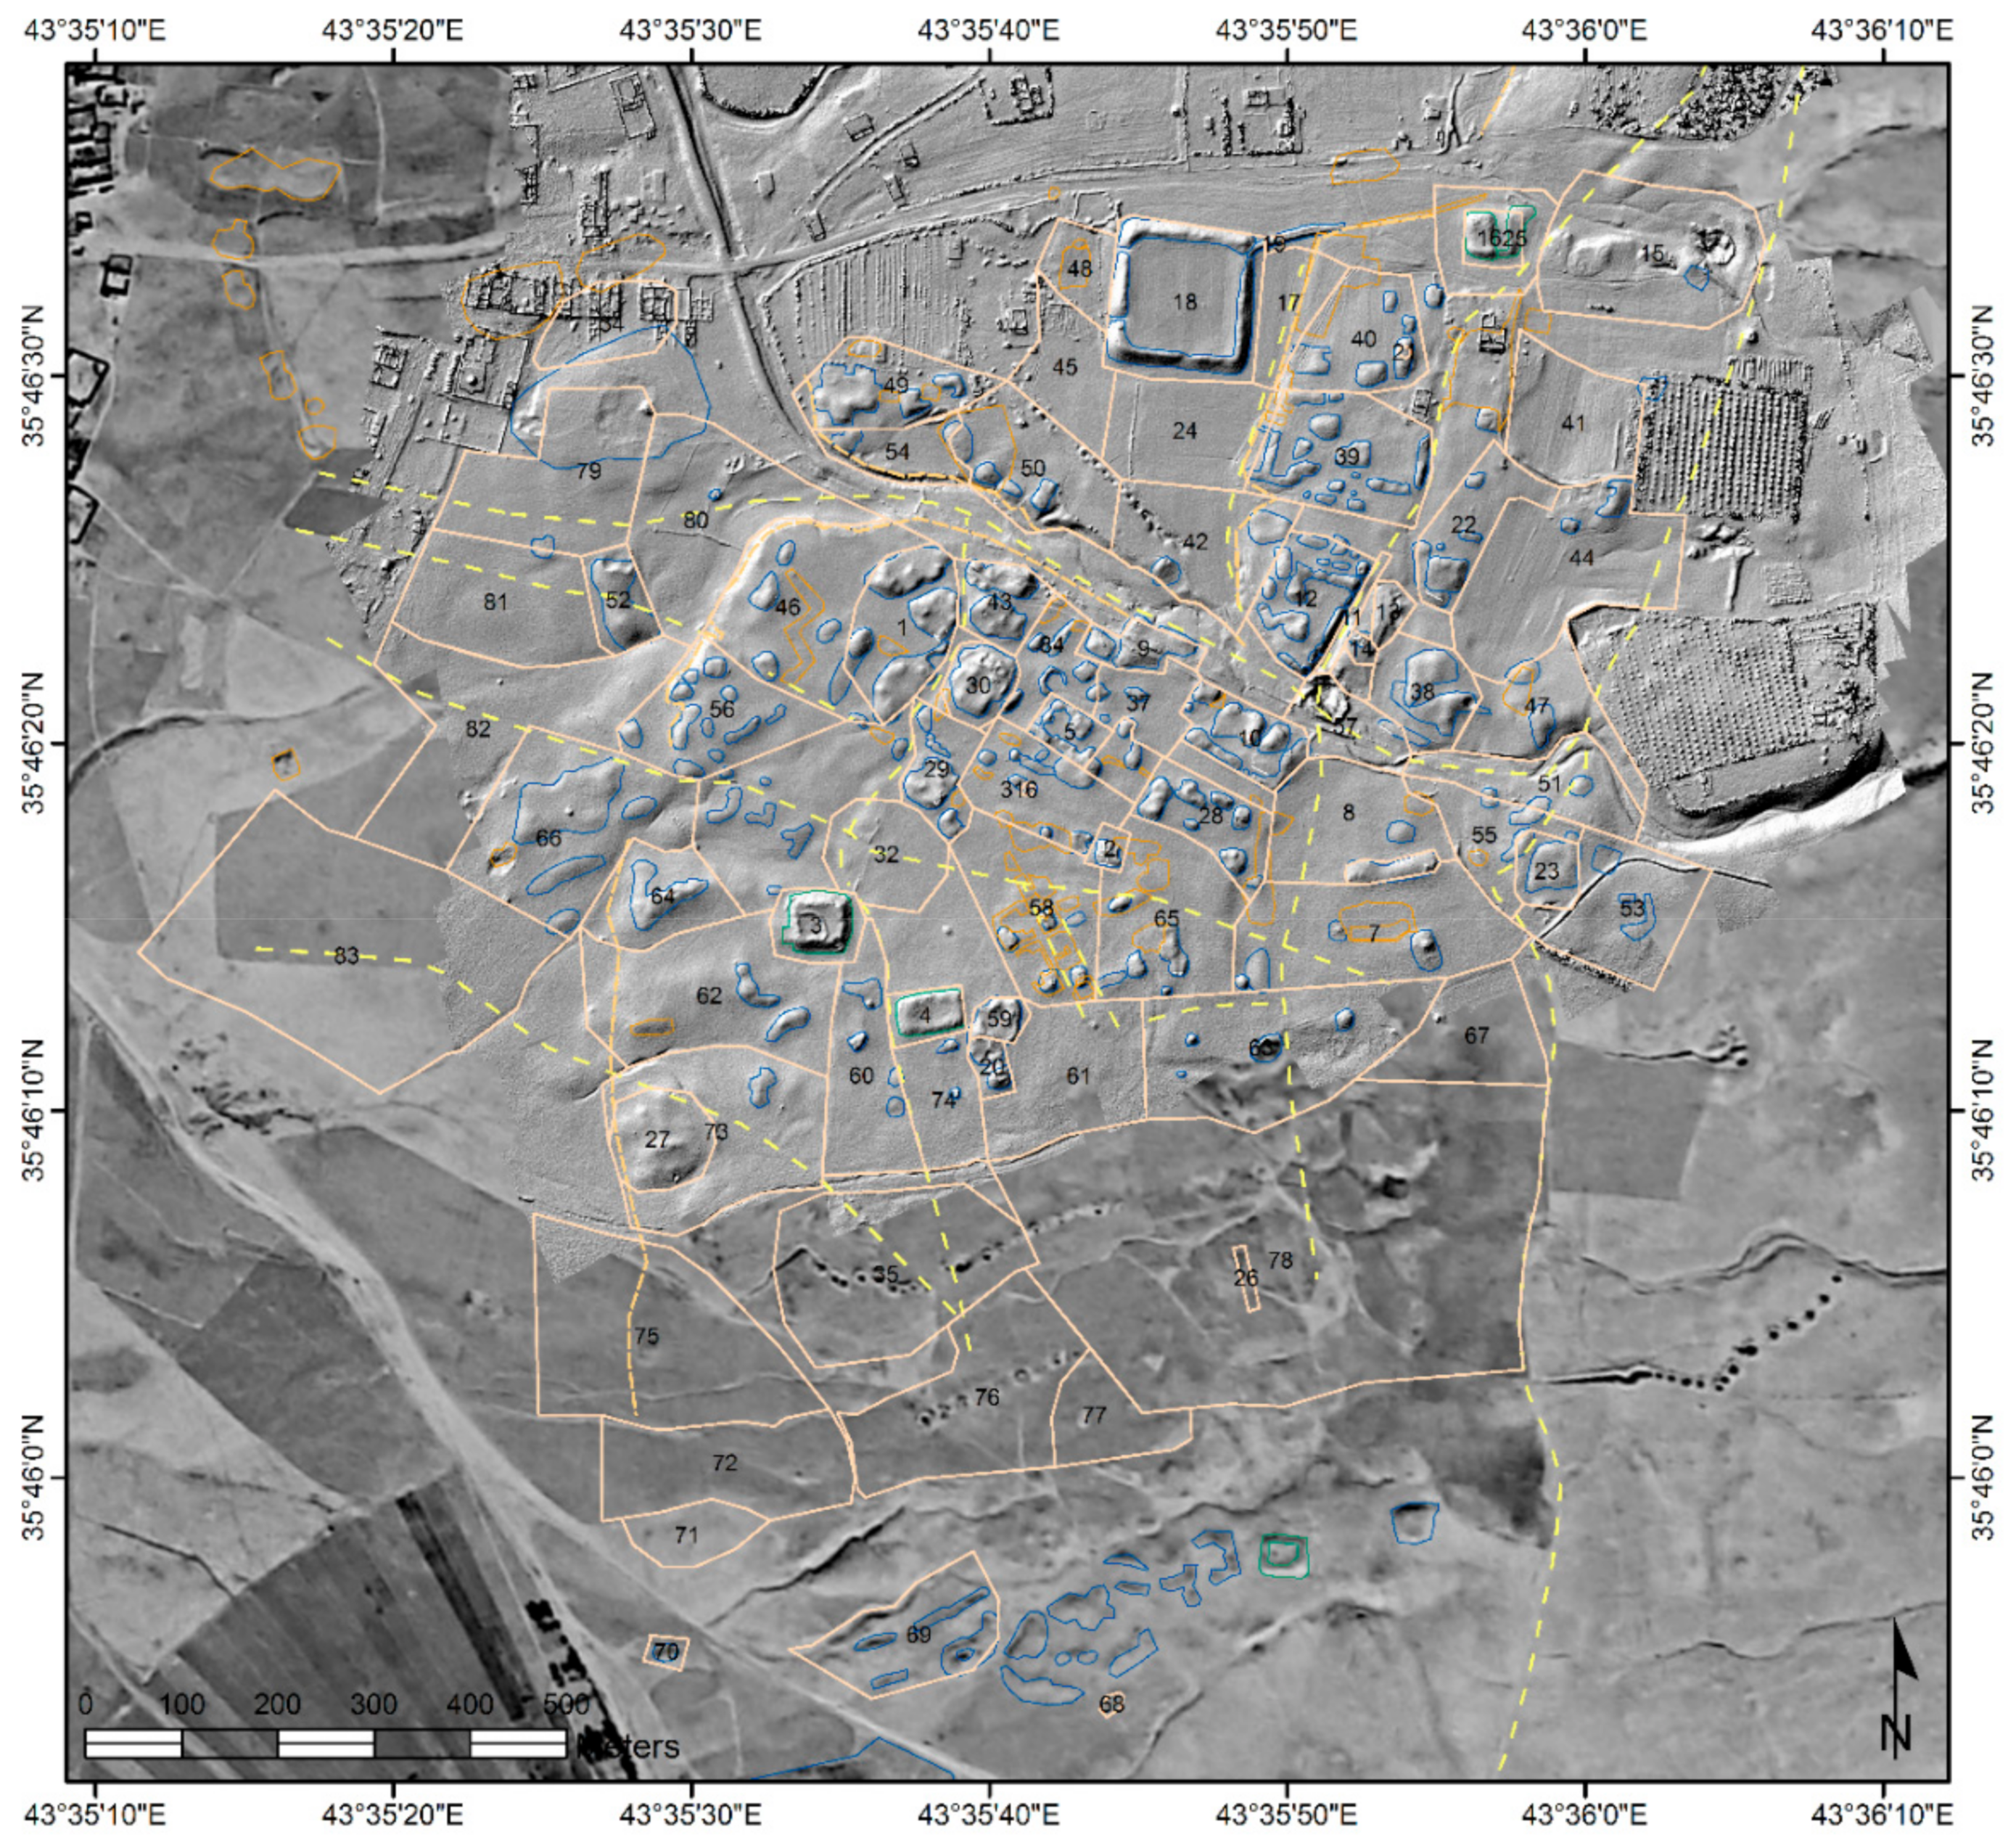
Kona Makhmūr, state of the Early Islamic site with the most important features: Traces of structures and water reservoirs (blue), fortified residences (qusūr; green), the original communication network (yellow), field survey polygons (pink). Satellite image HEXAGON, 1971, unmanned aerial system (UAV) hillshade 2015 (authors: Karel Nováček, Lenka Starková).
Figure 2.
Kona Makhmūr, state of the Early Islamic site with the most important features: Traces of structures and water reservoirs (blue), fortified residences (qusūr; green), the original communication network (yellow), field survey polygons (pink). Satellite image HEXAGON, 1971, unmanned aerial system (UAV) hillshade 2015 (authors: Karel Nováček, Lenka Starková).

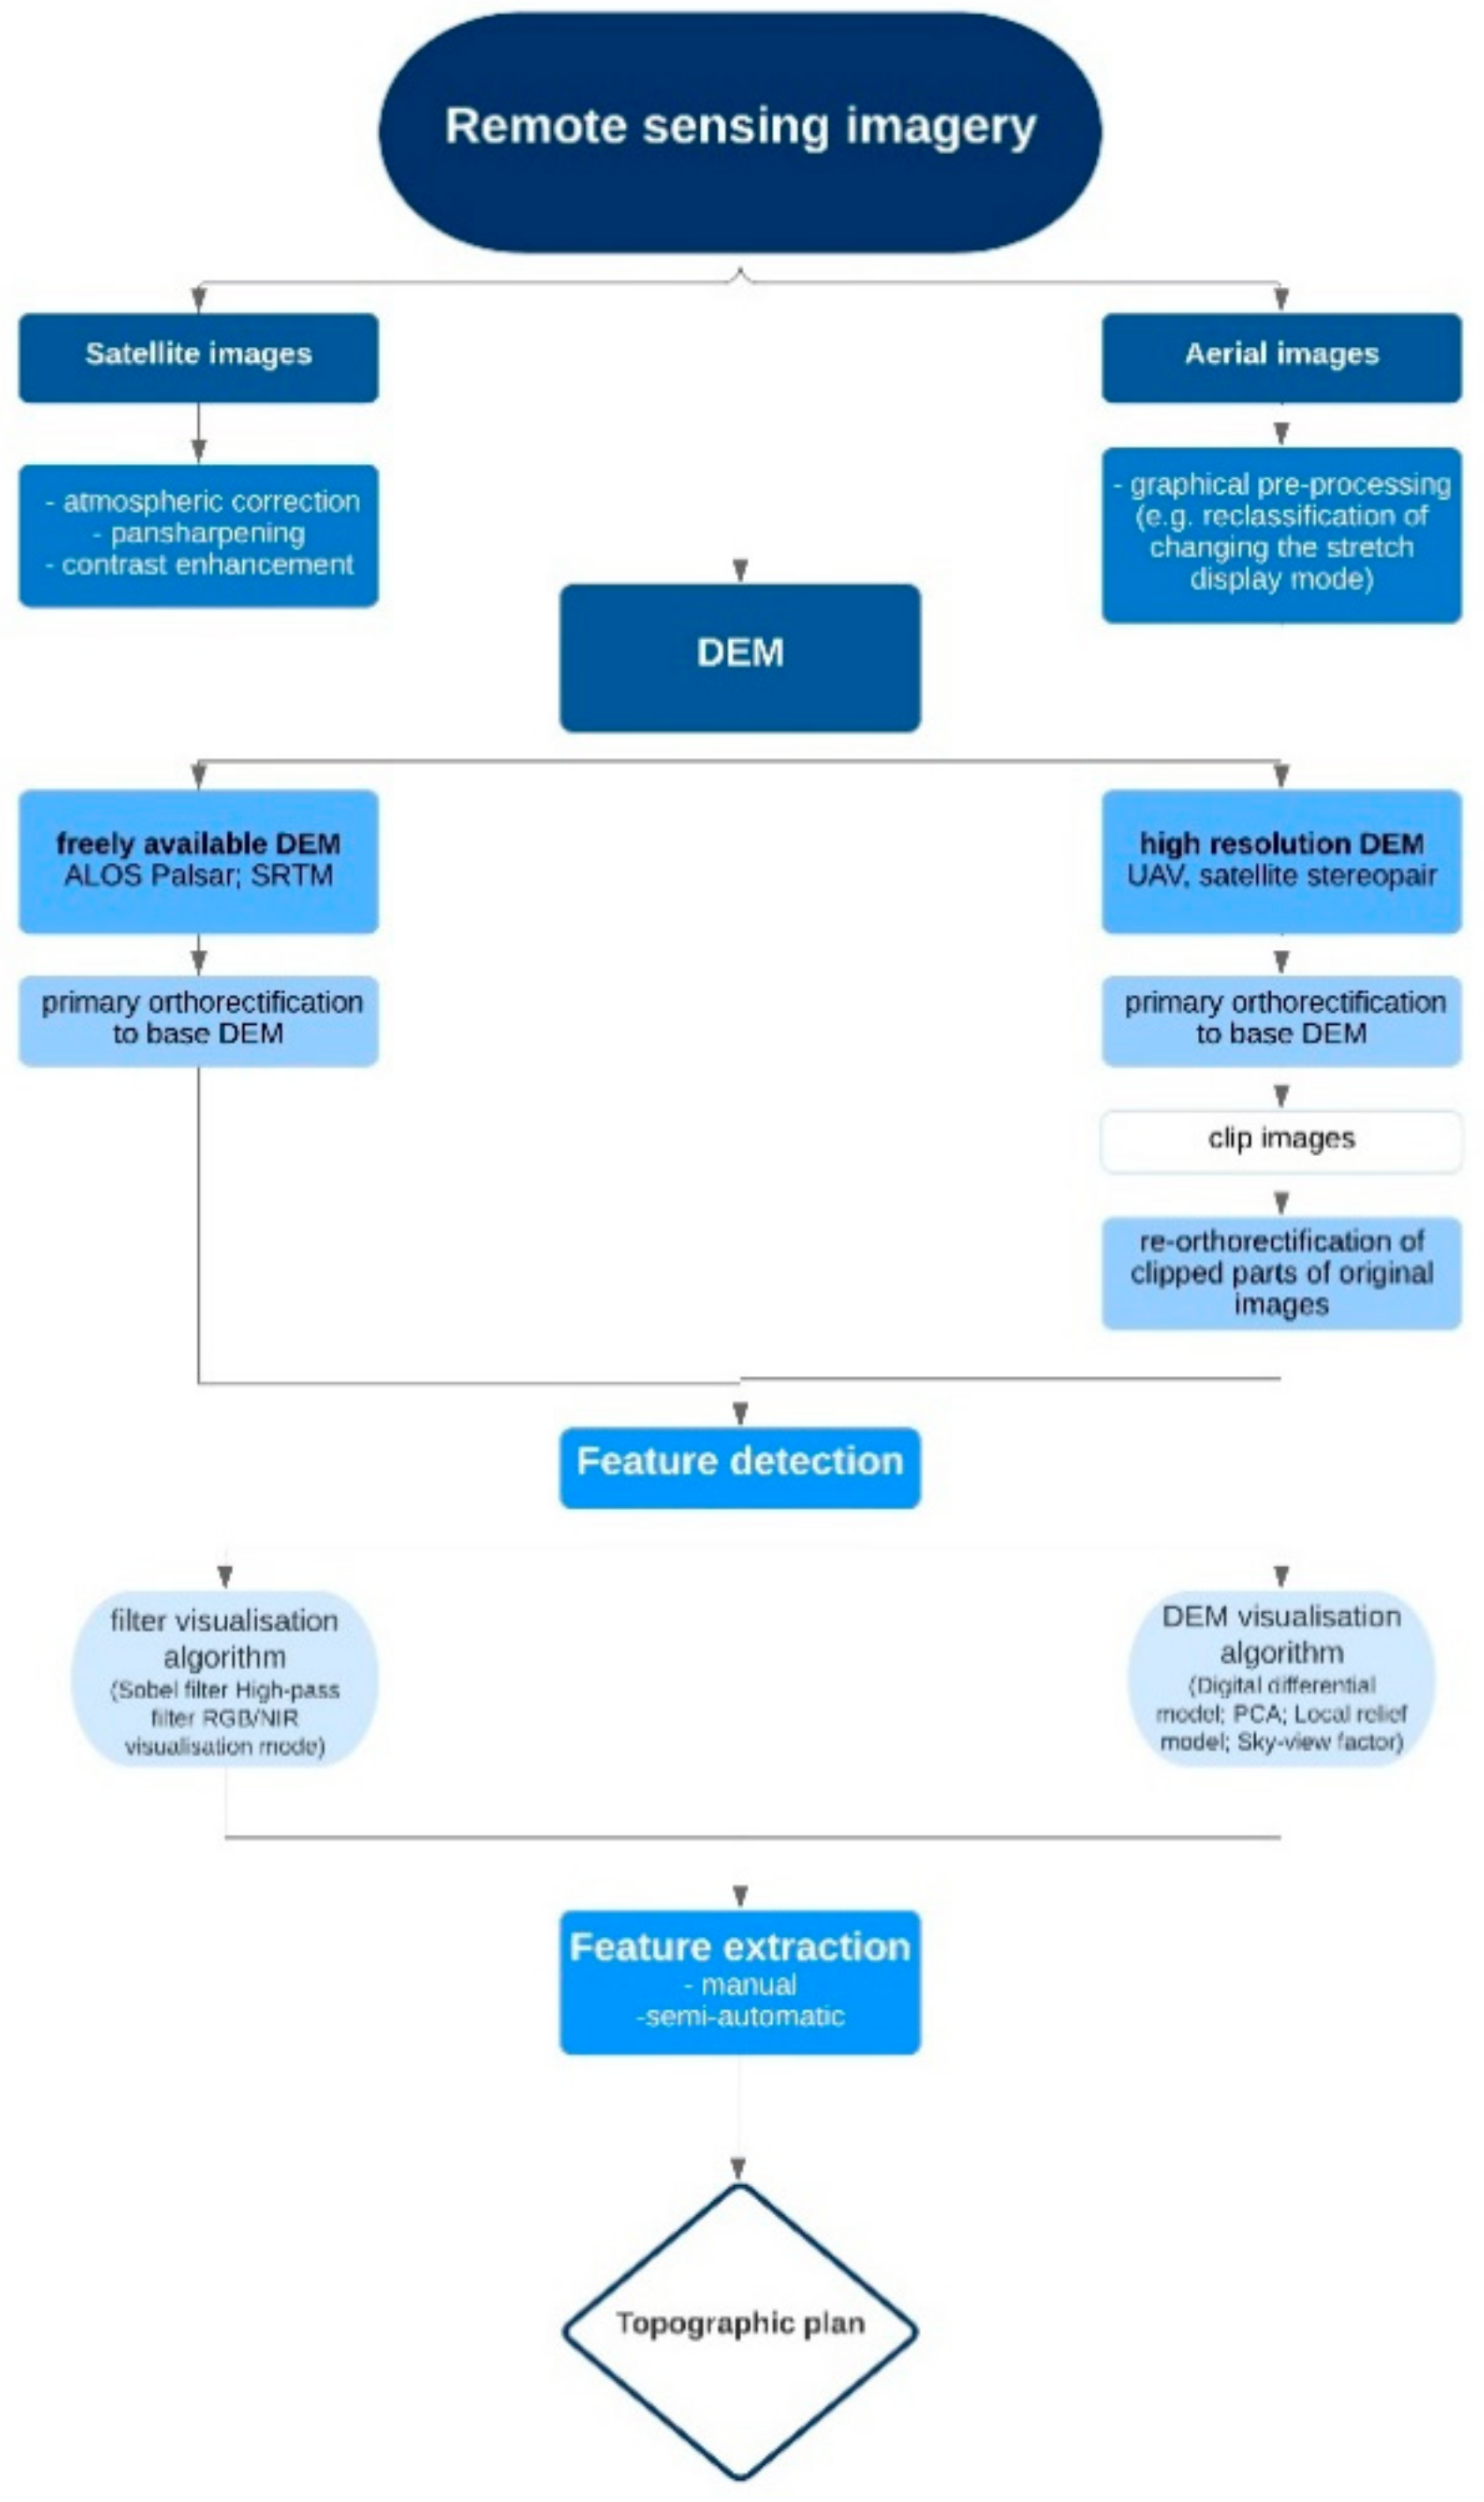
Figure 3.
Overview of the general methodological workflow (author: Lenka Starková).

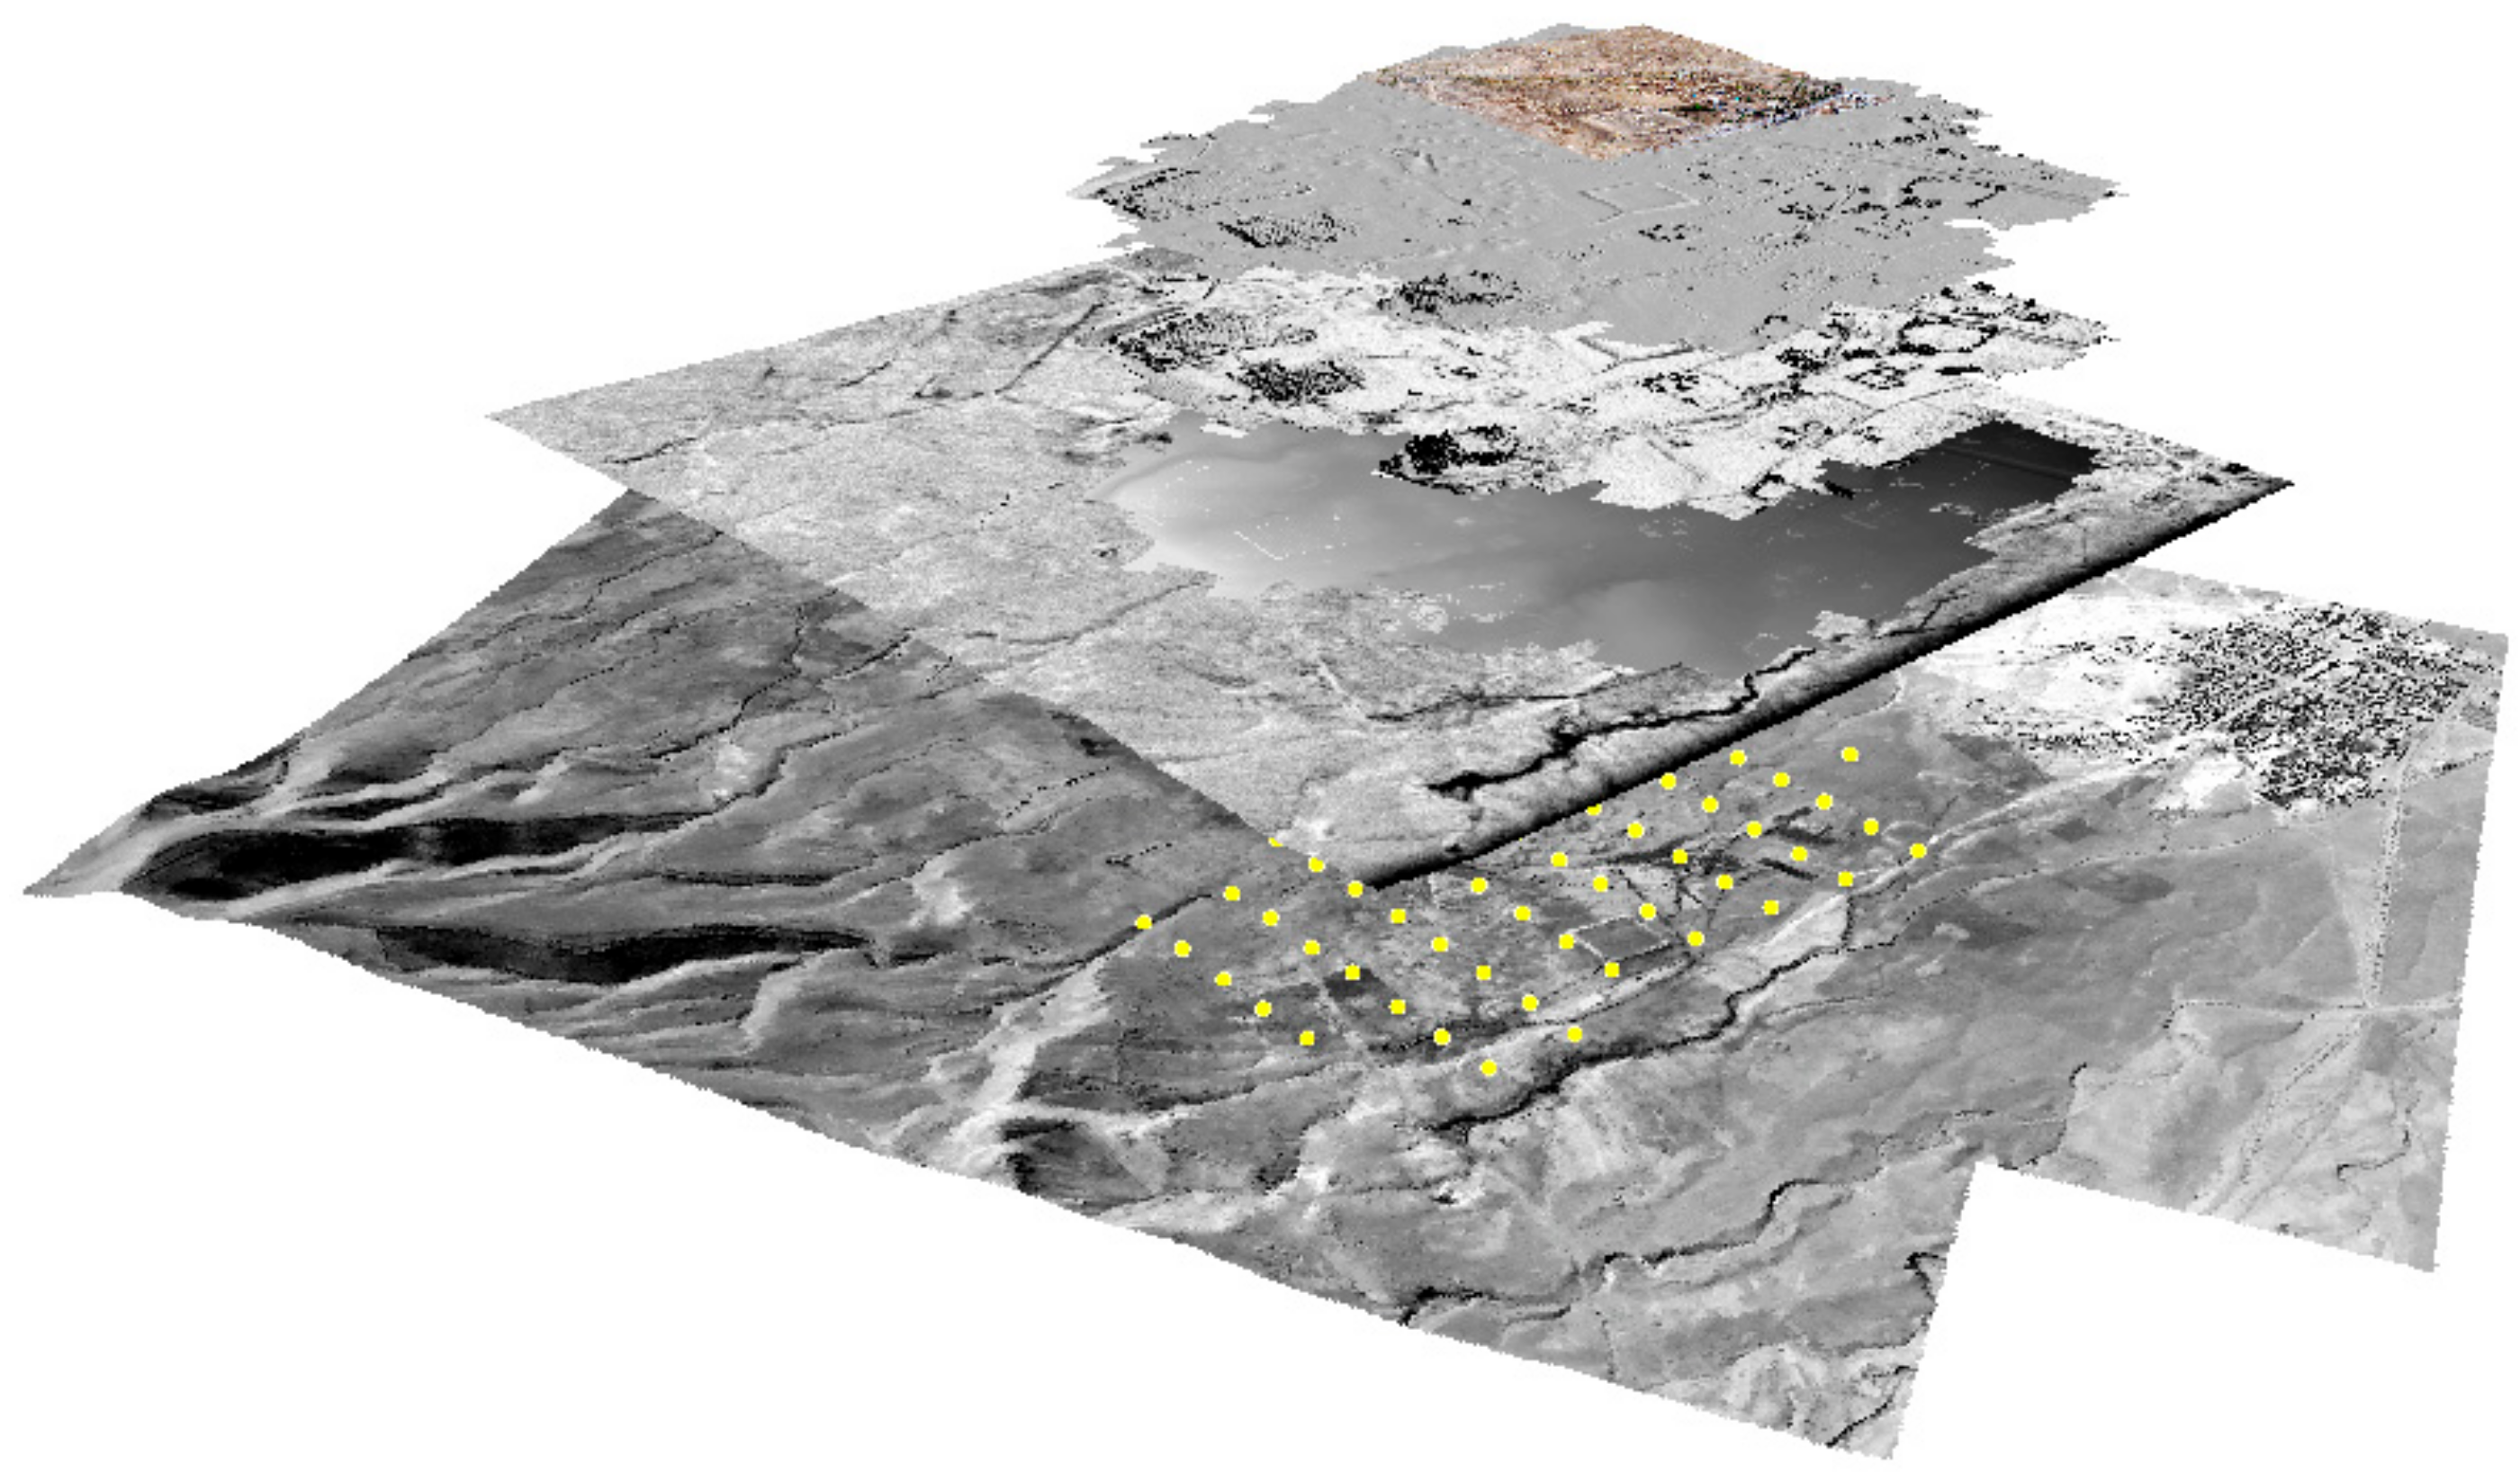
Figure 4.
Re-georeferencing of GIS base layers and rectification to the most accurate topographic and hypsometric base layer—point layer, measured directly in the field by sub-metric GPS (author: Lenka Starková).
Figure 4.
Re-georeferencing of GIS base layers and rectification to the most accurate topographic and hypsometric base layer—point layer, measured directly in the field by sub-metric GPS (author: Lenka Starková).

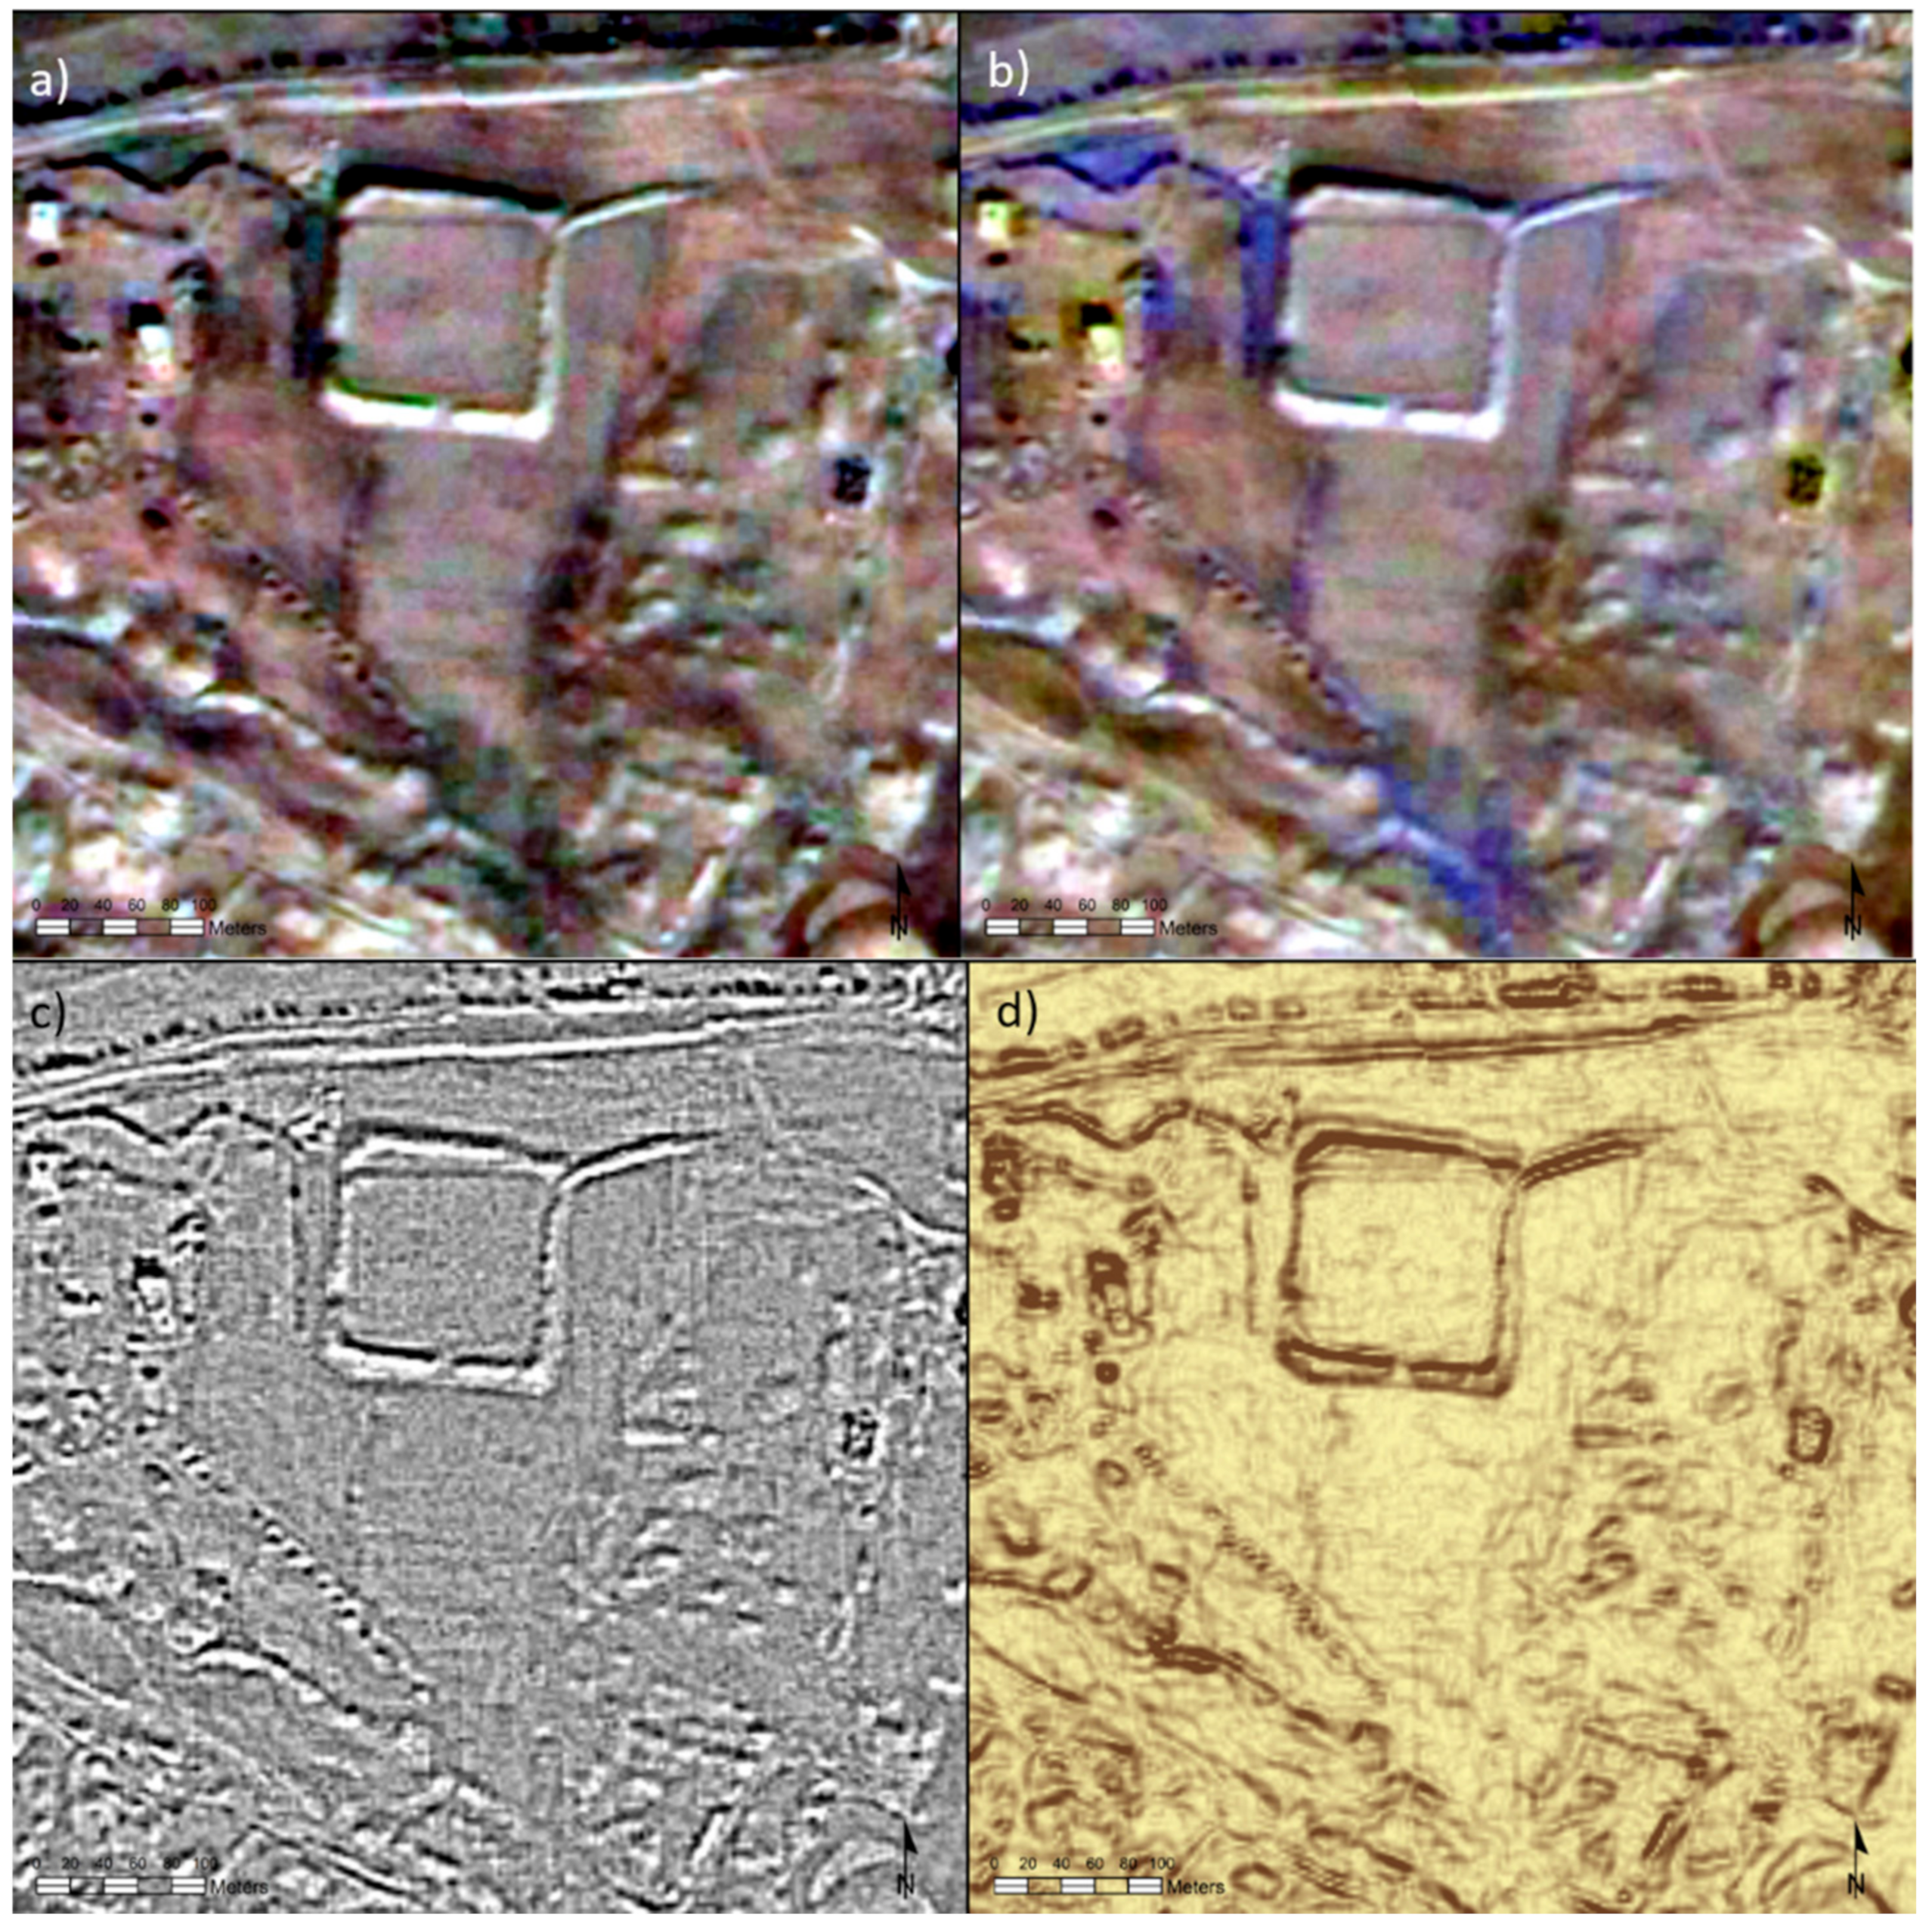
Figure 5.
The application of the filter visualization algorithms. Figures show: (a) The original image; (b) synthesis of 1, 2, and 4 FORMOSAT-2 bands (RGNIR); (c) the results of applying the High Pass filter; and (d) those of applying the Sobel filter (author: Lenka Starková).
Figure 5.
The application of the filter visualization algorithms. Figures show: (a) The original image; (b) synthesis of 1, 2, and 4 FORMOSAT-2 bands (RGNIR); (c) the results of applying the High Pass filter; and (d) those of applying the Sobel filter (author: Lenka Starková).

Figure 6.
Hydrology of the Kona Makhmūr site and its surroundings based on the ALOS Palsar digital elevation model (DEM) (12.5 m resolution) (author: Lenka Starková).
Figure 6.
Hydrology of the Kona Makhmūr site and its surroundings based on the ALOS Palsar digital elevation model (DEM) (12.5 m resolution) (author: Lenka Starková).

Figure 7.
Overview of historical and modern remote sensing data used to document the Kona Makhmūr site—comparison of feature visibility (author: Lenka Starková).
Figure 7.
Overview of historical and modern remote sensing data used to document the Kona Makhmūr site—comparison of feature visibility (author: Lenka Starková).

Figure 8.
Kona Makhmūr, general interpretation of part of the site: Combination of image-based digitalization of features with the results of field verification (walls) (authors: Karel Nováček, Lenka Starková).
Figure 8.
Kona Makhmūr, general interpretation of part of the site: Combination of image-based digitalization of features with the results of field verification (walls) (authors: Karel Nováček, Lenka Starková).

Figure 9.
Monitoring of the gradual recession of relics: (a) Image from 2013, WorldView-2—the dynamics of the transformation process of the site show the hard destruction of features, especially in the central part of the site (WorldView-2© Digital Globe Inc., distribution e-GEOS/ARCDATA PRAHA s.r.o.); (b) historical image from the Hexagon mission 1971—most of the parts that are above ground are still preserved and detectable (author: Lenka Starková).

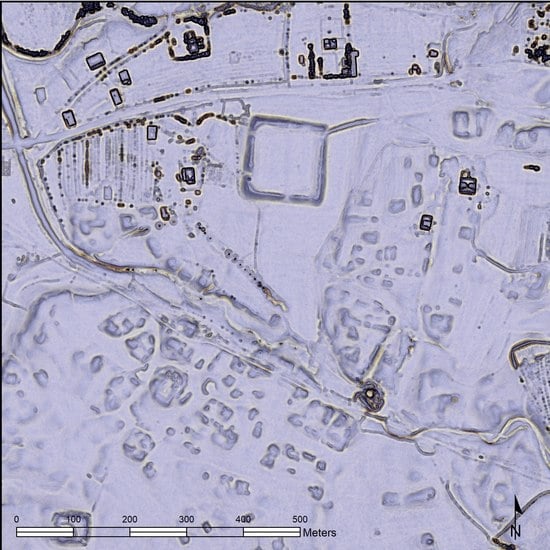
Figure 10.
The comparison of the digital elevation models (DEMs) created on the basis of UAV images and on the basis of the stereo pair of satellite images: (a) DEM created from the photographic dataset, taken by UAV; maximal resolution 20 cm (data obtained through the Czech Technical University in Prague); (b) DEM created from the stereo pair of the Pleiades-2 system; maximal resolution 1.6 m (authors: Jaroslav Šedina, Karel Pavelka and Lenka Starková).

Figure 11.
Kona Makhmūr, locus (interpreted as a church) with remains of masonry exposed on the surface. The digital surface model, exported from the UAV DEM output, was used as the base. The combination of field prospection and remote sensing data provides a unique opportunity to complete the detailed plan (authors: Karel Nováček and Lenka Starková).

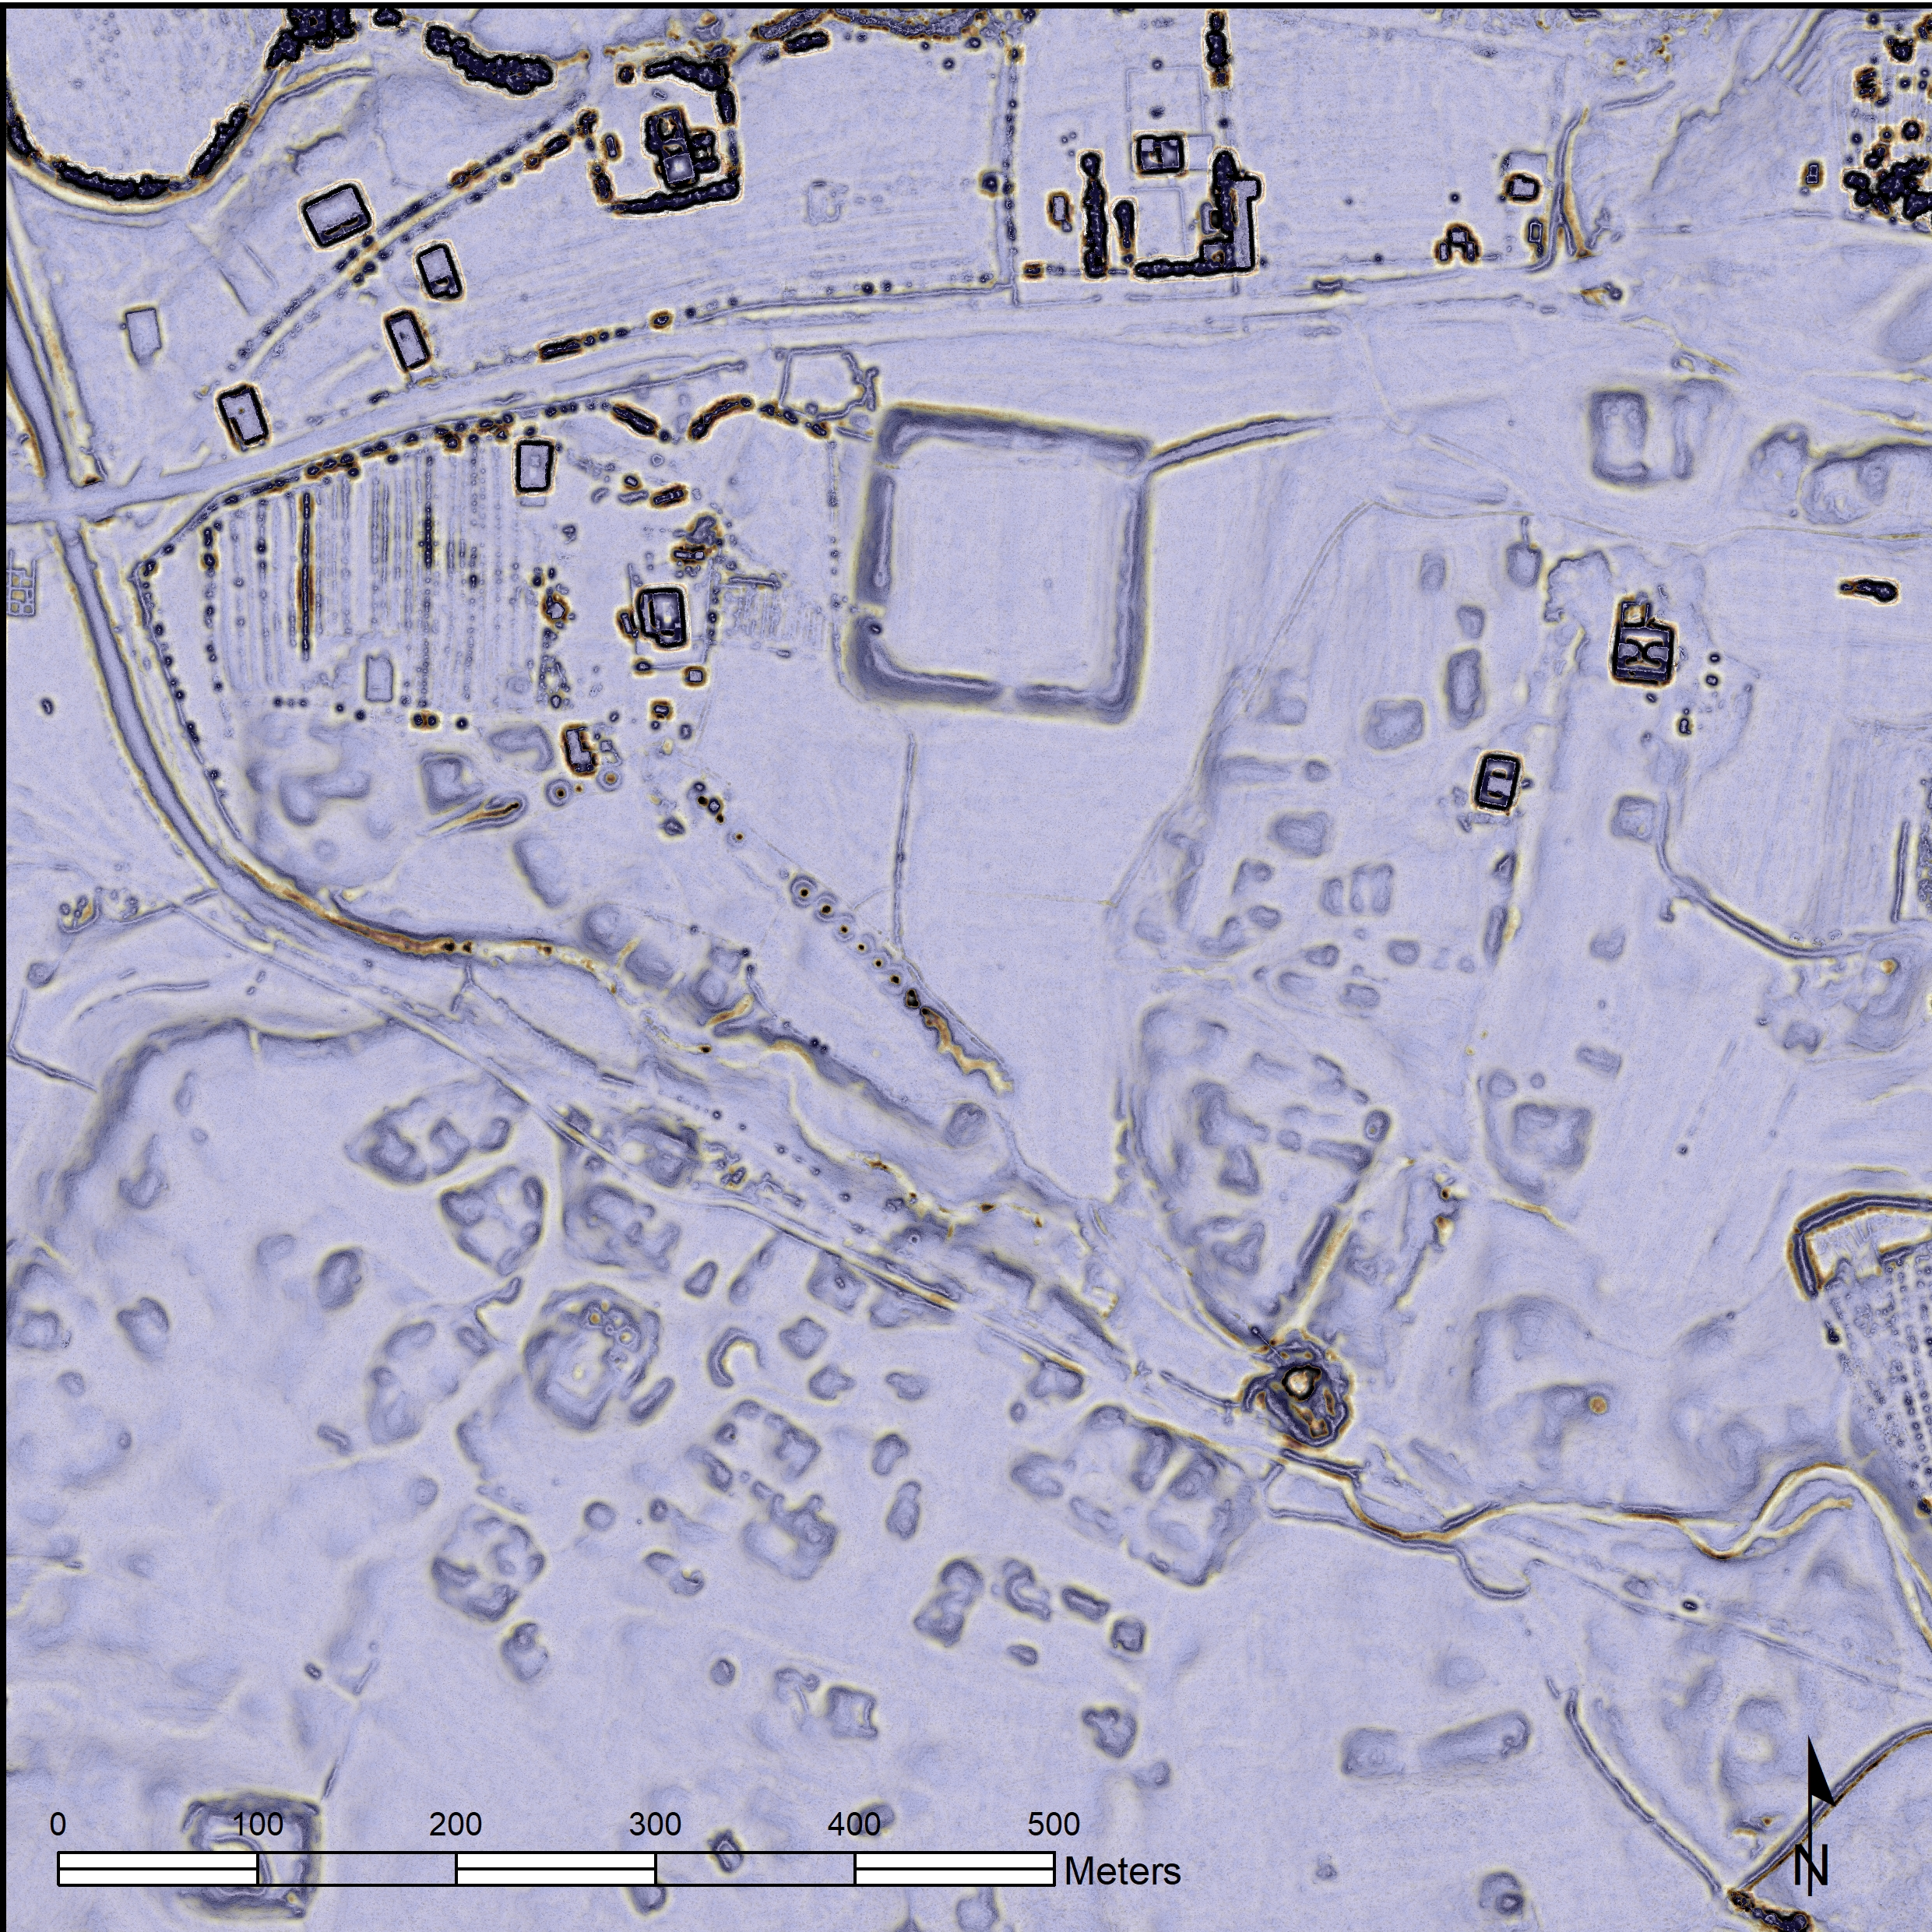
Figure 12.
The application of airborne laser scanning visualization to the remote sensing dataset: (a) Shaded relief; (b) digital differential model; (c) Principal Component Analysis (PCA) analyses; (d) Sky-view factor; (e) Local Relief Model; (f) optimal output based on the combination of the Local Relief Model and Sky-view factor. On the right is a comparison of the feature visibility of PCA analyses (2) (99% of the entire information extracted from the whole image) with that of the basic hillshade mode (1) (author: Lenka Starková).


Table 1.
Overview of total rot mean square (TRMS) by image size, data source, reference layer, and processing phase.
Table 1.
Overview of total rot mean square (TRMS) by image size, data source, reference layer, and processing phase.
| Imagery Source | Image Size | 1st Orthorectification | 2nd Orthorectification | 3rd Orthorectification (Clipped Imagery) | ||||||
|---|---|---|---|---|---|---|---|---|---|---|
| DEM Alos-Palsar; 12.5 m Resolution | GCPs 4 | Total RMS Error | DEM UAV– 20 cm Resolution | GCPs Grid of 90 | Total RMS Error | DEM UAV– 20 cm Resolution | GCPs Grid of 90 | Total RMS Error | ||
| CORONA (KH-4B) | 40 × 18 km | 18.8 m | 6.4 m | 1.2 m | ||||||
| CORONA (KH-4B) | 60 × 15 km | 19.2 m | 6.8 m | 1.6 m | ||||||
| World-View 2 | 8 × 8 km | 2.8 m | 1.1 m | 0.6 m | ||||||
| KH 9-Hexagon | 12 × 8 km | 16.8 m | 5.5 m | 0.8 m | ||||||
| Formosat-2 | 24 × 24 km | 9.6 m | 3.8 m | 1.1 m | ||||||
| U2 | 3.5 × 3 km | was not processed | 1.1 m | 0.76 m | ||||||
© 2020 by the author. Licensee MDPI, Basel, Switzerland. This article is an open access article distributed under the terms and conditions of the Creative Commons Attribution (CC BY) license (http://creativecommons.org/licenses/by/4.0/).
Share and Cite
MDPI and ACS Style
Starková, L. Toward a High-Definition Remote Sensing Approach to the Study of Deserted Medieval Cities in the Near East. Geosciences 2020, 10, 369. https://doi.org/10.3390/geosciences10090369
AMA Style
Starková L. Toward a High-Definition Remote Sensing Approach to the Study of Deserted Medieval Cities in the Near East. Geosciences. 2020; 10(9):369. https://doi.org/10.3390/geosciences10090369
Chicago/Turabian StyleStarková, Lenka. 2020. "Toward a High-Definition Remote Sensing Approach to the Study of Deserted Medieval Cities in the Near East" Geosciences 10, no. 9: 369. https://doi.org/10.3390/geosciences10090369
Note that from the first issue of 2016, this journal uses article numbers instead of page numbers. See further details here.