Article

Evolution and Expression Divergence of the CYP78A Subfamily Genes in Soybean

1
Key Laboratory of Soybean Molecular Design Breeding, Northeast Institute of Geography and Agroecology, Chinese Academy of Sciences, Changchun 130102, China
2
University of Chinese Academy of Sciences, Beijing 100049, China
3
Department of Horticulture, Michigan State University, East Lansing, MI 48824, USA
*
Author to whom correspondence should be addressed.
Genes 2018, 9(12), 611; https://doi.org/10.3390/genes9120611
Submission received: 31 October 2018 / Revised: 23 November 2018 / Accepted: 27 November 2018 / Published: 7 December 2018
(This article belongs to the Section Plant Genetics and Genomics)

Abstract

:
Gene expression divergence is an important evolutionary driving force for the retention of duplicate genes. In this study, we identified three CYP78A subfamily genes in soybean, GmCYP78A70, GmCYP78A57 and GmCYP78A72, which experienced different duplication events. GmCYP78A70 was mainly expressed in leaf tissue and the vegetative phase, whereas GmCYP78A57 was mainly expressed in floral tissue and seed, i.e., the reproductive phase. Expression of GmCYP78A72 could be detected in all the tissues and phases mentioned above. The expression levels of GmCYP78A70 and GmCYP78A57 in different soybean cultivars showed positive correlations with leaf size and 100-seed weight, respectively. The population genetics analysis indicated that the three genes had experienced different selective pressures during domestication and improved breeding of soybean. Deciphering the function of this subfamily of genes may well prove useful to breeders for improving soybean’s agronomic traits.

1. Introduction

Whole-genome duplication (WGD) is an especially common event in plant lineages relative to animal lineages, with 50–70% or more of all angiosperms having undergone at least one detectable genome duplication event in their history [1,2]. Soybean experienced a Gamma whole-genome duplication before the origin of the rosids, ~130 to 240 million years ago (Mya); the legume WGD (Legume WGD, ~58 Mya), and the Glycine WGD in the Glycine lineage (Glycine WGD, ~13 Mya) [3,4,5,6]. This produced a highly duplicated soybean genome with nearly 75% of its genes present in multiple copies [6]. Genes that have duplicated copies should have more diversified expression profiles than single-copy genes during development [7]. In Arabidopsis, approximately 70% of duplicate pairs have significant differences in transcript levels [8]. Epstein [9] proposed that expression divergence is the first step in the functional divergence between duplicate genes and thereby increases the chance of retention of duplicate genes in a genome. It is now clear that gene duplication enables tissue or developmental specialization and increases expression diversity [10].
For duplicate genes, expression divergence is often used as a proxy indicator for the divergence of gene functions. The prevalence of expression sub-functionalization after polyploidization-variation in the relative expression of homologs among tissues in the polyploids has been assessed in several studies [11,12,13,14,15,16], and the differential expression between the duplicate genes has been shown to contribute to phenotypic variation [17]. In Populus, among the 60 class I PG (polygalacturonases) genes, 11 of them were specifically expressed in flowers. These 11 genes might acquire new functions related to flower development; thus, their evolutionary fates might be neo-functionalization and could contribute to the retention of these class I PG genes [18].
As the largest family of enzymatic synthesis genes by far, the cytochrome P450s (CYPs), which are excellent reporters of metabolism architecture and evolution [17,19], were positively influenced by the WGD in soybean. The Arabidopsis cytochrome P450 KLUH (KLU)/CYP78A5 is expressed in leaf, flora and embryo tissues, and has been identified as a stimulator of plant organ growth [20,21]. In cultivated tomato, SLKLUH, encoding the ortholog of KLUH, shows a similar expression pattern and regulates plant architecture, ripening time and fruit mass [22]. Moreover, a single nucleotide polymorphism in the promoter of SLKLUH is highly associated with fruit mass [22]. The three closest homologs of KLU in soybean are GmCYP78A70 (Glyma.01G061100), GmCYP78A57 (Glyma.02G119600) and GmCYP78A72 (Glyma.19G240800). GmCYP78A72 has been proved to regulate the seed size and organ development [23]. Therefore, given the characteristics of the soybean genome and the function of CYP78A subfamily genes, soybean and its GmCYP78As forms an ideal subject for further studying the evolution and expression divergence of duplicated genes.
To that end, the present study analyzed the relationships between the origins of the three GmCYP78A genes and their relationships with the WGD in soybean. Moreover, clear expression divergence in different tissues was observed among the three genes. Our results showed that expression divergence largely explained the function variations of the CYP78A subfamily genes.

2. Materials and Methods

2.1. Gene Cloning

The GmCYP78A70, GmCYP78A57 and GmCYP78A72 gene fragments were amplified from the soybean cultivar Williams 82 (Supplementary Table S1). These PCR amplifications were carried out with KOD DNA polymerase in a 50 μL mix containing 200 μmol L−1 of dNTP, 0.4 μmol L−1 of each primer, 1 unit of KOD and 1 μL of cDNA. Reactions were performed at 95 °C for 2 min, and then cycled at 98 °C for 10 s, 55 °C for 15 s, 68 °C for 2 min for 35 cycles, and finally 68 °C for 5 min. The PCR products were cloned using a TA cloning vector (pMD18-T) and sequenced by Kumei Biology Co. (Changchun, Jilin, China). After verifying the sequences, these products were used for constructing an overexpression vector.

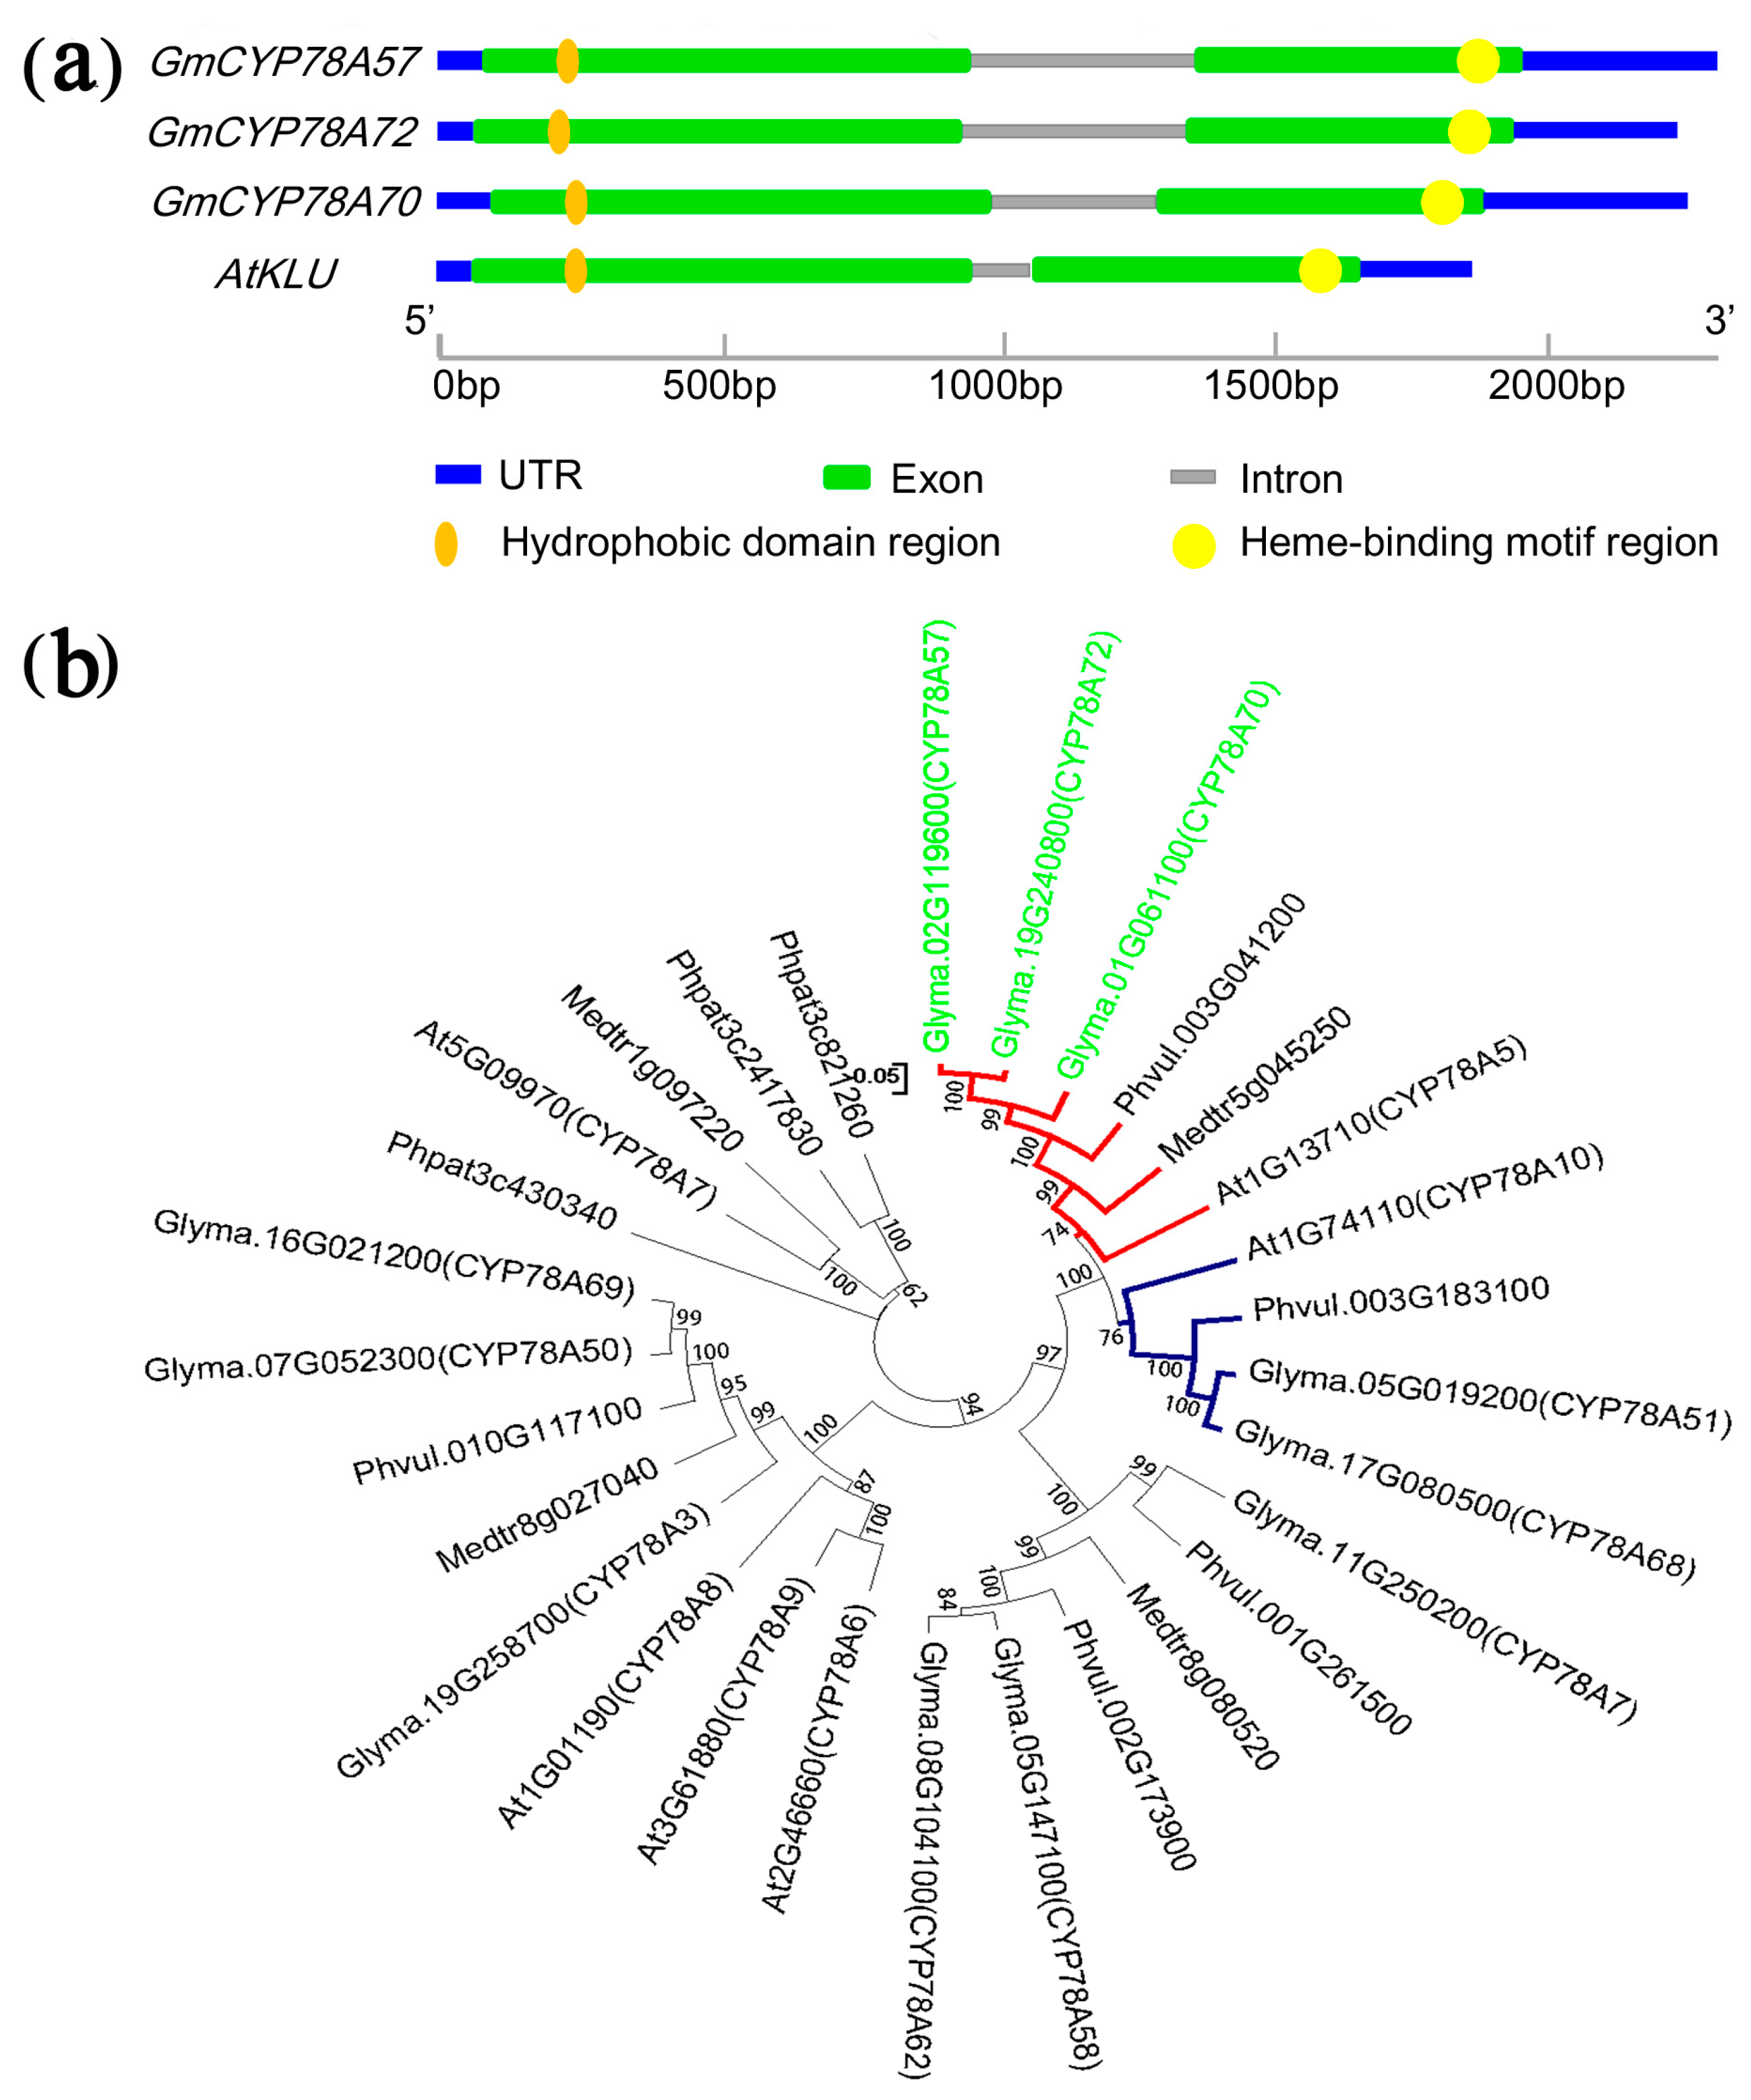
2.2. Phylogenetic Analysis and Gene Structure

We searched for the homologous genes of KLU/CYP78A5 from Phytozome (http://www.phytozome.net) for the following genomes: Arabidopsis thaliana, Glycine max, Medicago truncatula, Phaseolus vulgaris and Physcomitrella patens. Multiple sequence alignments of the amino acid sequences were performed in ClustalX (v 2.0.9) [24]. Unrooted phylogenetic and molecular evolutionary trees were constructed in MEGA7.0 (https://www.megasoftware.net/) using the neighbor-joining method [25]. The exon-intron organization was determined using the genome browser in RAP-DB (http://rapdb.dna.affrc.go.jp/). Gene structures were displayed using the Gene Structure Display Server (GSDS) (http://gsds.cbi.pku.edu.cn/chinese.php).

2.3. Ka/Ks Analysis and Calculating the Date of Duplication Events

The number of nonsynonymous substitutions per nonsynonymous site (Ka), and the number of synonymous substitutions per synonymous site (Ks), of the duplicated genes were calculated with the YN00 program in the PAML package [26]. The duplication date could be computed with the number of substitutions per silent site (Ks) [27]. A neutral evolutionary rate (λ) of substitutions per silent site per year was used to analyze the duplication history of the soybean genome. We calculated the duplication event dates using the equation T = Ks/2λ [28,29].

2.4. Constructs and Plant Transformation

The 35S::GmCYP78As vectors were constructed using a PCR-Restriction Enzyme ligation method. The coding sequences (CDS) were cloned into the pMD18-T TA cloning vector (Supplementary Table S1). The ProGmCYP78As::GUS vectors were constructed by a PCR-based Gateway system. Specifically, ~3000-bp promoter sequences of GmCYP78As were amplified (Supplementary Table S1), with a linker sequence at each end. The PCR products were recombined to the binary vector pCAMBIA3301 (35S of the GUS had been digested with NcoI and HindIII) by using the In-Fusion enzyme (In-Fusion Cloning Kit, Clontech, Mountain View, CA, USA).
The Dongnong50 soybean cultivar served as control in all the experiments. The pCYP78As::GUS was mobilized to the Agrobacterium tumefaciens strain EHA105 and used for the transformation of soybean in an Agrobacterium-mediated transformation [30].

2.5. Gene Expression Analysis

Total RNAs were isolated from plant tissues with Trizol (TIANGEN Biotech, Beijing, China) following the manufacturer’s instructions. RNA quality was determined by a Nanophotomoter (Implen, München, Germany). The removal of genomic DNA residues, reverse transcription and cDNA synthesis were separately performed with 2 μg of total RNA and a FastQuant cDNA RT Kit (TIANGEN Biotech). Real-time PCR analysis of GmCYP78As was performed with the FastStart Essential DNA Green Master (Roche, Shanghai, China) on a Stratagene Mx3005P (Agilent Technologies, Santa Clara, CA, USA, Supplementary Table S1). The relative expression levels were calculated from three replicates using the 2−ΔΔCt method after normalization to the Actin11 control in soybean [31].

2.6. Measurement of Leaf Area

A digital camera (Nikon D90, Tokyo, Japan) was used to photograph the entire plants and their organ morphology. Leaf surface areas were measured from the obtained digital images of dissected organs in Image J.

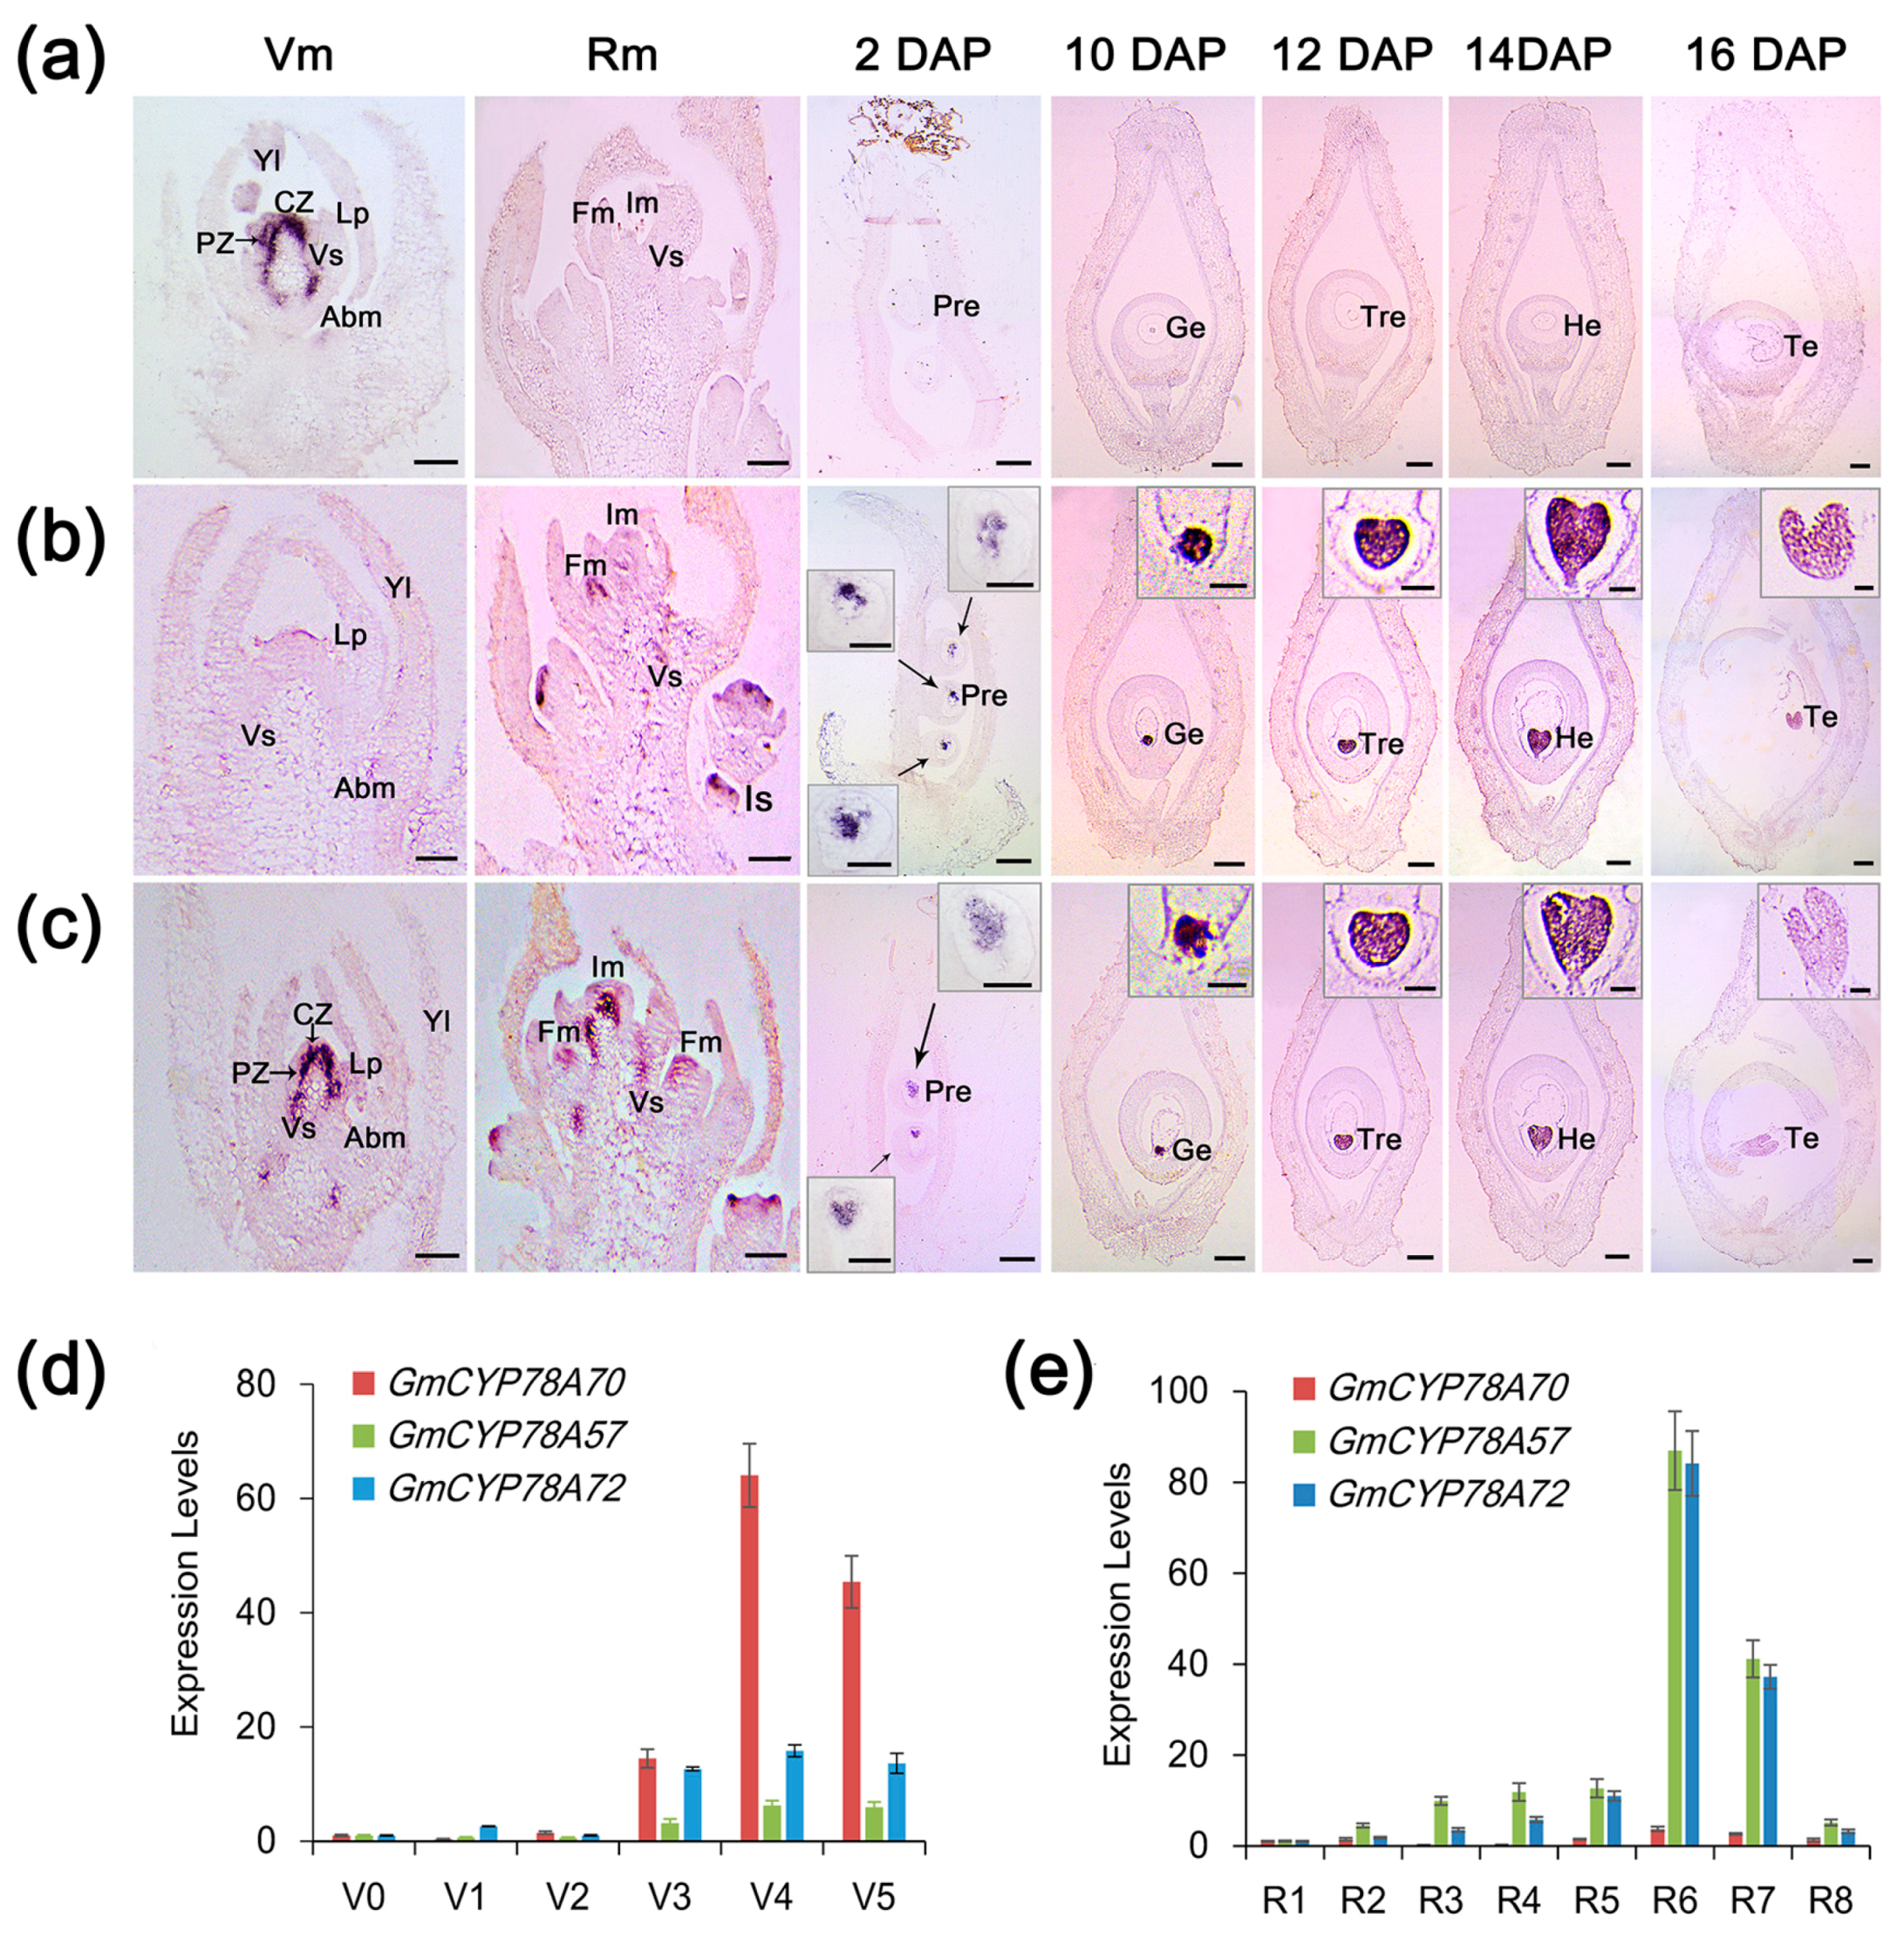
2.7. In Situ Hybridization

Tissue fixation for in situ hybridization was carried out according to the protocol of Feng et al. [32]. The tissues were embedded in paraffin (Paraplast Plus, Sigma-Aldrich, Saint Louis, MO, USA) and sliced into 8 μm sections with a microtome (Leica, Wetzlar, Germany). The 3’-region of the GmCYP78As cDNA was subcloned and used as a template to generate the sense and antisense RNA probes (Supplementary Table S1). Digoxigenin-labeled RNA probes were prepared with a DIG RNA Labeling Kit (T7/SP6) (Cat. no. 11175025910, Roche) according to the manufacturer’s instructions. The slides were observed under a bright field through a Leica microscope (DMI8, Leica).

2.8. Histology Analysis

For the GUS analysis, soybean tissues were incubated overnight at 37 °C in a 5-bromo-4-chloro-3-indolyl-b-glucuronic acid solution (Gold Biotechnology, Saint Louis, MO, USA). For clearing, tissues were treated with 70% ethyl alcohol. Light images from the GUS-stained tissues were obtained by an Olympus SZX7 (Olympus, Tokyo, Japan) stereomicroscope.

2.9. Artificial Selection Analysis

To analyze artificial selection, the selective sweep regions were detected with different parameters; namely, the nucleotide diversity (π) [33], and its π ratios (πlandraceGlycine soja, πimproved cultivarlandrace), and the pairwise fixation index (Fst) [34]. A 20-kb sliding window approach, with a 2-kb step-size, was applied to quantify these parameters using in-house PERL scripts. The top 1% and top 5% of outliers were selected to determine the region under evolutionary selection.

3. Results

3.1. Isolation and Structures of the GmCYP78A Subfamily Genes

We isolated and cloned the genomic and CDS sequences of the three GmCYP78A subfamily genes (Supplementary Figure S1). All were consistent with the reference sequences in phytozome (http://www.phytozome.net) and they showed high identity (ranging from 63.30% to 64.20% at the amino acid level) to Arabidopsis KLU. The three genes showed similar sizes of the genomic DNA sequences and the CDS (Supplementary Table S2). Furthermore, we determined the intron-exon boundaries of the three genes. According to the annotation of the soybean genome, the three genes had very similar exon boundaries (Figure 1a); all three genes have two exons and one intron, and the exon lengths of the three genes varied by no more than 9 bp. This points to the conservation of the three GmCYP78A genes for coding capacity and the cis-elements for splicing.
The putative products of the GmCYP78A genes were all structurally similar to that of KLU, in that they had a conservative heme-binding motif in the C-terminal region and a hydrophobic helix structure in their N-terminal region (Figure 1a; Supplementary Figure S2) [35,36,37].

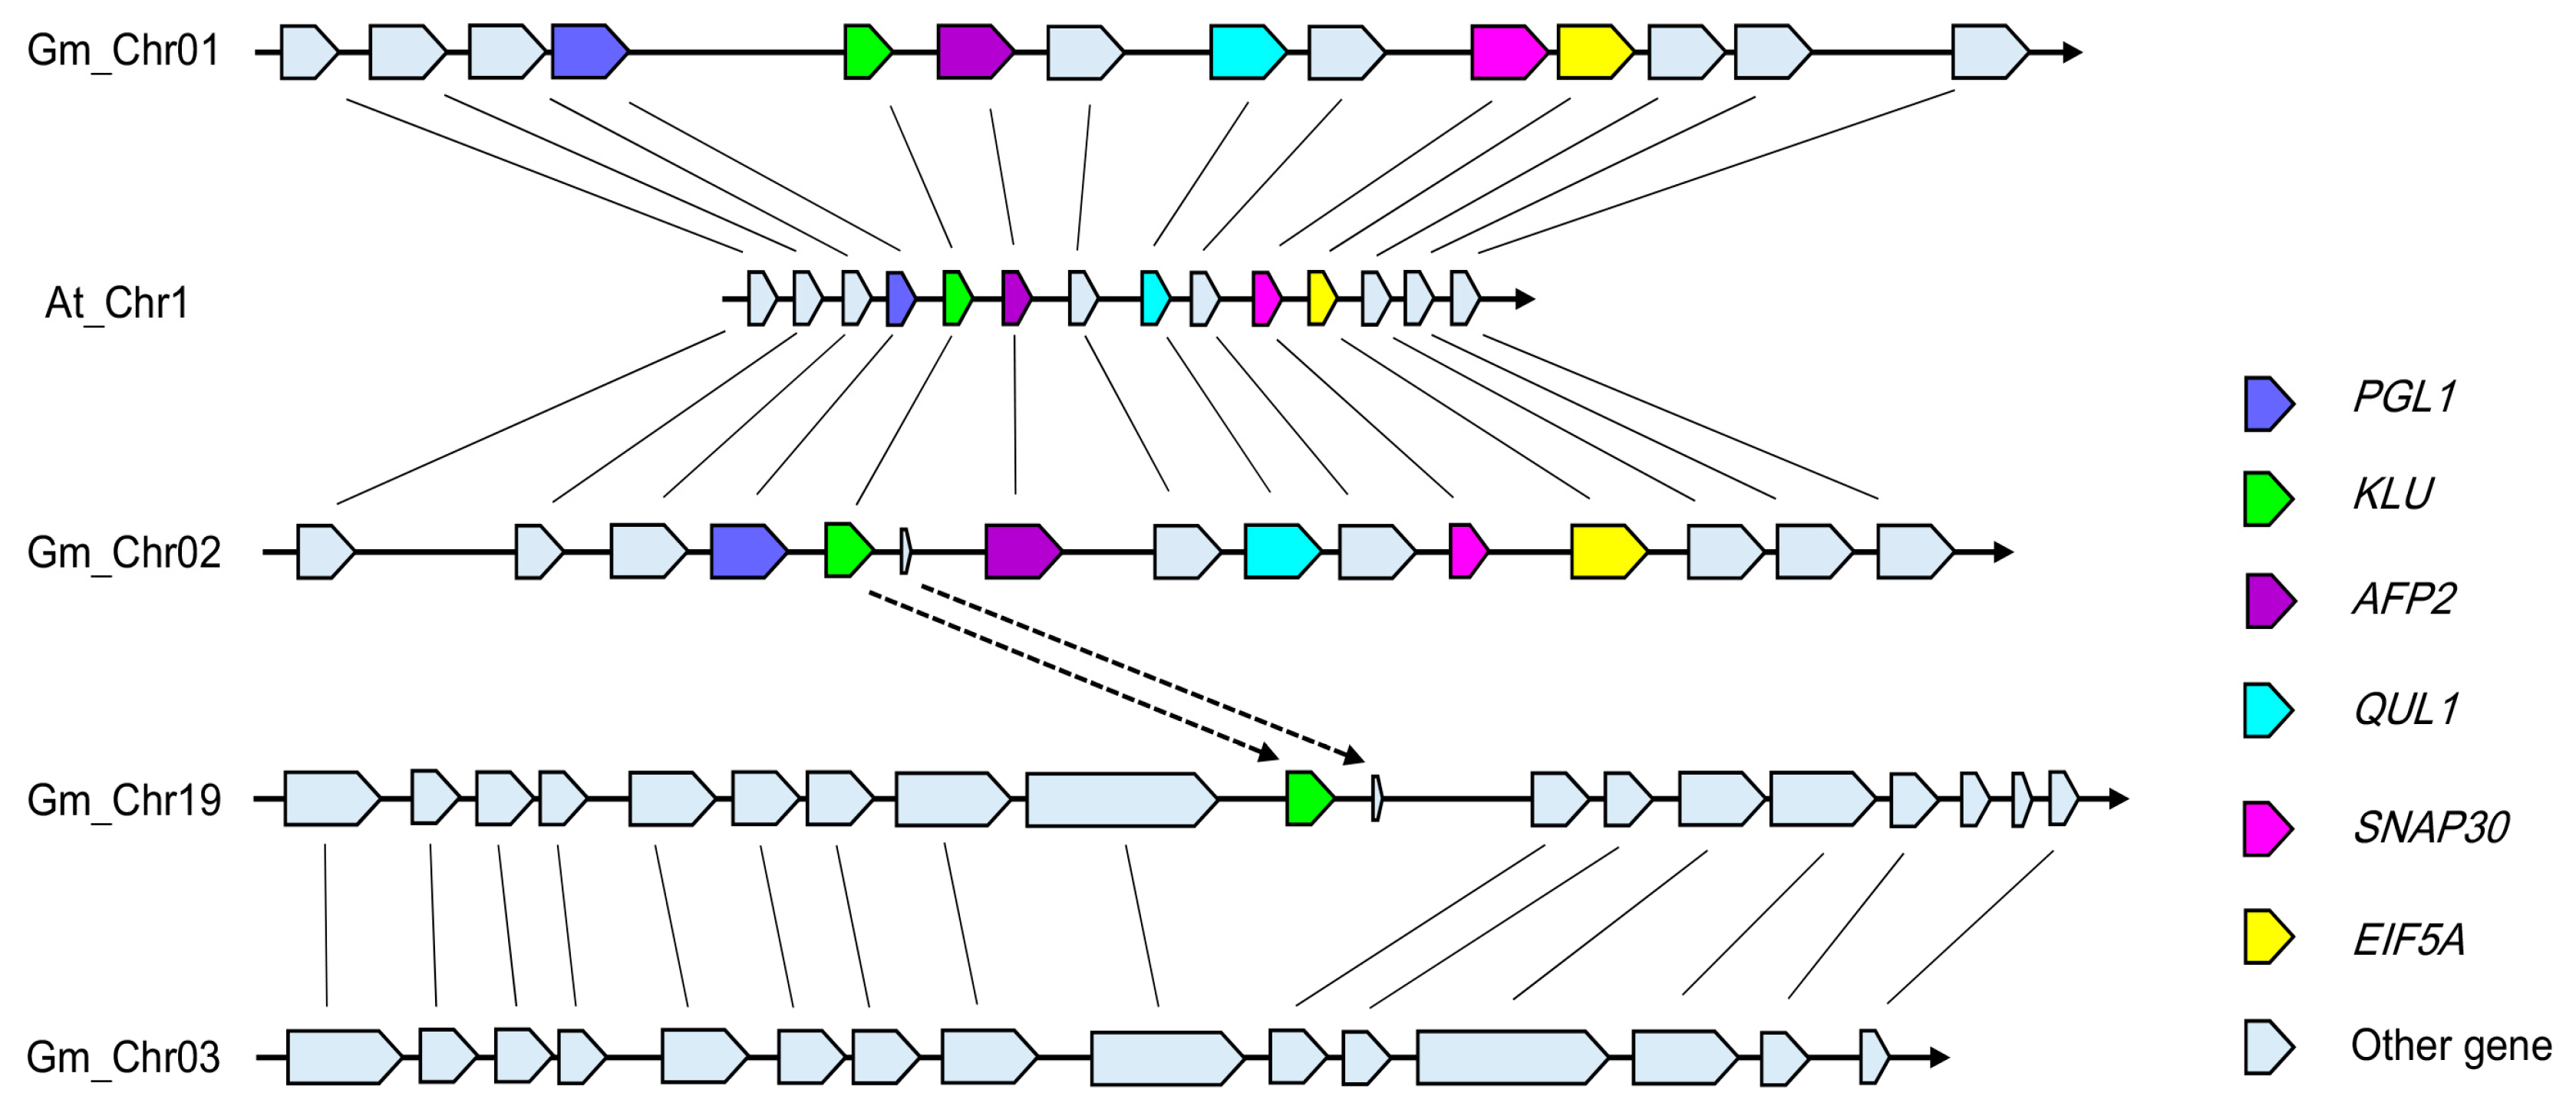
3.2. Evolution and Duplication of GmCYP78As

As we know, the WGD event that occurred 13 Mya did not occur in the progenitor shared with the genus Phaseolus or with the species Medicago truncatula [6,38,39]. So, according to the phylogenetic analysis of GmCYP78As and other CYP78A subfamily proteins from the five plant species (i.e., G. max, M. truncatula, P. vulgaris, P. patens and Arabidopsis), the GmCYP78As loci (the red branch) occurring as duplicate pairs in soybean are each represented by a single locus in their counterparts in P. vulgaris and M. truncatula (Figure 1b). Co-expression analysis found that GmCYP78A57 and GmCYP78A72 are involved in the same expression network (Supplementary Figure S3). The two genes could regulate the cellular process, metal ion transport and metabolic process in the network, especially in the development of seed (Supplementary Table S3). However, GmCYP78A70 was not found in this network.
To investigate the mechanism underpinning the emergence of three copies of KLU/CYP78A5 in G. max, we performed a synteny analysis of the 132,521 bp region around KLU—starting at 4642346 bp, and ending at 4774867 bp on Arabidopsis chromosome1—using the webtool “MultiSyn” (http://202.31.147.159:62001/) in the G. max genome [40]. Interestingly, in the ensuing synteny plot, the genes and their arrangement were only highly consistent with those in chromosomes 01 and 02 of G. max (Figure 2; Supplementary Figure S4a). So, GmCYP78A70 and GmCYP78A57 were thus located in the syntenic blocks. By contrast, the region around GmCYP78A72 on chromosome19 of G. max lacked a synteny relationship with the KLU locus in A. thaliana. Therefore, to determine the origin of GmCYP78A72, we used a 203,399 bp region around GmCYP78A72—starting at 48753501 bp, and ending at 48956900 bp on G. max chromosome 19—to search the soybean genome for homologous regions. The flanking sequence of GmCYP78A72 showed strong synteny with a region on chromosome03 (Figure 2; Supplementary Figure S4b).
We also calculated the dates of the duplication events based on the non-synonymous nucleotide substitution rate (Ks) [41]. According to these results, the duplication event between GmCYP78A70 and GmCYP78A57 occurred 13.49 Mya, which coincided with the Glycine WGD in the Glycine lineage (Supplementary Table S4) [6], thus suggesting that this gene pair arose from the Glycine WGD event. However, the duplication event between GmCYP78A57 and GmCYP78A72 was estimated at ~3.87 Mya, much later than the Glycine WGD. Thus, it is likely GmCYP78A72 was individually copied to its location after the duplication event between GmCYP78A70 and GmCYP78A57.

3.3. Spatiotemporal Expression Patterns of GmCYP78A Homologs

We examined the expression patterns of the three homologs via quantitative real-time PCR (qRT-PCR) using Williams82 (wild-type) mRNA and in situ hybridization. This analysis showed that the expression levels of the three GmCYP78A homologs were relatively low and stable from the vegetative 0 (V0) stage (when the cotyledons at node 0 are fully extended, but the unifoliate leaflets at node 1 have not yet unrolled) [42] to the V2 stage (when the first trifoliate leaflets at node 2 are fully expanded, but the second trifoliate leaflets at node 3 have not yet unfolded). However, expression increased dramatically in the V3 stage (when the second trifoliate leaflets are fully expanded but the third trifoliate leaflets remain rolled), especially for GmCYP78A70 (Figure 3d). Next, we compared the expression patterns of the three genes at different reproductive growth stages. Interestingly, the expression of GmCYP78A70 was down-regulated to a relatively low level whereas both GmCYP78A72 and GmCYP78A57 exhibited significantly higher levels of expression in stage R3 (pods are 5 mm in size at one of the four uppermost nodes on the main stem) through to R8 (95% of the pods have reached their full mature color), but especially in R6 (pod containing a green seed that fills the pod capacity at one of the four uppermost nodes on the main stem) (Figure 3e). The markedly high expression levels of GmCYP78A57 and GmCYP78A72 indicated their possible participation in the growth and development of soybean reproductive organs. Moreover, the shared expression pattern of GmCYP78A57 and GmCYP78A72 confirmed that they shared the same branch on the evolutionary tree (Figure 1b).
In the vegetative meristem (12 d), both the GmCYP78A70 and GmCYP78A72 transcripts were clearly detected in the central and peripheral zones of the shoot meristem and vascular strand (Figure 3a,c). GmCYP78A70 was also expressed in the axillary bud meristem. However, only a very weak expression of GmCYP78A57 was detected in these tissues (Figure 3b). In the reproductive meristem (35 d), GmCYP78A57 and GmCYP78A72 were highly expressed not only throughout the inflorescence and floral meristems, but also in the developing vascular strand (Figure 3b,c). Moreover, GmCYP78A57 could be detected in the inflorescence stem. However, weak or no expression of GmCYP78A70 occurred in the areas mentioned above (Figure 3a). In the young pod (10~16 DAP; days after pollination), abundant GmCYP78A57 and GmCYP78A72 transcripts were clearly observed in the embryo development of the globular, transition, heart and torpedo stages (Figure 2b,c), which together are responsible for cell proliferation toward the central vacuole. Moreover, GmCYP78A57 showed higher expression levels than did GmCYP78A72 during the process of embryo development, whereas their expression locations were similar. GmCYP78A70 expression went undetected in the embryo. As the negative control, the sense probes did not provide any signal (Supplementary Figure S5). The localization of GmCYP78As’ expression in both the meristem and the embryo was further corroborated by the real-time PCR results.

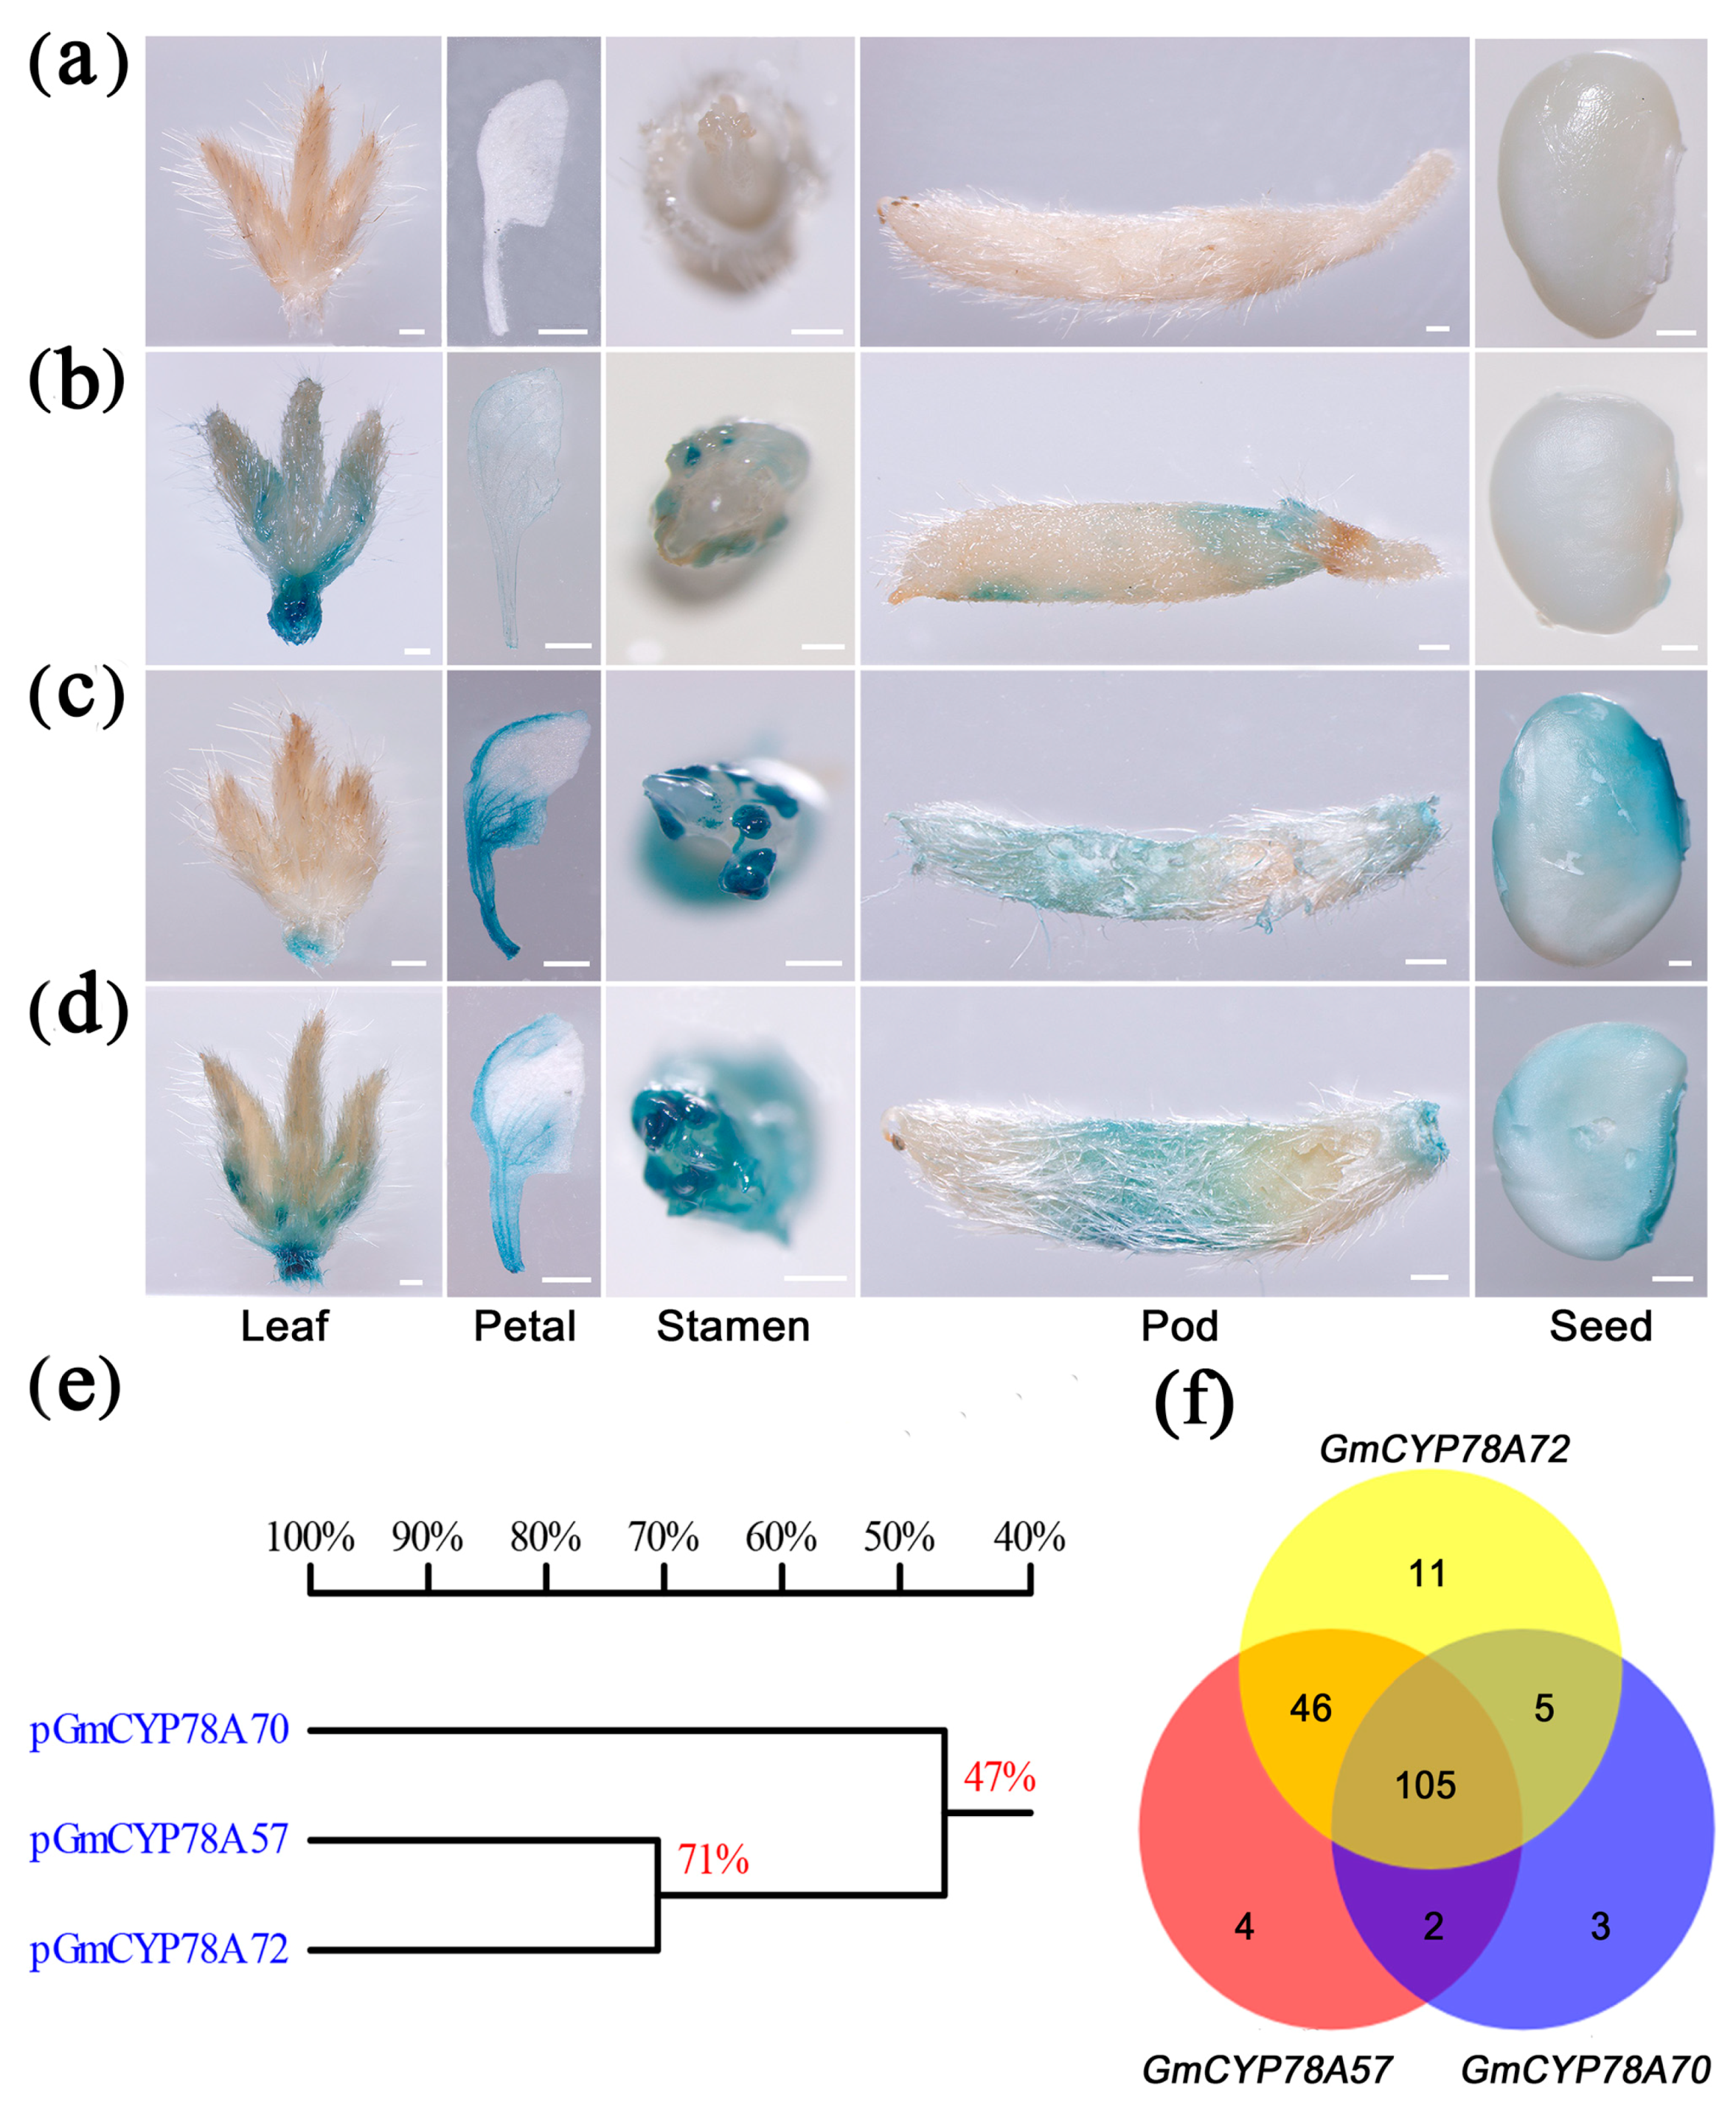
3.4. Activity and Transcription Factor Binding Sites of GmCYP78As Promoters Lead to Specialized Expression

The specific expression patterns may result from the different promoter activities of GmCYP78As. Promoters of GmCYP78A57 and GmCYP78A57 showed higher identity than that of GmCYP78A70 in the reference ‘Williams 82’ genome (Figure 4e). Therefore, we constructed the ProCYP78As::GUS vectors (Supplementary Figure S6) and transformed them into the soybean cultivar Dongnong50. The tissue-specific expression patterns of the GmCYP78As were examined by a histochemical assay of GUS activity. In the transformed plants of ProCYP78A70::GUS, the activity of GUS was high in young trifoliate leaflets (V2 stage) and pod trichome (R4 stage), whereas it was low or absent in the petal (R2 stage), stamen (R2 stage) and seed (R4 stage) (Figure 4b). Interestingly, GmCYP78A57 promoter activity was concentrated in the petal, stamen, pod trichome and seed tissues, but not in the young trifoliate leaflets, for which only a relatively lower GUS activity was detected at the petiole’s end (Figure 4c). For the plants of ProCYP78A72::GUS, high GUS activity was detected in all the tissues and organs mentioned above (Figure 4d). These differences in promoter activities explained the expression patterns of GmCYP78As, and thus confirmed our hypothesis.
Going further, we explored the transcription factor binding sites (TFBs) in the promoters of GmCYP78As. The stable clusters of co-occurring TFBs coordinately regulate those gene sets associated with highly specific cellular activities [43,44]. Hence, we used the 2 kb promoter region of the GmCYP78As and searched the A. thaliana transcription factor binding sites in the JASPAR database (http://jaspar.genereg.net/) (Figure 4f; Supplementary Table S5). Our results revealed 115 TFBs in the promoter region of GmCYP78A70, including three specific transcription factors: BZR1, SOD7 and DPA4. In Arabidopsis, overexpression of the mutant bzr1-1D gene increased cell elongation and led to a longer petiole and larger rosette leaves in the overexpression seedlings [45]. The CACTTG sequence is reportedly recognized by the transcription factors SOD7 and DPA4, and those two factors acted redundantly to regulate seed size by directly repressing KLU expression [46]; interestingly, since there is a CACTTG sequence only in the promoter of GmCYP78A70, this might help explain the specialized expression of the GmCYP78As. We found 157 TFBs in the promoter region of GmCYP78A57, among which we identified four specific ones: ZAP1, F3A4, SMZ and TCP4. In Arabidopsis, the miR319a-targeting of TCP4 was critical for petal growth and development [47]. An AP2-like transcription factor, SMZ, which repressed flowering and was a target of the regulatory miRNA172, functioned together with related proteins to directly regulate FLOWERING LOCUS T (FT) expression [48]. For GmCYP78A72, there were 167 TFBs and 11 specific ones—CRF4, PIF1, LFY, RAX3, ERF109, SPL7, TCP16, TCP5, FHY3, ABI5 and ABF3—in its promoter region, which had the most abundant gene-specific TFBs among the three soybean genes. In Arabidopsis, ERF109 mediated the cross-talk between jasmonic acid and auxin biosynthesis during the formation of lateral roots [49]. In addition, BRASSINOSTEROID INSENSITIVE2 (BIN2) could interact with ABSCISIC ACID INSENSITIVE5 (ABI5) to mediate the antagonism of brassinosteroids to abscisic acid during the phase of seed germination in Arabidopsis [50]. The ABA-responsive element binding factors ABF3 and ABF4 functioned in ABA signaling, and constitutive overexpression of either in Arabidopsis resulted in ABA hypersensitivity and other ABA-associated phenotypes, such that the transgenic plants had reduced transpiration and enhanced drought tolerance [51]. Since many of these transcription factors are expressed in the vegetative stages of plants, this likely explains why GmCYP78A72 was not only present in the reproductive tissues, but in the vegetative ones as well.

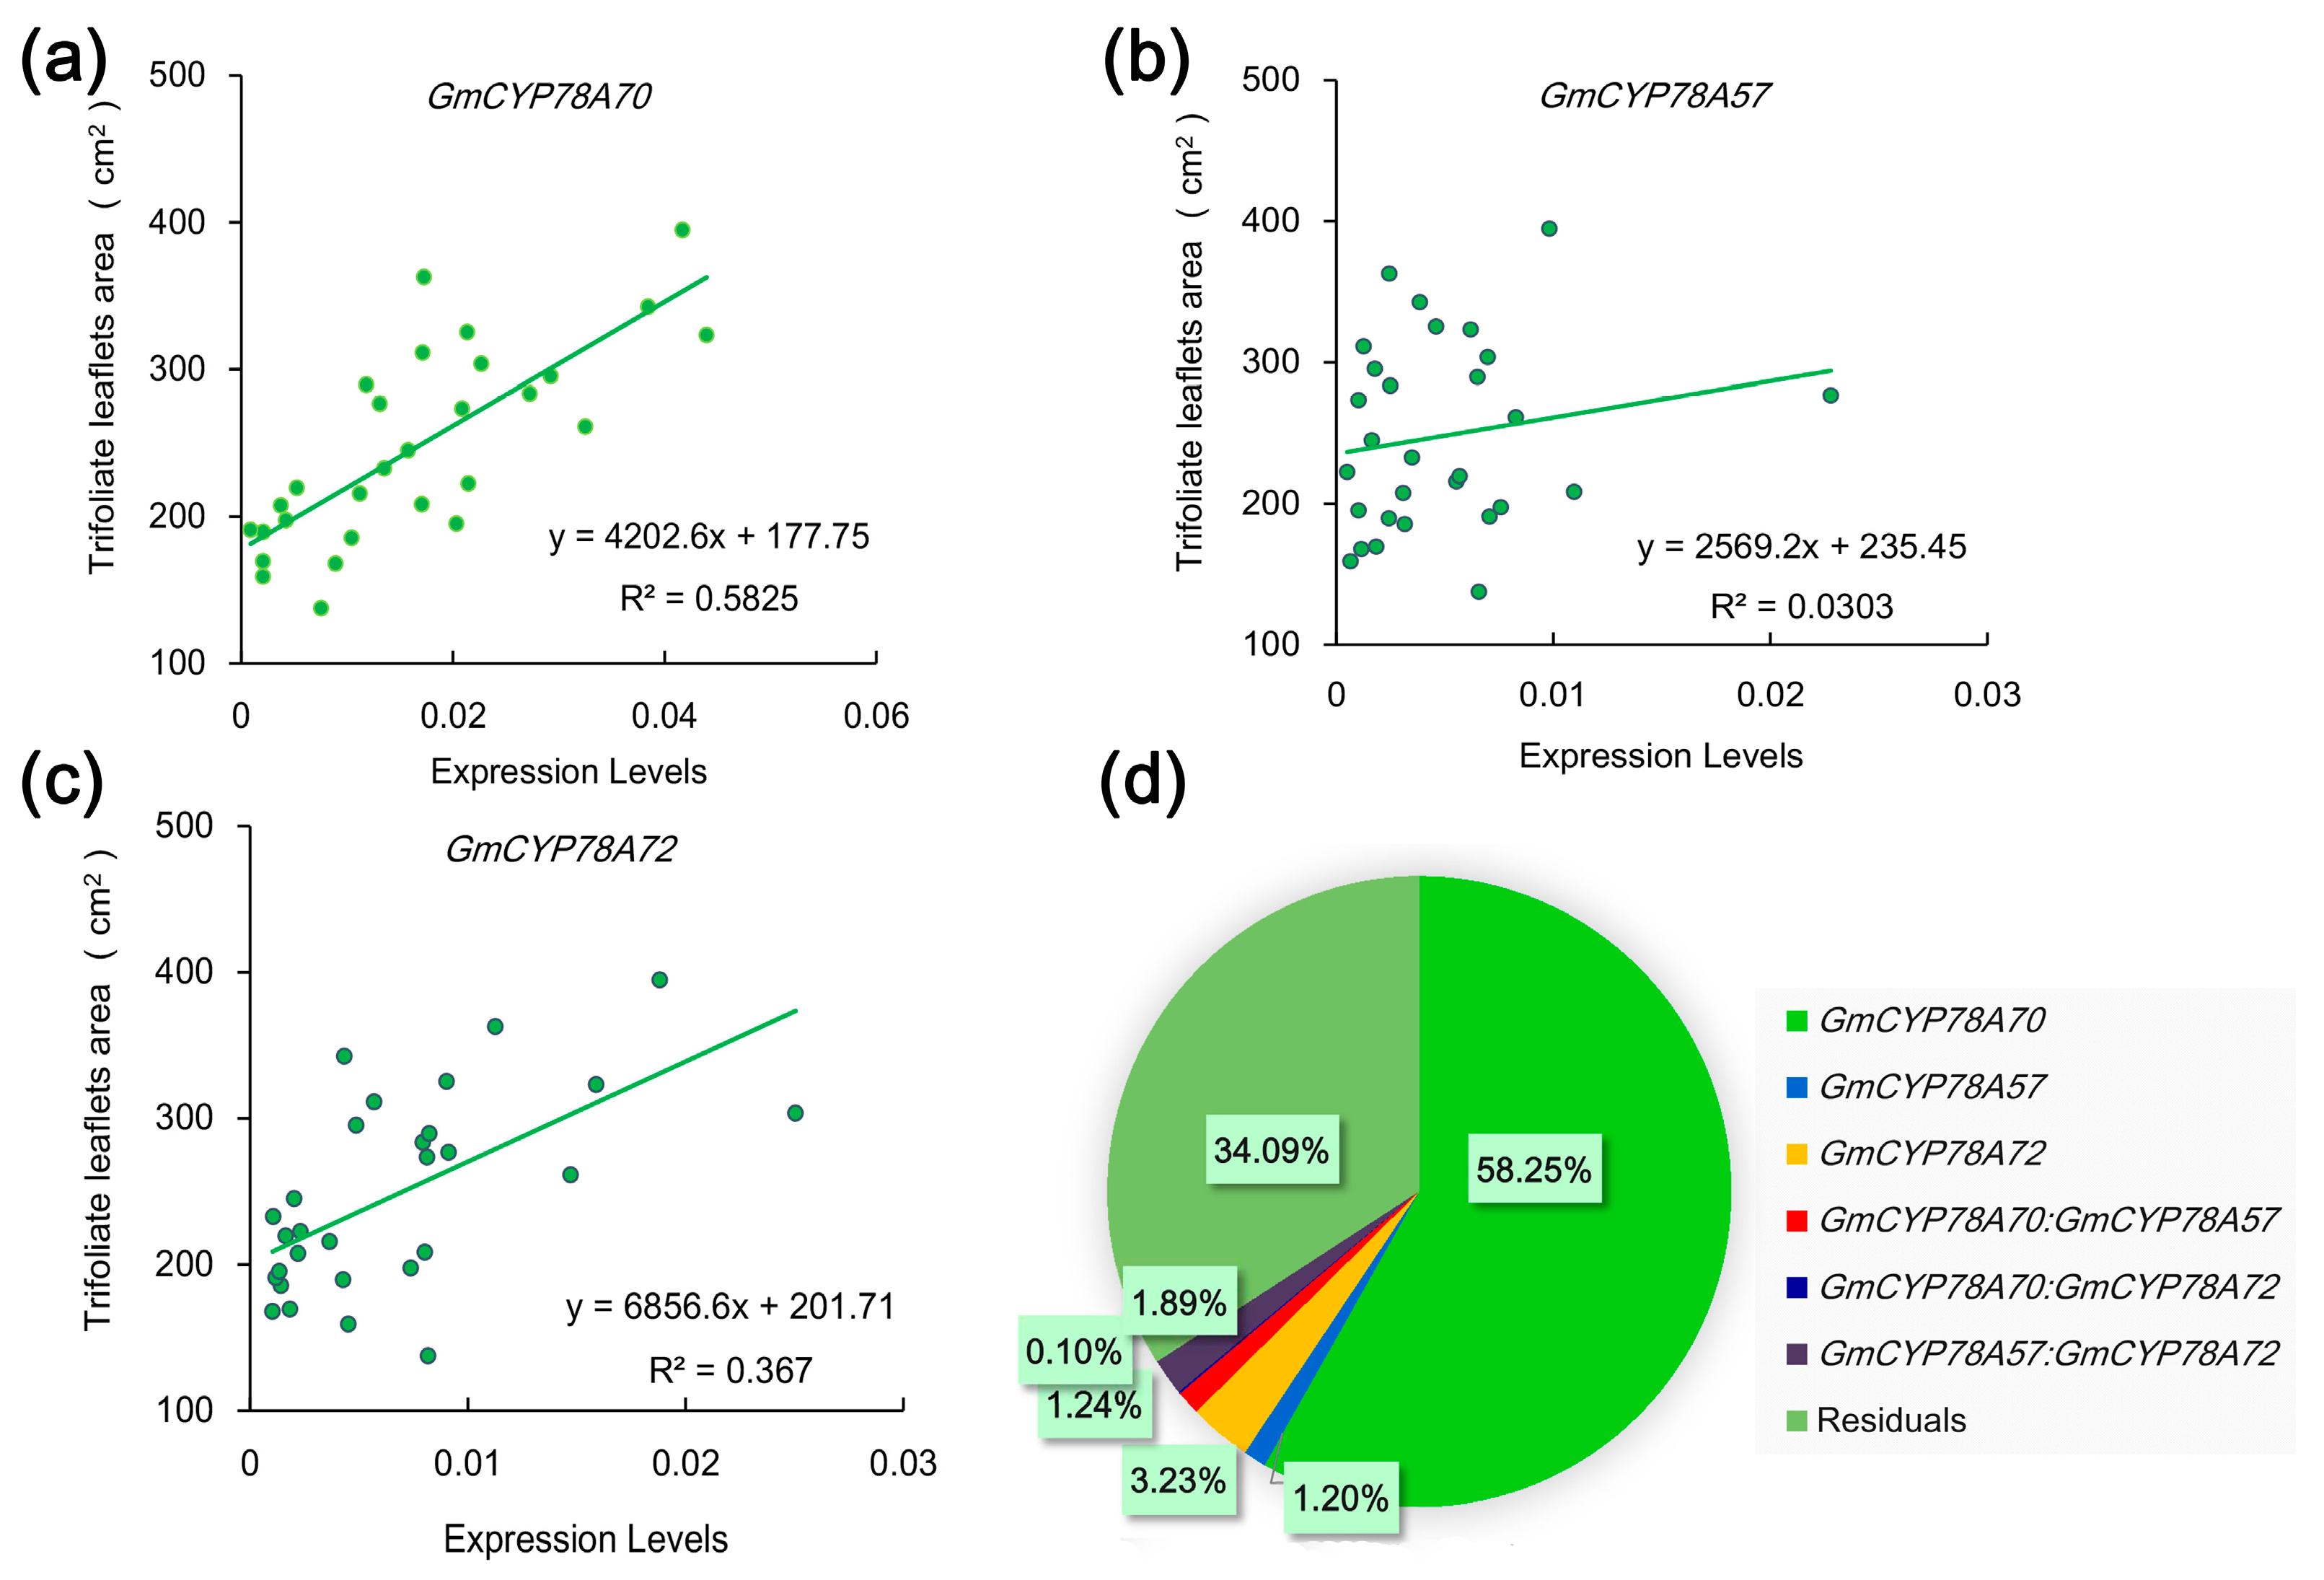
3.5. Correlations of Expression Levels of GmCYP78As and Leaf Size in Soybean

The specific expression patterns of the GmCYP78As indicate the possibility of correlations between their expression levels and leaf size in the different soybean cultivars. To investigate this hypothesis, we tested the relationships between the leaf area and GmCYP78As expression in 30 soybean cultivars at the V5 stage. The qRT-PCR analysis of leaf samples showed a significant positive correlation between the area of trifoliate leaflets and the expression levels of GmCYP78A70 and GmCYP78A72. The Person’s r correlation coefficients of GmCYP78A70 and GmCYP78A72 were 0.76 (R2 = 0.5825) and 0.61 (R2 = 0.3670) (Figure 5a,c), respectively. However, GmCYP78A57 did not show any significant correlation with leaf area (R2 = 0.0303) (Figure 5b). Moreover, we calculated the respective contribution of each gene’s expression level to the leaf size trait via regression analysis, finding that GmCYP78A70 explained 58.25% of the variation in the enlargement of leaf size (Figure 5d), while the contributions of GmCYP78A57 and GmCYP78A72 were both relatively low.
We categorized the promoters of GmCYP78As by genotype according to the sequences in 302 soybean accessions [52], and then amplified and sequenced the specific SNP (single nucleotide polymorphism) regions. We found that cultivars with “Genotype 1” and “Genotype 2” promoters showed higher expression levels of GmCYP78A70, and also produced trifoliate leaflets that were larger in area. “Genotype 3” consisted mostly of cultivars which showed lower expression levels of GmCYP78A70 and smaller-sized trifoliate leaflets (Supplementary Table S6).

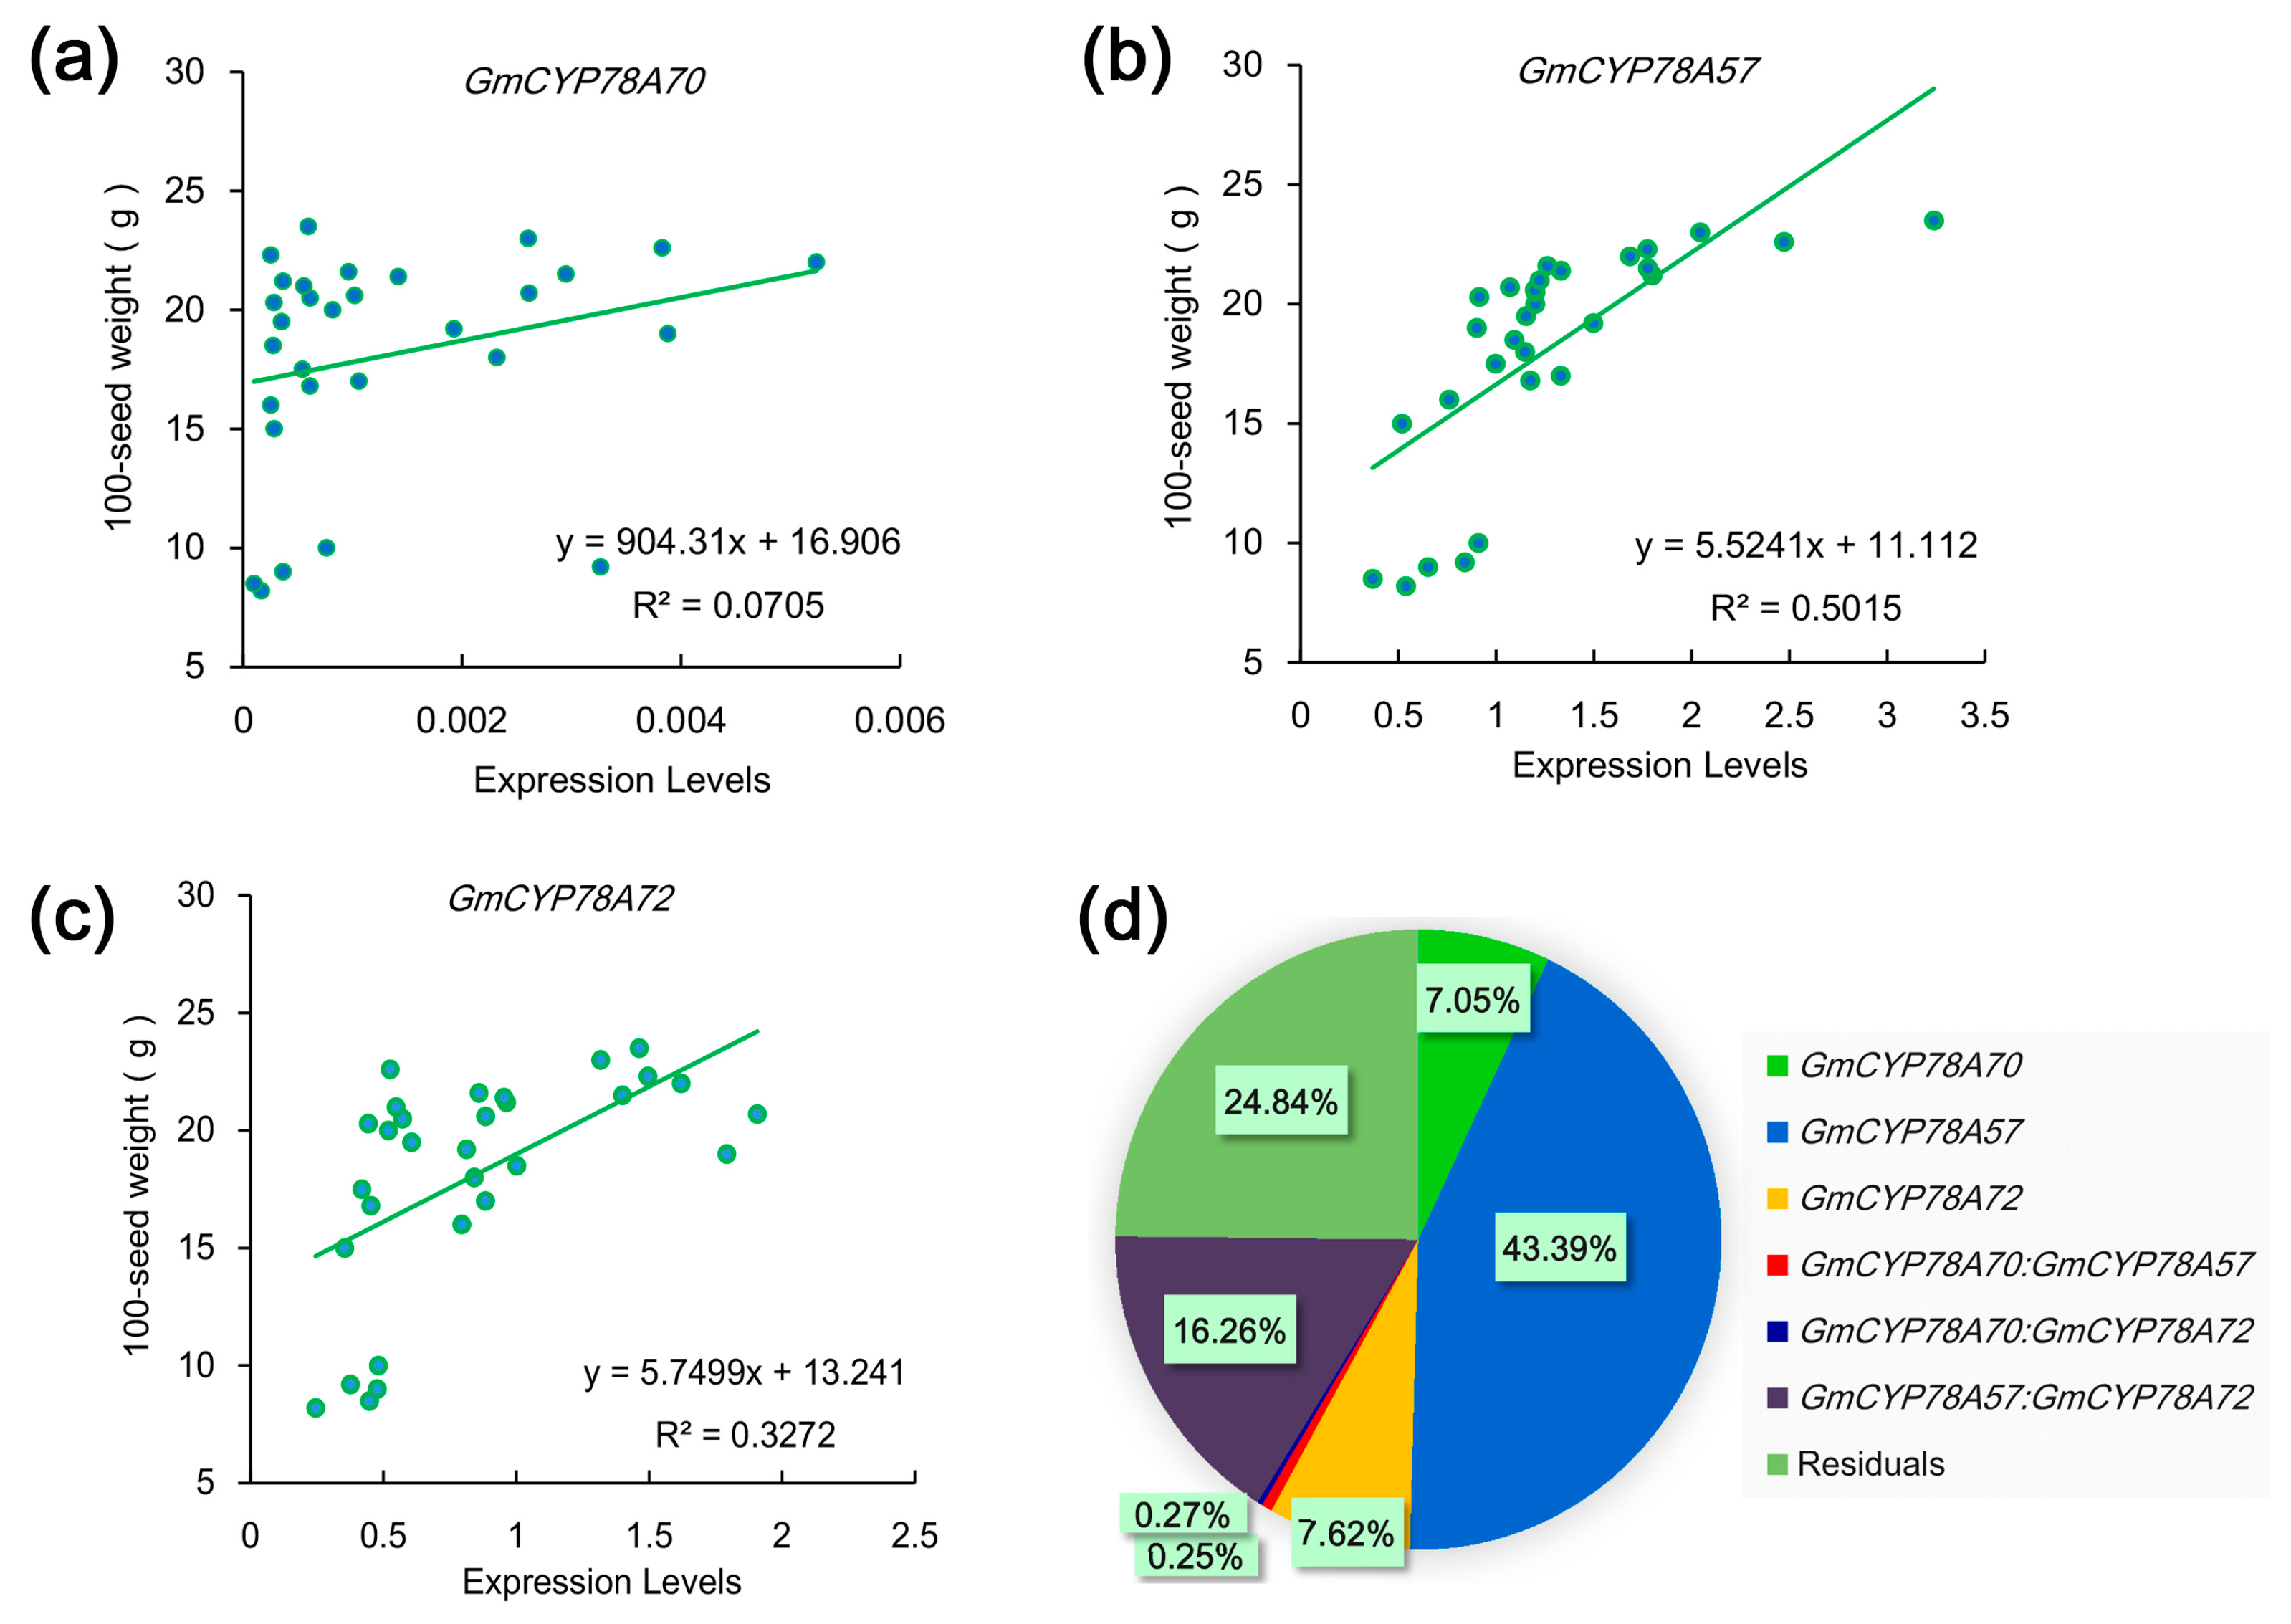
3.6. Correlations between the Expression Levels of GmCYP78As and the 100-Seed Weight in Soybean

Larger seeds offer the newly germinating seedling a larger initial supply of nutrients which increases their competitiveness during seedling establishment and strengthens their tolerance to adverse environmental conditions [53]. Since GmCYP78A72 is involved in regulating seed size, we speculated that those soybean cultivars with larger seeds might exhibit higher expression of GmCYP78A72. To test this hypothesis, we analyzed the correlation between the expression levels of GmCYP78As and the 100-seed weight. We used 30 soybean cultivars on the basis of different 100-seed weights to test the expression levels of the three genes in seeds that were in the late maturation stage [54]. The 100-seed weight and the expression levels of GmCYP78A57 and GmCYP78A72 were positively correlated, with Person’s r coefficients of 0.71 (R2 = 0.5015) and 0.57 (R2 = 0.3272) (Figure 6b,c), respectively, whereas that of GmCYP78A70 was weak, at 0.27 (R2 = 0.0705), which meant the GmCYP78A70 expression level and the 100-seed weight were not related (Figure 6a). To further determine the contribution of GmCYP78As towards seed size improvement, we fitted regression models between the 100-seed weight and the expression levels. The percentage contributions of GmCYP78A57, GmCYP78A70 and GmCYP78A72 were 43.39%, 7.05% and 7.62%, respectively (Figure 6d). Hence, GmCYP78A57 significantly regulated the growth of seeds and its contribution was higher than that of GmCYP78A70 and GmCYP78A72 combined.
We genotyped two kinds of GmCYP78A57 promoters in the 30 soybean cultivars, “Genotype 4” and “Genotype 5”. The expression levels of GmCYP78A57 in the cultivars with “Genotype 4” were unremarkable when compared with those of “Genotype 5” (Supplementary Table S7). However, the lowest expression levels of GmCYP78A57 were concentrated solely among those cultivars with “Genotype 5” promoters, and their corresponding 100-seed weights were also relatively small.

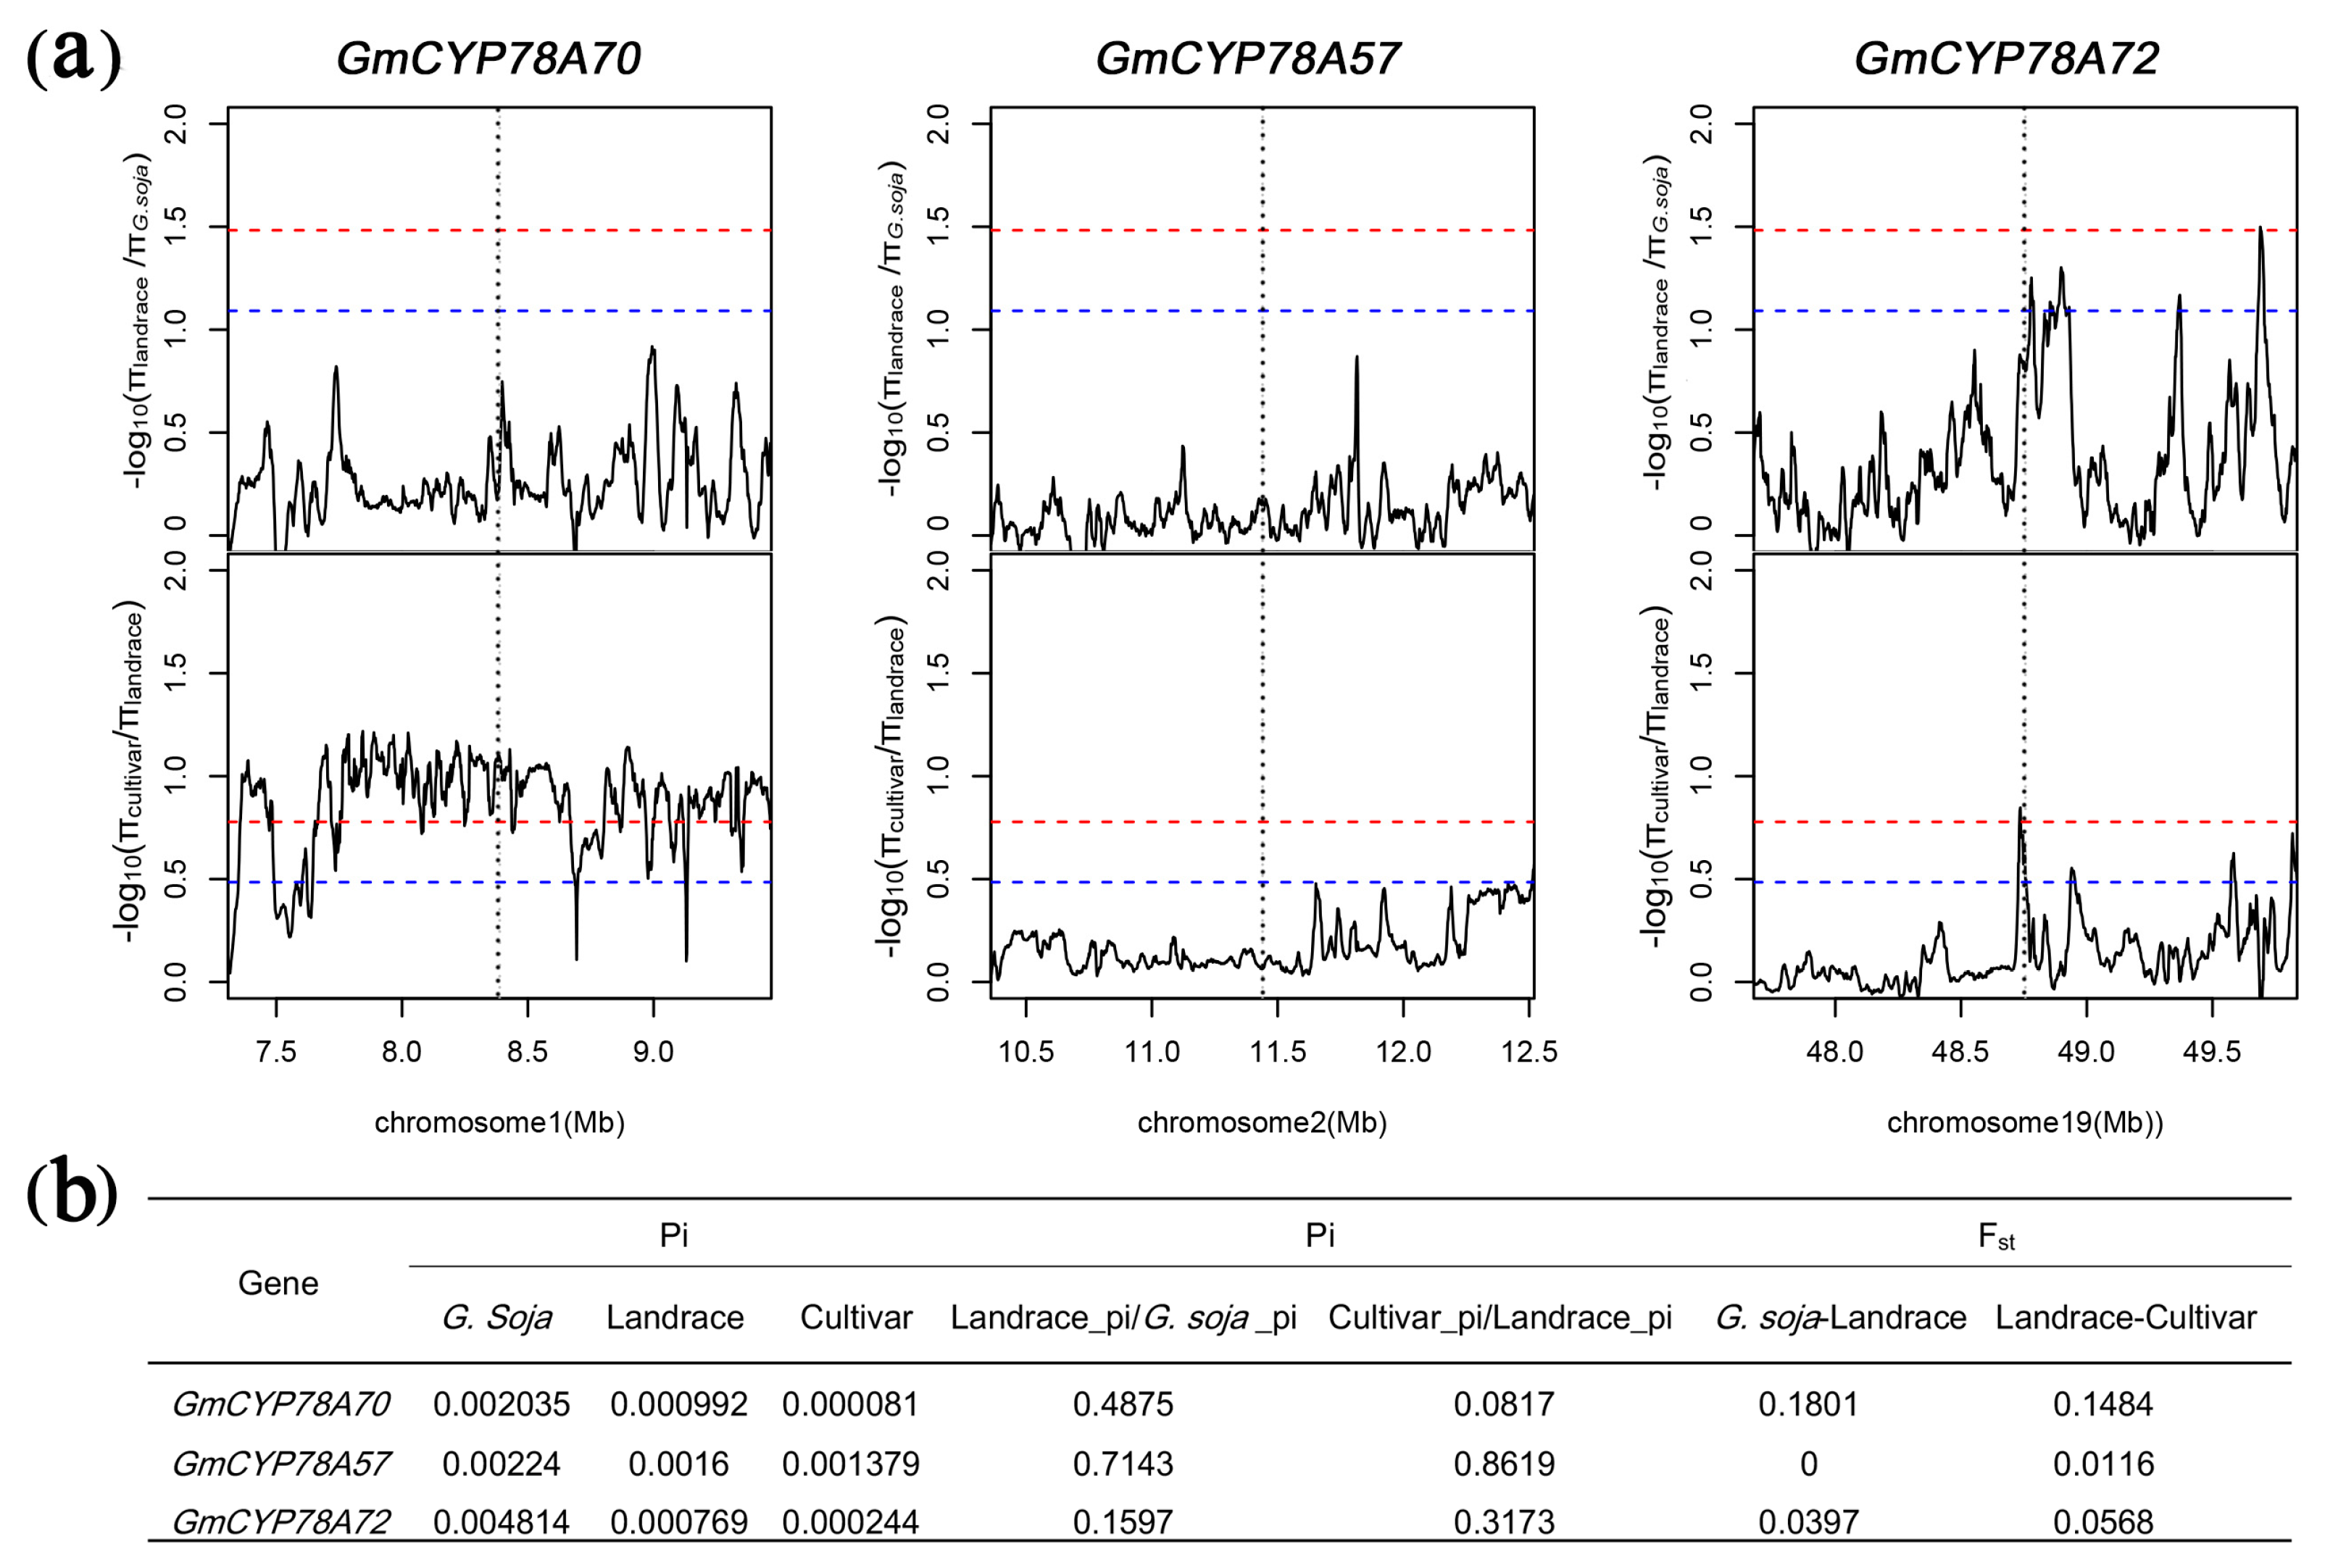
3.7. GmCYP78As Experienced Different Domestication and Improvement in Soybean

Expression levels of the GmCYP78As showed remarkable positive correlations with leaf area and with seed size, both of which are important agronomic traits. As such, we examined the selective pressure by diversity (π) and the π ratio between populations and the genomic sequences of GmCYP78As in 302 wild and cultivated accessions [52] (Figure 7; Supplementary Figure S7; Supplementary Table S8). The π ratio of the GmCYP78A70 region was low between Glycine soja and landrace, whereas it was extremely high between landrace and the improved cultivars (Figure 7a). This result indicates that GmCYP78A70 may have experienced weak selection during the domestication of soybean. but intense selection during its improvement. For the GmCYP78A72 region, the π ratio between G. soja and landrace could reach the top 5% threshold range, whereas π ratio between landrace and the improved cultivar reached the top 1% threshold section (Figure 7a). Moreover, the π value of GmCYP78A72 in Glycine soja was twice as high as those of the other two genes (Figure 7b), while the π value of GmCYP78A57 was similar to that of GmCYP78A70 (Figure 7b). However, all the π ratios of the GmCYP78A57 region were very low (Figure 7a). Collectively, these results indicated that the GmCYP78A70 region only experienced improvement breeding, while GmCYP78A72 experienced both domestication and improvement breeding.
The Ka/Ks ratios of the three GmCYP78A genes demonstrated that they all evolved under purifying selection (Ka/Ks < 1) (Supplementary Table S6) [55]. One study suggested that sub-functionalized gene copies, when they show transcriptional divergence across either tissues or cell types, are expected to undergo purifying selection [56].

4. Discussion

Gene duplication plays a central role in plant diversification as a key process that forms the raw material necessary for adaptive evolution. Our study focused on the evolution and expression divergence of three GmCYP78A subfamily genes, which may be explained by the following hypothesis. First, the ancestor of the three GmCYP78As was a single copy gene; it was expressed in both vegetative and reproductive organs. Then, GmCYP78A70 and GmCYP78A57 were derived from this single copy gene during the Glycine WGD process at ~13 Mya, followed by the formation of GmCYP78A72 from GmCYP78A57 on chromosome2. After the Glycine WGD, GmCYP78A70 was only expressed in vegetative tissues whereas GmCYP78A57 was only expressed in reproductive tissues. However, GmCYP78A72 maintained the expression pattern of the ancestral gene.

4.1. Contribution of Expression Divergence to the Retention of GmCYP78A Duplicate Genes

Previous studies have shown that divergence in gene expression contributes to the retention of duplicate genes [18,57]. In our work here, a clear divergence in the expression patterns was found among the GmCYP78A subfamily members. GmCYP78A70 is expressed specifically in the leaf primordia, while GmCYP78A57 is expressed mainly in floral organs and seeds; yet, GmCYP78A72 is expressed in all the aforementioned tissues. Nevertheless, the expression levels of the three genes increased according to the growth of the regulated organs, suggesting that the expression divergence in these duplicated genes could be attributed to functional requirements. The CYP78A subfamily genes play important roles in various plant developmental processes, such as organ growth, anther and pollen grain maturation, and fruit development [20,22,58]. Angiosperms possess more complex organ systems and structures than do gymnosperms, and when these are newer they may require more CYP78As to maintain their biological functions. Interestingly, the three GmCYP78A genes showed significant expression in leaf, flower and seed. This is a powerful reason for the retention of the three duplicate genes in soybean’s evolutionary history.

4.2. GmCYP78A Subfamily Underwent Artificial Selection during Soybean Breeding

In soybean, GmCYP78A10 is an orthologous gene of Arabidopsis AtCYP78A10, which is a subfamily member of the KLU. The allelic variation of GmCYP78A10 is only associated with soybean seed size and pod number, but not with other domesticated traits [59]. In our study, however, we demonstrated that the expression levels of GmCYP78A57 and GmCYP78A72 were actually very high in the cultivars. Furthermore, a remarkable correlation was found between the leaf size and the expression levels of GmCYP78A70 and GmCYP78A72. Moreover, the 100-seed weight of the soybean cultivars also showed a significant correlation with the expression levels of GmCYP78A57 and GmCYP78A72. This suggests that after an extended period of artificial selection, the expression of all three genes has been enhanced, especially in those cultivars characterized by larger leaves and seeds.
Based on the population differentiation rate among the wild relatives, landraces and improved cultivars, GmCYP78A72 has experienced continued selection during soybean domestication and modern breeding. Upon domestication, seed size was the most important trait sought after during artificial selection, and the variability in the GmCYP78A72 region provided great potential and a direct target for selection since it controls seed size. Meanwhile, its expression correlation with leaf size represents an indirect target for artificial selection, in that a large leaf size is often correlated with a higher photosynthesis rate, which provides the ultimate resource for large seeds or high yields. Under these circumstances, then, it is not at all surprising that GmCYP78A72 was the initial target for selection.
In the modern breeding era, particularly given the widespread application of chemical fertilizers, which enables extensive vegetative growth, further selection on leaf size might be more efficient to leverage the yield potential of soybean. In this case, breeders may wish to fully consider the photosynthesis efficiency of leaves; and if so, GmCYP78A70 would experience stronger artificial selection in any improved cultivar breeding. Given the fact that the expression of GmCYP78A57 is significantly correlated with seed size, while it has not supposed to experience significant artificial selection. However, this may indicate the potential of GmCYP78A57 for improving seed size under future breeding selection scenarios. Hence, the cultivars featuring larger leaves and seeds, most of which showed a relatively high expression of the three genes, could be easily selected by breeders as the ‘chassis’ varieties in breeding new elite varieties of soybean. The relatively high expression levels of GmCYP78A57 and GmCYP78A72 in the larger soybean cultivars make them ideal candidates for the future breeding of large-seed soybean plants.

Supplementary Materials

The following are available online at https://www.mdpi.com/2073-4425/9/12/611/s1, Figure S1: Isolation of the GmCYP78As from soybean, Figure S2: Conserved sites in the CYP78As from soybean, Arabidopsis, rice, Medicago truncatula, Vigna angularis and Phaseolus vulgaris, Figure S3. Co-expression networks of GmCYP78A57 and GmCYP78A72, Figure S4: Synteny plots of soybean and Arabidopsis sequence assemblies surrounding the AtKLU and GmCYP78A72 genes, Figure S5: Sense control of the in situ hybridization for GmCYP78As, Figure S6: Diagrams illustrating the constructs used for transformation, Figure S7: Selective pressure analysis across the whole genome, Table S1: Primers used in this study, Table S2: Sizes of the genomic DNA sequences and the CDS, Table S3: Ontology analysis of the genes in the cluster, Table S4: Ka/Ks analysis and estimate of the absolute dates between the duplicated GmCYP78A genes, Table S5: Transcription factors that could bind to the GmCYP78As promoters, Table S6: Genotyping of the GmCYP78A70 promoters in 30 soybean cultivars, Table S7: Genotyping of the GmCYP78A57 promoters in 30 soybean cultivars, Table S8: Threshold value of each index.

Author Contributions

Research design, X.-Z.F. and S.-X.Y.; Experiments, A.-H.D., J.-T.L., H.Y., Y.-H.Z., J.-S.G., Y.X. and Y.-J.G.; Bioinformatics analyses, H.-K.Z., K.-Q.T. and G.L.; Writing, A.-H.D., N.J. and X.-Z.F.

Funding

This research was funded by Programs (Grant Nos. 31571692 and 31271743) from the National Natural Science Foundation of China; by the Strategic Priority Research Program of the Chinese Academy of Sciences (Grant No. XDA0801010502); and by the National Key R&D Project (Grant Nos. 2016YFD0101900 and 2016YFD0100401) from the Ministry of Science and Technology of China.

Conflicts of Interest

The authors declare no conflicts of interest.

References

  1. Wendel, J.F. Genome evolution in polyploids. Plant Mol. Biol. 2000, 42, 225–249. [Google Scholar] [CrossRef] [PubMed]
  2. Blanc, G.; Wolfe, K.H. Widespread paleopolyploidy in model plant species inferred from age distributions of duplicate genes. Plant Cell 2004, 16, 1667–1678. [Google Scholar] [CrossRef] [PubMed]
  3. Lavin, M.; Herendeen, P.S.; Wojciechowski, M.F. Evolutionary rates analysis of Leguminosae implicates a rapid diversification of lineages during the tertiary. Syst. Biol. 2005, 54, 575–594. [Google Scholar] [CrossRef]
  4. Pfeil, B.E.; Schlueter, J.A.; Shoemaker, R.C.; Doyle, J.J. Placing paleopolyploidy in relation to taxon divergence: A phylogenetic analysis in legumes using 39 gene families. Syst. Biol. 2005, 54, 441–454. [Google Scholar] [CrossRef] [PubMed]
  5. Schlueter, J.A.; Lin, J.Y.; Schlueter, S.D.; Vasylenkosanders, I.F.; Deshpande, S.; Yi, J.; O’Bleness, M.; Roe, B.A.; Nelson, R.T.; Scheffler, B.E. Gene duplication and paleopolyploidy in soybean and the implications for whole genome sequencing. BMC Genom. 2007, 8, 330. [Google Scholar] [CrossRef] [PubMed]
  6. Schmutz, J.; Cannon, S.B.; Schlueter, J.; Ma, J.; Mitros, T.; Nelson, W.; Hyten, D.L.; Song, Q.; Thelen, J.J.; Cheng, J. Genome sequence of the palaeopolyploid soybean. Nature 2010, 463, 178–183. [Google Scholar] [CrossRef] [PubMed]
  7. Gu, Z.; Rifkin, S.A.; White, K.P.; Li, W.H. Duplicate genes increase gene expression diversity within and between species. Nat. Genet. 2004, 36, 577–579. [Google Scholar] [CrossRef] [Green Version]
  8. Ganko, E.W.; Meyers, B.C.; Vision, T.J. Divergence in expression between duplicated genes in Arabidopsis. Mol. Biol. Evol. 2007, 24, 2298–2309. [Google Scholar] [CrossRef] [PubMed]
  9. Epstein, C.J. Evolution by gene duplication. Am. J. Hum. Genet. 1971, 23, 541. [Google Scholar]
  10. Li, W.H.; Al, E. Expression divergence between duplicate genes. Trends Genet. 2005, 21, 602–607. [Google Scholar] [CrossRef]
  11. Adams, K.L.; Cronn, R.; Percifield, R.; Wendel, J.F. Genes duplicated by polyploidy show unequal contributions to the transcriptome and organ-specific reciprocal silencing. Proc. Natl. Acad. Sci. USA 2003, 100, 4649–4654. [Google Scholar] [CrossRef] [PubMed] [Green Version]
  12. Flagel, L.; Udall, J.; Nettleton, D.; Wendel, J. Duplicate gene expression in allopolyploid Gossypium reveals two temporally distinct phases of expression evolution. BMC Biol. 2008, 6, 1–9. [Google Scholar] [CrossRef] [PubMed]
  13. Chaudhary, B.; Flagel, L.; Stupar, R.M.; Udall, J.A.; Verma, N.; Springer, N.M.; Wendel, J.F. Reciprocal silencing, transcriptional bias and functional divergence of homeologs in polyploid cotton (Gossypium). Genetics 2008, 182, 503–517. [Google Scholar] [CrossRef] [PubMed]
  14. Buggs, R.J.; Elliott, N.M.; Zhang, L.; Koh, J.; Viccini, L.F.; Soltis, D.E.; Soltis, P.S. Tissue specific silencing of homoeologs in natural populations of the recent allopolyploid Tragopogon mirus. New Phytol. 2010, 186, 175–183. [Google Scholar] [CrossRef] [PubMed]
  15. Flagel, L.E.; Wendel, J.F. Evolutionary rate variation, genomic dominance and duplicate gene expression evolution during allotetraploid cotton speciation. New Phytol. 2010, 186, 184–193. [Google Scholar] [CrossRef]
  16. Guo, D.M.; Ran, J.H.; Wang, X.Q. Evolution of the cinnamyl/sinapyl alcohol dehydrogenase (CAD/SAD) gene family: The emergence of real lignin is associated with the origin of bona fide CAD. J. Mol. Evol. 2010, 71, 202–218. [Google Scholar] [CrossRef]
  17. Nelson, D.; Werck-Reichhart, D. A P450-centric view of plant evolution. Plant J. 2011, 66, 194–211. [Google Scholar] [CrossRef]
  18. Yang, Z.L.; Liu, H.J.; Wang, X.R.; Zeng, Q.Y. Molecular evolution and expression divergence of the populus polygalacturonase supergene family shed light on the evolution of increasingly complex organs in plants. New Phytol. 2013, 197, 1353–1365. [Google Scholar] [CrossRef]
  19. Guttikonda, S.K.; Trupti, J.; Bisht, N.C.; Chen, H.; An, Y.Q.; Pandey, S.; Xu, D.; Yu, O. Whole genome co-expression analysis of soybean cytochrome P450 genes identifies nodulation-specific P450 monooxygenases. BMC Plant Biol. 2010, 10, 1–19. [Google Scholar] [CrossRef]
  20. Anastasiou, E.; Kenz, S.; Gerstung, M.; Maclean, D.; Timmer, J.; Fleck, C.; Lenhard, M. Control of plant organ size by KLUH/CYP78A5 dependent intercellular signaling. Dev. Cell 2007, 13, 843–856. [Google Scholar] [CrossRef]
  21. Adamski, N.M.; Anastasiou, E.; Eriksson, S.; O’Neill, C.M.; Lenhard, M. Local maternal control of seed size by KLUH/CYP78A5-dependent growth signaling. Proc. Natl. Acad. Sci. USA 2009, 106, 20115–20120. [Google Scholar] [CrossRef] [PubMed]
  22. Chakrabarti, M.; Zhang, N.; Sauvage, C.; Muños, S.; Blanca, J.; Cañizares, J.; Diez, M.J.; Schneider, R.; Mazourek, M.; McClead, J.; et al. A cytochrome P450 regulates a domestication trait in cultivated tomato. Proc. Natl. Acad. Sci. USA 2013, 110, 17125–17130. [Google Scholar] [CrossRef] [PubMed]
  23. Zhao, B.; Dai, A.; Wei, H.; Yang, S.; Wang, B.; Jiang, N.; Feng, X. Arabidopsis KLU homologue GmCYP78A72 regulates seed size in soybean. Plant Mol. Biol. 2016, 90, 1–15. [Google Scholar] [CrossRef] [PubMed]
  24. Thompson, J.D.; Gibson, T.J.; Plewniak, F.; Jeanmougin, F.; Higgins, D.G. The CLUSTAL_X windows interface: Flexible strategies for multiple sequence alignment aided by quality analysis tools. Nucl. Acid Res. 1997, 25, 4876–4882. [Google Scholar] [CrossRef]
  25. Tamura, K.; Dudley, J.; Nei, M.; Kumar, S. MEGA4: Molecular evolutionary genetics analysis (MEGA) software version 4.0. Mol. Biol. Evol. 2007, 24, 1596–1599. [Google Scholar] [CrossRef]
  26. Yang, Z. Paml 4: Phylogenetic analysis by maximum likelihood. Mol. Biol. Evol. 2007, 24, 1586–1591. [Google Scholar] [CrossRef]
  27. Shiu, S.H.; Karlowski, W.M.; Pan, R.; Tzeng, Y.H.; Mayer, K.F.; Li, W.H. Comparative analysis of the receptor-like kinase family in Arabidopsis and rice. Plant Cell 2004, 16, 1220. [Google Scholar] [CrossRef]
  28. Lynch, M.; Conery, J.S. The evolutionary fate and consequences of duplicate genes. Science 2000, 290, 1151–1155. [Google Scholar] [CrossRef]
  29. Fan, C.; Wang, X.; Hu, R.; Wang, Y.; Xiao, C.; Jiang, Y.; Zhang, X.; Zheng, C.; Fu, Y.F. The pattern of phosphate transporter 1 genes evolutionary divergence in Glycine max L. BMC Plant Biol. 2013, 13, 48. [Google Scholar] [CrossRef]
  30. Yamada, T.; Watanabe, S.; Arai, M.; Harada, K.; Kitamura, K. Cotyledonary node pre-wounding with a micro-brush increased frequency of Agrobacterium-mediated transformation in soybean. Plant Biotechnol. 2010, 27, 217–220. [Google Scholar] [CrossRef] [Green Version]
  31. Bo, J.; Liu, B.; Bi, Y.; Hou, W.; Wu, C.; Han, T. Validation of internal control for gene expression study in soybean by quantitative real-time PCR. BMC Mol. Biol. 2008, 9, 1–14. [Google Scholar]
  32. Feng, X.; Zhao, Z.; Tian, Z.; Xu, S.; Luo, Y.; Cai, Z.; Wang, Y.; Yang, J.; Wang, Z.; Weng, L. Control of petal shape and floral zygomorphy in Lotus japonicus. Proc. Natl. Acad. Sci. USA 2006, 103, 4970–4975. [Google Scholar] [CrossRef] [PubMed] [Green Version]
  33. Nei, M.; Li, W.H. Mathematical model for studying genetic variation in terms of restriction endonucleases. Proc. Natl. Acad. Sci. USA 1979, 76, 5269–5273. [Google Scholar] [CrossRef] [PubMed]
  34. Hudson, R.; Slatkin, M.; Maddison, W.P. Estimation of levels of gene flow from DNA sequence data. Genetics 1992, 132, 583–589. [Google Scholar] [PubMed]
  35. Wachenfeldt, C.V.; Johnson, E.F. Structures of eukaryotic cytochrome P450 enzymesenzymes. In Cytochrome P450: Structure, Mechanism, and Biochemistry, 2nd ed.; Dawson, J., Ortiz de Montellano, Paul R., Eds.; Plenum Press: New York, NY, USA, 1995. [Google Scholar]
  36. Gonzalez, F.J.; Jaiswal, A.K.; Nebert, D.W. P450 genes: Evolution, regulation, and relationship to human cancer and pharmacogenetics. Cold Spring Harb. Symp. Quant. Biol. 1986, 51, 879–890. [Google Scholar] [CrossRef] [PubMed]
  37. Sakaguchi, M.; Mihara, K.; Sato, R. A short amino-terminal segment of microsomal cytochrome P-450 functions both as an insertion signal and as a stop-transfer sequence. Embo J. 1987, 6, 2425–2431. [Google Scholar] [CrossRef] [PubMed]
  38. Young, N.D.; Oldroyd, G.E.D.; Geurts, R.; Cannon, S.B.; Udvardi, M.K.; Benedito, V.A.; Mayer, K.F.X.; Gouzy, J.; Schoof, H.; Peer, Y.V.D. The Medicago genome provides insight into the evolution of rhizobial symbioses. Nature 2011, 480, 520–524. [Google Scholar] [CrossRef] [PubMed] [Green Version]
  39. Varshney, R.K.; Chen, W.; Li, Y.; Bharti, A.K.; Saxena, R.K.; Schlueter, J.A.; Donoghue, M.T.A.; Azam, S.; Fan, G.; Whaley, A.M. Draft genome sequence of pigeonpea (Cajanus cajan), an orphan legume crop of resource-poor farmers. Nat. Biotechnol. 2012, 30, 83–89. [Google Scholar] [CrossRef] [PubMed]
  40. Baek, J.H.; Kim, J.; Kim, C.K.; Sohn, S.H.; Choi, D.; Ratnaparkhe, M.B.; Kim, D.W.; Lee, T.H. MultiSyn: A webtool for multiple synteny detection and visualization of user’s sequence of interest compared to public plant species. Evol. Bioinform. 2016, 12, 193. [Google Scholar] [CrossRef]
  41. Koch, M.A.; Haubold, B.; Mitchellolds, T. Comparative evolutionary analysis of chalcone synthase and alcohol dehydrogenase loci in Arabidopsis, Arabis, and related genera (Brassicaceae). Mol. Biol. Evol. 2000, 17, 1483. [Google Scholar] [CrossRef] [PubMed]
  42. Liu, Y.; Zhang, D.; Ping, J.; Li, S.; Chen, Z.; Ma, J. Innovation of a regulatory mechanism modulating semi-determinate stem growth through artificial selection in soybean. PLoS Genet. 2016, 12, e1005818. [Google Scholar] [CrossRef] [PubMed]
  43. Macquarrie, K.L.; Fong, A.P.; Morse, R.H. Tapscott, S.J. Genome-wide transcription factor binding, beyond direct target regulation. Trends Genet. 2011, 27, 141. [Google Scholar] [CrossRef] [PubMed]
  44. Francozorrilla, J.M.; Lópezvidriero, I.; Carrasco, J.L.; Godoy, M.; Vera, P.; Solano, R. DNA-binding specificities of plant transcription factors and their potential to define target genes. Proc. Natl. Acad. Sci. USA 2014, 111, 2367–2372. [Google Scholar] [CrossRef] [PubMed] [Green Version]
  45. Wang, Z.Y.; Nakano, T.; Gendron, J.; He, J.; Chen, M.; Vafeados, D.; Yang, Y.; Fujioka, S.; Yoshida, S.; Asami, T. Nuclear-localized BZR1 mediates brassinosteroid-induced growth and feedback suppression of brassinosteroid biosynthesis. Dev. Cell 2002, 2, 505–513. [Google Scholar] [CrossRef]
  46. Zhang, Y.; Du, L.; Xu, R.; Cui, R.; Hao, J.; Sun, C.; Li, Y. Transcription factors SOD7/NGAL2 and DPA4/NGAL3 act redundantly to regulate seed size by directly repressing KLU expression in Arabidopsis thaliana. Plant Cell 2015, 27, 620. [Google Scholar] [CrossRef] [PubMed]
  47. Nag, A.; King, S.; Jack, T. miR319a targeting of TCP4 is critical for petal growth and development in Arabidopsis. Proc. Natl. Acad. Sci. USA 2009, 106, 22534–22539. [Google Scholar] [CrossRef] [PubMed]
  48. Mathieu, J.; Yant, L.J.; Mürdter, F.; Küttner, F.; Schmid, M. Repression of flowering by the miR172 target SMZ. PLoS Biol. 2009, 7, e1000148. [Google Scholar] [CrossRef]
  49. Cai, X.T.; Xu, P.; Zhao, P.X.; Liu, R.; Yu, L.H.; Xiang, C.B. Arabidopsis ERF109 mediates cross-talk between jasmonic acid and auxin biosynthesis during lateral root formation. Nat. Commun. 2010, 5, 5833. [Google Scholar] [CrossRef]
  50. Hu, Y.; Yu, D. BRASSINOSTEROID INSENSITIVE2 interacts with ABSCISIC ACID INSENSITIVE5 to mediate the antagonism of brassinosteroids to abscisic acid during seed germination in Arabidopsis. Plant Cell 2014, 26, 4394. [Google Scholar] [CrossRef]
  51. Kang, J.Y.; Choi, H.I.; Im, M.Y.; Kim, S.Y. Arabidopsis Basic Leucine Zipper Proteins That Mediate Stress-Responsive Abscisic Acid Signaling. Plant Cell 2002, 14, 343–357. [Google Scholar] [CrossRef]
  52. Zhou, Z.K.; Jiang, Y.; Wang, Z.; Gou, Z.H.; Lyu, J.; Li, W.Y.; Yu, Y.J.; Shu, L.P.; Zhao, Y.J.; Ma, Y.M.; et al. Resequencing 302 wild and cultivated accessions identifies genes related to domestication and improvement in soybean. Nat. Biotechnol. 2015, 33, 408. [Google Scholar] [CrossRef] [PubMed]
  53. Salisbury, E.J. The Reproductive Capacity of Plants: Studies in Quantitative Biology, 1st ed.; G. Bell and Sons: London, UK, 1942; pp. 123–126. [Google Scholar]
  54. Le, B.H.; Wagmaister, J.A.; Kawashima, T.; Bui, A.Q.; Harada, J.J.; Goldberg, R.B. Using genomics to study legume seed development. Plant Physiol. 2007, 144, 562–574. [Google Scholar] [CrossRef] [PubMed]
  55. Hurst, L.D. The Ka/Ks ratio: Diagnosing the form of sequence evolution. Trends Genet. 2002, 18, 486. [Google Scholar] [CrossRef]
  56. Roulin, A.; Auer, P.L.; Libault, M.; Schlueter, J.; Farmer, A.; May, G.; Stacey, G.; Doerge, R.W.; Jackson, S.A. The fate of duplicated genes in a polyploid plant genome. Plant J. 2013, 73, 143–153. [Google Scholar] [CrossRef]
  57. Lan, T.; Yang, Z.L.; Yang, X.; Liu, Y.J.; Wang, X.R.; Zeng, Q.Y. Extensive functional diversification of the Populus glutathione S-transferase supergene family. Plant Cell 2009, 21, 3749. [Google Scholar] [CrossRef] [PubMed]
  58. Li, H.; Zhang, D. Cytochrome P450 family member CYP704B2 catalyzes the -hydroxylation of fatty acids and is required for anther cutin biosynthesis and pollen exine formation in rice. Plant Cell 2010, 22, 173–190. [Google Scholar] [CrossRef] [PubMed]
  59. Wang, X.; Li, Y.; Zhang, H.; Sun, G.; Zhang, W.; Qiu, L. Evolution and association analysis of GmCYP78A10 gene with seed size/weight and pod number in soybean. Mol. Biol. Rep. 2015, 42, 489–496. [Google Scholar] [CrossRef]
Figure 1. Gene structure and phylogenetic analysis of GmCYP78As. (a) Schematic diagrams of the GmCYP78A gene structures. (b) Phylogenetic tree of GmCYP78As and other AtCYP78A5 homologous proteins from Glycine max, Medicago truncatula, Phaseolus vulgaris, Physcomitrella patens and Arabidopsis, constructed by MEGA7 using the neighbor-joining method. UTR: Untranslated Regions.
Genes 09 00611 g001
Figure 2. Synteny diagram plot of the soybean and Arabidopsis sequence assemblies surrounding the Arabidopsis KLU gene. The color key for specific genes is as follows: PGL1 (6-phosphogluconolactonase 1, At1G13700)—blue; KLU (cytochrome P450, At1G13710)—green; AFP2 (ABI five binding protein 2, At1G13740)—purple; QUL1 (QUASIMODO2 LIKE 1, At1G13820)—magenta; ANAP30 (Soluble N-ethylmaleimide-sensitive factor adaptor protein 30, At1G13860)—pink; and EIF5A (eukaryotic elongation factor 5A-1, At1G13890)—yellow. The syntenic matching genes in G. max are similarly colored. Solid black lines connect the homologous gene pairs.
Genes 09 00611 g002
Figure 3. Spatiotemporal expression patterns of GmCYP78As. (ac) In situ hybridizations of GmCYP78A70, GmCYP78A57 and GmCYP78A72 were performed respectively in the vegetative meristem (Vm), reproductive meristem (Rm), and the carpel and young pod. Scale bars = 100 μm. For the boxed insets of (b,c) the scale bars = 20 μm. (d) Expression levels of GmCYP78As at each stage of the vegetative phase (V0–V5). (e) Expression levels of the GmCYP78As at each stage of the reproductive phase (R1–R8). Expression levels at the V0/R1 stage were set to 1, while those at other stages were adjusted accordingly. Data shown are mean ± SE (n = 3, biological replicates). CZ, central zone; PZ, peripheral zone; Abm, axillary bud meristem; Vs, developing vascular strand; Fm, floral meristem; Im, inflorescence meristem; Is, inflorescence stem; Pre, proembryo; Ge, global embryo; Tre, transition embryo; He, heart embryo; Te, torpedo embryo; DAP: days after pollination.
Genes 09 00611 g003
Figure 4. GmCYP78As expression activities were monitored by pGmCYP78As::GUS transgenic expression. (ad) Respective histochemical analyses of the control, pGmCYP78A70::GUS, pGmCYP78A57::GUS and pGmCYP78A72::GUS in developing trifoliate leaflets, petals, stamen, pod trichome and seeds. Scale bars = 1 mm in (a–d). (e) Comparison of the promoters of the GmCYP78A homologues of the gene. (f) Venn diagram of the transcription factors that could bind to the GmCYP78As promoters.
Genes 09 00611 g004
Figure 5. Relationships between the leaf area and the expression level of GmCYP78As in leaves. (ac) Linear regressions between the leaf areas and the expression levels of GmCYP78A70, GmCYP78A57 and GmCYP78A72, respectively. Data shown are mean ± SE (n = 3). (d) The respective contribution of GmCYP78As expression to leaf area (percentage of variation explained). For the statistical analysis of relationship between gene expression level and trait, a linear model was fitted with the R function lm. The model was fitted with the following terms: “trait ~ GmCYP78A70 + GmCYP78A57 + GmCYP78A72 + GmCYP78A70:GmCYP78A57 + GmCYP78A70:GmCYP78A72 + GmCYP78A57:GmCYP78A72”, where the individual effect of each gene and the interaction effects of gene pairs were included.
Genes 09 00611 g005
Figure 6. Relationships between the 100-seed weight and the expression level of GmCYP78As in seeds. (ac) Linear regressions between the 100-seed weights and the expression levels of GmCYP78A70, GmCYP78A57 and GmCYP78A72, respectively. Data shown are mean ± SE (n = 3). (d) The respective contribution of GmCYP78As expression to 100-seed weight (percentage of variation explained). For the statistical analysis of relationship between gene expression level and trait, a linear model was fitted with the R function lm. The model was fitted with the following terms: “trait ~ GmCYP78A70 + GmCYP78A57 + GmCYP78A72 + GmCYP78A70:GmCYP78A57 + GmCYP78A70:GmCYP78A72 + GmCYP78A57:GmCYP78A72”, where the individual effect of each gene and the interaction effects of gene pairs were included.
Genes 09 00611 g006
Figure 7. Selective pressure analysis for GmCYP78As. (a) π ratios of the GmCYP78As regions between different soybean populations. The red and blue dotted lines respectively represent the top 1% and top 5% thresholds selected to determine the region under evolutionary selection. The gray vertical lines correspond to the location of each GmCYP78A. (b) Index values relate to selective sweep in coding regions of GmCYP78As.
Genes 09 00611 g007

