
Cytogenomic Characterization of Transposable Elements and Satellite DNA in Passiflora L. Species
 ,
,
Abstract
:1. Introduction
2. Materials and Methods
2.1. Plant Material
2.2. Genomic DNA Extraction and Next-Generation Sequencing (NGS)
2.3. Identification and Annotation of Repetitive DNA
2.4. Chromosome Mapping of Retrotransposons and satDNA
2.4.1. Probe Preparation
2.4.2. Slide Preparation
2.4.3. Fluorescent In Situ Hybridization (FISH)
2.4.4. FISH Analysis and Photo-Documentation
3. Results
3.1. Genomic Composition
3.2. Identification of RT Domains
3.3. Identification and Characterization of Satellite DNA
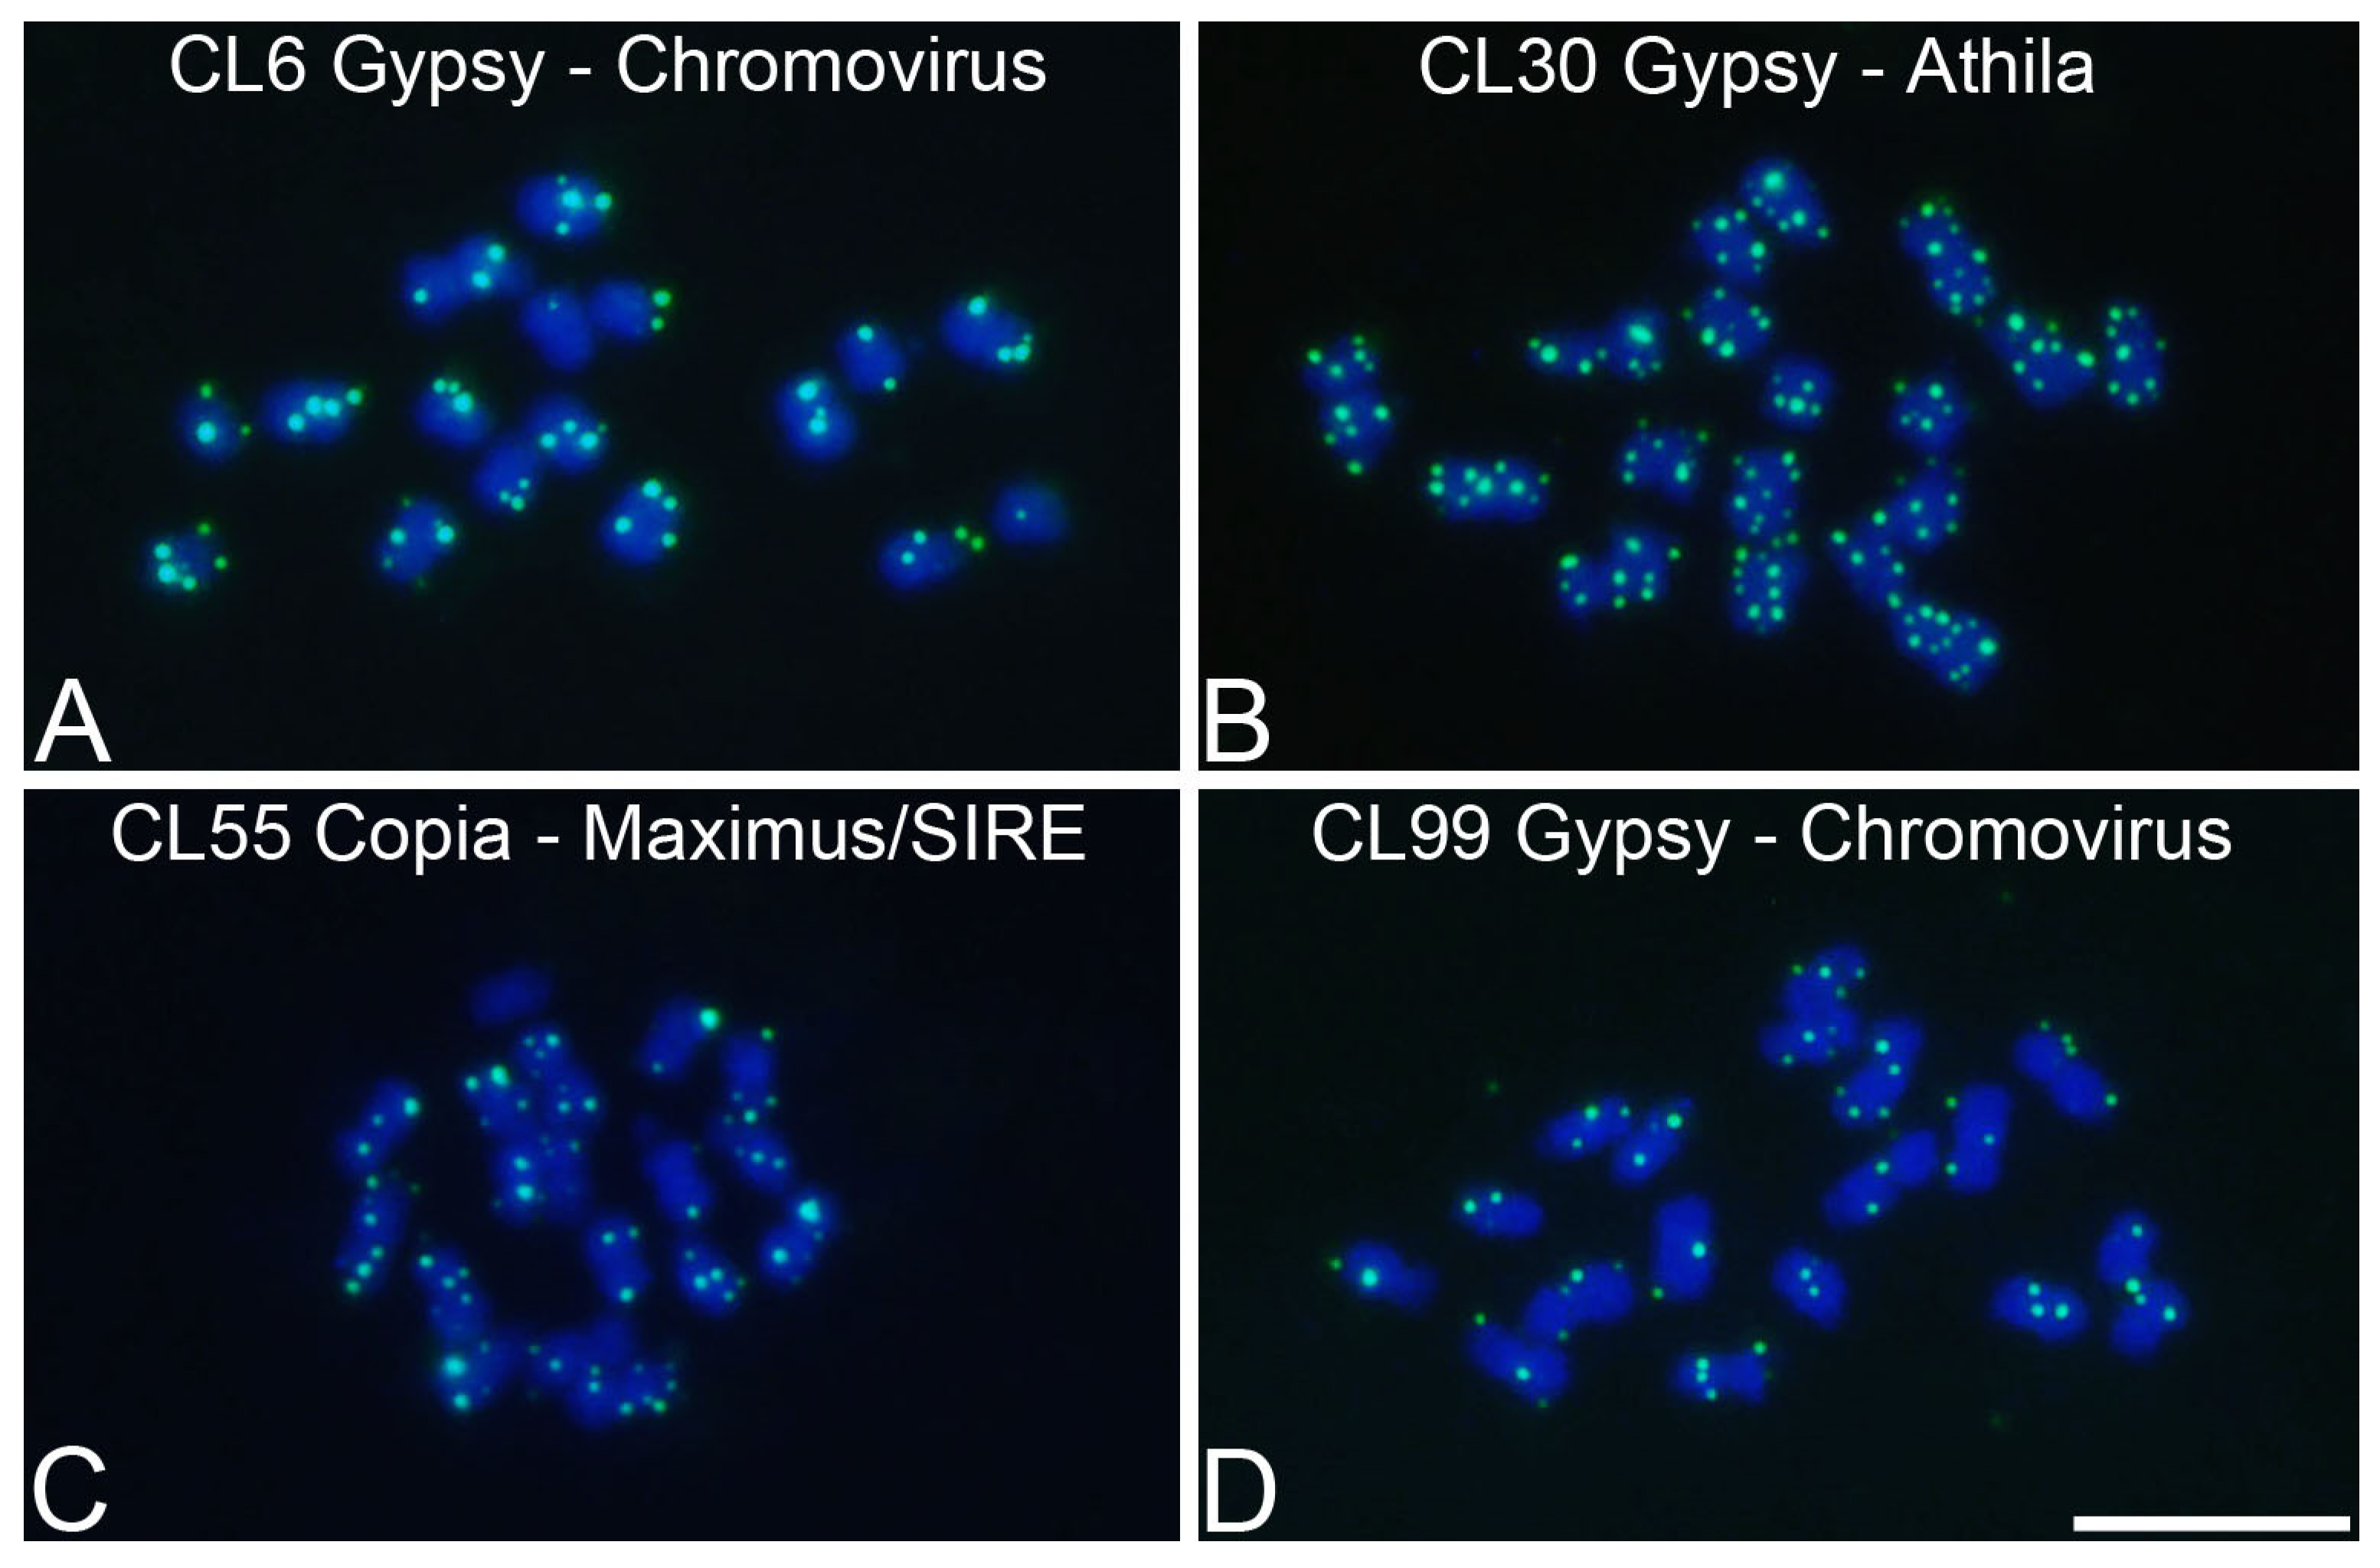
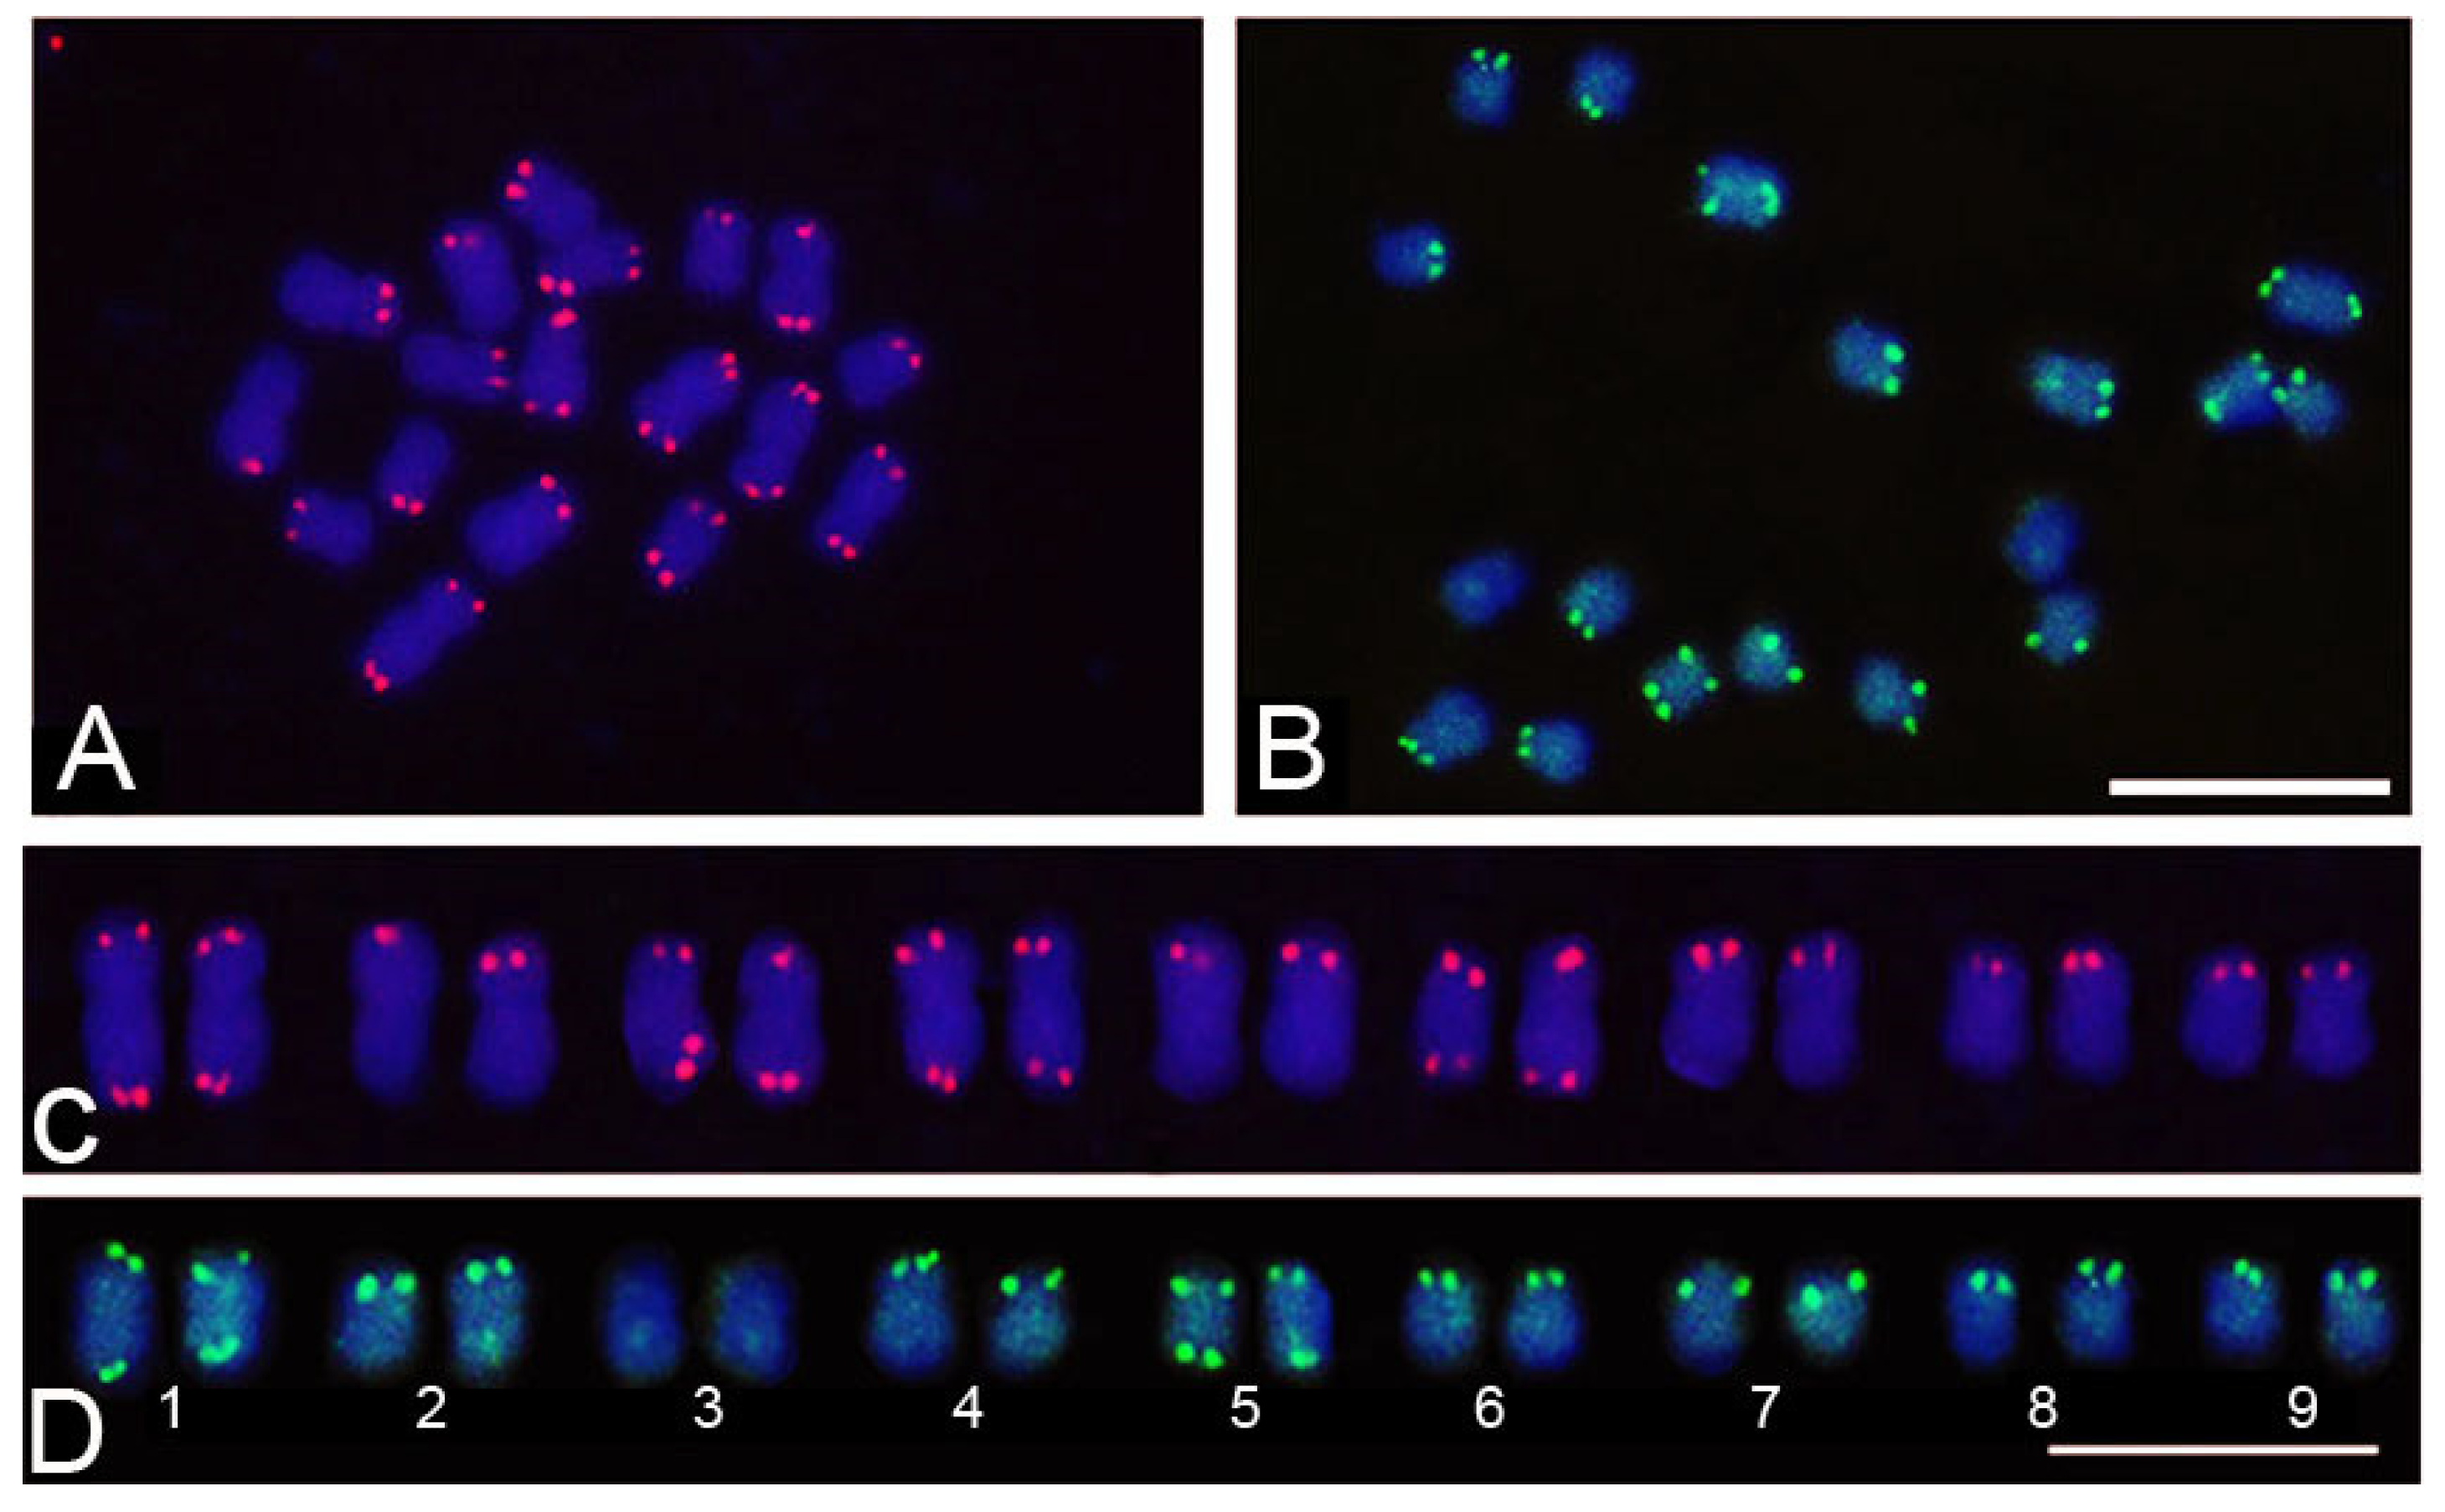
3.4. Chromosomal Mapping of Retrotransposons and satDNA
4. Discussion
5. Conclusions
Supplementary Materials
Author Contributions
Funding
Institutional Review Board Statement
Informed Consent Statement
Data Availability Statement
Acknowledgments
Conflicts of Interest
References
- Bernacci, L.C.; Cervi, A.C.; Giovanni, R.; Borges, R.A.X.; Hering, R.L.O.; Serrano, T.; Santos Filho, L.A.F. Passifloraceae. In Livro Vermelho da Flora do Brasil, 1st ed.; Jakobsson, A., Ed.; Instituto de Pesquisas Jardim Botânico: Rio de Janeiro, Brazil, 2013; Volume 1, pp. 830–834. [Google Scholar]
- Ulmer, T.; MacDougal, J.M. Passiflora: Passionflowers of the World, 1st ed.; Timber Press: Portland, OR, USA, 2004; pp. 27–31. [Google Scholar]
- Abreu, P.P.; Souza, M.M.; Santos, E.A.; Pires, M.V.; Pires, M.M.; Almeida, A.-A.F. Passionflower hybrids and their use in the ornamental plant market: Perspectives for sustainable development with emphasis on Brazil. Euphytica 2009, 166, 307–315. [Google Scholar] [CrossRef]
- Feuillet, C.; MacDougal, J.M. A new infrageneric classification of Passiflora. Passiflora 2004, 13, 34–38. [Google Scholar]
- Muschner, V.C.; Lorenz, A.; Cervi, A.C.; Bonatto, S.; Souza-Chies, T.; Salzano, F.; Freitas, L.B. A first molecular analysis of Passiflora (Passifloraceae). Am. J. Bot. 2003, 90, 1229–1238. [Google Scholar] [CrossRef] [PubMed]
- Yockteng, R.; Nadot, S. Phylogenetic relationships among Passiflora species based on the glutamine synthetase nuclear gene expressed in chloroplast (ncpGS). Mol. Phylogenet. Evol. 2004, 31, 379–396. [Google Scholar] [CrossRef] [PubMed]
- Hansen, A.K.; Gilbert, L.E.; Simpson, B.B.; Downie, S.R.; Cervi, A.C.; Jansen, R.K. Phylogenetic relationships and chromosome number evolution in Passiflora. Syst. Bot. 2006, 31, 138–150. [Google Scholar] [CrossRef]
- Muschner, V.C.; Zamberlan, P.M.; Bonatto, S.L.; Freitas, L.B. Phylogeny, biogeography and divergence times in Passiflora (Passifloraceae). Genet. Mol. Biol. 2012, 35, 1036–1043. [Google Scholar] [CrossRef] [PubMed]
- Faleiro, F.G.; Junqueira, N.T.V. Maracujá: O Produtor Pergunta, a Embrapa Responde, 1st ed.; Embrapa: Brasília, Brazil, 2016; p. 341. [Google Scholar]
- Meletti, L.M.M. Avanços na cultura do maracujá no Brasil. Rev. Bras. Frut. 2011, 33, 83–91. [Google Scholar] [CrossRef]
- IBGE—Produção Brasileira de Maracujá. 2021. Available online: http://www.cnpmf.embrapa.br/Base_de_Dados/index_pdf/dados/brasil/maracuja/b1_maracuja.pdf (accessed on 5 December 2022).
- Puterova, J.; Razumova, O.; Martinek, T.; Alexandrov, O.; Divashuk, M.; Kubat, Z.; Hobza, R.; Karlov, G.; Kejnovsky, E. Satellite DNA and Transposable Elements in Seabuckthorn (Hippophae rhamnoides), a Dioecious Plant with Small Y and Large X Chromosomes. Genome Biol. Evol. 2017, 9, 197–212. [Google Scholar] [CrossRef] [PubMed]
- Mehrotra, S.; Goyal, V. Repetitive sequences in plant nuclear DNA: Types, distribution, evolution and function. Genom. Proteom. Bioinform. 2014, 12, 164–171. [Google Scholar] [CrossRef]
- Novák, P.; Neumann, P.; Macas, J. Graph-based clustering and characterization of repetitive sequences in next-generation sequencing data. BMC Bioinfor. 2010, 11, 378. [Google Scholar] [CrossRef]
- Novák, P.; Neumann, P.; Pech, J.; Steinhaisl, J.; Macas, J. RepeatExplorer: A Galaxy-based web server for genome-wide characterization of eukaryotic repetitive elements from next-generation sequence reads. Bioinformatics 2013, 29, 792–793. [Google Scholar] [CrossRef]
- Macas, J.; Kejnovský, E.; Neumann, P.; Novák, P.; Koblížková, A.; Vyskot, B. Next Generation Sequencing-Based Analysis of Repetitive DNA in the Model Dioecious Plant Silene latifolia. PLoS ONE 2011, 6, e27335. [Google Scholar] [CrossRef]
- Novák, P.; Hřibová, E.; Neumann, P.; Koblížková, A.; Doležel, J.; Macas, J. Genome-Wide Analysis of Repeat Diversity across the Family Musaceae. PLoS ONE 2014, 9, e98918. [Google Scholar] [CrossRef] [PubMed]
- Dodsworth, S.; Chase, M.W.; Kelly, L.J.; Leitch, I.J.; Macas, J.; Novák, P.; Piednoël, M.; Weiss-Schneeweiss, H.A.R. Genomic Repeat Abundances Contain Phylogenetic Signal. Syst. Biol. 2015, 64, 112–126. [Google Scholar] [CrossRef]
- Macas, J.; Novák, P.; Pellicer, J.; Čížková, J.; Koblížková, A.; Neumann, P.; Fuková, I.; Doležel, J.; Kelly, L.J.; Leitch, I.J. In Depth Characterization of Repetitive DNA in 23 Plant Genomes Reveals Sources of Genome Size Variation in the Legume Tribe Fabeae. PLoS ONE 2015, 10, e0143424. [Google Scholar] [CrossRef] [PubMed]
- Mascagni, F.; Giordani, T.; Ceccarelli, M.; Cavallini, A.; Natali, L. Genome-wide analysis of LTR-retrotransposon diversity and its impact on the evolution of the genus Helianthus (L.). BMC Genom. 2017, 18, 634. [Google Scholar] [CrossRef]
- Zhang, W.; Zuo, S.; Li, Z.; Han, J.; Song, J.; Pan, Y.-B.; Wang, K. Isolation and characterization of centromeric repetitive DNA sequences in Saccharum spontaneum. Sci. Rep. 2017, 7, 41659. [Google Scholar] [CrossRef] [PubMed]
- Santos, A.A.; Penha, H.A.; Bellec, A.; Munhoz, C.F.; Pedrosa-Harand, A.; Bergès, H.; Vieira, M.L.V. Begin at the beginning: A BAC-end view of the passion fruit (Passiflora) genome. BMC Genom. 2014, 15, 816. [Google Scholar] [CrossRef]
- Pamponét, V.C.C.; Souza, M.M.; Silva, G.S.; Micheli, F.; Melo, C.A.F.; Oliveira, S.G.; Costa, E.A.; Corrêa, R.X. Low coverage sequencing for repetitive DNA analysis in Passiflora edulis Sims: Citogenomic characterization of transposable elements and satellite DNA. BMC Genom. 2019, 20, 262. [Google Scholar]
- Souza, M.M.; Palomino, G.; Pereira, T.N.S.; Pereira, M.G.; Viana, A.P. Flow cytometric analysis of genome size variations in some Passiflora species. Hereditas 2004, 141, 31–38. [Google Scholar] [CrossRef]
- Pinto, D.L.P.; Barros, B.A.; Viccini, B.A.; Campos, J.M.S.; Silva, M.L.; Otoni, W.C. Ploidy stability of somatic embryogenesis-derived Passiflora cincinnata Mast. plants as assessed by flow cytometry. Plant Cell Tissue Organ. Cult. 2010, 103, 71–79. [Google Scholar] [CrossRef]
- Yotoko, K.S.C.; Dornelas, M.C.; Togni, P.D.; Fonseca, T.C.; Salzano, F.M.; Bonatto, S.L.; Freitas, L.B. Does Variation in Genome Sizes Reflect Adaptive or Neutral Processes? New Clues from Passiflora. PLoS ONE 2011, 6, e18212. [Google Scholar] [CrossRef] [PubMed]
- Flavell, R. Repetitive DNA and chromosome evolution in plants. Philos Trans R. Soc. Lond. B. Biol. Sci. 1986, 312, 227–242. [Google Scholar] [PubMed]
- Doyle, J.J.; Doyle, J.L. Isolation of plant DNA from fresh tissue. Focus 1990, 12, 13–15. [Google Scholar]
- Novák, P.; Robledillo, L.A.; Andrea-Koblížková, A.; Iva-Vrbová, I.; Neumann, P.; Macas, J. TAREAN: A computational tool for identification and characterization of satellite DNA from unassembled short reads. Nucleic Acids Res. 2017, 45, e111. [Google Scholar] [CrossRef] [PubMed]
- Untergasser, A.; Nijveen, H.; Rao, X.; Bisseling, T.; Geurts, R.; Leunissen, J.A.M. Primer3Plus, an enhanced web interface to Primer3. Nucleic Acids Res. 2007, 35, W71–W74. [Google Scholar] [CrossRef]
- Schwarzacher, T.; Haslop-Harrison, P. Practical in situ Hybridization, 1st ed.; Bios Scientific Publishers: Oxford, UK, 2000; p. 216. [Google Scholar]
- Souza, M.M.; Urdampilleta, J.D.; Forni-Martins, E.R. Improvements in cytological preparations for fluorescent in situ hybridization in Passiflora. Genet. Mol. Res. 2010, 9, 2148–2155. [Google Scholar] [CrossRef]
- Neumann, P.; Koblížková, A.; Navrátilová, A.; Macas, J. Significant expansion of Vicia pannonica genome size mediated by amplification of a single type of giant retroelement. Genetics 2006, 173, 1047–1056. [Google Scholar] [CrossRef] [PubMed]
- Tenaillon, M.I.; Hufford, M.B.; Gaut, B.S.; Ross-Ibarra, J. Genome size and transposable element content as determined by high-throughput sequencing in Maize and Zea luxurians. Genome Biol. Evol. 2011, 3, 219–229. [Google Scholar] [CrossRef]
- Leitch, I.J.; Chase, M.W.; Bennett, M.D. Phylogenetic analysis of DNA C-values provides evidence for a small ancestral genome size in flowering plants. Ann. Bot. 1998, 82, 85–94. [Google Scholar] [CrossRef]
- Zuccolo, A.; Sebastian, A.; Talag, J.; Yu, Y.; Kim, H.; Collura, K.; Kudrna, D.; Wing, R.A. Transposable element distribution, abundance and role in genome size variation in the genus Oryza. BMC Evol. Biol. 2007, 7, 152. [Google Scholar] [CrossRef] [PubMed]
- Santos, F.C.; Guyot, R.; Do Valle, C.B.; Chiari, L.; Techio, V.H.; Heslop-Harrison, P.; Vanzela, A.L.L. Chromosomal distribution and evolution of abundant retrotransposons in plants: Gypsy elements in diploid and polyploid Brachiaria forage grasses. Chromosome Res. 2015, 23, 571–582. [Google Scholar] [CrossRef] [PubMed]
- Qiu, F.; Ungerer, M.C. Genomic abundance and transcriptional activity of diverse gypsy and copia long terminal repeat retrotransposons in three wild sunflower species. BMC Plant Biol. 2018, 18, 6. [Google Scholar] [CrossRef] [PubMed]
- Marques, A.; Ribeiro, T.; Neumann, P.; Macas, P.; Novák, P.; Schubert, V.; Pellino, M.; Fuchs, J.; Ma, W.; Kuhlmann, M.; et al. Holocentromeres in Rhynchospora are associated with genome-wide centromere-specific repeat arrays interspersed among euchromatin. Proc. Natl. Acad. Sci. USA 2015, 112, 13633–13638. [Google Scholar] [CrossRef] [PubMed]
- Santos, J.L.; Matsumoto, S.N.; D’Arêde, L.O.; Luz, I.S.; Viana, A.E.S. Propagação vegetativa de estacas de Passiflora cincinnata Mast. em diferentes recipientes e substratos comerciais. Rev. Bras. Frutic. 2012, 34, 581–588. [Google Scholar] [CrossRef]
- Santos, J.L.; Matsumoto, S.N.; Oliveira, P.N.; Oliveira, L.S.; Silva, R.A. Morphophysiological analysis of passion fruit plants from different propagation methods and planting spacing. Rev. Caatinga 2016, 29, 305–312. [Google Scholar] [CrossRef]
- Piednoël, M.; Carrete-Vega, G.; Renner, S.S. Characterization of the LTR Retrotransposon Repertoire of a Plant clade of Six Diploid and One tetraploid Species. Plant J. 2013, 75, 699–709. [Google Scholar] [CrossRef] [PubMed]
- Slotkin, R.K.; Martienssen, R. Transposable elements and the epigenetic regulation of the genome. Nat. Rev. Genet. 2007, 8, 272–285. [Google Scholar] [CrossRef] [PubMed]
- Reinders, J.; Wulff, B.B.; Mirouze, M.; Marí-Ordóñez, A.; Dapp, M.; Rozhon, W.; Bucher, E.; Theiler, G.; Paszkowski, J. Compromised stability of DNA methylation and transposon immobilization in mosaic Arabidopsis epigenomes. Genes Dev. 2009, 23, 939–950. [Google Scholar] [CrossRef]
- Gorinsek, B.; Gubensek, F.; Kordis, D. Evolutionary genomics of chromoviruses in eukaryotes. Mol. Biol. Evol. 2004, 21, 781–798. [Google Scholar] [CrossRef]
- Bender, J. Chromatin-based silencing mechanisms. Curr. Opin. Plant Biol. 2004, 7, 521–526. [Google Scholar] [CrossRef] [PubMed]
- Lippman, Z.; Gendrel, A.V.; Black, M.; Vaughn, M.W.; Dedhia, N.; McCombie, W.R.; Lavine, K.; Mittal, V.; May, B.; Kasschau, K.D.; et al. Role of transposable elements in heterochromatin and epigenetic control. Nature 2004, 430, 471–476. [Google Scholar] [CrossRef] [PubMed]
- Lapitan, N.L.V.; Ganal, M.W.; Tanksley, S.D. Somatic chromosome karyotype of tomato based on in situ hybridization of the TGRI satellite repeat. Genome 1989, 32, 992–998. [Google Scholar] [CrossRef]
- Kenton, A.; Parokonny, A.S.; Gleba, Y.Y.; Bennett, M.D. Characterization of the Nicotiana tabacum L. genome by molecular cytogenetics. Mol. Genet. Genom. 1993, 240, 159–169. [Google Scholar] [CrossRef] [PubMed]
- Cheng, Z.; Stupar, R.M.; Gu, M.; Jiang, J. A tandemly repeated DNA sequence is associated with both knob-like heterochromatin and a highly decondensed structure in the meiotic pachytene chromosomes of rice. Chromosoma 2001, 110, 24–31. [Google Scholar] [CrossRef]
- Li, J.; Yang, F.; Zhu, J.; He, S.B.; Li, L.J. Characterization of a tandemly repeated subtelomeric sequence with inverted telomere repeats in Maize. Genome 2009, 52, 286–293. [Google Scholar] [CrossRef] [PubMed]
- Torres, G.A.; Gong, Z.; Iovene, M. Organization and Evolution of Subtelomeric Satellite Repeats in the Potato Genome. G3 Genes Genomes Genet. 2011, 1, 85–92. [Google Scholar] [CrossRef] [PubMed]
- Wijnker, E.; Jong, H. Managing meiotic recombination in plant breeding. Trends Plant Sci. 2008, 13, 640–646. [Google Scholar] [CrossRef]
- Linardopoulou, E.V.; Williams, E.M.; Fan, Y.; Friedman, C.; Young, J.M.; Trask, B.J. Human subtelomeres are hot spots of interchromosomal recombination and segmental duplication. Nature 2005, 437, 94–100. [Google Scholar] [CrossRef]


| Species | Cluster | GP (%) 1 | Classification | Primers (5′-3′) |
|---|---|---|---|---|
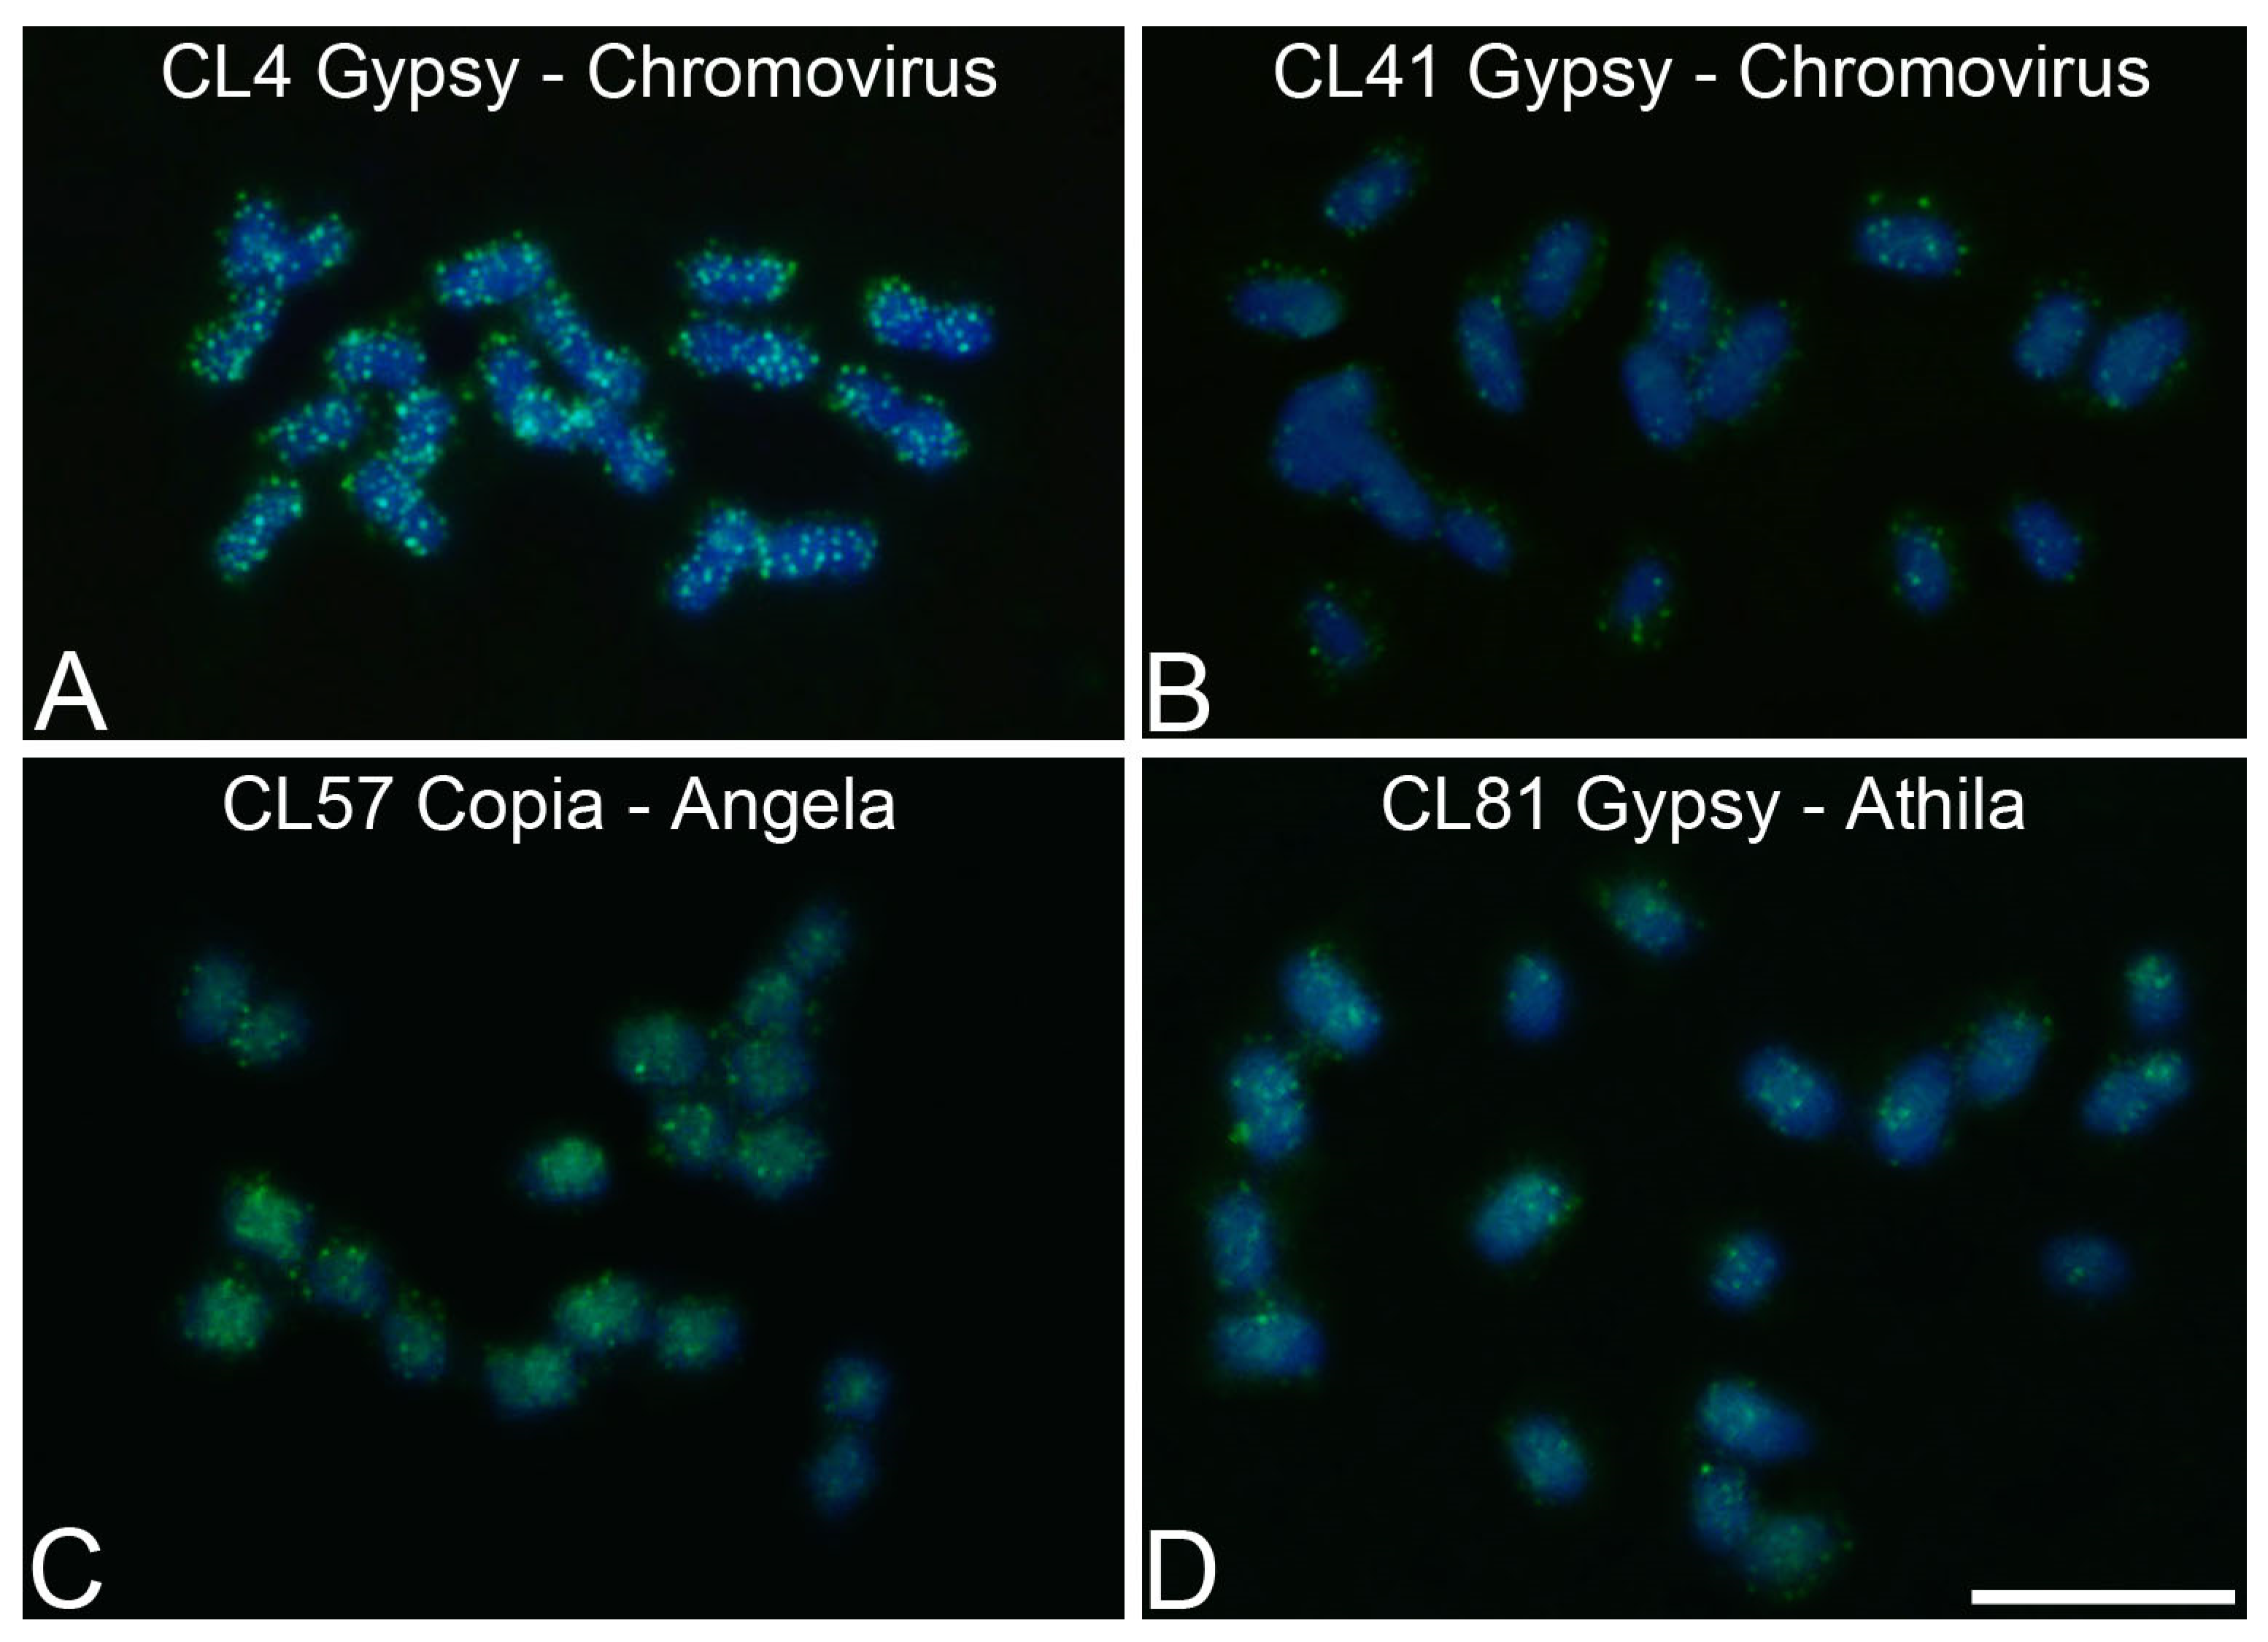
| P. alata | CL4 | 1.62 | Ty3/Gypsy/Chromovirus | F: CTGCAAGACGGTCCTCAACT |
| R: GTTCGCTCCGGTTGTGTATT | ||||
| P. alata | CL41 | 0.73 | Ty3/Gypsy/Chromovirus | F: AAATGCGACTCATGCTCCTC |
| R: ACCGGTCCTGTTCGTGAAG | ||||
| P. alata | CL57 | 0.56 | Ty1/Copia/Angela | F: TCTCTCGAATCCAGGTTGCT |
| R: TCAAGCATGGTCCTTGACAG | ||||
| P. alata | CL81 | 0.35 | Ty3/Gypsy/Athila | F: AGACGGGGATCACGGTTATT |
| R:TCTTCTCAATGCAACGCTGT | ||||
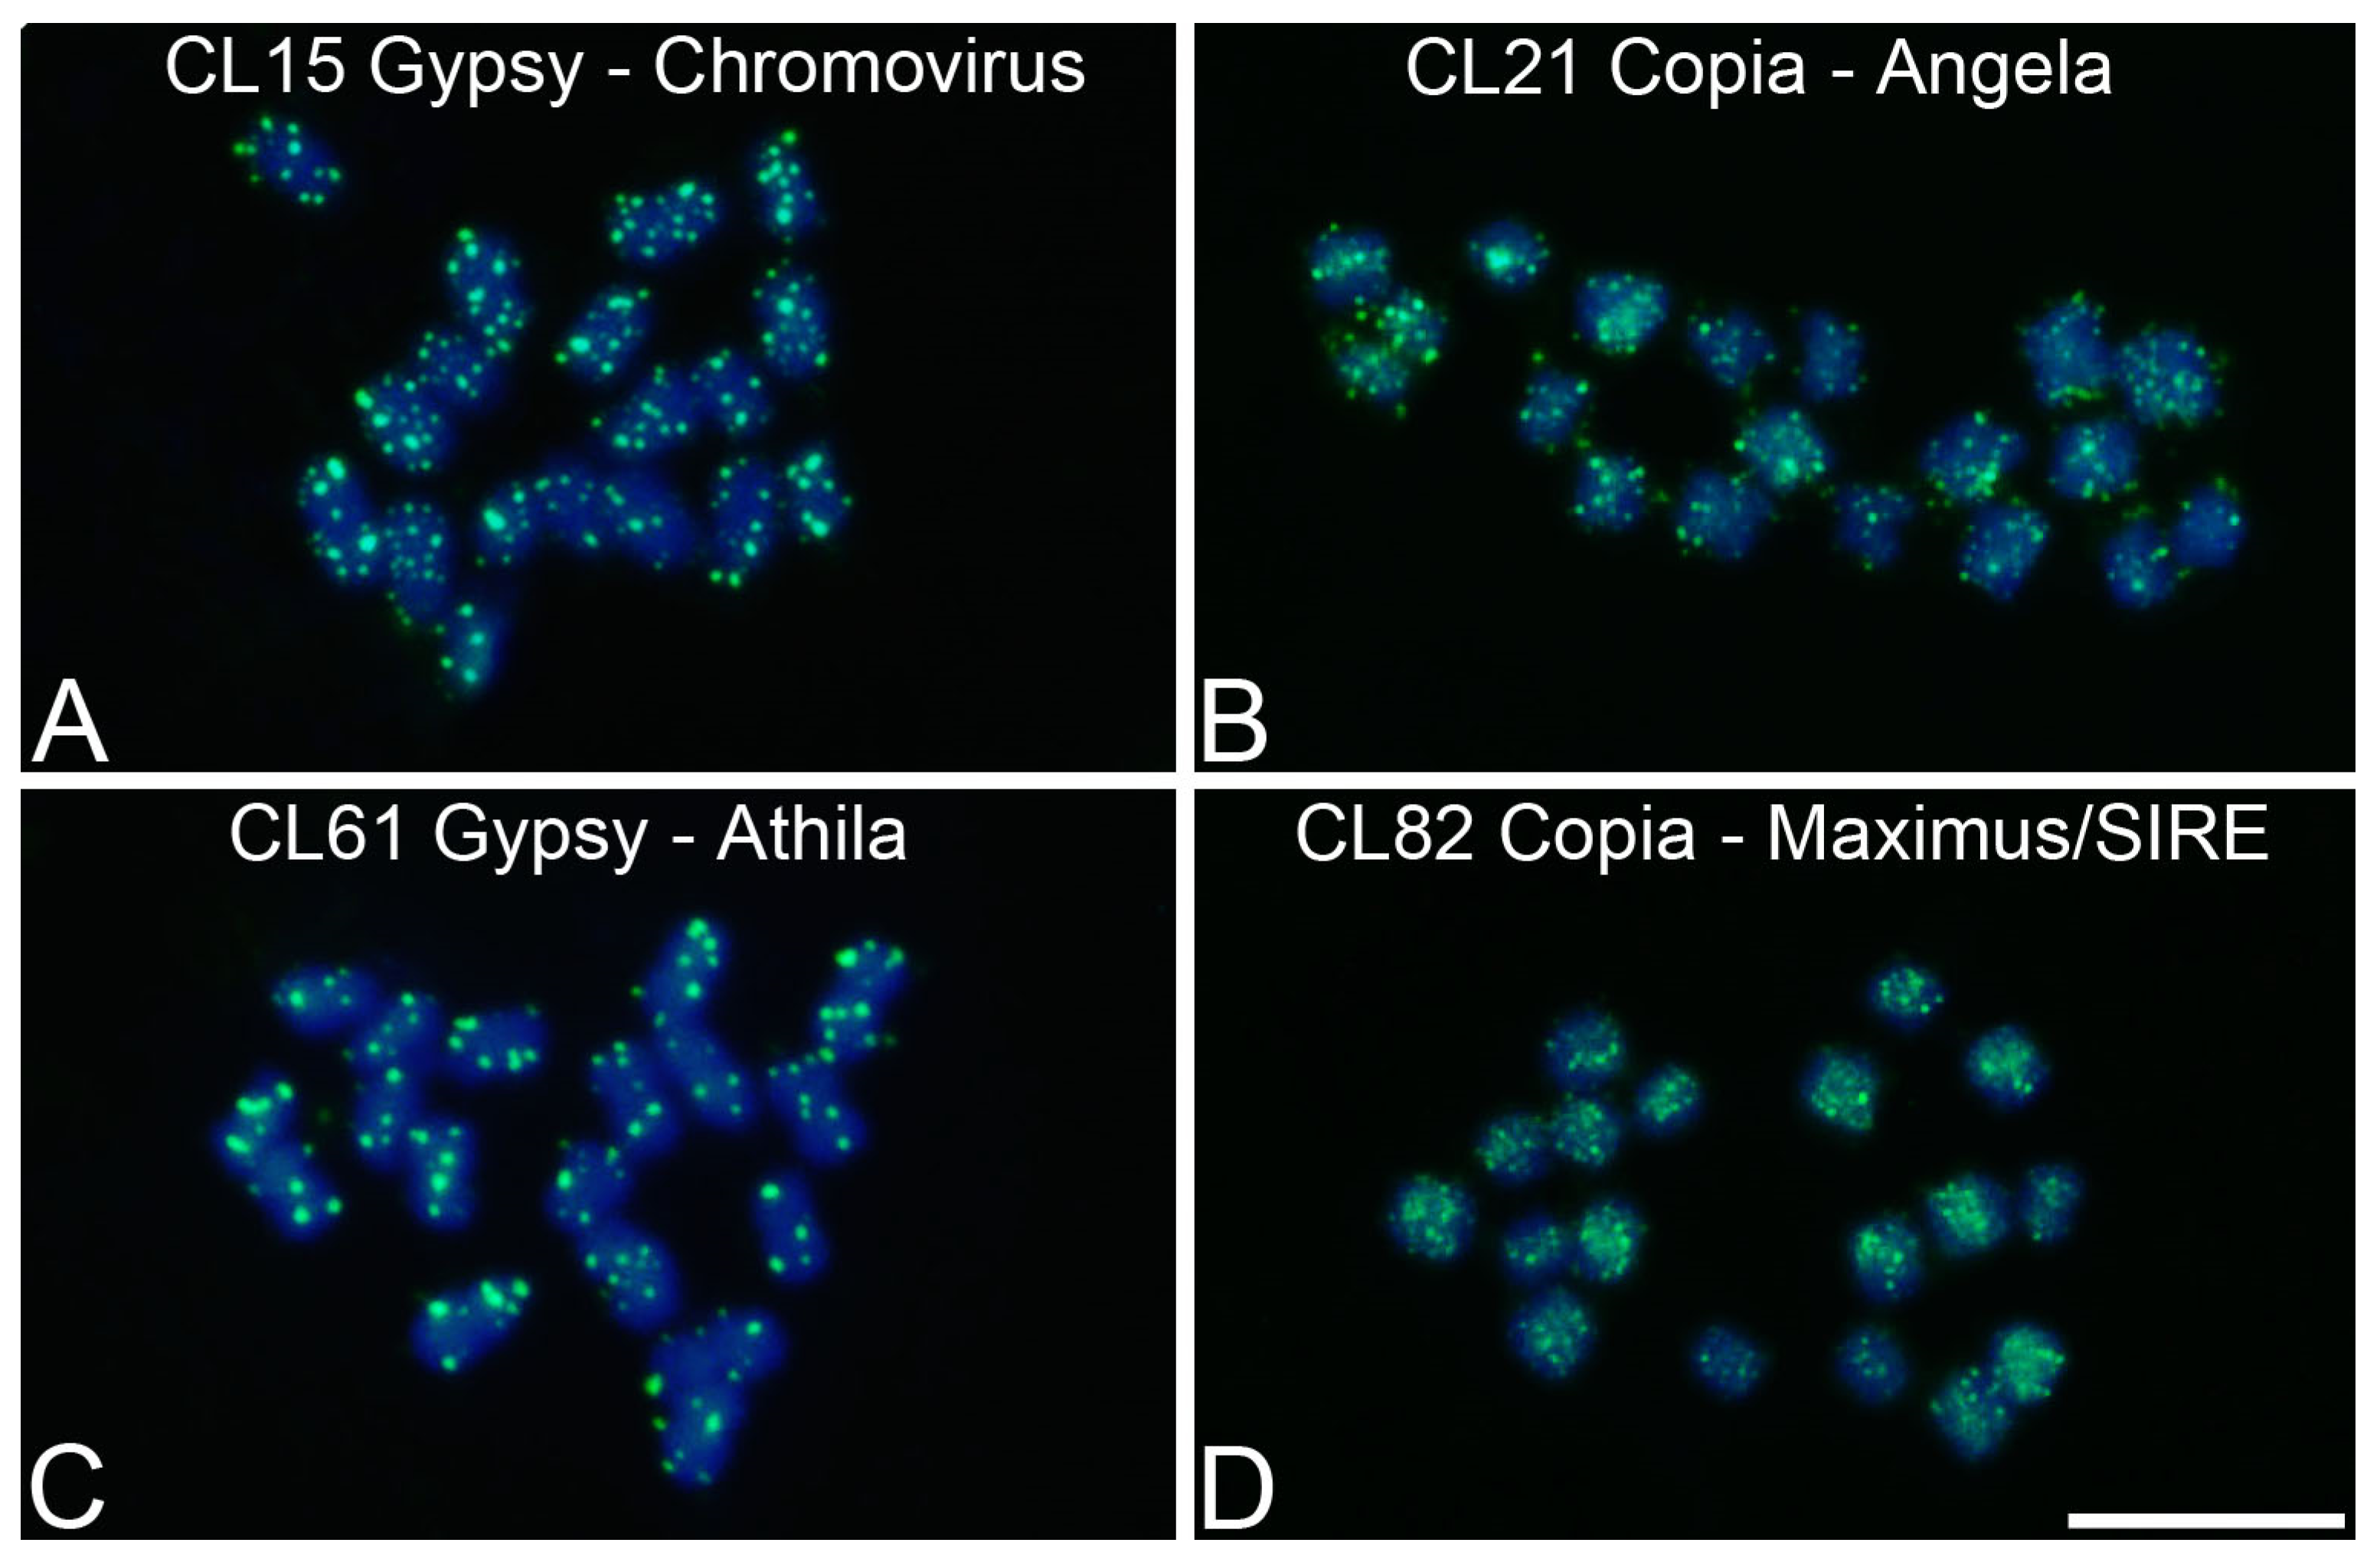
| P. edulis | CL15 | 1.03 | Ty3/Gypsy/Chromovirus | F: AGGGAGCAGCAGTATTTTCG |
| R: GCTTGTCTCGGAGCGTTT | ||||
| P. edulis | CL21 | 0.97 | Ty1/Copia/Angela | F: ATGGGCCTTAGTTGACTTGC |
| R: CATGCAACCATATCTTGACTGA | ||||
| P. edulis | CL61 | 0.47 | Ty3/Gypsy/Athila | F: CCTGTGCAATGTGTTCCAAA |
| R: TCCCAATTCAGCACAAGGTT | ||||
| P. edulis | CL82 | 0.29 | Ty1/Copia/Maximus/SIRE | F: GCATACTTTCCTTGTGTGATGAA |
| R: GCTTGATGAAAATGGCATGA | ||||
| P. cincinnata | CL6 | 1.22 | Ty3/Gypsy/Chromovirus | F: GCATACTTTCCTTGTGTGATGAA |
| R: GCTTGATGAAAATGGCATGA | ||||
| P. cincinnata | CL30 | 0.73 | Ty3/Gypsy/Athila | F: CCAGTGCAGTGTGTTCCAAA |
| R: TGCCTTCTCGTACCATGAAAT | ||||
| P. cincinnata | CL55 | 0.50 | Ty1/Copia/Maximus/SIRE | F: TTGGCATCCTCCAAATTGA |
| R: GGGAACTTGTTAAAAGGCCTAAA | ||||
| P. cincinnata | CL99 | 0.17 | Ty3/Gypsy/Chromovirus | F: GCTTAGCATAAAGCTTTTCACG |
| R: AGCTTAAGCCCATGTGCAGT |
| Classification | Genome Proportion (%) | ||||
|---|---|---|---|---|---|
| Repetitive Elements | Superfamily | Family | P. alata | P. edulis | P. cincinnata |
| LTR Retrotransposons | Ty1/Copia | Angela | 9.73 | 8.39 | 13.63 |
| Tork | 0.07 | 0.26 | 0.32 | ||
| Maximus/SIRE | 0.07 | 1.21 | 2.77 | ||
| Bianca | 0.00 | 0.00 | 0.02 | ||
| Unclassified | 7.18 | 6.84 | 7.67 | ||
| Ty1/Copia total | 17.05 | 16.70 | 24.41 | ||
| Ty3/Gypsy | Chromovirus | 15.75 | 12.51 | 7.29 | |
| Athila | 3.11 | 4.96 | 4.58 | ||
| Unclassified | 7.04 | 7.08 | 4.06 | ||
| Ty3/Gypsy total | 25.90 | 24.55 | 15.93 | ||
| Transposon DNA | 0.02 | 0.62 | 0.03 | ||
| Pararetrovirus | 0.00 | 0.00 | 0.01 | ||
| In tandem | 45S DNAr | 0.28 | 0.62 | 0.75 | |
| 5S DNAr | 0.02 | 0.01 | 0.05 | ||
| SatDNAs | 0.05 | 0.04 | 0.02 | ||
| Unclassified | 31.38 | 24.32 | 21.04 | ||
| Repetitive DNA total | 74.70 | 66.86 | 62.24 | ||
| Single copy | 25.30 | 33.14 | 37.76 | ||
Disclaimer/Publisher’s Note: The statements, opinions and data contained in all publications are solely those of the individual author(s) and contributor(s) and not of MDPI and/or the editor(s). MDPI and/or the editor(s) disclaim responsibility for any injury to people or property resulting from any ideas, methods, instructions or products referred to in the content. |
© 2024 by the authors. Licensee MDPI, Basel, Switzerland. This article is an open access article distributed under the terms and conditions of the Creative Commons Attribution (CC BY) license (https://creativecommons.org/licenses/by/4.0/).
Share and Cite
Silva, G.S.; Souza, M.M.; Pamponét, V.d.C.C.; Micheli, F.; Melo, C.A.F.d.; Oliveira, S.G.d.; Costa, E.A. Cytogenomic Characterization of Transposable Elements and Satellite DNA in Passiflora L. Species. Genes 2024, 15, 418. https://doi.org/10.3390/genes15040418
Silva GS, Souza MM, Pamponét VdCC, Micheli F, Melo CAFd, Oliveira SGd, Costa EA. Cytogenomic Characterization of Transposable Elements and Satellite DNA in Passiflora L. Species. Genes. 2024; 15(4):418. https://doi.org/10.3390/genes15040418
Chicago/Turabian StyleSilva, Gonçalo Santos, Margarete Magalhães Souza, Vanessa de Carvalho Cayres Pamponét, Fabienne Micheli, Cláusio Antônio Ferreira de Melo, Sárah Gomes de Oliveira, and Eduardo Almeida Costa. 2024. "Cytogenomic Characterization of Transposable Elements and Satellite DNA in Passiflora L. Species" Genes 15, no. 4: 418. https://doi.org/10.3390/genes15040418