Article

Differentiation of Morphological Traits and Genome-Wide Expression Patterns between Rice Subspecies Indica and Japonica

1
Laboratory of Subtropical Biodiversity, Jiangxi Agricultural University, Nanchang 330045, China
2
College of Life Sciences, Shaanxi Normal University, Xi’an 710119, China
3
Key Laboratory of Ecology of Rare and Endangered Species and Environmental Protection (Guangxi Normal University), Ministry of Education, Guilin 541004, China
4
Lushan Botanical Garden, Jiangxi Province and Chinese Academy of Sciences, Jiujiang 332900, China
*
Authors to whom correspondence should be addressed.
Genes 2023, 14(10), 1971; https://doi.org/10.3390/genes14101971
Submission received: 8 September 2023 / Revised: 17 October 2023 / Accepted: 19 October 2023 / Published: 21 October 2023
(This article belongs to the Special Issue Molecular Phylogenetics and Phylogeography of Seed Plants)

Abstract

:
Changes in gene expression patterns can lead to the variation of morphological traits. This phenomenon is particularly evident in recent evolution events such as crop domestication and responses to environmental stress, where alterations in expression levels can efficiently give rise to domesticated syndromes and adaptive phenotypes. Rice (Oryza sativa L.), one of the world’s most crucial cereal crops, comprises two morphologically distinct subspecies, Indica and Japonica. To investigate the morphological divergence between these two rice subspecies, this study planted a total of 315 landrace individuals of both Indica and Japonica under identical cultivation conditions. Out of the 16 quantitative traits measured in this study, 12 exhibited significant differences between the subspecies. To determine the genetic divergence between Indica and Japonica at the whole-genome sequence level, we constructed a phylogenetic tree using a resequencing dataset encompassing 95 rice landrace accessions. The samples formed two major groups that neatly corresponded to the two subspecies, Indica and Japonica. Furthermore, neighbor-joining (NJ) trees based on the expression quantity of effectively expressed genes (EEGs) across five different tissues categorized 12 representative samples into two major clades aligning with the two subspecies. These results imply that divergence in genome-wide expression levels undergoes stabilizing selection under non-stressful conditions, with evolutionary trends in expression levels mirroring sequence variation levels. This study further supports the pivotal role of changes in genome-wide expression regulation in the divergence of the two rice subspecies, Indica and Japonica.

1. Introduction

Early in 1970s, Wilson et al. proposed that divergence in gene expression regulation plays a significant role in evolution [1,2]. This hypothesis was subsequently supported by a series of studies in various animals and plants, including genes related to domestication in cultivated plants and genes leading to morphological variation among varieties [3]. For example, mutations in the upstream regulatory region of the tb1 gene in maize altered the branching pattern of individuals [4]; regulatory variation in the qSH1 gene in rice led to changes in seed shattering [5,6]; expression regulatory variation in the fw2.2 gene in tomatoes resulted in changes in fruit size [3]; alterations in the expression of the Q gene in wheat affected its inflorescence structure, and so on [3]. Purugganan and Fuller (2009) summarized that of the identified nine domestication genes, eight encoded transcriptional activators, suggesting that the domestication process may involve not only variations in the gene regions encoding amino acids but also variations in gene regulatory regions [7]. Doebley et al. (2006) postulated that the proportion of genes with transcriptional regulatory roles might be higher in determining morphological differences between crops and their ancestral species than genes involved in amino acid substitution [3].
Compared to sequence variation in the genome, variation at the transcriptome level could change with time and space. This form of expression regulatory variation is more closely associated with phenotypic variation and is most likely to be preserved through natural and artificial selection [1,8]. Especially when plants face sudden environmental stress, changes in expression levels can respond to environmental changes quickly, providing hope for the survival of plants. For example, Groen et al. (2020) found that under drought conditions, the selection intensity calculated based on transcriptome data was stronger than that in the control group under moist conditions [9]. Due to the variability at the transcriptome level, studies are often influenced by a series of factors, such as the external environment, the choice of tissue type, etc. Therefore, the role of expression variation in population divergence and adaptive evolution still requires further research.
Rice (O. sativa L.) is one of the world’s most important crops, with two subspecies, Indica and Japonica, characterized by differences in morphology, habitats/ecosystems, geographic distribution, cultivation culture, etc. (Figure 1) [10,11]. Furthermore, Indica rice mainly comprises the IND group, while Japonica rice predominantly encompasses temperate japonica (TEJ) and tropical japonica (TRJ) [12]. Indica rice is primarily grown in low-latitude regions such as the tropics and subtropics, while Japonica rice is cultivated in high-latitude areas with relatively lower temperatures and high altitudes [13,14].
Despite a series of studies on the phenotypic and whole-genome sequence divergence between the two subspecies of rice [11,12,13,14], we still cannot clearly understand whether the phenotypic separation between the two subspecies of rice is consistent with the whole-genome sequence divergence, especially regarding expression differentiation. Therefore, this study needs to address the following two questions: (1) What are the morphological differences between the two subspecies of rice? (2) Is the expression variation at the whole genome level consistent with the trend of DNA sequence divergence between the two subspecies of rice?

2. Materials and Methods

2.1. Sample Collection for Phenotypic Observation and RNA-Seq

To explore the divergence between Indica and Japonica rice, we chose 21 accessions covering two subspecies of rice for phenotypic measurements (Table 1). These accessions are all landraces, including 13 Japonica (9 TEJ and 4 TRJ) and 8 Indica (IND) accessions. Each accession consisted of 15 plants, totaling 315 plants. We cultivated these accessions in the phytotron under controlled conditions with a temperature of 30 °C (day, 8:00–20:00) and 25 °C (night) and a humidity level of 50%.
We referred to “Descriptors for wild and cultivated rice” (Bioversity International, IRRI and Africa Rice Center, 2007) and selected 16 quantitative traits for measurement (Table 2) [15]. We calculated the coefficient of variation (CV) and performed one-way analysis of variance (ANOVA). Due to significant phenotypic divergence between temperate japonica (TEJ) and tropical japonica (TRJ) within Japonica, we conducted separate analyses for these two groups.
The accessions for RNA sequencing (RNA-seq) were a subset of those for phenotypic observation, including 12 accessions (6 Indica and 6 Japonica) from the above 21 samples for studying phenotype (Table 1). The RNA-seq dataset was from our previously published research [16]. Each accession was cultivated with a minimum of five individuals to obtain RNAs at various developmental stages. We collected five types of tissues, i.e., leaves at the seedling stage (S), flag leaves (LH) and panicles (PH) at the heading stage, as well as flag leaves (LM) and panicles (PM) at the milk stage [16], for RNA sequencing using the Illumina HiSeq 2000 platform.

2.2. Whole-Genome Resequencing Data

To explore the divergence between Indica and Japonica at the whole-genome sequence level, we generated a resequencing dataset comprising 95 rice landraces, consisting of 56 accessions from the Indica subspecies and 39 accessions from the Japonica subspecies (Table S1). Out of these, the resequencing data for 82 accessions were downloaded from the 3000 Rice Genome Project (3K RGP) [17] and the remaining 13 accessions were from our previously published research [16]. These 95 accessions cover all accessions for RNA-seq and some accessions for phenotype observation.

2.3. Phylogeny Based on SNPs from Resequencing Data

We acquired an average of 14G of clean resequencing data for each accession. We first mapped the short clean reads to the O. sativa Nipponbare genome (MSU version 7.0) using the BWA-MEM algorithm. On average, we observed that 98.5% of the reads were successfully aligned to the reference genome, with a mean sequencing depth of 16.6× and an average coverage of 93.1% across the reference genome [18]. We utilized the HaplotypeCaller in the Genome Analysis Toolkit (GATK 3.5) for SNP calling, with parameters of “-stand_emit_conf 10, -stand_call_conf 30”. To minimize false positives, we filtered the raw SNPs through variant quality score recalibration (VQSR), resulting in a total of 9,282,239 reliable SNPs for further analyses.
We employed a sliding window approach with a 100 kb window, sliding in 10 kb steps, to scan the whole genome and estimate the nucleotide diversity (π) of the two subspecies, respectively. We also calculated the genetic divergence (FST) between Indica and Japonica using non-overlapping 10 kb windows, sliding in 10 kb steps, by vcftools [19]. A principal component analysis (PCA) was performed to assess the relatedness and clustering among all samples, utilizing the GCTA software (version 1.24.4) [20]. Furthermore, we computed pairwise genetic distances for all 95 samples, generating a genetic distance matrix using our in-house PERL scripts. Following this, we constructed a neighbor-joining (NJ) tree using MEGA (version 6.0) based on this distance matrix [21].

2.4. Phylogeny Based on RNA-Seq Data

Following the removal of low-quality reads, we successfully acquired over 30 million clean read pairs from each RNA-seq sample, with an average clean data size of approximately 6G per sample. Subsequently, these clean reads were aligned to the reference genome (O. sativa Nipponbare, MSU version 7.0) using TopHat2 [22], achieving mapping rates that ranged from 89.7% to 92.1%, varying depending on the tissues. To quantify expression levels, we employed the HTSeq.scripts.count feature in the software of HTSeq (version 0.6.1p1) [23]. Only reads that uniquely mapped to the reference genome were selected for gene expression calculations. We normalized gene expression using edgeR [24], computing count-per-million (cpm) and reads per million reads (RPKM). During normalization, we applied the TMM (trimmed mean of M-values) method. We defined a gene as effectively expressed (EEG) if it had at least one mapped read count per million in more than one of the samples (rowSums(cpm(d) > 1) ≥ 1). In total, we identified 29,818 EEGs, which represent genes that were effectively expressed in at least one tissue.
To investigate the evolutionary relationships among the samples, we computed pairwise distances between all 12 samples based on the expression levels of EEGs, utilizing our custom R scripts. This analysis generated a genetic distance matrix for each tissue. Subsequently, we utilized the distance matrixes to construct neighbor-joining (NJ) trees employing PHYLIP (version 3.696) [25].

2.5. Identifying Differentially Expressed Genes (DEGs) between Indica and Japonica Rice

We identified differentially expressed genes (DEGs) between Indica and Japonica rice in each tissue using edgeR [24]. Our criteria for detecting DEGs included a significance threshold with FDR (adjusted p) < 0.05 and |log2FC| > 2. Additionally, we performed gene ontology (GO) enrichment analysis for the DEGs in each tissue. We selected significant GO terms in the biological process (BP) category based on a Fisher’s exact test with a p value < 0.05.

3. Results

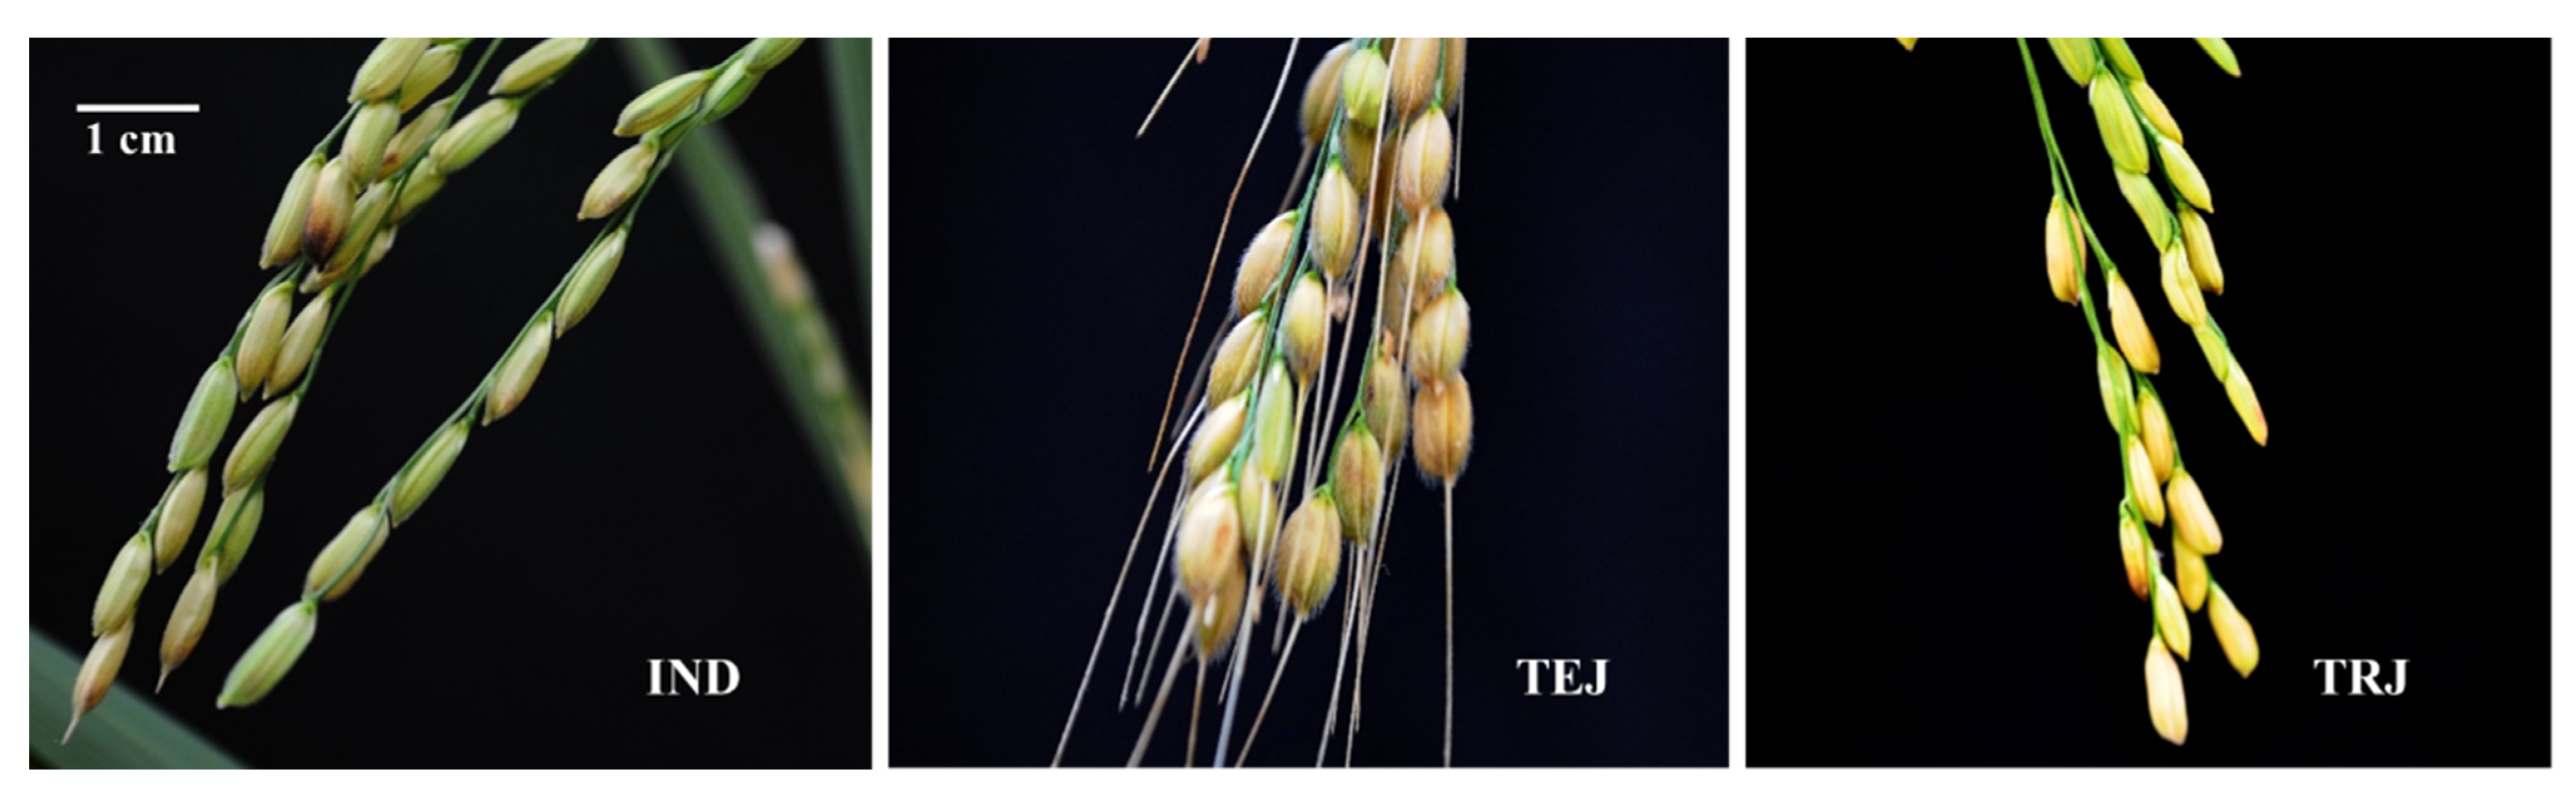
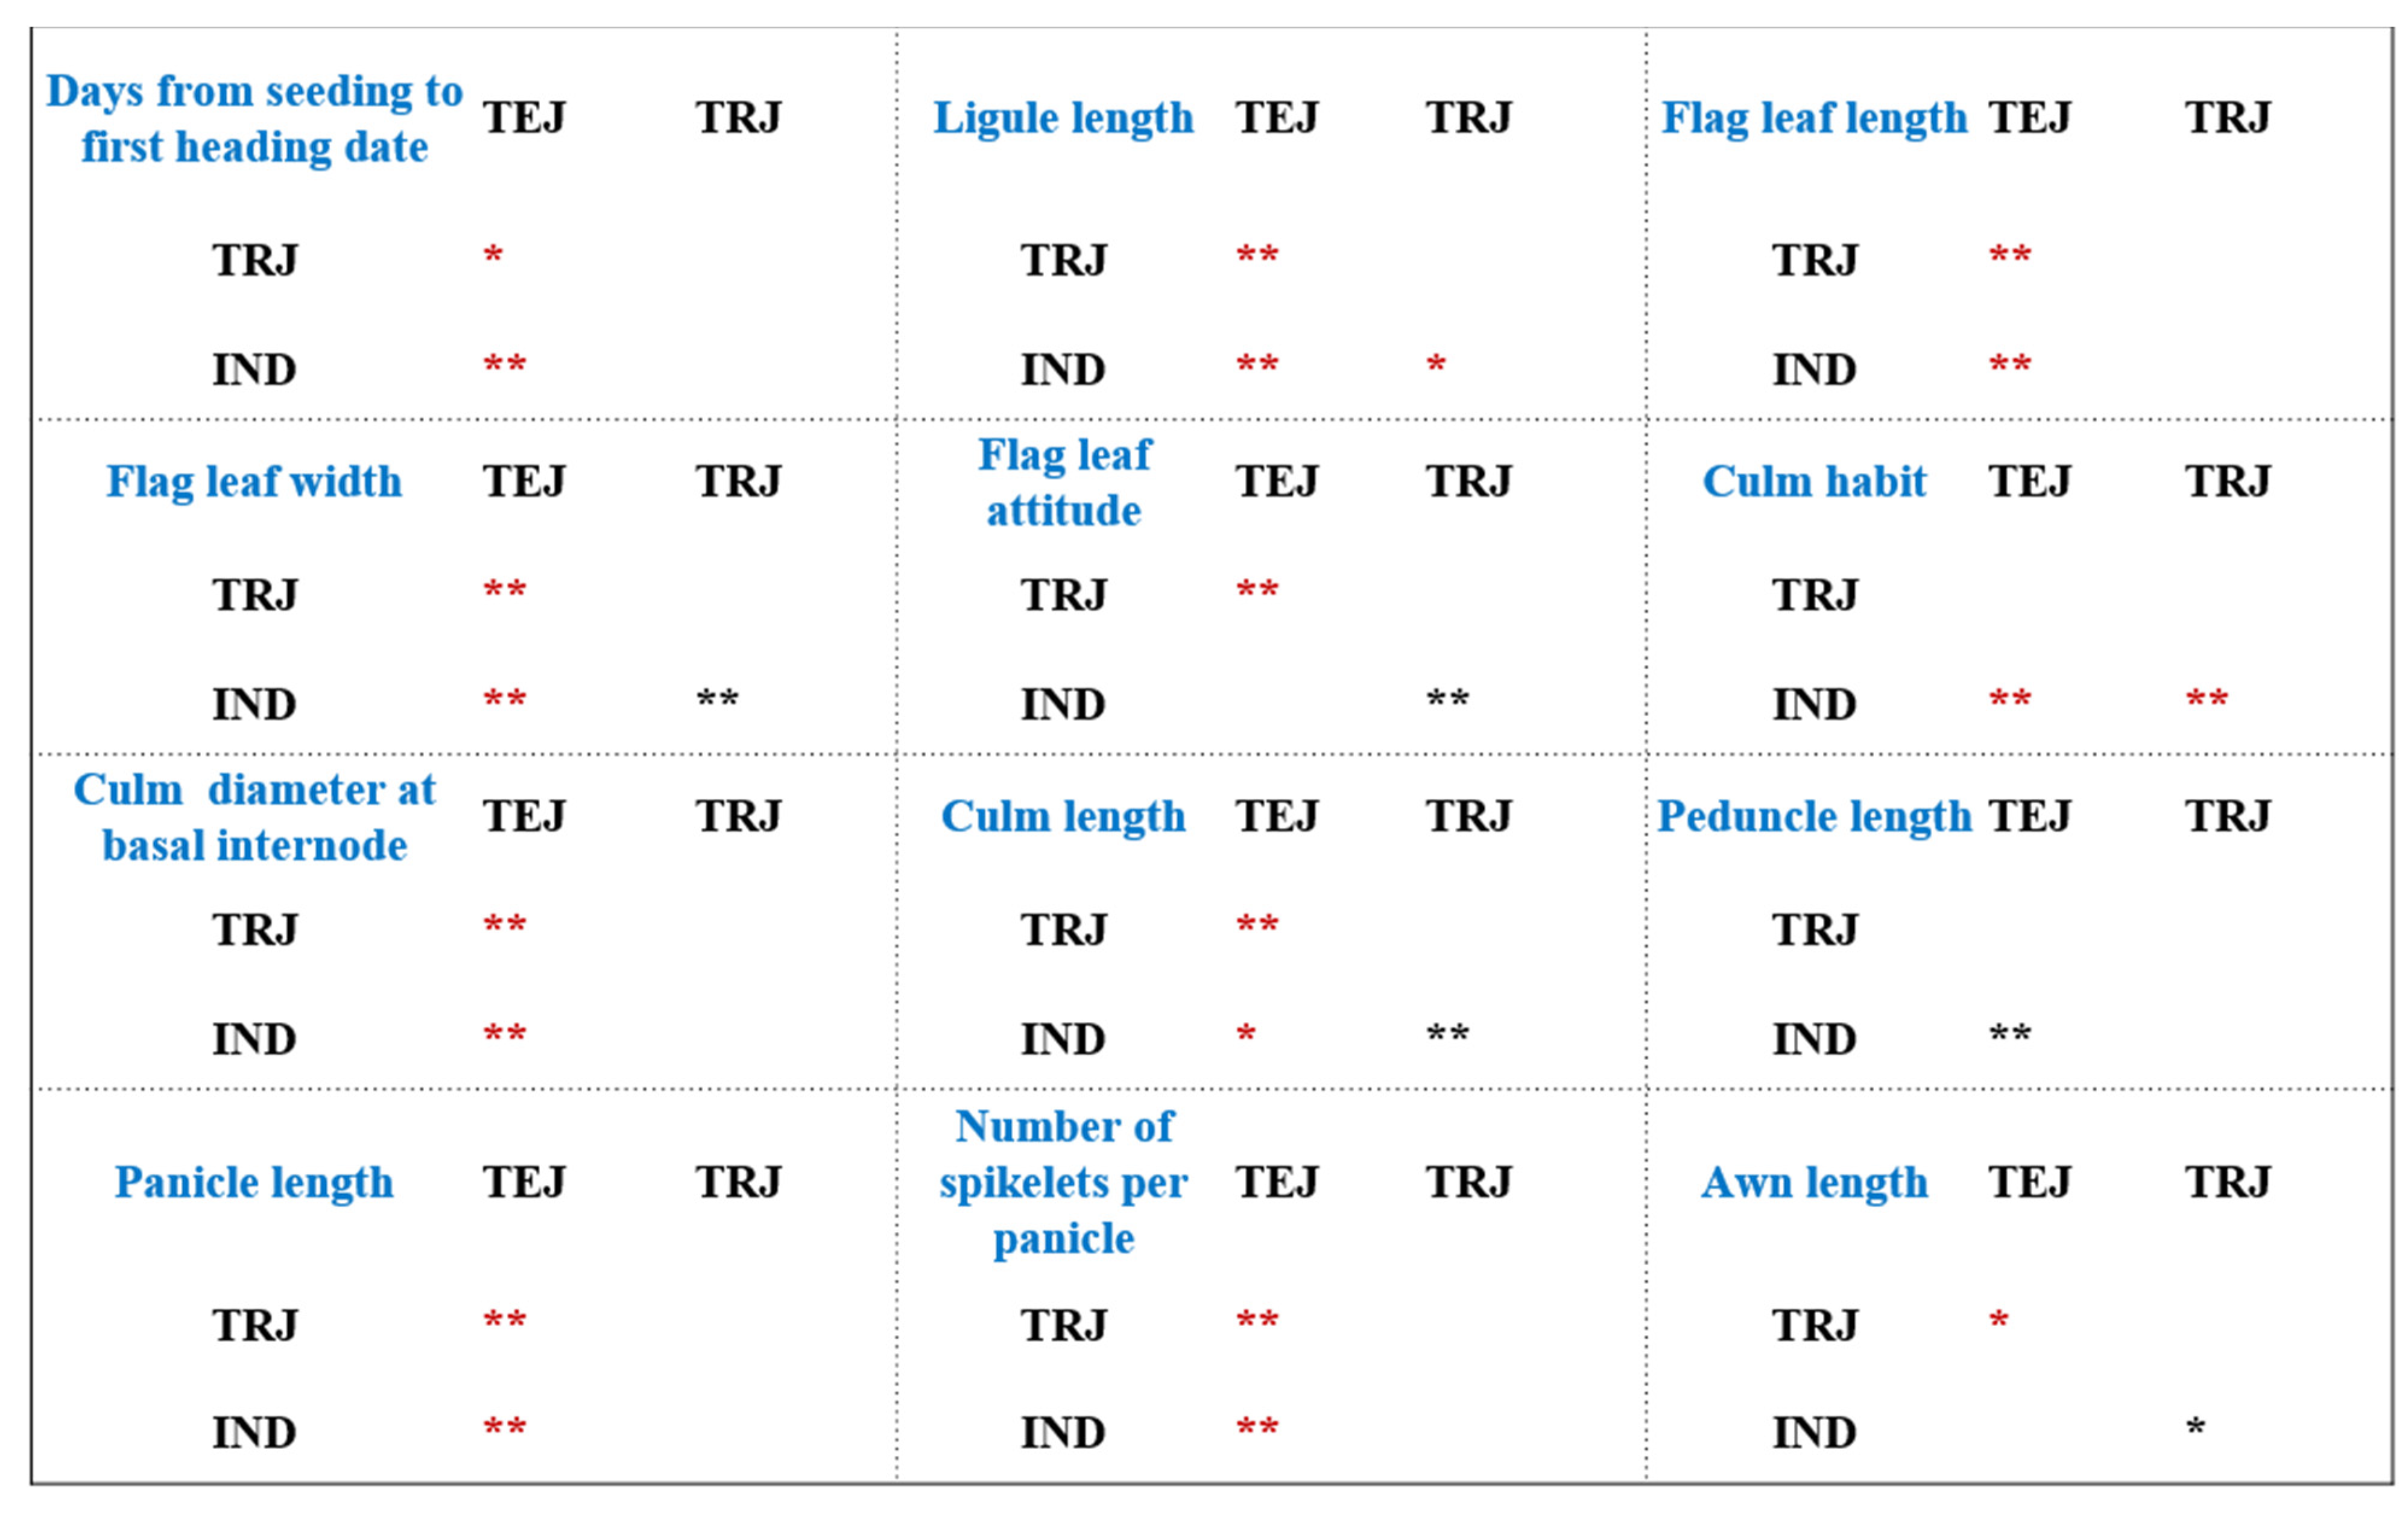
3.1. Morphological Variation between Two Subspecies of Rice

To quantify the morphological distinctions between Indica and Japonica rice, we performed a diversity assessment and differential analysis of 16 quantitative traits across 138 plants. As shown in Table 2, the coefficient of variation (CV) for three traits, namely, the attitude of flowering panicle branches, attitude of seed setting panicle branches, and awn length, was greater than 1. One-way analysis of variance (ANOVA) revealed that, except for the attitude of flowering panicle branches, attitude of seed setting panicle branches, anther length, and number of panicles per plant, the other 12 traits showed significant differences between the subspecies (p < 0.05).
As observed from Table 2 and Figure 2, in terms of nutrition-related traits, the ligule length of the Indica subspecies (IND) was significantly longer than that of the Japonica subspecies (TEJ and TRJ). IND exhibited significantly greater flag leaf length and width than TEJ. Whereas there was no significant difference in flag leaf attitude between IND and TEJ, it was notably larger in TRJ. Furthermore, based on culm habit, we found that the Japonica subspecies (TEJ and TRJ) exhibited significantly denser plant growth compared to the Indica subspecies. However, IND was thicker than TEJ in terms of culm diameter at basal internode, and IND was significantly taller than TEJ but shorter than TRJ in terms of culm length (Table 2, Figure 2). In terms of reproductive growth-related traits, IND flowered later than TEJ under our cultivate conditions (12 h of daylight per day). The peduncle length of IND was shorter than that of TEJ, but IND had significantly longer panicles and higher number of spikelets per panicle than TEJ. Additionally, the awn length of IND was significantly shorter than that of TRJ (Table 2, Figure 2).

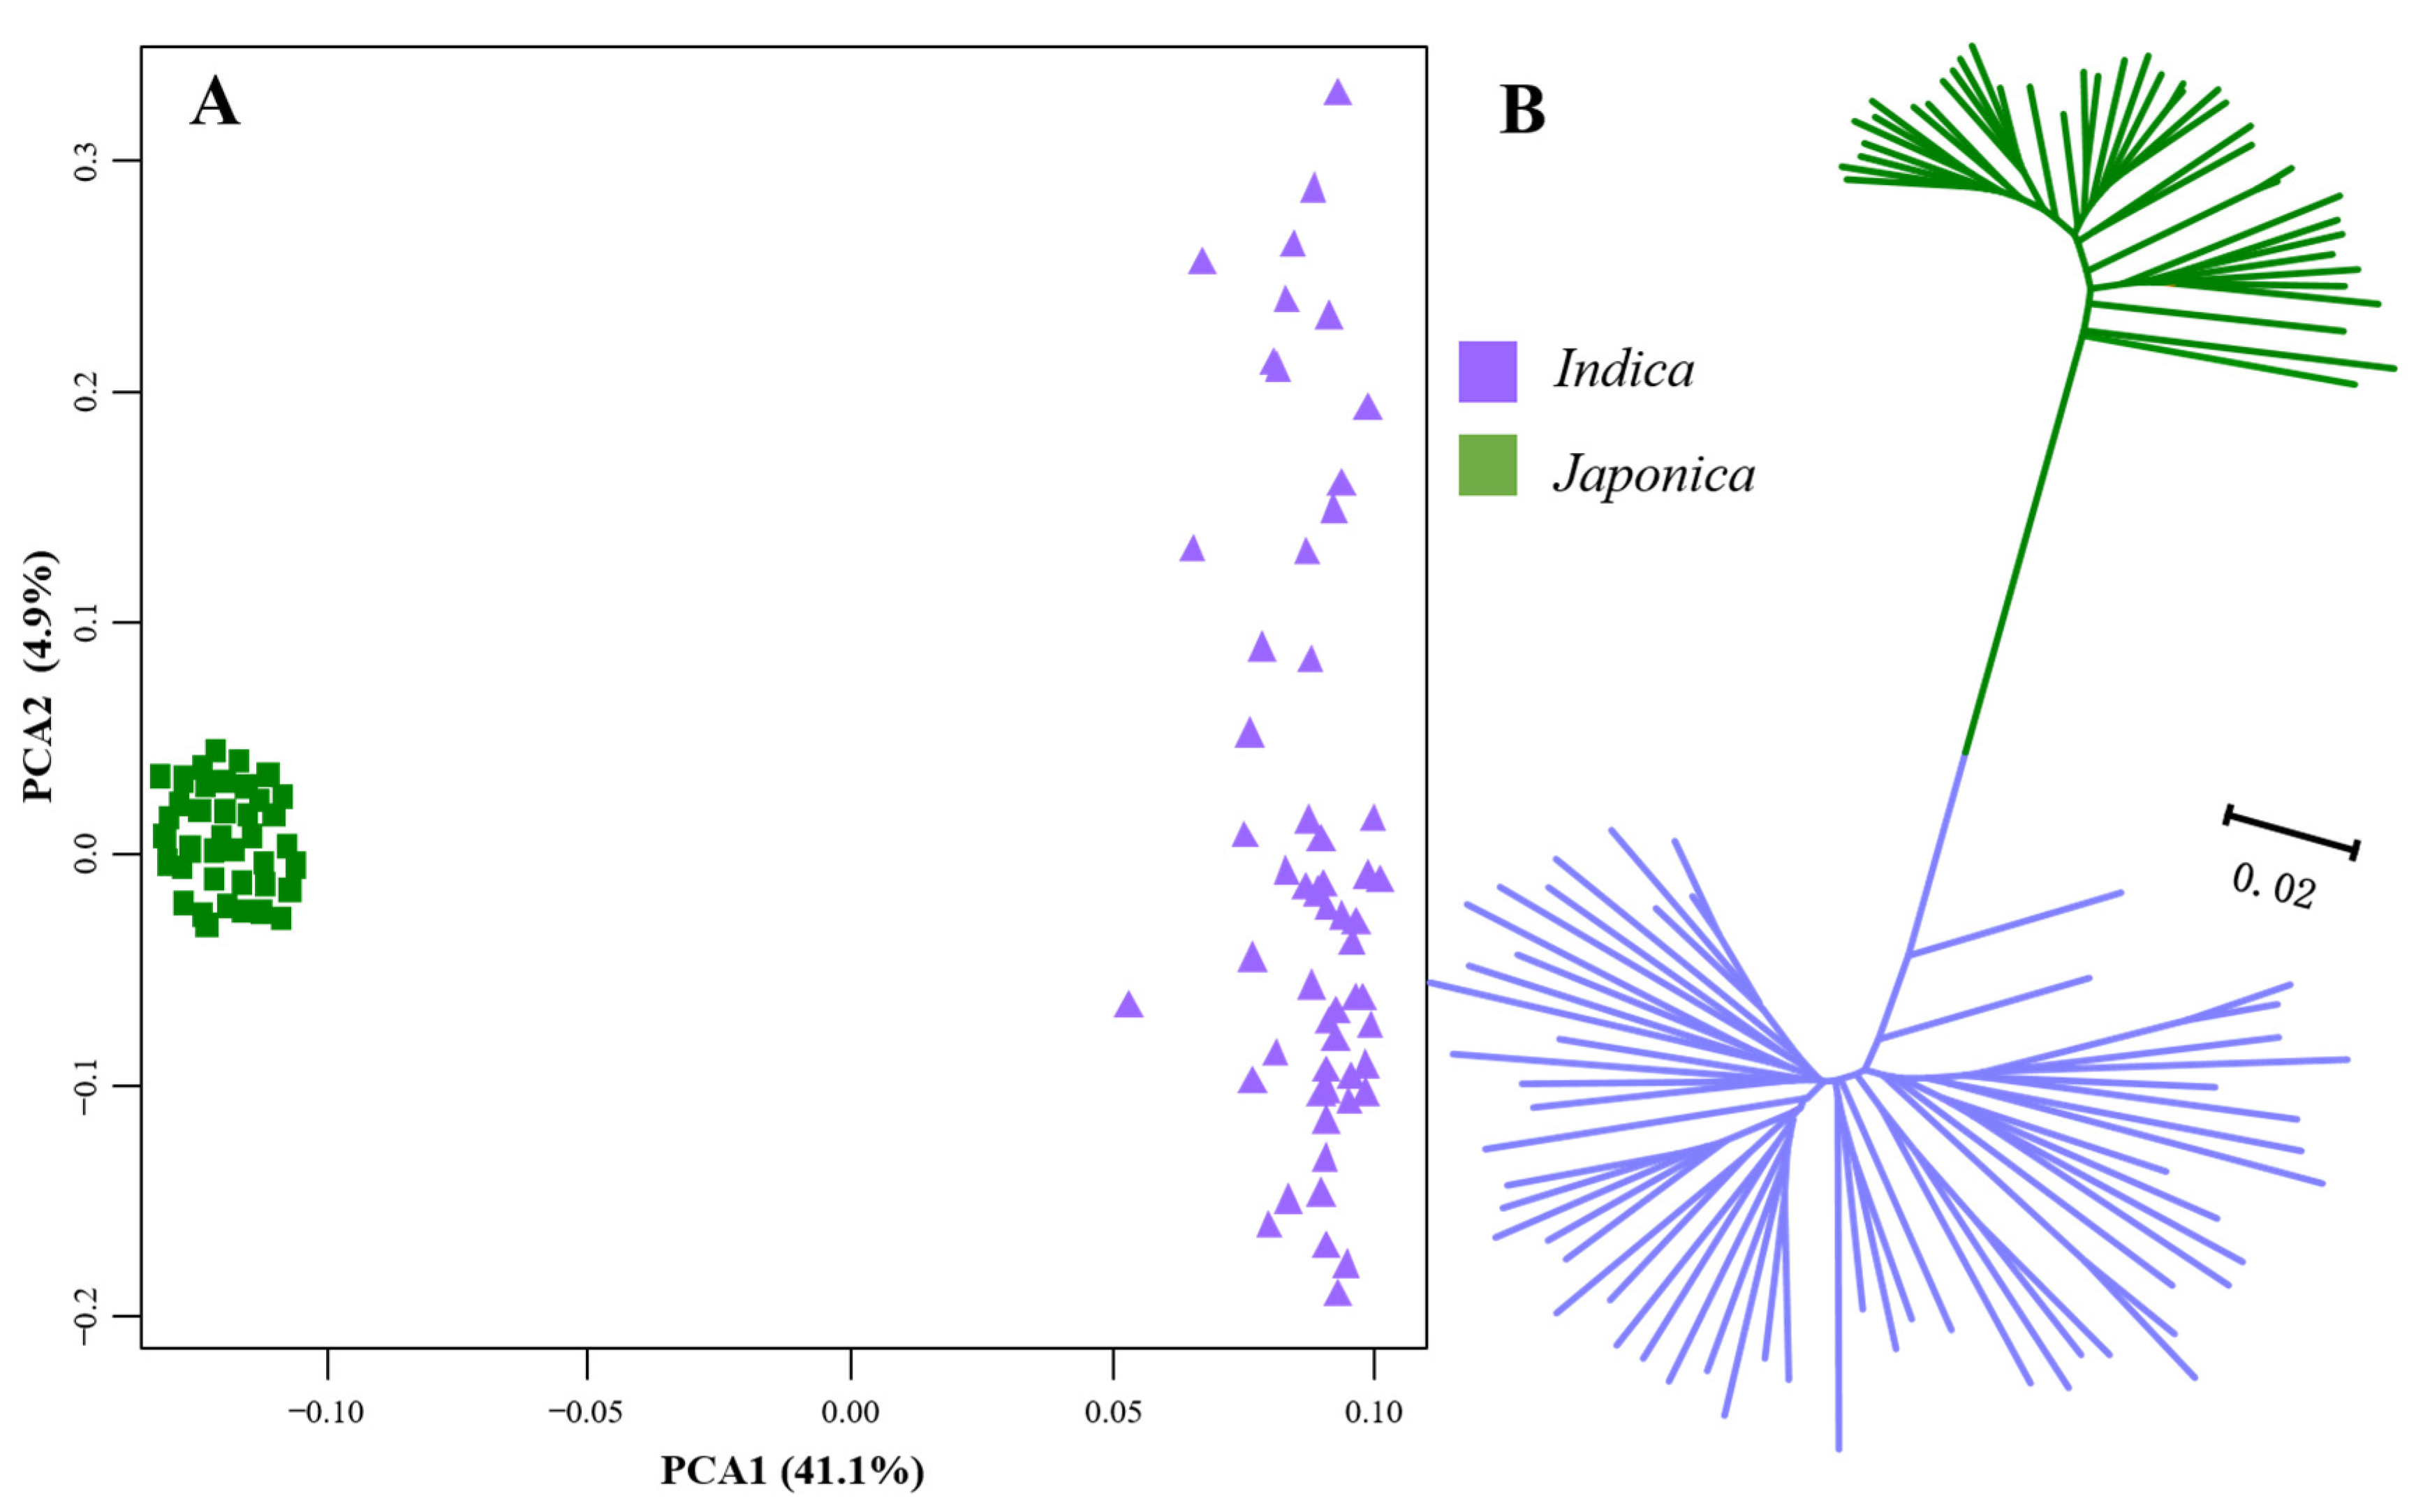
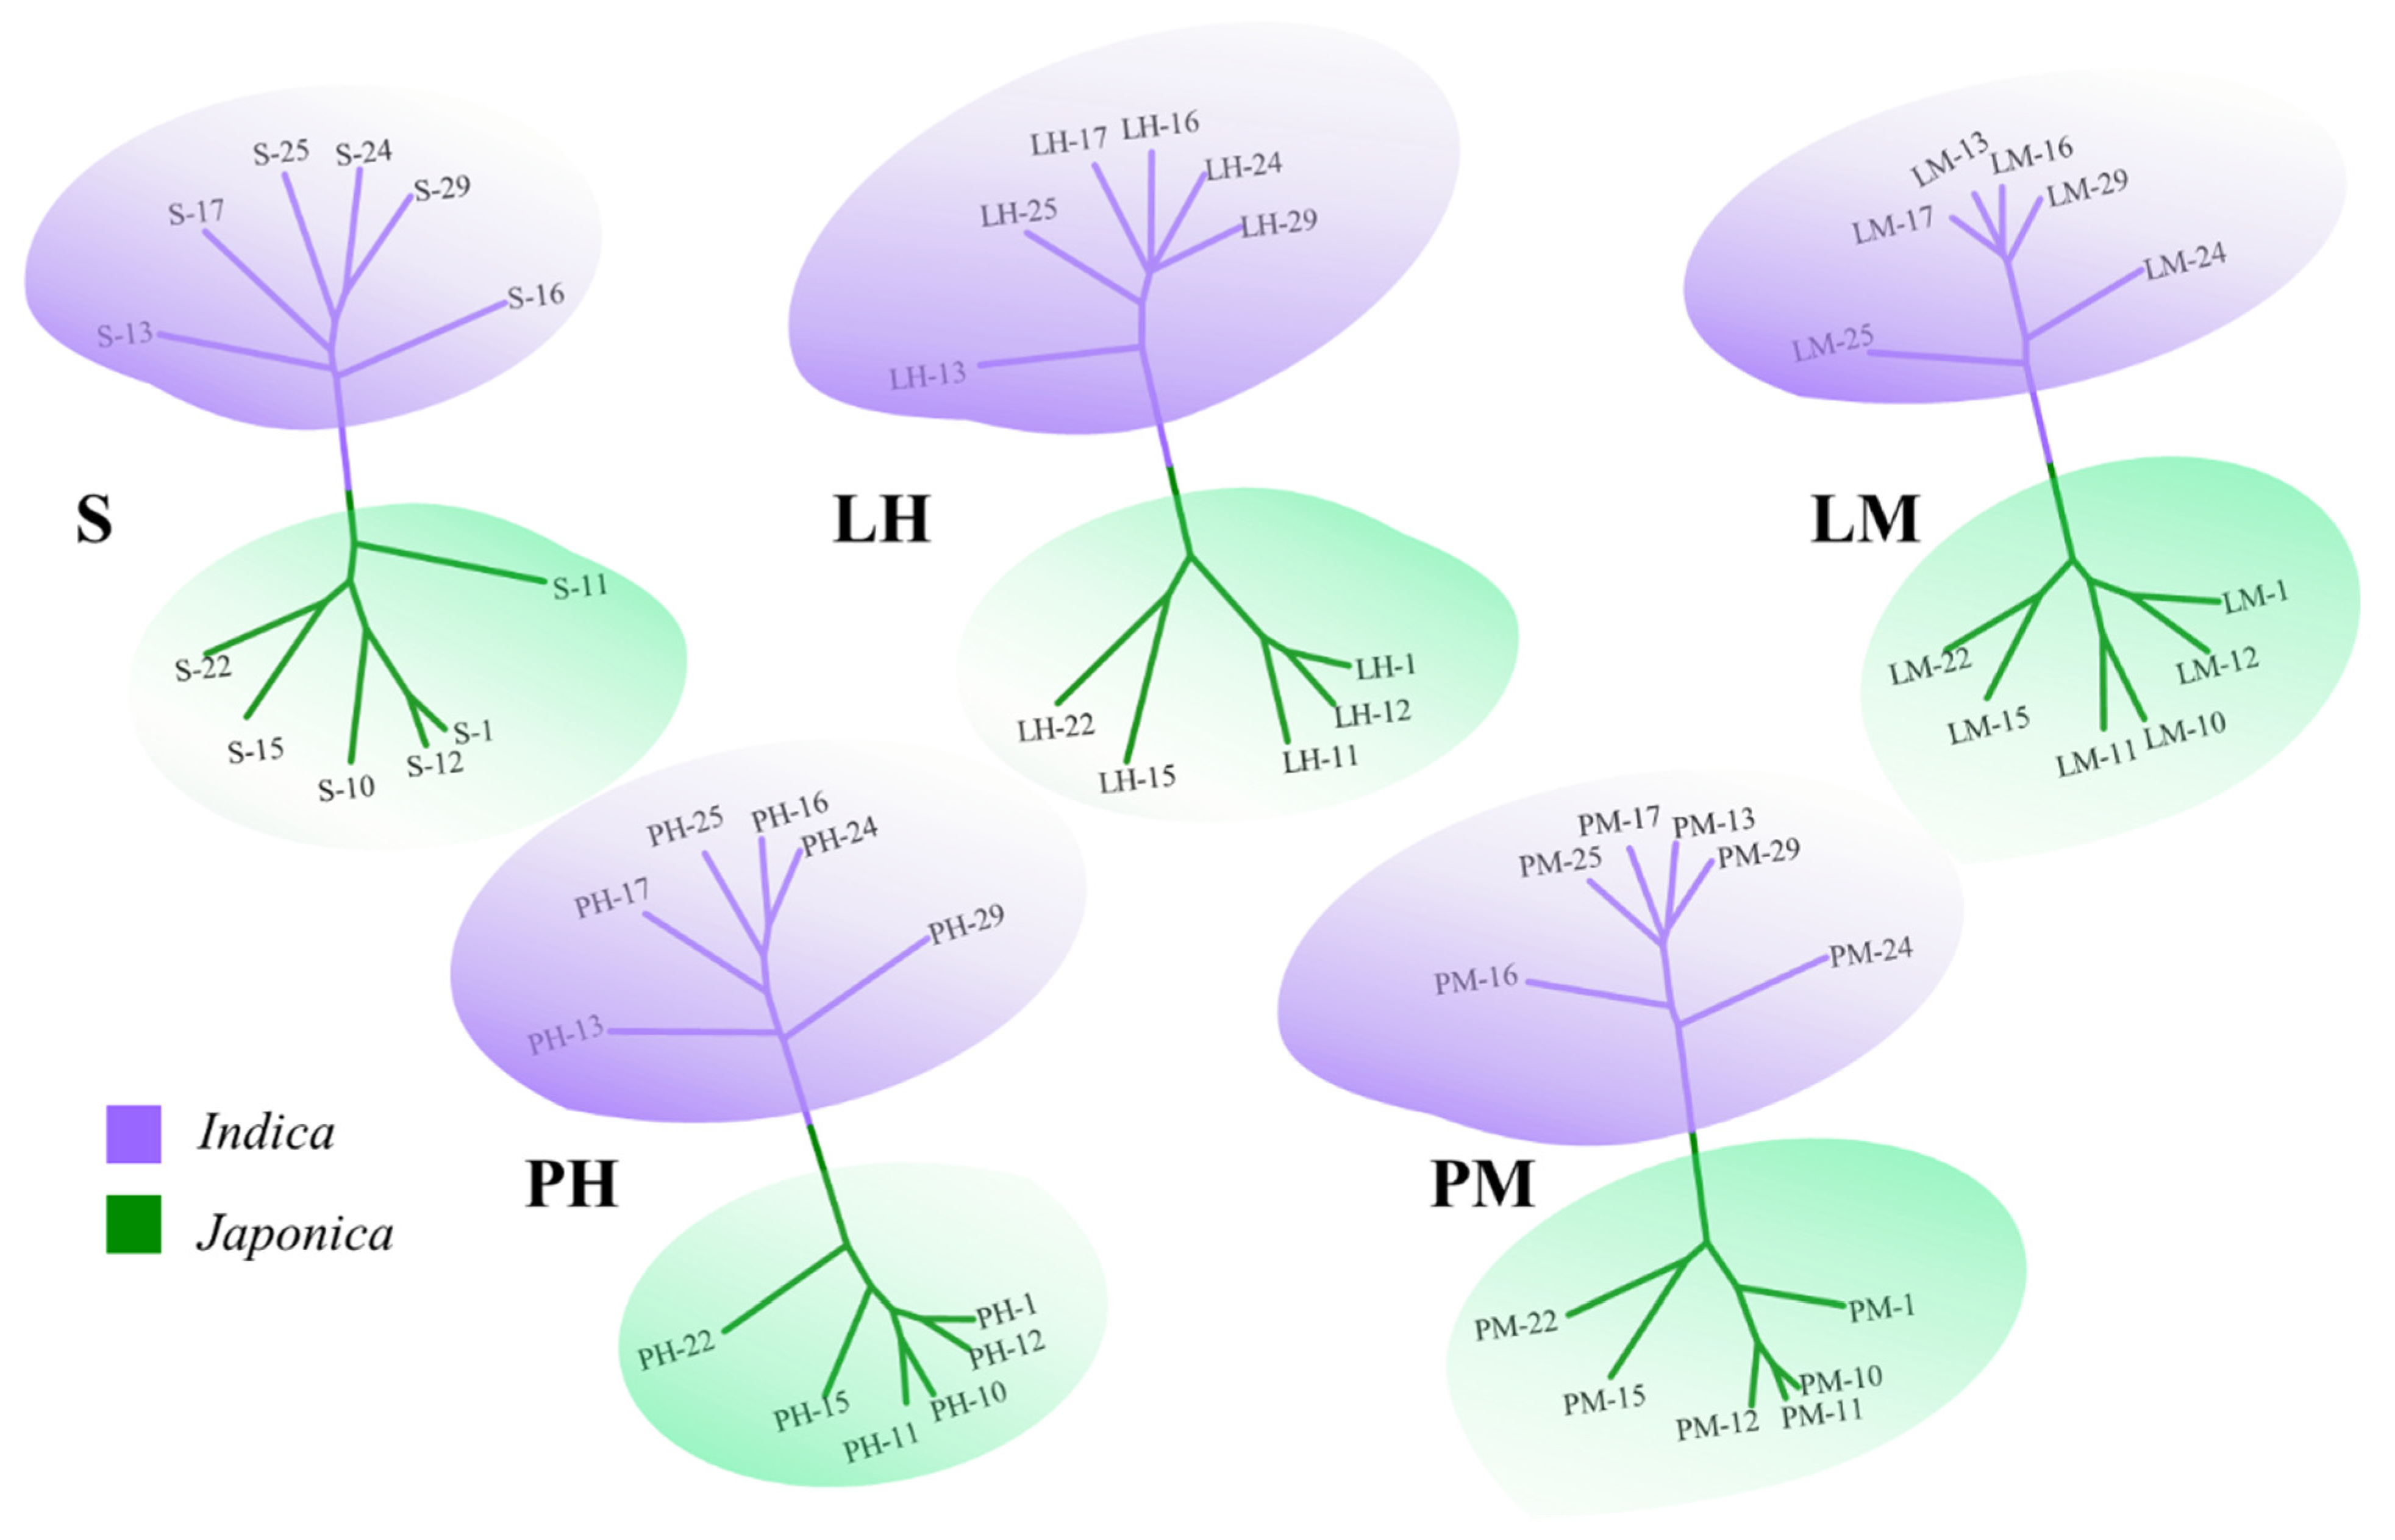
3.2. Divergence at Genome-Wide DNA Sequence Level and Expression Level between the Two Subspecies of Rice

Our initial investigation focused on the nucleotide diversity and population genetic divergence among all samples based on the SNPs extracted from the resequencing data. As anticipated, we observed a higher level of nucleotide diversity within the Indica subspecies (π = 0.0031) compared to the Japonica subspecies (π = 0.0018). The genetic divergence (FST) between these two subspecies was 0.5569. In our principal component analysis (PCA), PCA1 accounted for a substantial 41.1% of the variations, effectively grouping all samples into two distinct clusters corresponding to the Indica subspecies and the Japonica subspecies, with no overlap (Figure 3A). Similarly, the neighbor-joining (NJ) tree clearly revealed that all 95 samples segregated into two major groups, aligning with the two subspecies, i.e., Indica and Japonica rice (Figure 3B).
In our further analysis on the RNA-seq data, we identified a consistent pattern with the results based on the resequencing data. Specifically, the NJ tree constructed based on the expression levels of effectively expressed genes (EEGs) in each of the five tissues distinctly clustered all samples into two major clades, corresponding to Indica and Japonica rice (Figure 4).
Furthermore, the DEGs between Indica and Japonica rice were identified across five tissues. There were an average of 3000 DEGs (2498 to 3613) between the two subspecies, accounting for 12.4% of the number of EEGs on average (Table 3). Moreover, the numbers of up-regulated DEGs of Japonica rice to Indica rice were larger than that of down-regulated DEGs (Table 3). We further conducted functional enrichment analysis of these DEGs, respectively, and selected significantly enriched GO terms. For example, there were 16 significantly enriched GO terms in PH and most of them were related to pollination and reproduction, indicating the significant expression differentiation of reproductive-related genes in the panicles of the two rice subspecies at the heading stage (Figure S1).

4. Discussion

4.1. Significant Divergence in Morphological Traits between the Two Subspecies of Rice

Morphological variation serves as the foundation for adaptive evolution and natural selection [26]. Crops domestication also began with the selection of phenotypes. Apart from the emergence of domestication syndromes such as loss of shattering and enlargement of fruits, landrace populations from different regions have also developed specific phenotypic characteristics to adapt to their local environments. These morphological traits encompass both qualitative traits determined by single genes or major-effect genes and quantitative traits determined by polygenic effects [3,27]. For example, some rice varieties can flower earlier and expand their cultivation range to higher latitudes through changes in minor-effect gene DTH2 [28].
In this study, we observed a total of 16 quantitative traits, with 12 of them showing significant divergence among subspecies. In general, the ligule length of the Indica subspecies (IND) was significantly longer than that of the Japonica subspecies (TEJ and TRJ), and Japonica subspecies (TEJ and TRJ) plants exhibited significantly denser growth (culm habit). Therefore, the ligule length and culm habit could be used as distinguishing characteristics between these two subspecies.
Previous studies commonly classified IND and TEJ as the Indica and Japonica subspecies, which we refer to as subspecies in the narrow concept [12]. Our research found that IND had significantly longer and wider flag leaves, a thicker culm, a greater culm height, a later heading date, longer panicles, and more spikelets per panicle compared to TEJ, but IND had a shorter peduncle length than TEJ (Figure 2). These results also partially explain why the Indica subspecies has higher yields than the Japonica subspecies [29].
It is worth noting that TRJ significantly exceeded TEJ and IND in terms of flag leaf width and attitude, culm length, and awn length (Figure 2). These four traits not only help us distinguish between them morphologically but also guide us to further investigate why TRJ is more suitable for growing in higher temperature environments than TEJ [12,30]. In addition, TRJ and IND did not show significant differences in traits such as days from seeding to the first heading date, flag leaf length, culm diameter at the basal internode, panicle length, or number of spikelets per panicle, but they were significantly different from TEJ in these traits (Figure 2). This may be related to both TRJ and IND adapting to higher temperature environments [12,30].

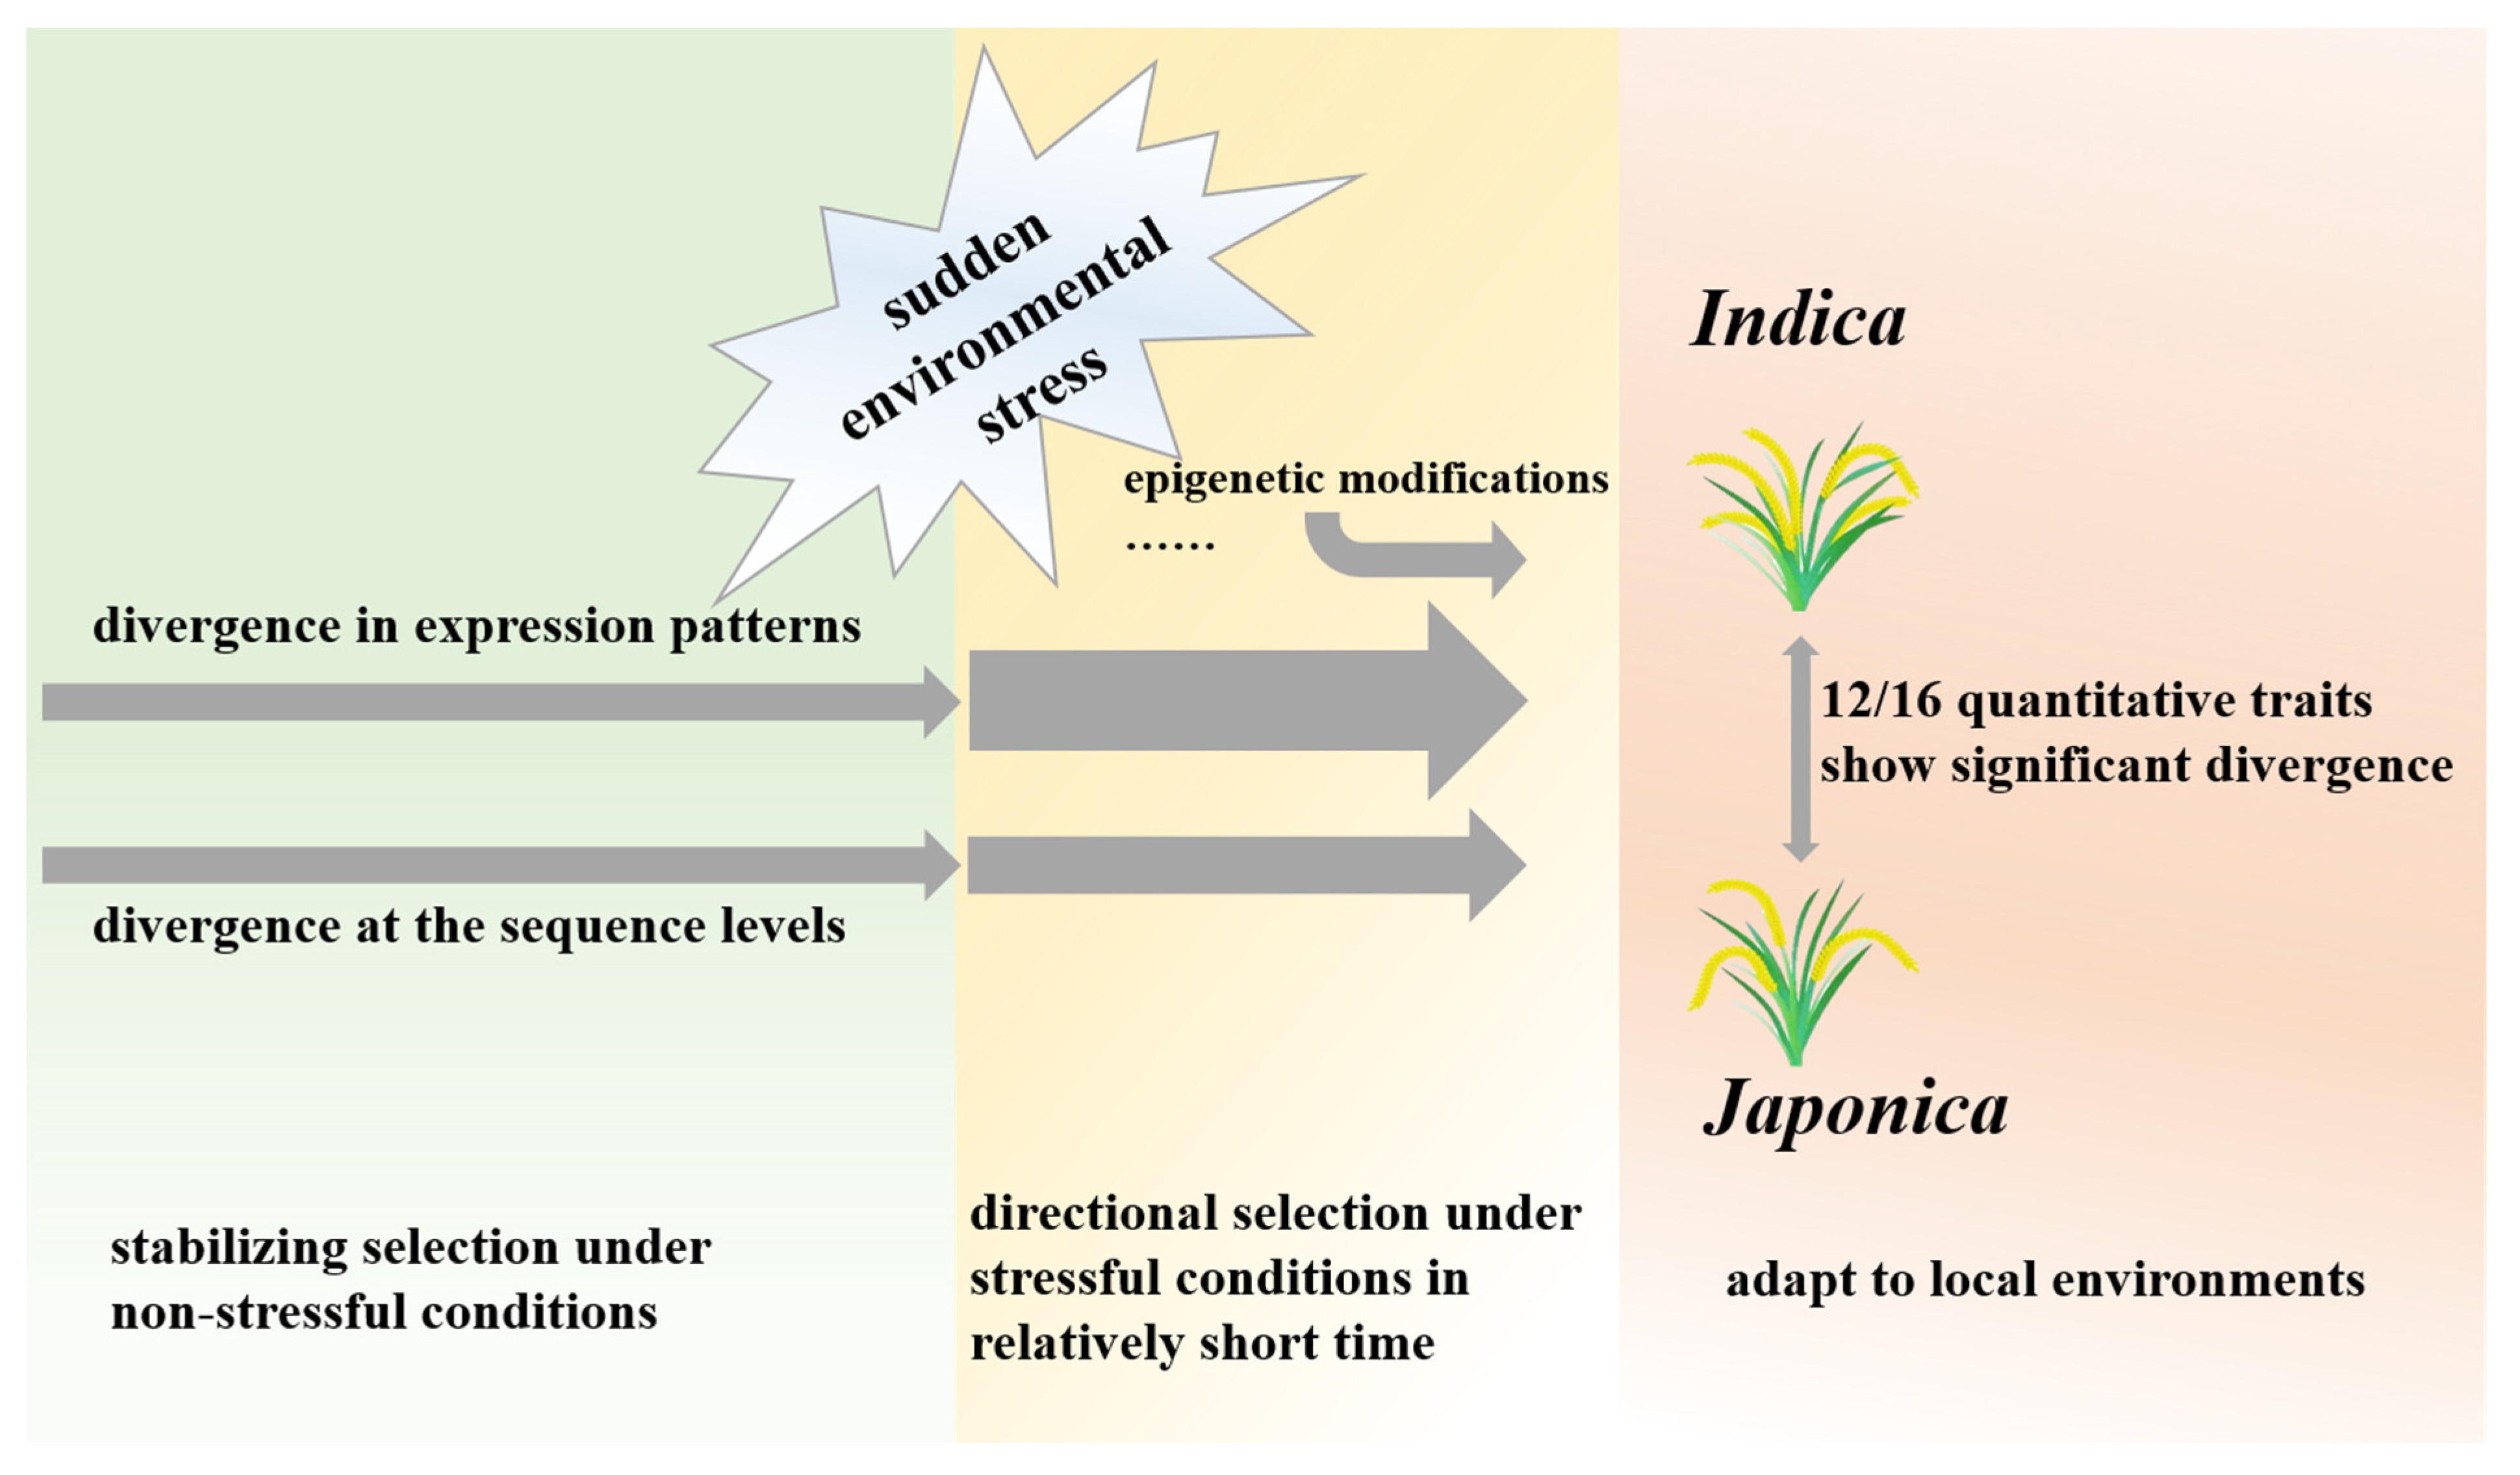
4.2. Divergence between Indica and Japonica Rice at Both DNA Sequence and Expression Levels

It is well known that divergence across the entire genome among species or populations exists at both sequence and expression levels. This variation depends on the species itself and various factors behind the divergence [31,32]. Previous studies have shown that expression variation plays a crucial role in adaptive evolution and speciation processes [33,34]. For instance, King and Wilson (1975) proposed that the significant differences between humans and chimpanzees is not caused by the changes in protein-coding genes but by the alterations in gene expression regulatory mechanisms [1]. In a speciation study of two crow species (Corvus [corone] corone and Corvus [corone] cornix), there was almost no difference in 25 intron sequences examined between them, but significant differences were observed at the expression level, indicating the significant effects of expression variation on species divergence [34]. Furthermore, Martinez-Fernandez et al. (2010) found that the rate of divergence between two snail ecotypes at the sequence, expression, and protein levels was 3%, 4%, and 7%, respectively, suggesting that the degree of species divergence is least obvious at the sequence level, most pronounced at the phenotypic level, and intermediate at the expression regulation level [35]. Therefore, changes in gene expression patterns can lead to the variation of morphological traits during evolution.
In this study (Figure 5), the phylogenetic trees based on the whole-genome sequences and the gene expression in different tissues were consistent in topologies. This indicates that the divergence in genome expression is subjected to stabilizing selection under non-stressful conditions, and the evolution trends in expression variation levels are consistent with sequence variation levels [9]. However, when populations are subjected to environmental stress, epigenetic modifications (e.g., DNA methylation) and gene expression can be changed, leading to faster adaptation to new growth environments compared to sequence mutations [36,37,38,39]. Changes in the expression of one gene can affect other related genes, so genome-wide expression regulation might evolve more rapidly than nucleotide variation [34,39]. By far the most domestication genes identified are transcription factors, suggesting the importance of expression regulation in the domestication process [3,40,41,42]. This study further confirms that changes in whole-genome expression regulation play a crucial role in the process of divergence between the two subspecies of rice.

5. Conclusions

Rice (O. sativa L.) is a globally significant cereal crop encompassing two distinct subspecies, Indica and Japonica, known for their evident phenotypic and population genetic divergence. In this study, we examined 16 quantitative traits across 138 plants under identical conditions, revealing significant disparities between the two subspecies, including key traits like ligule length and plant density. Notably, some traits, such as seeding to the first heading date, exhibited consistency between tropical japonica and the Indica subspecies, suggesting potential adaptations of tropical japonica to higher temperature environments. To investigate the genetic basis of this divergence, we utilized phylogenetic analysis and principal component analysis on resequencing data, affirming the clear divergence between Indica and Japonica. Furthermore, the neighbor-joining trees based on the expression quantity of effectively expressed genes across various tissues also revealed a consistent pattern with the results based on the resequencing data. We also identified some DEGs between the Indica and Japonica rice across five tissues. These findings imply that genome-wide expression divergence is influenced by stabilizing selection under non-stressful conditions, mirroring the patterns of sequence variation. In summary, our study confirmed the significant role played by changes in genome-wide expression patterns in driving the divergence between the Indica and Japonica subspecies of rice. These insights into both phenotypic and genomic distinctions provide valuable contributions to our understanding of rice diversity and adaptation.

Supplementary Materials

The following supporting information can be downloaded at: https://www.mdpi.com/article/10.3390/genes14101971/s1, Figure S1: Gene ontology (GO) enrichment of the DEGs between Indica and Japonica rice in PH tissue; Table S1: Information of 95 rice accessions used in this study.

Author Contributions

M.W. designed the project.; M.W. and Z.Z. supervised the research.; M.W., W.H. and D.F. obtained and analyzed the resequencing and RNA-seq data.; D.L., S.C., Y.Y. and M.W. conducted the planting and phenotyping.; L.H. and Y.K. participated the discussion and gave guidance on writing the manuscript.; M.W. and Z.Z. wrote the manuscript. All authors have read and agreed to the published version of the manuscript.

Funding

This work was supported by the National Natural Science Foundation of China (32260058), the Jiangxi Provincial Natural Science Foundation (20232BAB215008), and the Science and Technology Project of Jiangxi Provincial Department of Education (GJJ210412).

Institutional Review Board Statement

We confirm that we have read the Journal’s position on issues involved in ethical publication and affirm that this report is consistent with those guidelines.

Informed Consent Statement

Not applicable.

Data Availability Statement

Not applicable.

Acknowledgments

We would like to thank all members of Zhang’s group for their technical assistance and valuable discussions. We would also like to thank Song Ge (The Institute of Botany, Chinese Academy of Sciences) and all members of Ge’s laboratory.

Conflicts of Interest

The authors declare no conflict of interest.

References

  1. King, M.C.; Wilson, A.C. Evolution at two levels in humans and chimpanzees. Science 1975, 188, 107–116. [Google Scholar] [CrossRef]
  2. Wilson, A.C.; Maxson, L.R.; Sarich, V.M. Two types of molecular evolution evidence from studies of interspecific hybridization. Proc. Natl. Acad. Sci. USA 1974, 71, 2843–2847. [Google Scholar] [CrossRef] [PubMed]
  3. Doebley, J.F.; Gaut, B.S.; Smith, B.D. The molecular genetics of crop domestication. Cell 2006, 127, 1309–1321. [Google Scholar] [CrossRef] [PubMed]
  4. Doebley, J.; Stec, A.; Hubbard, L. The evolution of apical dominance in maize. Nature 1997, 386, 485–488. [Google Scholar] [CrossRef] [PubMed]
  5. Konishi, S.; Izawa, T.; Lin, S.Y.; Ebana, K.; Fukuta, Y.; Sasaki, T.; Yano, M. An SNP caused loss of seed shattering during rice domestication. Science 2006, 312, 1392–1396. [Google Scholar] [CrossRef]
  6. Li, C.B.; Zhou, A.L.; Sang, T. Rice domestication by reducing shattering. Science 2006, 311, 1936–1939. [Google Scholar] [CrossRef]
  7. Purugganan, M.D.; Fuller, D.Q. The nature of selection during plant domestication. Nature 2009, 457, 843–848. [Google Scholar] [CrossRef]
  8. Romero, I.G.; Ruvinsky, I.; Gilad, Y. Comparative studies of gene expression and the evolution of gene regulation. Nat. Rev. Genet. 2012, 13, 505–516. [Google Scholar] [CrossRef] [PubMed]
  9. Groen, S.C.; Calic, I.; Joly-Lopez, Z.; Platts, A.E.; Choi, J.Y.; Natividad, M.; Dorph, K.; Mauck, W.M.; Bracken, B.; Cabral, C.L.U.; et al. The strength and pattern of natural selection on gene expression in rice. Nature 2020, 578, 572–576. [Google Scholar] [CrossRef]
  10. Khush, G.S. Origin, dispersal, cultivation and variation of rice. Plant Mol. Biol. 1997, 35, 25–34. [Google Scholar] [CrossRef]
  11. Sang, T.; Ge, S. Genetics and phylogenetics of rice domestication. Curr. Opin. Genet. Dev. 2007, 17, 533–538. [Google Scholar] [CrossRef]
  12. Wang, C.H.; Zheng, X.M.; Xu, Q.; Yuan, X.P.; Huang, L.; Zhou, H.F.; Wei, X.H.; Ge, S. Genetic diversity and classification of Oryza sativa with emphasis on Chinese rice germplasm. Heredity 2014, 112, 489–496. [Google Scholar] [CrossRef]
  13. Vaughan, D.A.; Lu, B.R.; Tomooka, N. The evolving story of rice evolution. Plant Sci. 2008, 174, 394–408. [Google Scholar] [CrossRef]
  14. Kovach, M.J.; Sweeney, M.T.; McCouch, S.R. New insights into the history of rice domestication. Trends Genet. 2007, 23, 578–587. [Google Scholar] [CrossRef] [PubMed]
  15. Bioversity International; International Rice Research Institute; WARDA. Descriptors for Wild and Cultivated Rice (Oryza spp.); Bioversity International: Rome, Italy, 2007. [Google Scholar]
  16. Wang, M.X.; Jing, C.Y.; Wang, X.H.; Cai, Z.; Zhou, L.; Geng, M.F.; Han, J.D.; Guo, J.; Zhang, F.M.; Ge, S. Genomic landscape of parallel domestication of upland rice and its implications. J. Syst. Evol. 2021, 59, 229–239. [Google Scholar] [CrossRef]
  17. Li, J.Y.; Wang, J.; Zeigler, R.S. The 3000 rice genomes project: New opportunities and challenges for future rice research. GigaScience 2014, 3, 8. [Google Scholar] [CrossRef] [PubMed]
  18. Li, H.; Durbin, R. Fast and accurate short read alignment with Burrows-Wheeler transform. Bioinformatics 2009, 25, 1754–1760. [Google Scholar] [CrossRef]
  19. Danecek, P.; Auton, A.; Abecasis, G.; Albers, C.A.; Banks, E.; DePristo, M.A.; Handsaker, R.E.; Lunter, G.; Marth, G.T.; Sherry, S.T.; et al. The variant call format and VCFtools. Bioinformatics 2011, 27, 2156–2158. [Google Scholar] [CrossRef] [PubMed]
  20. Yang, J.; Lee, S.H.; Goddard, M.E.; Visscher, P.M. GCTA: A tool for genome-wide complex trait analysis. Am. J. Hum. Genet. 2011, 88, 76–82. [Google Scholar] [CrossRef]
  21. Tamura, K.; Stecher, G.; Peterson, D.; Filipski, A.; Kumar, S. MEGA6: Molecular evolutionary genetics analysis version 6.0. Mol. Biol. Evol. 2013, 30, 2725–2729. [Google Scholar] [CrossRef]
  22. Kim, D.; Pertea, G.; Trapnell, C.; Pimentel, H.; Kelley, R.; Salzberg, S.L. TopHat2: Accurate alignment of transcriptomes in the presence of insertions, deletions and gene fusions. Genome Biol. 2013, 14, R36. [Google Scholar] [CrossRef]
  23. Anders, S.; Pyl, P.T.; Huber, W. HTSeq-a python framework to work with high-throughput sequencing data. Bioinformatics 2015, 31, 166–169. [Google Scholar] [CrossRef] [PubMed]
  24. Chen, Y.; Lun, A.T.L.; Smyth, G.K. Differential expression analysis of complex RNA-seq experiments using edgeR. In Statistical Analysis of Next Generation Sequence Data; Datta, S., Nettleton, D., Eds.; Springer: New York, NY, USA, 2014; pp. 25–50. [Google Scholar]
  25. Felsenstein, J. PHYLIP (Phylogeny Inference Package), version 3.6; University of Washington: Seattle, WA, USA, 2005; Available online: https://phylipweb.github.io/phylip/ (accessed on 1 January 2021).
  26. Stebbins, G. Variation and Evolution in Plants; Columbia University Press: New York, NY, USA, 1950. [Google Scholar]
  27. Futuyma, D.J. Evolution, 3rd ed.; Sinauer Associates: Sunderland, MA, USA, 2013. [Google Scholar]
  28. Wu, W.X.; Zheng, X.M.; Lu, G.W.; Zhong, Z.Z.; Gao, H.; Chen, L.P.; Wu, C.Y.; Wang, H.J.; Wang, Q.; Zhou, K.N.; et al. Association of functional nucleotide polymorphisms at DTH2 with the northward expansion of rice cultivation in Asia. Proc. Natl. Acad. Sci. USA 2013, 110, 2775–2780. [Google Scholar] [CrossRef] [PubMed]
  29. Shin, D.; Lee, S.; Kim, T.H.; Lee, J.H.; Park, J.; Lee, J.; Lee, J.Y.; Cho, L.H.; Choi, J.Y.; Lee, W.; et al. Natural variations at the Stay-Green gene promoter control lifespan and yield in rice cultivars. Nat. Commun. 2020, 11, 2819. [Google Scholar] [CrossRef] [PubMed]
  30. Garris, A.J.; Tai, T.H.; Coburn, J.; Kresovich, S.; McCouch, S. Genetic structure and diversity in Oryza sativa L. Genetics 2005, 169, 1631–1638. [Google Scholar] [CrossRef]
  31. Bolnick, D.I.; Barrett, R.D.H.; Oke, K.B.; Rennison, D.J.; Stuart, Y.E. (Non)Parallel evolution. Annu. Rev. Ecol. Evol. Syst. 2018, 49, 303–330. [Google Scholar] [CrossRef]
  32. Shibata, Y.; Sheffield, N.C.; Fedrigo, O.; Babbitt, C.C.; Wortham, M.; Tewari, A.K.; London, D.; Song, L.; Lee, B.K.; Iyer, V.R.; et al. Extensive evolutionary changes in regulatory element activity during human origins are associated with altered gene expression and positive selection. PLoS Genet. 2012, 8, e1002789. [Google Scholar] [CrossRef]
  33. Guo, J.; Liu, R.; Huang, L.; Zheng, X.M.; Liu, P.L.; Du, Y.S.; Cai, Z.; Zhou, L.; Wei, X.H.; Zhang, F.M.; et al. Widespread and adaptive alterations in genome-wide gene expression associated with ecological divergence of two Oryza species. Mol. Biol. Evol. 2016, 33, 62–78. [Google Scholar] [CrossRef]
  34. Wolf, J.B.W.; Bayer, T.; Haubold, B.; Schilhabel, M.; Rosenstiel, P.; Tautz, D. Nucleotide divergence vs. gene expression differentiation: Comparative transcriptome sequencing in natural isolates from the carrion crow and its hybrid zone with the hooded crow. Mol. Ecol. 2010, 19, 162–175. [Google Scholar] [CrossRef]
  35. Martinez-Fernandez, M.; Bernatchez, L.; Rolan-Alvarez, E.; Quesada, H. Insights into the role of differential gene expression on the ecological adaptation of the snail Littorina saxatilis. BMC Evol. Biol. 2010, 10, 356. [Google Scholar] [CrossRef]
  36. Nosil, P. Ecological Speciation; Oxford University Press: Oxford, UK, 2012. [Google Scholar]
  37. Seymour, D.K.; Koenig, D.; Hagmann, J.; Becker, C.; Weigel, D. Evolution of DNA methylation patterns in the Brassicaceae is driven by differences in genome organization. PLoS Genet. 2014, 10, e1004785. [Google Scholar] [CrossRef]
  38. Yu, X.L.; Wei, P.; Zhao, S.Q.; Chen, Z.Y.F.; Li, X.Z.; Zhang, W.C.; Liu, C.L.; Yang, Y.J.; Li, X.Y.; Liu, X. Population transcriptomics uncover the relative roles of positive selection and differential expression in Batrachium bungei adaptation to the Qinghai–Tibetan plateau. Plant Cell Rep. 2023, 42, 879–893. [Google Scholar] [CrossRef] [PubMed]
  39. Kuo, H.C.; Yao, C.T.; Liao, B.Y.; Weng, M.P.; Dong, F.; Hsu, Y.C.; Hung, C.M. Weak gene–gene interaction facilitates the evolution of gene expression plasticity. BMC Biol. 2023, 21, 57. [Google Scholar] [CrossRef] [PubMed]
  40. Jing, C.Y.; Zhang, F.M.; Wang, X.H.; Wang, M.X.; Zhou, L.; Cai, Z.; Han, J.D.; Geng, M.F.; Yu, W.H.; Jiao, Z.H.; et al. Multiple domestications of Asian rice. Nat. Plants 2023, 9, 1221–1235. [Google Scholar] [CrossRef] [PubMed]
  41. Pickersgill, B. Parallel vs. convergent evolution in domestication and diversification of crops in the Americas. Front. Ecol. Evol. 2018, 6, 56. [Google Scholar] [CrossRef]
  42. Martinez-Ainsworth, N.E.; Tenaillon, M.I. Superheroes and masterminds of plant domestication. Comptes Rendus Biol. 2016, 339, 268–273. [Google Scholar] [CrossRef]
Figure 1. The apex of panicle in Indica and Japonica (TEJ and TRJ) rice.
Genes 14 01971 g001
Figure 2. LSD pairwise comparisons among rice groups of 12 quantitative traits that exhibited significant divergence between subspecies. * means p-values < 0.05, ** means p-values < 0.01; the * in red indicates that the measured value of a trait in the horizontal population is higher than that in the vertical population.
Genes 14 01971 g002
Figure 3. Analyses of population genetic divergence of all 95 rice accessions based on the total SNPs of the resequencing data. (A) Principal components analysis (PCA). (B) Neighbor-joining (NJ) tree.
Genes 14 01971 g003
Figure 4. NJ trees based on the expression quantity of the effectively expressed genes in five tissues: leaves at the seedling stage (S), flag leaves (LH) and panicles at the heading stage (PH), flag leaves (LM) and panicles at the milk stage (PM).
Genes 14 01971 g004
Figure 5. The variations at both DNA sequence and expression levels behind the phenotypic divergence of the two rice subspecies.
Genes 14 01971 g005
Table 1. Information of the samples used in the phenotype observation.
No.Accession No.Sample OriginBiological Repetition
TEJ 1 **680Zhejiang8
TEJ 2IRGC2545Japan6
TEJ 10 **20708Shanxi8
TEJ 11 **20721Liaoning6
TEJ 12 **20876Jiangsu7
TEJ 1421773Yunnan4
TEJ 27 *49357Guangdong8
TEJ 28IRGC55457Korea9
TEJ 30NipponbareJapan8
TRJ 3IRGC3782Philippines2
TRJ 15 **22128Guizhou5
TRJ 22 **32447Yunnan6
TRJ 26IRGC43675Indonesia8
IND 7IRGC9147Indonesia8
IND 13 **21327Hubei7
IND 16 **22233Guizhou7
IND 17 **24380Yunnan6
IND 19IRGC27748Thailand8
IND 24 **36467Guangxi4
IND 25 **41949Hainan5
IND 29 **60993Jiangxi8
Total 138
Note: ** Accessions also used in RNA-seq and resequencing; * Accessions also used in resequencing.
Table 2. The phenotypic diversity and intergroup difference for 16 quantitative traits.
Quantitative TraitsCV (Standard Deviation/Mean)Mean ± Standard Deviation (SD)
JaponicaIndicaJaponicaIndica
TEJTRJTEJTRJ
Days from seeding to first heading date (d)0.200.130.26107.68 ± 21.20 a122.24 ± 15.66 b130.36 ± 33.59 b
Ligule length (cm)0.460.410.331.06 ± 0.49 a1.81 ± 0.74 b2.32 ± 0.75 c
Flag leaf length (cm)0.350.290.4121.40 ± 7.53 a31.71 ± 9.19 b30.87 ± 12.63 b
Flag leaf width (cm)0.280.220.171.02 ± 0.28 a1.55 ± 0.34 b1.27 ± 0.22 c
Flag leaf attitude (°)0.630.540.5821.89 ± 13.75 a71.00 ± 38.37 b26.19 ± 15.17 a
Culm habit (°)0.650.940.5514.57 ± 9.42 a11.33 ± 10.60 a21.36 ± 11.78 b
Culm diameter at basal internode (cm)0.370.490.460.60 ± 0.23 a0.87 ± 0.42 b0.92 ± 0.42 b
Culm length (cm)0.330.160.2291.59 ± 30.37 a133.53 ± 21.26 b103.82 ± 23.22 c
Attitude of flowering panicle branches (°)6.785.441.09 ± 7.370.00 ± 0.000.57 ± 3.09
Attitude of seed setting panicle branches (°)3.711.922.412.17 ± 8.074.67 ± 8.964.50 ± 10.85
Anther length (cm)0.270.250.270.15 ± 0.04 0.16 ± 0.04 0.16 ± 0.04
Peduncle length (cm)0.870.731.385.48 ± 4.79 a4.58 ± 3.34 ab2.76 ± 3.80 b
Panicle length (cm)0.320.250.1517.54 ± 5.55 a25.92 ± 6.39 b23.39 ± 3.40 b
Number of spikelets per panicle0.630.440.3667.07 ± 42.20 a138.38 ± 60.37 b122.47 ± 44.63 b
Awn length (cm)2.341.342.030.40 ± 0.92 a1.12 ± 1.50 b0.27 ± 0.55 a
Number of panicles per plant0.490.470.525.93 ± 2.934.40 ± 2.065.53 ± 2.87
Note: 1. The traits highlighted in italics are those with non-significant p-values in the ANOVA analysis. 2. In multiple mean comparisons, traits with the same letter label are not significantly different, while traits with different letter labels are significantly different.
Table 3. Number of DEGs between Indica and Japonica rice.
TissueEEGsDEGsDEGs Total
(% of EEGs)
Up-RegulatedDown-Regulated
S23,477232010063326 (14.2%)
LH22,91717279192646 (11.5%)
PH26,406188010362916 (11.0%)
LM23,377205215613613 (15.5%)
PM25,26016997992498 (9.9%)
Mean24,287193610643000 (12.4%)
Note: EEGs: effectively expressed genes; DEGs: differentially expressed genes.
Disclaimer/Publisher’s Note: The statements, opinions and data contained in all publications are solely those of the individual author(s) and contributor(s) and not of MDPI and/or the editor(s). MDPI and/or the editor(s) disclaim responsibility for any injury to people or property resulting from any ideas, methods, instructions or products referred to in the content.

