
Insights from a Computational-Based Approach for Analyzing Autophagy Genes across Human Cancers

 , , , and
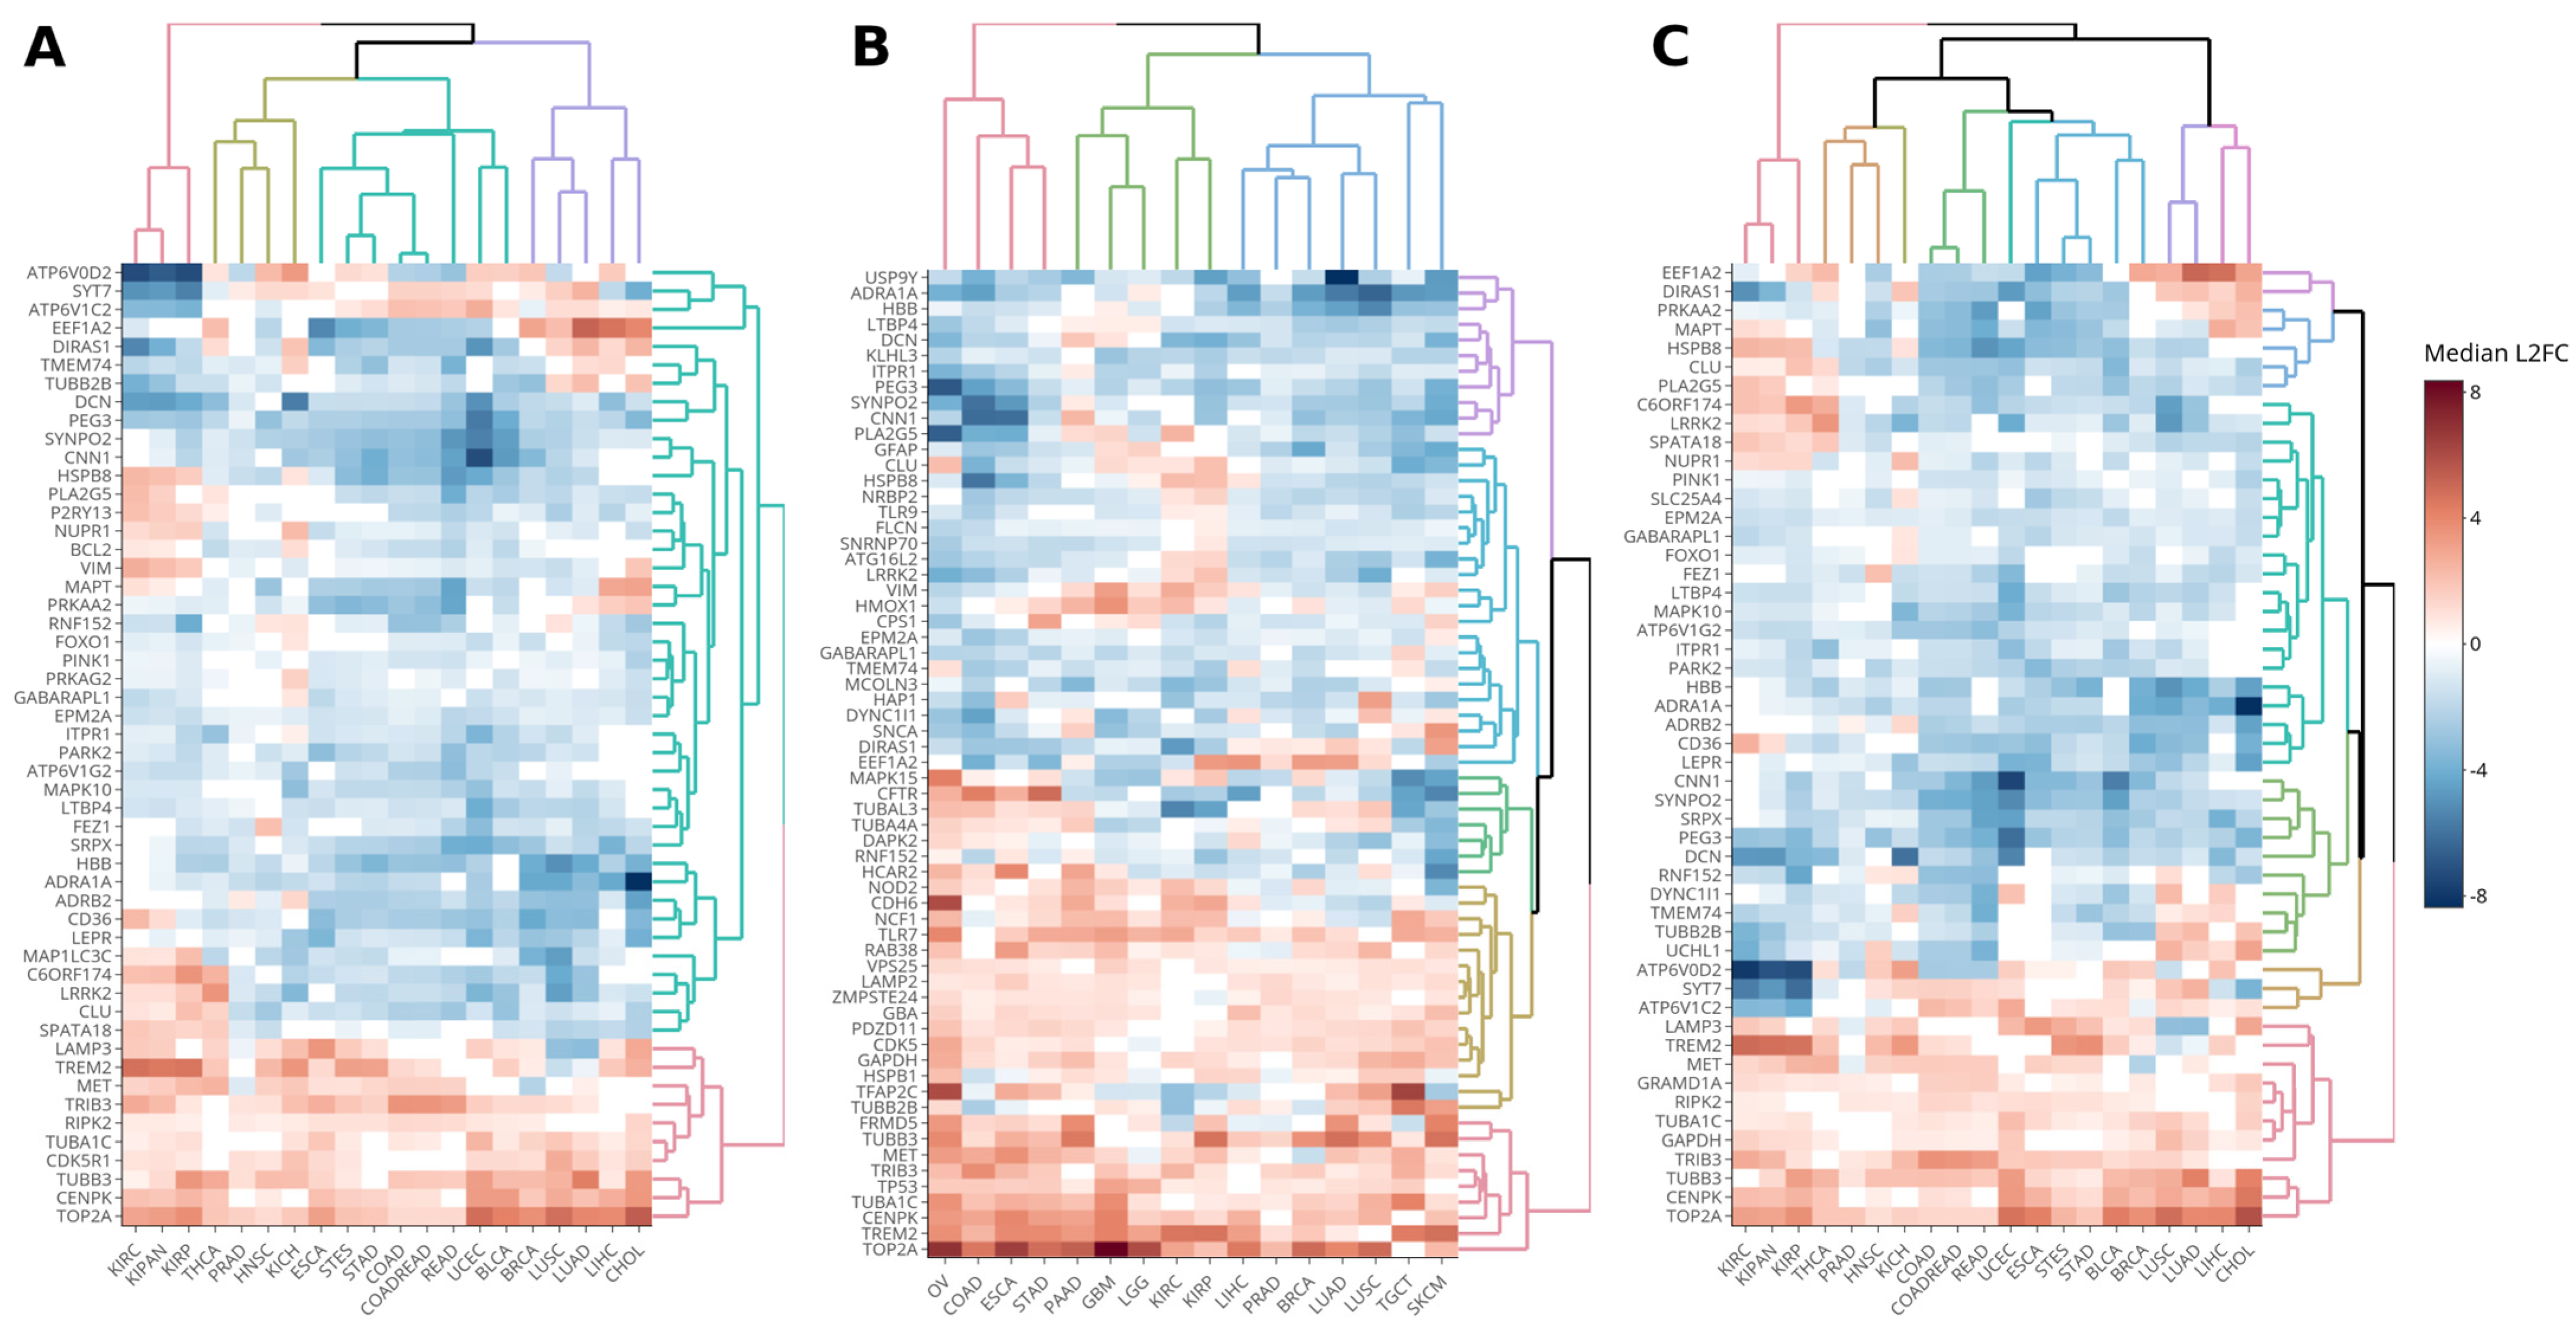
Abstract
:1. Introduction
2. Methods
2.1. Study Databases
2.2. Analytical Approaches for Evaluating Autophagy-Related Genes in Tumors
2.3. Tumor Clusterization Based on Autophagy-Related Genes
3. Results and Discussion
Autophagy-Related Genes Differentially Expressed in Solid Tumors
- TOP2A (topoisomerase II α) is an enzyme involved in DNA topology rearrangements, and its aberrant expression is linked to various cancer types. It serves as a target for anticancer drugs like Doxorubicin and etoposide, which have been associated with autophagy promotion [16,17]. Amplification and deletion of TOP2A are associated with both sensitivity and resistance to topoII-inhibitor-based chemotherapy [18].
- CENPK (centromere protein K) is a component of the centromeric complex and has been implicated in the progression of ovarian, breast, hepatocellular carcinoma, bladder, and lung adenocarcinoma [19]. Although this gene has not been studied in an autophagy context using tumor samples, it was included in this study as it belongs to the autophagy network according to the Kumar et al. (2010) study [20]. Moreover, CENPK is overexpressed in cancers promoting proliferation through the PI3K-AKT signaling pathway, a pathway with a key regulatory role in autophagy [21].
- TUBB3 (Tubulin β 3 Class III) is associated with increased chemoresistance and poor prognosis in several cancers, including NSCLC, ovarian cancer, gastric cancer, breast cancer, uterine serous carcinoma, glioblastoma, colorectal cancer, and pancreatic ductal adenocarcinoma. It interacts with LC3, a key player in autophagosome formation [22].
- TRIB3 (Tribbles Pseudokinase 3) overexpression inhibits the AKT-mTORC1 axis and autophagy-mediated cancer cell death [23]. TRIB3 upregulation induced by ABTL0812, an anticancer agent under clinical development that induces TRIB3 upregulation and potentiates common chemotherapy regimens in adenocarcinoma and squamous non-small cell lung cancer [24].
- MET is a receptor tyrosine kinase that activates the mTOR signaling pathway, regulating cell proliferation, apoptosis, autophagy, invasion, and tumorigenesis. The ubiquitination and degradation of MET can inhibit the proliferation, migration, and invasion of gastric cancer cells and induce apoptosis [25].
- TREM2 is a myeloid receptor expressed by tumor-infiltrating macrophages, commonly found within the tumor microenvironment of human cancers, and inversely correlated with prolonged survival in colorectal carcinoma and triple-negative breast cancer. TREM2 deficiency delays tumor growth in mice [26]. Moreover, it was observed that TREM2 regulates autophagy in tumor-associated microglia [27,28].
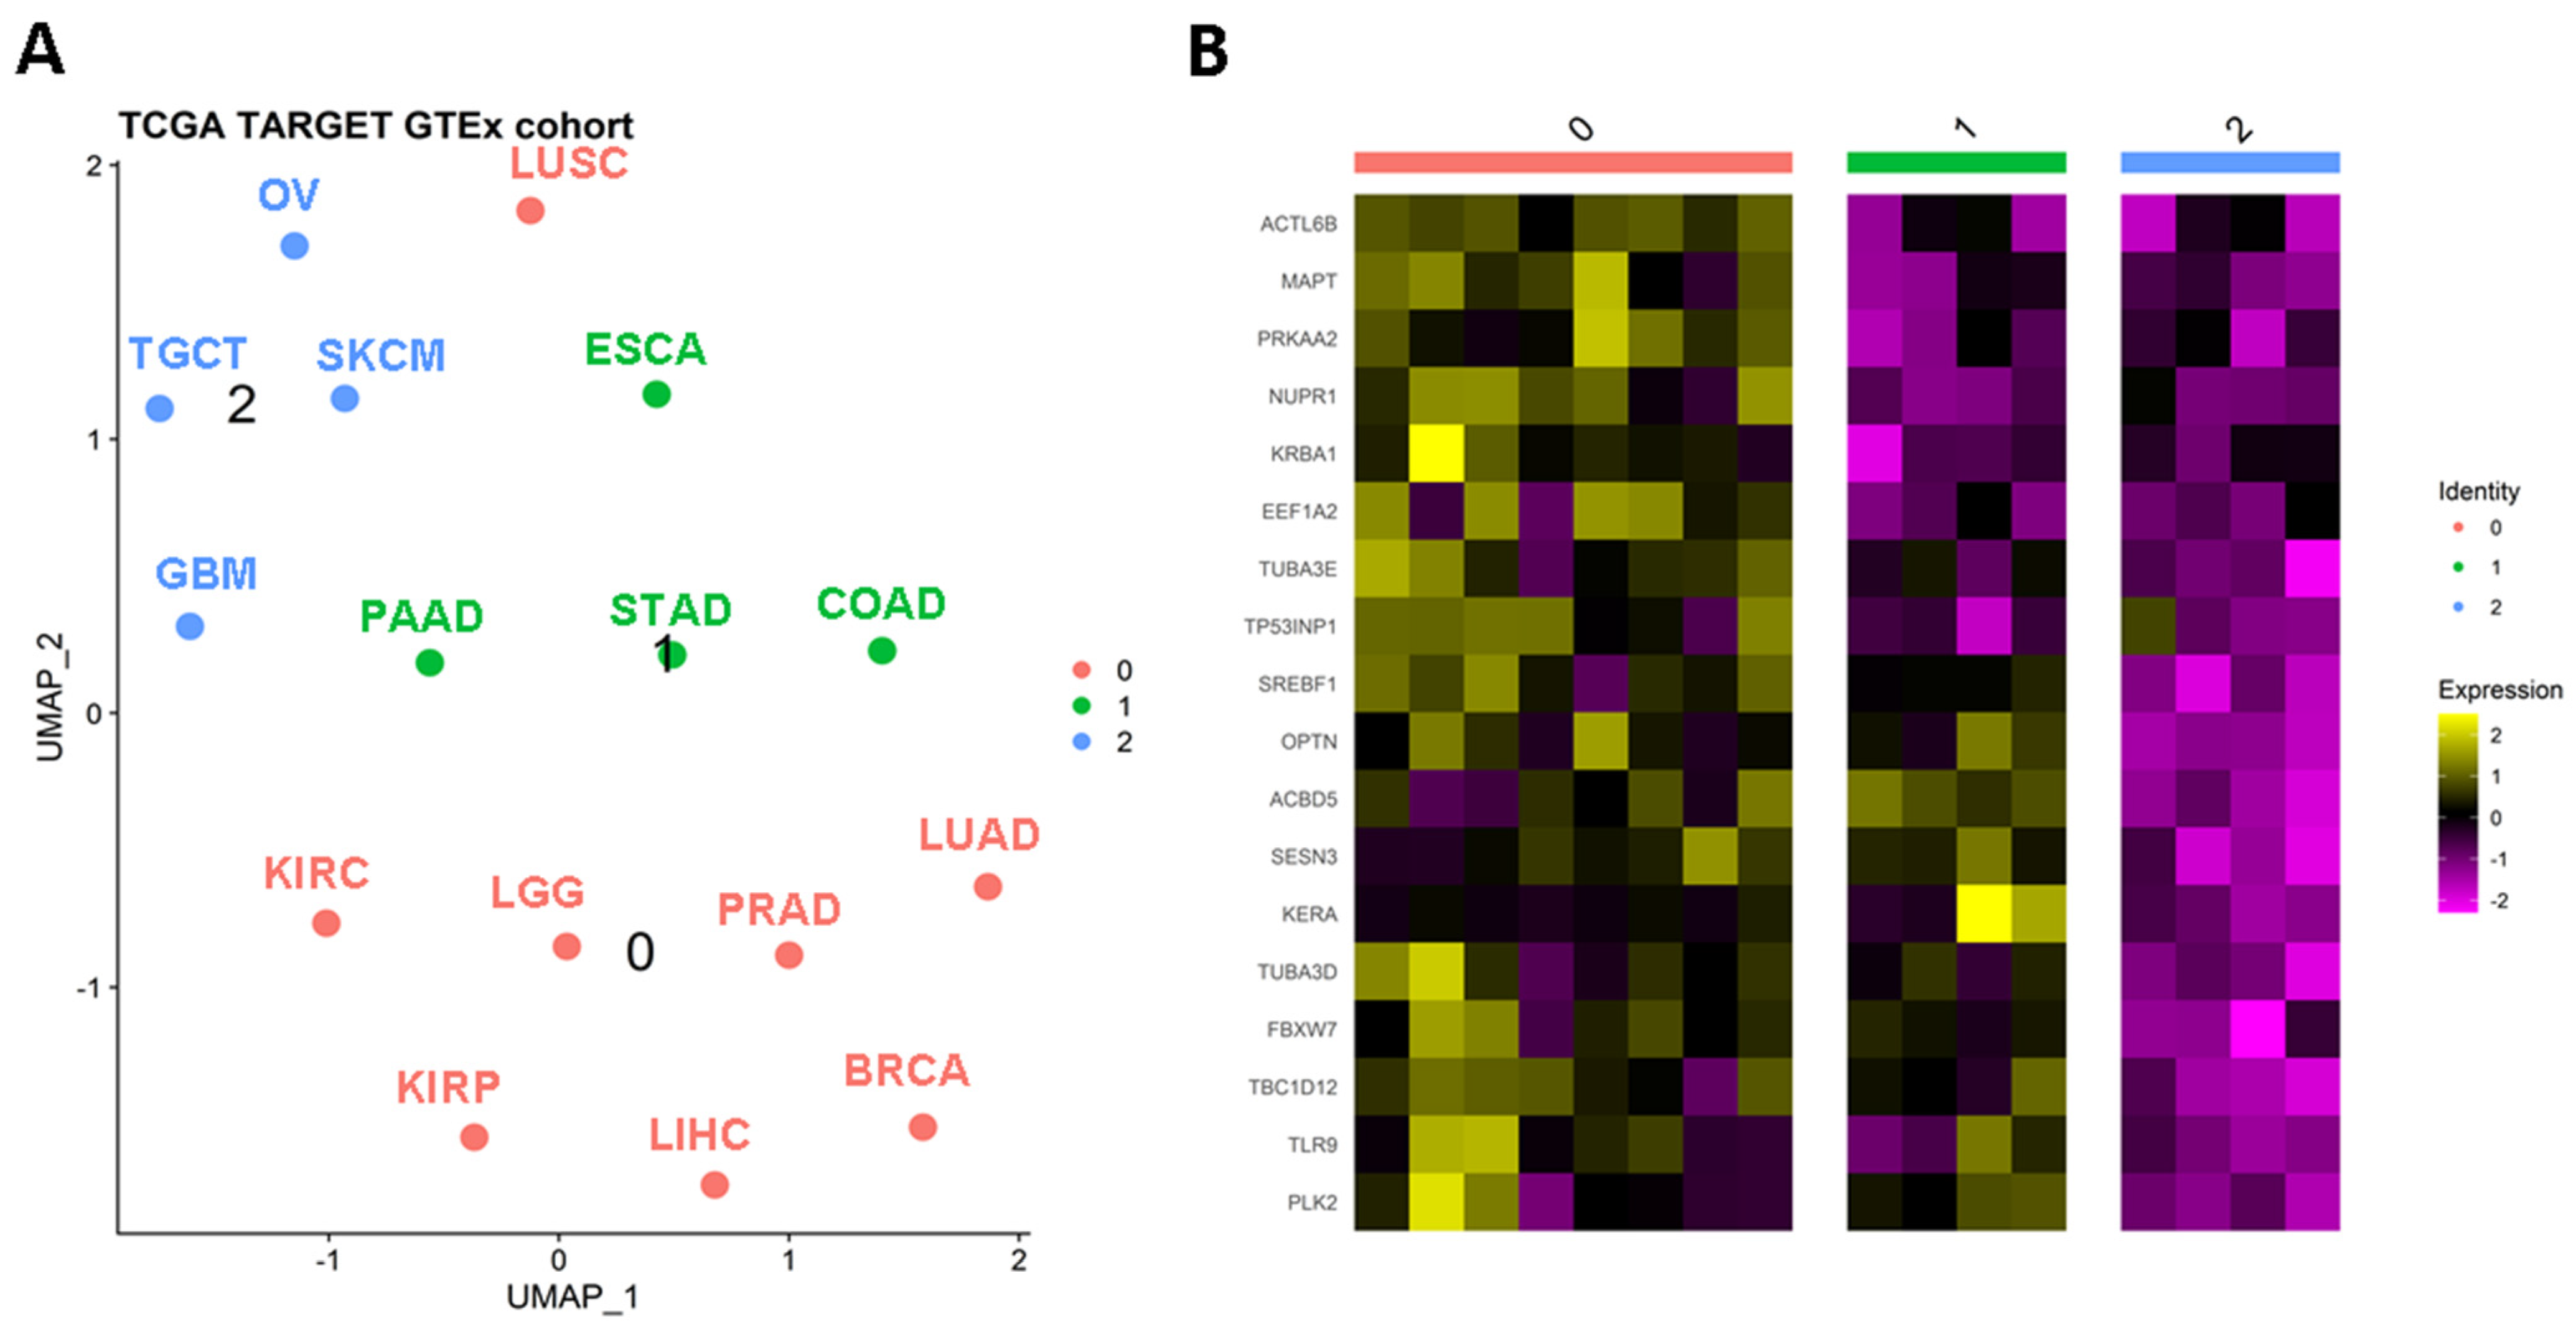
4. Clustering Solid Tumors Based on Autophagy-Related Genes
4.1. Autophagy Regulators Specific to Cluster 0
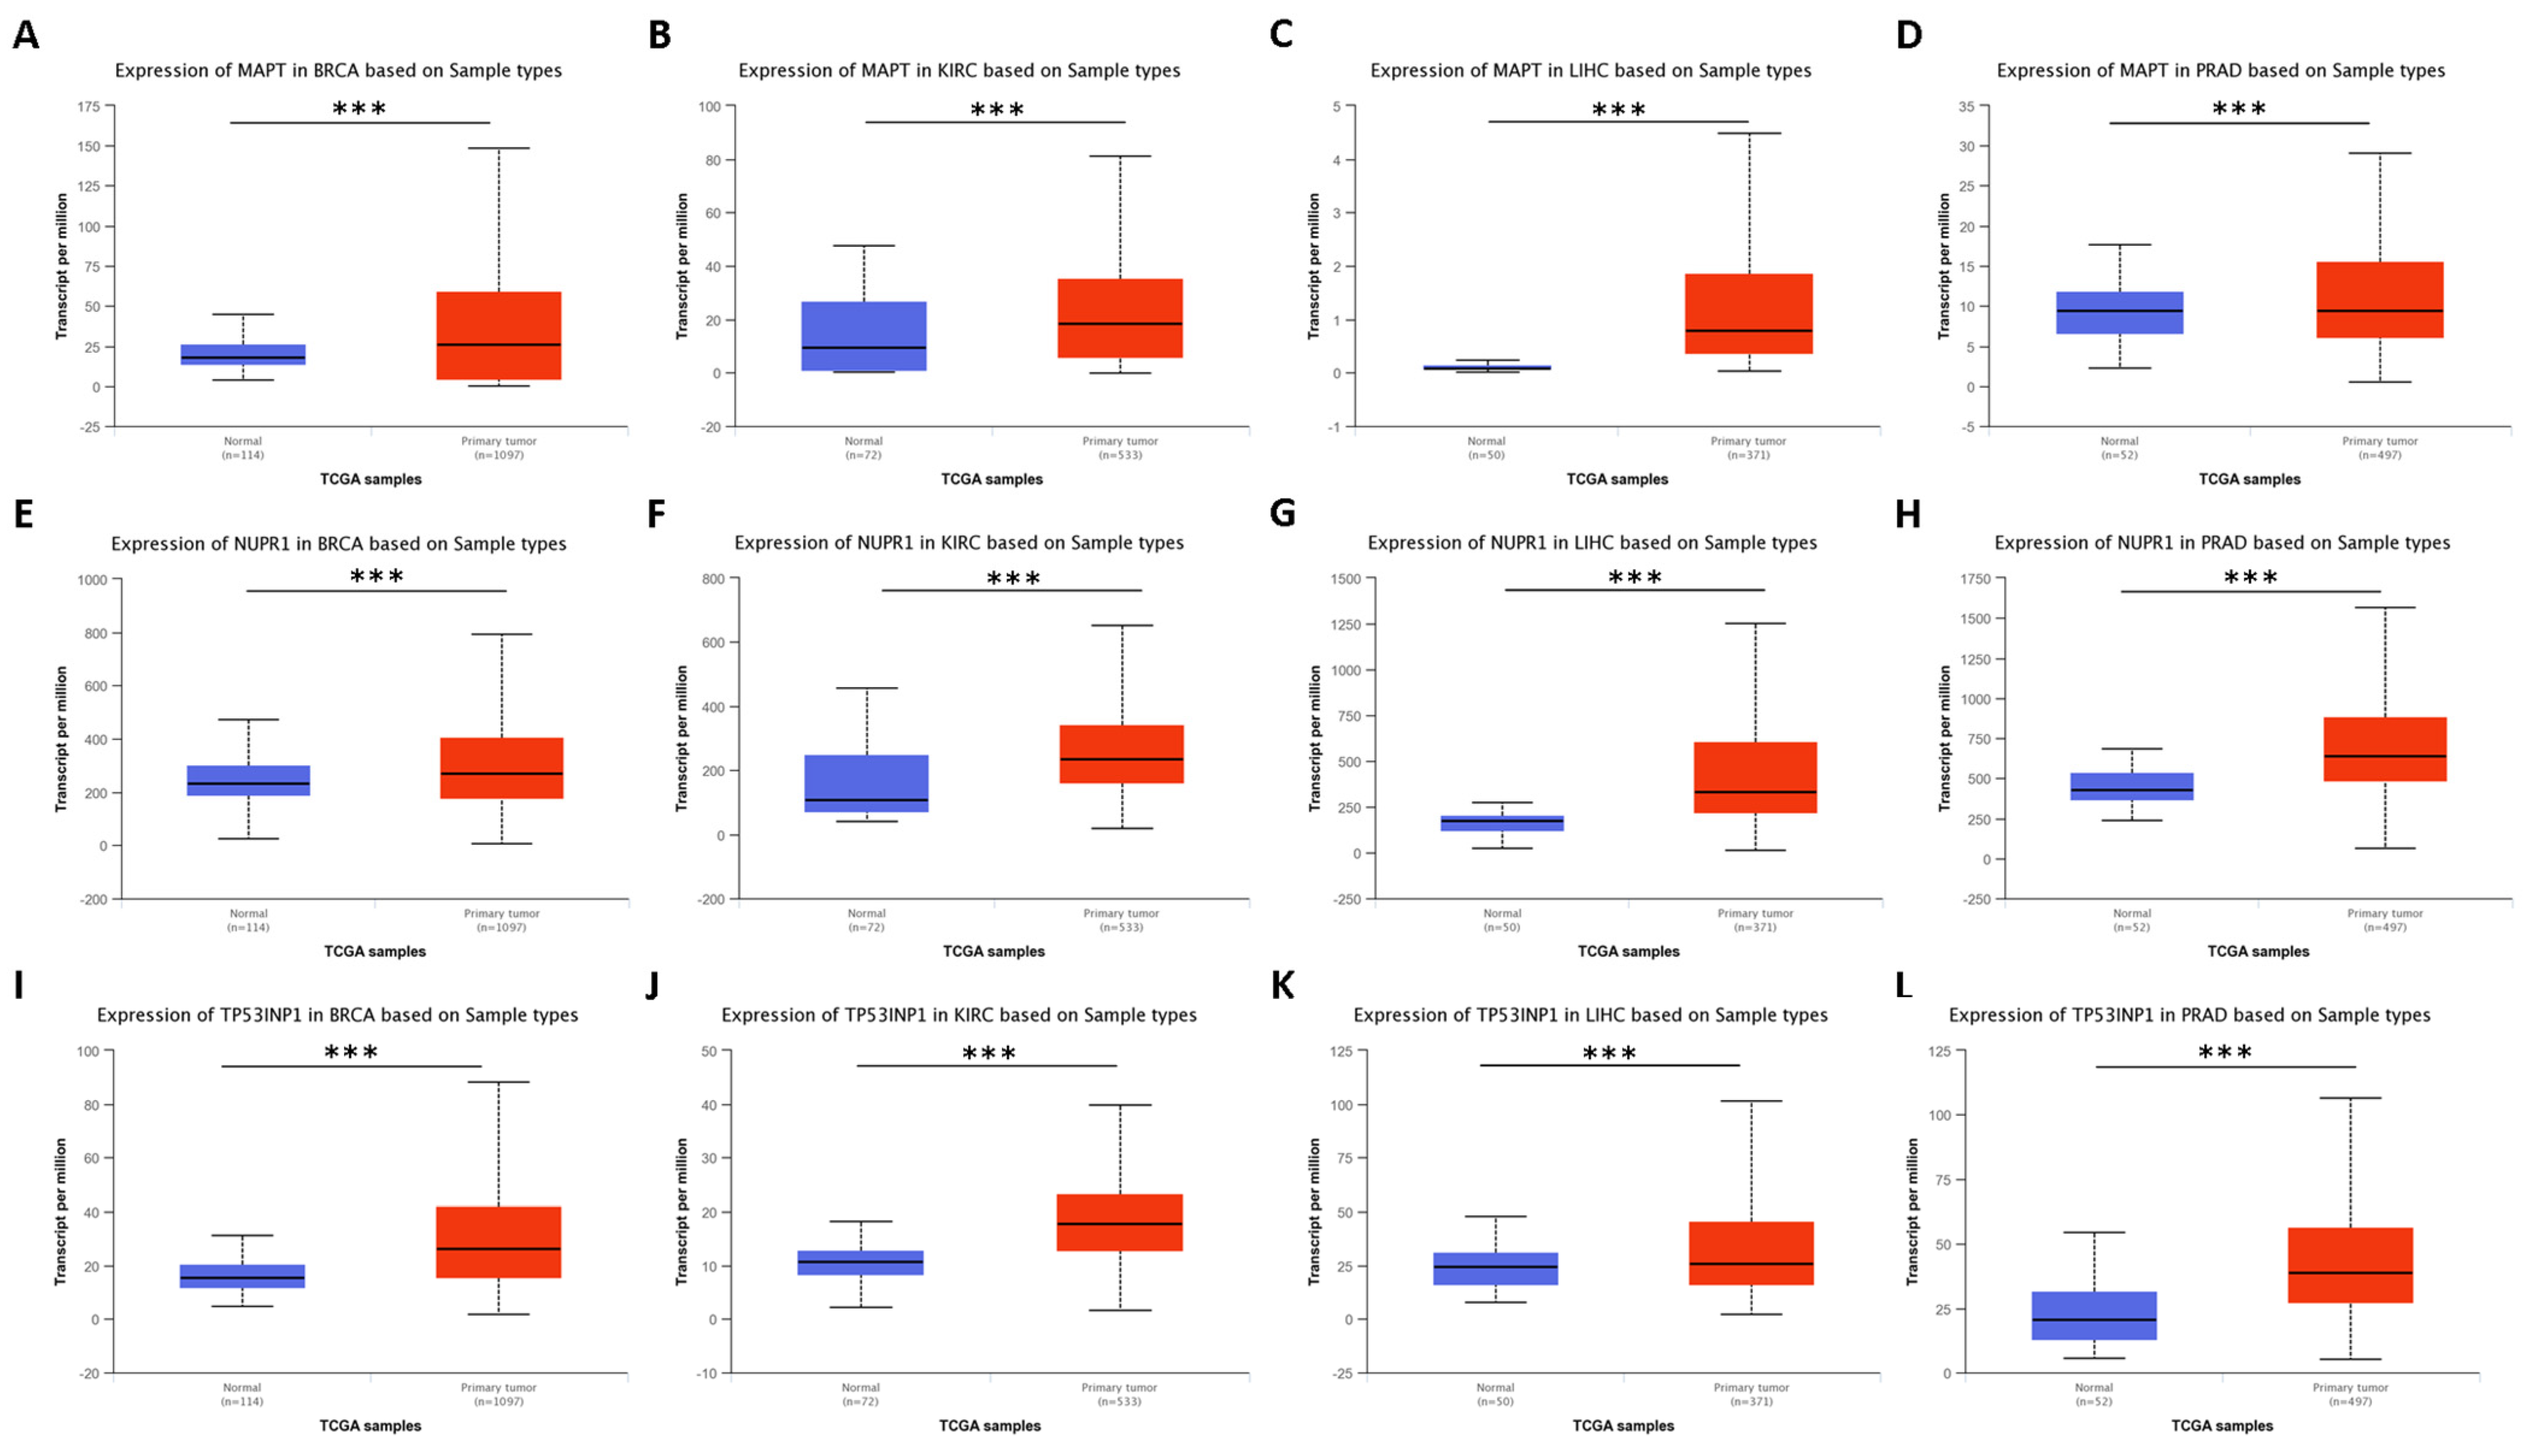
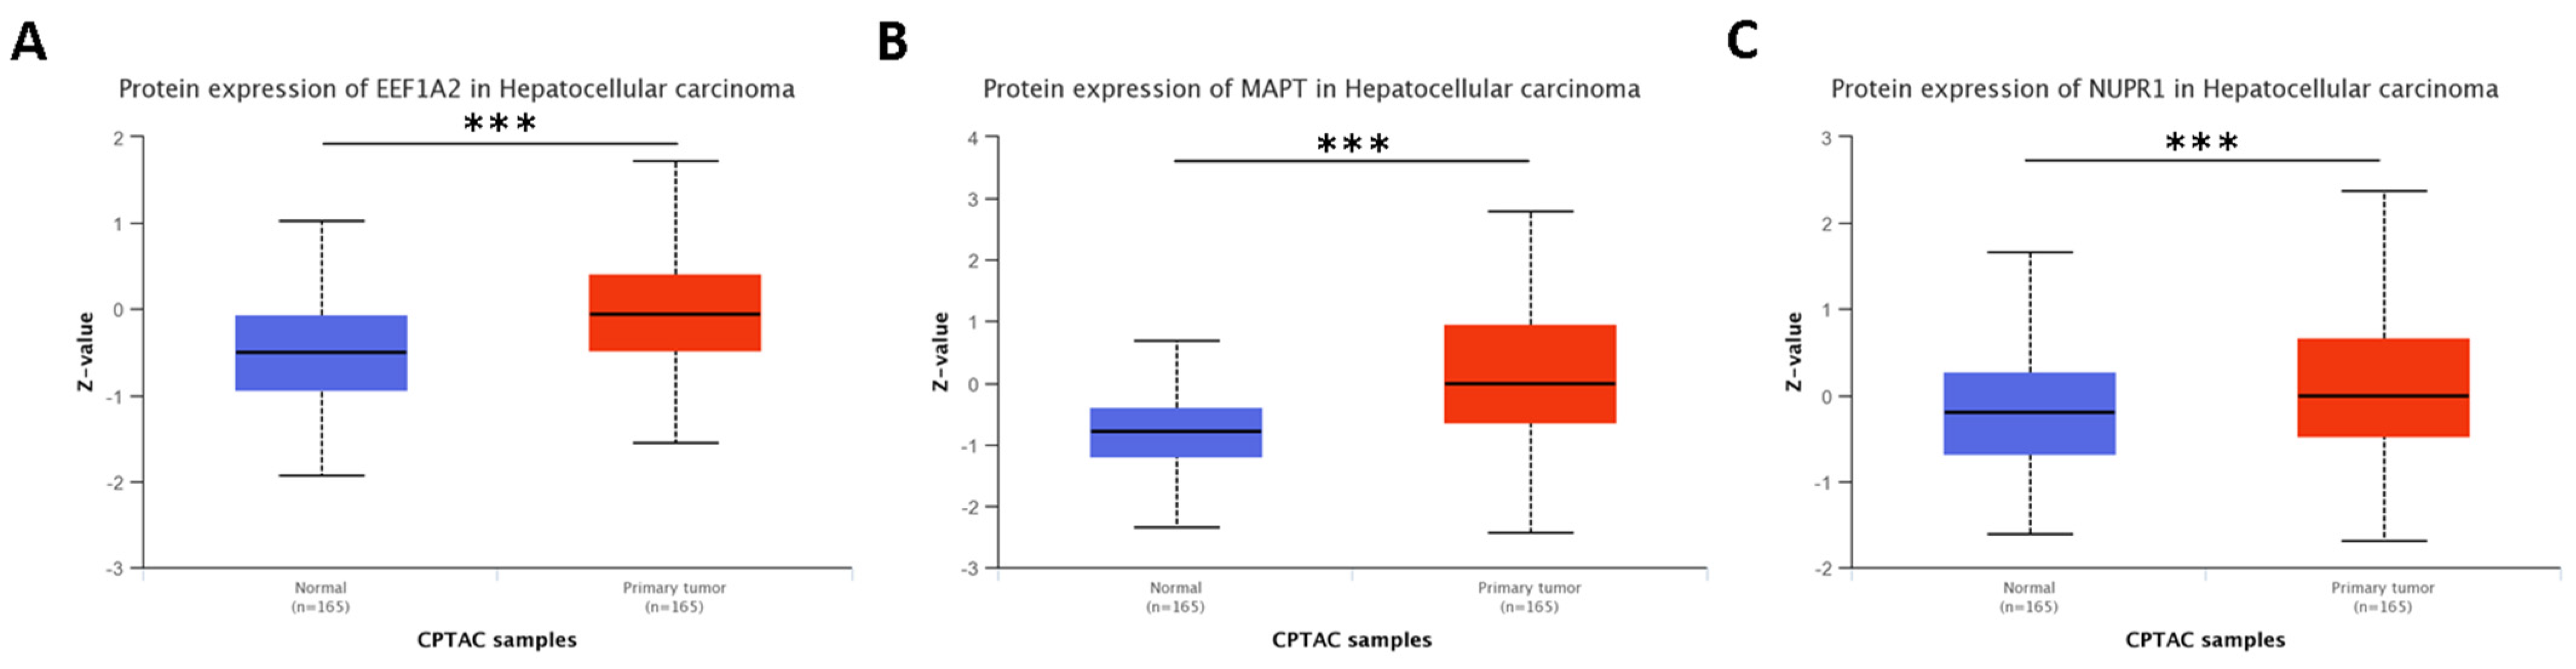
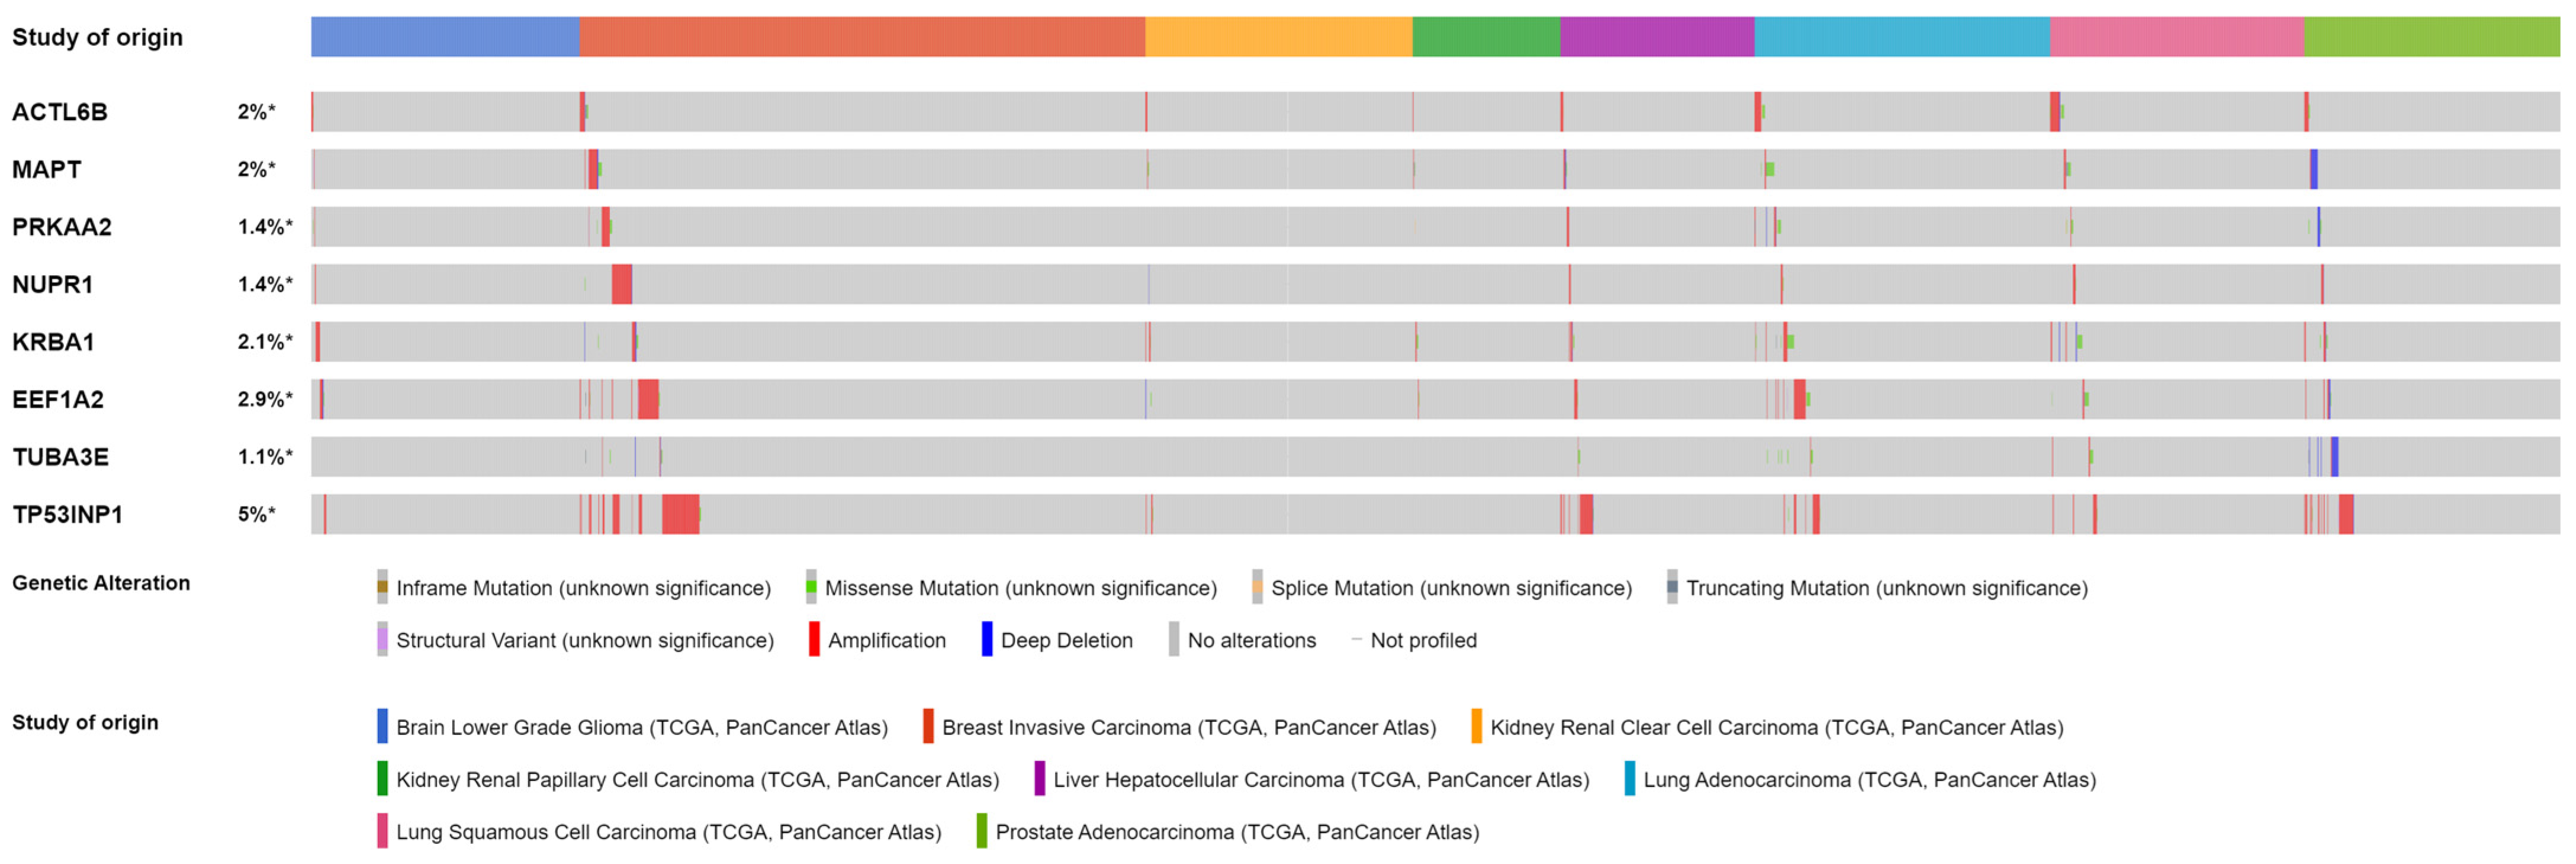
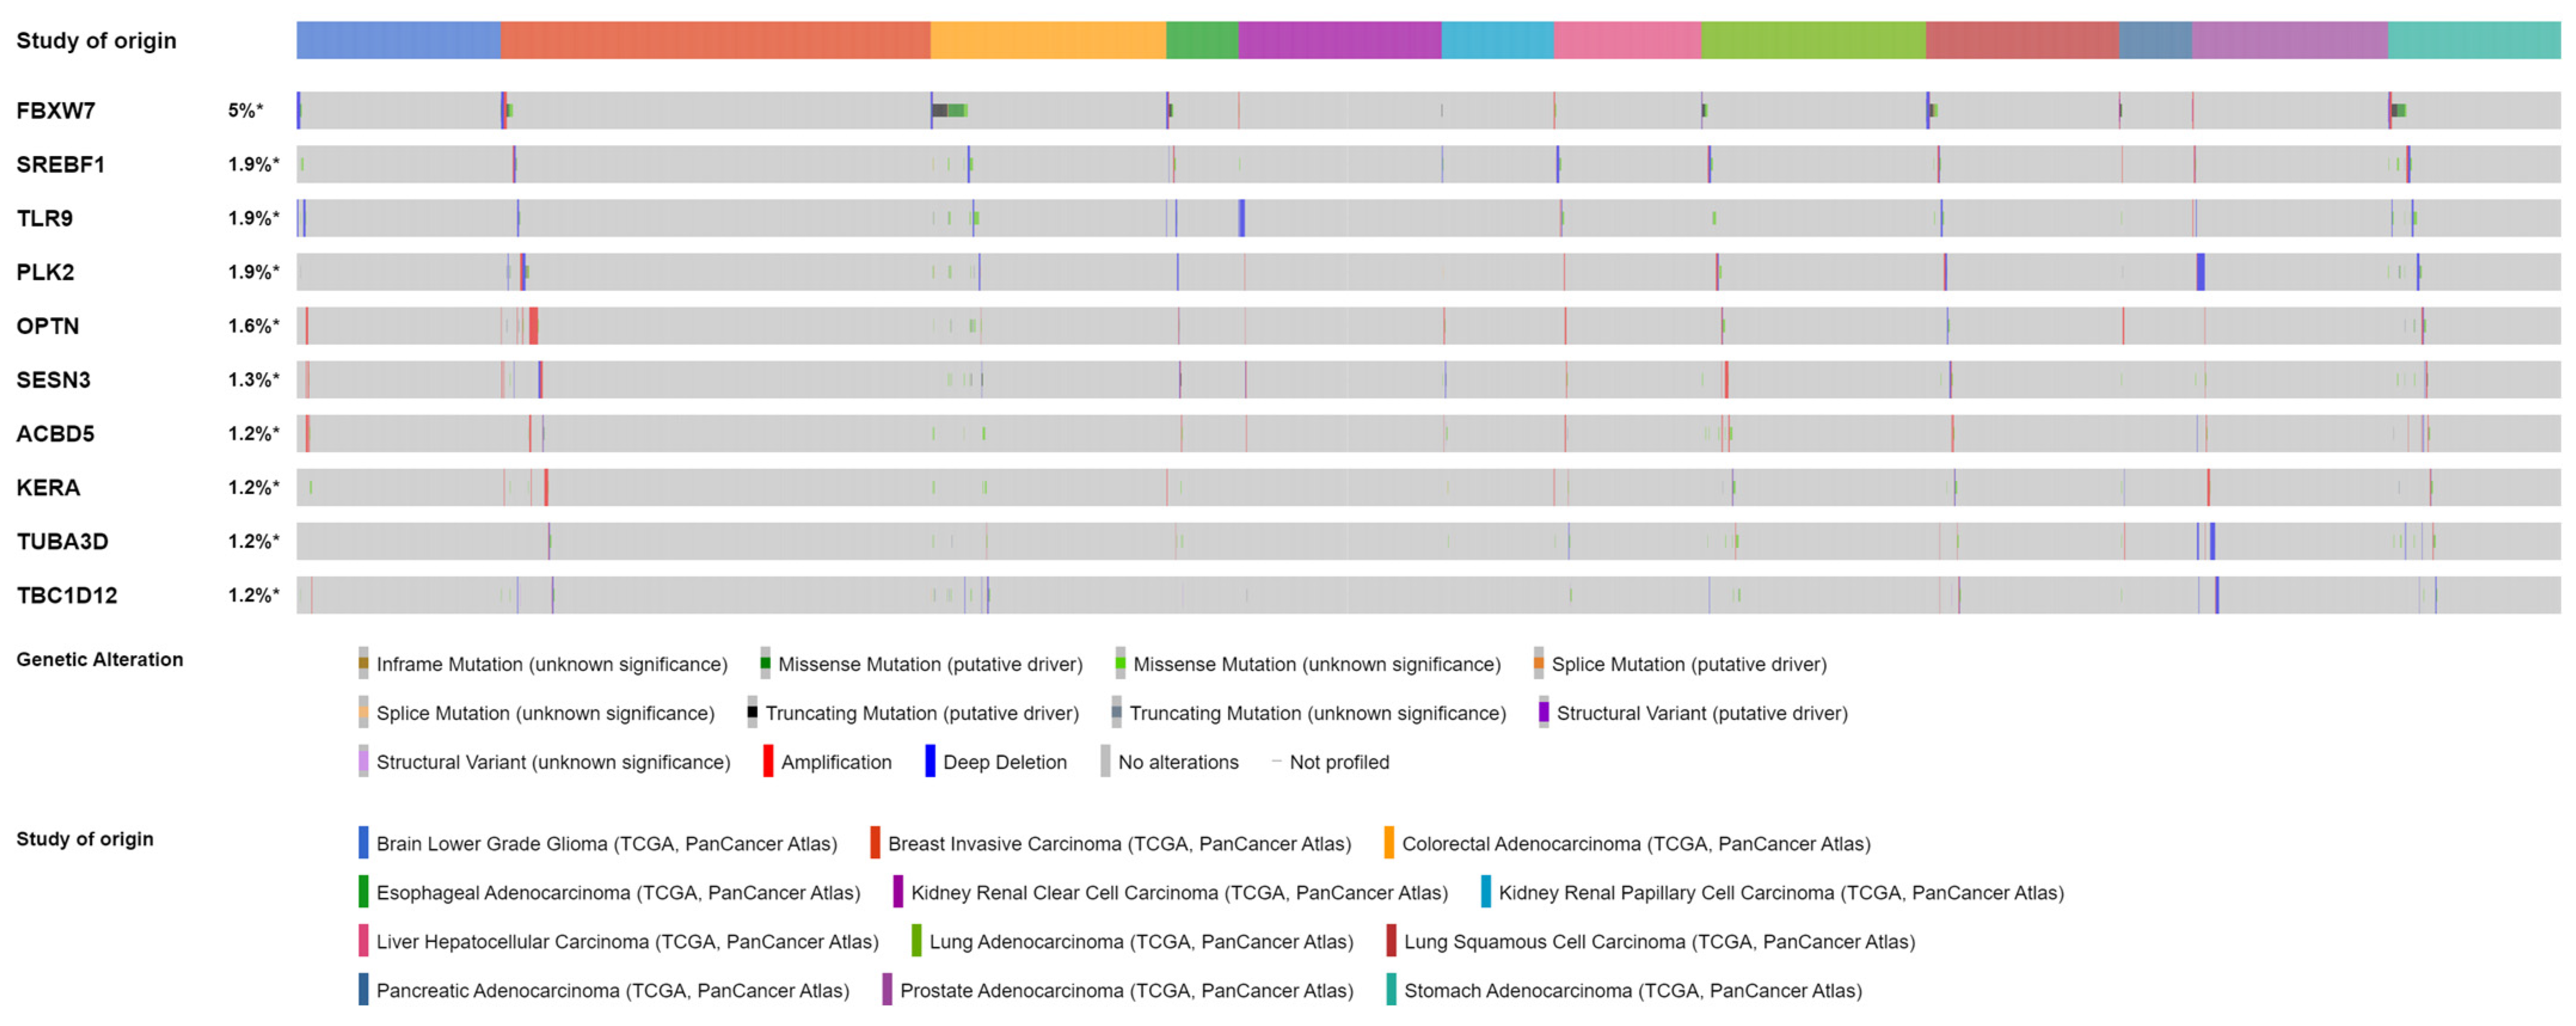
4.1.1. Protein and Mutational Features of Relevant Genes for Cluster 0
4.1.2. Previous Research on Relevant Genes for Cluster 0
4.2. Tumors Balancing Macro- and Micro-Autophagy Processes (Clusters 0 and 1)
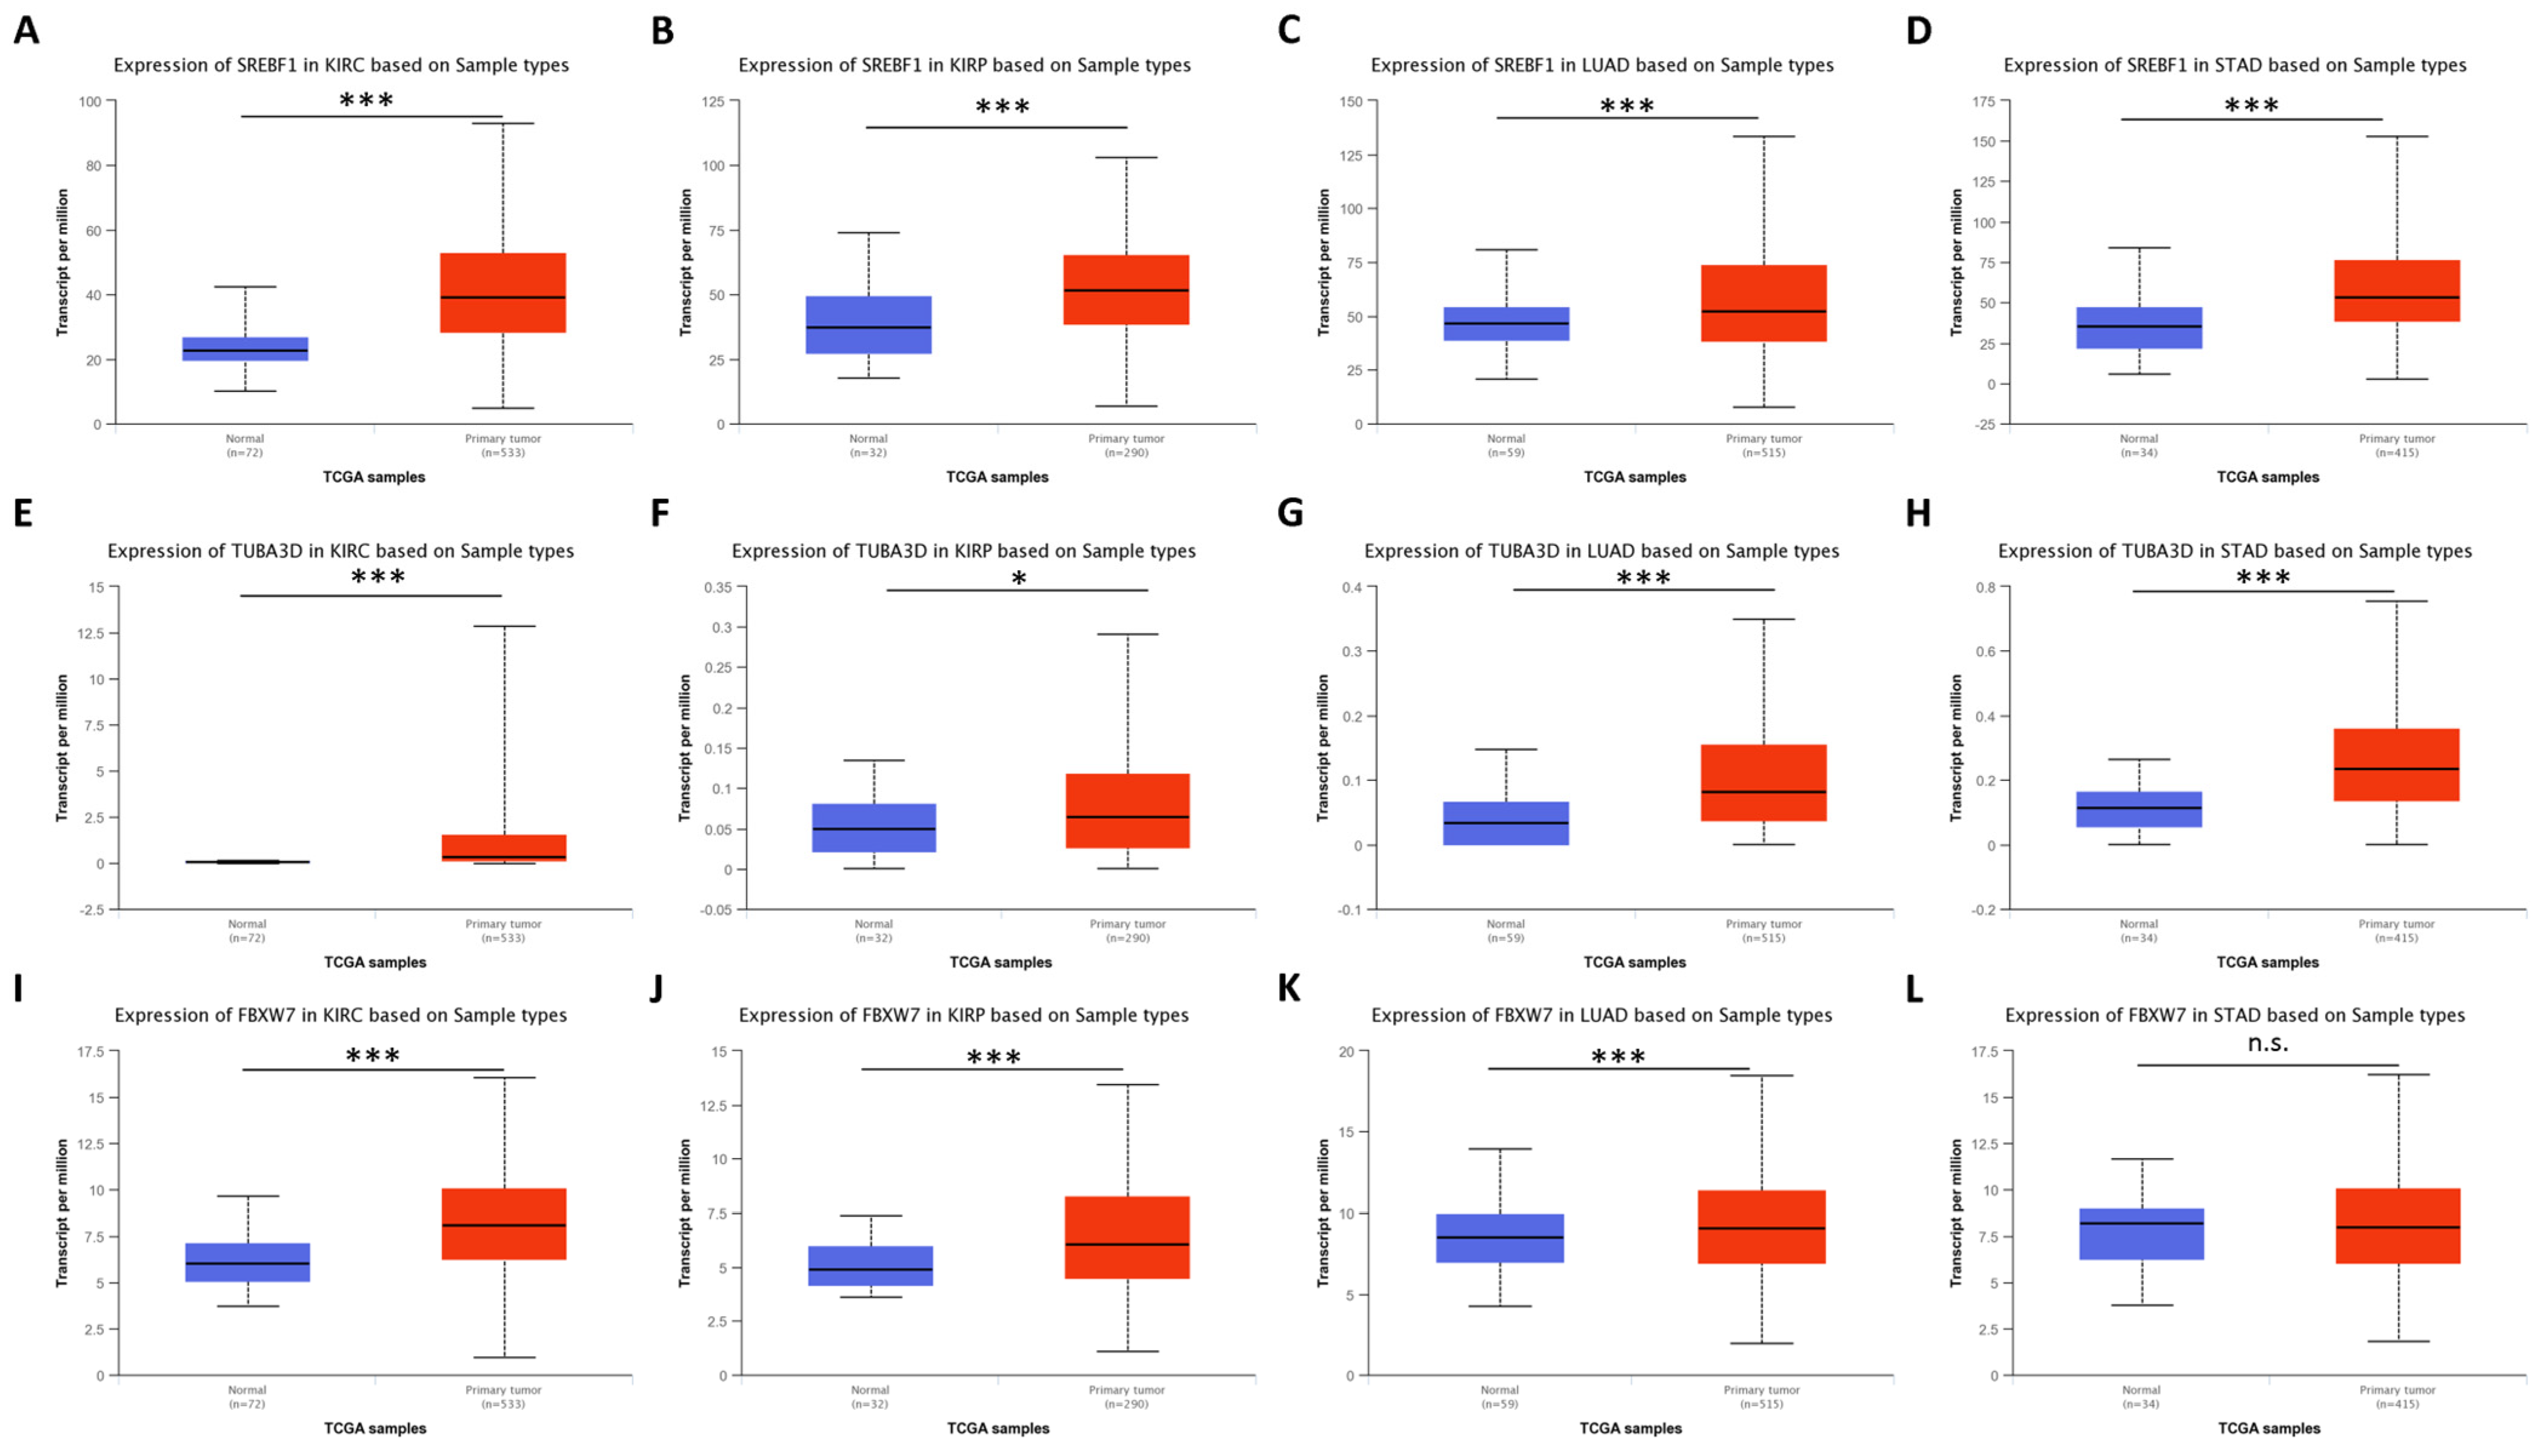
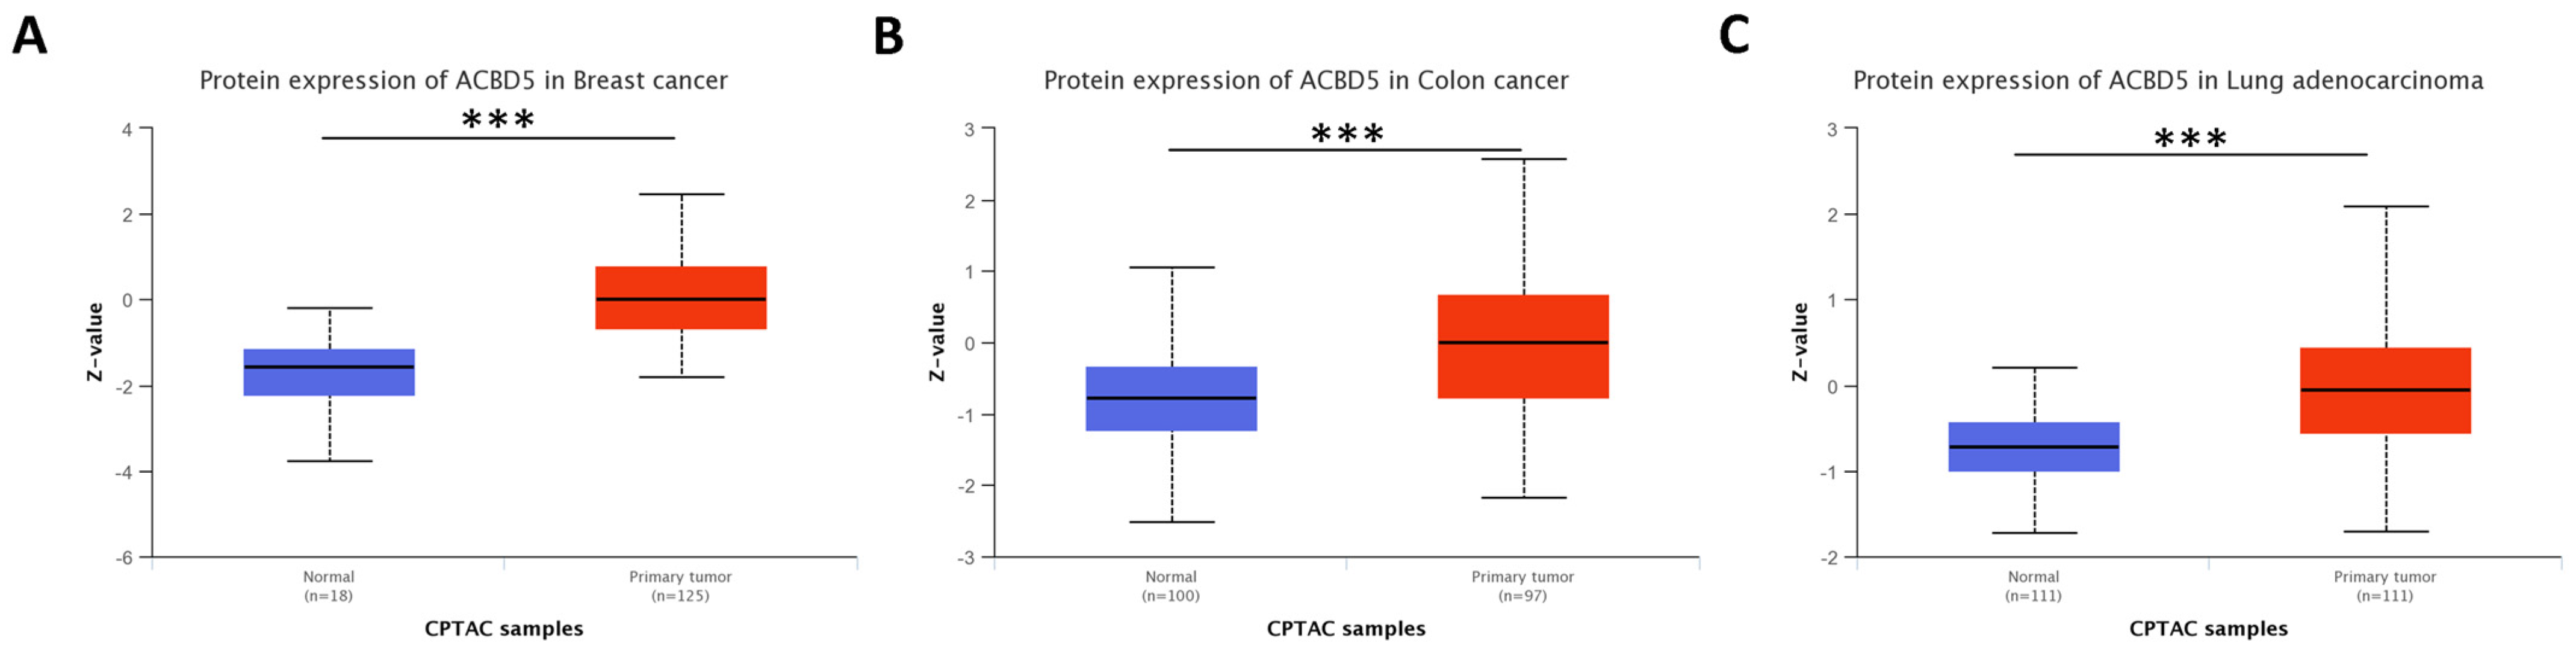
4.2.1. Accumulation of ACBD5 Is Found in Tumors from Cluster 0 and 1
4.2.2. Previous Research on Overexpressed Genes in Tumors of Clusters 0 and 1
5. Conclusions
Supplementary Materials
Author Contributions
Funding
Institutional Review Board Statement
Informed Consent Statement
Data Availability Statement
Acknowledgments
Conflicts of Interest
References
- Mathew, R.; Karantza-Wadsworth, V.; White, E. Role of autophagy in cancer. Nat. Rev. Cancer 2007, 7, 961–967. [Google Scholar] [CrossRef]
- Debnath, J.; Gammoh, N.; Ryan, K.M. Autophagy and autophagy-related pathways in cancer. Nat. Rev. Mol. Cell Biol. 2023, 24, 560–575. [Google Scholar] [CrossRef]
- White, E.; Lattime, E.C.; Guo, J.Y. Autophagy Regulates Stress Responses, Metabolism, and Anticancer Immunity. Trends Cancer 2021, 7, 778–789. [Google Scholar] [CrossRef]
- Bustos, S.O.; Antunes, F.; Rangel, M.C.; Chammas, R. Emerging Autophagy Functions Shape the Tumor Microenvironment and Play a Role in Cancer Progression—Implications for Cancer Therapy. Front. Oncol. 2020, 10, 2549. [Google Scholar] [CrossRef]
- Cuervo, A.M.; Wong, E. Chaperone-mediated autophagy: Roles in disease and aging. Cell Res. 2014, 24, 92–104. [Google Scholar] [CrossRef] [Green Version]
- Sukhorukov, V.; Voronkov, D.; Baranich, T.; Mudzhiri, N.; Magnaeva, A.; Illarioshkin, S. Impaired Mitophagy in Neurons and Glial Cells during Aging and Age-Related Disorders. Int. J. Mol. Sci. 2021, 22, 10251. [Google Scholar] [CrossRef] [PubMed]
- Wang, L.; Klionsky, D.J.; Shen, H.-M. The emerging mechanisms and functions of microautophagy. Nat. Rev. Mol. Cell Biol. 2023, 24, 186–203. [Google Scholar] [CrossRef] [PubMed]
- Ding, W.-X.; Yin, X.-M. Mitophagy: Mechanisms, pathophysiological roles, and analysis. Biol. Chem. 2012, 393, 547–564. [Google Scholar] [CrossRef] [Green Version]
- Liberzon, A.; Birger, C.; Thorvaldsdóttir, H.; Ghandi, M.; Mesirov, J.P.; Tamayo, P. The Molecular Signatures Database Hallmark Gene Set Collection. Cell Syst. 2015, 1, 417–425. [Google Scholar] [CrossRef] [Green Version]
- Homma, K.; Suzuki, K.; Sugawara, H. The Autophagy Database: An all-inclusive information resource on autophagy that provides nourishment for research. Nucleic Acids Res. 2011, 39, D986–D990. [Google Scholar] [CrossRef] [Green Version]
- Wang, N.-N.; Dong, J.; Zhang, L.; Ouyang, D.; Cheng, Y.; Chen, A.F.; Lu, A.-P.; Cao, D.-S. HAMdb: A database of human autophagy modulators with specific pathway and disease information. J. Cheminform. 2018, 10, 34. [Google Scholar] [CrossRef] [Green Version]
- Goldman, M.J.; Craft, B.; Hastie, M.; Repečka, K.; McDade, F.; Kamath, A.; Banerjee, A.; Luo, Y.; Rogers, D.; Brooks, A.N.; et al. Visualizing and interpreting cancer genomics data via the Xena platform. Nat. Biotechnol. 2020, 38, 675–678. [Google Scholar] [CrossRef] [PubMed]
- Deng, M.; Brägelmann, J.; Kryukov, I.; Saraiva-Agostinho, N.; Perner, S. FirebrowseR: An R client to the Broad Institute’s Firehose Pipeline. Database 2017, 2017, baw160. [Google Scholar] [CrossRef] [PubMed] [Green Version]
- Kondapuram, S.K.; Coumar, M.S. Pan-cancer gene expression analysis: Identification of deregulated autophagy genes and drugs to target them. Gene 2022, 844, 146821. [Google Scholar] [CrossRef] [PubMed]
- Stevens, J.R.; Herrick, J.S.; Wolff, R.K.; Slattery, M.L. Power in pairs: Assessing the statistical value of paired samples in tests for differential expression. BMC Genom. 2018, 19, 953. [Google Scholar] [CrossRef] [Green Version]
- Tyutyunyk-Massey, L.; Sun, Y.; Dao, N.; Ngo, H.; Dammalapati, M.; Vaidyanathan, A.; Singh, M.; Haqqani, S.; Haueis, J.; Finnegan, R.; et al. Autophagy-Dependent Sensitization of Triple-Negative Breast Cancer Models to Topoisomerase II Poisons by Inhibition of the Nucleosome Remodeling Factor. Mol. Cancer Res. 2021, 19, 1338–1349. [Google Scholar] [CrossRef]
- Muciño-Hernández, G.; Acevo-Rodríguez, P.S.; Cabrera-Benitez, S.; Guerrero, A.O.; Merchant-Larios, H.; Castro-Obregón, S. Nucleophagy contributes to genome stability through degradation of type II topoisomerases A and B and nucleolar components. J. Cell Sci. 2023, 136, jcs260563. [Google Scholar] [CrossRef]
- Järvinen, T.A.H.; Liu, E.T. Topoisomerase II α gene (TOP2A) amplification and deletion in cancer—More common than anticipated. Cytopathology 2003, 14, 309–313. [Google Scholar] [CrossRef]
- Lin, X.; Wang, F.; Chen, J.; Liu, J.; Lin, Y.-B.; Li, L.; Chen, C.-B.; Xu, Q. N6-methyladenosine modification of CENPK mRNA by ZC3H13 promotes cervical cancer stemness and chemoresistance. Mil. Med. Res. 2022, 9, 19. [Google Scholar] [CrossRef] [PubMed]
- Kumar, D.; Nath, L.; Kamal, M.A.; Varshney, A.; Jain, A.; Singh, S.; Rao, K.V.S. Genome-wide Analysis of the Host Intracellular Network that Regulates Survival of Mycobacterium tuberculosis. Cell 2010, 140, 731–743. [Google Scholar] [CrossRef] [PubMed] [Green Version]
- Wu, S.; Cao, L.; Ke, L.; Yan, Y.; Luo, H.; Hu, X.; Niu, J.; Li, H.; Xu, H.; Chen, W.; et al. Knockdown of CENPK inhibits cell growth and facilitates apoptosis via PTEN-PI3K-AKT signalling pathway in gastric cancer. J. Cell. Mol. Med. 2021, 25, 8890–8903. [Google Scholar] [CrossRef]
- Trisciuoglio, D.; Degrassi, F. The Tubulin Code and Tubulin-Modifying Enzymes in Autophagy and Cancer. Cancers 2021, 14, 6. [Google Scholar] [CrossRef]
- Erazo, T.; Lorente, M.; López-Plana, A.; Muñoz-Guardiola, P.; Fernández-Nogueira, P.; García-Martínez, J.A.; Bragado, P.; Fuster, G.; Salazar, M.; Espadaler, J.; et al. The New Antitumor Drug ABTL0812 Inhibits the Akt/mTORC1 Axis by Upregulating Tribbles-3 Pseudokinase. Clin. Cancer Res. 2016, 22, 2508–2519. [Google Scholar] [CrossRef] [Green Version]
- López-Plana, A.; Fernández-Nogueira, P.; Muñoz-Guardiola, P.; Solé-Sánchez, S.; Megías-Roda, E.; Pérez-Montoyo, H.; Jauregui, P.; Yeste-Velasco, M.; Gómez-Ferreria, M.; Erazo, T.; et al. The novel proautophagy anticancer drug ABTL0812 potentiates chemotherapy in adenocarcinoma and squamous nonsmall cell lung cancer. Int. J. Cancer 2020, 147, 1163–1179. [Google Scholar] [CrossRef] [PubMed]
- Ji, J.; Wang, Z.; Sun, W.; Li, Z.; Cai, H.; Zhao, E.; Cui, H. Effects of Cynaroside on Cell Proliferation, Apoptosis, Migration and Invasion though the MET/AKT/mTOR Axis in Gastric Cancer. Int. J. Mol. Sci. 2021, 22, 12125. [Google Scholar] [CrossRef]
- Molgora, M.; Esaulova, E.; Vermi, W.; Hou, J.; Chen, Y.; Luo, J.; Brioschi, S.; Bugatti, M.; Omodei, A.S.; Ricci, B.; et al. TREM2 Modulation Remodels the Tumor Myeloid Landscape Enhancing Anti-PD-1 Immunotherapy. Cell 2020, 182, 886–900.e17. [Google Scholar] [CrossRef]
- Huang, W.; Lv, Q.; Xiao, Y.; Zhong, Z.; Hu, B.; Yan, S.; Yan, Y.; Zhang, J.; Shi, T.; Jiang, L.; et al. Triggering Receptor Expressed on Myeloid Cells 2 Protects Dopaminergic Neurons by Promoting Autophagy in the Inflammatory Pathogenesis of Parkinson’s Disease. Front. Neurosci. 2021, 15, 745815. [Google Scholar] [CrossRef]
- Sun, R.; Han, R.; McCornack, C.; Khan, S.; Tabor, G.T.; Chen, Y.; Hou, J.; Jiang, H.; Schoch, K.M.; Mao, D.D.; et al. TREM2 inhibition triggers antitumor cell activity of myeloid cells in glioblastoma. Sci. Adv. 2023, 9, eade3559. [Google Scholar] [CrossRef]
- Chatterjee, S.J.; Pandey, S. Chemo-resistant melanoma sensitized by tamoxifen to low dose curcumin treatment through induction of apoptosis and autophagy. Cancer Biol. Ther. 2011, 11, 216–228. [Google Scholar] [CrossRef] [Green Version]
- Matteoni, S.; Matarrese, P.; Ascione, B.; Ricci-Vitiani, L.; Pallini, R.; Villani, V.; Pace, A.; Paggi, M.G.; Abbruzzese, C. Chlorpromazine induces cytotoxic autophagy in glioblastoma cells via endoplasmic reticulum stress and unfolded protein response. J. Exp. Clin. Cancer Res. 2021, 40, 347. [Google Scholar] [CrossRef]
- Zhan, L.; Zhang, Y.; Wang, W.; Song, E.; Fan, Y.; Li, J.; Wei, B. Autophagy as an emerging therapy target for ovarian carcinoma. Oncotarget 2016, 7, 83476–83487. [Google Scholar] [CrossRef] [Green Version]
- Al-Qatati, A.; Aliwaini, S. Combined pitavastatin and dacarbazine treatment activates apoptosis and autophagy resulting in synergistic cytotoxicity in melanoma cells. Oncol. Lett. 2017, 14, 7993–7999. [Google Scholar] [CrossRef] [Green Version]
- Li, X.; Qi, X.; Zhou, L.; Fu, W.; Abdul-Karim, F.W.; MacLennan, G.; Gorodeski, G.I. P2X7 receptor expression is decreased in epithelial cancer cells of ectodermal, uro-genital sinus, and distal paramesonephric duct origin. Purinergic Signal. 2009, 5, 351–368. [Google Scholar] [CrossRef] [Green Version]
- Cofre, J.; Abdelhay, E. Cancer Is to Embryology as Mutation Is to Genetics: Hypothesis of the Cancer as Embryological Phenomenon. Sci. World J. 2017, 2017, 3578090. [Google Scholar] [CrossRef] [PubMed] [Green Version]
- Chandrashekar, D.S.; Karthikeyan, S.K.; Korla, P.K.; Patel, H.; Shovon, A.R.; Athar, M.; Netto, G.J.; Qin, Z.S.; Kumar, S.; Manne, U.; et al. UALCAN: An update to the integrated cancer data analysis platform. Neoplasia 2022, 25, 18–27. [Google Scholar] [CrossRef] [PubMed]
- Cerami, E.; Gao, J.; Dogrusoz, U.; Gross, B.E.; Sumer, S.O.; Aksoy, B.A.; Jacobsen, A.; Byrne, C.J.; Heuer, M.L.; Larsson, E.; et al. The cBio Cancer Genomics Portal: An Open Platform for Exploring Multidimensional Cancer Genomics Data. Cancer Discov. 2012, 2, 401–404. [Google Scholar] [CrossRef] [Green Version]
- Augello, G.; Emma, M.R.; Azzolina, A.; Puleio, R.; Condorelli, L.; Cusimano, A.; Giannitrapani, L.; McCubrey, J.A.; Iovanna, J.L.; Cervello, M. The NUPR1/p73 axis contributes to sorafenib resistance in hepatocellular carcinoma. Cancer Lett. 2021, 519, 250–262. [Google Scholar] [CrossRef]
- Zhan, Y.; Zhang, Z.; Liu, Y.; Fang, Y.; Xie, Y.; Zheng, Y.; Li, G.; Liang, L.; Ding, Y. NUPR1 contributes to radiation resistance by maintaining ROS homeostasis via AhR/CYP signal axis in hepatocellular carcinoma. BMC Med. 2022, 20, 365. [Google Scholar] [CrossRef]
- Chen, S.-S.; Hu, W.; Wang, Z.; Lou, X.-E.; Zhou, H.-J. p8 attenuates the apoptosis induced by dihydroartemisinin in cancer cells through promoting autophagy. Cancer Biol. Ther. 2015, 16, 770–779. [Google Scholar] [CrossRef] [Green Version]
- Salazar, M.; Carracedo, A.; Salanueva, Í.J.; Hernández-Tiedra, S.; Lorente, M.; Egia, A.; Vázquez, P.; Blázquez, C.; Torres, S.; García, S.; et al. Cannabinoid action induces autophagy-mediated cell death through stimulation of ER stress in human glioma cells. J. Clin. Investig. 2009, 119, 1359–1372. [Google Scholar] [CrossRef] [Green Version]
- Wang, L.; Sun, J.; Yin, Y.; Sun, Y.; Ma, J.; Zhou, R.; Chang, X.; Li, D.; Yao, Z.; Tian, S.; et al. Transcriptional coregualtor NUPR1 maintains tamoxifen resistance in breast cancer cells. Cell Death Dis. 2021, 12, 149. [Google Scholar] [CrossRef]
- Xiao, H.; Long, J.; Chen, X.; Tan, M.-D. NUPR1 promotes the proliferation and migration of breast cancer cells by activating TFE3 transcription to induce autophagy. Exp. Cell Res. 2022, 418, 113234. [Google Scholar] [CrossRef]
- Li, Y.; Yin, Y.; Ma, J.; Sun, Y.; Zhou, R.; Cui, B.; Zhang, Y.; Yang, J.; Yan, X.; Liu, Z.; et al. Combination of AAV-mediated NUPR1 knockdown and trifluoperazine induces premature senescence in human lung adenocarcinoma A549 cells in nude mice. Oncol. Rep. 2020, 43, 681–688. [Google Scholar] [CrossRef]
- Kong, D.K.; Georgescu, S.P.; Cano, C.; Aronovitz, M.J.; Iovanna, J.L.; Patten, R.D.; Kyriakis, J.M.; Goruppi, S. Deficiency of the Transcriptional Regulator p8 Results in Increased Autophagy and Apoptosis, and Causes Impaired Heart Function. Mol. Biol. Cell 2010, 21, 1335–1349. [Google Scholar] [CrossRef] [Green Version]
- Chen, X.; Li, A.; Zhan, Q.; Jing, Z.; Chen, Y.; Chen, J. microRNA-637 promotes apoptosis and suppresses proliferation and autophagy in multiple myeloma cell lines via NUPR1. FEBS Open Bio 2021, 11, 519–528. [Google Scholar] [CrossRef]
- Song, X.; Zhu, S.; Chen, P.; Hou, W.; Wen, Q.; Liu, J.; Xie, Y.; Liu, J.; Klionsky, D.J.; Kroemer, G.; et al. AMPK-Mediated BECN1 Phosphorylation Promotes Ferroptosis by Directly Blocking System Xc– Activity. Curr. Biol. 2018, 28, 2388–2399.e5. [Google Scholar] [CrossRef] [PubMed] [Green Version]
- Matrood, S.; Melms, L.E.; Bartsch, D.K.; Fazio, P. Di The Expression of Autophagy-Associated Genes Represents a Valid Footprint for Aggressive Pancreatic Neuroendocrine Neoplasms. Int. J. Mol. Sci. 2023, 24, 3636. [Google Scholar] [CrossRef]
- Rao, S.V.; Solum, G.; Niederdorfer, B.; Nørsett, K.G.; Bjørkøy, G.; Thommesen, L. Gastrin activates autophagy and increases migration and survival of gastric adenocarcinoma cells. BMC Cancer 2017, 17, 68. [Google Scholar] [CrossRef] [Green Version]
- Fang, L.; Lv, J.; Xuan, Z.; Li, B.; Li, Z.; He, Z.; Li, F.; Xu, J.; Wang, S.; Xia, Y.; et al. Circular CPM promotes chemoresistance of gastric cancer via activating PRKAA2-mediated autophagy. Clin. Transl. Med. 2022, 12, e708. [Google Scholar] [CrossRef]
- Huang, H.; Kang, R.; Wang, J.; Luo, G.; Yang, W.; Zhao, Z. Hepatitis C virus inhibits AKT-tuberous sclerosis complex (TSC), the mechanistic target of rapamycin (MTOR) pathway, through endoplasmic reticulum stress to induce autophagy. Autophagy 2013, 9, 175–195. [Google Scholar] [CrossRef] [Green Version]
- Sun, W.; Yan, J.; Ma, H.; Wu, J.; Zhang, Y. Autophagy-Dependent Ferroptosis-Related Signature is Closely Associated with the Prognosis and Tumor Immune Escape of Patients with Glioma. Int. J. Gen. Med. 2022, 15, 253–270. [Google Scholar] [CrossRef] [PubMed]
- Subramanian, A.; Tamayo, P.; Mootha, V.K.; Mukherjee, S.; Ebert, B.L.; Gillette, M.A.; Paulovich, A.; Pomeroy, S.L.; Golub, T.R.; Lander, E.S.; et al. Gene set enrichment analysis: A knowledge-based approach for interpreting genome-wide expression profiles. Proc. Natl. Acad. Sci. USA 2005, 102, 15545–15550. [Google Scholar] [CrossRef] [PubMed]
- Wani, A.; Rihani, S.B.A.; Sharma, A.; Weadick, B.; Govindarajan, R.; Khan, S.U.; Sharma, P.R.; Dogra, A.; Nandi, U.; Reddy, C.N.; et al. Crocetin promotes clearance of amyloid-β by inducing autophagy via the STK11/LKB1-mediated AMPK pathway. Autophagy 2021, 17, 3813–3832. [Google Scholar] [CrossRef] [PubMed]
- Feng, Q.; Luo, Y.; Zhang, X.-N.; Yang, X.-F.; Hong, X.-Y.; Sun, D.-S.; Li, X.-C.; Hu, Y.; Li, X.-G.; Zhang, J.-F.; et al. MAPT/Tau accumulation represses autophagy flux by disrupting IST1-regulated ESCRT-III complex formation: A vicious cycle in Alzheimer neurodegeneration. Autophagy 2020, 16, 641–658. [Google Scholar] [CrossRef]
- Hedna, R.; Kovacic, H.; Pagano, A.; Peyrot, V.; Robin, M.; Devred, F.; Breuzard, G. Tau Protein as Therapeutic Target for Cancer? Focus on Glioblastoma. Cancers 2022, 14, 5386. [Google Scholar] [CrossRef]
- Chen, J.; Li, X.; Yan, S.; Li, J.; Zhou, Y.; Wu, M.; Ding, J.; Yang, J.; Yuan, Y.; Zhu, Y.; et al. An autophagy-related long non-coding RNA prognostic model and related immune research for female breast cancer. Front. Oncol. 2022, 12, 929240. [Google Scholar] [CrossRef]
- Wu, Q.; Li, Q.; Zhu, W.; Zhang, X.; Li, H. Identification of autophagy-related long non-coding RNA prognostic signature for breast cancer. J. Cell. Mol. Med. 2021, 25, 4088–4098. [Google Scholar] [CrossRef]
- Luo, Z.; Nong, B.; Ma, Y.; Fang, D. Autophagy related long non-coding RNA and breast cancer prognosis analysis and prognostic risk model establishment. Ann. Transl. Med. 2022, 10, 58. [Google Scholar] [CrossRef]
- Segura, A.V.C.; Sotomayor, M.B.V.; Román, A.I.F.G.; Rojas, C.A.O.; Carrasco, A.G.M. Impact of mini-driver genes in the prognosis and tumor features of colorectal cancer samples: A novel perspective to support current biomarkers. PeerJ 2023, 11, e15410. [Google Scholar] [CrossRef] [PubMed]
- Han, L.; Huang, Z.; Liu, Y.; Ye, L.; Li, D.; Yao, Z.; Wang, C.; Zhang, Y.; Yang, H.; Tan, Z.; et al. MicroRNA-106a regulates autophagy-related cell death and EMT by targeting TP53INP1 in lung cancer with bone metastasis. Cell Death Dis. 2021, 12, 1037. [Google Scholar] [CrossRef]
- Xu, C.-G.; Yang, M.-F.; Fan, J.-X.; Wang, W. MiR-30a and miR-205 are downregulated in hypoxia and modulate radiosensitivity of prostate cancer cells by inhibiting autophagy via TP53INP1. Eur. Rev. Med. Pharmacol. Sci. 2016, 20, 1501–1508. [Google Scholar] [PubMed]
- Wang, W.; Liu, J.; Wu, Q. MiR-205 suppresses autophagy and enhances radiosensitivity of prostate cancer cells by targeting TP53INP1. Eur. Rev. Med. Pharmacol. Sci. 2016, 20, 92–100. [Google Scholar]
- Peuget, S.; Bonacci, T.; Soubeyran, P.; Iovanna, J.; Dusetti, N.J. Oxidative stress-induced p53 activity is enhanced by a redox-sensitive TP53INP1 SUMOylation. Cell Death Differ. 2014, 21, 1107–1118. [Google Scholar] [CrossRef] [PubMed] [Green Version]
- Seillier, M.; Pouyet, L.; N’Guessan, P.; Nollet, M.; Capo, F.; Guillaumond, F.; Peyta, L.; Dumas, J.; Varrault, A.; Bertrand, G.; et al. Defects in mitophagy promote redox-driven metabolic syndrome in the absence of TP53 INP1. EMBO Mol. Med. 2015, 7, 802–818. [Google Scholar] [CrossRef] [PubMed]
- Warde-Farley, D.; Donaldson, S.L.; Comes, O.; Zuberi, K.; Badrawi, R.; Chao, P.; Franz, M.; Grouios, C.; Kazi, F.; Lopes, C.T.; et al. The GeneMANIA prediction server: Biological network integration for gene prioritization and predicting gene function. Nucleic Acids Res. 2010, 38, W214–W220. [Google Scholar] [CrossRef] [Green Version]
- Chen, E.Y.; Tan, C.M.; Kou, Y.; Duan, Q.; Wang, Z.; Meirelles, G.V.; Clark, N.R.; Ma’ayan, A. Enrichr: Interactive and collaborative HTML5 gene list enrichment analysis tool. BMC Bioinform. 2013, 14, 128. [Google Scholar] [CrossRef] [PubMed] [Green Version]
- Hua, R.; Cheng, D.; Coyaud, É.; Freeman, S.; Pietro, E.D.; Wang, Y.; Vissa, A.; Yip, C.M.; Fairn, G.D.; Braverman, N.; et al. VAPs and ACBD5 tether peroxisomes to the ER for peroxisome maintenance and lipid homeostasis. J. Cell Biol. 2017, 216, 367–377. [Google Scholar] [CrossRef]
- Kalayou, S.; Hamre, A.G.; Ndossi, D.; Connolly, L.; Sørlie, M.; Ropstad, E.; Verhaegen, S. Using SILAC proteomics to investigate the effect of the mycotoxin, alternariol, in the human H295R steroidogenesis model. Cell Biol. Toxicol. 2014, 30, 361–376. [Google Scholar] [CrossRef]
- Alizadeh, J.; Kavoosi, M.; Singh, N.; Lorzadeh, S.; Ravandi, A.; Kidane, B.; Ahmed, N.; Mraiche, F.; Mowat, M.R.; Ghavami, S. Regulation of Autophagy via Carbohydrate and Lipid Metabolism in Cancer. Cancers 2023, 15, 2195. [Google Scholar] [CrossRef]
- Dahmene, M.; Bérard, M.; Oueslati, A. Dissecting the Molecular Pathway Involved in PLK2 Kinase-mediated α-Synuclein-selective Autophagic Degradation. J. Biol. Chem. 2017, 292, 3919–3928. [Google Scholar] [CrossRef] [Green Version]
- Song, Z.; Xie, B. LncRNA OIP5-AS1 reduces α-synuclein aggregation and toxicity by targeting miR-126 to activate PLK2 in human neuroblastoma SH-SY5Y cells. Neurosci. Lett. 2021, 740, 135482. [Google Scholar] [CrossRef] [PubMed]
- Zhang, J.; Ng, S.; Wang, J.; Zhou, J.; Tan, S.-H.; Yang, N.; Lin, Q.; Xia, D.; Shen, H.-M. Histone deacetylase inhibitors induce autophagy through FOXO1-dependent pathways. Autophagy 2015, 11, 629–642. [Google Scholar] [CrossRef] [PubMed] [Green Version]
- Fan, L.; Li, B.; Li, Z.; Sun, L. Identification of Autophagy Related circRNA-miRNA-mRNA-Subtypes Network With Radiotherapy Responses and Tumor Immune Microenvironment in Non-small Cell Lung Cancer. Front. Genet. 2021, 12, 730003. [Google Scholar] [CrossRef]
- Li, Z.-W.; Zhang, T.-Y.; Yue, G.-J.; Tian, X.; Wu, J.-Z.; Feng, G.-Y.; Wang, Y.-S. Small nucleolar RNA host gene 22 (SNHG22) promotes the progression of esophageal squamous cell carcinoma by miR-429/SESN3 axis. Ann. Transl. Med. 2020, 8, 1007. [Google Scholar] [CrossRef] [PubMed]
- Sipos, F.; Barta, B.B.; Simon, Á.; Nagy, L.; Dankó, T.; Raffay, R.E.; Petővári, G.; Zsiros, V.; Wichmann, B.; Sebestyén, A.; et al. Survival of HT29 Cancer Cells Is Affected by IGF1R Inhibition via Modulation of Self-DNA-Triggered TLR9 Signaling and the Autophagy Response. Pathol. Oncol. Res. 2022, 28, 1610322. [Google Scholar] [CrossRef] [PubMed]
- Sipos, F.; Kiss, A.L.; Constantinovits, M.; Tulassay, Z.; Műzes, G. Modified Genomic Self-DNA Influences In Vitro Survival of HT29 Tumor Cells via TLR9- and Autophagy Signaling. Pathol. Oncol. Res. 2019, 25, 1505–1517. [Google Scholar] [CrossRef] [PubMed]
- Barta, B.B.; Simon, Á.; Nagy, L.; Dankó, T.; Raffay, R.E.; Petővári, G.; Zsiros, V.; Sebestyén, A.; Sipos, F.; Műzes, G. Survival of HT29 cancer cells is influenced by hepatocyte growth factor receptor inhibition through modulation of self-DNA-triggered TLR9-dependent autophagy response. PLoS ONE 2022, 17, e0268217. [Google Scholar] [CrossRef]
- Li, M.; Sala, V.; Santis, M.C.D.; Cimino, J.; Cappello, P.; Pianca, N.; Bona, A.D.; Margaria, J.P.; Martini, M.; Lazzarini, E.; et al. Phosphoinositide 3-Kinase γ Inhibition Protects From Anthracycline Cardiotoxicity and Reduces Tumor Growth. Circulation 2018, 138, 696–711. [Google Scholar] [CrossRef]
- Chen, M.-Y.; Yadav, V.K.; Chu, Y.C.; Ong, J.R.; Huang, T.-Y.; Lee, K.-F.; Lee, K.-H.; Yeh, C.-T.; Lee, W.-H. Hydroxychloroquine (HCQ) Modulates Autophagy and Oxidative DNA Damage Stress in Hepatocellular Carcinoma to Overcome Sorafenib Resistance via TLR9/SOD1/hsa-miR-30a-5p/Beclin-1 Axis. Cancers 2021, 13, 3227. [Google Scholar] [CrossRef]
- Limagne, E.; Nuttin, L.; Thibaudin, M.; Jacquin, E.; Aucagne, R.; Bon, M.; Revy, S.; Barnestein, R.; Ballot, E.; Truntzer, C.; et al. MEK inhibition overcomes chemoimmunotherapy resistance by inducing CXCL10 in cancer cells. Cancer Cell 2022, 40, 136–152.e12. [Google Scholar] [CrossRef]
- Anunobi, R.; Boone, B.A.; Cheh, N.; Tang, D.; Kang, R.; Loux, T.; Lotze, M.T.; Zeh, H.J. Extracellular DNA promotes colorectal tumor cell survival after cytotoxic chemotherapy. J. Surg. Res. 2018, 226, 181–191. [Google Scholar] [CrossRef] [PubMed] [Green Version]
- Zhao, X.; Dong, Y.; Zhang, J.; Chen, C.; Gao, L.; Shi, C.; Fu, Z.; Han, M.; Tang, C.; Sun, P.; et al. Reversing immune evasion using a DNA nano-orchestrator for pancreatic cancer immunotherapy. Acta Biomater. 2023, 166, 512–523. [Google Scholar] [CrossRef]
- Jiang, H.; Chiang, C.Y.; Chen, Z.; Nathan, S.; D’Agostino, G.; Paulo, J.A.; Song, G.; Zhu, H.; Gabelli, S.B.; Cole, P.A. Enzymatic analysis of WWP2 E3 ubiquitin ligase using protein microarrays identifies autophagy-related substrates. J. Biol. Chem. 2022, 298, 101854. [Google Scholar] [CrossRef]
- Inokuchi, S.; Yoshizumi, T.; Toshima, T.; Itoh, S.; Yugawa, K.; Harada, N.; Mori, H.; Fukuhara, T.; Matsuura, Y.; Mori, M. Suppression of optineurin impairs the progression of hepatocellular carcinoma through regulating mitophagy. Cancer Med. 2021, 10, 1501–1514. [Google Scholar] [CrossRef] [PubMed]
- Zhang, Z.; Wang, N.; Ma, Q.; Chen, Y.; Yao, L.; Zhang, L.; Li, Q.; Shi, M.; Wang, H.; Ying, Z. Somatic and germline mutations in the tumor suppressor gene PARK2 impair PINK1/Parkin-mediated mitophagy in lung cancer cells. Acta Pharmacol. Sin. 2020, 41, 93–100. [Google Scholar] [CrossRef]
- Yan, C.; Gong, L.; Chen, L.; Xu, M.; Abou-Hamdan, H.; Tang, M.; Désaubry, L.; Song, Z. PHB2 (prohibitin 2) promotes PINK1-PRKN/Parkin-dependent mitophagy by the PARL-PGAM5-PINK1 axis. Autophagy 2020, 16, 419–434. [Google Scholar] [CrossRef]
- Yamano, K.; Kikuchi, R.; Kojima, W.; Hayashida, R.; Koyano, F.; Kawawaki, J.; Shoda, T.; Demizu, Y.; Naito, M.; Tanaka, K.; et al. Critical role of mitochondrial ubiquitination and the OPTN–ATG9A axis in mitophagy. J. Cell Biol. 2020, 219, e201912144. [Google Scholar] [CrossRef] [PubMed]
- Liu, Z.; Chen, P.; Gao, H.; Gu, Y.; Yang, J.; Peng, H.; Xu, X.; Wang, H.; Yang, M.; Liu, X.; et al. Ubiquitylation of Autophagy Receptor Optineurin by HACE1 Activates Selective Autophagy for Tumor Suppression. Cancer Cell 2014, 26, 106–120. [Google Scholar] [CrossRef] [PubMed] [Green Version]
- Li, S.; Yang, H.; Zhao, M.; Gong, L.; Wang, Y.; Lv, Z.; Quan, Y.; Wang, Z. Demethylation of HACE1 gene promoter by propofol promotes autophagy of human A549 cells. Oncol. Lett. 2020, 20, 12143. [Google Scholar] [CrossRef] [PubMed]
- Yu, Z.; Li, Y.; Han, T.; Liu, Z. Demethylation of the HACE1 gene promoter inhibits the proliferation of human liver cancer cells. Oncol. Lett. 2019, 17, 4361–4368. [Google Scholar] [CrossRef] [PubMed] [Green Version]
- Liu, S.; van Dinther, M.; Hagenaars, S.C.; Gu, Y.; Kuipers, T.B.; Mei, H.; Gomez-Puerto, M.C.; Mesker, W.E.; ten Dijke, P. Differential optineurin expression controls TGFβ signaling and is a key determinant for metastasis of triple negative breast cancer. Int. J. Cancer 2023, 152, 2594–2606. [Google Scholar] [CrossRef] [PubMed]
- Lv, D.; Yang, K.; Rich, J.N. Growth factor receptor signaling induces mitophagy through epitranscriptomic regulation. Autophagy 2023, 19, 1034–1035. [Google Scholar] [CrossRef] [PubMed]
- Ali, D.M.; Ansari, S.S.; Zepp, M.; Knapp-Mohammady, M.; Berger, M.R. Optineurin downregulation induces endoplasmic reticulum stress, chaperone-mediated autophagy, and apoptosis in pancreatic cancer cells. Cell Death Discov. 2019, 5, 128. [Google Scholar] [CrossRef] [Green Version]
- Hou, H.; Pan, H.; Liao, W.; Lee, C.; Yu, C. Autophagy in fibroblasts induced by cigarette smoke extract promotes invasion in lung cancer cells. Int. J. Cancer 2020, 147, 2587–2596. [Google Scholar] [CrossRef]
- Yi, J.; Zhu, J.; Wu, J.; Thompson, C.B.; Jiang, X. Oncogenic activation of PI3K-AKT-mTOR signaling suppresses ferroptosis via SREBP-mediated lipogenesis. Proc. Natl. Acad. Sci. USA 2020, 117, 31189–31197. [Google Scholar] [CrossRef]
- Pham, D.; Pun, N.T.; Park, P. Autophagy activation and SREBP-1 induction contribute to fatty acid metabolic reprogramming by leptin in breast cancer cells. Mol. Oncol. 2021, 15, 657–678. [Google Scholar] [CrossRef] [PubMed]
- Eguchi, A.; Mizukami, S.; Nakamura, M.; Masuda, S.; Murayama, H.; Kawashima, M.; Inohana, M.; Nagahara, R.; Kobayashi, M.; Yamashita, R.; et al. Metronidazole enhances steatosis-related early-stage hepatocarcinogenesis in high fat diet-fed rats through DNA double-strand breaks and modulation of autophagy. Environ. Sci. Pollut. Res. 2022, 29, 779–789. [Google Scholar] [CrossRef]
- Guan, M.; Fousek, K.; Chow, W.A. Nelfinavir inhibits regulated intramembrane proteolysis of sterol regulatory element binding protein-1 and activating transcription factor 6 in castration-resistant prostate cancer. FEBS J. 2012, 279, 2399–2411. [Google Scholar] [CrossRef] [PubMed]
- Zhou, C.; Qian, W.; Li, J.; Ma, J.; Chen, X.; Jiang, Z.; Cheng, L.; Duan, W.; Wang, Z.; Wu, Z.; et al. High glucose microenvironment accelerates tumor growth via SREBP1-autophagy axis in pancreatic cancer. J. Exp. Clin. Cancer Res. 2019, 38, 302. [Google Scholar] [CrossRef]
- Huang, Y.; Bell, L.N.; Okamura, J.; Kim, M.S.; Mohney, R.P.; Guerrero-Preston, R.; Ratovitski, E.A. Phospho-ΔNp63α/SREBF1 protein interactions: Bridging cell metabolism and cisplatin chemoresistance. Cell Cycle 2012, 11, 3810–3827. [Google Scholar] [CrossRef] [Green Version]
- Li, S.; Oh, Y.-T.; Yue, P.; Khuri, F.R.; Sun, S.-Y. Inhibition of mTOR complex 2 induces GSK3/FBXW7-dependent degradation of sterol regulatory element-binding protein 1 (SREBP1) and suppresses lipogenesis in cancer cells. Oncogene 2016, 35, 642–650. [Google Scholar] [CrossRef] [Green Version]
- Belmonte-Fernández, A.; Herrero-Ruíz, J.; Galindo-Moreno, M.; Limón-Mortés, M.C.; Mora-Santos, M.; Sáez, C.; Japón, M.Á.; Tortolero, M.; Romero, F. Cisplatin-induced cell death increases the degradation of the MRE11-RAD50-NBS1 complex through the autophagy/lysosomal pathway. Cell Death Differ. 2023, 30, 488–499. [Google Scholar] [CrossRef] [PubMed]
- Gou, W.; Shen, D.; Yang, X.; Zhao, S.; Liu, Y.; Sun, H.; Su, R.; Luo, J.; Zheng, H. ING5 suppresses proliferation, apoptosis, migration and invasion, and induces autophagy and differentiation of gastric cancer cells: A good marker for carcinogenesis and subsequent progression. Oncotarget 2015, 6, 19552–19579. [Google Scholar] [CrossRef] [PubMed] [Green Version]
- Ding, X.-Q.; Zhao, S.; Yang, L.; Zhao, X.; Zhao, G.-F.; Zhao, S.-P.; Li, Z.-J.; Zheng, H.-C. The nucleocytoplasmic translocation and up-regulation of ING5 protein in breast cancer: A potential target for gene therapy. Oncotarget 2017, 8, 81953–81966. [Google Scholar] [CrossRef] [PubMed] [Green Version]
- Zhang, Z.; Guo, M.; Li, Y.; Shen, M.; Kong, D.; Shao, J.; Ding, H.; Tan, S.; Chen, A.; Zhang, F.; et al. RNA-binding protein ZFP36/TTP protects against ferroptosis by regulating autophagy signaling pathway in hepatic stellate cells. Autophagy 2020, 16, 1482–1505. [Google Scholar] [CrossRef]
- Xie, C.-M.; Sun, Y. The MTORC1-mediated autophagy is regulated by the FBXW7-SHOC2-RPTOR axis. Autophagy 2019, 15, 1470–1472. [Google Scholar] [CrossRef]
- Xie, C.-M.; Tan, M.; Lin, X.-T.; Wu, D.; Jiang, Y.; Tan, Y.; Li, H.; Ma, Y.; Xiong, X.; Sun, Y. The FBXW7-SHOC2-Raptor Axis Controls the Cross-Talks between the RAS-ERK and mTORC1 Signaling Pathways. Cell Rep. 2019, 26, 3037–3050.e4. [Google Scholar] [CrossRef] [Green Version]
- Qin, S.; Wang, G.; Chen, L.; Geng, H.; Zheng, Y.; Xia, C.; Wu, S.; Yao, J.; Deng, L. Pharmacological vitamin C inhibits mTOR signaling and tumor growth by degrading Rictor and inducing HMOX1 expression. PLOS Genet. 2023, 19, e1010629. [Google Scholar] [CrossRef]
- Lan, H.; Tan, M.; Zhang, Q.; Yang, F.; Wang, S.; Li, H.; Xiong, X.; Sun, Y. LSD1 destabilizes FBXW7 and abrogates FBXW7 functions independent of its demethylase activity. Proc. Natl. Acad. Sci. USA 2019, 116, 12311–12320. [Google Scholar] [CrossRef] [Green Version]
- Feng, X.; Zou, B.; Nan, T.; Zheng, X.; Zheng, L.; Lan, J.; Chen, W.; Yu, J. MiR-25 enhances autophagy and promotes sorafenib resistance of hepatocellular carcinoma via targeting FBXW7. Int. J. Med. Sci. 2022, 19, 257–266. [Google Scholar] [CrossRef]
- Wang, H.; Chen, J.; Zhang, S.; Zheng, X.; Xie, S.; Mao, J.; Cai, Y.; Lu, X.; Hu, L.; Shen, J.; et al. MiR-223 regulates autophagy associated with cisplatin resistance by targeting FBXW7 in human non-small cell lung cancer. Cancer Cell Int. 2020, 20, 258. [Google Scholar] [CrossRef] [PubMed]
- Li, A.S.; Reuter, J.A.; Cenik, C.; Synder, M.P. Abstract 2457: Investigating the functional significance of novel, recurrent noncoding mutations of TBC1D12 in bladder cancer. Cancer Res. 2017, 77, 2457. [Google Scholar] [CrossRef]
- Januchowski, R.; Zawierucha, P.; Ruciński, M.; Nowicki, M.; Zabel, M. Extracellular Matrix Proteins Expression Profiling in Chemoresistant Variants of the A2780 Ovarian Cancer Cell Line. Biomed Res. Int. 2014, 2014, 365867. [Google Scholar] [CrossRef] [PubMed] [Green Version]
- Lou, W.; Ding, B.; Zhong, G.; Yao, J.; Fan, W.; Fu, P. RP11-480I12.5-004 Promotes Growth and Tumorigenesis of Breast Cancer by Relieving miR-29c-3p-Mediated AKT3 and CDK6 Degradation. Mol. Ther.-Nucleic Acids 2020, 21, 916–931. [Google Scholar] [CrossRef] [PubMed]
- Mamoor, S. Differential Expression of Tubulin α 3d in Human Epithelial Ovarian Cancer; OSF: Charlottesville, VA, USA, 2021; pp. 1–10. [Google Scholar]
- Nami, B.; Wang, Z. Genetics and Expression Profile of the Tubulin Gene Superfamily in Breast Cancer Subtypes and Its Relation to Taxane Resistance. Cancers 2018, 10, 274. [Google Scholar] [CrossRef] [Green Version]


Disclaimer/Publisher’s Note: The statements, opinions and data contained in all publications are solely those of the individual author(s) and contributor(s) and not of MDPI and/or the editor(s). MDPI and/or the editor(s) disclaim responsibility for any injury to people or property resulting from any ideas, methods, instructions or products referred to in the content. |
© 2023 by the authors. Licensee MDPI, Basel, Switzerland. This article is an open access article distributed under the terms and conditions of the Creative Commons Attribution (CC BY) license (https://creativecommons.org/licenses/by/4.0/).
Share and Cite
Murillo Carrasco, A.G.; Giovanini, G.; Ramos, A.F.; Chammas, R.; Bustos, S.O. Insights from a Computational-Based Approach for Analyzing Autophagy Genes across Human Cancers. Genes 2023, 14, 1550. https://doi.org/10.3390/genes14081550
Murillo Carrasco AG, Giovanini G, Ramos AF, Chammas R, Bustos SO. Insights from a Computational-Based Approach for Analyzing Autophagy Genes across Human Cancers. Genes. 2023; 14(8):1550. https://doi.org/10.3390/genes14081550
Chicago/Turabian StyleMurillo Carrasco, Alexis Germán, Guilherme Giovanini, Alexandre Ferreira Ramos, Roger Chammas, and Silvina Odete Bustos. 2023. "Insights from a Computational-Based Approach for Analyzing Autophagy Genes across Human Cancers" Genes 14, no. 8: 1550. https://doi.org/10.3390/genes14081550