
Genome-Wide Identification and Functional Analysis of the GASA Gene Family Responding to Multiple Stressors in Canavalia rosea

1
Guangdong Provincial Key Laboratory of Applied Botany, South China Botanical Garden, Chinese Academy of Sciences, Guangzhou 510650, China
2
Key Laboratory of South China Agricultural Plant Molecular Analysis and Genetic Improvement, South China Botanical Garden, Chinese Academy of Sciences, Guangzhou 510650, China
3
Key Laboratory of Vegetation Restoration and Management of Degraded Ecosystems, South China Botanical Garden, Chinese Academy of Sciences, Guangzhou 510650, China
4
Key Laboratory of Carbon Sequestration in Terrestrial Ecosystem, South China Botanical Garden, Chinese Academy of Sciences, Guangzhou 510650, China
*
Authors to whom correspondence should be addressed.
Genes 2022, 13(11), 1988; https://doi.org/10.3390/genes13111988
Submission received: 26 August 2022
/
Revised: 25 October 2022
/
Accepted: 26 October 2022
/
Published: 31 October 2022
(This article belongs to the Special Issue Genetics of Abiotic Stress Tolerance in Plants)
Abstract
:In plants, the Gibberellic Acid-Stimulated Arabidopsis (GASA) gene family is unique and responds to ubiquitous stress and hormones, playing important regulatory roles in the growth and development of plants, as well as in the resistance mechanisms to biotic and abiotic stress. In this study, a total of 23 CrGASAs were characterized in C. rosea using a genome-wide approach, and their phylogenetic relationships, gene structures, conserved motifs, chromosomal locations, gene duplications, and promoter regions were systematically analyzed. Expression profile analysis derived from transcriptome data showed that CrGASAs are expressed at higher levels in the flowers or fruit than in the leaves, vines, and roots. The expression of CrGASAs also showed habitat- and environmental-stress-regulated patterns in C. rosea analyzed by transcriptome and quantitative reverse transcription PCR (qRT-PCR). The heterologous induced expression of some CrGASAs in yeast enhanced the tolerance to H2O2, and some CrGASAs showed elevated heat tolerance and heavy metal (HM) Cd/Cu tolerance. These findings will provide an important foundation to elucidate the biological functions of CrGASA genes, especially their role in the ecological adaptation of specific plant species to tropical islands and reefs in C. rosea.
1. Introduction
Plant-specific Gibberellic Acid-Stimulated Arabidopsis (GASA) genes, which exist extensively, encode a series of small cysteine-rich proteins with high evolutionary conservation that are characterized by a signaling amino acid region at their N-terminus and a conserved cysteine-rich domain (GASA domain) at the C-terminus [1,2]. GASA proteins are also named snakin, because the early-discovered Snakin-1 (SN1) from potato (Solanum tuberosum) shares two conserved regions with snake venom kistrin, even though it typically lacks the residues responsible for the desintegrin action of the venom [3,4]. Previously, the GASA gene was primarily called GAST (Gibberellic Acid-Stimulated Transcript) due to its expression being obviously induced by exogenous gibberellic acid (GA) in tomato (GAST1, Solanum lycopersicum) [5]. In Petunia hybrida, this gene family was also called the Gibberellin-Induced gene from Petunia (GIP) [6], and in rice it was named Gibberellic Acid-Stimulated Rice (OsGASR) [7]. A typical feature of GASA proteins is that they all have 12 conserved cysteine residues at constant positions at the C-terminal region, while a putative signal peptide at the N-terminus is closely followed by a variable hydrophilic region in the middle part. The GASA domain consists of a highly conserved 12-Cys motif, “XnCX3CX2RCX8 (9)CX3CX2CCX2CXCVPXGX2GNX3CPCYX10(14)KCP,” in which R is arginine, V is valine, P is proline, G is glycine, Y is tyrosine, K is lysine, and X represents any of the other 20 amino acids, except for cysteine [1].
Plant GASAs have been proven to play multiple potential roles in plant growth and development, particularly flower induction and seed development [6,8,9]. GASA proteins participate in hormonal signaling pathways, mainly gibberellic acid, and including other hormones, such as ethylene, brassinosteroid, abscisic acid, jasmonic acid, and salicylic acid [10,11,12,13,14,15,16]. GASA proteins are a type of plant antimicrobial peptide (AMP) and play different roles in response to a variety of pathogens, including bacteria, fungi, and even nematodes [4,17,18,19]. Moreover, evidence has demonstrated that GASA proteins could participate in abiotic stress tolerance, probably by acting as cellular integrators or playing roles in redox regulation [12,20,21,22].
Although many previous studies have shown that most GASA homologues are involved in numerous biological processes, mainly including the development of plant flowering, seed development, fruit growth, and cell elongation in vegetative organs [8,9,12,23,24,25], the study of plant GASA genes is of great significance for elucidating the molecular mechanisms of defense and stress resistance in plants [12]. Due to sessile features, plants must encounter various abiotic stressors, including salt, drought, heavy metals, extreme temperatures, chemical toxicity, and nutrient deficiencies [26]. To survive these abiotic stressors, plants have developed a series of physiological, molecular, and biochemical strategies, including enhancing the content of antioxidants, accumulating cellular stress proteins as molecular chaperones, inducing the expression of resistance genes, or adjusting cellular constituents or compatible solutes. Many previous studies have shown that GASAs are a group of environmental-stress-responsive proteins that play crucial roles both in protecting against insects and disease and in regulating multiple abiotic stressors [27].
The first plant GASA gene was identified from tomato in 1992 [5], and the first functionally defined plant GASA/snakin peptide was potato Snakin-1 (StSN1) from its tubers [3]. An increasing number of plant GASA genes have been cloned and systematically studied in a variety of plant species, forming pathogen resistance and plant developmental process points [19,28]. The Arabidopsis GASA gene family consists of 15 members, from GASA1 to GASA15 [2,28], and only five members (GASA4, 5, 6, 10, and 14) have been characterized, with functions including phytohormonal signaling integrators, interaction partners of protein complexes, and metalloproteins with antioxidant capacity [29,30]. In studies of abiotic stress responses, different GASA genes have presented specific roles. For example, overexpression of AtGASA4 in Arabidopsis could enhance tolerance to heat stress, probably by suppressing the accumulation of reactive oxygen species (ROS) [21]. The expression of AtGASA4 and AtGASA6 was generally upregulated by growth hormones (auxin, BR, cytokinin, and GA) and downregulated by stress hormones (ABA, JA, and SA), while the overexpression of AtGASA6 caused early flowering in Arabidopsis [16]. Conversely, overexpression of AtGASA5 in Arabidopsis can increase its sensitivity to heat stress [22], and this gene may be suppressed by GA [15]. AtGASA14 is a specific member due to its extraordinary proline-rich protein (PRP) domain in the N-terminal region. Overexpression of AtGASA14 in Arabidopsis showed elevated abscisic acid (ABA) and salt tolerance and a better ability to scavenge ROS than wild-type plants [12]. The Gerbera hybrida GASA genes GIP2, GIP4, and GIP5 are induced by H2O2, and the overexpression of GIP2 in transgenic petunia shows reduced H2O2 levels after osmotic stress or ABA treatment [20]. Rice GASA genes’ expression levels were regulated by different abiotic stressors, including salt, drought, cold, heat, and metal stress [28]. In Eucalyptus globulus, the Snakin-2 gene was upregulated by metal stress combined with infection by the rhizospheric microorganism Chaetomium cupreum [31]. In general, systematic research on GASA genes’ involvement in abiotic stress responses is limited, but research has indicated that the GASA gene family might be significantly involved in responding to external stimuli and environmental suitability in plants.
Until now, many GASA gene families have been identified using whole-genome analyses in a wide variety of plant species [2]. Maize possesses 10 GASA members [32], and at least 10 OsGASR members were identified in the rice GASA family [28]. The GmGASA family has 37 members [33] in the ancient tetraploid soybean, while, in the common wheat genome (Triticum aestivum, hexaploid), there are 37 designated GASA genes [34]. Given the importance of plant GASAs as key growth regulators and antimicrobial peptides in some non-food cash crops, GASAs have attracted increasing attention in studies of plant–pathogen resistance, stress tolerance, and growth regulation. For example, in the apple (Malus domestica) genome, there are 26 MdGASA genes, and some members are involved in flower induction [35]. Poplar is an important tree species for shelterbelt and timber forests, and there are 21 candidate GASAs in Populus trichocarpa and 19 in Populus euphratica. Some members are widely involved in hormone responses, growth, and development for vegetative organs, and drought stress responses [36,37]. Grapevine (Vitis vinifera) is a major fruit crop, and the demand for seedless grapes is greatly increasing. Some VvGASA genes might play roles during different phases of seed development and in different tissues in seedless grape cultivars [38]. The Citrus clementina canker pathogen Xanthomonas citri is the primary cause of citrus loss; some GASAs in the 18-member CcGASA family are speculated to respond to X. citri infection [39]. Tobacco (Nicotiana tabacum) has 18 GASA genes, and some NtGASAs display unique or distinct expression patterns in different tissues, suggesting their potential roles in tobacco plant growth and development [40].
Canavalia rosea is a perennial twining herb distributed in the semi-arid and saline–alkali areas of coastal regions; it has shown great halotolerance and multiple resistance to many environmental adversities, including drought, salinity/alkaline, heat, and low nitrogen and phosphorous stress. Additionally, as a mangrove-associated species distributed in tropical and subtropical areas, C. rosea also has the potential to absorb or enrich heavy metals (HMs) at beaches or near river estuaries. Therefore, C. rosea can be used as a pioneer species with good wind-breaking and sand-fixing in the ecological reconstruction of tropical coral reefs or for phytoremediation with the protection of coastal belts. It is of particular interest to identify the gene-regulatory network involved in environmental adaptation in C. rosea. The GASA gene family has been confirmed to be involved in numerous physiological and biological processes, displaying complex and diverse functions.
In this study, we performed the genome-wide characterization of the GASA genes in C. rosea to explore the potential roles of these family members in the adaptation of C. rosea to tropical coastal regions or coral islands. In total, 23 putative CrGASA genes were identified in the C. rosea genome and subjected to phylogenetic, gene structure, motif, and chromosomal location analyses. The tissue-specific expression profiles, as well as the differential expression profiles of CrGASAs under abiotic stress, were also analyzed. Moreover, several CrGASA genes were cloned and expressed in yeast for the further identification of the CrGASAs’ functions in stress tolerance. Our results provide a platform for the further investigation of the functions of CrGASAs in the adaptation of C. rosea to multiple stress conditions on tropical coral islands and reefs, as well as providing significant insights into the function of plant GASAs as promising candidate genes for breeding HM-related phytoremediation.
2. Materials and Methods
2.1. Plant Materials and Stress Treatments
The seeds of C. rosea were collected from the coastal regions of Hainan Province, China, in 2019. C. rosea seedlings were cultivated under normal conditions (22 °C, with a photoperiod of 16 h light/8 h darkness) in the South China Botanical Garden (SCBG, 23°18′76″ N, 113°37′02″ E). The mature leaf samples were taken from perennial C. rosea plants growing on Yongxing Island (YX, 16°83′93′′ N, 112°34′00″ E) and SCBG. One-month-old C. rosea seedlings were used for various abiotic or heavy metal (HM) stress treatments, and the leaves and roots were collected separately after stress treatment, immediately frozen in liquid nitrogen, and stored at −80 °C for subsequent use. In brief, the seedlings were soaked in 600 mM NaCl, 150 mM NaHCO3 (pH 8.2), 300 mM mannitol, and 45 °C pre-warmed 1/2 Hoagland solution for high salinity, alkaline, high osmotic, and heat stress, respectively. For HM stress, C. rosea seedlings were subjected to 0.1 mM CdCl2, 0.5 mM ZnSO4, 1 mM MnCl2, and 0.1 mM CuSO4 solutions with the roots submerged. Plant tissues were collected at different time points (2 and 48 h for RNA-seq and qRT-PCR). Three independent biological replicates were used.
2.2. Identification, Ka/Ks Calculation, and Evolutionary Analyses of the CrGASA Family in C. rosea
Whole-genome sequencing was performed, and the whole genomic DNA sequence information was submitted to GenBank (Accession No.: JACXSB000000000), which will be released on 16 September 2024. The assembled genome data of C. rosea were annotated with the InterPro [41] and Pfam [42] databases for gene identification and DIAMOND [43] and InterProscan [41] for all C. rosea protein information with conserved domains and motifs (e < 1 × 10⁻⁵). The Pfam ID (GASA domain, PF02704) was used to search for CrGASA family members, and putative sequences of CrGASA proteins were identified and submitted to the NCBI Conserved Domain Database (https://www.ncbi.nlm.nih.gov/Structure/cdd/wrpsb.cgi (accessed on 1 March 2022)) to confirm the presence of the GASA domain.
The nucleotide and protein sequences of CrGASA members were tracked from the genome database of C. rosea, and the gene names were appointed according to their positions on the 11 chromosomes (from chromosomes 1 to 11 and one scaffold, CrGASA1 to CrGASA23). Then, the isoelectric point, number of amino acids, and molecular weight of CrGASAs were predicted using the ExPASy tool (http://web.expasy.org/protparam/ (accessed on 1 March 2022)). The protein sequences of GASAs from Arabidopsis (15 AtGASAs) [28], rice (11 OsGASRs; note that, compared with the related reference, we added a new putative rice GASA protein by Pfam search, LOC_Os03g14550.1, as OsGASR1, and the other ten OsGASRs listed in the reference were correspondingly designated as OsGASR2-11) [28], and soybean (37 GmGASAs) [33] were used to construct a phylogenetic tree using MEGA 6.0 with the neighbor-joining (NJ) method and a bootstrap test of 1000 replicates. The Gene Structure Display Server (http://gsds.cbi.pku.edu.cn (accessed on 1 March 2022)) was used to predict the exon/intron structures of each CrGASA. The conserved motifs of CrGASA proteins were analyzed using the Multiple Em for Motif Elicitation (MEME) software (http://meme-suite.org/tools/meme (accessed on 1 March 2022)), with a maximum of 10 motifs and a maximum width of between 6 and 50 amino acids.
2.3. Chromosomal Location and Sequence Alignments
All CrGASAs were mapped to 11 C. rosea chromosomes and scaffolds based on physical location information from the database for C. rosea genomic sequence information using MG2C 2.1 (http://mg2c.iask.in/mg2c_v2.1/ (accessed on 1 March 2022)). The synonymous and non-synonymous substitution rates (Ks and Ka, respectively) and the probability (p-value) of Fisher’s exact test of neutrality were calculated to explore the selective pressures on the duplication of CrGASAs based on all nucleotide sequences, using the Nei–Gojobori model with 1000 bootstrap replicates [44]. Gene segmental duplication events of the CrGASA family were analyzed using the MCScanX software (http://chibba.pgml.uga.edu/mcscan2/ (accessed on 1 March 2022)), and tandem duplications were identified manually. The protein sequences of the CrGASAs were aligned using ClustalW (http://www.clustal.org/ (accessed on 1 March 2022)) and visualized with GeneDoc (https://github.com/karlnicholas/GeneDoc (accessed on 1 March 2022)). The WebLogo platform (http://weblogo.berkeley.edu/logo.cgi (accessed on 1 March 2022)) was used to generate and analyze the sequence logos.
2.4. Cis-Regulatory Element Analysis of CrGASA Promoters
The predicted cis-regulatory elements were scanned using the PlantCARE program (http://bioinformatics.psb.ugent.be/webtools/plantcare/html/ (accessed on 1 March 2022)), searching the promoter regions (1000 bp upstream from the translation start site) of all CrGASAs. After sorting the cis-regulatory elements obtained from PlantCARE, the results were visualized and mapped to the CrGASA promoters using TBtools software [45].
2.5. RNA-Seq of Different C. rosea Tissues under Different Stress Treatments
Tissue-specific expression profile analysis for CrGASAs during different developmental stages of C. rosea was conducted using Illumina HiSeq X sequencing technology. Five different tissues from C. rosea plants (root, vine, young leaf, flower bud, and young silique samples) were collected from C. rosea adult plants and seedlings growing in the SCBG; mature leaf samples from C. rosea growing in SCBG and on YX Island were examined using FastQC (http://www.bioinformatics.babraham.ac.uk/projects/fastqc/ (accessed on 1 March 2022)) based on the primary 40 Gb clean reads and were mapped to the C. rosea reference genome using Tophat v.2.0.10 (http://tophat.cbcb.umd.edu/ (accessed on 1 March 2022)). For the expression profiles of CrGASAs under different abiotic stress treatments, C. rosea seedling tissues (including leaves and roots) were also collected and sequenced at the transcriptome level. Then, all EST information was mapped to the C. rosea reference genome. Gene expression levels were calculated as fragments per kilobase (kb) of transcript per million mapped reads (FPKM) according to the length of the gene and the read counts mapped to the gene: FPKM = total exon fragments/[mapped reads (millions) × exon length (kb)]. The expression levels of CrGASAs were visualized as clustered heatmaps (log2) using TBtools, which were directly shown with FPKM values by Microsoft Excel 2010.
2.6. Expression Pattern Analysis Using Quantitative Reverse Transcription (qRT)-PCR
The total RNA was extracted from the same tissues for RNA-seq assays using a plant RNA extraction kit (TIANGEN, Beijing, China), and cDNA was synthesized using AMV reverse transcriptase (TransGen Biotech, Beijing, China) according to the manufacturer’s instructions. The total RNA and cDNA concentration and quality were tested using a NanoDrop 1000 (Thermo Fisher Scientific, Waltham, MA, USA), with the integrity of the total RNA being checked on 1% agarose gel. qRT-PCR was used to analyze the relative expression levels of the CrGASAs. The housekeeping gene CrEF-1α was used as a reference. The sequences of the primers are listed in Table S1. In brief, the qRT-PCR was carried out for six selected genes (CrGASA2, CrGASA3, CrGASA7, CrGASA13, CrGASA14, and CrGASA16) using 2 × Ultra SYBR Green qPCR Mix (CISTRO BIO, Guangzhou, China) on a LightCycler480 system (Roche, Basel, Switzerland), according to the manufacturer’s instructions. The relative expression levels of the members of the CrGASA were displayed with the 2−∆∆CT method.
2.7. Functional Identification with a Yeast Expression System
The open reading frames (ORFs) of the CrGASAs were PCR-amplified from different cDNA samples of C. rosea with gene-specific primer pairs (listed in Table S1). After several PCR procedures, the PCR fragments were purified and cloned into the BamHI and EcoRI sites of pYES2 to yield recombinant plasmids of CrGASAs-pYES2 and sequenced. The Saccharomyces cerevisiae wild-type (WT) strain BY4741 (Y00000) and six deletion mutant strains skn7Δ (Y02900), ycf1Δ (Y04069), pmr1Δ (Y04534), cot1Δ (Y01613), smf1Δ (Y06272), and cup2Δ (Y04533) were obtained from Euroscarf (http://www.euroscarf.de (accessed on 1 March 2022)). The double-mutant strain zrc1Δ/cot1Δ was obtained from Sanders’ lab [46]. The plasmids were introduced into yeast using the LiAc/PEG method. These CrGASA proteins will be expressed under the induction of 2% galactose in medium, with the control of galactose-induced promoter ProGAL1. Yeast growth and metal sensitivity tests were performed as previously described [47]. Single colonies of yeast transformants were selected and used to inoculate a liquid synthetic drop-out uracil medium with 2% galactose (SDG-Ura) medium. It was then incubated overnight or longer at 30 °C, diluted with fresh pre-warmed SDG medium (volume ratio 1:10), and incubated with vigorous shaking for approximately 30 h at 30 °C to reach an optical density of 1 at OD600 (optical density at 600 nm). The cells were then serially diluted in 10-fold steps, and 2 μL aliquots of each were finally spotted onto SDG medium plates with or without HM stressors. To determine heat tolerance, the liquid yeast cultures were incubated in a constant-temperature bath (52 °C) at different durations (WT for 30 min and skn7Δ for 15 min); then, the cultures were spotted on solid SDG medium plates. Plates were incubated at 30 °C for 2 to 5 days and photographed.
2.8. Statistical Analyses
All analyses were conducted at least in triplicate, with the results shown as the mean ± SD (n ≥ 3). The Excel 2010 (Microsoft Corporation, Albuquerque, NM, USA) statistics program was used to perform statistical analyses.
3. Results
3.1. Overview of the C. rosea CrGASA Gene
In total, 23 CrGASA genes were identified from the C. rosea genome based on Pfam and NCBI Conserved Domain Database confirmation with other GASA proteins. CrGASA family sequence information is listed in Table S2. In addition, based on chromosome localization, the 23 CrGASA genes were named CrGASA1–CrGASA23. Among them, CrGASA1–CrGASA22 were located on nine chromosomes across the C. rosea genome (including 11 chromosomes), and only CrGASA23 was located on one of the scaffolds, due to less-than-perfect genome assembly (Figure 1). Chromosomes 02 and 04 each contained four CrGASA genes, and chromosomes 06 and 07 each contained three genes. Chromosomes 03, 05, and 08 each had two CrGASA genes, while chromosomes 01 and 11 and an unassembled scaffold each contained only one. The physicochemical properties were estimated using the ExPASy server, and the CrGASAs’ length ranged from 70 (CrGASA19) to 233 aa (CrGASA17), and the MWs ranged from 7.86 to 24.55 kDa. The theoretical isoelectric point (pI) values were all greater than 8, and over half of the CrGASA members (13) presented a higher instability index (II) >40, indicating that these proteins are unstable in vivo. The aliphatic index ranged from 25.14 (CrGASA19) to 90.69 (CrGASA15), and most of the grand average hydropathicity values (GRAVY) were below 0, which indicated that although CrGASAs had different aliphatic amino acid content, most of the CrGASAs were hydrophilic. The transmembrane and 3D structure prediction showed that most of the CrGASAs had one or two transmembrane helices (TMHs), indicating their possible movement or redistribution across membranes. Moreover, the subcellular localization prediction that more than half of the CrGASA members were secretory proteins further supported the notion that CrGASAs are cellular shuttle proteins. The physicochemical characteristics of the CrGASAs are summarized in Table 1.
3.2. Phylogenetic Analysis and Multiple Sequence Alignment of CrGASA Members
To characterize the phylogenetic relationships among GASAs from different species, an unrooted NJ phylogenetic tree was constructed with 15 AtGASAs from Arabidopsis, 11 OsGASRs from rice, 37 GmGASAs from soybean, and 23 CrGASAs from C. rosea. All GASA proteins were divided into three groups (G1, G2, and G3) (Figure 2), which showed that there was a close relationship between the candidate CrGASA proteins in each of the three subgroups. In general, due to C. rosea being a leguminous plant species, the CrGASAs showed more close evolutionary relationships with GmGASAs from soybean (Leguminosae) than GASAs from Arabidopsis (Brassicaceae) and rice (Gramineae). There were more members of the G2 group in C. rosea than in most other plants [35,38,39], and the CrGASAs were almost evenly distributed in the three subgroups. Different from this, in the soybean genome, the G2 group number of GmGASA was also obviously smaller than that of G1 and G3 [33].
As shown in previous studies, most plant GASAs have a highly conserved C-terminal domain containing 12 conserved cysteines, designated as the GASA domain (containing 60 amino acids). Here, we aligned 23 CrGASAs’ conserved domains, in which we found that there were several variations in the positions of cysteines, including the second cysteine in CrGASA5, the eighth cysteine in CrGASA12, and the fifth cysteine in CrGASA20. Except for CrGASA12, the others ended with “KCP” at the C-terminus (Figure 3). After knocking out the genome sequencing factors, the GASA domains in the CrGASA family seemed to be more variable than in other plants [40].
The selection process history of the CrGASA genes has also been predicted through the Ka (non-synonymous substitution rate)/Ks (synonymous substitution rate) ratio, and the positive, negative (purifying), or neutral selection for CrGASA genes was considered when the ratio was >1, <1, or = 1, respectively. All segmental duplicates had Ka/Ks values less than 1 (Table 2), indicating that these gene pairs evolved under the influence of purifying selection. The distribution of segmental duplication of CrGASAs in C. rosea chromosomes is shown in Figure S1.
3.3. Analysis of CrGASA Proteins’ Conserved Motifs and Gene Structures
Four conserved protein motifs were identified in the CrGASA proteins, mainly due to their relatively short peptide chain lengths (70–233 aa). The highly conserved motifs 1 (KCARRCSKASRKKRCMRFCGTCCSKCKCVPPGTYGNKEEC) and 2 (CYNBLKTKGGKPKCP) merged to form the GASA domain, while motifs 3 (AKFLLVLILALIAISMLKTRVMASSADGC) and 4 (YGPGSLKSYQC) were more variable in different CrGASA members (Figure 4A,B).
Exon–intron structures were generated based on annotated C. rosea genome sequencing information using the Gene Structure Display Server program (Figure 4C). Even encoding relatively small proteins (70–233 aa), all CrGASA genes contain introns and some of them seem to be large (CrGASA22 and CrGASA23), which is similar to that in other plant species [33,40]. Interestingly, in the highly homologous gene pairs CrGASA18 and CrGASA23, CrGASA3 and CrGASA11, and CrGASA2 and CrGASA16, the gene structures were not very similar, and they had different numbers of exons.
3.4. Abiotic Stress-Related Cis-Regulatory Elements in CrGASA Promoters
To gain further insights into the regulatory mechanisms of CrGASA genes, a 1-kb promoter region upstream of the start codon (ATG) was isolated based on the C. rosea genome sequence and analyzed to identify potential cis-regulatory elements. These elements are listed in Figure 5 and Table S3. Several plant hormone-related cis elements, including MeJA, auxin, gibberellin, salicylic acid, ethylene, and ABA, accounted for a larger portion of the total elements. Wound-responsive (WUN motif), defense and stress responsiveness (TC-rich repeats), and pathogen-inducible (as-1) elements were also widely distributed in these promoters, which might be closely related to CrGASAs’ function as defense-related genes. Moreover, cis elements involved in endosperm development (GCN4_motif) and meristem-specific expression (CAT-box) were identified in the promoters of several CrGASAs. Additionally, MYC- and MYB-binding sites were abundant, indicating that some CrGASAs were involved in drought-inducibility gene expression or other abiotic stressors (Figure 5). The presence of multiple cis-regulatory elements in CrGASAs’ promoter regions indicates the possible roles of this gene family in various physiological and biological processes, although this prediction needs to be further verified by experiments.
3.5. Tissue- and Habitat-Specific Expression Profiles of CrGASAs
The expression patterns of the 23 CrGASAs were investigated in different tissues or organs using RNA-seq to further verify their roles in regulating the growth and development of C. rosea. Five tissues or organs (root, vine, leaf, flower bud, and young fruit) from C. rosea plants were analyzed (Figure 6A). In general, the expression levels of most CrGASAs were relatively low in the roots, while, in the reproductive organs (flowers and fruit), CrGASAs presented higher expression levels overall. In the actively growing vines and leaves, some of the CrGASAs also showed high expression while being slightly lower than in flowers and fruit. The unique expression patterns showed that CrGASAs had strong spatiotemporal and tissue specificity in C. rosea plants, which might further suggest their obvious biological roles, most related to the vegetative growth and reproduction of C. rosea.
Canavalia rosea plants have a great advantage in adapting to multiple adversities on tropical coral islands or reefs, and plant GASA gene families have been found to be modulated by various abiotic stressors. In this regard, we performed a gene expression analysis of two mature leaf samples gathered from SCBG and YX Island (Figure 6B). The FPKM values for the above RNA-seq assays are listed in Table S4. We noted that more than half of the CrGASAs had relatively low expression in both samples, while several members, such as CrGASA5, CrGASA8, CrGASA9, CrGASA10, CrGASA11, CrGASA14, CrGASA17, CrGASA20, and CrGASA21, showed relatively higher expression in the YX sample than in the SCBG sample, which indicated that these genes might play positive regulatory roles in this halophyte’s adaptation to coral island or reef habitats. Additionally, CrGASA2 and CrGASA16 showed higher expression in SCBG than in YX, suggesting that these two genes act on growth regulation, since the C. rosea plants showed better growth potential in SCBG under better care and with better nutrients than those on YX Island.
3.6. Expression Profile of CrGASA Genes in Response to Abiotic Stresses
The promoter analysis of CrGASAs suggested that these genes are involved in the response of C. rosea to different stressors. In this study, the transcriptional expression of CrGASAs in C. rosea seedlings was analyzed by RNA-seq after salt, alkaline, high osmotic, and heat stresses to mimic the extreme adversities of C. rosea’s original habitats on tropical coral islands or reefs. The expression patterns of CrGASAs under different challenges showed diverse changes compared to the controls. Overall, the expression levels of most CrGASAs in seedling leaves were much higher than those in roots, which might further indicate that CrGASAs are cellularly widely distributed, small proteins that work as protective molecules in ground substances and mainly play important roles in tissues’ exuberant growth. In general, after high salinity treatment, some CrGASAs were induced immediately in roots after 2 h, and in the challenge lasting 48 h, more than half of the CrGASAs were induced in roots and leaves. Accordingly, alkaline and high osmotic stress caused only a small portion of CrGASAs to be upregulated after 2 h and 48 h of treatment (Figure 7). Notably, 2 h heat stress also had an enormous influence on the expression levels of the CrGASAs, manifested in the mass inhibition of CrGASAs’ expression in roots, while obvious induction of most CrGASAs was expressed in the leaves. These data suggest that different CrGASAs may have specific functions, whereas the regulation patterns for CrGASAs could be tissue-specific and show multiple instances of functional differentiation.
As some plant GASA genes have been proven to be regulated by heavy metals [31,48], we further investigated the expression patterns of CrGASAs in response to different metal stressors, including cadmium (Cd), zinc (Zn), copper (Cu), and manganese (Mn). After 2 h of Cd treatment, the expression of CrGASA3, CrGASA5, CrGASA10, and CrGASA15 was obviously induced in both root and leaf samples, while, after 48 h, the expression of the CrGASA family seemed to be inhibited, probably caused by C. rosea plant growth inhibition due to Cd toxicity. With the Zn and Cu stress challenges, the long-term treatments (48 h) resulted in the apparent upregulation of several CrGASAs, while the effects of 2 h of stress were indistinctive. Mn stress also induced the expression of some CrGASAs in the leaves (2 h) and roots (48 h) of C. rosea (Figure 8). The FPKM values for the above RNA-seq assays are listed in Table S4.
3.7. qRT-PCR Analysis of CrGASAs
The expression levels of several CrGASAs were measured by qRT-PCR experiments to further determine whether transcript changes were associated with abiotic stress, mainly based on the RNA-seq results, and to choose the target CrGASAs with significant FPKM changes. Six CrGASAs were selected for qRT-PCR verification assays, and these assays were all repeated for three biological replicates. Here, the figures show only one typical experimental result of these biological replicates, which were all roughly consistent with the RNA-seq data (Figure 7, Figure 8, Figure 9 and Figure 10). Overall, alkaline stress caused the most apparent induction of CrGASA2, CrGASA3, CrGASA13, and CrGASA14 in the C. rosea roots and CrGASA2, CrGASA7, CrGASA14, and CrGASA16 in the leaves. Following high osmotic treatment (mannitol), all six CrGASAs showed induced expression either in roots or leaves at different time points (2 h or 48 h), although the long-term high osmotic challenge (48 h) decreased the expression of CrGASA7 and CrGASA13. High salinity only temporarily induced the expression of CrGASA2, CrGASA14, and CrGASA16. Interestingly, the expression of most CrGASAs was not obviously affected by heat stress (Figure 9), which is similar to the RNA-seq results (Figure 7). Only CrGASA7 and CrGASA16 were significantly induced by the heat challenge.
3.8. Functional Characterization of CrGASAs in Yeast
To sufficiently investigate the function of CrGASAs in abiotic stress responses, the primary functions of CrGASAs was analyzed with a yeast heterologous expression system. The CrGASA proteins were induced in yeast cells in the galactose-supplied SDG medium. Given that plant GASAs have been shown to be involved in cellular redox homeostasis [27], although some reports have debated whether they are general or direct ROS scavengers [15], we checked their redox activities in yeast by monitoring their tolerance to hydrogen peroxide (H2O2). Although we initially chose the same six CrGASAs for further functional identification, the full-length cDNA of CrGASA3 was not successfully cloned and the subsequent work on CrGASA3 was ignored. The yeast H2O2-sensitive mutant stain skn7∆ and the wild type (WT) expressing five CrGASAs or only pYES2 (empty vector as a control) were grown in the presence of different H2O2 concentrations. Skn7∆ that expressed CrGASAs was significantly less sensitive to H2O2 than that only transformed with pYES2, although these CrGASAs were not completely complementary to the H2O2 sensitivity of skn7∆ compared with the WT (Figure 11A). Given that oxidative stress tolerance is considered as a universal trait for many abiotic or biotic stressors, it is reasonable that CrGASAs have been involved in environmental stress, such as salt/alkaline, dehydration, and heat stress, by exhibiting their antioxidant activity.
We next examined the HM tolerance of these five CrGASAs in yeast. As shown in Figure 11, the overexpression of CrGASA14 both in the WT and Cd-sensitive mutant stain ycf1∆ could greatly elevate the Cd tolerance of these two yeast strains, while the other four CrGASAs could not (Figure 11B,C). We also detected other metal tolerances mediated by CrGASAs, including Cu with cup2∆, Zn with zrc1∆cot1∆, Ni with smf1∆, Mn with pmr1∆, and Co with cot1∆. None of these five CrGASAs could mediate Zn, Co, Ni, or Mn tolerance in yeast mutant strains (Figure S2), while only CrGASA2 and CrGASA14 elevated the Cu tolerance of cup2∆ (Figure 11D). These results indicate that the metal tolerance mediated by GASA proteins has gene-specific characteristics. Considering previous research on AtGASA5 being a metalloprotein only using iron as a metal cofactor (and not other elements, such as Ag, Al, B, Ba, and Ca) [15], we can conclude that the metal tolerance mediated by CrGASAs was also specific and did not have universality.
Different Arabidopsis GASAs have been confirmed to have the opposite effects against thermotolerance; for example, AtGASA4 enhanced tolerance to heat stress in transgenic overexpressing Arabidopsis [21], while AtGASA5-overexpressing plants displayed weaker thermotolerance than WT plants [22]. Here, we also detected yeast thermotolerance by expressing these five CrGASAs, and we found that CrGASA2, CrGASA13, and CrGASA16 could obviously elevate thermotolerance both in the WT and skn7∆, while CrGASA7 induced the sensitivity of yeast to heat, and CrGASA14 only showed slightly elevated tolerance to heat stress both in WT and in the skn7∆ yeast strain (Figure 12). These results suggest that different CrGASAs might act as contrasting regulators in thermotolerance, while their concrete mechanisms require further research.
4. Discussion
Due to their sessile characteristics, plants are inevitably subjected to stressful challenges or pest and disease attacks throughout their life cycles. To survive these environmental disturbances and complete the alternation of generations, plants have evolved adaptive molecular mechanisms whereby the biological processes in vivo are widely protected and regulated by a variety of components, including chemical molecules, chaperones, or transcription factor regulators. The plant GASA family encodes a series of low-molecular-weight proteins with the characteristic of the GASA domain containing 12 conserved cysteines, which may be active redox reaction sites for key regions, regulating redox homeostasis in plants or mediating the physical interaction between GASA proteins and other proteins [25]. The objectives of this study represent the first comprehensive investigation of the GASA family in a specific habitat plant, C. rosea, and the related data undoubtedly reveal the potential roles of GASA proteins in the adaptation of plants to their extreme environmental habitats.
In model plant Arabidopsis, the GASA family has been proven to be involved in numerous biological processes and molecular events, including responding to surrounding or endogenous cues, regulating plant growth and development, and adapting to environmental adversities [12,16,22,27]. To date, in some crops, the GASA families have also been elucidated partially or systematically, mainly aiming at their critical roles in plant vegetative and reproductive organ development [20,23,25,28] or plant defense processes [39]. Although GASA families have been found in many plant species, the available information describes little about this gene family in wild plants from unique habitats, especially for their possible roles related to ecological adaptation in extreme environments. Here, we conducted a comprehensive genome-wide identification and expression profiling study of the GASA gene family in C. rosea. Canavalia rosea is widely distributed in tropical and subtropical seashores and coral islands, with high saline alkalinity, extreme drought, and continuous heat tolerance. Our research has focused on this species for several years. CrGASAs may act as protective molecules to help this plant in adapting to continuous abiotic stresses in its unique habitat.
We identified 23 GASA genes in the C. rosea genome based on the BLASTP search results (Figure 1 and Table 1). Most of the CrGASA proteins had low molecular weight and 12 conserved cysteine residues at the C-terminus, except for CrGASA12, in which the GASA domain was located in the middle of the protein (Table 1, Figure 3 and Figure 4). The CrGASAs were divided into three groups (G1, G2, and G3) based on their phylogenetic analysis with other species, including Arabidopsis, rice, and soybean (Figure 2). According to this phylogenetic tree, most CrGASAs showed closer homology with soybean GASAs, and, as a diploid dicotyledon species, C. rosea holds more CrGASA members than that in the diploid monocotyledons—for example, 14 or 10 GASA members were found in maize and rice [28,32], while almost 20 GASA members were identified in apple (26), citrus (18), tobacco (18), and poplars (19 or 21), which probably indicates a slight GASA gene expansion in dicotyledon species [35,36,37,39,40]. Because of the relatively short protein lengths and the highly conserved GASA domains of all CrGASAs (Figure 3), the classification of protein groups mostly depends on the variable N-terminus (Figure 4), which also determines the subcellular localization of CrGASAs. This issue led to the fact that, in the same group, some CrGASA members might have similar subcellular distribution patterns, such as CrGASA5, CrGASA19, CrGASA20, and CrGASA21 (G2 group, partially localized in the cell nucleus) (Figure 4, Table 1). Thus, we proposed that it might be the variability of CrGASAs’ N-terminus that accounts for their functional diversity and specificity.
According to the transcriptome data of the tissue- and habitat-specific C. rosea samples (Figure 6), the basic expression levels of most CrGASAs were not high, and they were more likely to be transcribed in tissues with better growth potential, which is consistent with the previous view that plant GASAs are primarily involved in mediating the growth and development of plants, as well as disease resistance and stress responses [27,29]. However, we presented another hypothesis that, since plant GASAs could decrease ROS accumulation to mediate hormone signaling and stress responses [15], it is reasonable that CrGASAs might participate in the strong adaptability of C. rosea plants to the extreme adversity experienced on tropical coral reefs or islands. In some previous studies, for example, ZmGSL3 from maize and AtGASA4 from Arabidopsis had enhanced thermotolerance when overexpressed in yeast or transgenic plants [21], while overexpression of AtGASA5 led to heat sensitivity in plants [22]. A beechnut (Fagus sylvatica) GASA gene, FsGASA4, can improve plant resistance to salt, oxidative, and heat stress in transgenic Arabidopsis [49]. Heat stress is one of the major environmental stressors on tropical islands or reefs compared with inland areas, mainly due to the intensity of sunlight and lack of shade. Here, we only detected transcript changes in leaf samples collected in two different habitats (SCBG and YX); the expression of CrGASAs in the YX sample integrally presented a slightly higher level than that in the SCBG sample (Figure 6). This suggests that CrGASAs might participate in abiotic stress responses by regulating their expression, while the question of whether they are directly involved in thermotolerance needs to be further investigated.
Plants are subjected to various abiotic stressors, leading to the increased production of ROS that, at low levels, can act as signaling molecules in mediating stress responses in plants or, when accumulating, can cause damage to plant cells and cannot be scavenged effectively by antioxidant systems [50]. Thus, plants’ adaptation to extreme environments or climate conditions, such as heat, drought, salinity, and alkalinity, depends much more on the ROS scavenging ability, which is mainly mediated by plant antioxidant defense systems, including non-enzymatic antioxidants and antioxidant enzymes [51]. Plant GASA proteins have been confirmed to be involved in redox reactions with non-enzymatic antioxidant activities [29]; therefore, they were thought to be generally responsive to different pathogens or to mediate complex hormonal crosstalk [4], as well as to challenge various abiotic stressors during plant growth and development [19]. We also investigated the CrGASAs’ expression changes under different single stress challenges (salt, alkaline, high osmotic stress, and heat) by RNA-seq or qRT-PCR (Figure 7 and Figure 9), which can provide important clues for their possible involvement in C. rosea’s adaptability to environmental adversity. Under different stress challenges, CrGASAs showed spatiotemporal specificity, probably due to their involvement in different functional characterizations and perceptions of stress signaling. Several genes showed ubiquitous upregulation, especially in leaves under 48 h of challenge, such as CrGASA4, CrGASA5, CrGASA13, CrGASA15, CrGASA16, CrGASA18, and CrGASA19, while CrGASA3, CrGASA4, CrGASA7, CrGASA9, CrGASA12, CrGASA13, CrGASA14, CrGASA16, CrGASA18, CrGASA19, and CrGASA23 were also partially induced in roots after 48 h of challenge. While most CrGASAs remained constant in roots under 2 h of salt, alkaline, or high osmotic stress, only some members (CrGASA14 and CrGASA16) showed induced expression under heat stress after 2 h. In the leaf after 2 h stress challenges, most of the CrGASAs were obviously induced by alkaline, high osmotic and heat stresses (Figure 7 and Figure 9, and Table S3). The complex expression patterns of CrGASAs under different abiotic stressors highlight their potential integral roles in various stress response processes.
Plant GASAs could also act as metalloproteins, which may be due to their conserved GASA domains holding 12 cysteine residues. Until now, there have been only a few reports about plant GASAs related to metal stress [15,28,31,48,52]. In several plant species, the expression of some GASAs has been induced by HMs [28,31,52]. For example, in the metal-tolerant species Eucalyptus globulus and Viola baoshanensis, GASA members were obviously regulated by exogenous HMs, and in rice, the OsGASR genes were upregulated by Cd, Cr, Ni, and Fe in gene- and spatio/temporal-specific manners. One tobacco GASA gene was also shown to alleviate Cd toxicity when expressed in yeast [48]. Considering that C. rosea is a halophyte and mangrove associate, HM tolerance and accumulation in this type of plant is also a hotspot in research about the adaptation mechanisms of plants to their native habitats. We first checked the transcriptional changes under different HM challenges (Cd, Zn, Cu, and Mn) at different time points (2 h and 48 h), and the results showed that 48 h HM stress could induce the expression of specific CrGASAs, such as CrGASA16 in roots and CrGASA4/CrGASA14/CrGASA16 in leaves, while some of the CrGASAs were not affected by HM challenge (Figure 8, Table S2). Further confirmation by qRT-PCR was also performed, and the expression of CrGASA3, CrGASA13, and CrGASA16 in the roots or CrGASA3, CrGASA14, and CrGASA16 in the leaves was induced by metals (Figure 10). These results imply that CrGASAs are responsive to HMs; thus, HM stress modulates their transcription regulation network in C. rosea plants.
Based on these data, we propose that CrGASAs might be involved in HM detoxification, probably by their metal chelation mediated by the disulfide bonds of conserved cysteines in the GASA domain or depending on their antioxidant capacity, similar to metallothionein [53]. All five CrGASAs, unsurprisingly, showed obvious H2O2 tolerance in the yeast mutant strain skn7∆ (Figure 11A), indicating that these CrGASA members all presented some antioxidant activities, at least in terms of alleviating the toxicity of H2O2, which might mainly be mediated by reductive amino acids (i.e., the 12 conserved cysteines in the GASA domains). Originally, speculation about metal chelation and detoxification by these cysteines might have been consistent with different CrGASAs, but this contrasted with the yeast assays. Only CrGASA14 enhanced the Cd tolerance of WT yeast and complemented the Cd sensitivity of ycf1∆ (Figure 11B,C). Both CrGASA2 and CrGASA14 also complemented the Cu sensitivity of cup2∆ (Figure 11D). None of the five CrGASAs showed Zn, Co, Ni, or Mn tolerance in the different yeast mutant strains (Figure S2). These results are quite different from other small, cysteine-rich antioxidative proteins, such as plant metallothioneins [47,48,53], but HM detoxification mediated by metallothioneins was typical and not protein member-specific. This suggested the functional redundancy of different CrGASA members, which indicated that some CrGASA proteins could chelate active HMs, thereby alleviating HM toxicity. Moreover, this might also be due to the unique subcellular localization characteristic of specific CrGASAs, which are cysteine-rich, cytoplasmically distributed proteins, organelle- or vesicle-localized, or secretory peptides. Compared with the expression patterns of this gene family, especially the induced expression of CrGASA2 and CrGASA14 by HMs in RNA-seq or qRT-PCR, we can conclude that some CrGASAs undertake metal detoxification and HM phytoremediation, similar to C. rosea metallothioneins. However, given the highly conserved GASA domains with nearly constant cysteine residues, it is still unclear how the variable amino acid residues in GASA domains or the N-terminus affect or restrict HM chelation specificity by the disulfide bonds of conserved cysteines. Similarly, the thermotolerance or sensitivity mediated by different CrGASAs was also member-specific (Figure 12), indicating that the cellular heat signaling pathways mediated by or involving different CrGASA members were specific, or perhaps opposed, and that some CrGASAs do participate in the adaptability to the thermal environment in tropical regions. These findings could provide informative insights for further studies on the roles of the CrGASA gene family, especially in phytoremediation concerning Cd pollution or the thermotolerance of C. rosea plants.
5. Conclusions
In brief, we identified 23 CrGASA genes and explored their conserved motifs, tissue expression patterns, and evolutionary relationships. The expression of CrGASAs has the potential to be regulated by their habitats, as well as the C. rosea plants’ developmental stages. Therefore, CrGASAs were speculated to play possible roles against extreme abiotic stress. This research has also attempted to explore the biological roles of CrGASAs in responding to different HMs and their stress resistance. CrGASAs possess considerable potential for the phytoremediation of Cd and Cu. These results will help to further study plant GASAs and their role in abiotic stress tolerance for improving the agricultural productivity of crops.
Supplementary Materials
The following supporting information can be downloaded at: https://www.mdpi.com/article/10.3390/genes13111988/s1, Figure S1: The distribution of segmental duplication of CrGASAs in Canavalia rosea chromosomes; Figure S2: Complementation confirmation of yeast mutants mediated by five CrGASAs on solid medium containing heavy metals (HMs). (A) Zn (zrc1Δ/cot1Δ); (B) Co (cot1Δ); (C) Ni (smf1Δ); and (D) Mn (pmr1Δ). The WT strain BY4741 was transformed with the empty vector pYES2, and the mutant strains were transformed with pYES2 or with recombinant vectors CrGASAs-pYES2. Yeast cultures were adjusted to OD600 = 1, and 2 μL serial dilutions (10-fold, from left to right in each panel) were spotted on SDG/-Ura medium supplemented with different concentrations of HMs. The corresponding yeast spots growing on SDG/-Ura plates without HMs were used as controls. The plates were incubated for 2–5 days at 30 °C; Table S1: Primer sequences used in this study; Table S2: The sequences of CrGASA genomic DNA, CDS, and promoter region DNA; Table S3: Summary of possible candidate cis-regulatory elements found in CrGASA promoter DNA regions; Table S4: The FPKM values of CrGASAs for RNA-seq assay of C. rosea tissues in this study.
Author Contributions
Conceptualization, M.Z., Z.W. and S.J.; methodology, M.Z.; software, Z.W.; validation, M.Z. and S.J.; formal analysis, M.Z.; investigation, S.J.; resources, S.J.; data curation, M.Z. and Z.W.; writing—original draft preparation, M.Z.; writing—review and editing, M.Z. and S.J.; visualization, Z.W.; supervision, Z.W. and S.J.; project administration, S.J.; funding acquisition, M.Z. and S.J. All authors have read and agreed to the published version of the manuscript.
Funding
This research was funded by the Guangdong Science and Technology Program (No. 2019B121201005), the Institution of South China Sea Ecology and Environmental Engineering, Chinese Academy of Sciences (No. ISEE2021ZD04), and the National Natural Sciences Foundation of China (No. U1701246 and 32270380). The funders had no roles in the study design, data collection and analysis, decision to publish, or preparation of the manuscript.
Institutional Review Board Statement
Not applicable.
Informed Consent Statement
Not applicable.
Data Availability Statement
Not applicable.
Acknowledgments
The authors thank the staff of the Xisha Marine Science Comprehensive Experimental Station, South China Sea Institute of Oceanography (Guangzhou city, China), Chinese Academy of Sciences, for the assistance with field sampling. The authors also thank the several workers who planted the Canavalia rosea plants in the South China Botanical Garden (Guangzhou city, China) and gathered the C. rosea seeds in Hainan Province, China.
Conflicts of Interest
The authors declare no conflict of interest, and the funders had no role in the design of the study.
References
- Silverstein, K.A.; Moskal, W.A., Jr.; Wu, H.C.; Underwood, B.A.; Graham, M.A.; Town, C.D.; VandenBosch, K.A. Small cysteine-rich peptides resembling antimicrobial peptides have been under-predicted in plants. Plant J. 2007, 51, 262–280. [Google Scholar] [CrossRef] [PubMed]
- Kumar, A.; Singh, A.; Kumar, P.; Sarkar, A.K. Giberellic acid-stimulated transcript proteins evolved through successive conjugation of novel motifs and their subfunctionalization. Plant Physiol. 2019, 180, 998–1012. [Google Scholar] [CrossRef] [PubMed]
- Segura, A.; Moreno, M.; Madueño, F.; Molina, A.; García-Olmedo, F. Snakin-1, a peptide from potato that is active against plant pathogens. Mol. Plant Microbe Interact. 1999, 12, 16–23. [Google Scholar] [CrossRef] [PubMed] [Green Version]
- Almasia, N.I.; Nahirñak, V.; Hopp, H.E.; Vazquez-Rovere, C. Potato Snakin-1: An antimicrobial player of the trade-off between host defense and development. Plant Cell Rep. 2020, 39, 839–849. [Google Scholar] [CrossRef] [PubMed]
- Shi, L.; Gast, R.T.; Gopalraj, M.; Olszewski, N.E. Characterization of a shoot-specific, GA3- and ABA-regulated gene from tomato. Plant J. 1992, 2, 153–159. [Google Scholar]
- Ben-Nissan, G.; Lee, J.Y.; Borohov, A.; Weiss, D. GIP, a Petunia hybrida GA-induced cysteine-rich protein: A possible role in shoot elongation and transition to flowering. Plant J. 2004, 37, 229–238. [Google Scholar] [CrossRef]
- Furukawa, T.; Sakaguchi, N.; Shimada, H. Two OsGASR genes, rice GAST homologue genes that are abundant in proliferating tissues, show different expression patterns in developing panicles. Genes Genet. Syst. 2006, 81, 171–180. [Google Scholar] [CrossRef] [Green Version]
- Roxrud, I.; Lid, S.E.; Fletcher, J.C.; Schmidt, E.D.; Opsahl-Sorteberg, H.G. GASA4, one of the 14-member Arabidopsis GASA family of small polypeptides, regulates flowering and seed development. Plant Cell Physiol. 2007, 48, 471–483. [Google Scholar] [CrossRef]
- Zhang, S.; Yang, C.; Peng, J.; Sun, S.; Wang, X. GASA5, a regulator of flowering time and stem growth in Arabidopsis thaliana. Plant Mol. Biol. 2009, 69, 745–759. [Google Scholar] [CrossRef]
- Wang, L.; Wang, Z.; Xu, Y.; Joo, S.H.; Kim, S.K.; Xue, Z.; Xu, Z.; Wang, Z.; Chong, K. OsGSR1 is involved in crosstalk between gibberellins and brassinosteroids in rice. Plant J. 2009, 57, 498–510. [Google Scholar] [CrossRef]
- Rubinovich, L.; Weiss, D. The Arabidopsis cysteine-rich protein GASA4 promotes GA responses and exhibits redox activity in bacteria and in planta. Plant J. 2010, 64, 1018–1027. [Google Scholar] [CrossRef]
- Sun, S.; Wang, H.; Yu, H.; Zhong, C.; Zhang, X.; Peng, J.; Wang, X. GASA14 regulates leaf expansion and abiotic stress resistance by modulating reactive oxygen species accumulation. J. Exp. Bot. 2013, 64, 1637–1647. [Google Scholar] [CrossRef] [Green Version]
- Mohan, S.; Meiyalaghan, S.; Latimer, J.M.; Gatehouse, M.L.; Monaghan, K.S.; Vanga, B.R.; Pitman, A.R.; Jones, E.E.; Conner, A.J.; Jacobs, J.M. GSL2 over-expression confers resistance to Pectobacterium atrosepticum in potato. Theor. Appl. Genet. 2014, 127, 677–689. [Google Scholar] [CrossRef]
- García, A.N.; Ayub, N.D.; Fox, A.R.; Gómez, M.C.; Diéguez, M.J.; Pagano, E.M.; Berini, C.A.; Muschietti, J.P.; Soto, G. Alfalfa snakin-1 prevents fungal colonization and probably coevolved with rhizobia. BMC Plant Biol. 2014, 14, 248. [Google Scholar] [CrossRef] [Green Version]
- Rubinovich, L.; Ruthstein, S.; Weiss, D. The Arabidopsis cysteine-rich GASA5 is a redox-active metalloprotein that suppresses gibberellin responses. Mol. Plant. 2014, 7, 244–247. [Google Scholar] [CrossRef] [Green Version]
- Qu, J.; Kang, S.G.; Hah, C.; Jang, J.C. Molecular and cellular characterization of GA-stimulated transcripts GASA4 and GASA6 in Arabidopsis thaliana. Plant Sci. 2016, 246, 1–10. [Google Scholar] [CrossRef]
- Oliveira-Lima, M.; Benko-Iseppon, A.M.; Neto, J.R.C.F.; Rodriguez-Decuadro, S.; Kido, E.A.; Crovella, S.; Pandolfi, V. Snakin: Structure, roles and applications of a plant antimicrobial peptide. Curr. Protein Pept. Sci. 2017, 18, 368–374. [Google Scholar] [CrossRef]
- Darqui, F.S.; Radonic, L.M.; Trotz, P.M.; López, N.; Vázquez Rovere, C.; Hopp, H.E.; López Bilbao, M. Potato snakin-1 gene enhances tolerance to Rhizoctonia solani and Sclerotinia sclerotiorum in transgenic lettuce plants. J. Biotechnol. 2018, 283, 62–69. [Google Scholar] [CrossRef]
- Su, T.; Han, M.; Cao, D.; Xu, M. Molecular and biological properties of snakins: The foremost cysteine-rich plant host defense peptides. J. Fungi 2020, 6, 220. [Google Scholar] [CrossRef]
- Wigoda, N.; Ben-Nissan, G.; Granot, D.; Schwartz, A.; Weiss, D. The gibberellin-induced, cysteine-rich protein GIP2 from Petunia hybrida exhibits in planta antioxidant activity. Plant J. 2006, 48, 796–805. [Google Scholar] [CrossRef]
- Ko, C.B.; Woo, Y.M.; Lee, D.J.; Lee, M.C.; Kim, C.S. Enhanced tolerance to heat stress in transgenic plants expressing the GASA4 gene. Plant Physiol. Biochem. 2007, 45, 722–728. [Google Scholar] [CrossRef] [PubMed]
- Zhang, S.; Wang, X. Overexpression of GASA5 increases the sensitivity of Arabidopsis to heat stress. J. Plant Physiol. 2011, 168, 2093–2101. [Google Scholar] [CrossRef] [PubMed]
- Nahirñak, V.; Almasia, N.I.; Fernandez, P.V.; Hopp, H.E.; Estevez, J.M.; Carrari, F.; Vazquez-Rovere, C. Potato snakin-1 gene silencing affects cell division, primary metabolism, and cell wall composition. Plant Physiol. 2012, 158, 252–263. [Google Scholar] [CrossRef] [PubMed] [Green Version]
- Deng, M.; Peng, J.; Zhang, J.; Ran, S.; Cai, C.; Yu, L.; Ni, S.; Huang, X.; Li, L.; Wang, X. The cysteine-rich peptide snakin-2 negatively regulates tubers sprouting through modulating lignin biosynthesis and H2O2 accumulation in potato. Int. J. Mol. Sci. 2021, 22, 2287. [Google Scholar] [CrossRef] [PubMed]
- Li, L.; Lyu, C.; Chen, J.; Lu, Y.; Yang, S.; Ni, S.; Zheng, S.; Yu, L.; Wang, X.; Wang, Q.; et al. Snakin-2 interacts with cytosolic glyceraldehyde-3-phosphate dehydrogenase 1 to inhibit sprout growth in potato tubers. Hortic. Res. 2022, 9, uhab060. [Google Scholar] [CrossRef]
- Zhu, J.K. Abiotic stress signaling and responses in plants. Cell 2016, 167, 313–324. [Google Scholar] [CrossRef] [Green Version]
- Nahirñak, V.; Almasia, N.I.; Hopp, H.E.; Vazquez-Rovere, C. Snakin/GASA proteins: Involvement in hormone crosstalk and redox homeostasis. Plant Signal. Behav. 2012, 7, 1004–1008. [Google Scholar] [CrossRef] [Green Version]
- Muhammad, I.; Li, W.Q.; Jing, X.Q.; Zhou, M.R.; Shalmani, A.; Ali, M.; Wei, X.Y.; Sharif, R.; Liu, W.T.; Chen, K.M. A systematic in silico prediction of gibberellic acid stimulated GASA family members: A novel small peptide contributes to floral architecture and transcriptomic changes induced by external stimuli in rice. J. Plant Physiol. 2019, 234–235, 117–132. [Google Scholar] [CrossRef]
- Zhang, S.; Wang, X. One new kind of phytohormonal signaling integrator: Up-and-coming GASA family genes. Plant Signal. Behav. 2017, 12, e1226453. [Google Scholar] [CrossRef] [Green Version]
- Trapalis, M.; Li, S.F.; Parish, R.W. The Arabidopsis GASA10 gene encodes a cell wall protein strongly expressed in developing anthers and seeds. Plant Sci. 2017, 260, 71–79. [Google Scholar] [CrossRef]
- Ortiz, J.; Soto, J.; Fuentes, A.; Herrera, H.; Meneses, C.; Arriagada, C. The endophytic fungus Chaetomium cupreum regulates expression of genes involved in the tolerance to metals and plant growth promotion in Eucalyptus globulus roots. Microorganisms 2019, 7, 490. [Google Scholar] [CrossRef]
- Zimmermann, R.; Sakai, H.; Hochholdinger, F. The Gibberellic Acid Stimulated-Like gene family in maize and its role in lateral root development. Plant Physiol. 2010, 152, 356–365. [Google Scholar] [CrossRef] [Green Version]
- Ahmad, M.Z.; Sana, A.; Jamil, A.; Nasir, J.A.; Ahmed, S.; Hameed, M.U.; Abdullah. A genome-wide approach to the comprehensive analysis of GASA gene family in Glycine max. Plant Mol. Biol. 2019, 100, 607–620. [Google Scholar] [CrossRef]
- Cheng, X.; Wang, S.; Xu, D.; Liu, X.; Li, X.; Xiao, W.; Cao, J.; Jiang, H.; Min, X.; Wang, J.; et al. Identification and analysis of the GASR gene family in common wheat (Triticum aestivum L.) and characterization of TaGASR34, a gene associated with seed dormancy and germination. Front. Genet. 2019, 10, 980. [Google Scholar] [CrossRef]
- Fan, S.; Zhang, D.; Zhang, L.; Gao, C.; Xin, M.; Tahir, M.M.; Li, Y.; Ma, J.; Han, M. Comprehensive analysis of GASA family members in the Malus domestica genome: Identification, characterization, and their expressions in response to apple flower induction. BMC Genom. 2017, 18, 827. [Google Scholar] [CrossRef]
- Han, S.; Jiao, Z.; Niu, M.-X.; Yu, X.; Huang, M.; Liu, C.; Wang, H.-L.; Zhou, Y.; Mao, W.; Wang, X.; et al. Genome-wide comprehensive analysis of the GASA gene family in Populus. Int. J. Mol. Sci. 2021, 22, 12336. [Google Scholar] [CrossRef]
- Wu, K.; Qu, Y.; Rong, H.; Han, X.; Tian, Y.; Xu, L. Identification and expression analysis of the Populus trichocarpa GASA-gene family. Int. J. Mol. Sci. 2022, 23, 1507. [Google Scholar] [CrossRef]
- Ahmad, B.; Yao, J.; Zhang, S.; Li, X.; Zhang, X.; Yadav, V.; Wang, X. Genome-wide characterization and expression profiling of GASA genes during different stages of seed development in grapevine (Vitis vinifera L.) predict their involvement in seed development. Int. J. Mol. Sci. 2020, 21, 1088. [Google Scholar] [CrossRef] [Green Version]
- Wu, T.; Zhong, Y.; Chen, M.; Wu, B.; Wang, T.; Jiang, B.; Zhong, G. Analysis of CcGASA family members in Citrus clementina (Hort. ex Tan.) by a genome-wide approach. BMC Plant Biol. 2021, 21, 565. [Google Scholar] [CrossRef]
- Li, Z.; Gao, J.; Wang, G.; Wang, S.; Chen, K.; Pu, W.; Wang, Y.; Xia, Q.; Fan, X. Genome-wide identification and characterization of GASA gene family in Nicotiana tabacum. Front. Genet. 2022, 12, 768942. [Google Scholar] [CrossRef]
- Mulder, N.; Apweiler, R. InterPro and InterProScan: Tools for protein sequence classification and comparison. Methods Mol. Biol. 2007, 396, 59–70. [Google Scholar] [PubMed]
- Mistry, J.; Chuguransky, S.; Williams, L.; Qureshi, M.; Salazar, G.A.; Sonnhammer, E.L.L.; Tosatto, S.C.; Paladin, L.; Raj, S.; Richardson, L.J.; et al. Pfam: The protein families database in 2021. Nucleic Acids Res. 2021, 49, D412–D419. [Google Scholar] [CrossRef] [PubMed]
- Buchfink, B.; Xie, C.; Huson, D.H. Fast and sensitive protein alignment using DIAMOND. Nat. Methods 2015, 12, 59–60. [Google Scholar] [CrossRef] [PubMed]
- Nei, M.; Gojobori, T. Simple methods for estimating the numbers of synonymous and nonsynonymous nucleotide substitutions. Mol. Biol. Evol. 1986, 3, 418–426. [Google Scholar] [PubMed]
- Chen, C.; Chen, H.; Zhang, Y.; Thomas, H.R.; Frank, M.H.; He, Y.; Xia, R. TBtools: An integrative toolkit developed for interactive analyses of big biological data. Mol. Plant 2020, 13, 1194–1202. [Google Scholar] [CrossRef]
- Podar, D.; Scherer, J.; Noordally, Z.; Herzyk, P.; Nies, D.; Sanders, D. Metal selectivity determinants in a family of transition metal transporters. J. Biol. Chem. 2012, 287, 3185–3196. [Google Scholar] [CrossRef] [Green Version]
- Zou, T.; Pu, L.; Lin, R.; Mo, H.; Wang, Z.; Jian, S.; Zhang, M. Roles of Canavalia rosea metallothioneins in metal tolerance and extreme environmental adaptation to tropical coral reefs. J. Plant Physiol. 2022, 268, 153559. [Google Scholar] [CrossRef]
- Zhang, M.; Mo, H.; Sun, W.; Guo, Y.; Li, J. Systematic isolation and characterization of cadmium tolerant genes in tobacco: A cDNA library construction and screening approach. PLoS ONE 2016, 11, e0161147. [Google Scholar] [CrossRef] [Green Version]
- Alonso-Ramírez, A.; Rodríguez, D.; Reyes, D.; Jiménez, J.A.; Nicolás, G.; López-Climent, M.; Gómez-Cadenas, A.; Nicolás, C. Evidence for a role of gibberellins in salicylic acid-modulated early plant responses to abiotic stress in Arabidopsis seeds. Plant Physiol. 2009, 150, 1335–1344. [Google Scholar] [CrossRef] [Green Version]
- Chaudhry, S.; Sidhu, G.P.S. Climate change regulated abiotic stress mechanisms in plants: A comprehensive review. Plant Cell Rep. 2022, 41, 1–31. [Google Scholar] [CrossRef]
- Singh, A.; Mehta, S.; Yadav, S.; Nagar, G.; Ghosh, R.; Roy, A.; Chakraborty, A.; Singh, I.K. How to cope with the challenges of environmental stresses in the era of global climate change: An update on ROS stave off in plants. Int. J. Mol. Sci. 2022, 23, 1995. [Google Scholar] [CrossRef]
- Zhang, J.; Li, J.; Huang, Z.; Yang, B.; Zhang, X.; Li, D.; Craik, D.J.; Baker, A.J.; Shu, W.; Liao, B. Transcriptomic screening for cyclotides and other cysteine-rich proteins in the metallophyte Viola baoshanensis. J. Plant Physiol. 2015, 178, 17–26. [Google Scholar] [CrossRef]
- Cobbett, C.; Goldsbrough, P. Phytochelatins and metallothioneins: Roles in heavy metal detoxification and homeostasis. Annu. Rev. Plant Biol. 2002, 53, 159–182. [Google Scholar] [CrossRef]
Figure 1.
Locations of the twenty-three CrGASAs on eleven chromosomes and one scaffold of C. rosea genome.
Figure 1.
Locations of the twenty-three CrGASAs on eleven chromosomes and one scaffold of C. rosea genome.

Figure 2.
Phylogenetic relationships of the twenty-three CrGASAs from C. rosea, fifteen AtGASAs from Arabidopsis thaliana, eleven OsGASRs from Oryza sativa, and thirty-seven GmGASAs from Glycine max. These eighty-six amino acid sequences of four plant species were compared with ClustalW alignment, and the phylogenetic tree was constructed in MEGA 6.0 using the neighbor-joining method, with 1000 bootstrap repetitions. The different branch colors represent different groups, including G1 (cyan), G2 (brown), and G3 (green).

Figure 3.
Alignment of the GASA domain from CrGASA proteins. (A) Multiple alignments of the CrGASA protein sequences. Their conserved GASA domains are indicated. (B) Sequence logo analysis of the conserved GASA domains. Each stack represents their amino acids.
Figure 3.
Alignment of the GASA domain from CrGASA proteins. (A) Multiple alignments of the CrGASA protein sequences. Their conserved GASA domains are indicated. (B) Sequence logo analysis of the conserved GASA domains. Each stack represents their amino acids.

Figure 4.
Structural analysis of the CrGASA proteins and genes. (A) The phylogenetic tree constructed using MEGA 6.0. The three major groups are marked with different background colors. (B) The conserved motifs of each group identified by the MEME web server. Different motifs are represented by different colored boxes, and the motif sequences are provided at the bottom. (C) The exon–intron organization of the CrGASAs constructed using GSDS 2.0.

Figure 5.
Statistics for predicted cis-regulatory elements in the CrGASA promoters (ATG upstream 1000). (A) Summaries of the thirteen cis-regulatory elements in the twenty-two CrGASA promoter regions. (B) Distribution of the six cis-regulatory elements (ABRE, as-1, WUN motif, TC-rich repeats, MBS, gibberellin-responsive motif, GARE) in the twenty-two CrGASA promoter regions. The elements are represented by different symbols. The scale bar represents 100 bp.

Figure 6.
Heatmaps showing (A) the expression levels of the CrGASAs in the root, vine, leaf, flower bud, and young fruit of C. rosea plants and (B) expression differences of the CrGASAs in mature C. rosea leaves planted in the South China Botanical Garden (SCBG) and in Yongxing (YX) Island. The expression level of each gene is shown in FPKM (log2). Red denotes high expression levels, and blue denotes low expression levels. Data normalization was performed on the Oebiotech Cloud website (https://cloud.oebiotech.cn/task/detail/heatmap/ (accessed on 1 March 2022)).

Figure 7.
Heatmaps showing the expression changes of CrGASAs under high salinity, alkaline, high osmotic stresses, and heat challenge. (A,B) The expression differences of CrGASAs in the root (A) and leaf (B) after 2 h abiotic stress challenges; (C,D) the expression differences of CrGASAs in the root (C) and leaf (D) after 48 h abiotic stress challenges. CK: control. The expression level of each gene is shown in FPKM (log2). Red denotes high expression levels, and blue denotes low expression levels. Data normalization was performed on the Oebiotech Cloud website (https://cloud.oebiotech.cn/task/detail/heatmap/ (accessed on 1 March 2022)).

Figure 8.
Heatmaps showing the expression levels of the CrGASAs under heavy metal stress, including cadmium (Cd), zinc (Zn), copper (Cu), and manganese (Mn). (A,B) The expression differences of CrGASAs in the root (A) and leaf (B) after 2 h heavy metal stress; (C,D) the expression differences of CrGASAs in the root (C) and leaf (D) after 48 h heavy metal stress. CK: control. The expression level of each gene is shown in FPKM (log2). Red denotes high expression levels, and blue denotes low expression levels. Data normalization was performed on the Oebiotech Cloud website (https://cloud.oebiotech.cn/task/detail/heatmap/ (accessed on 1 March 2022)).

Figure 9.
Quantitative RT-PCR detection of the expression levels of the six CrGASAs in C. rosea seedlings responding to different stresses, including 600 mM NaCl, 150 mM NaHCO3, 300 mM mannitol, and heat stress (45 °C), for different times (0, 2 h, and 48 h). (A,B) Root and leaf samples under 600 mM NaCl treatment; (C,D) root and leaf samples under 150 mM NaHCO3 treatment; (E,F) root and leaf samples under 300 mM mannitol treatment; and (G) root, vine, and leaf samples under 2 h heat stress challenge. CK: control. Relative expression values were calculated using the 2−ΔCt method, with the housekeeping gene CrEF-1α as a reference gene. Bars show the mean values ± SD of n = 3–4 technical replicates.

Figure 10.
Quantitative RT-PCR detection of the expression levels of the six CrGASAs responding to different heavy metal (HM) stresses (0.1 mM CdCl2, 0.5 mM ZnSO4, 1 mM MnCl2, and 0.1 mM CuSO4) in C. rosea seedlings. (A) Root samples under different HM stresses; (B) leaf samples under different HM stresses. CK: control. Relative expression values were calculated using the 2−ΔCt method, with the housekeeping gene CrEF-1α as a reference gene. Bars show the mean values ± SD of n = 3–4 technical replicates.

Figure 11.
Functional identification of five CrGASAs in yeast by heterologous expression assay. The yeast wild-type (WT) strain BY4741, and yeast mutant strains skn7Δ (sensitive to H2O2), ycf1Δ (sensitive to cadmium), and cup2Δ (sensitive to copper), were transformed with the empty vector pYES2 and five recombinant vectors, including CrGASA2-pYES2, CrGASA7-pYES2, CrGASA13-pYES2, CrGASA14-pYES2, and CrGASA16-pYES2. Yeast cultures were adjusted to OD600 = 1, and 2 μL serial dilutions (10-fold, from left to right in each panel) were spotted on SDG-Ura medium supplemented with different concentrations of stressors. (A) H2O2 oxidative stress tolerance confirmation in yeast mutant strain skn7Δ; (B) cadmium tolerance confirmation in WT yeast; (C) cadmium tolerance confirmation in mutant yeast strain ycf1Δ; (D) copper tolerance confirmation in mutant yeast strain cup2Δ.

Figure 12.
The thermotolerance confirmation in yeast strains WT (A) and skn7Δ (B) by expressing five CrGASAs. Yeast cultures (with or without heat stress challenges, WT: 52 °C for 30 min; skn7Δ: 52 °C for 15 min) were adjusted to OD600 = 1, and 2 μL serial dilutions (10-fold) were spotted on SDG-Ura medium plates. The plates were incubated for 2–5 days at 30 °C.


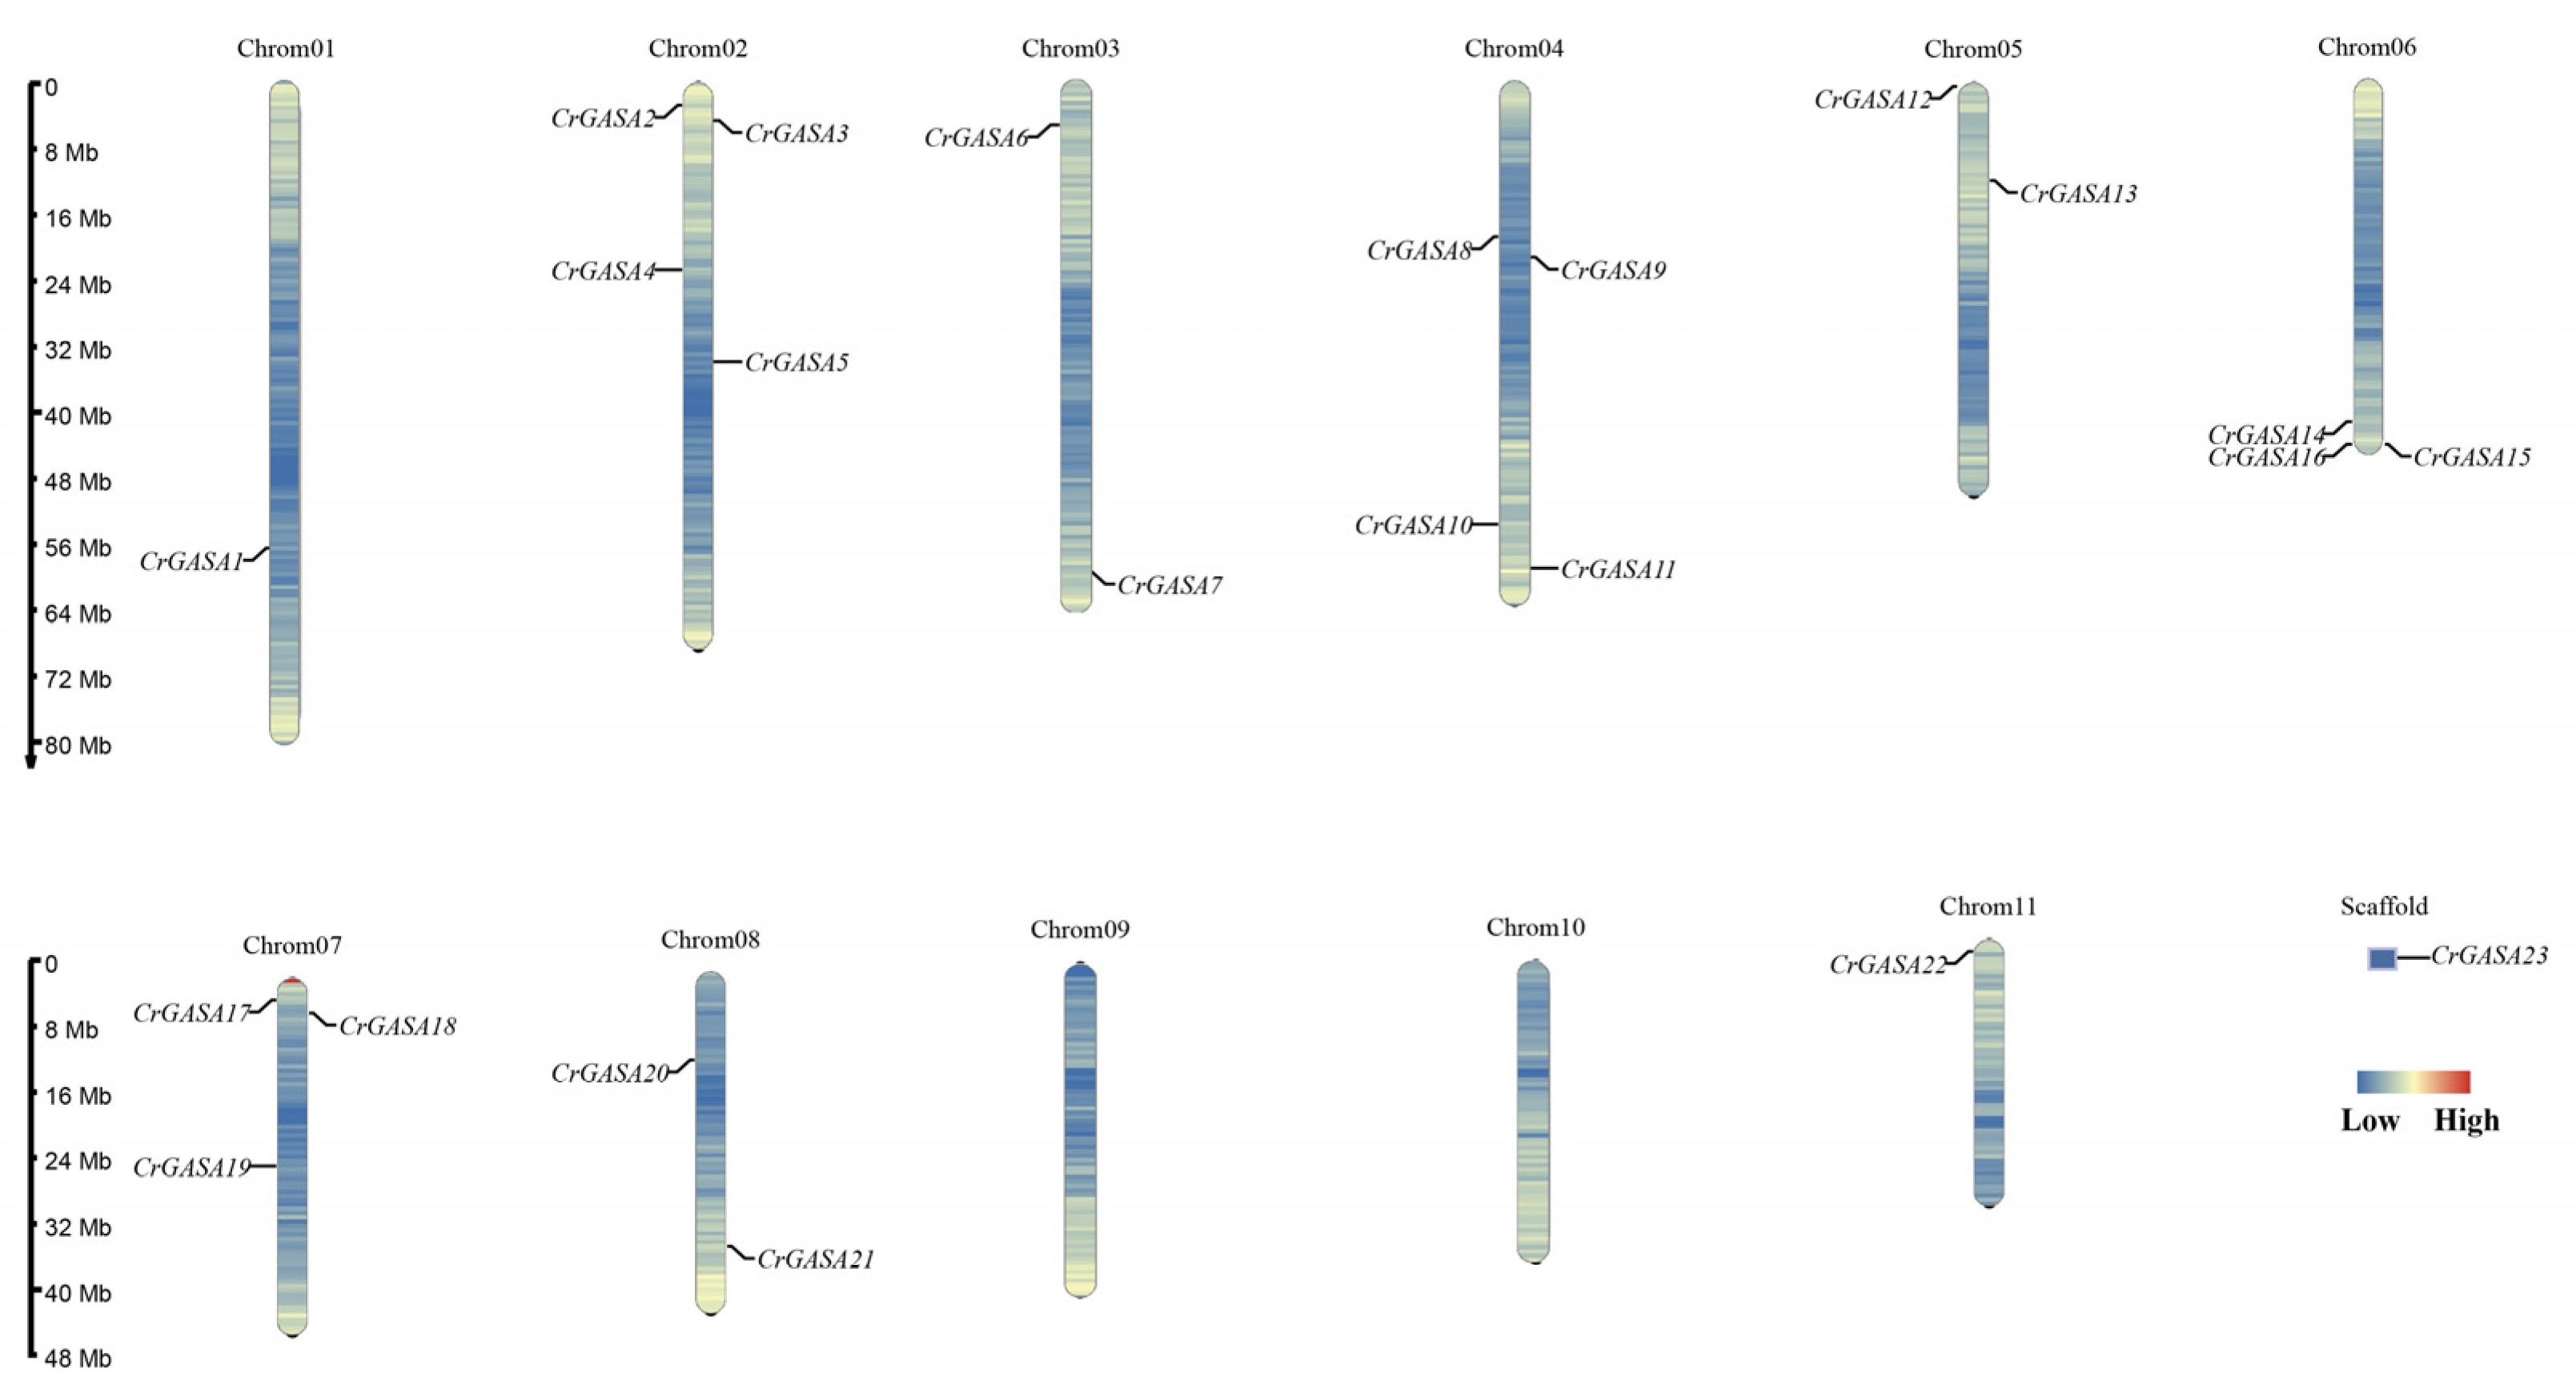
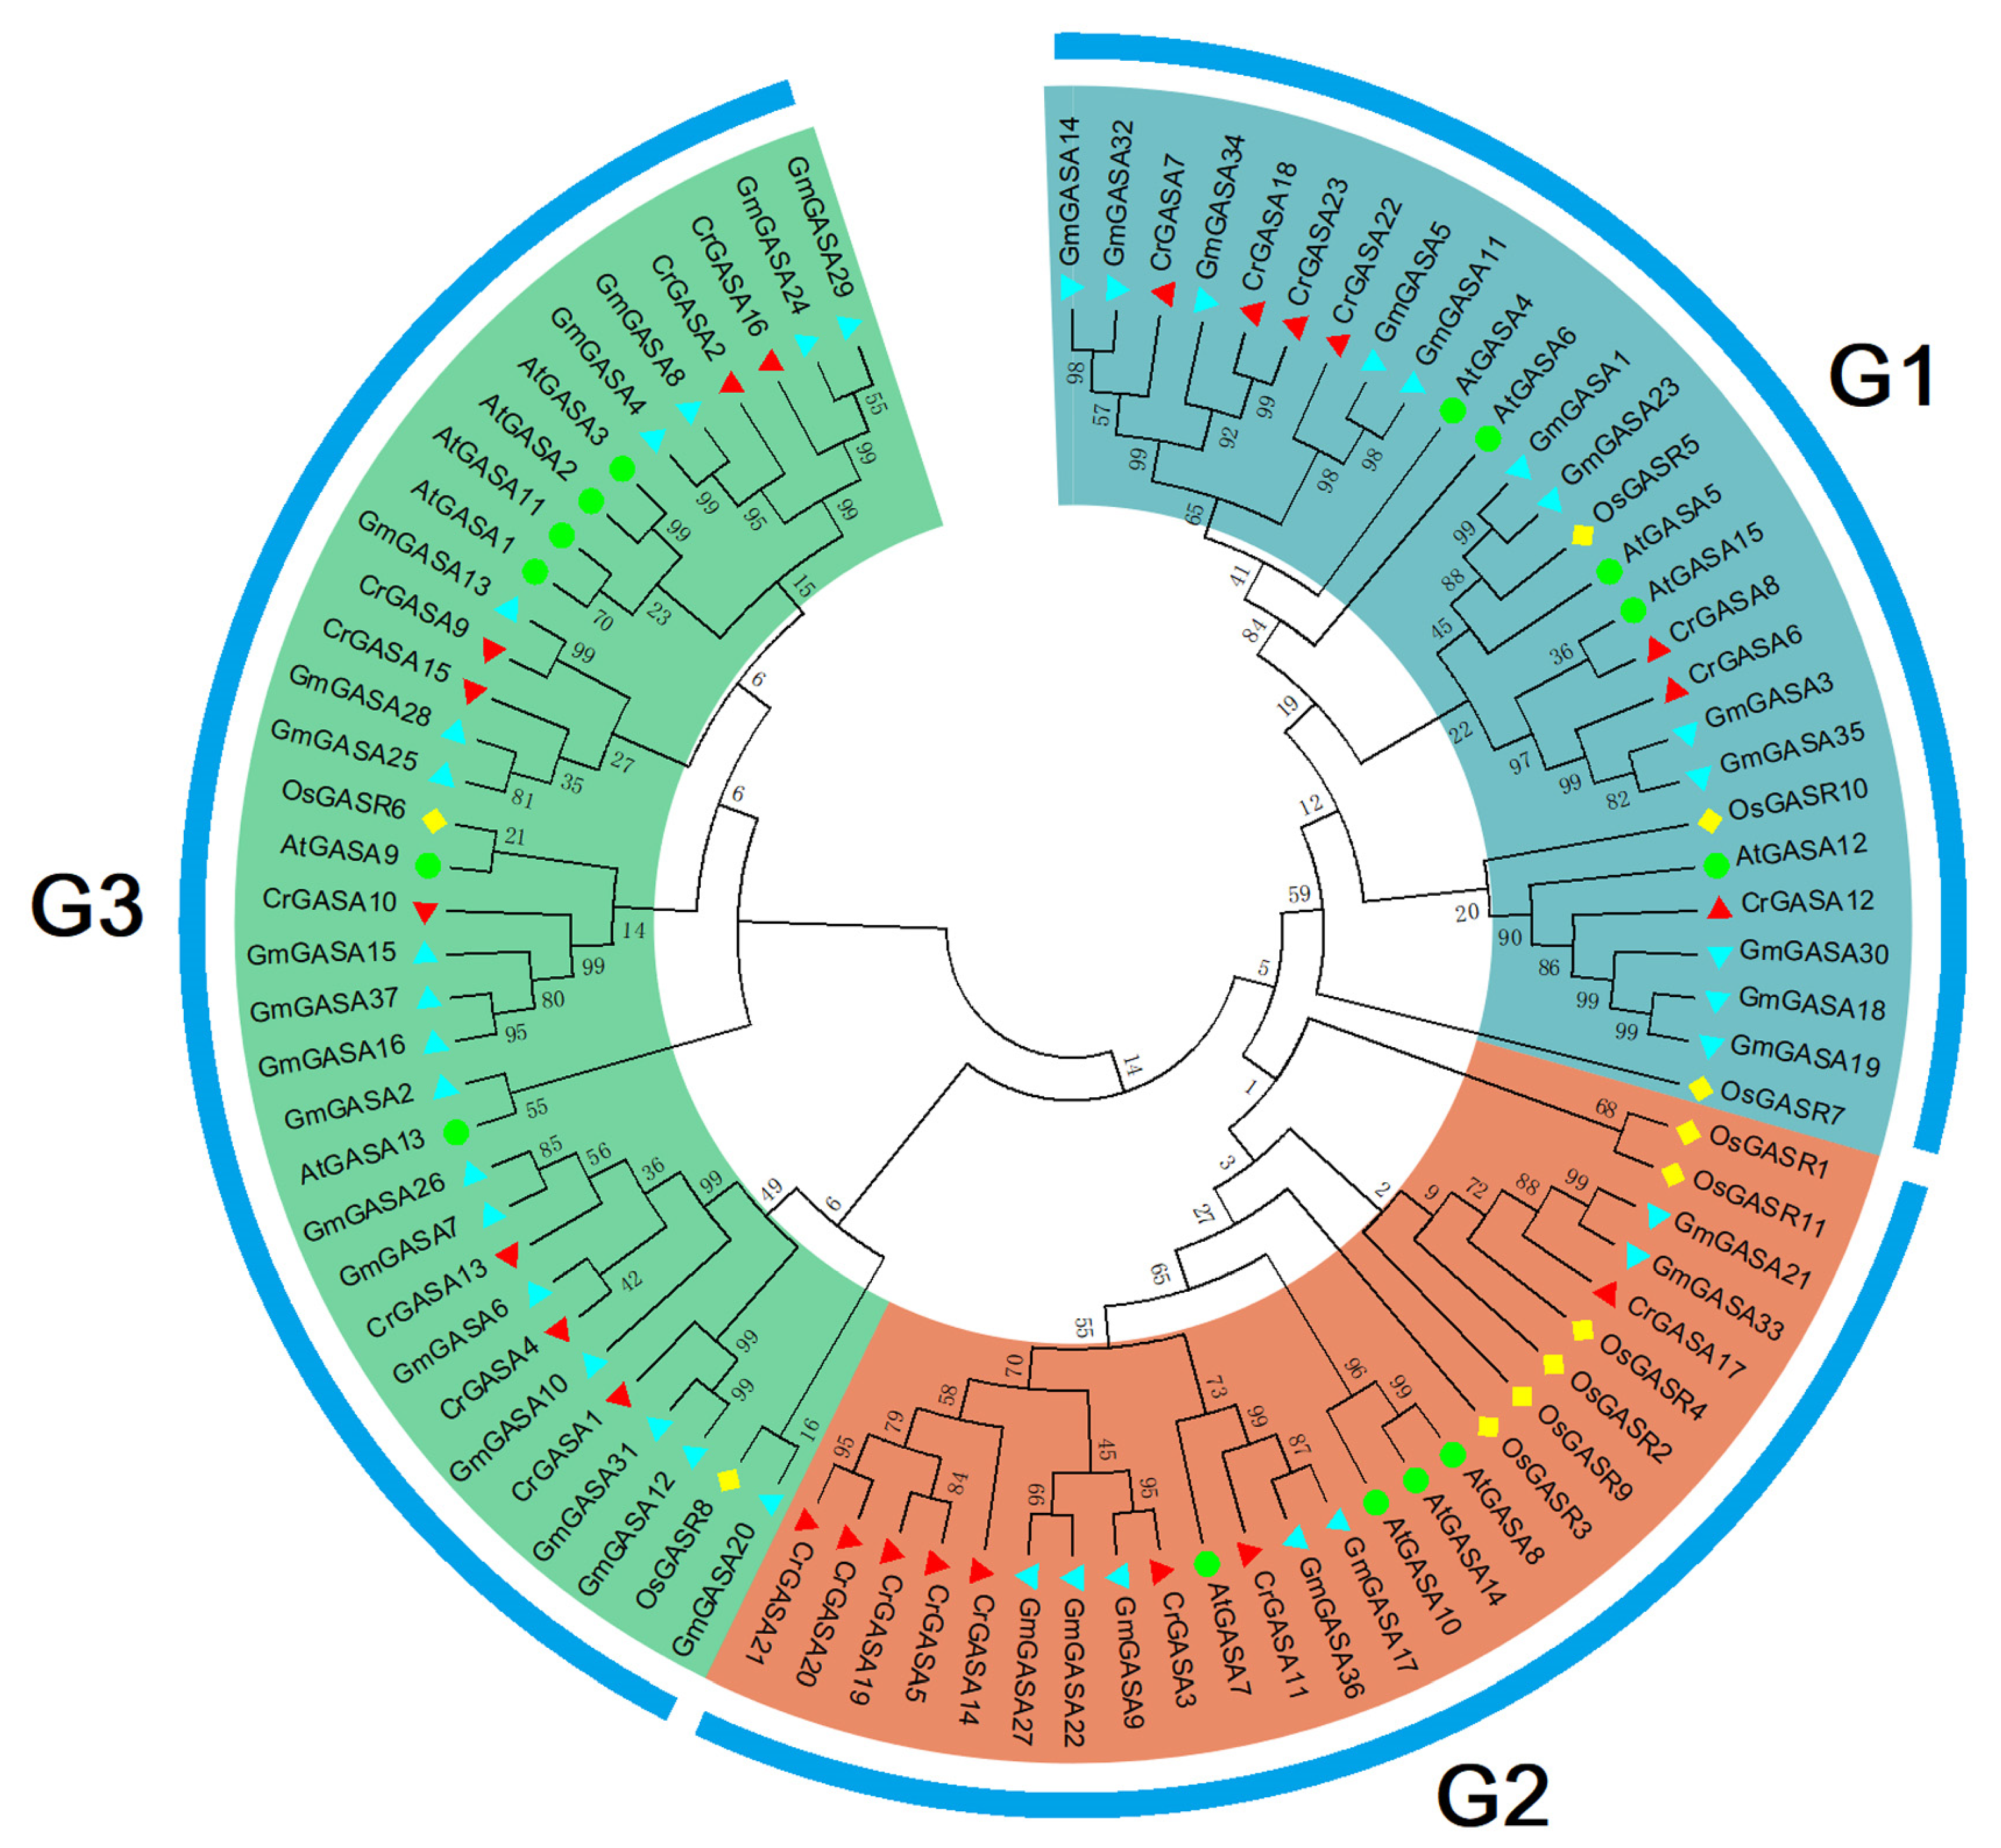
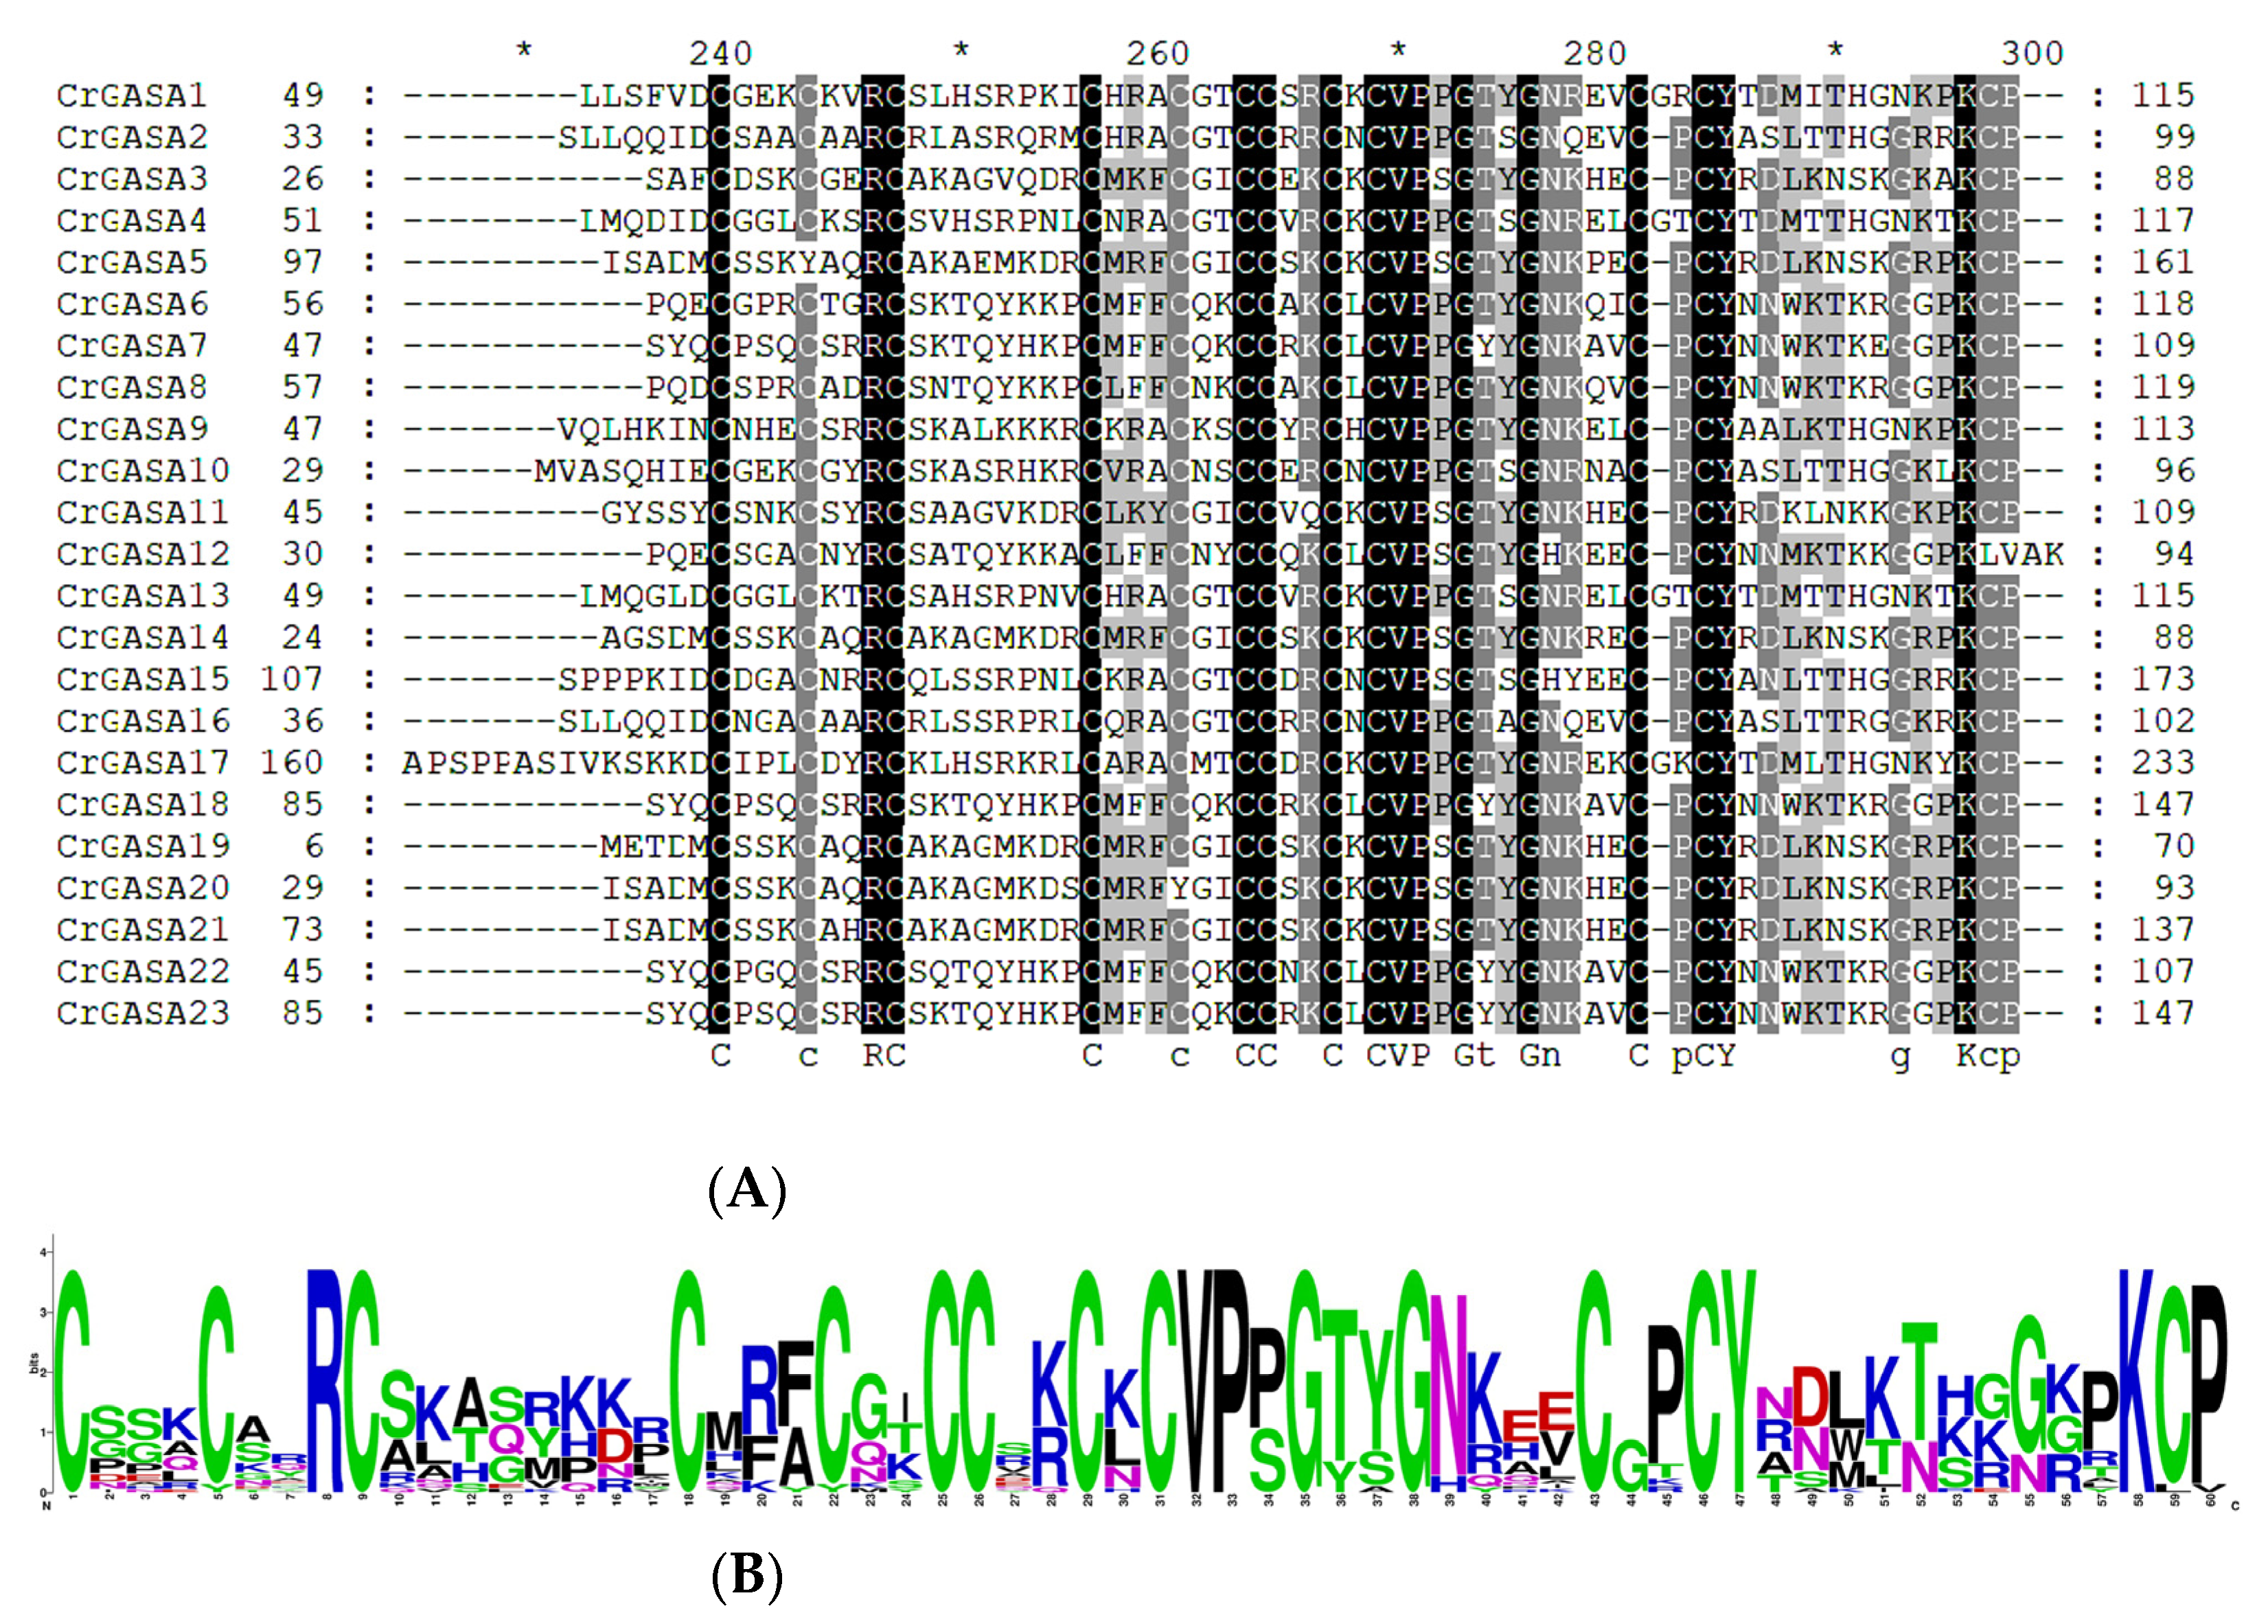
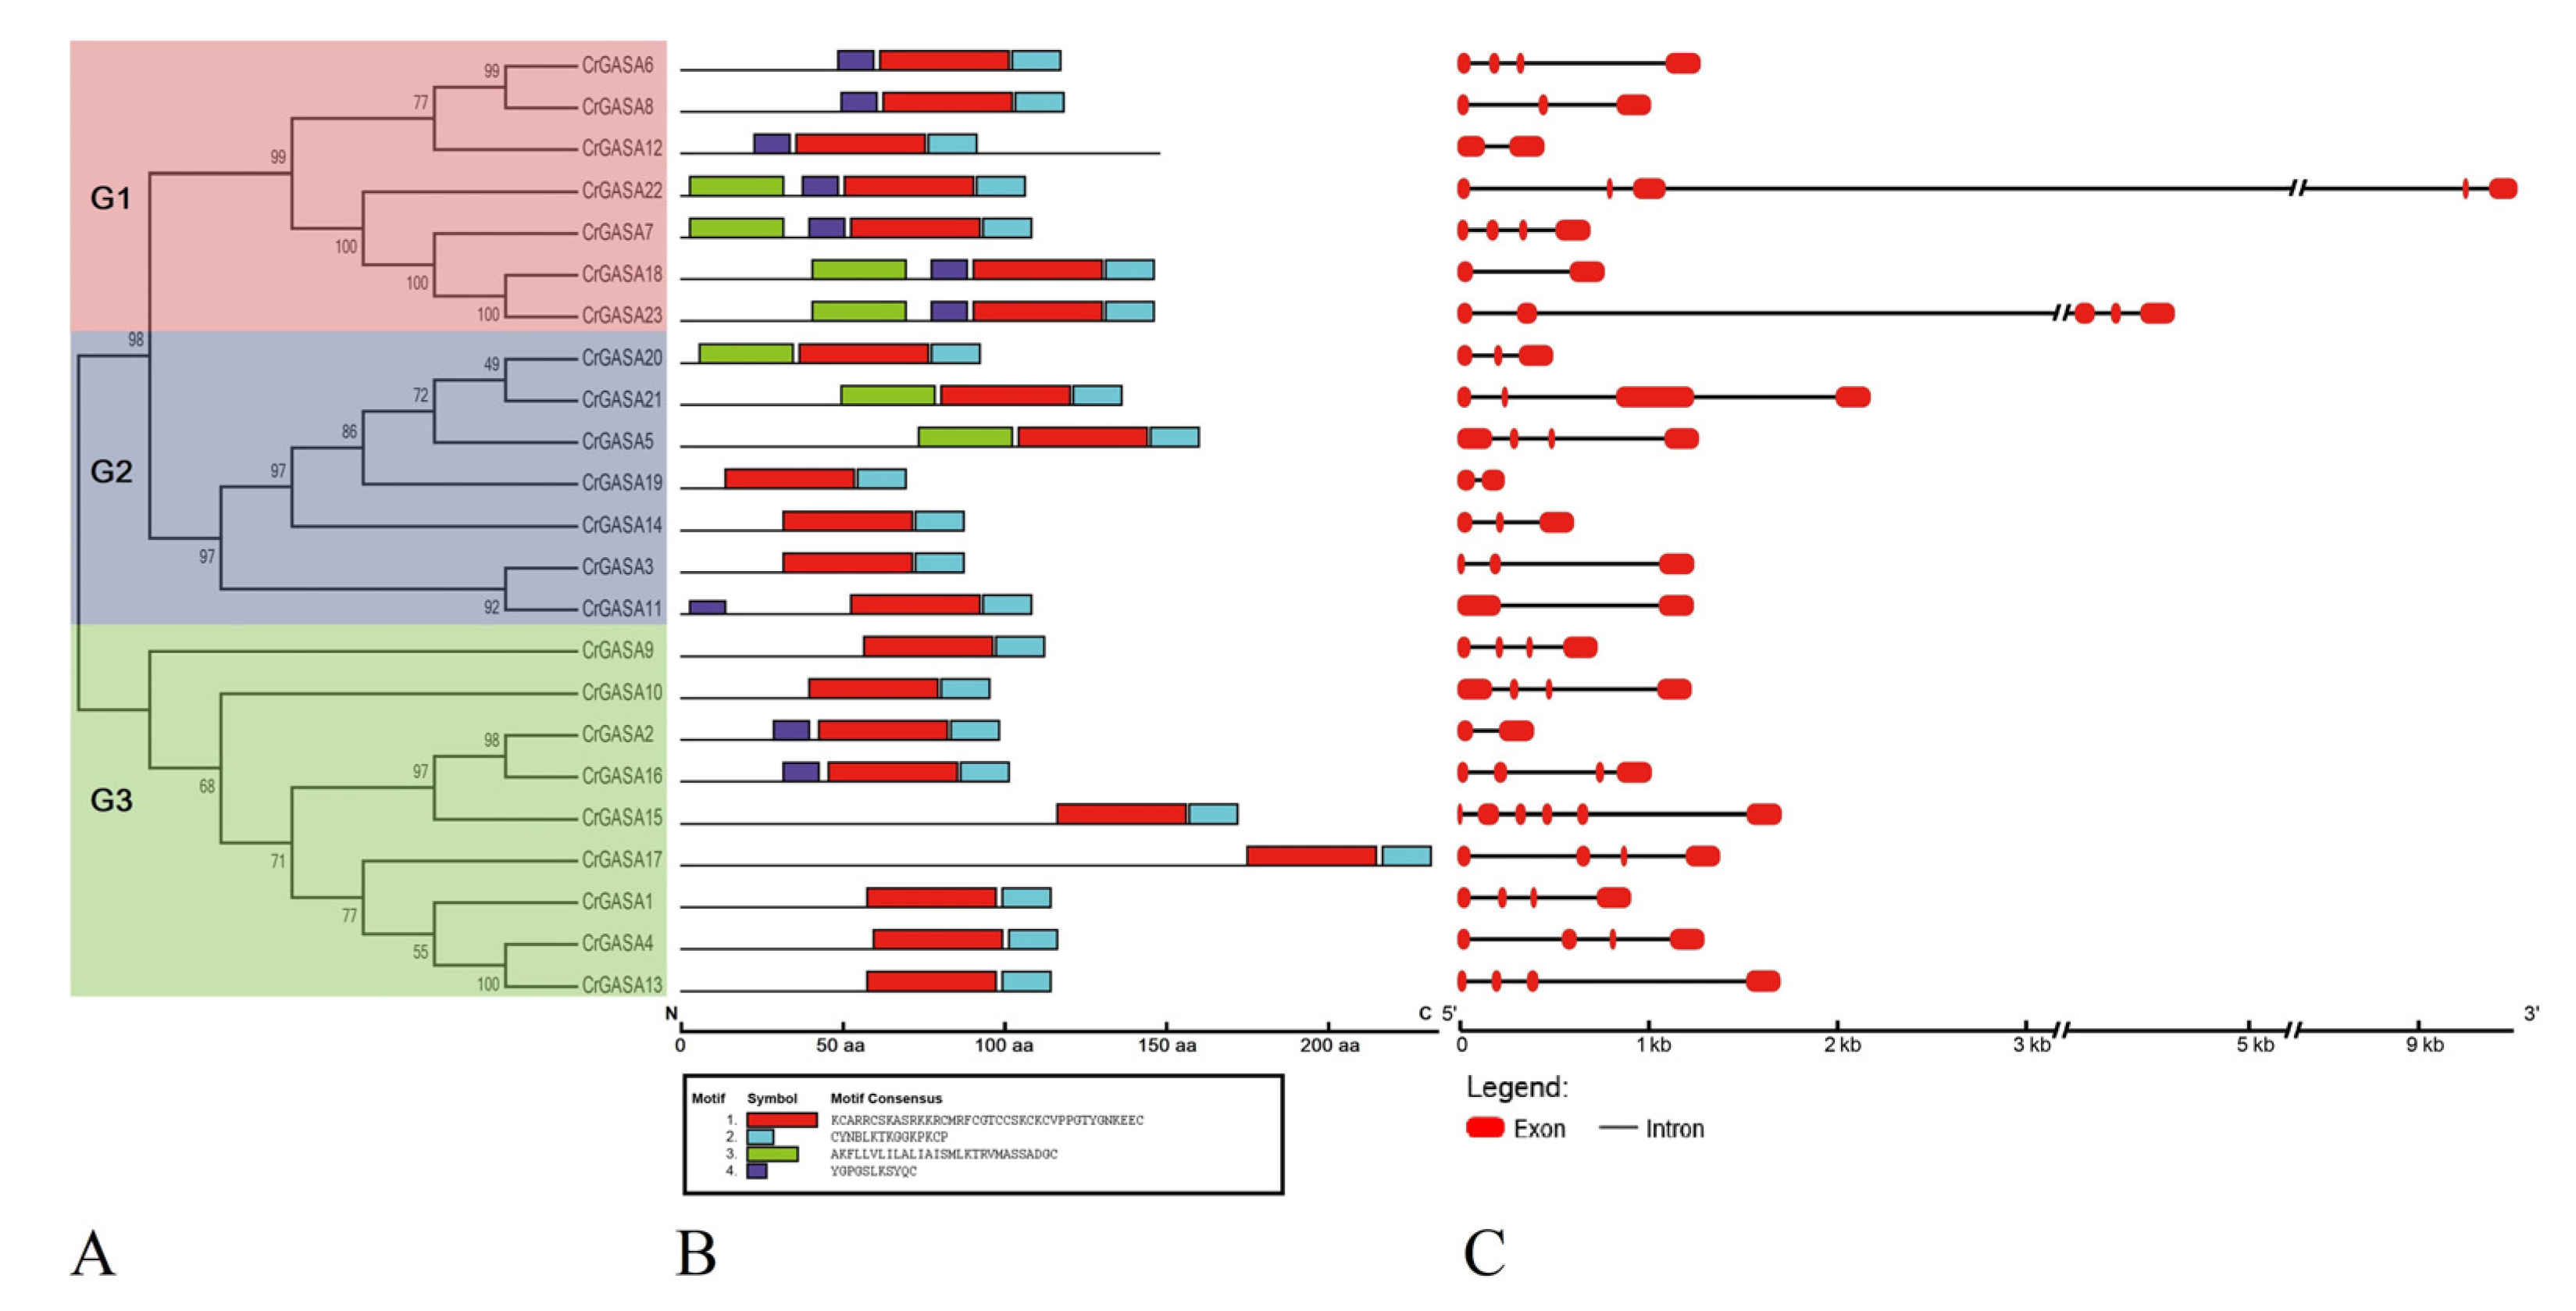
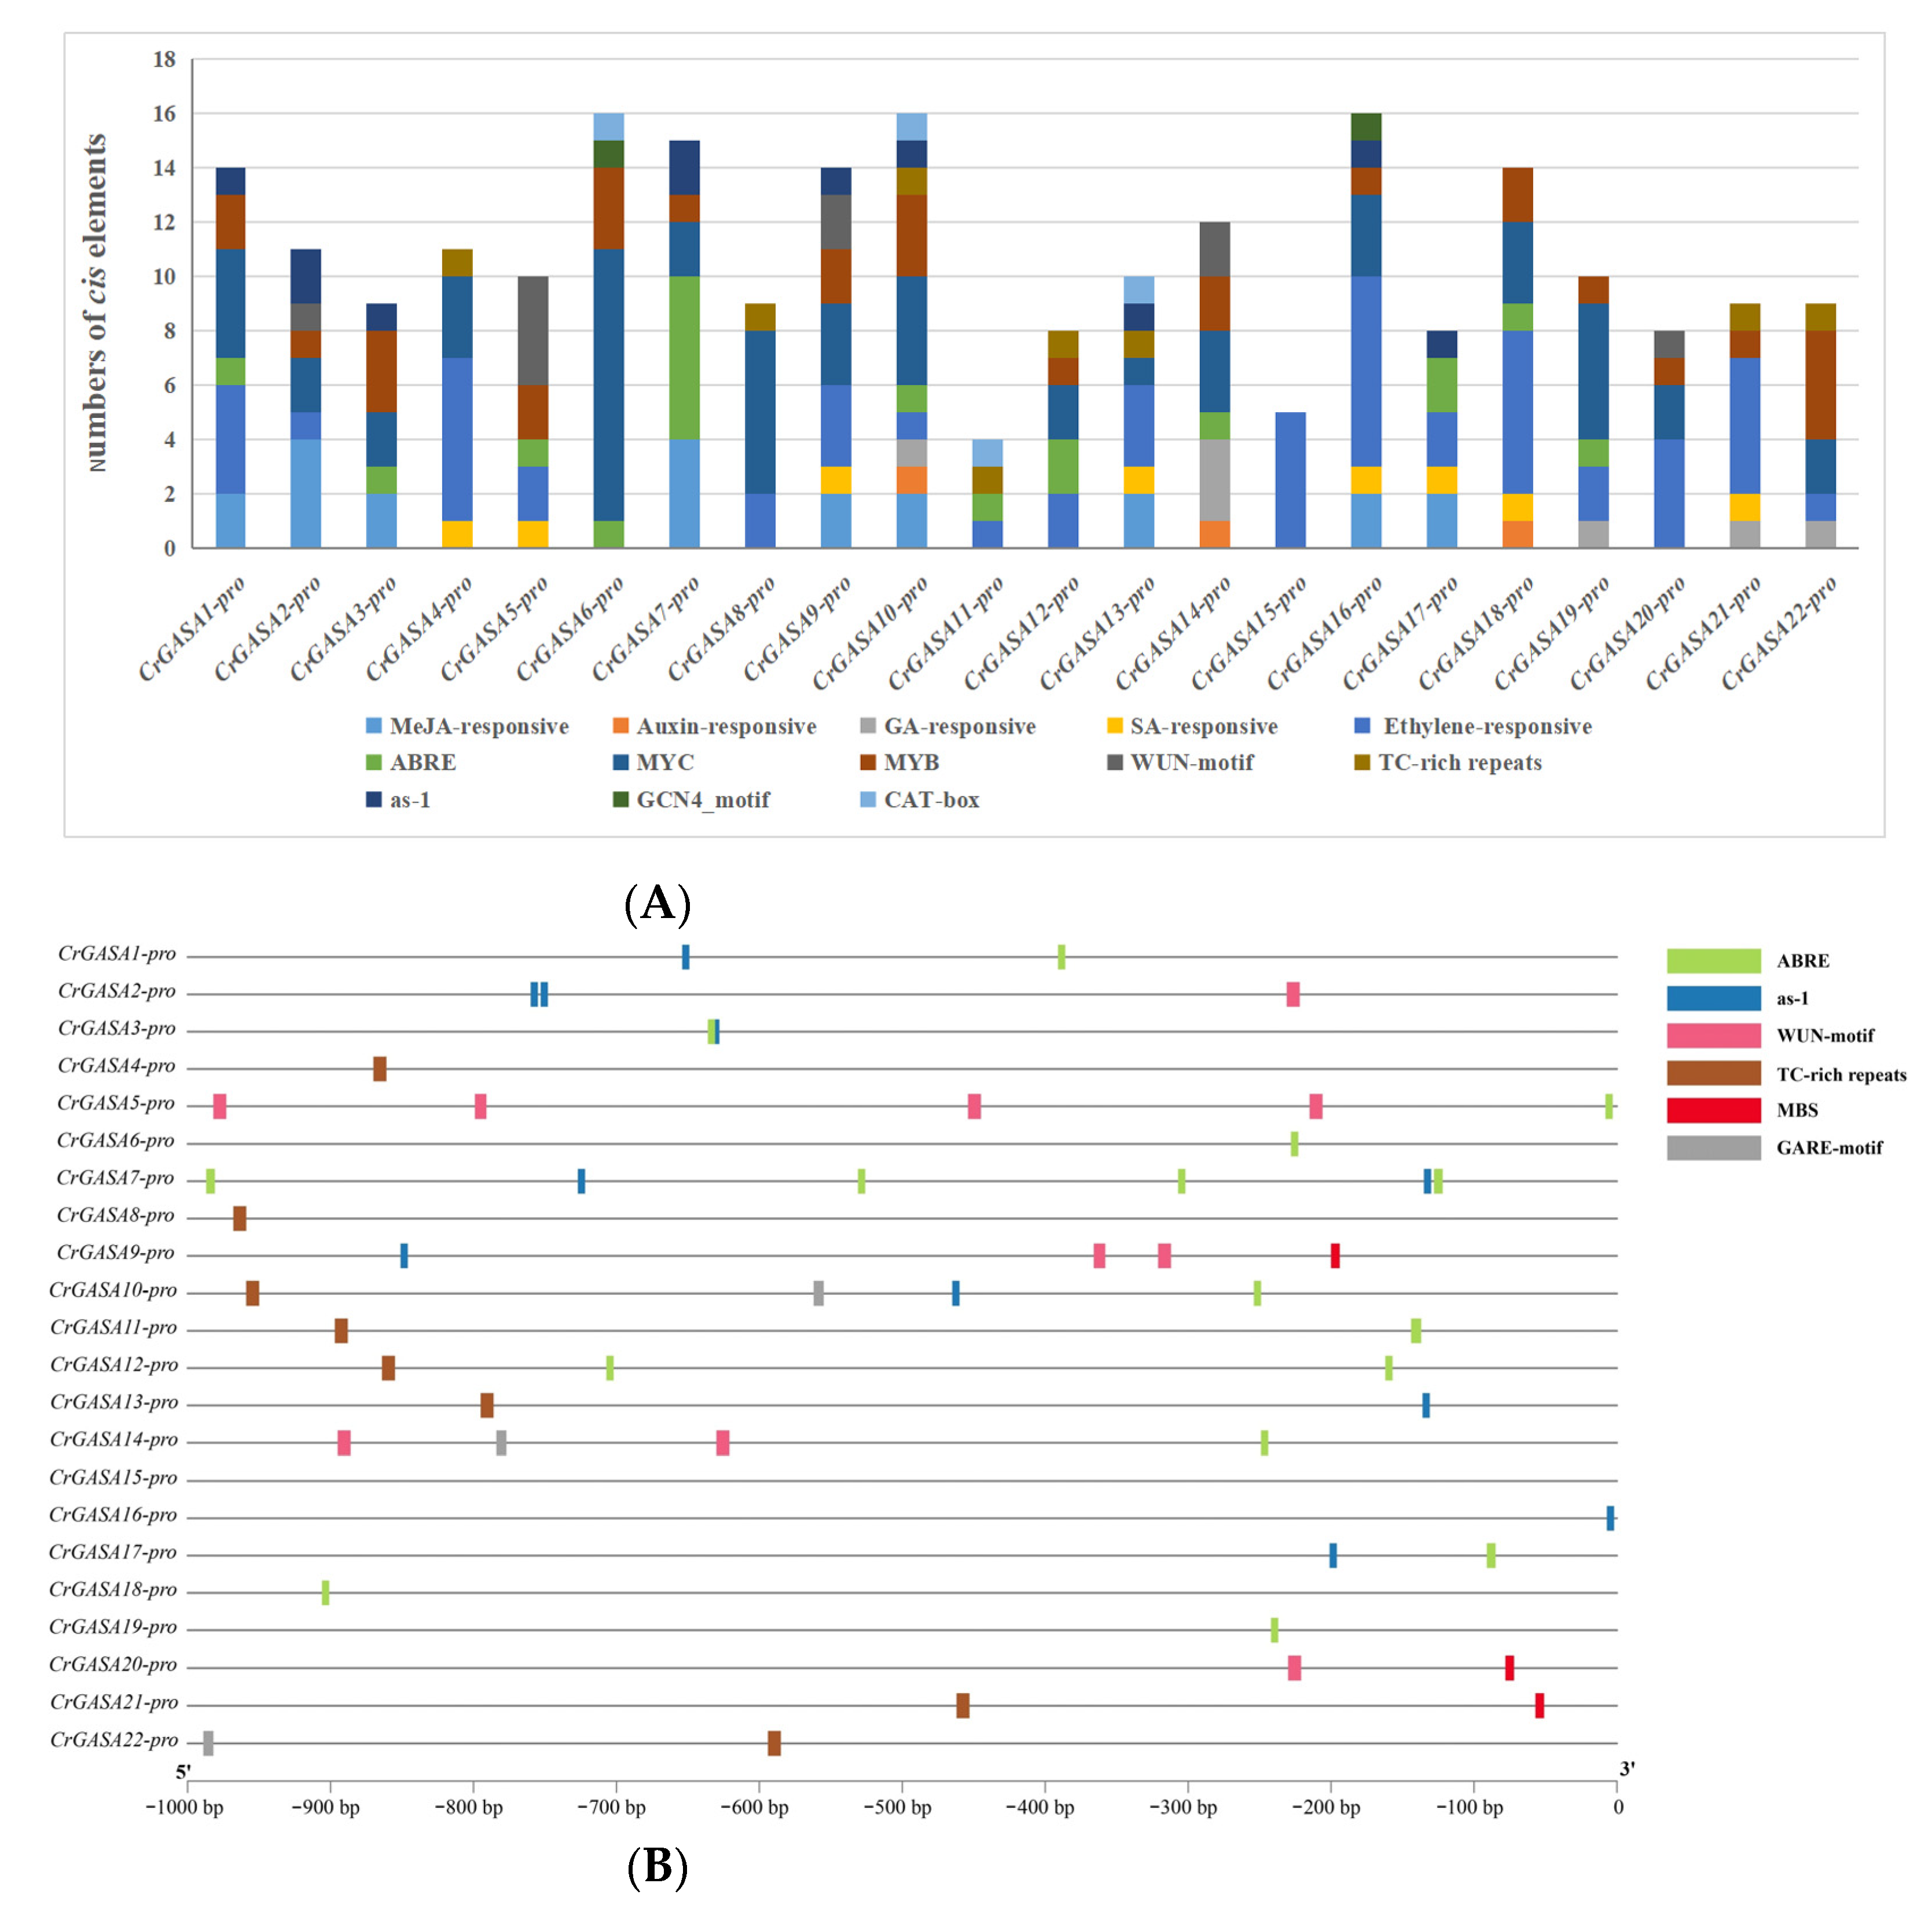
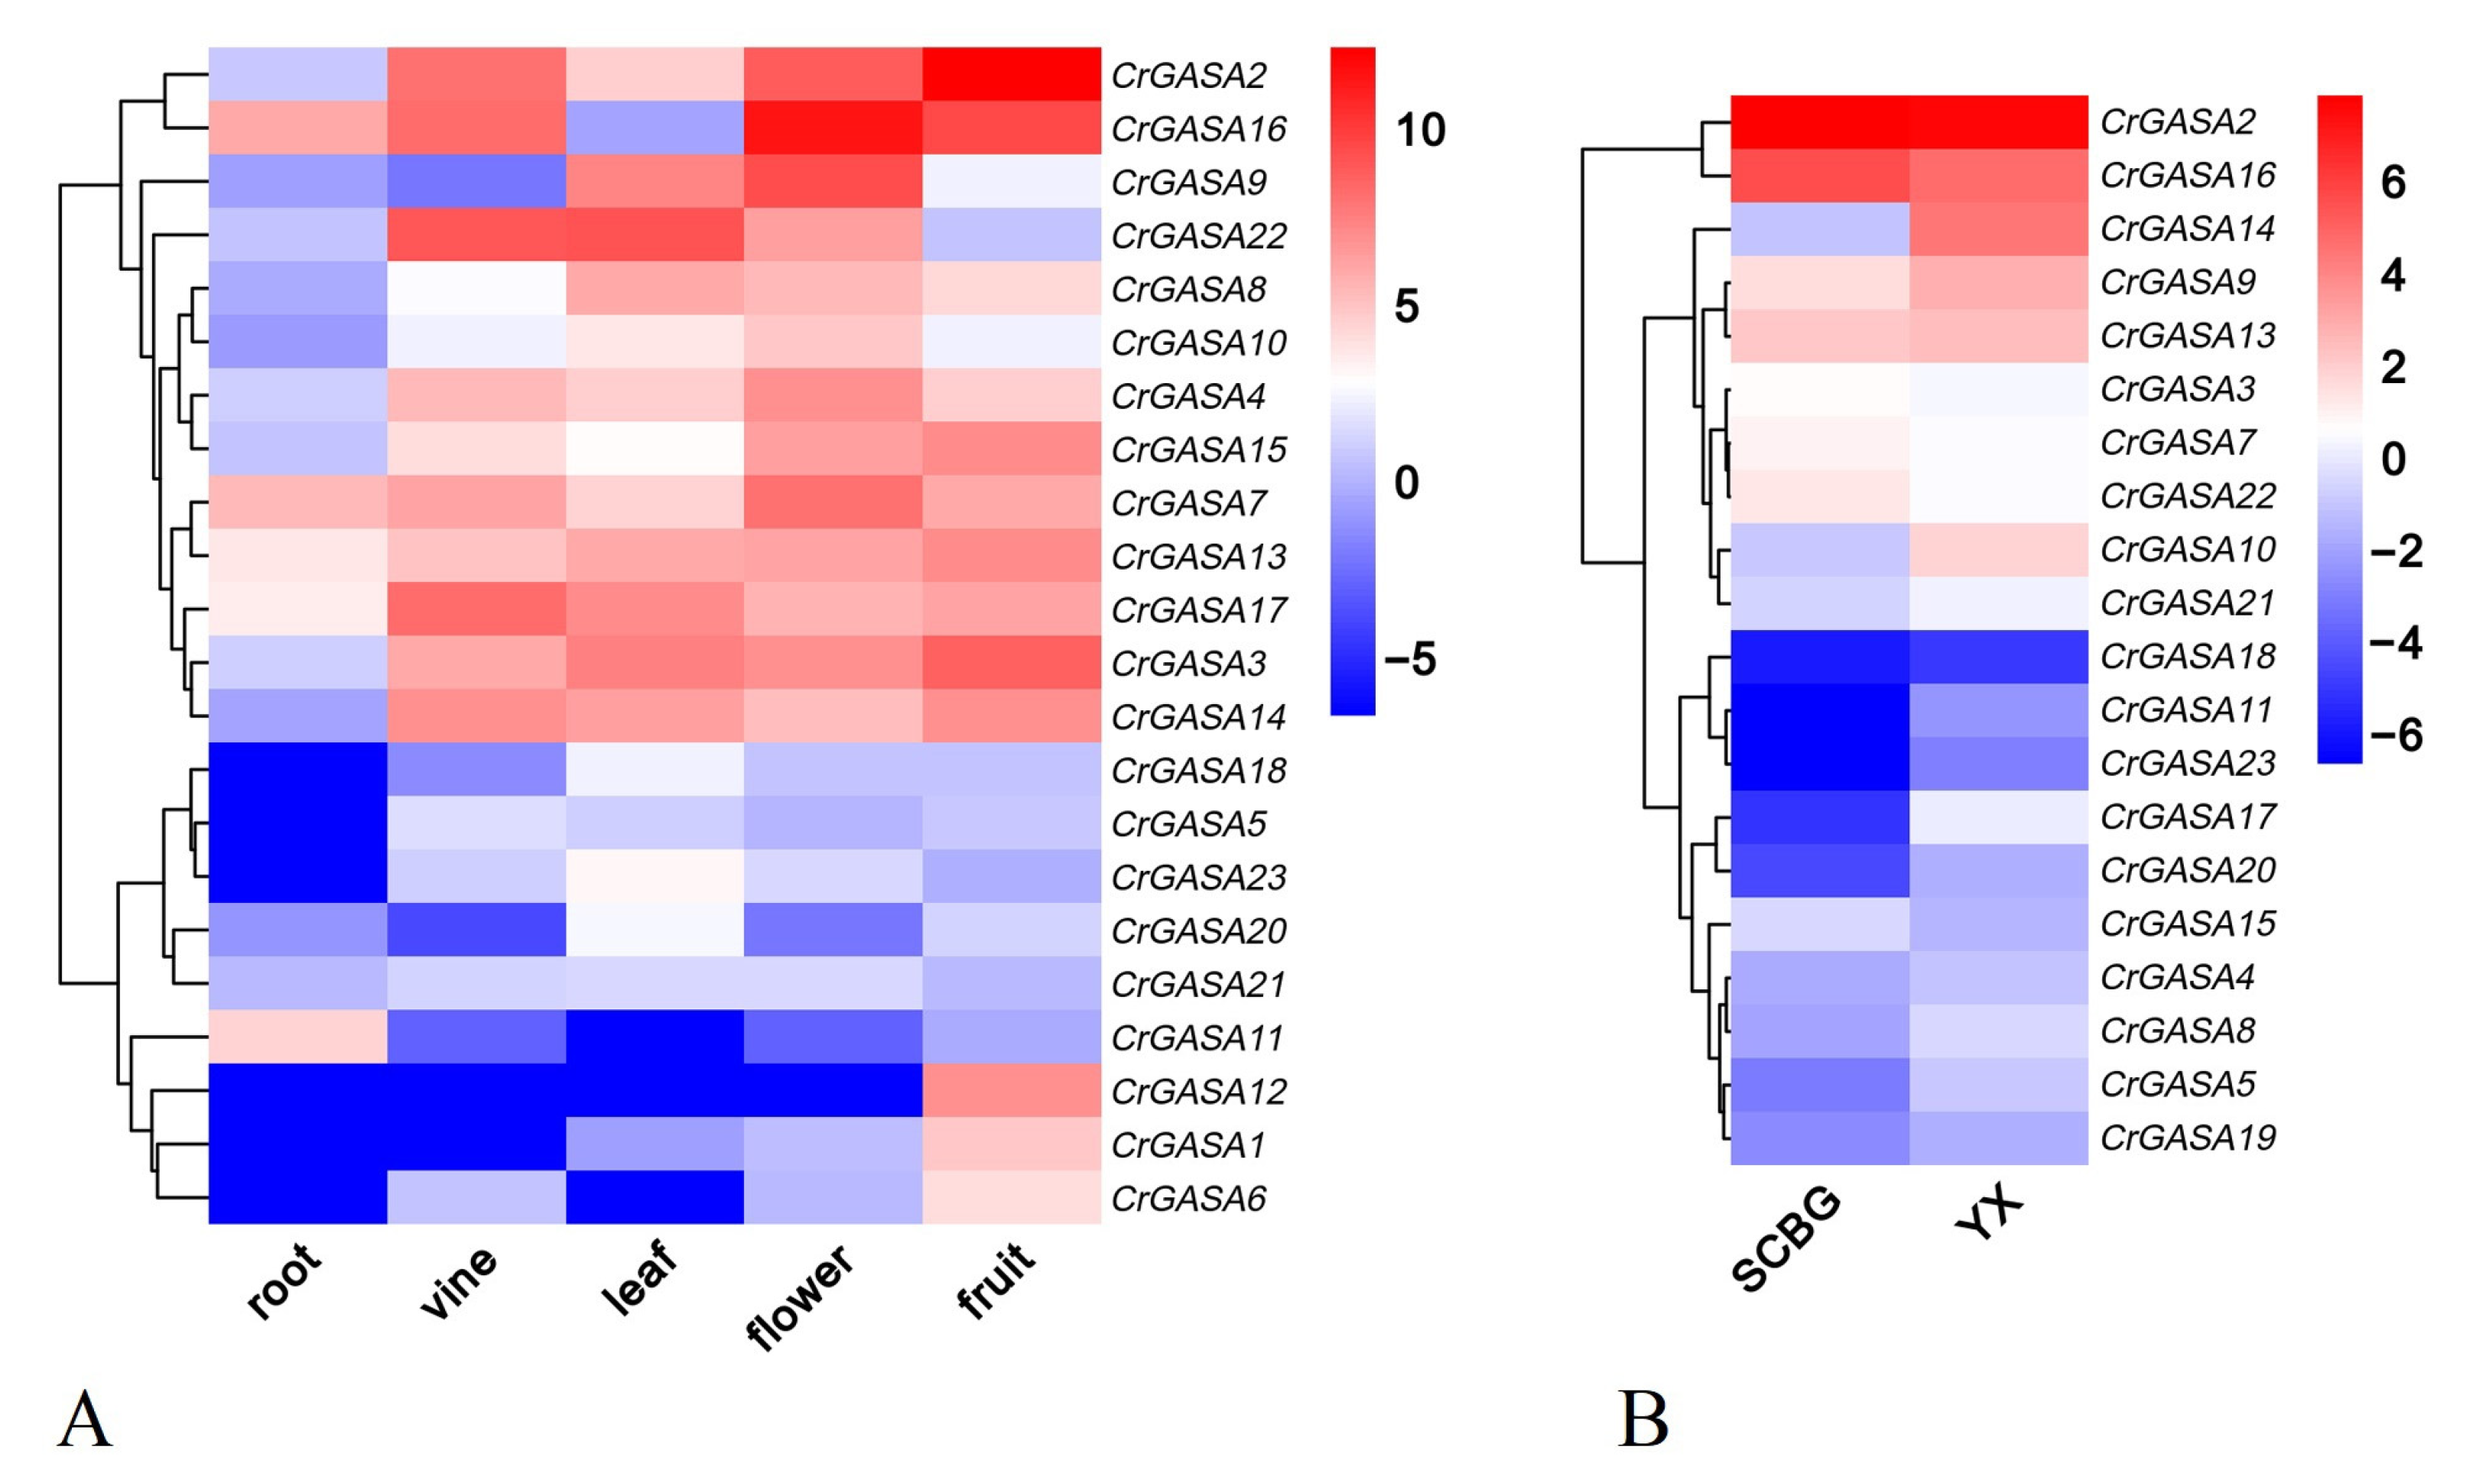
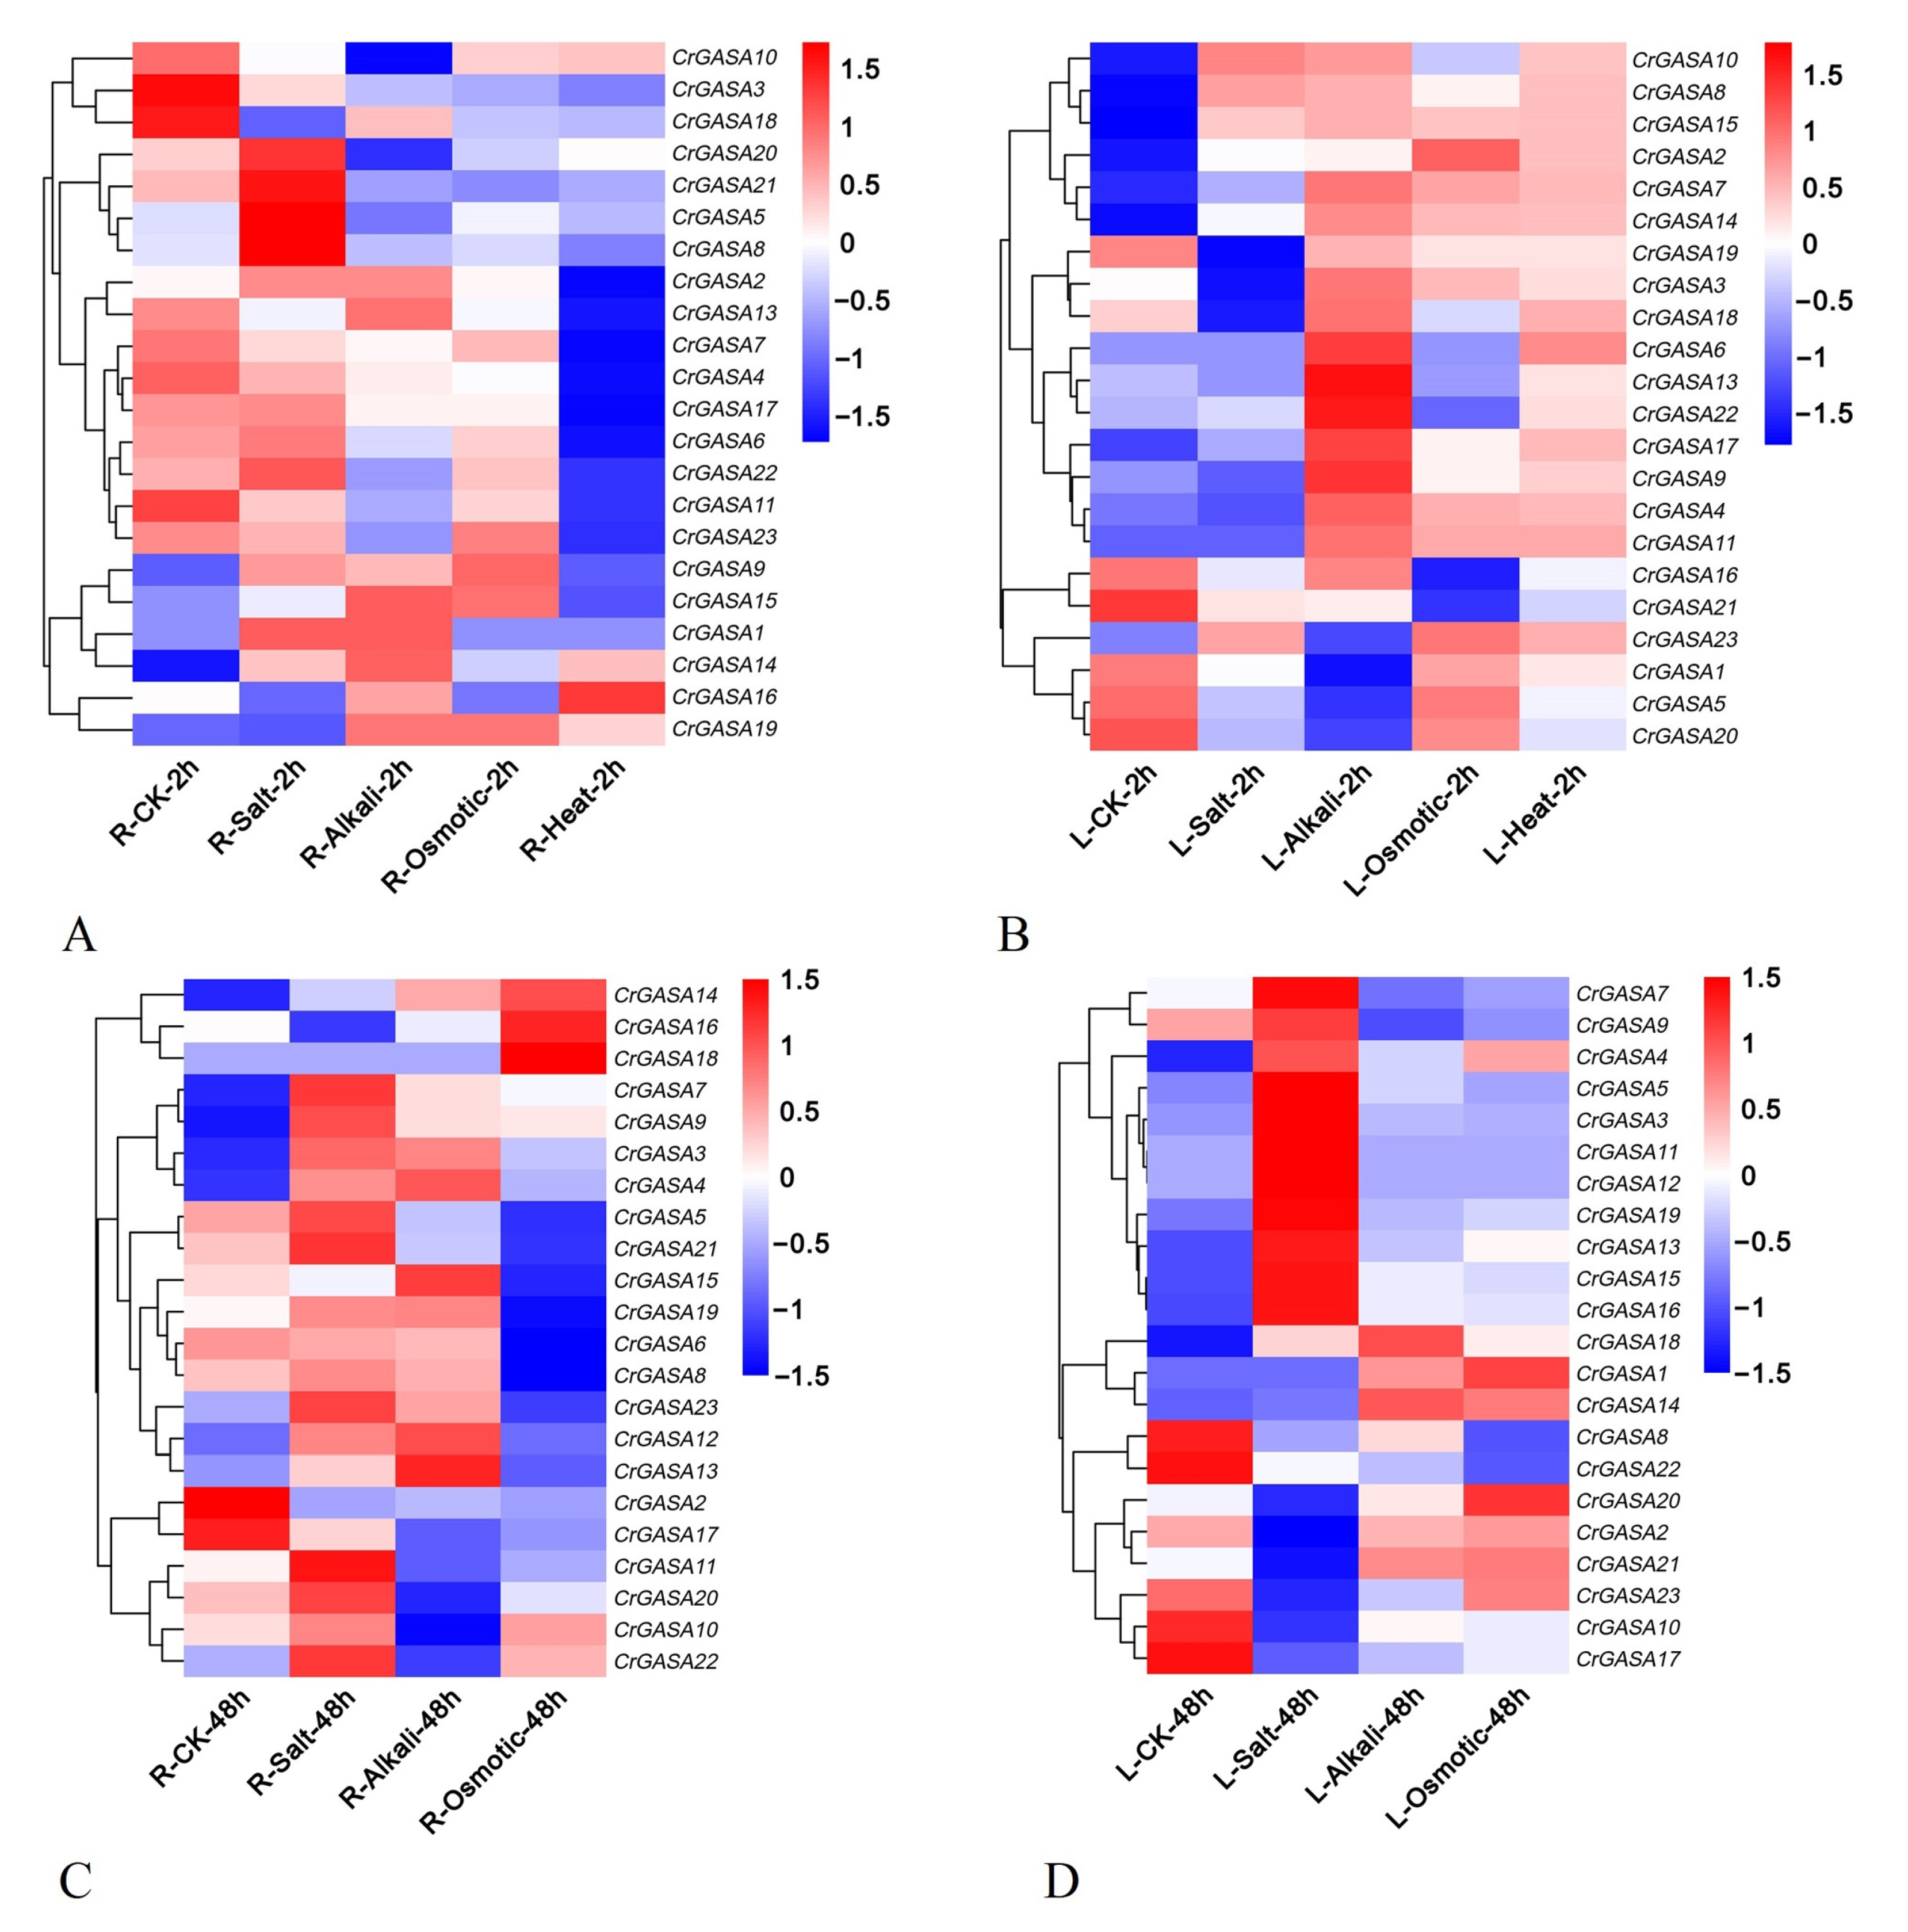
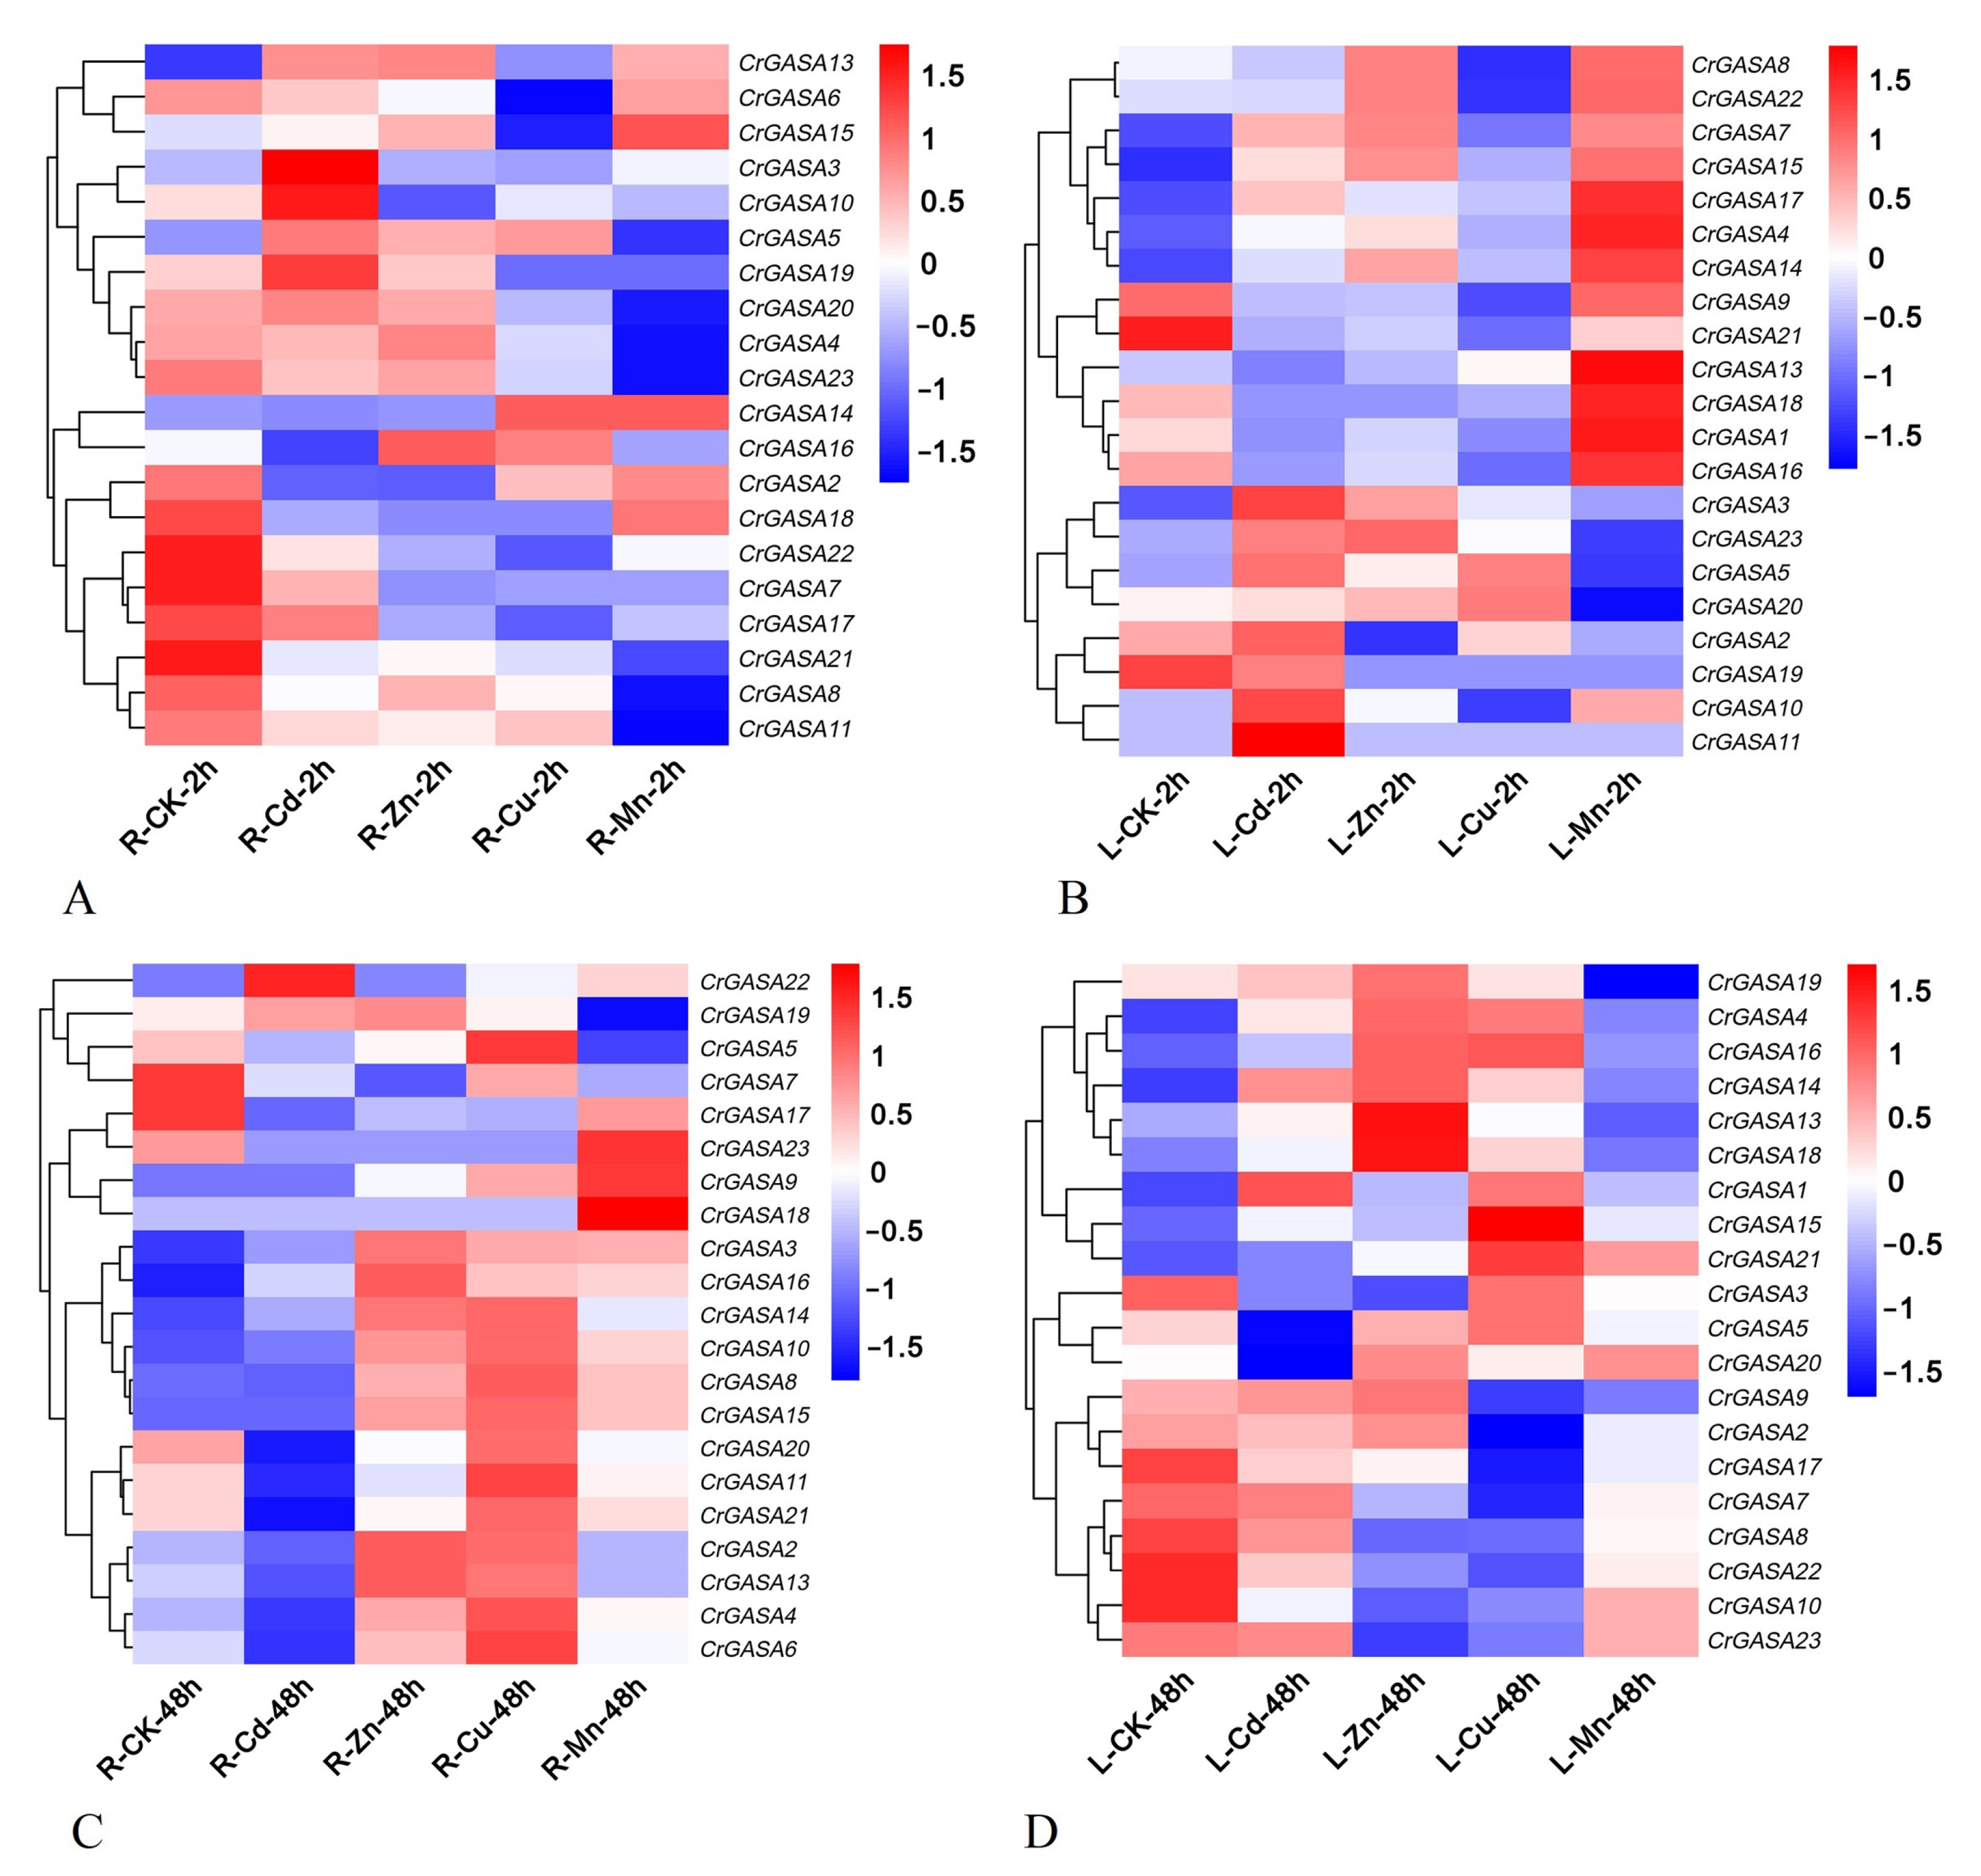
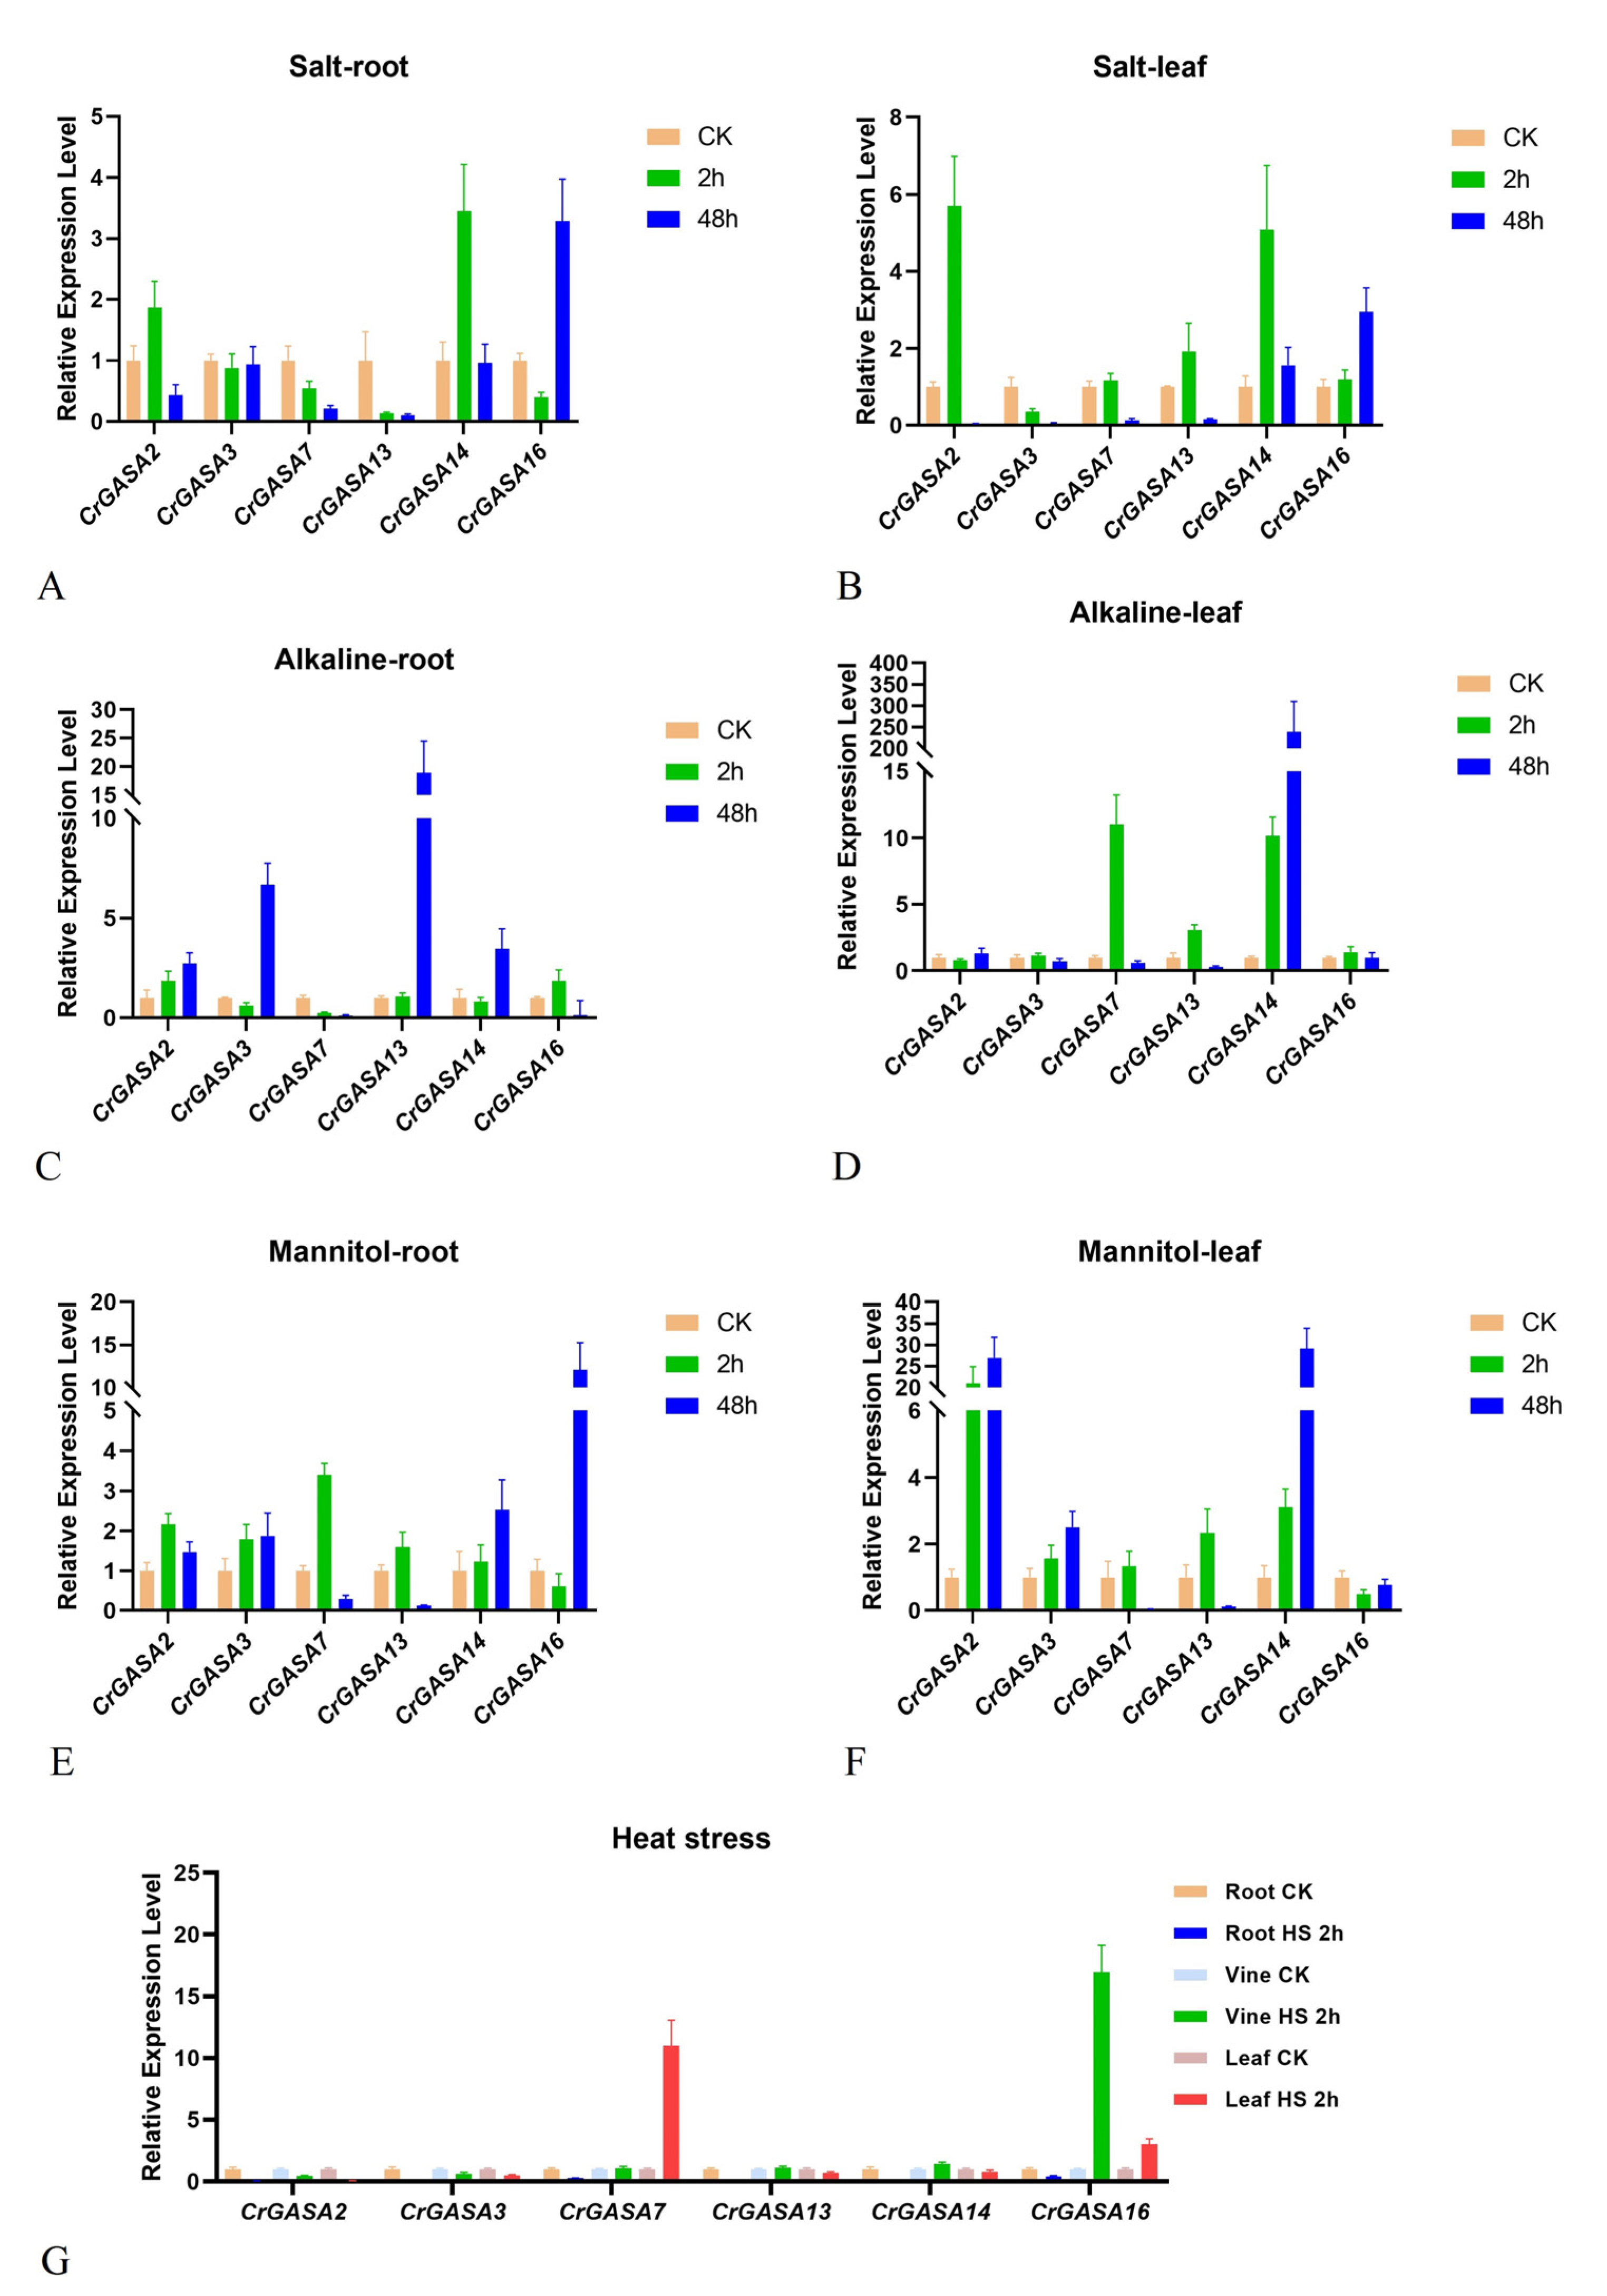
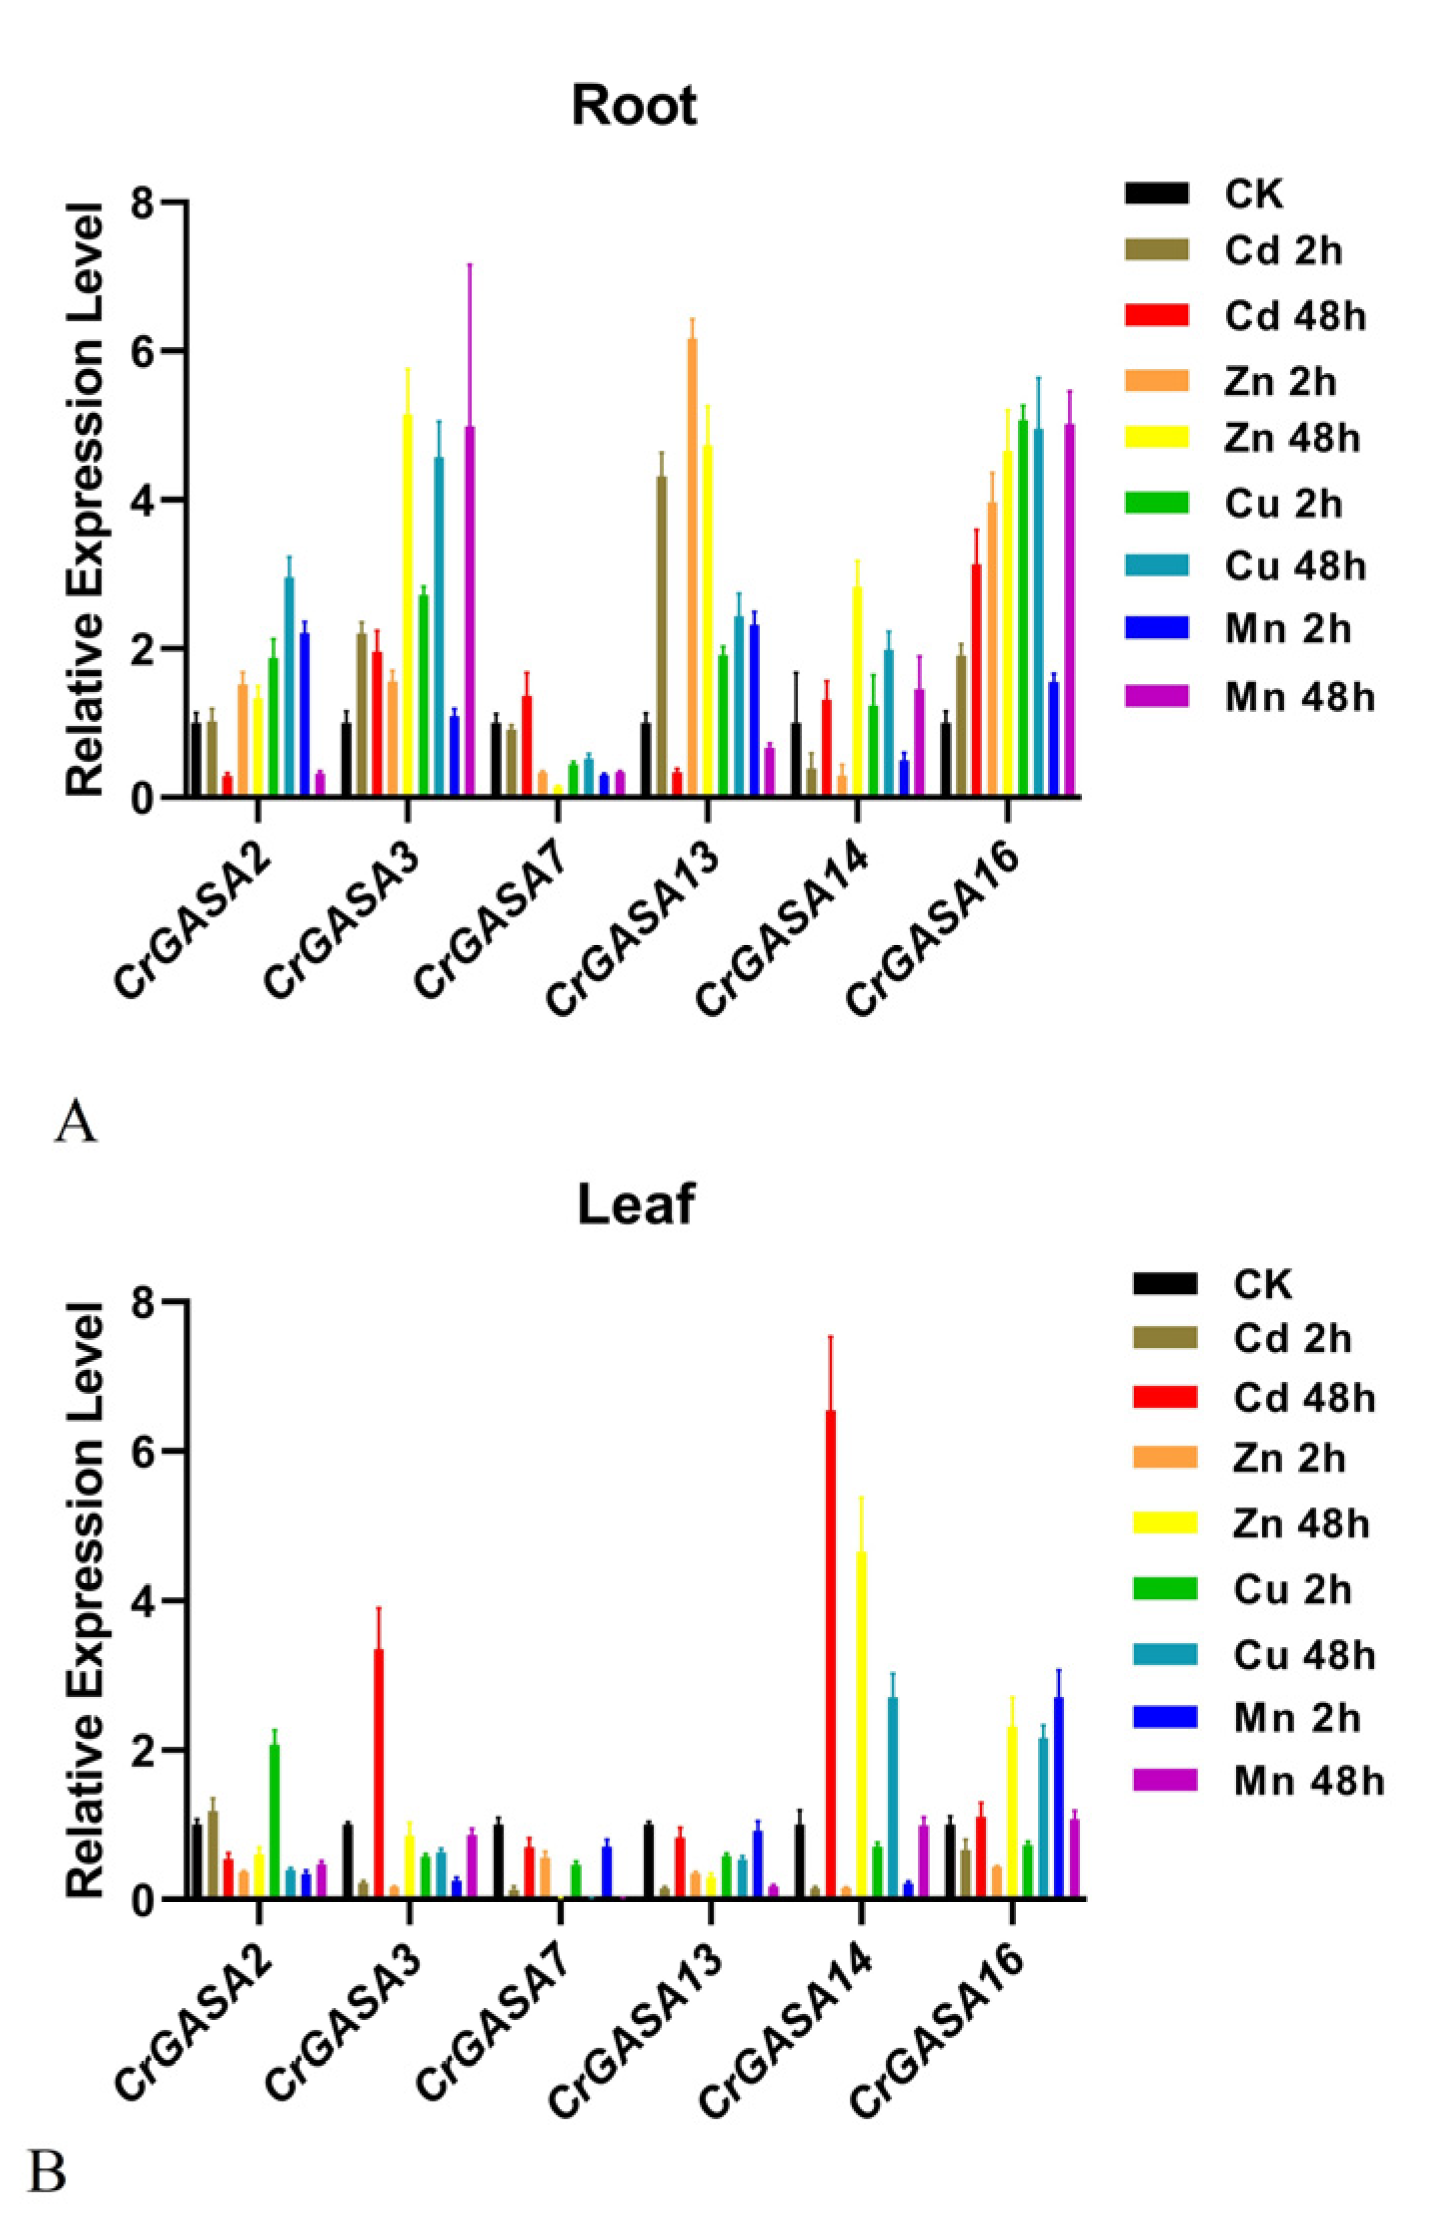
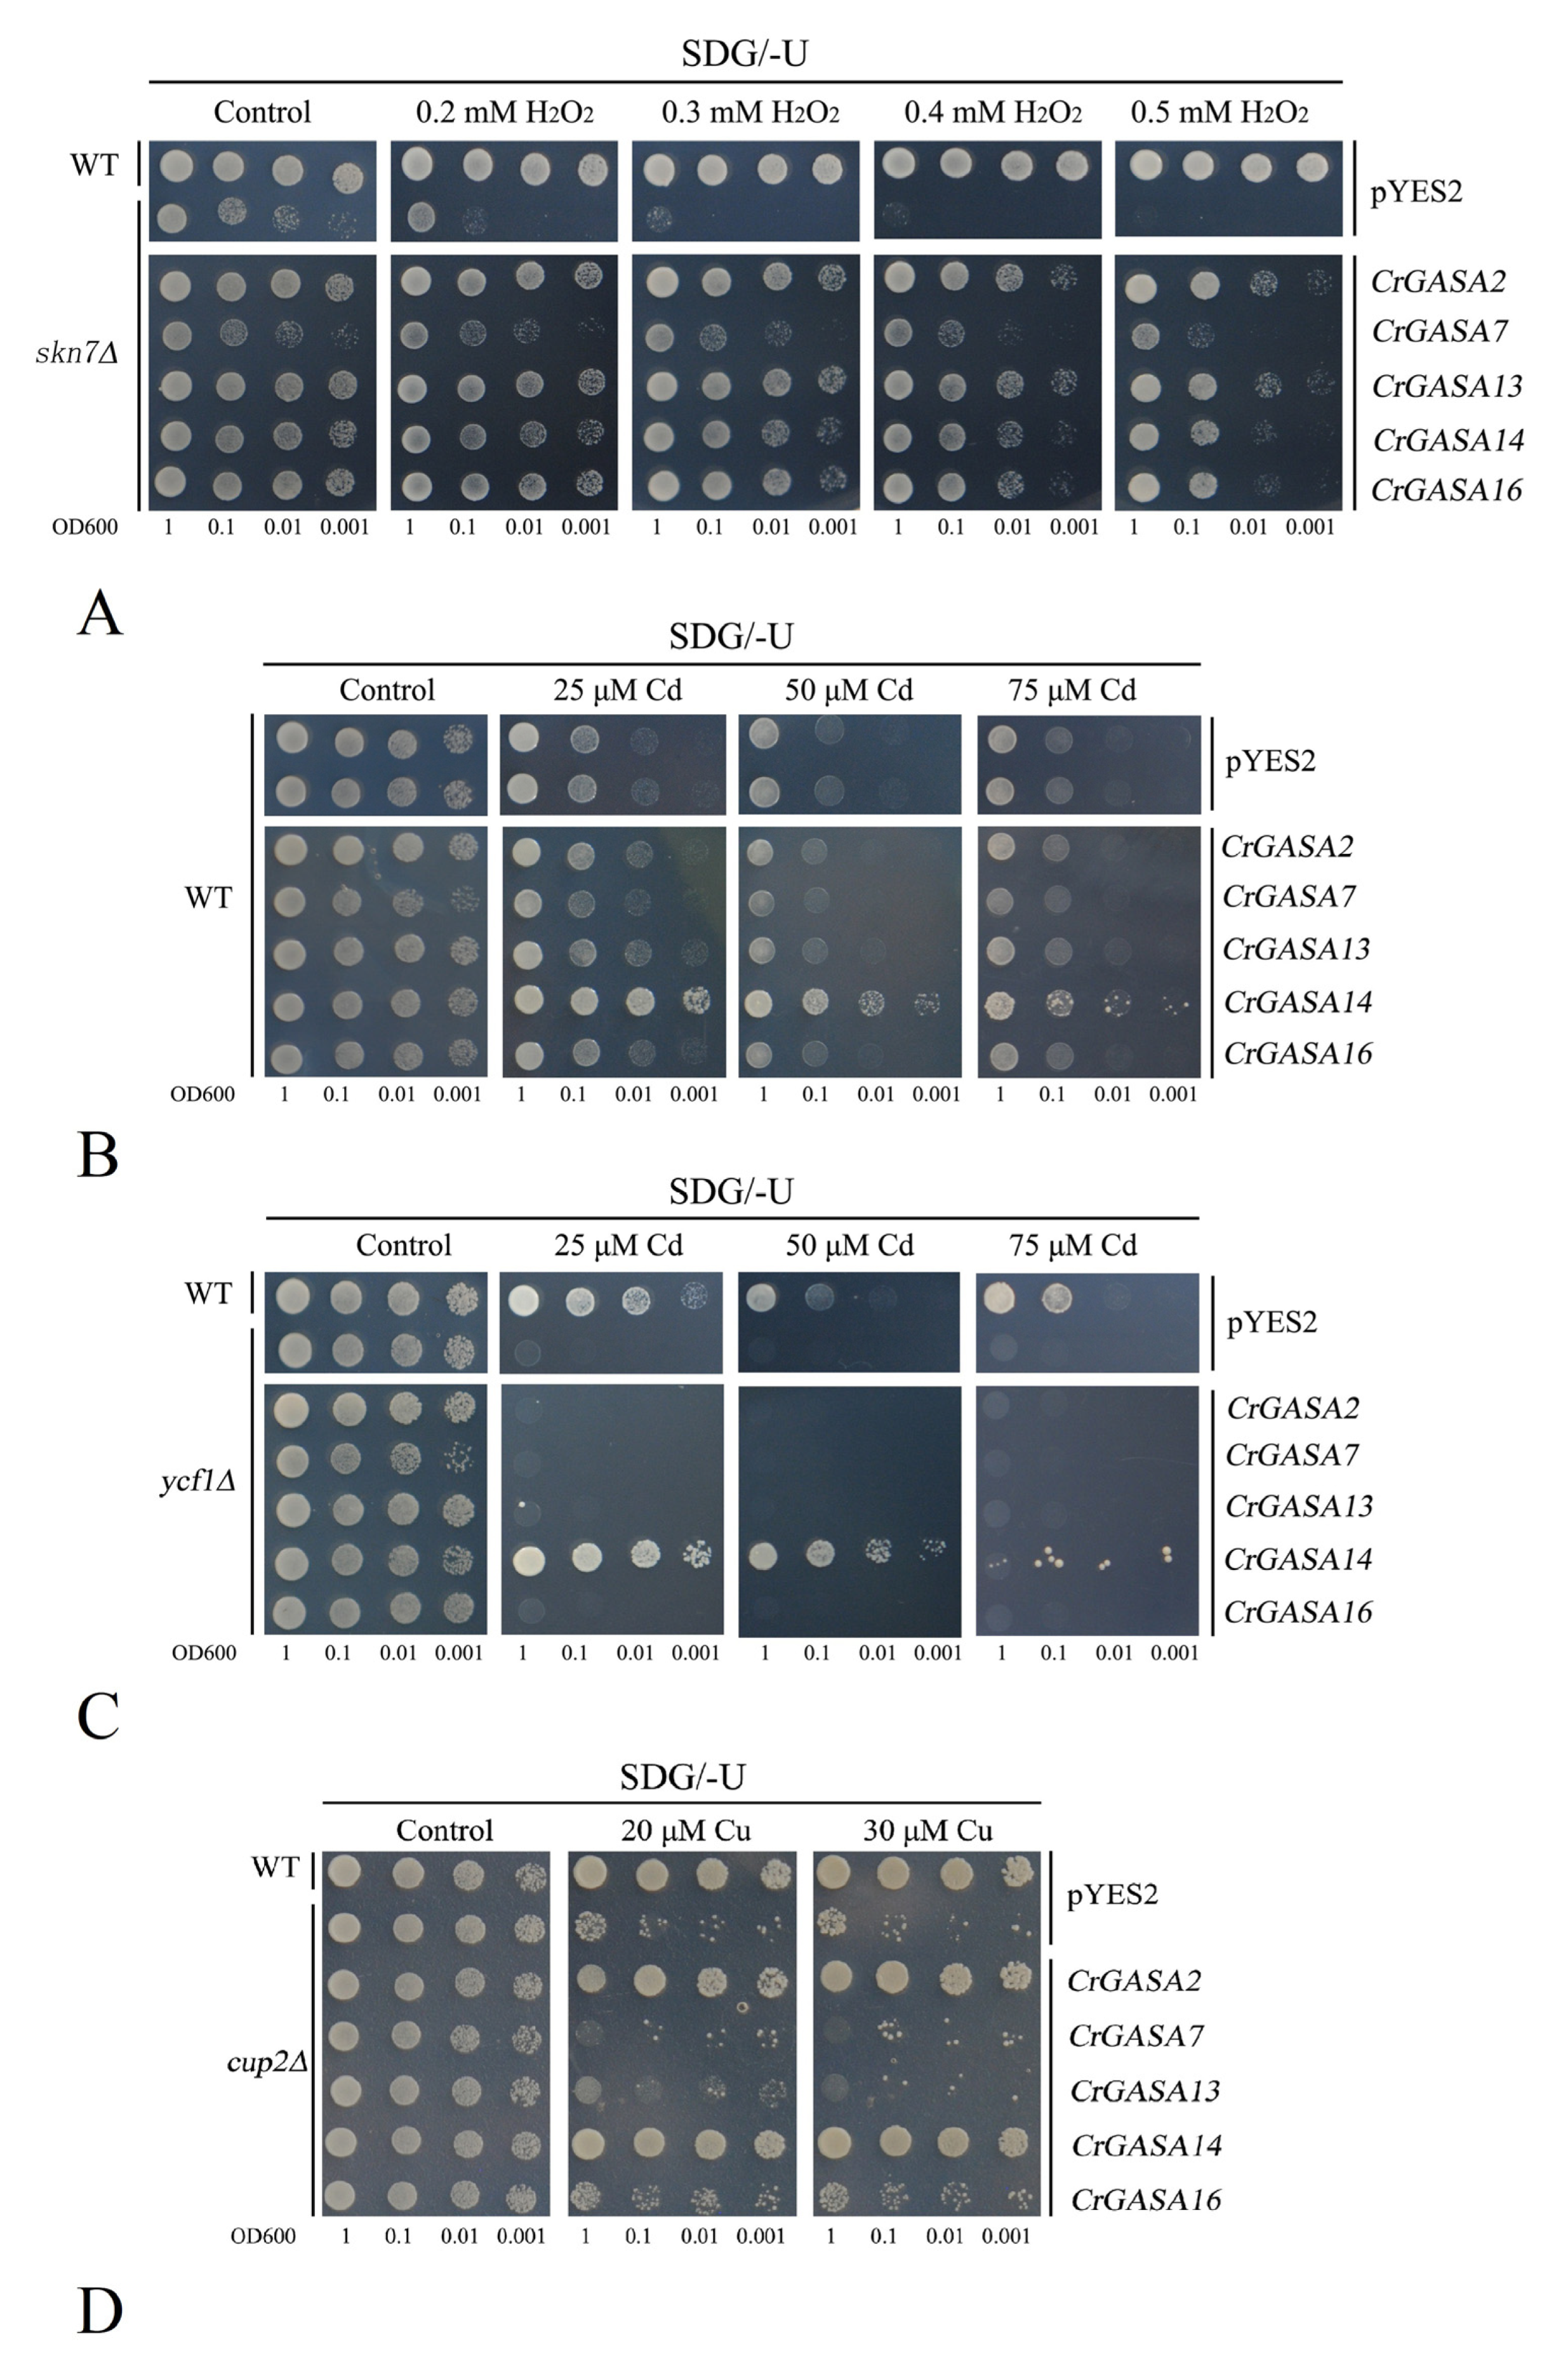
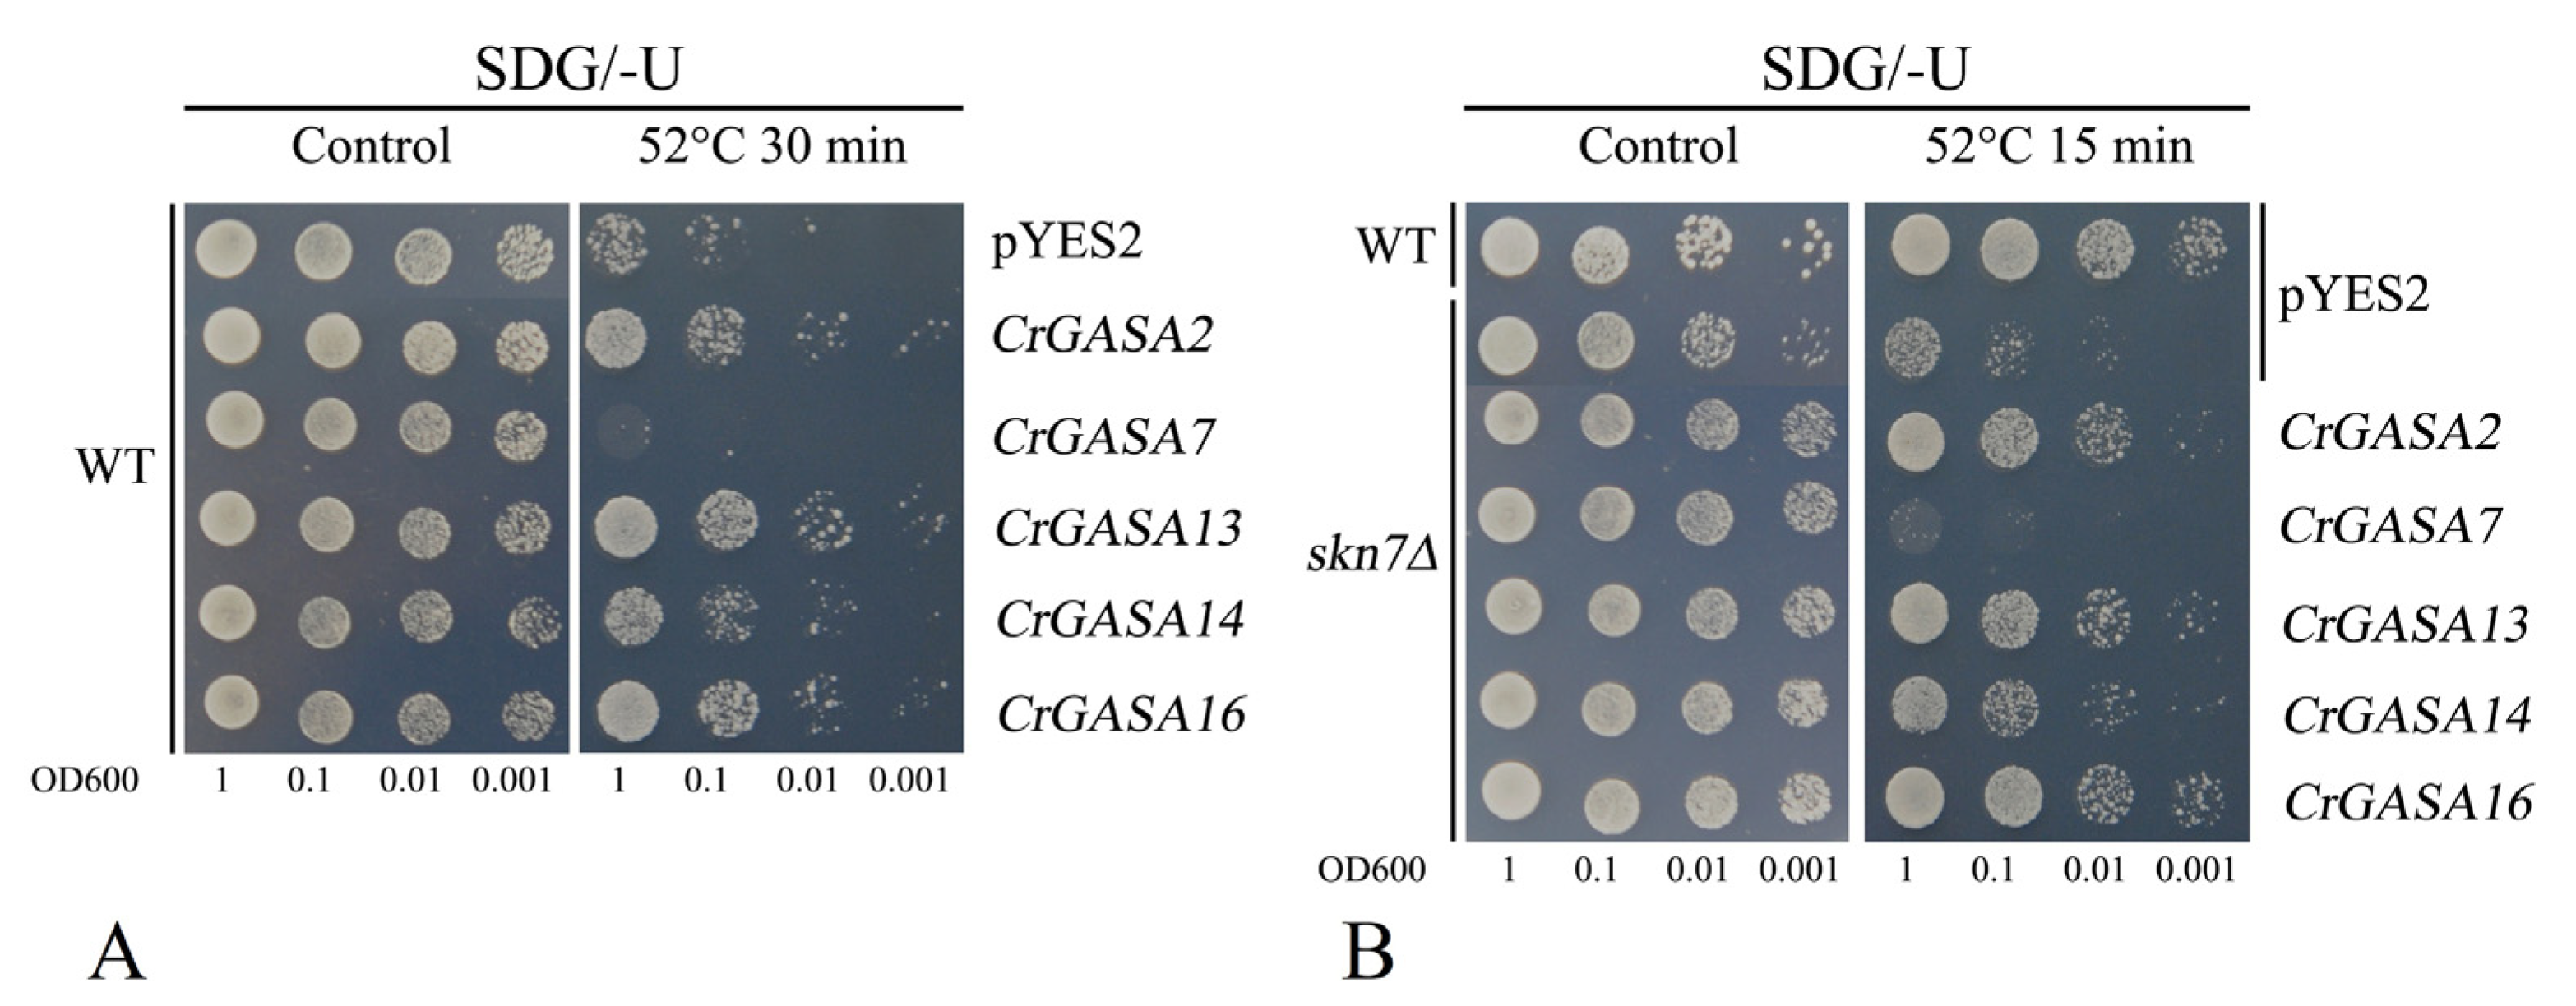
Table 1.
Nomenclature and subcellular localization of CrGASAs identified from C. rosea genome.
| Name | Locus | Protein Length | Major Amino Acid% | Mw (kD) | PI | II | AI | GRAVY | TMHs and Topologies | Subcellular Localization |
|---|---|---|---|---|---|---|---|---|---|---|
| CrGASA1 | 01T002406 | 115 | C (11.3%), L (10.4%), K (9.6%) | 12.83 | 9.32 | 37.75 | 71.13 | –0.33 | 1/in to out | extr: 8, vacu: 4, cyto: 1 |
| CrGASA2 | 02T004079 | 99 | C (12.1%), L (11.1%), A (10.1%) | 10.73 | 8.84 | 51.61 | 79.9 | 0.040 | 1/in to out | extr: 11, vacu: 2 |
| CrGASA3 | 02T004275 | 88 | C (14.8%), K (12.5%), G (8.0%) | 9.61 | 8.82 | 31.5 | 57.61 | 0.032 | None | extr: 12, golg: 2 |
| CrGASA4 | 02T005653 | 117 | L (12.0%), C (11.1%), R8.5 (%) | 12.95 | 8.24 | 47.68 | 84.02 | –0.079 | 1/in to out | extr: 9, vacu: 3, nucl: 1 |
| CrGASA5 | 02T006081 | 161 | S (13.0%), L (9.3%), K (9.3%) | 17.51 | 9.44 | 29.22 | 73.42 | –0.208 | None | nucl: 9, chlo: 3, cyto: 1 |
| CrGASA6 | 03T007841 | 118 | C (11.0%), L (10.2%), K (9.3%) | 13.12 | 9.12 | 51.68 | 69.41 | –0.258 | 1/in to out | extr: 5, nucl: 4, vacu: 2, cyto: 1, mito: 1 |
| CrGASA7 | 03T010634 | 109 | C (11.0%), K (11.0%), G (7.3%) | 12.23 | 9.29 | 41.85 | 54.59 | –0.236 | 1/in to out | extr: 10, chlo: 3 |
| CrGASA8 | 04T011946 | 119 | P (11.8%), C (10.9%), A (10.1%) | 12.67 | 9.12 | 42.58 | 60.76 | –0.202 | 1/in to out | extr: 10, chlo: 2, cyto: 1 |
| CrGASA9 | 04T011999 | 113 | K (11.5%), C (10.6%), L (8.8%) | 12.68 | 9.31 | 52.40 | 71.68 | –0.307 | 1/in to out | extr: 13 |
| CrGASA10 | 04T013414 | 96 | C (13.5%), L (6.2%), K (6.2%) | 10.53 | 8.85 | 53.80 | 70.10 | –0.109 | 1/in to out | extr: 10, golg: 2, cyto: 1 |
| CrGASA11 | 04T013838 | 109 | C (13.8%), L (11.0%), S (11.0%) | 12.08 | 9.06 | 26.61 | 68.90 | –0.047 | 1/in to out | chlo: 12, extr: 2 |
| CrGASA12 | 05T014257 | 149 | C (9.4%), A (9.4%), K (8.7%) | 16.55 | 9.56 | 37.33 | 68.05 | –0.204 | None | extr: 12, vacu: 2 |
| CrGASA13 | 05T015099 | 115 | C (11.3%), L (11.3%), G (10.5%) | 12.62 | 8.44 | 42.52 | 77.04 | –0.183 | 1/in to out | extr: 12, vacu: 2 |
| CrGASA14 | 06T019101 | 88 | C (13.6%), S (12.5%), K (11.4%) | 9.67 | 9.40 | 30.93 | 56.59 | –0.045 | 1/in to out | extr: 7, chlo: 4, vacu: 2.5, E.R._vacu: 2 |
| CrGASA15 | 06T019306 | 173 | C (9.2%), S (9.2%), L (8.7%) | 18.88 | 8.71 | 62.17 | 90.69 | 0.175 | 1/in to out | plas: 5, golg: 4, chlo: 2, E.R.: 2 |
| CrGASA16 | 06T019307 | 102 | L (14.7%), C (11.8%), A (8.8%) | 10.89 | 9.08 | 45.13 | 88.04 | –0.056 | 1/in to out | extr: 7, chlo: 4, E.R._plas: 2, plas: 1.5 |
| CrGASA17 | 07T019638 | 233 | P (25.8%), V (10.7%), K (9.9%) | 24.55 | 9.71 | 80.18 | 70.21 | –0.225 | None | extr: 12, vacu: 1 |
| CrGASA18 | 07T019724 | 147 | L (11.6%), C (8.8%), G (8.2%) | 16.44 | 9.34 | 57.44 | 83.47 | –0.270 | 2/out to out | plas: 5, E.R.: 3, extr: 2, vacu: 2, cyto: 1 |
| CrGASA19 | 07T020256 | 70 | C (18.6%), K (12.9%), S (8.6%) | 7.86 | 9.15 | 25.60 | 25.14 | –0.591 | None | nucl: 9, mito: 2, extr: 2 |
| CrGASA20 | 08T021709 | 93 | K (12.9%), C (11.8%), S (10.8%) | 10.21 | 9.41 | 38.59 | 44.19 | –0.555 | None | nucl: 12, chlo: 1 |
| CrGASA21 | 08T022646 | 137 | C (10.2%), K (10.2%), S (10.2%) | 15.24 | 9.38 | 34.29 | 52.77 | –0.244 | 1/in to out | nucl: 10, chlo: 3 |
| CrGASA22 | 11T027756 | 107 | C (11.2%), K (9.3%), L (8.4%) | 11.75 | 9.23 | 34.55 | 64.77 | –0.147 | 1/in to out | extr: 13 |
| CrGASA23 | UnT032831 | 147 | L (11.6%), C (8.8%), G (8.2%) | 16.41 | 9.34 | 57.44 | 82.18 | –0.254 | 2/out to out | plas: 4, vacu: 3, E.R.: 3, extr: 2, cyto: 1 |
MW: molecular weight; PI: isoelectric point; II: instability index; AI: aliphatic index; GRAVY: grand average of hydropathicity. The molecular weight and isoelectric points of predicted CrGASAs were detected using the ExPASy proteomics server (https://web.expasy.org/protparam/ (accessed on 1 March 2022)). The TMHMM Server 2.0 program (http://www.cbs.dtu.dk/services/TMHMM/ (accessed on 1 March 2022)) and the Protein Fold Recognition Server tool (PHYRE2, http://www.sbg.bio.ic.ac.uk/phyre2/html/page.cgi?id= index (accessed on 1 March 2022)) were used to predict the transmembrane helices and for the 3D prediction of CrGASAs, i.e., the “TMHs and Topologies” column. For the subcellular localization prediction, the online program WoLF_PSORT (https://www.genscript.com/wolf-psort.html (accessed on 1 March 2022)) was used.
Table 2.
Ka/Ks analysis and duplicated type calculation for CrGASA genes.
| Duplicated Pair | Duplicate Type | Ka | Ks | Ka/Ks | p-Value (Fisher) | Positive Selection |
|---|---|---|---|---|---|---|
| CrGASA2-CrGASA16 | Segmental | 0.135321 | 0.587267 | 0.230425 | 3.22 × 10⁻⁷ | No |
| CrGASA3-CrGASA14 | Segmental | 0.169573 | 0.654909 | 0.258926 | 1.04 × 10⁻⁵ | No |
| CrGASA4-CrGASA13 | Segmental | 0.0755763 | 0.929139 | 0.0813401 | 3.44 × 10⁻¹⁸ | No |
| CrGASA6-CrGASA8 | Segmental | 0.180004 | 0.748689 | 0.240425 | 3.69 × 10⁻⁸ | No |
| CrGASA7-CrGASA18 | Segmental | 0.0790249 | 0.780183 | 0.10129 | 5.13 × 10⁻¹⁴ | No |
| CrGASA15-CrGASA16 | Tandem | \ | \ | \ | \ | \ |
Publisher’s Note: MDPI stays neutral with regard to jurisdictional claims in published maps and institutional affiliations. |
© 2022 by the authors. Licensee MDPI, Basel, Switzerland. This article is an open access article distributed under the terms and conditions of the Creative Commons Attribution (CC BY) license (https://creativecommons.org/licenses/by/4.0/).
Share and Cite
MDPI and ACS Style
Zhang, M.; Wang, Z.; Jian, S. Genome-Wide Identification and Functional Analysis of the GASA Gene Family Responding to Multiple Stressors in Canavalia rosea. Genes 2022, 13, 1988. https://doi.org/10.3390/genes13111988
AMA Style
Zhang M, Wang Z, Jian S. Genome-Wide Identification and Functional Analysis of the GASA Gene Family Responding to Multiple Stressors in Canavalia rosea. Genes. 2022; 13(11):1988. https://doi.org/10.3390/genes13111988
Chicago/Turabian StyleZhang, Mei, Zhengfeng Wang, and Shuguang Jian. 2022. "Genome-Wide Identification and Functional Analysis of the GASA Gene Family Responding to Multiple Stressors in Canavalia rosea" Genes 13, no. 11: 1988. https://doi.org/10.3390/genes13111988
Note that from the first issue of 2016, this journal uses article numbers instead of page numbers. See further details here.