Article

DNA Methylation Level Changes in Transgenic Chinese Cabbage (Brassica rapa ssp. pekinensis) Plants and Their Effects on Corresponding Gene Expression Patterns

Department of Horticultural Biotechnology, Kyung Hee University, 1732 Deogyoung-daero, Giheung-gu, Yongin-si 17104, Gyeonggi-do, Korea
*
Author to whom correspondence should be addressed.
These authors contributed equally to this work.
Genes 2021, 12(10), 1563; https://doi.org/10.3390/genes12101563
Submission received: 6 August 2021 / Revised: 19 September 2021 / Accepted: 29 September 2021 / Published: 30 September 2021
(This article belongs to the Special Issue Genetic Research and Plant Breeding)

Abstract

:
Plant tissue culture is an in vitro technique used to manipulate cells, tissues, or organs, and plays an important role in genetic transformation. However, plants cultured in vitro often exhibit unintended genetic and epigenetic variations. Since it is important to secure the stability of endogenous and exogenous gene expressions in transgenic plants, it is preferable to avoid the occurrence of such variations. In this study, we focused on epigenetic variations, exclusively on methylation level changes of DNA, in transgenic Chinese cabbage (Brassica rapa ssp. pekinensis) plants. To detect these methylation level changes of DNA, bisulfite sequencing was performed and the obtained sequences were compared with the ‘CT001’ reference genome. Differentially methylated regions (DMRs) of DNA between the non-transgenic and transgenic lines were detected by bisulfite sequencing, and ten DMRs located in exonic regions were identified. The regions with methylation variations that were inherited and consistently maintained in the next generation lines were selected and validated. We also analyzed the relationship between methylation status and expression levels of transformant-conserved DMR (TCD) genes by quantitative reverse transcription-PCR. These results suggested that the changes in methylation levels of these DMRs might have been related to the plant transformation process, affecting subsequent gene expression. Our findings can be used in fundamental research on methylation variations in transgenic plants and suggest that these variations affect the expression of the associated genes.

1. Introduction

Tissue culture is a widely used tool in plant biotechnology, including Agrobacterium-mediated transformation [1]. Transgenic plants are often cultured in vitro and undergo regeneration to produce numerous identical seedlings; hence, the stable expression of the transgene is a critical issue for such plants. However, genetic and epigenetic variations have been reported to occur in transgenic plants and can affect their genomic stability [2,3], thus disrupting the genetic uniformity of these plants. In addition, such variations are inherited.
Variation derived from tissue cultures, termed somaclonal variation, has been observed in various crops [4]. It has been proposed that alterations in the epigenome may be a cause of somaclonal variation [5,6,7,8,9]. Changes in DNA methylation patterns are frequently observed in regenerated and transgenic plants, and have been suggested to cause phenotypic variation through the modulation of gene expression [10,11].
Epigenetics is the study of processes by which a change in the degree of gene expression occurs without a change in the DNA sequence. DNA modification in eukaryotes occurs primarily in cytosine bases, typically by DNA methylation enzymes at the carbon position of cytosine 5. DNA methylation in plants is carried out by a DNA methyltransferase in CG, CHG, and CHH (H = C, A, or T) sequences. A defect in this methyltransferase induced a change in DNA methylation patterns, producing the phenotype of flowering delay in Arabidopsis plants [12]. CG hypomethylation of the flowering wageningen (FWA) transcription factor partly contributed to expression of the FWA gene and delayed flowering in the met1 mutant. CHG methylation significantly decreased in chromomethylase 3 (CMT 3) Arabidopsis mutants, resulting in a high regenerative capacity [13]. CHG methylation can hence control regenerative capacity and cell potency.
The level of DNA methylation in plants is dynamically regulated by the interactive reactions of methylation and demethylation. Unlike animals, plants have genes that can directly remove the 5th position of cytosine (5mC), making them more efficient in DNA demethylation [14]. DNA methylation and demethylation inhibit and induce gene expression, respectively. Furthermore, these processes act as a memory of the patterns of expression [11,12].
Specifically, epigenetic variations are mainly expressed as alterations in DNA methylation levels, which can modulate gene expression [15]. DNA methylation changes in the promoter and gene body regions affect the regulation of gene expression and/or function of the protein [4,10,11].
Various methods such as methylation-sensitive amplification polymorphism and methylation-specific PCR (MSP) [16,17,18], have been used to detect methylation variations. Owing to the advent of next-generation sequencing (NGS), DNA methylation changes can be examined genome-wide using diverse methodologies such as bisulfite sequencing (BS-Seq) [19], methylated DNA immunoprecipitation sequencing [20], or bisulfite amplicon sequencing [21].
Chinese cabbage (Brassica rapa ssp. pekinensis) is one of the most important vegetable crop worldwide. The reference genome of B. rapa variety Chiifu-401-42 was published in 2011 [22] and the pseudomolecule genome of the inbred line ‘CT001’ was constructed for genome research [23]. In particular, despite the importance of Chinese cabbage, there were few whole-genome bisulfite sequencing (WGBS) studies on this plant and few studies on transgenic Chinese cabbage plants.
In this study, we focused exclusively on methylation level changes of DNA in transgenic Chinese cabbage plants developed by Agrobacterium–mediated transformation procedure and in vitro culture. WGBS was performed on non-transgenic and transgenic plants derived from the Chinese cabbage inbred line ‘CT001’. DNA methylation patterns of the non-transgenic and transgenic plants were studied, and transgenic plant-specific differentially methylated region (DMR) candidates were selected. Among the conserved DMRs, ten TCDs that were located in the exonic region of fully annotated genes and occurred in more than two contexts were also selected. In addition, it was studied whether DNA methylation variations in transgenic plants induced by transformation procedure and in vitro culture were inherited and maintained through generational progression. Finally, the effects of changes in methylation levels on gene expression in transgenic plants were also studied. The findings of this study are expected to provide basic resources on DNA methylation variations in transgenic plants.

2. Materials and Methods

2.1. Plant Material and Bisulfite Sequencing

To detect methylation variations in transgenic plants, IGA transgenic Chinese cabbage plants with downregulated expression of the glutathione S-transferase gene, generated as described previously [24], were used in this study. Non-transgenic Chinese cabbage (Brassica rapa ssp. pekinensis) inbred line ‘CT001’ was used as a control line. IGA transgenic plants were developed from inbred line ‘CT001’ through Agrobacterium-mediated transformation and cultured in vitro.
The confirmed transgenic lines, IGA7, IGA74, and IGA743 were used to analyze methylation variation. Seeds from the non-transgenic ‘CT001’ and transgenic lines were cultivated for two weeks in a greenhouse at Kyung Hee University (Yongin, Korea). Total genomic DNA was obtained from the leaf tissues of non-transgenic and transgenic lines using the modified sodium dodecyl sulfate method [25]. DNA concentration and quality were measured using the Trinean DropSense instrument (Trinean, Belgium) and PicoGreen assay (Molecular Probes, Eugene, OR, USA). To verify the presence of the T-DNA, PCR and T-DNA inserted site analysis were conducted according to a previously reported study [26].
The quality and quantity of the genomic DNA samples were checked using the PicoGreen assay for WGBS library construction. Agarose gel electrophoresis was also performed to ascertain the quality of the genomic DNA samples. The genomic DNA of each transgenic line was fragmented using a Covaris sonication system (Covaris S2). Following fragmentation, libraries were constructed using the Illumina Nextflex bisulfite-seq kit (Illumina, San Diego, CA, USA). The fragmented DNA was ligated with 5′ and 3′ adaptors, and the adaptor-ligated fragments were amplified and purified. The ligated DNA was bisulfite-converted using the EZ DNA Methylation-Gold kit (Zymo Research, Orange, CA, USA). After bisulfite modification, size selection, PCR amplification, and quality control (QC) of the library were performed. The resultant DNA was quantified using qPCR (Life Technologies, CA, USA), and the insert size was assayed using the Agilent Bioanalyzer 2100 system (Agilent, Santa Clara, CA, USA). The qualified libraries for each sample were sequenced using the HiSeq X system (Illumina). Removal of low-quality read and reads containing adaptor sequences was performed using Trimmomatic software [27].

2.2. Sequence DATA Processing and Analysis

Trimmed sequence reads were mapped to ‘CT001’ pseudomolecule reference sequences [23] using Bismark (v0.10.1) under default parameters [28]. Methylation calls were extracted after excluding duplicate sequences. The DNA methylation level was calculated using sites that had more than 95% mapping coverage levels and cytosines covered with an average of nine reads. The outputs were imported to genome browsers, in sequence alignment map (SAM)/binary alignment map (BAM) formats for visualization, and direct exploration.
The mC density and average methylation level of each transgenic line were determined. The mC density refers to the number of cytosine methylations in each sequence context of the aligned reads. In addition, each type of cytosine methylation in the transgenic lines was determined. The average cytosine methylation level was calculated based on the ratio between the number of methylated cytosines and total cytosines within a mapped read present in each transgenic line.

2.3. Selection of DMR Candidates

The DNA methylome patterns of the transgenic lines were studied, and transgenic line-specific DMR candidates were selected and analyzed. To identify DMRs across the entire genome of the non-transgenic and transgenic lines, the DSS package (http://bioconductor.org/packages/release/bioc/html/DSS.html; accessed on 31 May 2021) [29] was used in the R environment. Even though, DSS R package does not include false discovery rate (FDR) calculations, FDR was considered and analyzed in DML (differentially methylated locus) analysis, a step before DMR analysis. For DMR analysis, DML analysis should be performed first, and q ≤ 0.05 was applied to estimate the locus. Cytosines within methylation loci that presented an average five-fold coverage were used to calculate methylation levels. Regions with a difference of more than 40% in each context compared with the non-transgenic line were defined as DMRs. DMR calling for each transgenic line (IGA7, IGA74, and IGA743) was performed with the callDMR function using all default parameters, except for P-value thresholds of 0.05 and delta values of 0.1.
The genomic distributions of DMRs in the transgenic lines were investigated. Gene ontology analysis for methylation-related genes was performed using DAVID Bioinformatics Resources v6.8 (http://david.ncifcrf.gov/; accessed on 9 June 2021) [30]. Functional annotation clustering was analyzed based on corresponding TAIR IDs. Classification stringency was set to medium, and those with an enhancement score of more than 0.4 were selected.
In addition, expression analyses of methylation-related genes were performed with the Arabidopsis Information Resource (TAIR) ID using the eFP browser (http://bar.utoronto.ca/efp/cgi-bin/efpWeb.cgi; accessed on 21 June 2021). A homology search was performed using basic local alignment search tool (BLAST).
In silico analysis of the DMR candidates was performed using the ‘CT001’ pseudomolecule genome browser. The BAM files of the non-transgenic ‘CT001’, T1 (IGA7), T2 (IGA74), and T3 (IGA743) lines were loaded onto the genome browser. TCDs corresponding the condition that DMR was located in the exonic region of the gene and maintained in the next generation were selected. The methylation status of the selected transformant-conserved DMRs (TCDs) genes for the CG, CHG, and CHH methylation patterns of each line was compared. The methylation states of CG, CHH, and CHG can be visually verified in silico analysis.

2.4. Expression Analysis of Genes Associated with DMR Candidates

To determine the relationship between DNA methylation status and expression levels of genes within the candidate DMRs in the T1 (IGA7), T2 (IGA74), and T3 (IGA743) lines, quantitative reverse transcription PCR (qRT-PCR) analysis of the selected TCD genes was performed. We selected 10 TCDs located in the exonic region of annotated genes with different methylation levels in all three transgenic lines. Four individual plants of the T1 line (IGA7), three individual plants of the T2 line (IGA74), and three individual plants of the T3 line (IGA743) were selected for analysis.
Total RNA was isolated from the leaf tissues of the non-transgenic and transgenic lines using the Plant Total RNA Extraction Kit (TaKaRa, Otsu, Japan) in accordance with the manufacturer’s instructions. The qRT-PCR assay was performed using a Roter-GeneTM 6000 (Corbett, Sydney, Australia) and TransStart® Top Green qPCR SuperMix (TransGen Biotech, Beijing, China). The total reaction volume was 20 μL, including 1 μL cDNA, 10 pmol of each primer, and 10 μL 2× QuantiSpeed SYBR mix. The primers used for qRT-PCR are listed in Table S1. The PCR conditions were as follows: pre-denaturation for 10 min at 95 °C, followed by 40 cycles of denaturation for 10 s at 95 °C, annealing and extension for 30 s at 60 °C. Melting curve analysis of the PCR products was performed by increasing the temperature from 60 to 95 °C with a temperature increment rate of 0.1 °C/s. Fluorescence intensity data were collected at the end of each cycle and analyzed using the instrument software. The cycle threshold (Ct) value of each sample was used to calculate the relative gene expression levels via the ΔΔCt method [31]. The actin gene was used as the endogenous housekeeping gene for normalization of the target genes. To ensure the specificity of the results, qRT-PCR analysis was repeated three times, and the average value and standard errors (SE) were analyzed. Standard errors are indicated as bars in Figure 3.

2.5. MSP for DMR Candidates

MSP was conducted to examine the CpG islands with changed methylation states of TCD genes in non-transgenic ‘CT001’, T1 (IGA7), T2 (IGA74), T3 (IGA743), and T4 (IGA7434) lines. Genomic DNA (1 µg) of each line was treated with bisulfite using the EZ DNA Methylation-Gold™ Kit (Zymo research, CA, USA) according to the manufacturer’s instructions. Primers for MSP were designed using MethPrimer 2.0 (Table S2). PCR was performed with 20 μL reaction mixtures using the Maxime™ PCR PreMix Kit (iNtRON, Seongnam, Korea) containing the primer sets designed based on the selected TCD genes (Table S2) and bisulfite-treated DNA segments. The MSP conditions were as follows: pre-denaturation for 10 min at 95 °C, followed by 40 cycles of 10 s at 95 °C and 30 s at 60 °C, 30 s at 72 °C, and a final extension for 10 min at 72 °C. PCR amplicons were loaded onto a 1% agarose gel, separated, and observed under ultraviolet light.

3. Results

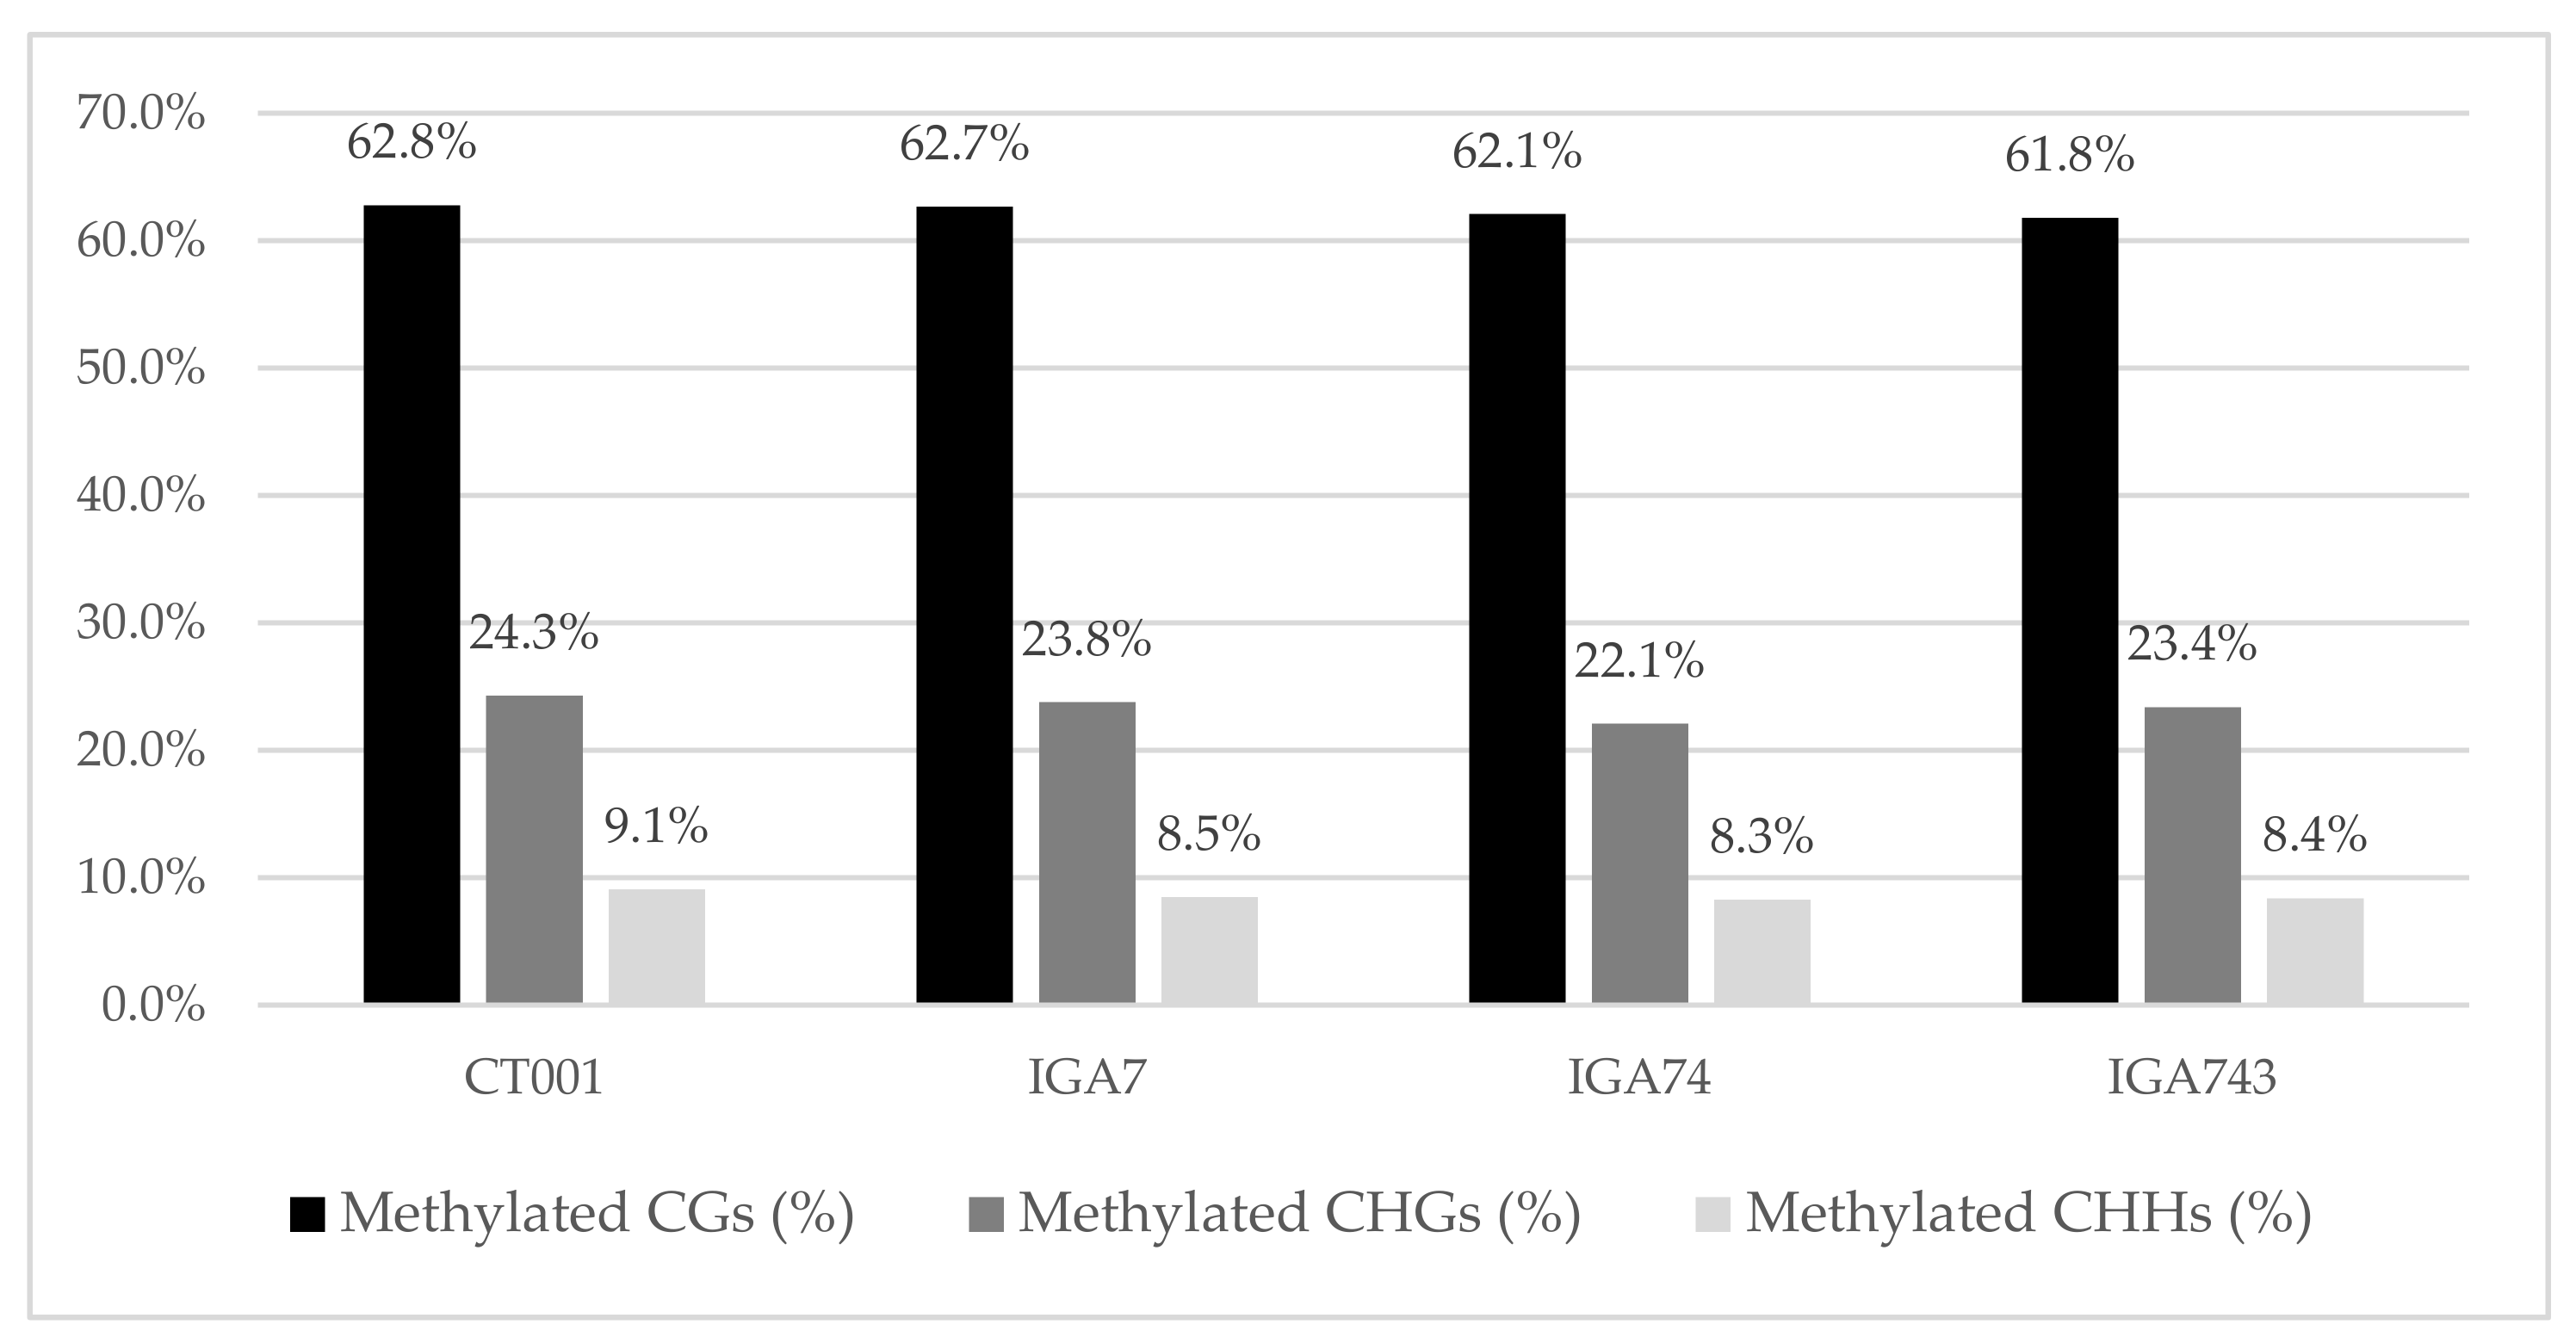
3.1. Bisulfite Sequencing and Mapping

Before bisulfite sequencing, we performed a PCR analysis to confirm the insertion of T-DNA, and chromosome number counting to confirm the chromosomal stability of the transgenic lines. WGBS of the non-transgenic and transgenic lines was conducted to determine the DNA methylation status of the transgenic lines. The ambiguously mapped or duplicate reads were removed, and only uniquely mapped reads were retained for further analyses. After trimming the bisulfite sequencing data using Trimmomatic, an average of 8.1 Gb of WGBS data was obtained and the paired mapped reads were mapped to the ‘CT001’ pseudomolecule reference genome using Bismark. Approximately 79.7% of the clean reads could be independently mapped to the reference genome. Thus, an average of six million properly mapped paired reads were retained.
The average methylation level in the total genome of each transgenic line was analyzed and was summarized in Table S3. The DMRs in the CpG, CHG, and CHH contexts (where H is any base except G) of each transgenic plant were categorized. The levels of DNA methylation in these three contexts were determined for each region of each transgenic line and compared with that in the non-transgenic control line (Figure 1). DMR calling for transgenic lines resulted in the identification of an average of 39 million methylated CGs (mCG) (62.2% of all CGs), 13 million mCHGs (23.1% of all CHGs), and 13 million mCHHs (8.4% of all CHHs).

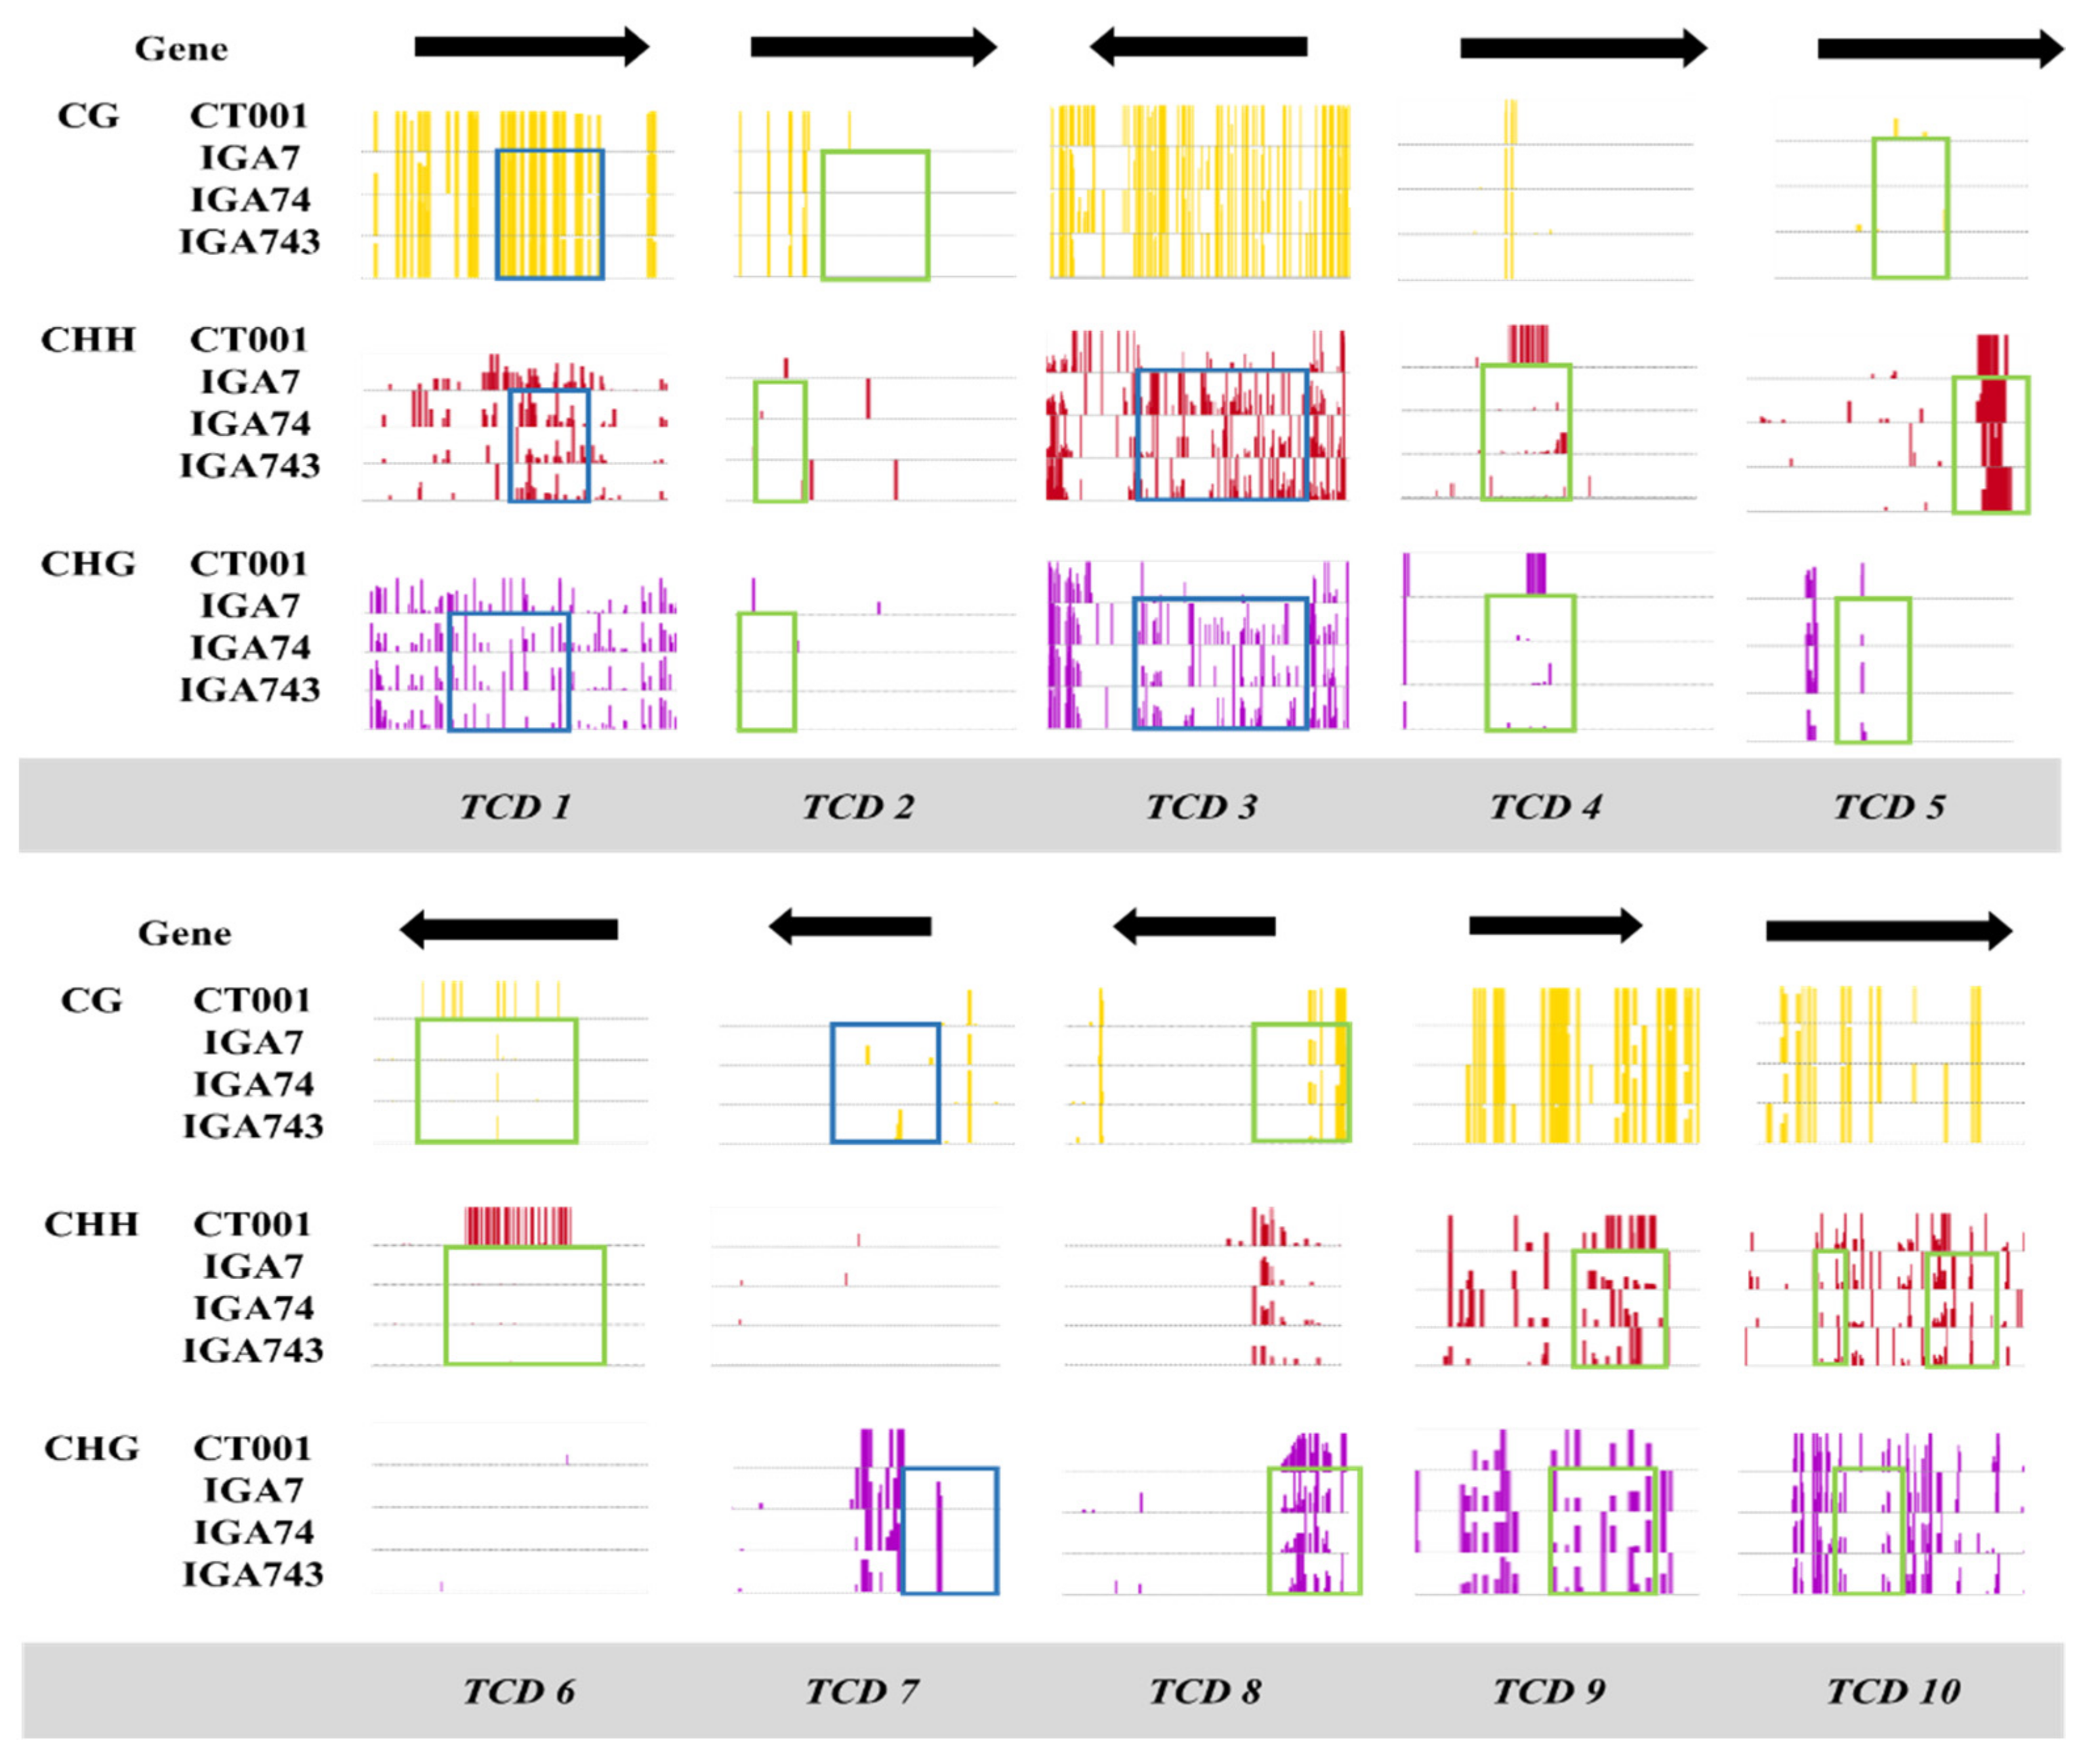
3.2. Confirmation of Selected TCDs

DMR calling was performed using the WGBS data of each transgenic line, which were compared with those of the non-transgenic line. In addition, genome-wide DNA methylation of each transgenic line was investigated based on the WGBS data of the transformants. As a result, 1642 DMRs, including 1237 DMRs in the CG context, 183 DMRs in the CHG context, and 222 DMRs in the CHH context on the exonic region were identified in the T1 transgenic line. Among them, we selected exonic regions with methylation patterns maintained in the T2 and T3 lines. In particular, two or more overlapping exonic regions were selected and named as conserved DMRs. Finally, we identified 102 conserved DMRs, including 28 DMRs in the CG context, 39 DMRs in the CHG context, and 35 DMRs in the CHH context. The list of genes associated with the DMRs identified in all three transgenic lines is shown in Table S4.
Conserved DMRs within exonic regions were clustered based on their corresponding TAIR IDs using the DAVID Bioinformatics Resources v6.8 (http://david.ncifcrf.gov/; accessed on 9 June 2021) to investigate the relationship between genes with differences in methylation patterns in the transgenic lines (Table 1). When selecting DMR, T1 transgenic line with different methylation status were first compared to non-transgenic control line, CT001 and then DMRs inherited and maintained in next generation lines (T2 and T3) were selected. Therefore, the number of DMRs was greatly reduced from 1642 to 10. As a result, only a few of categories (Leucine rich repeats) were statistically significant. Functional annotation enriched for conserved DMRs in the transgenic lines showed that they were mainly associated with DNA polymerase activity and signal transduction functions. Functional analysis of the genes within the selected conserved DMRs revealed that these genes were related to diverse functions, including protein phosphorylation and nucleic acid fusion, and production of calcium-dependent lipid-binding protein, reductase thioredoxin family protein, and calcium-binding protein TCH2.
Among them, DMRs of CT001_A07241320 and CT001_A07421310 appeared in all contexts, whereas DMRs of CT001_A08284340 and CT001_A03126570 appeared in the CHG and CHH contexts. Among the conserved DMRs, ten that were located in the exonic region of fully annotated genes and occurred in more than two contexts were selected and named TCDs (Table 2).
For in silico analysis of the selected TCDs, the BAM files of the non-transgenic, T1, T2, and T3 transgenic lines were loaded onto the genome browser and the methylation status of their selected TCD genes was visualized and compared. Figure 2 summarizes the results of the in silico analysis of the TCDs. The CG, CHG, and CHH methylation patterns of each line were compared in parallel. Of the ten selected TCDs, seven DMRs were hypomethylated compared with those of the non-transgenic line, whereas three were hypermethylated.

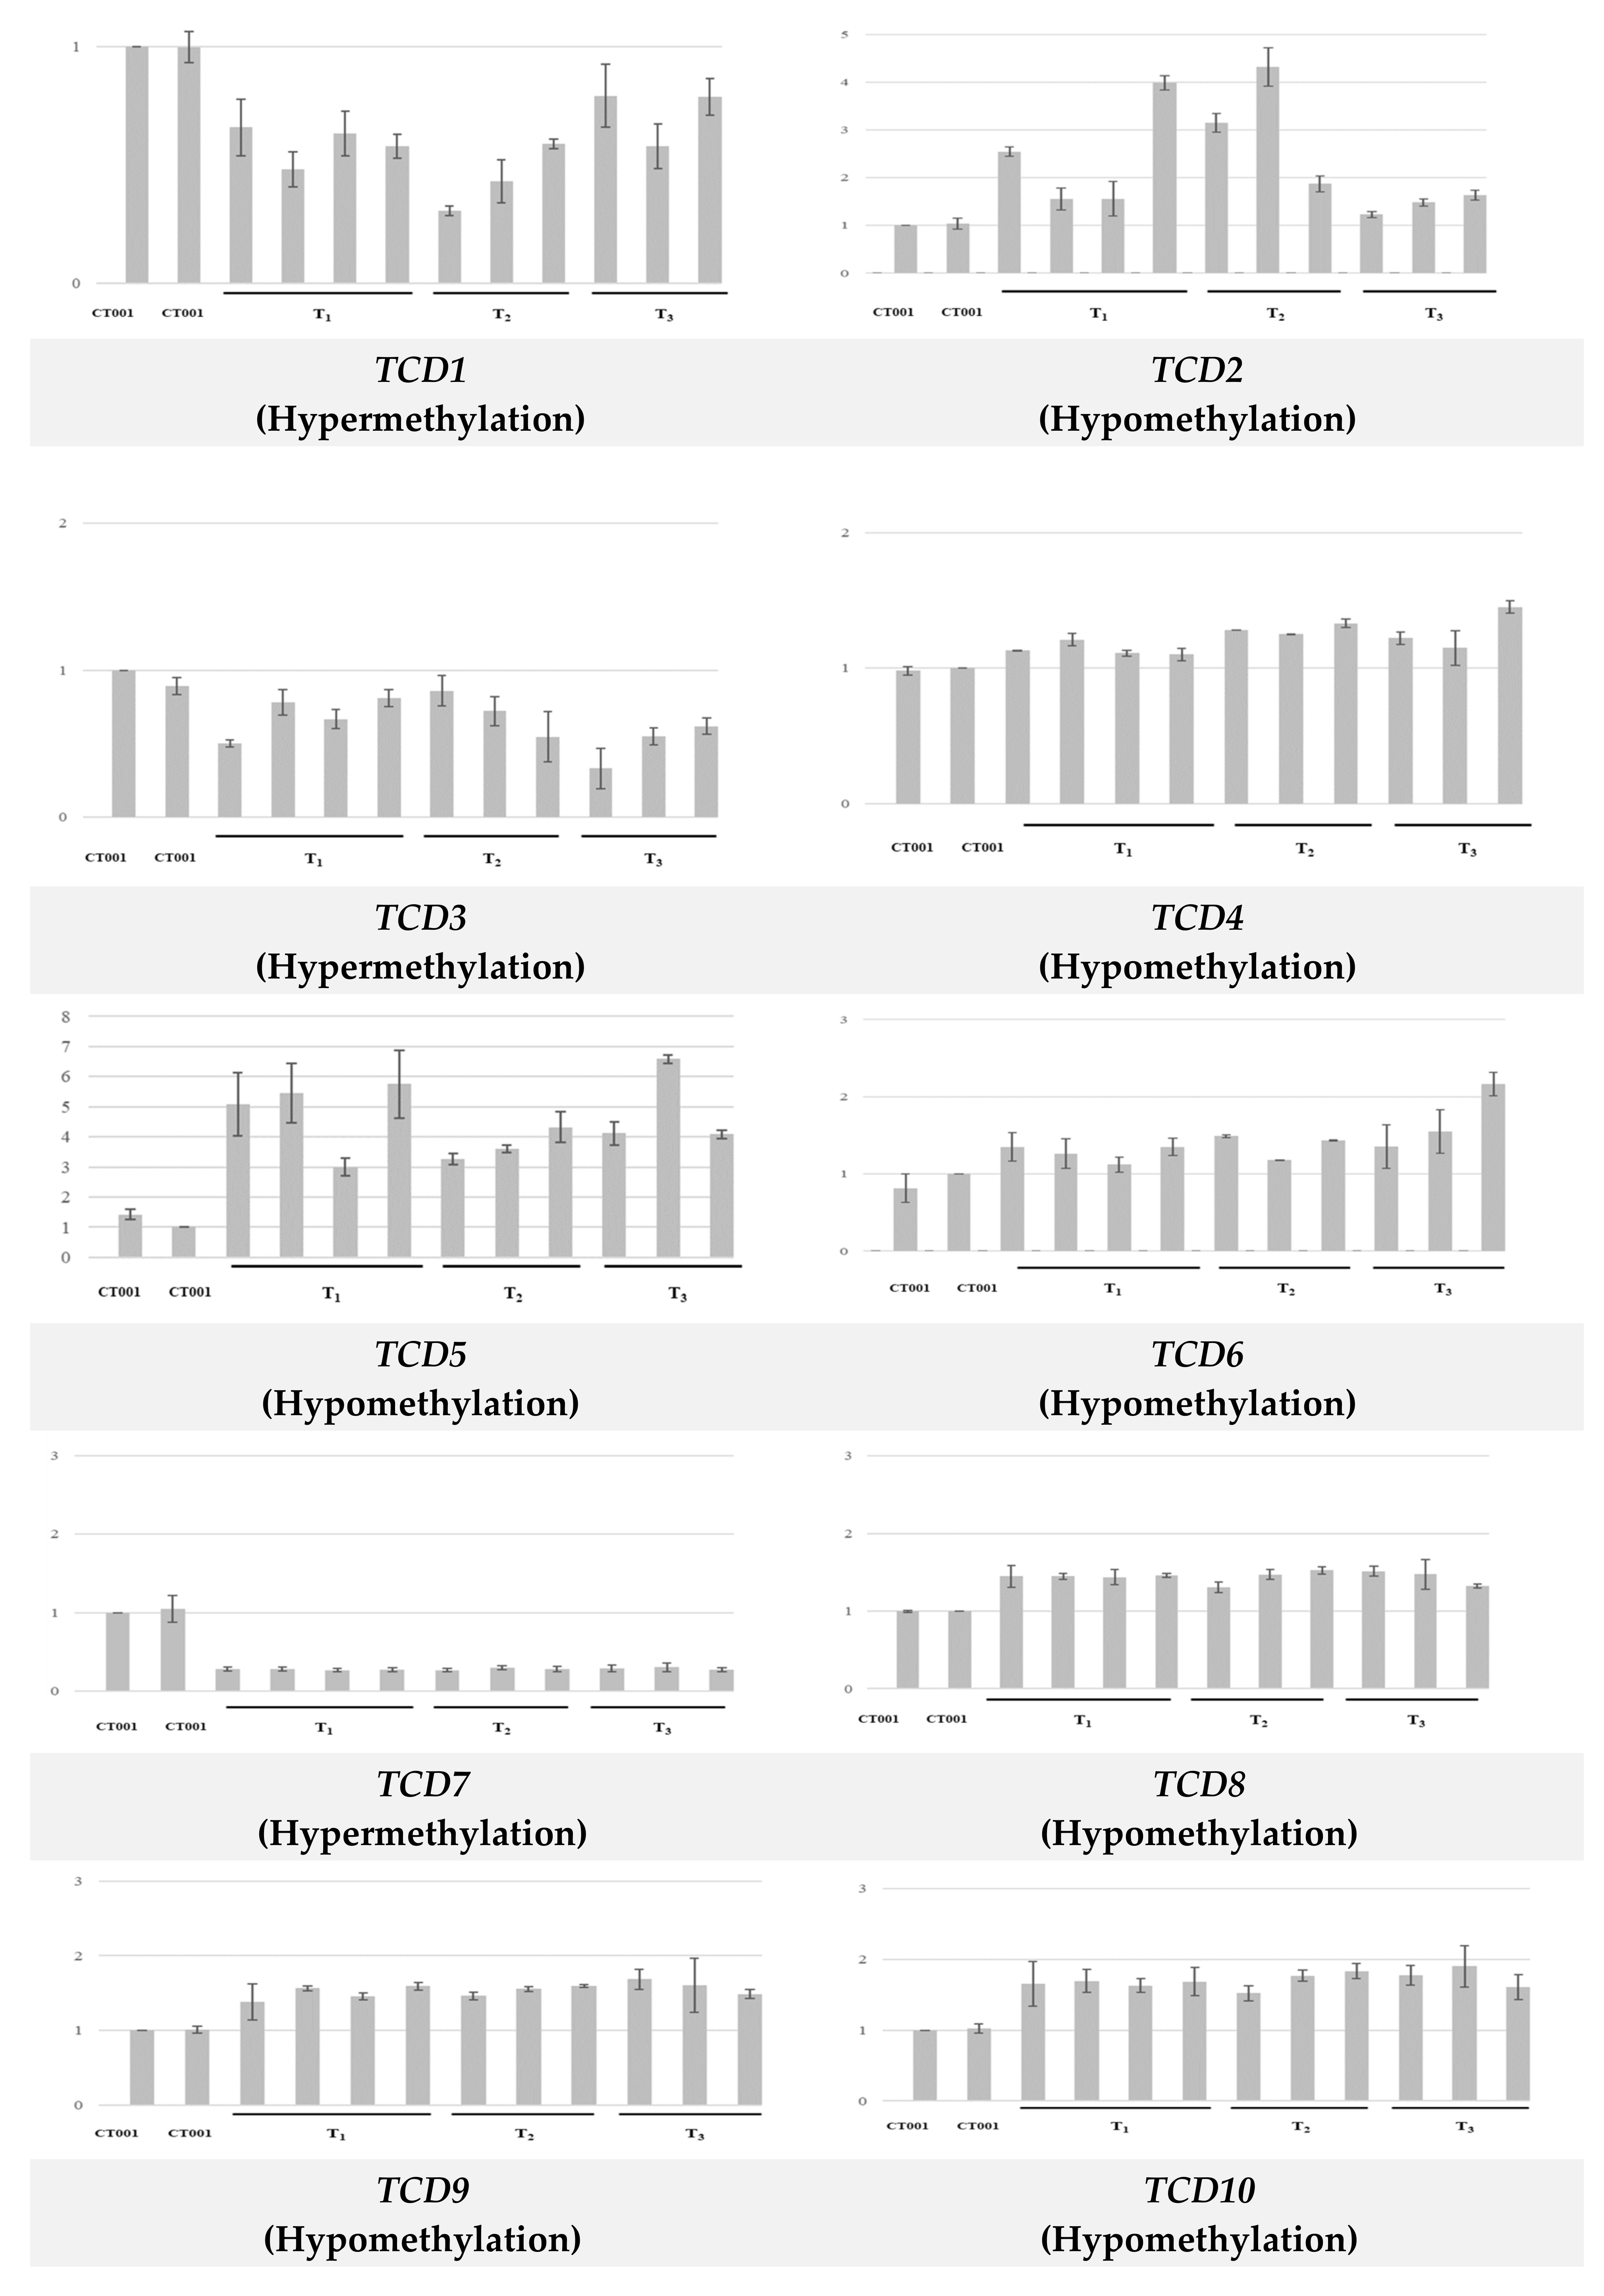
3.3. Correlation between Methylation Status and Expression of TCD Genes

We analyzed the relationship between gene expression patterns in TCDs and methylation patterns of transgenic lines. DMRs identified in all three transgenic lines were selected, and primer sets were designed based on sequences of coding loci identified in transgenic lines to analyze gene expression. To determine whether altered methylation patterns of a DMR affected the expression of the gene within the DMR, total RNA was extracted and cDNA was synthesized for each transgenic line. RT-PCR of the ten selected TCD genes was then conducted using cDNA of each transgenic line and primer sets for the selected DMRs, and the amplicon with the expected product size was identified (Figure S1). Gene expression in the non-transgenic and transgenic lines was quantified by qRT-PCR using the same primer sets as those used for RT-PCR. As expected, the gene expression levels positively correlated with the methylation levels. The expression of TCD genes with hypermethylated DMR patterns in the transgenic line was downregulated. In contrast, the expression of TCD genes with hypomethylated DMR patterns in the transgenic line was upregulated (Figure 3). Among the genes with hypermethylation, the gene expression of TCD1 in transgenic lines decreased 1.25 to 3.3 times compared with that of non-transgenic line ‘CT001’. In addition, the gene expression of TCD5 with hypomethylation in the transgenic line increased 3 to 6.5 times compared with that in the non-transgenic line.

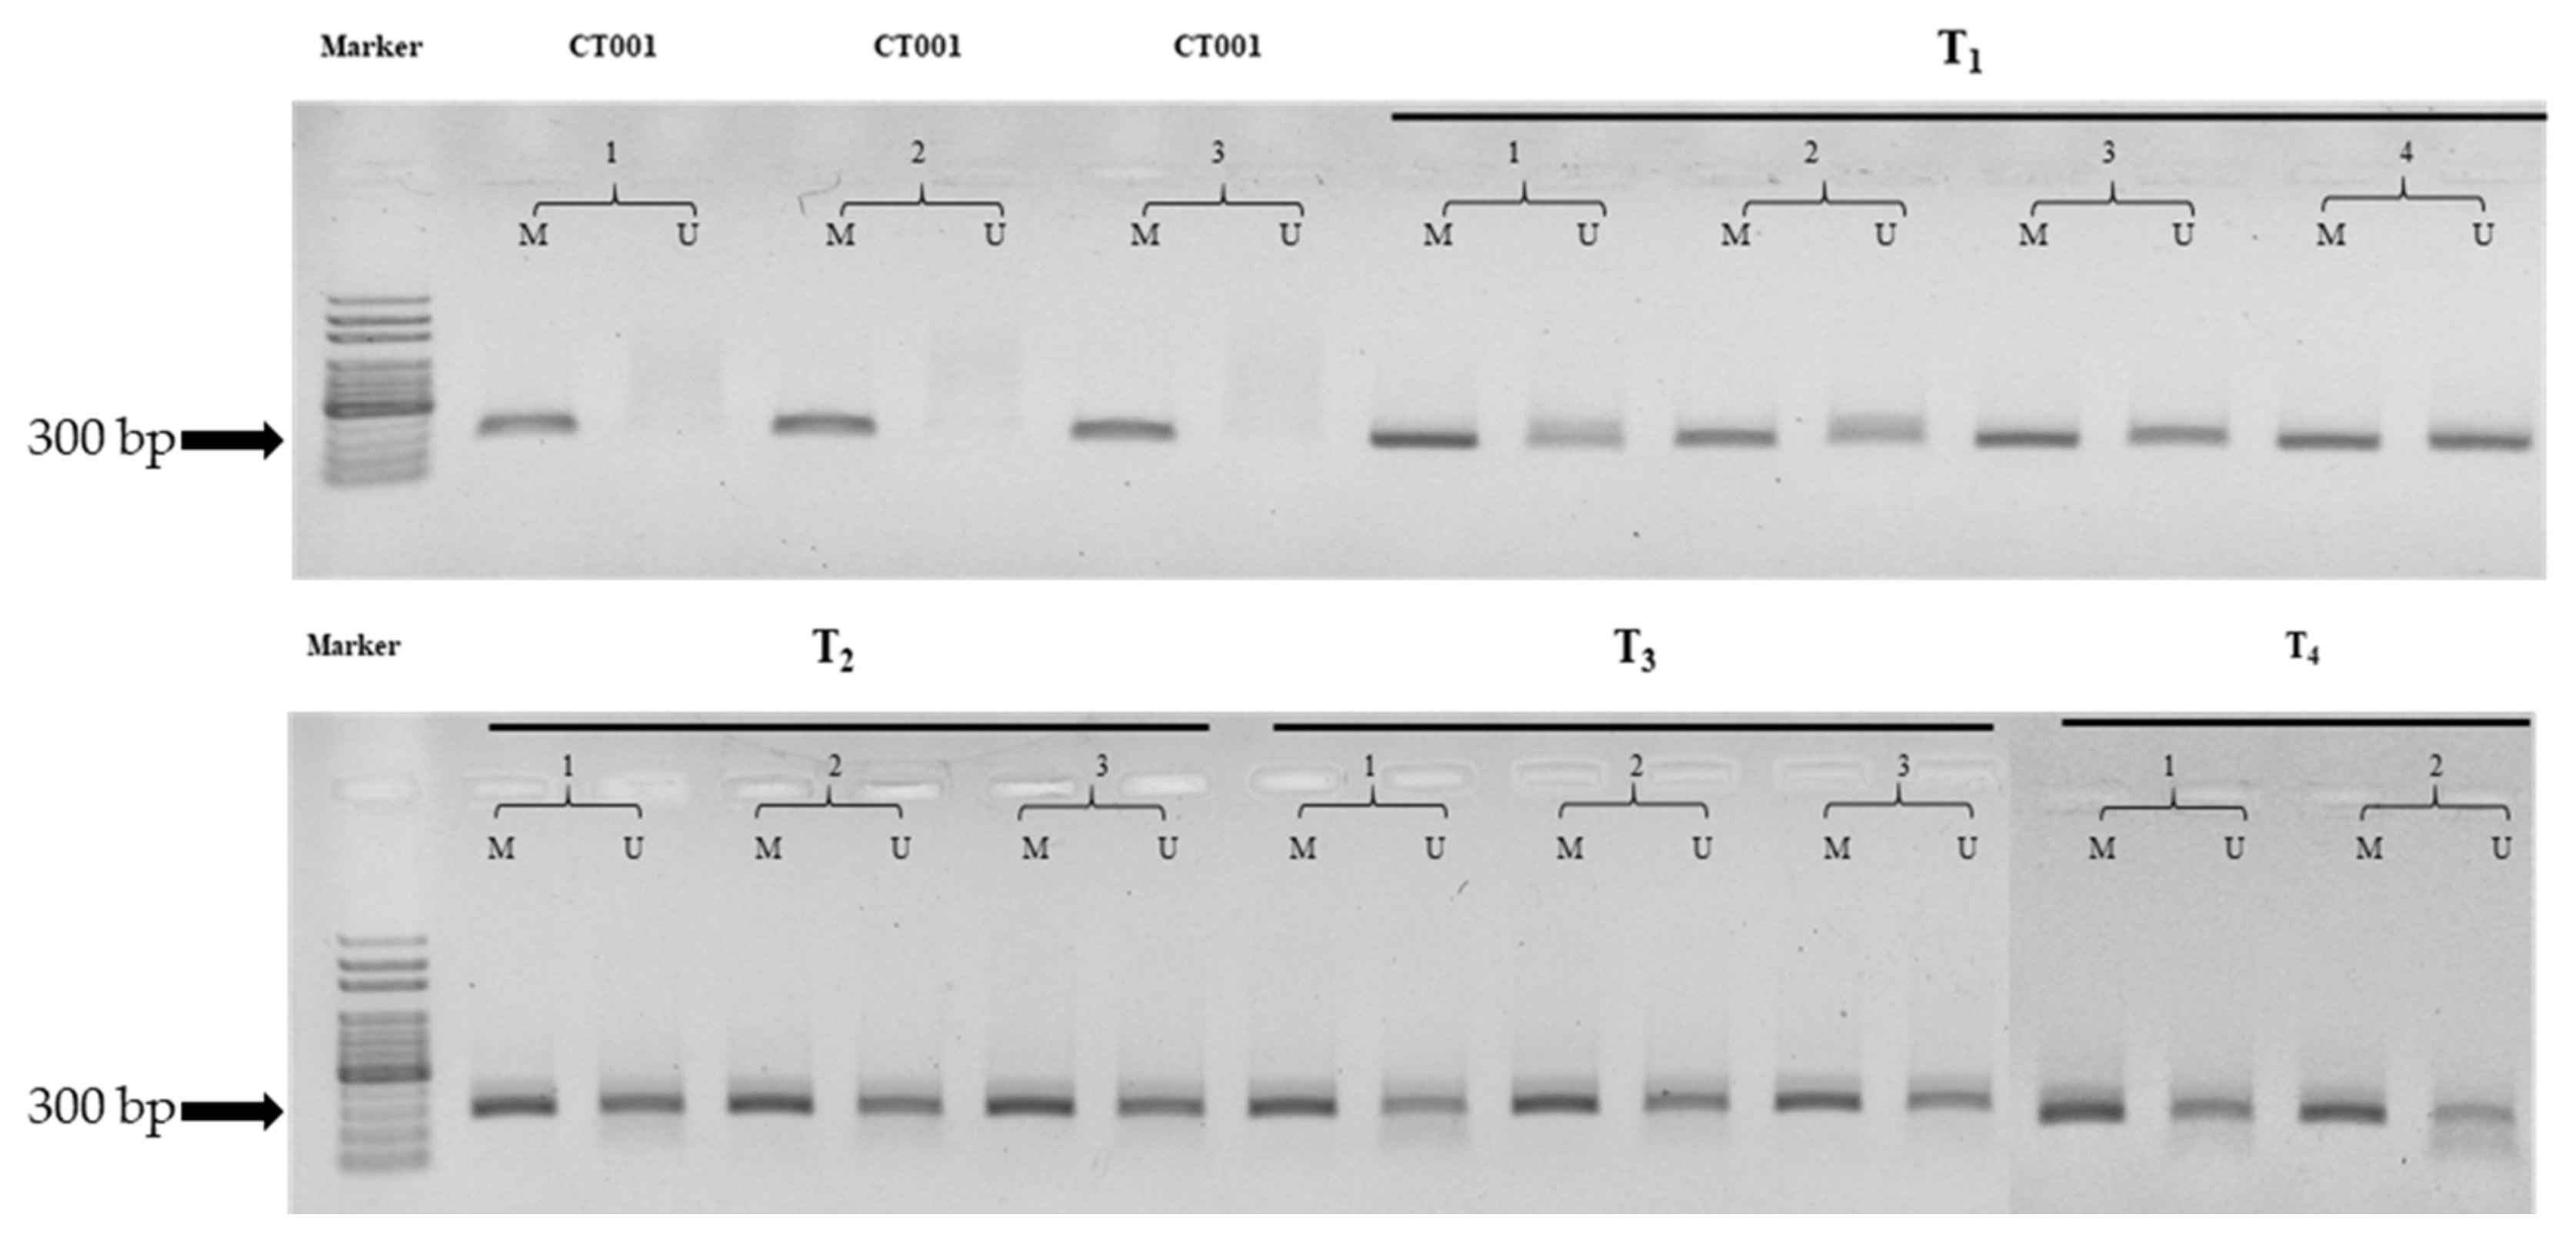
3.4. Determination of DNA Methylation Patterns by MSP

MSP analysis was conducted to visualize the methylation state in non-transgenic and transgenic lines. When MSP was performed using bisulfite-treated DNA (as the template) and primer sets, the M primer set amplified the methylated DNA and the U primer set amplified the unmethylated DNA. Analysis of ten TCD genes using the MSP method produced significant results, especially for TCD8 genes. MSP data of TCD8 showed that methylated PCR products were present in ‘CT001’, whereas unmethylated PCR products were not (Figure 4). In contrast, methylated and unmethylated regions were visualized using MSP amplicons from the transgenic lines (Figure 4).

4. Discussion

Some of the causes of somaclonal variation in tissue culture are transposable elements, genetic variations such as single nucleotide polymorphisms (SNPs) and insertions/deletions(InDels), and epigenetic variations due to methylation changes. DNA methylation variation is the change in the methylation level of the promoter or exonic region without a change in the DNA sequence. The most common method to detect such changes is to conduct methylome analysis of the genome through WGBS, also known as BS-seq, methyl-seq, or methylC-seq [32,33,34]. Many studies have reported WGBS of various crops under abiotic and biotic stress. WGBS of regenerated plants has also been studied, but most of these plants were sourced from food crops, including maize and rice [35,36,37,38]. Despite the importance of Chinese cabbage, there have not been many WGBS studies on this plant, and few studies have been conducted on transgenic plants [39].
In this study, WGBS of transgenic lines was carried out to confirm the DNA methylation patterns and gene expression levels. Approximately 79.7% of the reads mapped to the reference genome suggested that we had obtained fundamental data that could enable meaningful analysis. The average percentages of methylation of CG, CHG, and CHH contexts in the transgenic lines were 62.2%, 23.1%, and 8.4%, respectively, which were much higher than those in Arabidopsis thaliana (24%, 6.7%, and 1.7% for CG, CHG, and CHH, respectively) [32]. The percentage of methylation of CG sequences in vertebrates, including zebrafish and mice, is known to account for nearly 80% of all methylation. In contrast, all types of methylation occur in plants. CG is the most methylated, CHG is moderately methylated, and CHH is methylated at the lowest level in plants [40]. From an evolutionary perspective, plants belonging to the same genus have similar methylation patterns. For example, an investigation of the methylation patterns of the DNA methyltransferase, CMT 3, in Brassica rapa and Brassica oleracea indicated that the distribution patterns of the three contexts were similar [41,42].
To examine the influence of the Agrobacterium-mediated transformation process on DNA methylation status, we identified the DMRs in transgenic lines through in silico analysis using a genome browser. Based on these data, the expression levels of the TCD genes were determined by qRT-PCR. The gene expression level was positively associated with the methylation level.
In this study, methylation differences were observed not only in the 1kb-up promoter region of genes but also in the exon and intron. Changes in methylation status in the promoter and coding regions can affect gene expression, however, the analysis was conducted focusing on exonic region.
By examining the function of the conserved DMR-related genes, we studied the possible correlation between the transformation process and changes in methylation patterns. The leucine-rich repeat (LRR) is used as a module for the interaction of many plant proteins [43]. Changes in the methylation level of LRR partially affect the transmission of external signals to inside the cell. It is engaged in common biological processes, including defense and response to abiotic and biotic stresses. In addition, genes involved in membrane components and membrane transport were clustered. In particular, ten TCDs existing in exons, and duplicated in two or more contexts, were selected and further analyzed based on their TAIR IDs. Genes with transport-, transferase-, and plasma membrane-related functions were mainly clustered.
TCD1 and TCD2 are genes with different DNA methylation levels in all contexts, however, they do not have corresponding Brassica or TAIR IDs and their functional annotations are understudied. The TCD3 gene showed different DNA methylation patterns in CHG and CHH contexts, and was found to be similar to AT3G47200. However, its exact function is not known. TCD4 is expected to function as a gene associated with the RNA export factor, silencing defective 5 (SDE5). SDE5 affects DNA methylation by regulating RNA-directed DNA methylation (RdDM) [35]. TCD5 is a gene encoding the F-box / kelch-repeat protein, and TCD6 is associated with tyrosine-sulfated glycopeptide receptor 1 (PSY1R). PSY1R is not only involved in growth and development, but also in plant defense [44]. PSY1-reactive genes encode genes localized in the cell wall that regulate carboxylesterase activity, whereas differentially expressed genes in psy1r mutant plants mainly localize to the nucleus through molecular functions of ion binding and activity of transcription factors [45].
TCD7 is a G-box binding factor, and GF14 omega encodes a 14-3-3 protein. According to previous studies, 14-3-3 proteins interact with abscisic acid response-binding factor 3 (ABFBI3) to regulate the basic regulation/leucine zipper (bZIP) transcription factor, ABA insensitive 5 (ABI5). ABI5 is known to confer resistance to salt stress upon Arabidopsis plants [46,47,48]. TCD8 encodes domains rearranged methyltransferase 3 (DRM3). DRM3, which is homologous to DRM2, is known to regulate RdDM in Arabidopsis plants, and has been reported to be involved in the regulation of DNA methylation [49,50]. We also confirmed the results of a previous study, which showed that DRM3 regulated DNA methylation by enhancing the transcriptional elongation of RNA polymerase V or stabilizing RNA polymerase V transcripts [51]. Based on studies that analyzed the function of DRM3, it was assumed that the DMR of the gene equivalent to TCD8 was related to epigenetic changes such as DNA methylation in response to external stresses occurring during various processes of transformation. TCD9 encodes potassium uptake transporter 1 (AtKUP1) and is involved in K+ transport in plants. The sodium–potassium pump is a membrane protein present in cell membranes that functions as an enzyme for the hydrolysis of adenosine triphosphate (ATP). It consumes the energy generated by decomposing ATP, moving three sodium ions out of the cell and two potassium ions into the cell. It is known to generate and maintain electrical and concentration gradients, and prevent the cell volume from growing. The AtKUP1 gene has been reported to be highly expressed in plants exposed to salt stress [52]. TCD10 encodes chromosome transmission fidelity 7 (CTF7), which is homologous to the establishment of cohesion 1 (Eco1) gene. Eco1 enables sister chromatid cohesion, which is essential for cell division. The transgenic line inhibited the expression of the CTF7 gene in the Arabidopsis plants that showed decreased development of dwarfism, anthers, and infertility, and was closely linked to the DNA repair process and cell division [53,54]. Based on our results, it was assumed that the methylation pattern of the TCD10 gene was hypomethylated, and that the expression of the gene changed to cope with problems such as external environmental changes or DNA anomalies during the process of recovery.
Among the seven annotated genes, TCD7 only showed a hypermethylation pattern. TCD7 matched with AT1G78300, which encodes a 14-3-3 protein that play significant roles in the regulation of plant responses to abiotic stresses, including drought, temperature, and salinity, and biotic stresses, including plant hormones and exotic pathogens. The 14-3-3 genes exhibit various levels of up- or down-regulation [55]. Therefore, it can be assumed that the expression of the AT1G78300 gene decreases in response to stress. The decrease in gene expression of TCD7 due to hypermethylation was predicted to defend against abiotic and biotic stresses generated during transformation. Seven out of the ten genes identified were analyzed using the eFP browser. The expression levels of the genes tended to increase by 2–4 times on average during the callus induction process; therefore, these genes were considered to be involved in the process of transformation and in vitro culture. In particular, the expression level of galactose oxidase/kelch repeat superfamily protein (AT1G67480, TCD5) increased 20-fold after callus induction, and it was probably associated with the regeneration process. Compared with those of ‘CT001’, the genes were hypomethylated, suggesting that they were expressed more during regeneration.
These results suggested that the changes in methylation levels of these DMRs might have been related to the Agrobacterium–mediated transformation process, affecting subsequent gene expression. Furthermore, the generated DMRs were inherited and maintained as the generations progressed. MSP analysis methods made it possible to visualize the methylation patterns and confirmed that these changed patterns were inherited to next generations. TCD8 was found to be methylated in the non-transgenic line and partially unmethylated in the T1 transgenic line, and this partially unmethylated state was maintained in the T2, T3, and T4 transgenic lines (Figure 4). These results show that the TCD8 gene is methylated in the general condition of the B. rapa plant, but it is unmethylated under various environmental stresses through de-differentiation and re-differentiation during the transformation process. This change in methylation patterns was also maintained in the T2, T3, and T4 generations.
It may be considered that transgenes may have indirectly influenced DNA methylation. However, in this study, IGA transgenic lines with downregulated expression of the glutathione S-transferase gene [24] were used to examine the methylation level changes of DNA in transgenic plants. IGA transgenic lines were developed through Agrobacterium-mediated transformation and cultured in vitro. The glutathione S-transferase gene is involved in the synthesis of isothiocyanates in Chinese cabbage, but not in the methylation system. By down-regulating this gene, phenylethylisothiocyanate can be accumulated in cells [24]. In addition, it was also confirmed that single copy of transgene was inserted into the intergenic region of the IGA genome [26]. Therefore, the presence of a transgene with down-regulating vector of glutathione S-transferase gene was not expected to be a major factor for methylation changes.
In conclusion, the results of this study demonstrate that changes of methylation status can be assumed to be induced during Agrobacterium–mediated transformation and in vitro tissue culture, and subsequently affect their gene expression. And these changes of methylation levels can be inherited through generation progression.

5. Conclusions

Methylation level changes have been observed in transgenic plants cultured in vitro. These undesired changes in DNA methylation pose a problem for the genetic stability of transgenic plants. In this study, BS-Seq was conducted using non-transgenic and transgenic lines of the Chinese cabbage inbred line ‘CT001’. Methylation variations in the transgenic lines and their effects on gene expression were analyzed. Consistently identified DMRs in T1, T2, and T3 lines were detected, and ten DMRs located in the exonic regions of a gene were selected and analyzed. The findings of this study will help understand the variation in methylation in transgenic plants and can be applied in further research.

Supplementary Materials

The following are available online at https://www.mdpi.com/article/10.3390/genes12101563/s1, Figure S1. RT-PCR analysis of the non-transgenic and transgenic lines using primer sets for transformant-conserved DMRs (TCDs). Table S1. List of primer sets for quantitative RT-PCR analysis. Table S2. List of primer sets for methylation-specific PCR analysis. Table S3. Average methylation level in total genome of the non-transgenic and transgenic lines. Table S4. List of genes within the conserved DMRs identified in the transgenic lines.

Author Contributions

J.-S.P. and Y.-H.S. performed the majority of the experiment and data analysis. J.-S.P. analyzed the methylome patterns of the non-transgenic and transgenic lines. Y.-H.S. analyzed expression level and function of genes associated with the DMRs. Y.-D.P. designed the experiment and analyzed data. Writing—original draft preparation, J.-S.P., Y.-H.S. All authors contributed to and corrected the manuscript. All authors have read and agreed to the published version of the manuscript.

Funding

This research was funded by the “Cooperative Research Program for Agriculture Science and Technology Development (Project No. PJ01579301)” Rural Development Administration, Korea.

Institutional Review Board Statement

Not applicable.

Informed Consent Statement

Not applicable.

Data Availability Statement

The obtained sequencing data (5 fastq files) generated during the current study were deposited in the National Agricultural Biotechnology Information Center (NABIC) (http://nabic.rda.go.kr, accessed on 21 June 2021) in Rural Development Administration (RDA), South Korea with the following accession numbers (CT001 Re-seq: NN-1902, CT001 Bs-seq: NN-6312, IGA7 Bs-seq: NN-6314, IGA74 Bs-seq: NN-7496, IGA743 Bs-seq: NN-6315). The sequencing data is publicly available.

Acknowledgments

This work was carried out with the support of the “Cooperative Research Program for Agriculture Science and Technology Development (Project No. PJ01579301)”, Rural Development Administration, Republic of Korea.

Conflicts of Interest

The authors declare that they have no conflict of interest.

References

  1. Husaini, A.M.; Abdin, M.Z.; Parray, G.A.; Sanghera, G.S.; Murtaza, I.; Alam, T.; Srivastava, D.K.; Farooqi, H.; Khan, H.N. Vehicles and ways for efficient nuclear transformation in plants. GM Crop. 2010, 1, 276–287. [Google Scholar] [CrossRef] [PubMed]
  2. Larkin, P.J.; Scowcroft, W.R. Somaclonal variation—A novel source of variability from cell cultures for plant improvement. Theor. Appl. Genet. 1981, 60, 197–214. [Google Scholar] [CrossRef] [PubMed]
  3. Bajaj, Y.P.S. Somaclonal variation—Origin, induction, cryopreservation and implication in plant breeding. In Somaclonal Variation in Crop. Improvement I; Springer: Berlin/Heidelberg, Germany, 1990; pp. 3–48. [Google Scholar]
  4. Miguel, C.; Marum, L. An epigenetic view of plant cells cultured in vitro: Somaclonal variation and beyond. J. Exp. Bot. 2011, 62, 3713–3725. [Google Scholar] [CrossRef] [PubMed] [Green Version]
  5. Kaeppler, S.; Phillips, R.L. Tissue culture-induced DNA methylation variation in maize. Proc. Natl. Acad. Sci. USA 1993, 90, 8773–8776. [Google Scholar] [CrossRef] [Green Version]
  6. Kaeppler, S.M.; Kaeppler, H.F.; Rhee, Y. Epigenetic aspects of somaclonal variation in plants. Plant Mol. Biol. 2000, 43, 179–188. [Google Scholar] [CrossRef]
  7. Thorpe, T.A. History of plant tissue culture. Mol. Biotechnol. 2007, 37, 169–180. [Google Scholar] [CrossRef]
  8. Rhee, Y.; Sekhon, R.S.; Chopra, S.; Kaeppler, S. Tissue Culture-Induced Novel Epialleles of a Myb Transcription Factor Encoded by pericarp color1 in Maize. Genetics 2010, 186, 843–855. [Google Scholar] [CrossRef] [Green Version]
  9. Neelakandan, A.; Wang, K. Recent progress in the understanding of tissue culture-induced genome level changes in plants and potential applications. Plant Cell Rep. 2011, 31, 597–620. [Google Scholar] [CrossRef]
  10. Yang, X.; Han, H.; De Carvalho, D.D.; Lay, F.D.; Jones, P.A.; Liang, G. Gene body methylation can alter gene expression and is a therapeutic target in cancer. Cancer Cell. 2014, 26, 577–590. [Google Scholar] [CrossRef] [Green Version]
  11. To, T.K.; Saze, H.; Kakutani, T. DNA Methylation within Transcribed Regions. Plant Physiol. 2015, 168, 1219–1225. [Google Scholar] [CrossRef] [Green Version]
  12. Kankel, M.W.; Ramsey, D.E.; Stokes, T.L.; Flowers, S.K.; Haag, J.R.; A Jeddeloh, J.; Riddle, N.C.; Verbsky, M.L.; Richards, E.J. Arabidopsis MET1 Cytosine Methyltransferase Mutants. Genetics 2003, 163, 1109–1122. [Google Scholar] [CrossRef]
  13. Shemer, O.; Landau, U.; Candela, H.; Zemach, A.; Williams, L.E. Competency for shoot regeneration from Arabidopsis root explants is regulated by DNA methylation. Plant Sci. 2015, 238, 251–261. [Google Scholar] [CrossRef] [PubMed]
  14. Wu, S.C.; Zhang, Y. Active DNA demethylation: Many roads lead to Rome. Nat. Rev. Mol. Cell. Biol. 2010, 11, 607–620. [Google Scholar] [CrossRef] [PubMed] [Green Version]
  15. Kubis, S.E.; Castilho, A.; Vershinin, A.V.; Heslop-Harrison, J.S. Retroelements, transposons and methylation status in the genome of oil palm (Elaeis guineensis) and the relationship to somaclonal variation. Plant Mol. Biol. 2003, 52, 69–79. [Google Scholar] [CrossRef] [PubMed]
  16. Herman, J.G.; Graff, J.R.; Myohanen, S.; Nelkin, B.D.; Baylin, S.B. Methylation-specific PCR: A novel PCR assay for methylation status of CpG islands. Proc. Natl. Acad. Sci. USA 1996, 93, 9821–9826. [Google Scholar] [CrossRef] [Green Version]
  17. Smulders, M.J.M.; De Klerk, G.J. Epigenetics in plant tissue culture. Plant Growth Regul. 2011, 63, 137–146. [Google Scholar] [CrossRef] [Green Version]
  18. Coronel, C.J.; González, A.I.; Ruiz, M.L.; Polanco, C. Analysis of somaclonal variation in transgenic and regenerated plants of Arabidopsis thaliana using methylation related metAFLP and TMD markers. Plant Cell Rep. 2017, 37, 137–152. [Google Scholar] [CrossRef]
  19. Frommer, M.; McDonald, L.E.; Millar, D.S.; Collis, C.M.; Watt, F.; Grigg, G.W.; Molloy, P.L.; Paul, C.L. A genomic sequencing protocol that yields a positive display of 5-methylcytosine residues in individual DNA strands. Proc. Natl. Acad. Sci. USA 1992, 89, 1827–1831. [Google Scholar] [CrossRef] [Green Version]
  20. Weber, M.; Davies, J.J.; Wittig, D.; Oakeley, E.J.; Haase, M.; Lam, W.L.; Schuebeler, D. Chromosome-wide and promoter-specific analyses identify sites of differential DNA methylation in normal and transformed human cells. Nat. Genet. 2005, 37, 853–862. [Google Scholar] [CrossRef]
  21. Masser, D.R.; Berg, A.S.; Freeman, W.M. Focused, high accuracy 5-methylcytosine quantitation with base resolution by benchtop next-generation sequencing. Epigenetics Chromatin 2013, 6, 33. [Google Scholar] [CrossRef] [Green Version]
  22. Wang, X.; Wang, H.; Wang, J.; Sun, R.; Wu, J.; Liu, S.; Bai, Y.; Mun, J.; Bancroft, I.; Cheng, F.; et al. The genome of the mesopolyploid crop species Brassica rapa. Nat. Genet. 2011, 43, 1035–1039. [Google Scholar] [CrossRef] [Green Version]
  23. Park, J.S.; Park, J.H.; Park, Y.D. Construction of pseudomolecule sequences of Brassica rapa ssp. pekinensis inbred line CT001 and analysis of spontaneous mutations derived via sexual propagation. PLoS ONE 2019, 14, e0222283. [Google Scholar] [CrossRef]
  24. Park, J.H.; Lee, S.J.; Kim, B.R.; Woo, E.T.; Lee, J.S.; Han, E.H.; Lee, Y.H.; Park, Y.D. Isolation of Myrosinase and Glutathione S-transferase Genes and Transformation of These Genes to Develop Phenylethylisothiocyanate Enriching Chinese Cabbage. Kor. J. Hort. Sci. Technol. 2011, 29, 623–632. [Google Scholar]
  25. Dellaporta, S.L.; Wood, J.; Hicks, J.B. A plant DNA minipreparation: Version II. Plant Mol. Biol. Rep. 1983, 1, 19–21. [Google Scholar] [CrossRef]
  26. Kim, S.J.; Park, J.S.; Shin, Y.H.; Park, Y.D. Identification and Validation of Genetic Variations in Transgenic Chinese Cabbage Plants (Brassica rapa ssp. pekinensis) by Next-Generation Sequencing. Genes 2021, 12, 621. [Google Scholar] [CrossRef]
  27. Bolger, A.M.; Lohse, M.; Usadel, B. Trimmomatic: A flexible trimmer for Illumina sequence data. Bioinformatics 2014, 30, 2114–2120. [Google Scholar] [CrossRef] [PubMed] [Green Version]
  28. Krueger, F.; Andrews, S.R. Bismark: A flexible aligner and methylation caller for Bisulfite-Seq applications. Bioinformatics 2011, 27, 1571–1572. [Google Scholar] [CrossRef] [PubMed]
  29. Park, Y.; Wu, H. Differential methylation analysis for BS-seq data under general experimental design. Bioinformatics 2016, 32, 1446–1453. [Google Scholar] [CrossRef] [Green Version]
  30. Huang, D.W.; Sherman, B.T.; Tan, Q.; Kir, J.; Liu, D.; Bryant, D.; Guo, Y.; Stephens, R.; Baseler, M.W.; Lane, H.C.; et al. DAVID Bioinformatics Resources: Expanded annotation database and novel algorithms to better extract biology from large gene lists. Nucleic Acids Res. 2007, 35, W169–W175. [Google Scholar] [CrossRef]
  31. Livak, K.J.; Schmittgen, T.D. Analysis of Relative Gene Expression Data Using Real-Time Quantitative PCR and the 2−ΔΔCT Method. Methods 2001, 25, 402–408. [Google Scholar] [CrossRef]
  32. Cokus, S.J.; Feng, S.; Zhang, X.; Chen, Z.; Merriman, B.; Haudenschild, C.D.; Pradhan, S.; Nelson, S.F.; Pellegrini, M.; Jacobsen, S.E. Shotgun bisulphite sequencing of the Arabidopsis genome reveals DNA methylation patterning. Nature 2008, 452, 215–219. [Google Scholar] [CrossRef] [PubMed] [Green Version]
  33. Lister, R.; Ecker, J.R. Finding the fifth base: Genome-wide sequencing of cytosine methylation. Genome Res. 2009, 19, 959–966. [Google Scholar] [CrossRef] [PubMed] [Green Version]
  34. Feng, S.; Rubbi, L.; Jacobsen, S.E.; Pellegrini, M. Determining DNA Methylation Profiles Using Sequencing. High-Throughput Next Gener. Seq. 2011, 733, 223–238. [Google Scholar] [CrossRef]
  35. Stroud, H.; Ding, B.; Simon, S.A.; Feng, S.; Bellizzi, M.; Pellegrini, M.; Wang, G.L.; Meyers, B.C.; Jacobsen, S.E. Plants regenerated from tissue culture contain stable epigenome changes in rice. elife 2013, 2, e00354. [Google Scholar] [CrossRef] [PubMed]
  36. Stelpflug, S.C.; Eichten, S.R.; Hermanson, P.J.; Springer, N.M.; Kaeppler, S.M. Consistent and Heritable Alterations of DNA Methylation Are Induced by Tissue Culture in Maize. Genetics 2014, 198, 209–218. [Google Scholar] [CrossRef] [Green Version]
  37. Lauria, M.; Echegoyen-Nava, R.A.; Rodríguez-Ríos, D.; Zaina, S.; Lund, G. Inter-individual variation in DNA methylation is largely restricted to tissue-specific differentially methylated regions in maize. BMC Plant Biol. 2017, 17, 52. [Google Scholar] [CrossRef] [Green Version]
  38. Hu, L.; Li, N.; Zhang, Z.; Meng, X.; Dong, Q.; Xu, C.; Gong, L.; Liu, B. CG hypomethylation leads to complex changes in DNA methylation and transpositional burst of diverse transposable elements in callus cultures of rice. Plant J. 2019, 101, 188–203. [Google Scholar] [CrossRef]
  39. Fujimoto, R.; Sasaki, T.; Inoue, H.; Nishio, T. Hypomethylation and transcriptional reactivation of retrotransposon-like sequences in ddm1 transgenic plants of Brassica rapa. Plant Mol. Biol. 2008, 66, 463–473. [Google Scholar] [CrossRef]
  40. Karim, R.; Nuruzzaman, M.; Khalid, N.; Harikrishna, J.A. Importance of DNA and histone methylation in in vitro plant propagation for crop improvement: A review. Ann. Appl. 2016, 169, 1–16. [Google Scholar] [CrossRef]
  41. Bewick, A.J.; Ji, L.; Niederhuth, C.E.; Willing, E.-M.; Hofmeister, B.T.; Shi, X.; Wang, L.; Lu, Z.; Rohr, N.A.; Hartwig, B.; et al. On the origin and evolutionary consequences of gene body DNA methylation. Proc. Natl. Acad. Sci. USA 2016, 113, 9111–9116. [Google Scholar] [CrossRef] [Green Version]
  42. Takuno, S.; Ran, J.H.; Gaut, B.S. Evolutionary patterns of genic DNA methylation vary across land plants. Nat. Plants 2016, 2, 15222. [Google Scholar] [CrossRef]
  43. Velásquez, A.C.; Nomura, K.; Cooper, M.D.; Herrin, B.R.; He, S.Y. Leucine-rich-repeat-containing variable lymphocyte receptors as modules to target plant-expressed proteins. Plant Methods 2017, 13, 29. [Google Scholar] [CrossRef] [PubMed] [Green Version]
  44. Mosher, S.; Kemmerling, B. PSKR1 and PSY1R-mediated regulation of plant defense responses. Plant Signal. Behav. 2013, 8, e24119. [Google Scholar] [CrossRef] [Green Version]
  45. Mahmood, K.; Kannangara, R.; Jørgensen, K.; Fuglsang, A.T. Analysis of peptide PSY1 responding transcripts in the two Arabidopsis plant lines: Wild type and psy1r receptor mutant. BMC Genom. 2014, 15, 441. [Google Scholar] [CrossRef] [Green Version]
  46. Brocard, I.M.; Lynch, T.J.; Finkelstein, R.R. Regulation and Role of the Arabidopsis Abscisic Acid-Insensitive 5 Gene in Abscisic Acid, Sugar, and Stress Response. Plant Physiol. 2002, 129, 1533–1543. [Google Scholar] [CrossRef] [PubMed] [Green Version]
  47. Garcia, M.E.; Lynch, T.; Peeters, J.; Snowden, C.; Finkelstein, R. A small plant-specific protein family of ABI five binding proteins (AFPs) regulates stress response in germinating Arabidopsis seeds and seedlings. Plant Mol. Biol. 2008, 67, 643–658. [Google Scholar] [CrossRef] [PubMed]
  48. Chang, H.C.; Tsai, M.C.; Wu, S.S.; Chang, I.F. Regulation of ABI5 expression by ABF3 during salt stress responses in Arabidopsis thaliana. Bot. Stud. 2019, 60, 16. [Google Scholar] [CrossRef] [Green Version]
  49. Vu, T.; Nakamura, M.; Calarco, J.P.; Susaki, D.; Lim, P.Q.; Kinoshita, T.; Higashiyama, T.; Martienssen, R.A.; Berger, F. RNA-directed DNA methylation regulates parental genomic imprinting at several loci in Arabidopsis. Development 2013, 140, 2953–2960. [Google Scholar] [CrossRef] [Green Version]
  50. Arıkan, B.; Özden, S.; Turgut-Kara, N. DNA methylation related gene expression and morphophysiological response to abiotic stresses in Arabidopsis thaliana. Environ. Exp. Bot. 2018, 149, 17–26. [Google Scholar] [CrossRef]
  51. Zhong, X.; Hale, C.J.; Nguyen, M.; Ausin, I.; Groth, M.; Hetzel, J.; Vashisht, A.A.; Henderson, I.; Wohlschlegel, J.A.; Jacobsen, S.E. DOMAINS REARRANGED METHYLTRANSFERASE3 controls DNA methylation and regulates RNA polymerase V transcript abundance in Arabidopsis. Proc. Natl. Acad. Sci. USA 2015, 112, 911–916. [Google Scholar] [CrossRef] [Green Version]
  52. Kim, E.J.; Kwak, J.M.; Uozumi, N.; Schroeder, J.I. AtKUP1: An Arabidopsis Gene Encoding High-Affinity Potassium Transport Activity. Plant Cell. 1998, 10, 51–62. [Google Scholar] [CrossRef] [PubMed] [Green Version]
  53. Gomez, M.D.; Urbez, C.; Perez-Amador, M.A.; Carbonell, J. Characterization of constricted fruit (ctf) Mutant Uncovers a Role for AtMYB117/LOF1 in Ovule and Fruit Development in Arabidopsis thaliana. PLoS ONE 2011, 6, e18760. [Google Scholar] [CrossRef] [Green Version]
  54. Bolaños-Villegas, P.; Yang, X.; Wang, H.J.; Juan, C.T.; Chuang, M.H.; Makaroff, C.A.; Jauh, G.Y. Arabidopsis CHROMOSOME TRANSMISSION FIDELITY 7 (AtCTF7/ECO1) is required for DNA repair, mitosis and meiosis. Plant J. 2013, 75, 927–940. [Google Scholar] [CrossRef] [PubMed] [Green Version]
  55. Lyu, S.; Chen, G.; Pan, D.; Chen, J.; She, W. Molecular Analysis of 14-3-3 Genes in Citrus sinensis and Their Responses to Different Stresses. Int. J. Mol. Sci. 2021, 22, 568. [Google Scholar] [CrossRef] [PubMed]
Figure 1. Methylation rates of the non-transgenic and transgenic lines. Proportions of methylated cytosines in the 3 contexts (mCs ≥ 3), classified as CG, CHG, and CHH (H indicates A, C, or T).
Genes 12 01563 g001
Figure 2. In silico methylation pattern analysis of the transformant-conserved DMRs (TCDs) between the non-transgenic control line ‘CT001’ and transgenic lines (T1, T2, and T3). Black arrows indicate directions of the genes. The green boxes indicate hypomethylated DMRs, and the blue boxes indicate hypermethylated DMRs in the transgenic lines.
Genes 12 01563 g002
Figure 3. Gene expression analysis of 10 selected genes within transformant-conserved DMRs (TCDs) between the non-transgenic and transgenic lines. Expression levels of each DMR gene in T1, T2, and T3 generations of IGA were compared with inbred line ‘CT001’. Y-axis indicates relative mRNA expression, and bars on the graph indicate the SE of the means (n = 3).
Genes 12 01563 g003
Figure 4. Methylation-specific PCR (MSP) analysis of TCD8 in the non-transgenic and transgenic lines. MSP was conducted to examine the methylation status of the three CT001, four T1 (IGA7), three T2 (IGA74), three T3 (IGA743) and two T4 (IGA7434) lines. M primer set amplified the methylated DNA with 288 bp and the U primer set amplified the unmethylated DNA with 290 bp. CT001, inbred line; T1, T2, T3, and T4, transgenic lines of IGA. M, methylated PCR products; U, unmethylated PCR products.
Genes 12 01563 g004
Table 1. Functional annotation clustering of the conserved DMRs in the transgenic lines.
Cluster Enrichment ScoreCategory zDescriptionCountp Value
1.45INTERPROLeucine-rich repeat, typical subtype43.1 × 10−3
SMARTLRR TYP45.3 × 10−1
INTERPROLeucine-rich repeat42.3 × 10−2
INTERPROLeucine-rich repeat-containing N-terminal, type 245.0 × 10⁻²
UP_KEYWORDSReceptor46.2 × 10−2
UP_KEYWORDSLeucine-rich repeat42.3 × 10−1
GOTERM_MF_DIRECTKinase activity42.6 × 10−1
0.43GOTERM_CC_DIRECTIntegral component of membrane113.0 × 10−1
UP_SEQ_FEATURETransmembrane region53.2 × 10−1
UP_KEYWORDSTransport53.7 × 10−1
UP_KEYWORDSTransmembrane helix114.0 × 10−1
UP_KEYWORDSTransmembrane114.1 × 10−1
UP_KEYWORDSMembrane124.8 × 10−1
0.42UP_KEYWORDSNucleotide-binding86.2 × 10−2
UP_KEYWORDSATP-binding62.0 × 10−1
UP_KEYWORDSSerine/threonine-protein kinase33.3 × 10−1
GOTERM_MF_DIRECTATP binding63.8 × 10−1
INTERPROSerine/threonine-protein kinase, active site34.0 × 10−1
GOTERM_MF_DIRECTProtein serine/threonine kinase activity34.0 × 10−1
SMARTS TKc35.2 × 10−1
INTERPROProtein kinase, catalytic domain35.3 × 10−1
INTERPROProtein kinase-like domain35.5 × 10−1
INTERPROP-loop containing nucleoside triphosphate hydrolase35.7 × 10−1
UP_KEYWORDSTransferase65.9 × 10−1
UP_KEYWORDSKinase36.2 × 10−1
z The terms derived from reference databases. INTERPRO, terms from InterPro protein database; SMART, analysis of domain architectures; UP_KEYWORDS, keywords from UniProtKB; GOTERM_MF, Gene ontology term of molecular function; GOTERM_CC, Gene ontology term for cellular component; UP_SEQ_FEATURE, Uniprot Sequence Feature.
Table 2. Information of genes within the transfomant-conserved DMRs (TCDs) in the transgenic lines.
NameContextMethyl in Transformants ZGene IDBrassica IDTAIR IDDescription
TCD 1CG
CHG
CHH
HyperCT001_A07241320---
TCD 2CG
CHG
CHH
HypoCT001_A07421310---
TCD 3CHG
CHH
HyperCT001_A08284340Bra034540--
TCD 4CHG
CHH
HypoCT001_A05184770Bra027247AT3G15390Putative nuclear RNA export factor SDE5 isoform X1
TCD 5CHG
CHH
HypoCT001_A07260420Bra004227AT1G67480F-box/kelch-repeat protein
TCD 6CG
CHH
HypoCT001_A07264360Bra016068AT1G72300Tyrosine-sulfated glycopeptide receptor 1
TCD 7CG
CHG
HyperCT001_A07243410Bra012325AT1G78300G-box binding factor GF14 omega encoding a 14-3-3 protein
TCD 8CG
CHG
HypoCT001_A09347510Bra031188AT3G17310Probable inactive DNA (cytosine-5)-methyltransferase DRM3
TCD 9CHH
CHG
HypoCT001_A01011320Bra013553AT2G30070High affinity potassium transporter
TCD 10CHG
CHH
HypoCT001_A03126570Bra024010AT4G31400Protein chromosome transmission fidelity 7
z Methylation status of transgenic lines compared to non-transgenic line. Hyper, hypermethylation; Hypo, hypomethylation.
Publisher’s Note: MDPI stays neutral with regard to jurisdictional claims in published maps and institutional affiliations.

