
Myocardial Deformation Analysis in MYBPC3 and MYH7 Related Sarcomeric Hypertrophic Cardiomyopathy—The Graz Hypertrophic Cardiomyopathy Registry

 , , ,
, , ,
Abstract
:1. Introduction
2. Materials and Methods
2.1. Design and Study Population
2.2. Clinical Characteristics and Medical History
2.3. Genetic Analysis
2.4. Echocardiographic Assessment and Variables
2.5. Statistical Analysis
3. Results
3.1. Clinical Characteristics
3.2. Echocardiographic Parameters
4. Discussion
5. Conclusions
Supplementary Materials
Author Contributions
Funding
Institutional Review Board Statement
Informed Consent Statement
Data Availability Statement
Acknowledgments
Conflicts of Interest
References
- Semsarian, C.; Ingles, J.; Maron, M.S.; Maron, B.J. New Perspectives on the Prevalence of Hypertrophic Cardiomyopathy. J. Am. Coll. Cardiol. 2015, 65, 1249–1254. [Google Scholar] [CrossRef] [PubMed] [Green Version]
- Elliott, P.M.; Anastasakis, A.; Borger, M.; Borggrefe, M.; Cecchi, F.; Charron, P.; Hagege, A.; Lafont, A.; Limongelli, G.; Mahrholdt, H.; et al. 2014 ESC Guidelines on diagnosis and management of hypertrophic cardiomyopathy. Eur. Heart J. 2014, 35, 2733–2779. [Google Scholar] [CrossRef] [Green Version]
- Wang, J.; Yang, F.; Liu, W.; Sun, J.; Han, Y.; Li, D.; Gkoutos, G.V.; Zhu, Y.; Chen, Y. Radiomic Analysis of Native T 1 Mapping Images Discriminates Between MYH7 and MYBPC3 -Related Hypertrophic Cardiomyopathy. J. Magn. Reson. Imaging 2020, 52, 1714–1721. [Google Scholar] [CrossRef] [PubMed]
- Toepfer, C.N.; Wakimoto, H.; Garfinkel, A.C.; McDonough, B.; Liao, D.; Jiang, J.; Tai, A.C.; Gorham, J.M.; Lunde, I.G.; Lun, M.; et al. Hypertrophic cardiomyopathy mutations in MYBPC3 dysregulate myosin. Sci. Transl. Med. 2019, 11, eaat1199. [Google Scholar] [CrossRef] [PubMed]
- Adalsteinsdottir, B.; Burke, M.; Maron, B.J.; Danielsen, R.; Lopez, B.; Diez, J.; Jarolim, P.; Seidman, J.; Seidman, C.E.; Ho, C.Y.; et al. Hypertrophic cardiomyopathy in myosin-binding protein C (MYBPC3) Icelandic founder mutation carriers. Open Heart 2020, 7, e001220. [Google Scholar] [CrossRef] [Green Version]
- Geske, J.B.; Ong, K.C.; Siontis, K.C.; Hebl, V.B.; Ackerman, M.J.; Hodge, D.O.; Miller, V.M.; Nishimura, R.A.; Oh, J.K.; Schaff, H.; et al. Women with hypertrophic cardiomyopathy have worse survival. Eur. Heart J. 2017, 38, 3434–3440. [Google Scholar] [CrossRef] [Green Version]
- Sabater-Molina, M.; Pérez-Sánchez, I.; Del Rincón, J.H.; Gimeno, J. Genetics of hypertrophic cardiomyopathy: A review of current state. Clin. Genet. 2017, 93, 3–14. [Google Scholar] [CrossRef]
- Velicki, L.; Jakovljevic, D.G.; Preveden, A.; Golubovic, M.; Bjelobrk, M.; Ilic, A.; Stojsic, S.; Barlocco, F.; Tafelmeier, M.; Okwose, N.; et al. Genetic determinants of clinical phenotype in hypertrophic cardiomyopathy. BMC Cardiovasc. Disord. 2020, 20, 1–10. [Google Scholar] [CrossRef] [PubMed]
- Sedaghat-Hamedani, F.; Kayvanpour, E.; Tugrul, O.F.; Lai, A.; Amr, A.; Haas, J.; Proctor, T.; Ehlermann, P.; Jensen, K.; Katus, H.A.; et al. Clinical outcomes associated with sarcomere mutations in hypertrophic cardiomyopathy: A meta-analysis on 7675 individuals. Clin. Res. Cardiol. 2017, 107, 30–41. [Google Scholar] [CrossRef]
- Walsh, R.; Rutland, C.; Thomas, R.; Loughna, S. Cardiomyopathy: A Systematic Review of Disease-Causing Mutations in Myosin Heavy Chain 7 and Their Phenotypic Manifestations. Cardiology 2010, 115, 49–60. [Google Scholar] [CrossRef]
- Helms, A.S.; Tang, V.T.; O’Leary, T.S.; Friedline, S.; Wauchope, M.; Arora, A.; Wasserman, A.; Smith, E.D.; Lee, L.M.; Wen, X.W.; et al. Effects of MYBPC3 loss-of-function mutations preceding hypertrophic cardiomyopathy. JCI Insight 2020, 5. [Google Scholar] [CrossRef] [Green Version]
- Lopes, L.R.; Brito, D.; Belo, A.; Cardim, N. Genetic characterization and genotype-phenotype associations in a large cohort of patients with hypertrophic cardiomyopathy—An ancillary study of the Portuguese registry of hypertrophic cardiomyopathy. Int. J. Cardiol. 2018, 278, 173–179. [Google Scholar] [CrossRef] [PubMed]
- Viswanathan, S.K.; Sanders, H.K.; McNamara, J.W.; Jagadeesan, A.; Jahangir, A.; Tajik, A.J.; Sadayappan, S. Hypertrophic cardiomyopathy clinical phenotype is independent of gene mutation and mutation dosage. PLoS ONE 2017, 12, e0187948. [Google Scholar] [CrossRef] [PubMed] [Green Version]
- Weissler-Snir, A.; Hindieh, W.; Gruner, C.; Fourey, D.; Appelbaum, E.; Rowin, E.; Care, M.; Lesser, J.R.; Haas, T.S.; Udelson, J.E.; et al. Lack of Phenotypic Differences by Cardiovascular Magnetic Resonance Imaging in MYH7 (β-Myosin Heavy Chain)- Versus MYBPC3 (Myosin-Binding Protein C)-Related Hypertrophic Cardiomyopathy. Circ. Cardiovasc. Imaging 2017, 10. [Google Scholar] [CrossRef] [PubMed] [Green Version]
- Pagourelias, E.D.; Mirea, O.; Duchenne, J.; Unlu, S.; Van Cleemput, J.; Papadopoulos, C.E.; Bogaert, J.; Vassilikos, V.P.; Voigt, J.-U. Speckle tracking deformation imaging to detect regional fibrosis in hypertrophic cardiomyopathy: A comparison between 2D and 3D echo modalities. Eur. Heart J.-Cardiovasc. Imaging 2020, 21, 1262–1272. [Google Scholar] [CrossRef] [PubMed]
- Ponikowski, P.; Voors, A.A.; Anker, S.D.; Bueno, H.; Cleland, J.G.F.; Coats, A.J.S.; Falk, V.; González-Juanatey, J.R.; Harjola, V.-P.; Jankowska, E.A.; et al. 2016 ESC Guidelines for the diagnosis and treatment of acute and chronic heart failure. Eur. Heart J. 2016, 37, 2129–2200. [Google Scholar] [CrossRef]
- Voigt, J.-U.; Pedrizzetti, G.; Lysyansky, P.; Marwick, T.H.; Houle, H.; Baumann, R.; Pedri, S.; Ito, Y.; Abe, Y.; Metz, S.; et al. Definitions for a common standard for 2D speckle tracking echocardiography: Consensus document of the EACVI/ASE/Industry Task Force to standardize deformation imaging. Eur. Heart J.-Cardiovasc. Imaging 2014, 16, 1–11. [Google Scholar] [CrossRef]
- Ommen, S.R.; Mital, S.; Burke, M.A.; Day, S.M.; Deswal, A.; Elliott, P.; Evanovich, L.L.; Hung, J.; Joglar, J.A.; Kantor, P.; et al. 2020 AHA/ACC Guideline for the Diagnosis and Treatment of Patients with Hypertrophic Cardiomyopathy: Executive Summary. J. Am. Coll. Cardiol. 2020, 76, 3022–3055. [Google Scholar] [CrossRef]
- Richards, S.; Aziz, N.; Bale, S.; Bick, D.; Das, S.; Gastier-Foster, J.; Grody, W.W.; Hegde, M.; Lyon, E.; Spector, E.; et al. Standards and guidelines for the interpretation of sequence variants: A joint consensus recommendation of the American College of Medical Genetics and Genomics and the Association for Molecular Pathology. Genet. Med. 2015, 17, 405–423. [Google Scholar] [CrossRef] [PubMed]
- Mor-Avi, V.; Lang, R.M.; Badano, L.; Belohlavek, M.; Cardim, N.M.; Derumeaux, G.; Galderisi, M.; Marwick, T.; Nagueh, S.F.; Sengupta, P.P.; et al. Current and Evolving Echocardiographic Techniques for the Quantitative Evaluation of Cardiac Mechanics: ASE/EAE Consensus Statement on Methodology and Indications: Endorsed by the Japanese Society of Echocardiography. J. Am. Soc. Echocardiogr. 2011, 24, 277–313. [Google Scholar] [CrossRef]
- Lang, R.M.; Badano, L.; Mor-Avi, V.; Afilalo, J.; Armstrong, A.; Ernande, L.; Flachskampf, F.A.; Foster, E.; Goldstein, S.A.; Kuznetsova, T.; et al. Recommendations for Cardiac Chamber Quantification by Echocardiography in Adults: An Update from the American Society of Echocardiography and the European Association of Cardiovascular Imaging. Eur. Heart J.-Cardiovasc. Imaging 2015, 16, 233–271. [Google Scholar] [CrossRef] [PubMed]
- Nagueh, S.F.; Smiseth, O.A.; Appleton, C.P.; Byrd, B.F.; Dokainish, H.; Edvardsen, T.; Flachskampf, F.A.; Gillebert, T.C.; Klein, A.L.; Lancellotti, P.; et al. Recommendations for the Evaluation of Left Ventricular Diastolic Function by Echocardiography: An Update from the American Society of Echocardiography and the European Association of Cardiovascular Imaging. Eur. Heart J.-Cardiovasc. Imaging 2016, 17, 1321–1360. [Google Scholar] [CrossRef] [PubMed]
- Rudski, L.G.; Lai, W.W.; Afilalo, J.; Hua, L.; Handschumacher, M.; Chandrasekaran, K.; Solomon, S.D.; Louie, E.K.; Schiller, N.B. Guidelines for the Echocardiographic Assessment of the Right Heart in Adults: A Report from the American Society of Echocardiography: Endorsed by the European Association of Echocardiography, a registered branch of the European Society of Cardiology, and the Canadian Society of Echocardiography. J. Am. Soc. Echocardiogr. 2010, 23, 685–713. [Google Scholar] [CrossRef] [PubMed]
- Sugimoto, T.; Dulgheru, R.; Bernard, C.; Ilardi, F.; Contu, L.; Addetia, K.; Caballero, L.; Akhaladze, N.; Athanassopoulos, G.D.; Barone, D.; et al. Echocardiographic reference ranges for normal left ventricular 2D strain: Results from the EACVI NORRE study. Eur. Heart J.-Cardiovasc. Imaging 2017, 18, 833–840. [Google Scholar] [CrossRef]
- Badano, L.P.; Kolias, T.J.; Muraru, D.; Abraham, T.P.; Aurigemma, G.; Edvardsen, T.; D’Hooge, J.; Donal, E.; Fraser, A.G.; Marwick, T.; et al. Standardization of left atrial, right ventricular, and right atrial deformation imaging using two-dimensional speckle tracking echocardiography: A consensus document of the EACVI/ASE/Industry Task Force to standardize deformation imaging. Eur. Heart J.-Cardiovasc. Imaging 2018, 19, 591–600. [Google Scholar] [CrossRef]
- Badano, L.P.; Muraru, D.; Parati, G.; Haugaa, K.; Voigt, J.-U. How to do right ventricular strain. Eur. Heart J.-Cardiovasc. Imaging 2020, 21, 825–827. [Google Scholar] [CrossRef]
- Kraft, T.; Montag, J. Altered force generation and cell-to-cell contractile imbalance in hypertrophic cardiomyopathy. Pflügers Arch.-Eur. J. Physiol. 2019, 471, 719–733. [Google Scholar] [CrossRef]
- Moore, J.R.; Leinwand, L.; Warshaw, D.M. Understanding cardiomyopathy phenotypes based on the functional impact of mutations in the myosin motor. Circ. Res. 2012, 111, 375–385. [Google Scholar] [CrossRef] [Green Version]
- Adhikari, A.S.; Kooiker, K.B.; Sarkar, S.S.; Liu, C.; Bernstein, D.; Spudich, J.A.; Ruppel, K.M. Early-Onset Hypertrophic Cardiomyopathy Mutations Significantly Increase the Velocity, Force, and Actin-Activated ATPase Activity of Human β-Cardiac Myosin. Cell Rep. 2016, 17, 2857–2864. [Google Scholar] [CrossRef]
- Roest, A.S.V.; Liu, C.; Morck, M.M.; Kooiker, K.B.; Jung, G.; Song, D.; Dawood, A.; Jhingran, A.; Pardon, G.; Ranjbarvaziri, S.; et al. Hypertrophic cardiomyopathy β-cardiac myosin mutation (P710R) leads to hypercontractility by disrupting super relaxed state. Proc. Natl. Acad. Sci. USA 2021, 118. [Google Scholar] [CrossRef]
- Waldmüller, S.; Erdmann, J.; Binner, P.; Gelbrich, G.; Pankuweit, S.; Geier, C.; Timmermann, B.; Haremza, J.; Perrot, A.; Scheer, S.; et al. Novel correlations between the genotype and the phenotype of hypertrophic and dilated cardiomyopathy: Results from the German Competence Network Heart Failure. Eur. J. Heart Fail. 2011, 13, 1185–1192. [Google Scholar] [CrossRef]
- Niimura, H.; Bachinski, L.L.; Sangwatanaroj, S.; Watkins, H.; Chudley, A.E.; McKenna, W.; Kristinsson, A.; Roberts, R.; Sole, M.; Maron, B.J.; et al. Mutations in the Gene for Cardiac Myosin-Binding Protein C and Late-Onset Familial Hypertrophic Cardiomyopathy. N. Engl. J. Med. 1998, 338, 1248–1257. [Google Scholar] [CrossRef] [PubMed]
- Christiaans, I.; Nannenberg, E.A.; Dooijes, D.; Jongbloed, R.J.E.; Michels, M.; Postema, P.G.; Majoor-Krakauer, D.; Wijngaard, A.V.D.; Mannens, M.M.A.M.; van Tintelen, J.P.; et al. Founder mutations in hypertrophic cardiomyopathy patients in the Netherlands. Neth. Heart J. 2010, 18, 248–254. [Google Scholar] [CrossRef]
- Alders, M.; Jongbloed, R.; Deelen, W.; Wijngaard, A.V.D.; Doevendans, P.A.F.M.; Cate, F.T.; Regitz-Zagrosek, V.; Vosberg, H.-P.; Van Langen, I.; Wilde, A.A.M.; et al. The 2373insG mutation in the MYBPC3 gene is a founder mutation, which accounts for nearly one-fourth of the HCM cases in the Netherlands. Eur. Heart J. 2003, 24, 1848–1853. [Google Scholar] [CrossRef] [Green Version]
- Carrier, L.; Mearini, G.; Stathopoulou, K.; Cuello, F. Cardiac myosin-binding protein C (MYBPC3) in cardiac pathophysiology. Gene 2015, 573, 188–197. [Google Scholar] [CrossRef]
- Lopes, L.; Rahman, M.S.; Elliott, P.M. A systematic review and meta-analysis of genotype–phenotype associations in patients with hypertrophic cardiomyopathy caused by sarcomeric protein mutations. Heart 2013, 99, 1800–1811. [Google Scholar] [CrossRef] [PubMed]
- Woo, A. Mutations of the myosin heavy chain gene in hypertrophic cardiomyopathy: Critical functional sites determine prognosis. Heart 2003, 89, 1179–1185. [Google Scholar] [CrossRef] [PubMed] [Green Version]
- Tower-Rader, A.; Desai, M.Y. Phenotype–Genotype Correlation in Hypertrophic Cardiomyopathy. Circ. Cardiovasc. Imaging 2017, 10. [Google Scholar] [CrossRef] [Green Version]
- Bongini, C.; Ferrantini, C.; Girolami, F.; Coppini, R.; Arretini, A.; Targetti, M.; Bardi, S.; Castelli, G.; Torricelli, F.; Cecchi, F.; et al. Impact of Genotype on the Occurrence of Atrial Fibrillation in Patients With Hypertrophic Cardiomyopathy. Am. J. Cardiol. 2016, 117, 1151–1159. [Google Scholar] [CrossRef]
- Lee, S.-P.; Ashley, E.A.; Homburger, J.; Caleshu, C.; Green, E.M.; Jacoby, D.; Colan, S.D.; Arteaga-Fernández, E.; Day, S.M.; Girolami, F.; et al. Incident Atrial Fibrillation Is Associated with MYH7 Sarcomeric Gene Variation in Hypertrophic Cardiomyopathy. Circ. Heart Fail. 2018, 11, e005191. [Google Scholar] [CrossRef]
- Maron, B.J.; Casey, S.A.; Poliac, L.C.; Gohman, T.E.; Almquist, A.K.; Aeppli, D.M. Clinical Course of Hypertrophic Cardiomyopathy in a Regional United States Cohort. JAMA 1999, 281, 650–655. [Google Scholar] [CrossRef] [PubMed]
- Haland, T.F.; Almaas, V.M.; Hasselberg, N.E.; Saberniak, J.; Leren, I.S.; Hopp, E.; Edvardsen, T.; Haugaa, K.H. Strain echocardiography is related to fibrosis and ventricular arrhythmias in hypertrophic cardiomyopathy. Eur. Heart J.-Cardiovasc. Imaging 2016, 17, 613–621. [Google Scholar] [CrossRef] [PubMed] [Green Version]
- Tower-Rader, A.; Mohananey, D.; To, A.; Lever, H.M.; Popovic, Z.B.; Desai, M.Y. Prognostic Value of Global Longitudinal Strain in Hypertrophic Cardiomyopathy. JACC Cardiovasc. Imaging 2018, 12, 1930–1942. [Google Scholar] [CrossRef] [PubMed]
- Geske, J.B.; Bos, J.M.; Gersh, B.J.; Ommen, S.R.; Eidem, B.W.; Ackerman, M.J. Deformation patterns in genotyped patients with hypertrophic cardiomyopathy. Eur. Heart J.-Cardiovasc. Imaging 2013, 15, 456–465. [Google Scholar] [CrossRef] [Green Version]


| Chamber | Parameter |
|---|---|
| Left ventricle | LVEF, Simpson’s biplane (%) LVEF, triplane, 2dCPA (%) |
| Transmitral E velocity (cm/s) | |
| Septal annular e′ velocity (cm/s) | |
| Lateral annular e′ velocity (cm/s) | |
| LV E/e′ (average) ratio LV GLS, auto-strain (%) LV GLS, 2dCPA (%) | |
| Left atrium | LAVi (mL/m2) |
| Right ventricle | RV basal ED diameter (mm) |
| RV wall thickness (mm) | |
| TAPSE (mm) TRVmax (m/s) | |
| Fractional area change (%) RVLS 6 segments, 2dCPA (%) RVLS free wall, 2dCPA (%) | |
| Right atrium | RAVi (mL/m2) |
| Whole Cohort (n = 57) | MYBPC3 (n = 39) | MYH7 (n = 18) | t-Test/Pearson Chi2-Test | |
|---|---|---|---|---|
| Characteristics | n (%) or Mean ± SD or Median (IQR) | n (%) or Mean ± SD or Median (IQR) | n (%) or Mean ± SD or Median (IQR) | p Value |
| Female | 28 (49.1) | 16 (41.0) | 12 (66.7) | p = 0.072 |
| Age (years) | 49.07 ± 15.24 | 51.82 ± 14.40 | 41.44 ± 13.95 | p = 0.013 |
| Age at first diagnosis (years) 1 | 40.78 ± 15.55 | 41.80 ± 14.61 | 36.4 ±16.91 | p = 0.259 |
| BMI (kg/m2) 2 | 27.52 ± 5.90 | 26.55 ± 4.47 | 29.59 ± 7.91 | p = 0.143 |
| RR systolic (mmHg) 2 | 134.73 ± 18.31 | 135.88 ± 19.13 | 132.33 ± 16.71 | p = 0.505 |
| RR diastolic (mmHg) 2 | 80.32 ± 10.04 | 79.71 ± 10.18 | 81.61 ± 9.91 | p = 0.513 |
| Heartrate (beats/min) | 67.39 ± 10.20 | 68.44 ± 10.04 | 65.11 ± 10.44 | p = 0.256 |
| NYHA > II | 19 (33.3) | 15 (38.5) | 4 (22.3) | p = 0.227 |
| LVOT obstruction | 22 (38.6) | 16 (41.0) | 6 (33.3) | p = 0.579 |
| Loop diuretics | 8 (14.0) | 8 (20.5) | 0 | p = 0.038 |
| MRA | 5 (8.8) | 4 (10.3) | 1 (5.6) | p = 0.560 |
| Verapamil | 5 (8.8) | 4 (10.3) | 1 (5.6) | p = 0.560 |
| Amiodarone | 3 (5.3) | 2 (5.1) | 1 (5.6) | p = 0.946 |
| ACEI/ARB/ARNI | 12 (21.2) | 11 (28.2) | 1 (5.6) | p = 0.051 |
| NTproBNP (pg/mL) | 536 (193, 1470) | 817 (197, 2802) | 390 (164, 789) | p = 0.158 |
| eGFR (ml/min/1.73 m) | 86.89 ± 27.07 | 80.55 ± 22.4 | 100.62 ± 31.62 | p = 0.008 |
| History | ||||
| Surgical myectomy | 3 (5.3) | 1 (2.6) | 2 (11.1) | p = 0.179 |
| PTSMA | 9 (15.8) | 7 (17.9) | 2 (11.1) | p = 0.510 |
| Mitral valve replacement/repair | 0 | 0 | 0 | |
| Survived sudden cardiac death | 7 (12.3) | 6 (15.4) | 1 (5.6) * | p = 0.293 |
| Hospitalization for WHF | 8 (14.0) | 7 (17.9) | 1 (5.6) | p = 0.211 |
| Arterial hypertension | 23 (40.4) | 17 (43.6) | 6 (33.3) | p = 0.463 |
| Stroke | 4 (7.0) | 4 (10.3) | 0 | p = 0.132 |
| PE | 3 (5.3) | 2 (5.1) | 1 (5.6) | p = 0.946 |
| AF | 13 (22.8) | 12 (30.8) | 1 (5.6) | p = 0.035 |
| permanent | 4 (30.8 **) | 4 (33.3 **) | 0 | p = 0.159 |
| paroxysmal | 8 (61.5 **) | 8 (66.7 **) | 1 (100 **) | p = 0.150 |
| ECG | ||||
| Sinus rhythm | 48 (84.3) | 30 (77) | 18 (100) | p = 0.026 |
| Ventricular stimulated rhythm | 5 (8.8) | 5 (12.8) | 0 | p = 0.112 |
| Atrial fibrillation | 4 (7.0) | 4 (10.3) | 0 | p = 0.159 |
| QRS duration (ms) | 111.43 ± 33.67 | 113.8 5 ± 37.72 | 104.67 ± 21.65 | p = 0.251 |
| LBBB | 19 (33.3) | 11 (28.2) | 8 (44.4) | p = 0.227 |
| RBBB | 11 (19.3) | 8 (20.5) | 3 (16.7) | p = 0.732 |
| Devices | ||||
| Pacemaker | 15 (26.3) | 15 (38.5) | 0 | p = 0.002 |
| CRT | 1 (1.8) | 1 (2.6) | 0 | p = 0.493 |
| ICD | 15 (26.3) | 15 (38.5) | 0 * | p = 0.002 |
| ICD shock | 4 (26.7 **) | 4 (26.7 **) | ||
| Primary prevention | 9 (60.0 **) | 9 (60.0 **) | ||
| Secondary prevention | 6 (40.0 **) | 6 (40.0 **) |
| MYBPC3 (n = 39) | MYH7 (n = 18) | t-Test | ANCOVA | |||
|---|---|---|---|---|---|---|
| Not Adjusted | Adjusted | Not Adjusted | Adjusted | |||
| Mean ± SD or Median (IQR) | Mean ± SE | Mean ± SD or Median (IQR) | Mean ± SE | p Value | p Value | |
| Sinus rhythm during TTE n (%) | 30 (77) | 18 (100) | ||||
| heart rate during TTE (beats/min) | 68.44 ± 10.04 | 68.9 ± 1.7 | 65.11 ± 10.44 | 64.0 ± 2.6 | p = 0.256 | p = 0.139 |
| LV average loops | 2 ± 0 | 2 ± 0 | ||||
| RV average loops | 2.53 ± 0.6 | 2.47 ± 0.7 | ||||
| LV | ||||||
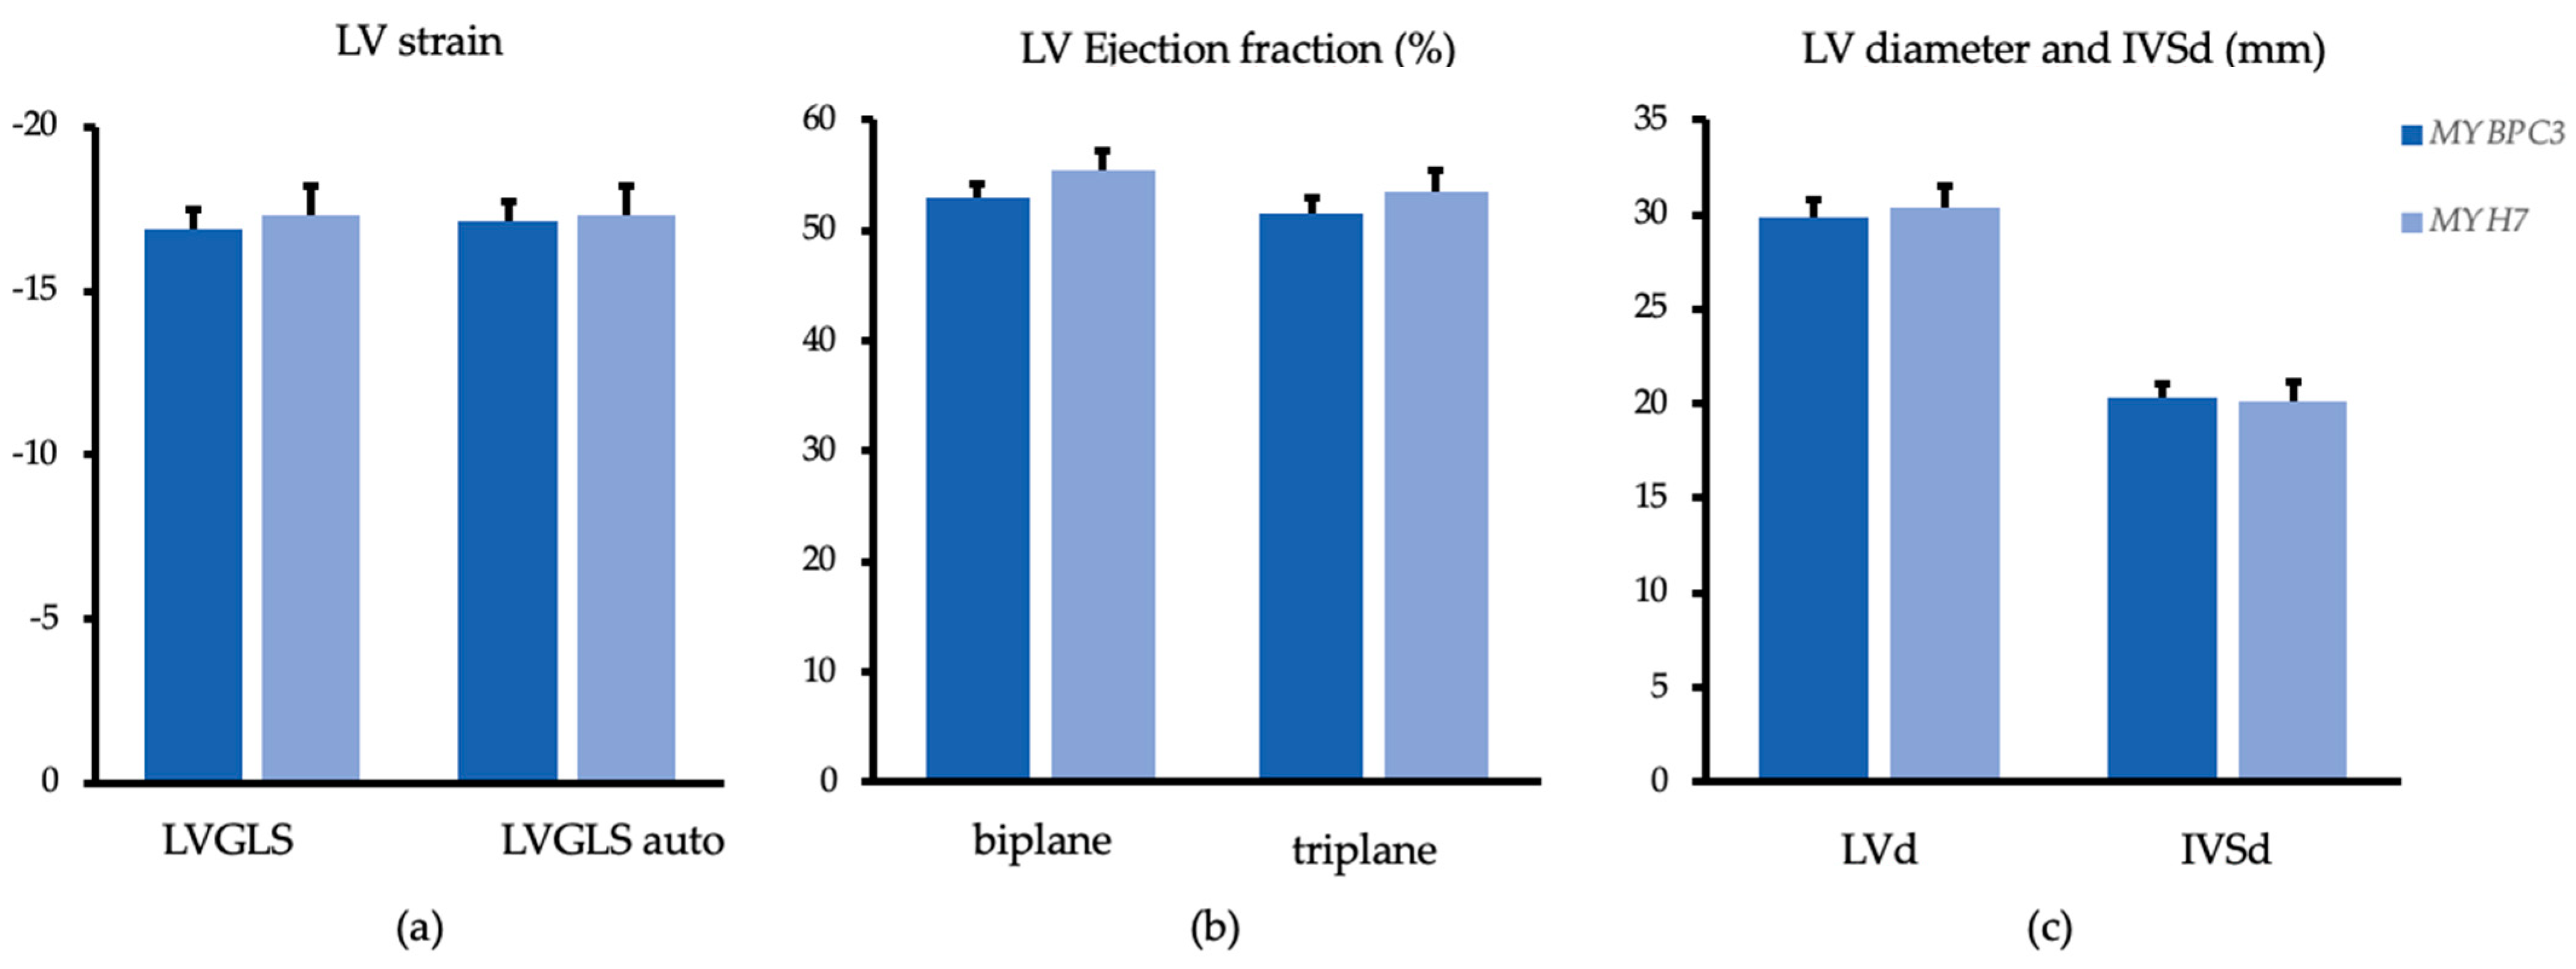
| LVGLS auto 1 | −16.7 ± 4.1 | −17.2 ± 0.6 | −18.3 ± 2.6 | −17.3 ± 0.9 | p = 0.138 | p = 0.892 |
| LVGLS 2dCPA | −16.5 ± 4.0 | −16.9 ± 0.6 | −18.3 ± 2.8 | −17.3 ± 0.9 | p = 0.088 | p = 0.807 |
| LVEF Simpson biplane (%) 2 | 52.9 ± 8.0 | 53.03 ± 1.2 | 56.3 ± 4.8 | 55.4 ± 1.8 | p = 0.100 | p = 0.338 |
| LVEF triplane (%) | 51.1 ± 8.6 | 51.6 ± 1.3 | 54.7 ± 4.8 | 53.5 ± 1.9 | p = 0.105 | p = 0.410 |
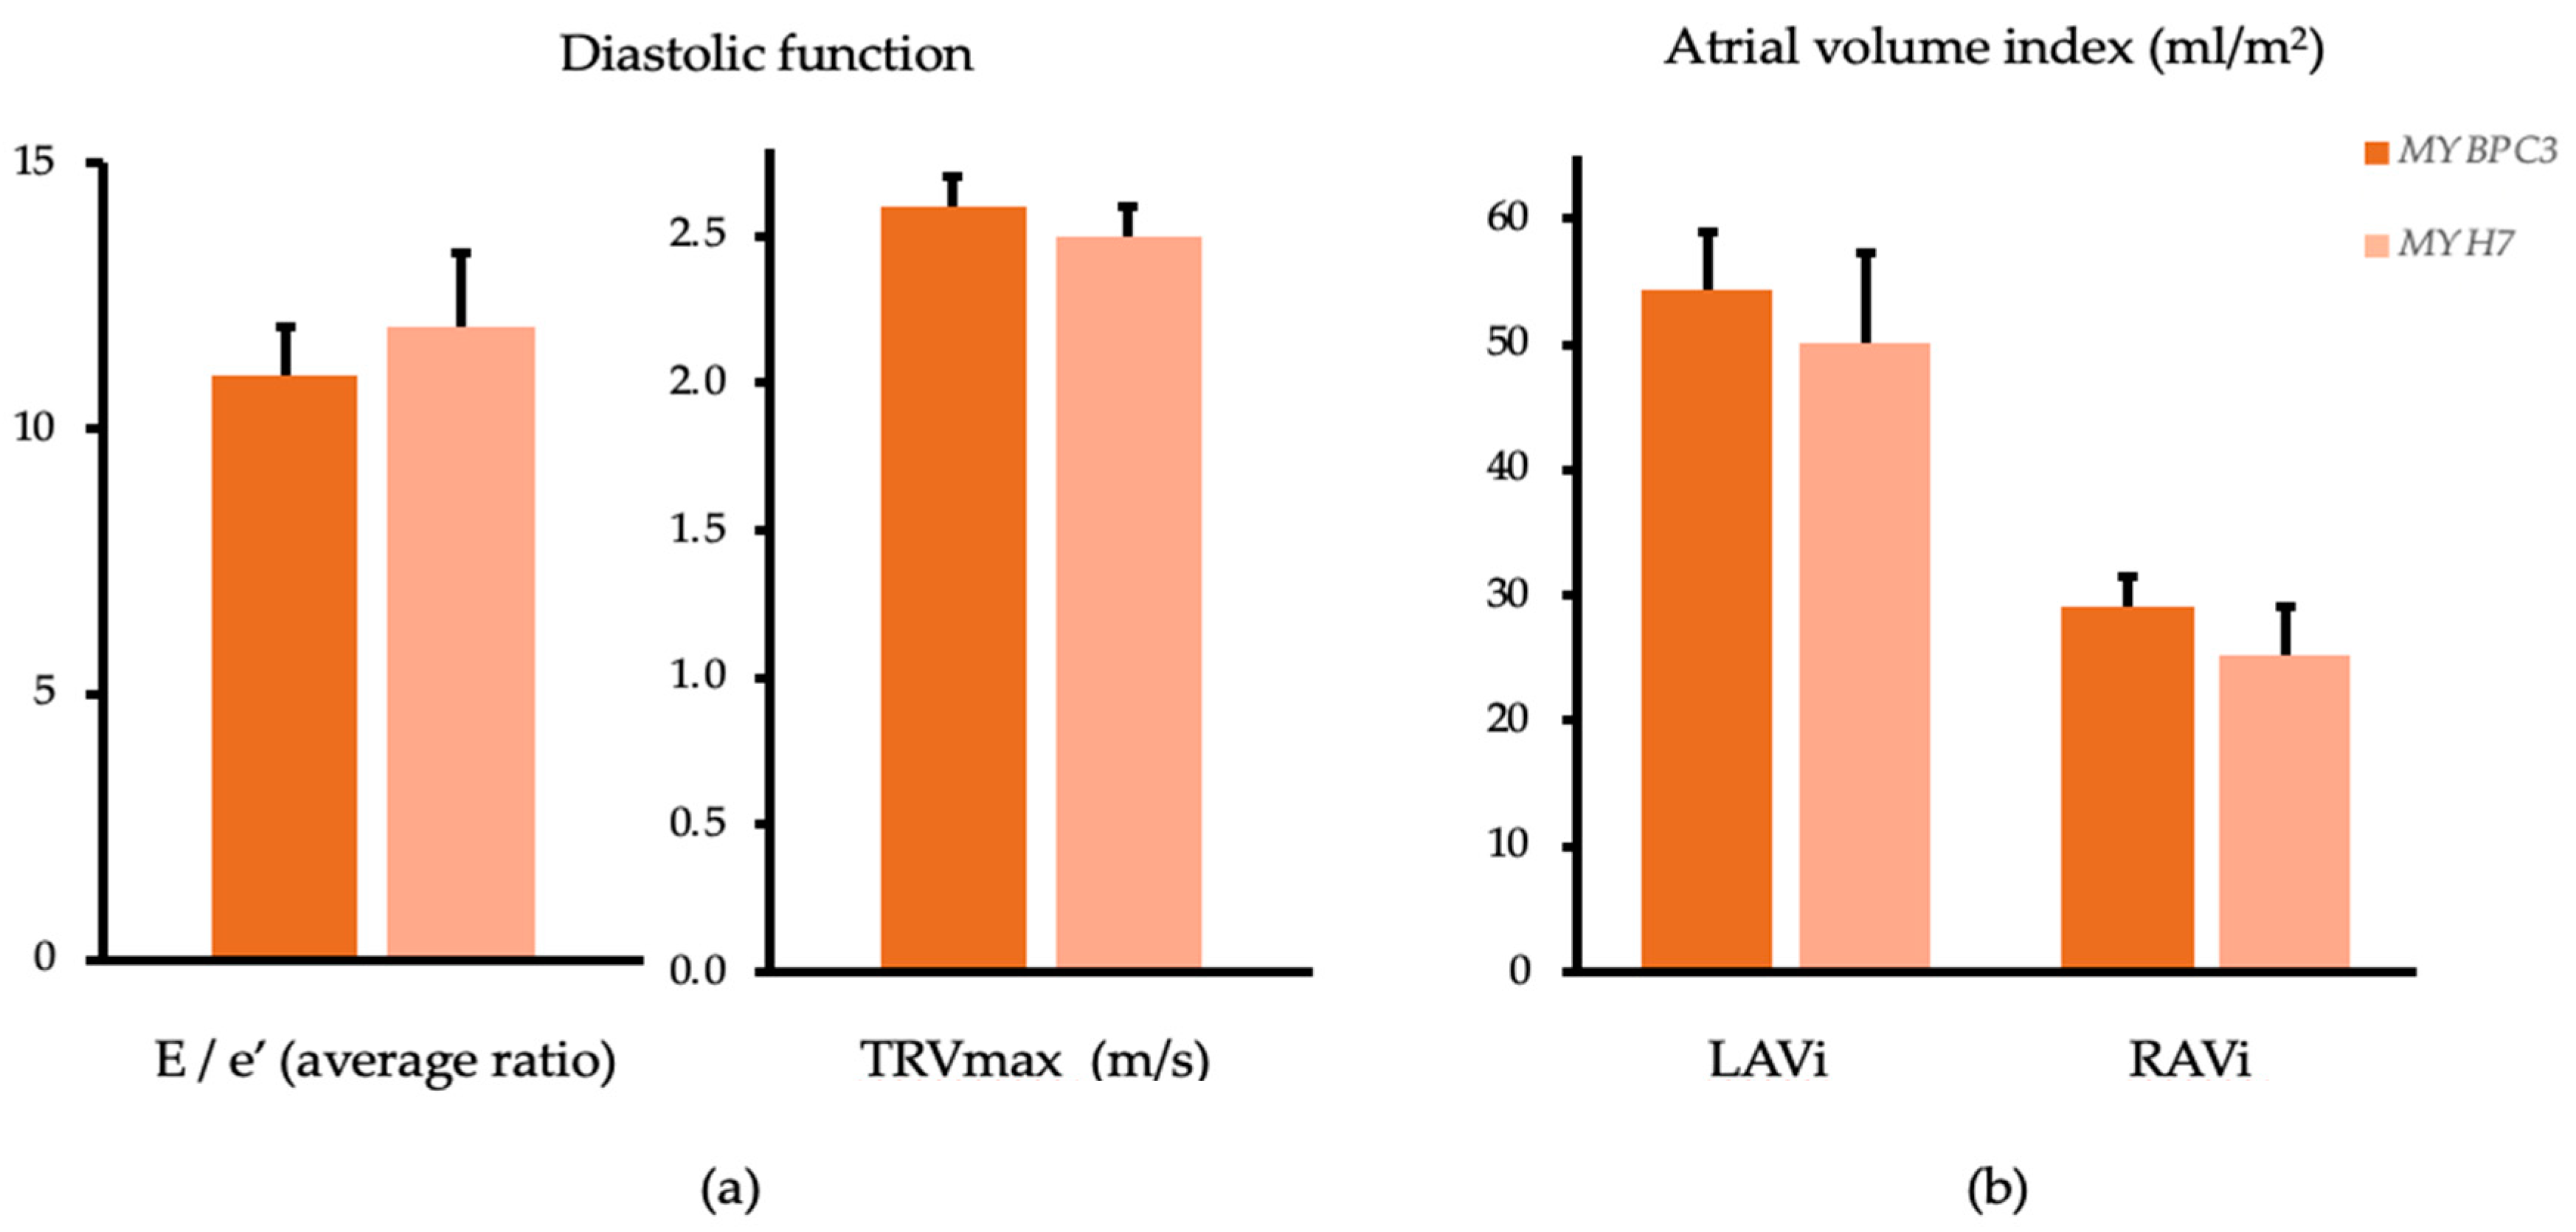
| E/e′ average (ratio) 3 | 11.4 ± 5.8 | 11.0 ± 0.9 | 11.1 ± 4.6 | 11.9 ± 1.4 | p = 0.652 | p = 0.630 |
| E (cm/s) 3 | 83.0 ± 27.1 | 84.3 ± 4.6 | 79.4 ± 22.6 | 76.7 ± 7.1 | p = 0.647 | p = 0.397 |
| e′ average (cm/s) 3 | 8.1 ± 2.7 | 8.5 ± 0.4 | 7.7 ± 2.4 | 6.8 ± 0.6 | p = 0.892 | p = 0.026 |
| IVSd maximal (mm) | 20.8 ± 4.6 | 20.3 ± 0.8 | 19.2 ± 4.8 | 20.1 ± 1.1 | p = 0.226 | p = 0.897 |
| IVSd basal (mm) | 15.2 ± 3.8 | 14.9 ± 0.6 | 13.5 ± 3.8 | 14.3 ± 0.9 | p = 0.125 | p = 0.626 |
| IVSd midventricular (mm) | 20.7 ± 4.6 | 20.2 ± 0.8 | 19.1 ± 4.7 | 20.1 ± 1.1 | p = 0.233 | p = 0.911 |
| IVSd apical (mm) | 14.4 ± 4.6 | 14.1 ± 0.7 | 13.7 ± 4.3 | 14.3 ± 1.1 | p = 0.593 | p = 0.868 |
| LVEDd (cm) | 3.03 ± 0.54 | 2.98 ± 0.1 | 2.94 ± 0.36 | 3.04 ± 0.11 | p = 0.527 | p = 0.693 |
| LAVi MOD (mL/m2) 4 | 50.2 (37.8, 68.8) | 54.3 ± 4.7 | 42.5 (33.5, 49.9) | 50.1 ± 7.2 | p = 0.097 | p = 0.637 |
| RV | ||||||
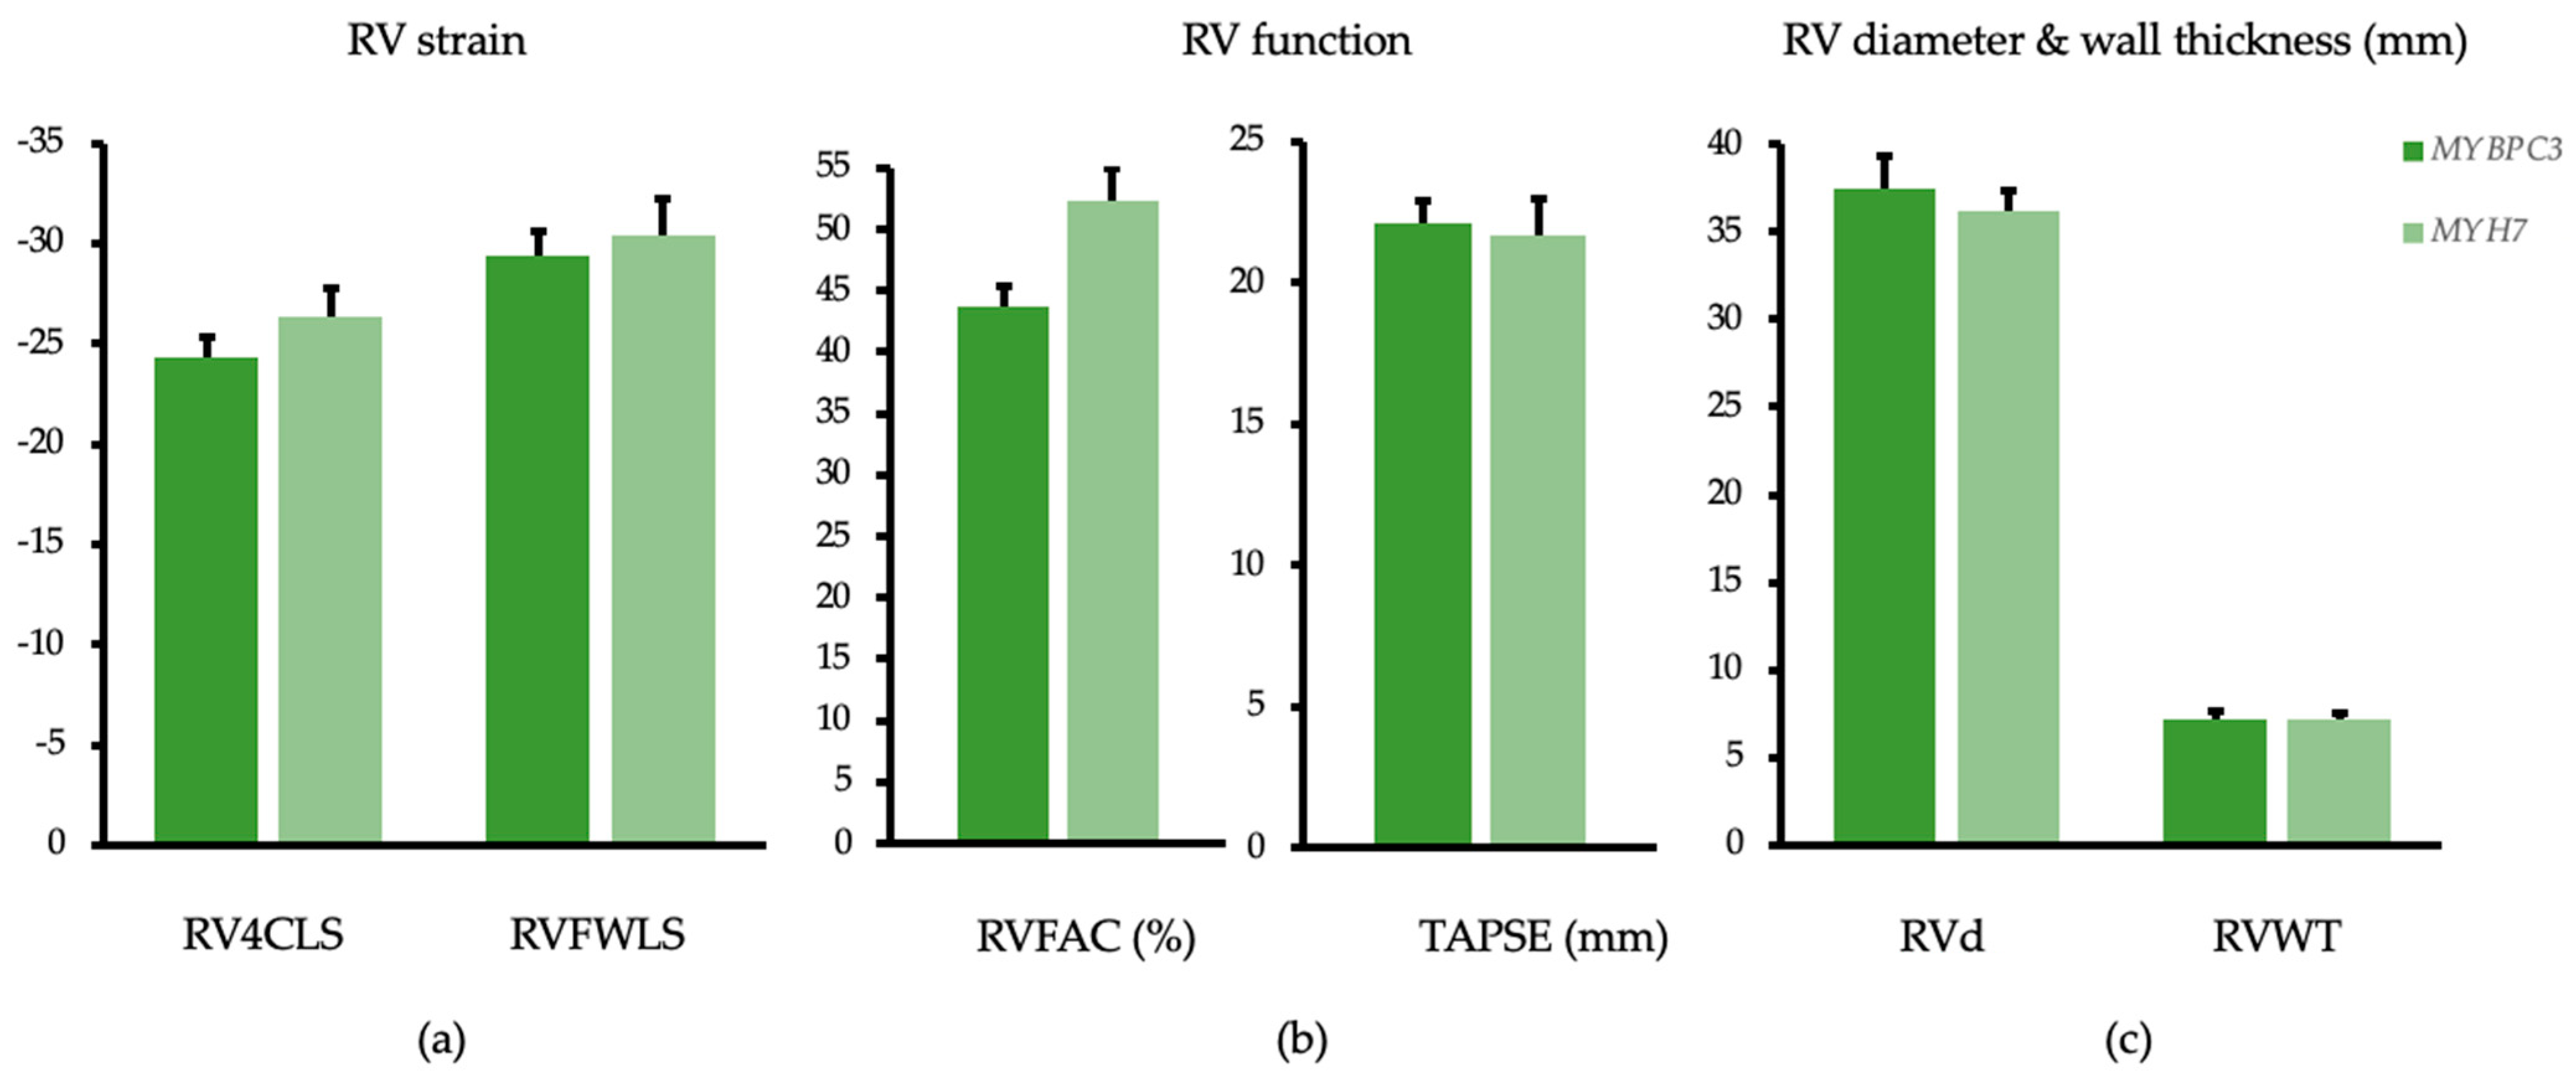
| RVLS 6 segments 2dCPA 5 | −24.1 ± 6.3 | −24.3 ± 1.0 | −26.9 ± 3.8 | −26.3 ± 1.5 | p = 0.062 | p = 0.285 |
| RVLS free wall 2dCPA 5 | −29.1 ± 7.4 | −29.4 ± 1.2 | −30.9 ± 4.2 | −30.4 ± 1.8 | p = 0.395 | p = 0.643 |
| RVFAC (%) 2 | 43.5 ± 10.9 | 43.7 ± 1.7 | 52.8 ± 7.4 | 52.4 ± 2.5 | p = 0.002 | p = 0.007 |
| TRVmax (m/s) 6 | 2.6 ± 0.4 | 2.6 ± 0.1 | 2.5 ± 0.2 | 2.5 ± 0.1 | p = 0.206 | p = 0.390 |
| TAPSE (mm) 7 | 21.9 ± 4.5 | 22.1 ± 0.8 | 22.2 ± 5.0 | 21.7 ± 1.3 | p = 0.823 | p = 0.798 |
| RVEDd basal (mm) 2 | 38.4 ± 7.1 | 37.5 ± 1.2 | 34.3 ± 8.2 | 36.2 ± 1.8 | p = 0.059 | p = 0.551 |
| RVWT (mm) 8 | 7.2 ± 1.7 | 7.2 ± 0.3 | 7.2 ± 2.0 | 7.2 ± 0.5 | p = 0.950 | p = 0.917 |
| RA Area (cm2) 9 | 18.5 ± 1.0 | 18.3 ± 1.0 | 16.6 ± 1.6 | 17.3 ± 1.6 | p = 0.045 | p = 0.619 |
| RAVi (mL/m2) 2,9 | 31.4 ± 19.1 | 29.1 ± 2.5 | 20.3 ± 7.4 | 25.3 ± 3.9 | p = 0.003 | p = 0.443 |
Publisher’s Note: MDPI stays neutral with regard to jurisdictional claims in published maps and institutional affiliations. |
© 2021 by the authors. Licensee MDPI, Basel, Switzerland. This article is an open access article distributed under the terms and conditions of the Creative Commons Attribution (CC BY) license (https://creativecommons.org/licenses/by/4.0/).
Share and Cite
Höller, V.; Seebacher, H.; Zach, D.; Schwegel, N.; Ablasser, K.; Kolesnik, E.; Gollmer, J.; Waltl, G.; Rainer, P.P.; Verheyen, S.; et al. Myocardial Deformation Analysis in MYBPC3 and MYH7 Related Sarcomeric Hypertrophic Cardiomyopathy—The Graz Hypertrophic Cardiomyopathy Registry. Genes 2021, 12, 1469. https://doi.org/10.3390/genes12101469
Höller V, Seebacher H, Zach D, Schwegel N, Ablasser K, Kolesnik E, Gollmer J, Waltl G, Rainer PP, Verheyen S, et al. Myocardial Deformation Analysis in MYBPC3 and MYH7 Related Sarcomeric Hypertrophic Cardiomyopathy—The Graz Hypertrophic Cardiomyopathy Registry. Genes. 2021; 12(10):1469. https://doi.org/10.3390/genes12101469
Chicago/Turabian StyleHöller, Viktoria, Heidelis Seebacher, David Zach, Nora Schwegel, Klemens Ablasser, Ewald Kolesnik, Johannes Gollmer, Gert Waltl, Peter P. Rainer, Sarah Verheyen, and et al. 2021. "Myocardial Deformation Analysis in MYBPC3 and MYH7 Related Sarcomeric Hypertrophic Cardiomyopathy—The Graz Hypertrophic Cardiomyopathy Registry" Genes 12, no. 10: 1469. https://doi.org/10.3390/genes12101469