Article

A Comparative Transcriptome Analysis of Volvariella volvacea Identified the Candidate Genes Involved in Fast Growth at the Mycelial Growth Stage

1
Vegetables Research Institute, Guangdong Academy of Agricultural Sciences, Guangdong Key Laboratory for New Technology Research of Vegetables, Guangzhou 510640, China
2
Agro-Biological Gene Research Center, Guangdong Academy of Agricultural Sciences, Guangzhou 510640, China
3
School of Light Industry and Engineering, South China University of Technology, Guangzhou 510640, China
4
Department of Microbiology and Molecular Genetics, Michigan State University, East Lansing, MI 48824, USA
*
Authors to whom correspondence should be addressed.
These authors have contributed equally to this work.
Genes 2020, 11(2), 161; https://doi.org/10.3390/genes11020161
Submission received: 20 January 2020 / Accepted: 1 February 2020 / Published: 4 February 2020
(This article belongs to the Section Microbial Genetics and Genomics)

Abstract

:
The edible straw mushroom, Volvariella volvacea, is one of the most important cultivated mushrooms in tropical and sub-tropical regions. Strain improvement for V. volvacea is difficult because of the unknown mechanisms involved in its growth regulation and substrate utilization. A comparative physiological and transcriptomic study was conducted between two commercially available straw mushroom strains (v9 and v26) to explore their fast-growth regulation mechanism(s). The physiological study showed that V. volvacea v9 had a shorter growth cycle and higher biological efficiency (4% higher) than that in v26. At least 14,556 unigenes were obtained from the four cDNA libraries (two replicates per strain). Among them, the expression of 1597 unigenes was up-regulated while 1352 were down-regulated. Four heat-shock proteins were highly expressed in v9, showing that v9 has the better ability to handle stresses and/or environmental changes. Moreover, up to 14 putative transporter genes were expressed at a higher level in v9 than those in v26, implying that v9 has a better ability to transport nutrients or export xenobiotics efficiently. Our report allows to identify the candidate genes involved in the fast growth requirement of V. volvacea, which represents a valuable resource for strain improvement in this commercially important edible mushroom.

1. Introduction

Straw mushroom (Volvariella volvacea), also called Chinese mushroom, has a long history of cultivation in tropical and subtropical regions [1,2]. In China, at least 330,000 tons of straw mushroom were produced in 2010 (accounting for more than 80% of the global production). The yield ranked the fifth among the commercially cultivated mushrooms [3]. Besides its high nutrient value, V. volvacea also has medicinal importance, including antitumor polysaccharides, immunosuppressive proteins and immunomodulatory lectins [4,5]. Despite its high demand in the mushroom markets, the conversion efficiency of culture substrates into fungal fruit bodies is remarkably lower than those major cultivated species [6].
During the past decade, with the rapid development of high-throughput sequencing technologies, genome-wide expression analysis has been used for investigating genes involved in lignocellulose decomposition, secondary metabolites and fruiting body development in various edible mushrooms, including Schizophyllum commune [7], Ganoderma lucidum [8], Agaricus bisporus [9] and Lentinula edodes [10]. In V. volvacea [3,11,12], the genes responsible for tolerance of low temperature [13,14], the mating-type system and fruit-body development were also explored by comparative transcriptome analysis techniques [15].
Edible fungi with fast growth features are associated with a short growth cycle, a better substrate utilization efficiency and higher yields. However, the molecular mechanisms involved in V. volvacea fast-growth remain unexplored. Previous studies showed that the fast-growing strains showed higher activities of endoglucanase, laccase and polyphenol oxidase when cultivated on pasteurized substrates; further, a higher xylanase and β-glucosidase were found in mushroom when the composted substrates were used [16,17]. Fast-growing fungal strains utilize the mitogen-activated protein kinase (MAPK) pathways for mating, morphogenesis, stress tolerance and fruiting-body development. In this study, we conducted a comparative transcriptome analysis between a faster growing V. volvacea strain, v9, and a slower growing strain, v26, to identify the candidate genes involved in fast growth at the mycelial growth stage.

2. Results

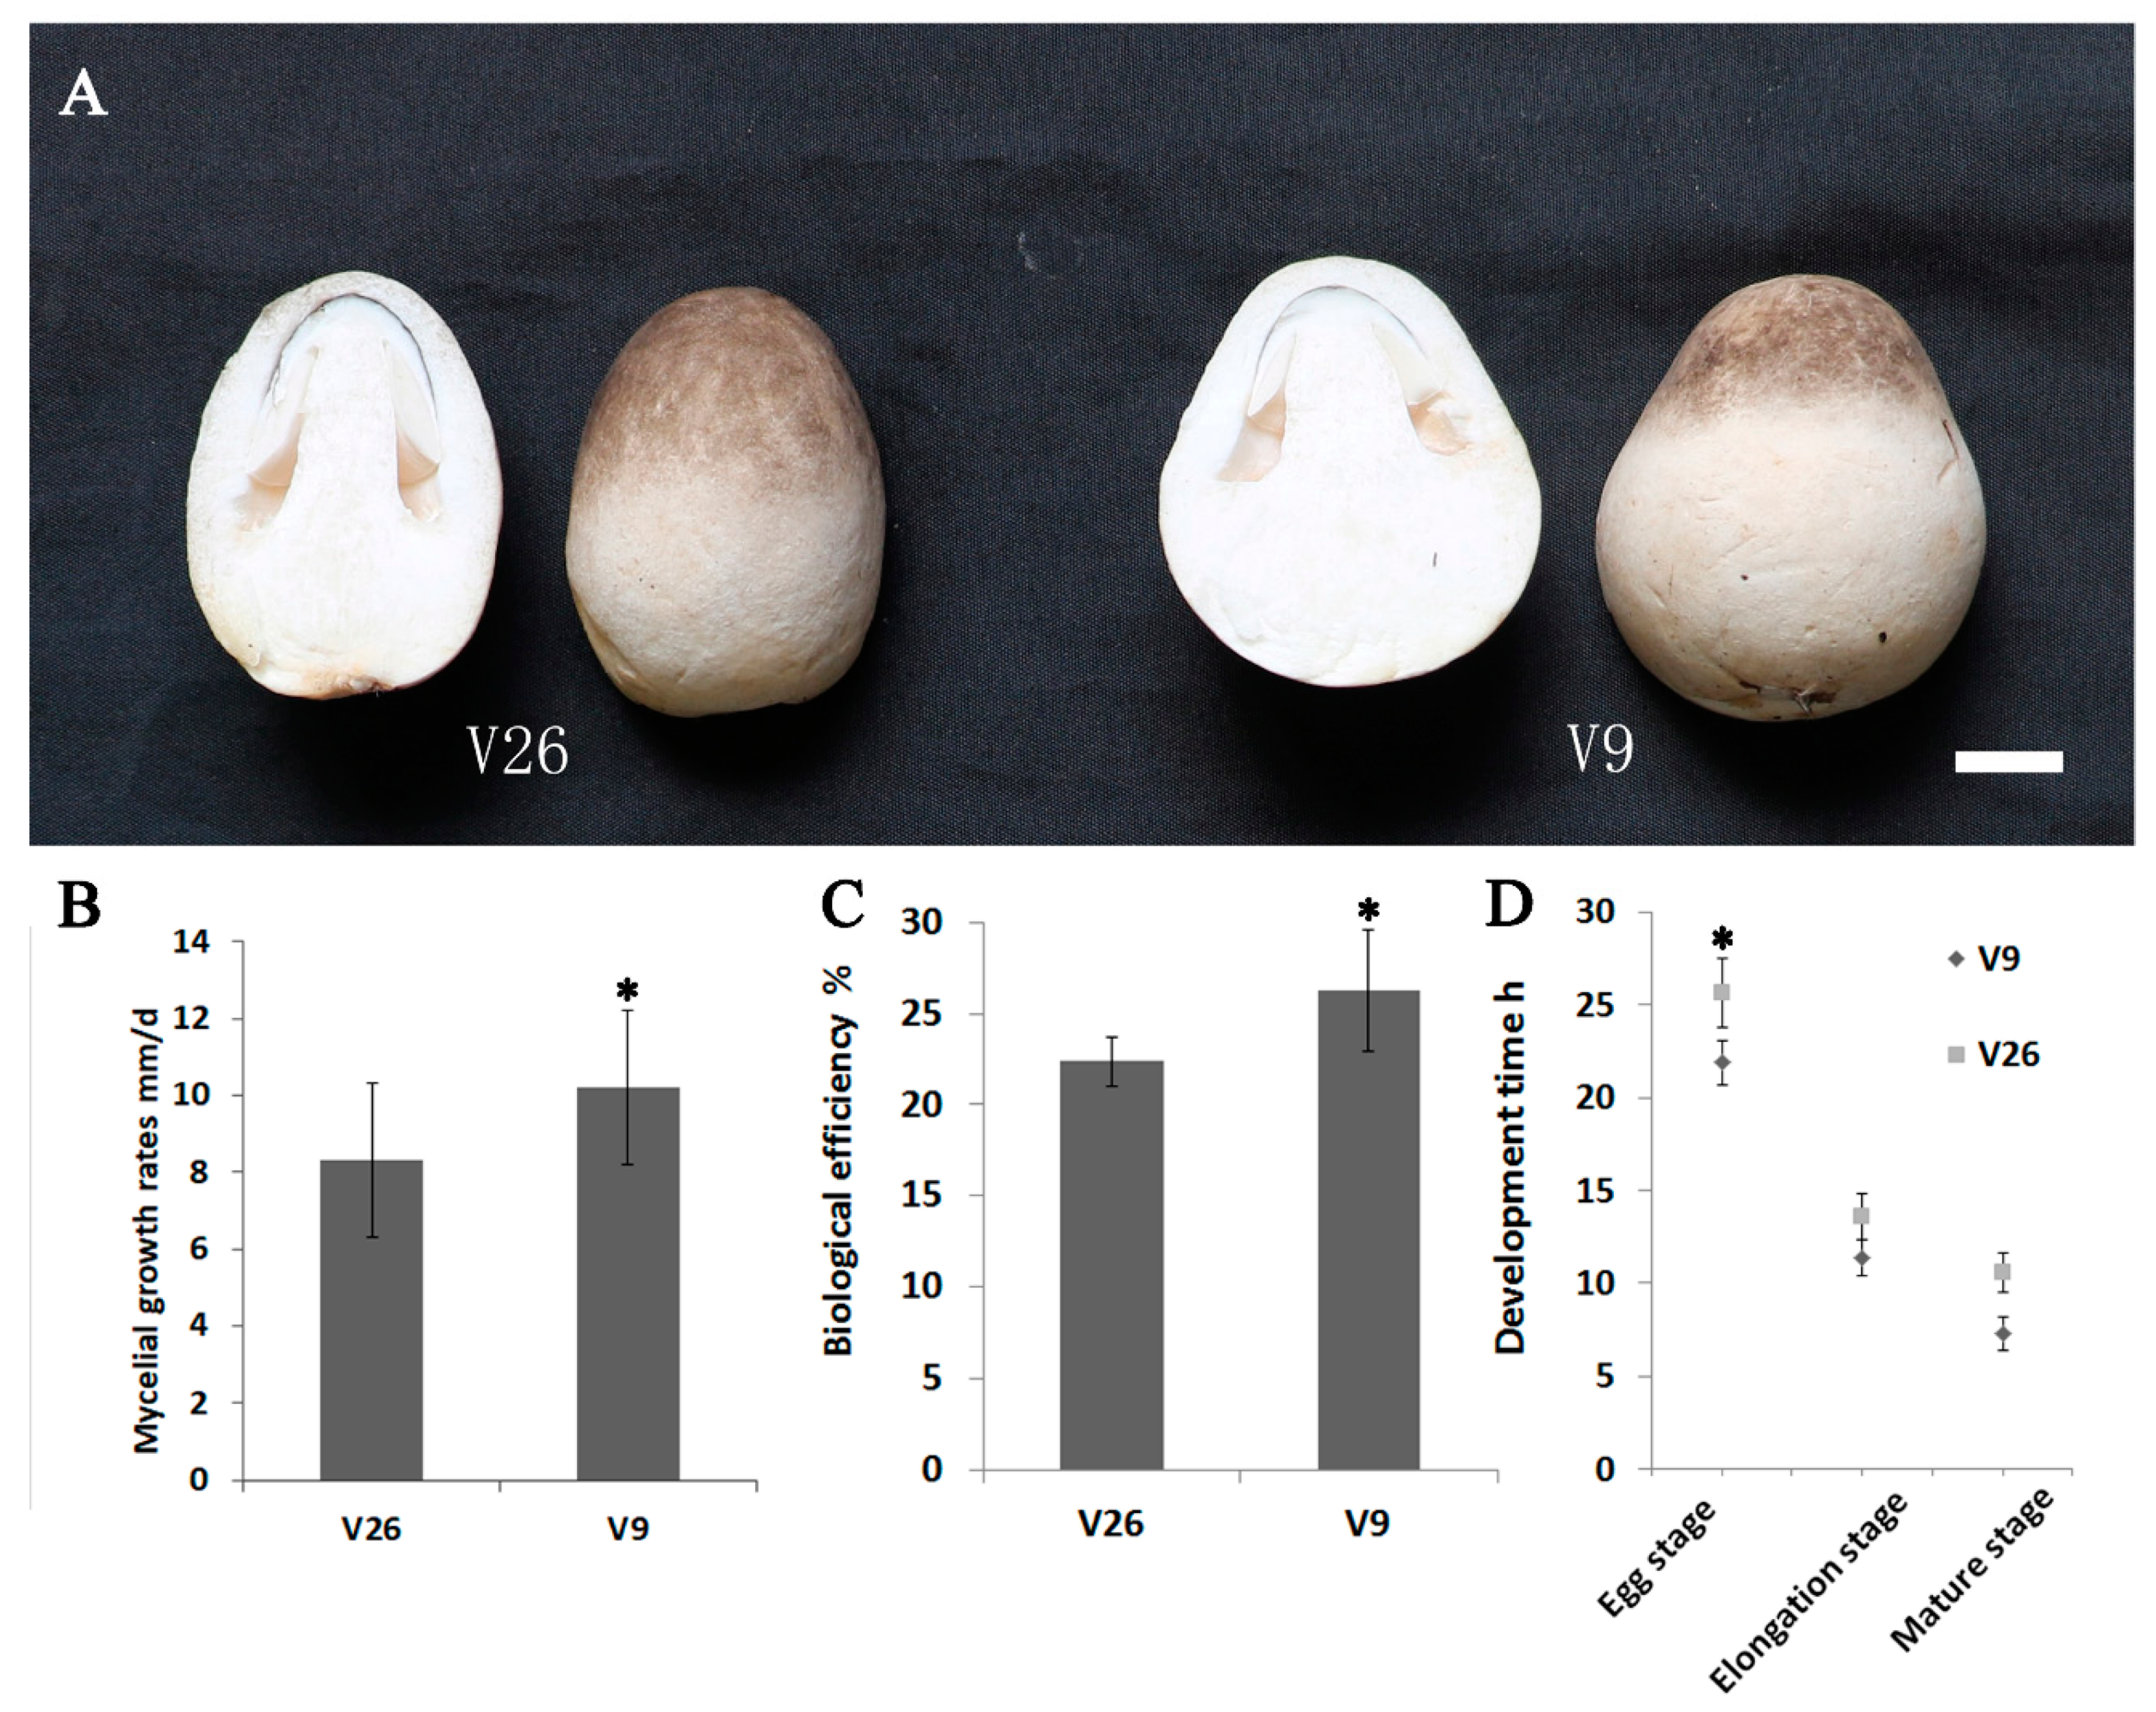
2.1. Comparations of the Growth Rates between V. volvacea Strain v9 and Strain v26

V. volvacea v9 had a bell-shaped fruit body with a gray-white color. It was noted that its basal surface contacted closely to the cultivated materials. However, the fruit body of strain v26 was oval-shaped with a gray color. The contact area between the fruiting body and the cultivated materials was smaller than that of v9 (Figure 1A). On the PDA media, mycelial growth rates of v9 and v26 were 10.2 ± 2 mm/d and 8.3 ± 2 mm/d, respectively (Figure 1B). The following formula for biological efficiency was used: biological efficiency (%) = fresh fruit body weight/substrate dry weight × 100. The biological efficiency of strain v9 was 26.3%, which was higher than strain v26 (22.3%) (Figure 1C). Three development stage periods were measured (egg stage, elongation stage and mature stage) [18]. In the egg stage, the stipe was hidden and ovoid; in the elongation stage, the stipe was stretched out of the universal veil and the pileus was not opened; in the mature stage, the pileus was fully expanded. The egg stage, elongation stage and mature stage time in strain v9 was 21.9, 11.5 and 7.3 h, respectively. Instead, the mature time for strain v26 was 25.6, 13.6 and 10.5 h, respectively (Figure 1D). Collectively, v9 had higher biological efficiency and a shorter mature time than v26.

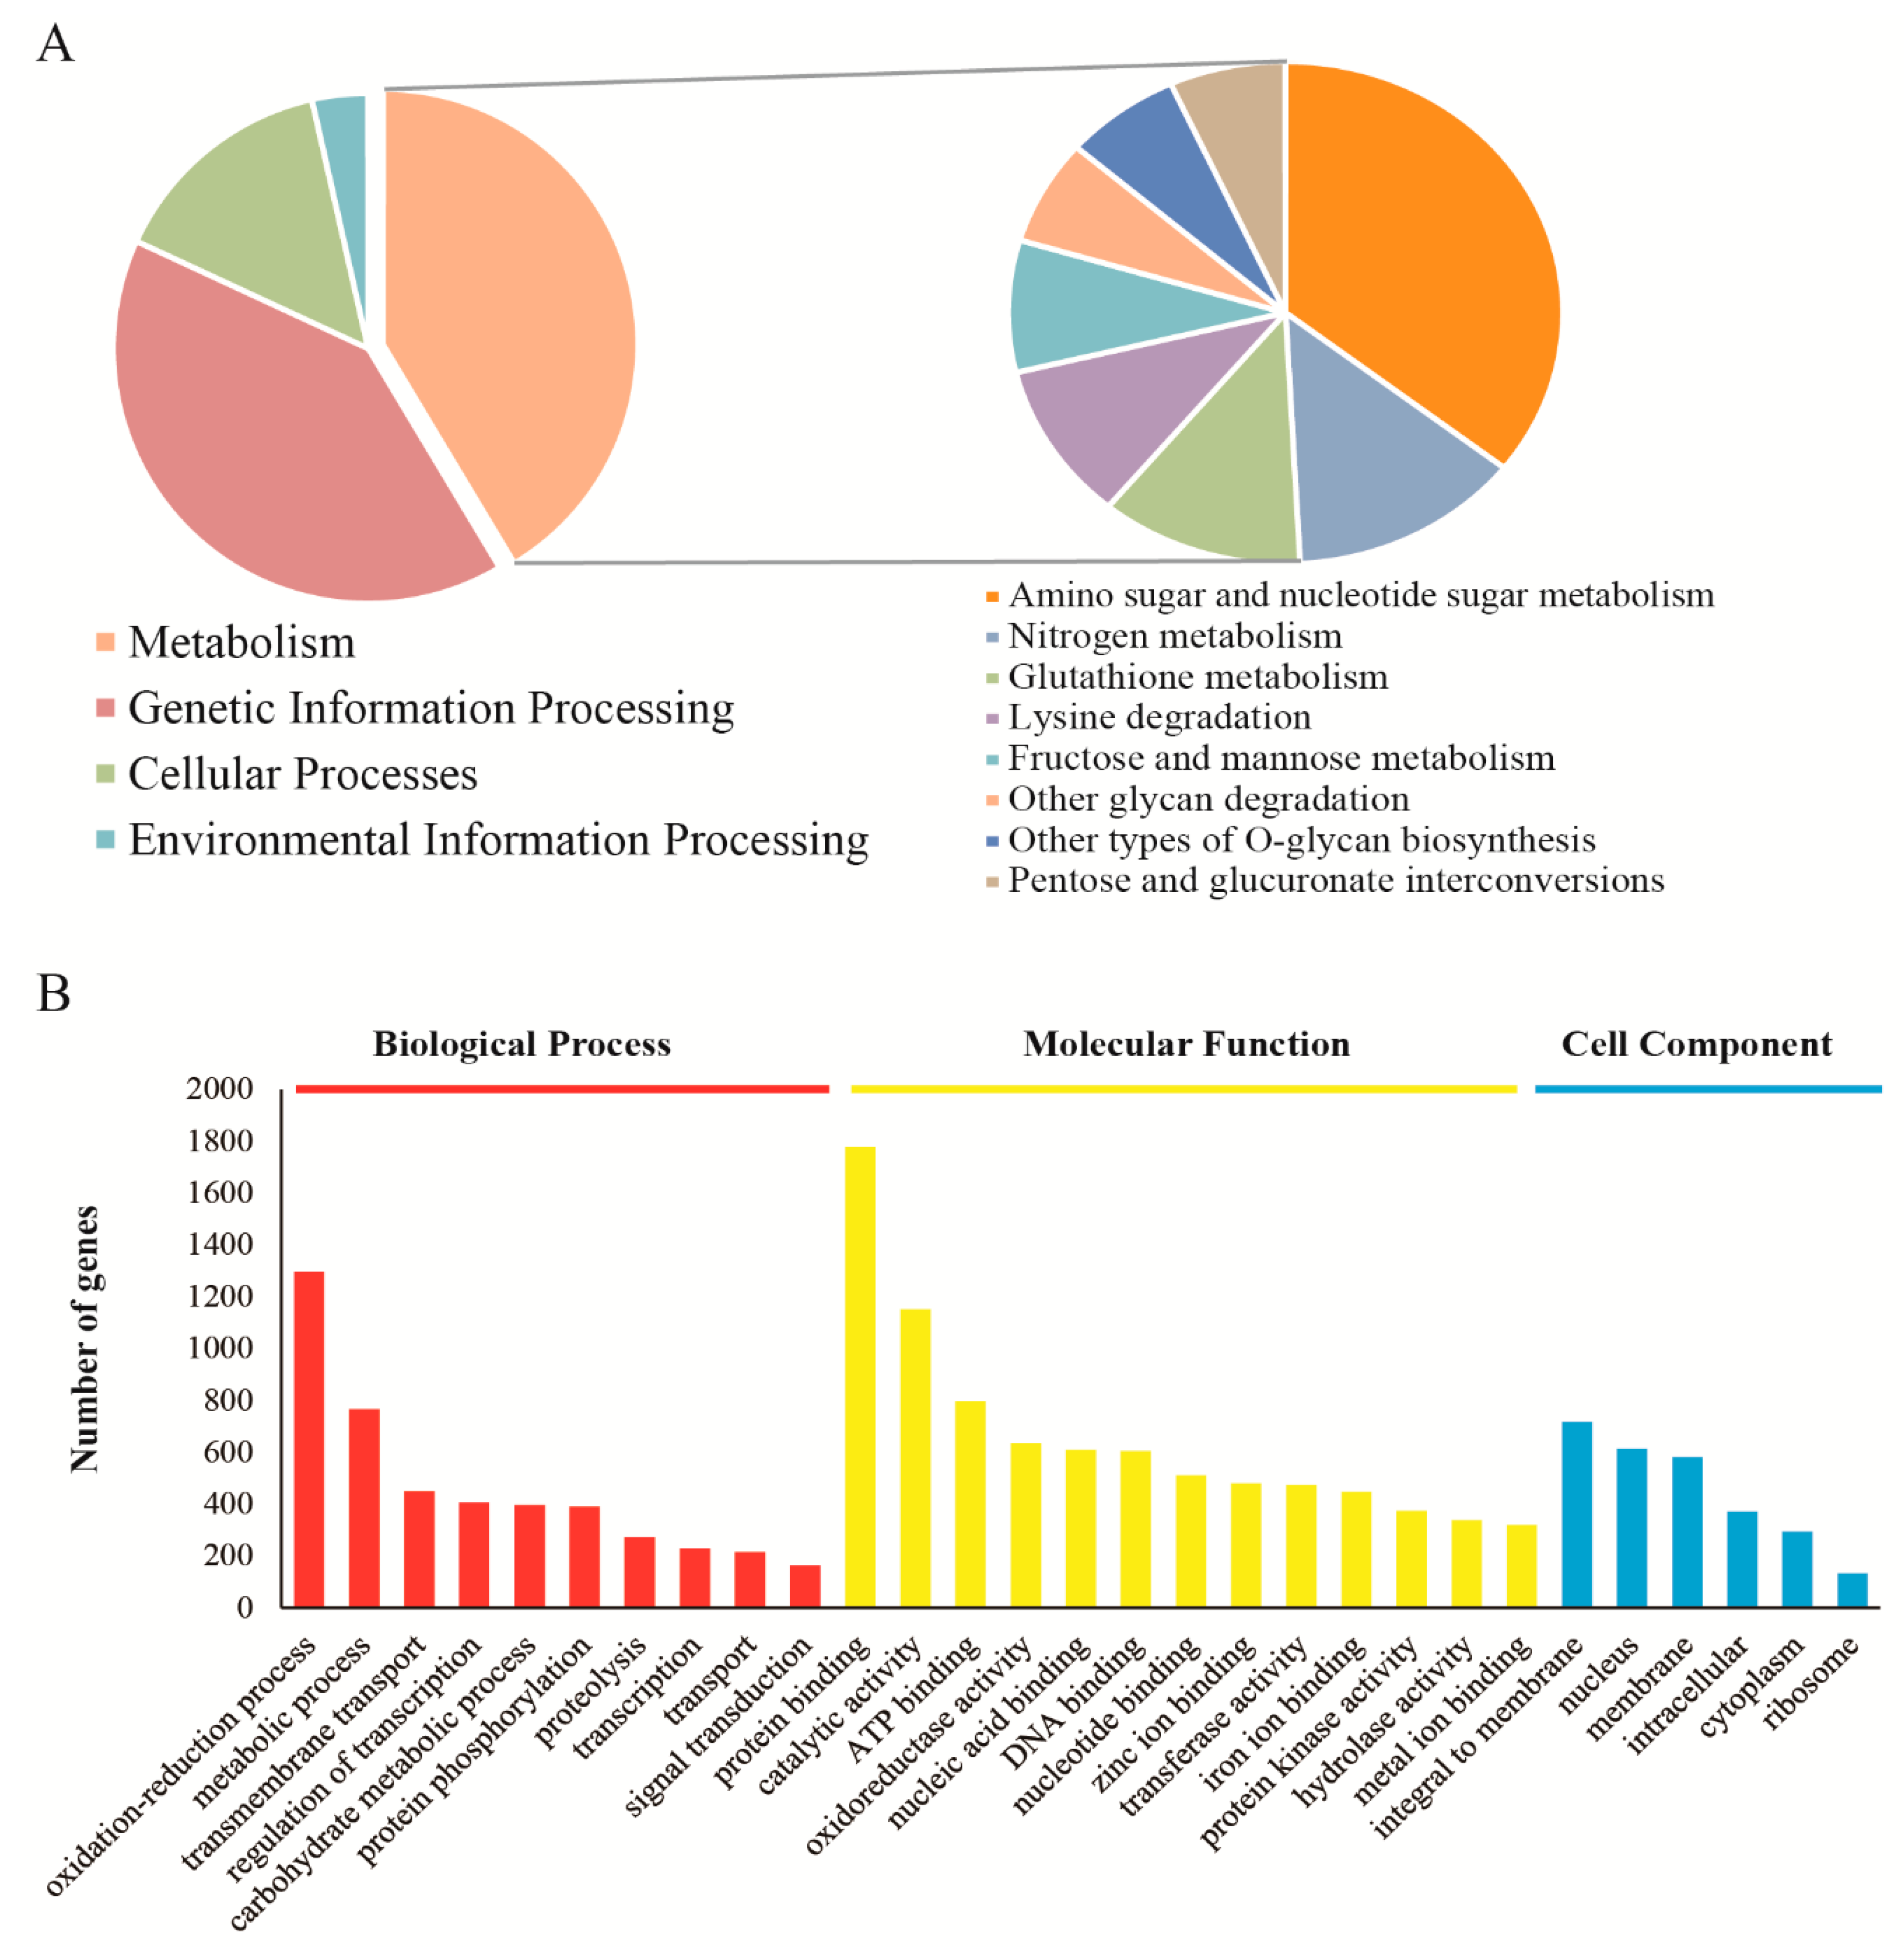
2.2. Sequencing, Assembly and Functional Annotation of V. volvacea

The four cDNA libraries from the mycelial growth stage yielded a total of 67 million raw reads. Up to 16 million reads per sample were obtained after the data filtering and trimming (Table 1). A total of 14,556 unigenes were assembled for all samples (Table 1). Among them, at least 85% of the unigenes were annotated using the databases of NR and KEGG (Table 1). A total of 58% and 43% of the unigenes encoded the “hypothetical proteins” in strains v9 and v26, respectively. The above observation agreed that many genes in V. volvacea were not able to be assigned to the known functions in Basidiomycetes [7,9].
Most of the unigenes were enriched in “Metabolism” and “Genetic Information Processing” (Figure 2A, left panel) using the KEGG pathway enrichment analysis. Among the metabolism pathways, the amino sugar and nucleotide sugar metabolism were most abundant, followed by nitrogen metabolism, glutathione metabolism, lysine degradation and fructose and mannose metabolism (Figure 2A, right panel). Enrichment analysis of Gene Ontology (GO) showed that “Oxidation-reduction process” had the most abundant genes. Moreover, a large number of genes involved in the “Carbohydrate Metabolic Process” and “Proteolysis” were found in the “Biological Process” (Figure 2B), indicating that V. volvacea has a strong potential to utilize plant-derived culture substrates.

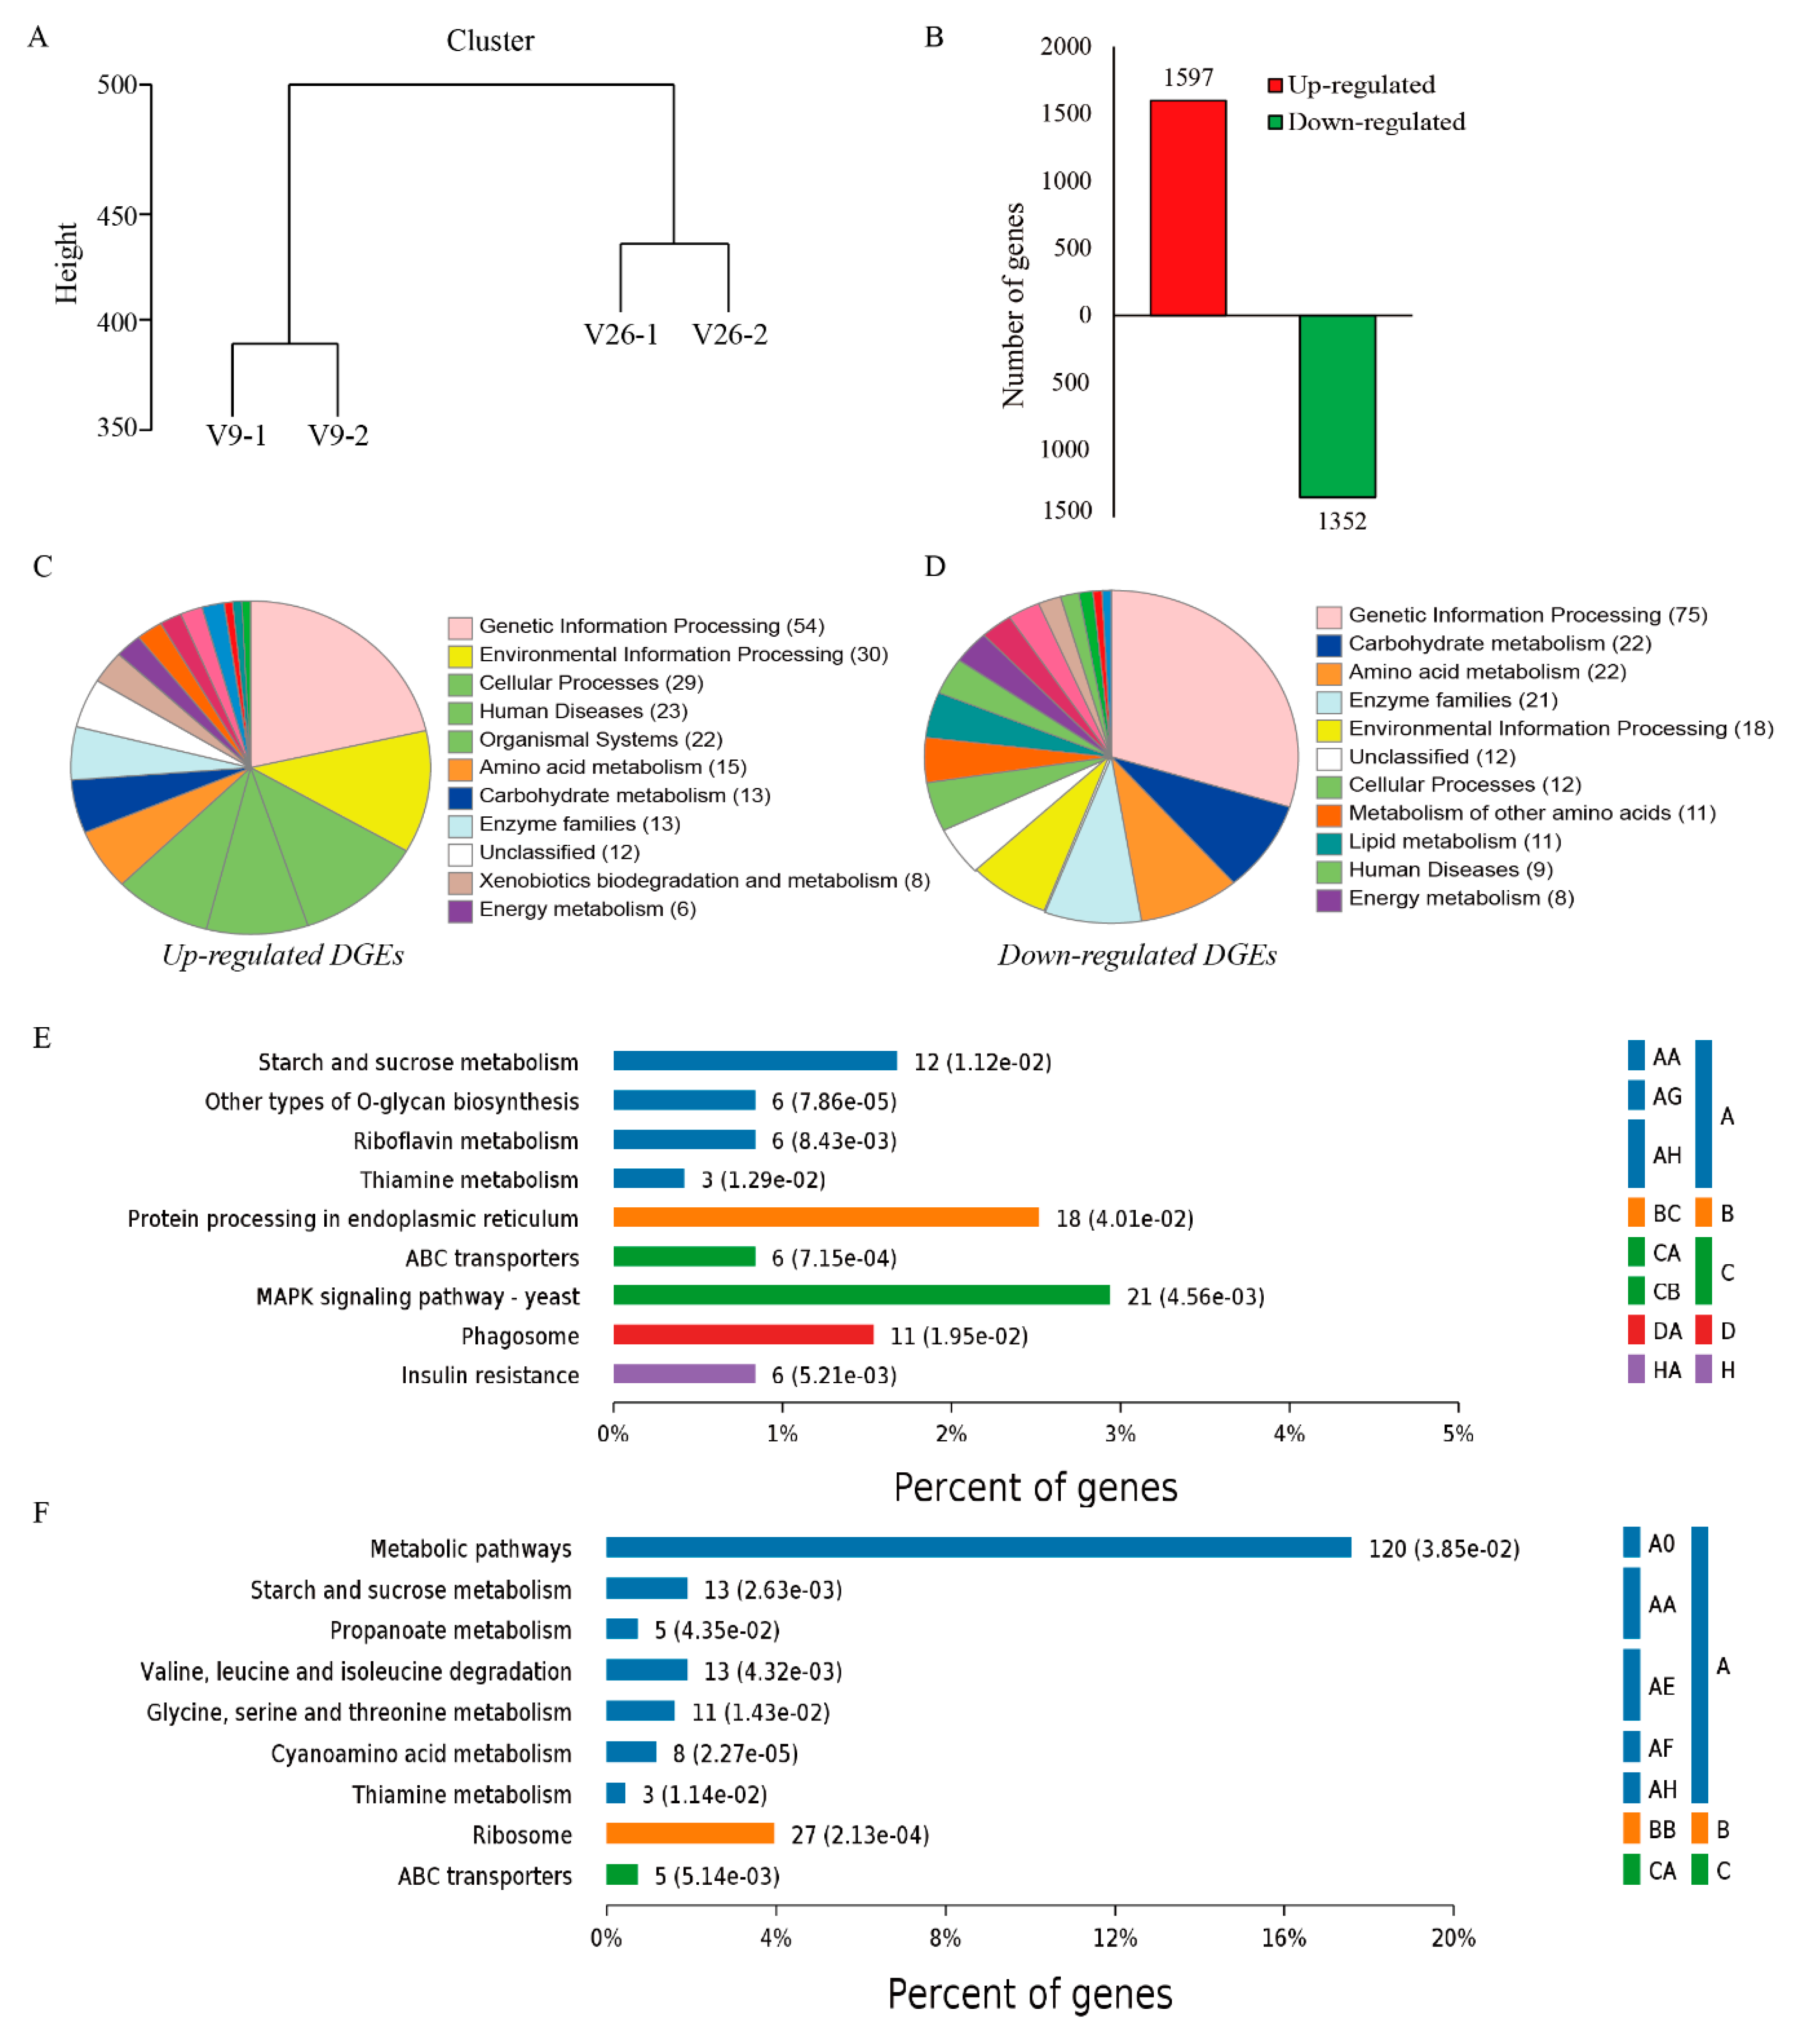
2.3. Gene Expression and Identification of DEGs

At least 13,488 (92.7%), 13,427 (92.2%), 13,200 (90.7%) and 12,955 (89%) transcripts were identified in v9-1, v9-2, v26-1 and v26-2 libraries, respectively. The cluster analysis showed that v9-1 was close to v9-2 and v26-1 was clustered with v26-2. Instead, v9-1 and v9-2 separated with v26-1 and v26-2. This observation indicated that the gene expression patterns were different in the two V. volvacea strains (Figure 3A). qRT-PCR analysis of the selected genes was performed to validate the transcriptome data. The same gene expression patterns were consistent with those by the transcriptome analysis (Supplementary Table S1).
At least 2949 transcripts were shared between v9 and v26 at the vegetative growth stage. Among them, the expression of 1597 unigenes was up-regulated while 1352 were down-regulated (Figure 3B). Up-regulated DEGs were assigned to Genetic Information Processing by the KEGG enrichment analysis of DGEs, followed by Environmental Information Processing, Cellular Processes, Amino Acid Metabolism and Carbohydrate Metabolism, as well as several others (Figure 3C). Down-regulated DGEs were enriched in Genetic Information Processing, followed by Carbohydrate Metabolism, Amino Acid Metabolism, Enzyme Families, Environmental Information Processing and Cellular Processes (Figure 3D).
A further significant enrichment analysis of the KEGG pathway showed that both up-regulated DGEs and down-regulated DGEs were significantly enriched on the pathways of Starch and Sucrose Metabolism, Thiamine Metabolism and ABC Transporters (Figure 3E,F). Moreover, up-regulated DGEs were significantly enriched in the MAPK signaling pathway within Environmental Information Processing and Phagosome within cellular processes (Figure 3E). However, down-regulated DGEs were significantly enriched in the Propanoate Metabolism within Carbohydrate Metabolism, and pathways related to Amino Acid Metabolism of Valine, Leucine and Isoleucine Degradation, Glycine, Serine and Threonine Metabolism as well as Cyanoamino Acid Metabolism (Figure 3F).
Thiamine plays a vital role in the metabolism of glucose and energy production. At least six genes involved in “Thiamine Metabolism” pathways were investigated in detail because they were significantly enriched in the KEGG pathways (Figure 3E,F). The expression level of thiamine synthase genes iscS (ctg4698_g1) was higher in v9 than in that in v26, demonstrating a more active vitamin B1 synthesis activity. The thiamine metabolism gene THI20 (ctg9033_g1) and THI4 (ctg9315_g1) in v9 showed a lower expression level than that in v26. The expression of other selected thiamine metabolism genes was only slightly different between the strains.
The carbohydrate utilization gene is expressed differently in the two strains (Table 2). Three genes encoding the cellulase 1,4-beta-cellobiosidase (CBH1 and CBH2) were upregulated in v9, and two of the three lytic polysaccharide monooxygenase genes (LPMOs) were expressed at a higher level in v9. Moreover, at least 8 β-glycosidase genes (bglX) were downregulated in v9 compared to v26. Two (ctg9698_g1 and ctg11581_g1) of the three selected α-amylase genes (AMY) showed a higher expression level in v9 than they did in v26 (Table 2).

2.4. Genes Involved in MAPK Signaling Pathway

At least 21 up-regulated and 10 down-regulated unigenes were discovered in the MAPK signaling pathway. These 31 unigenes were distributed in four pipelines of the MAPK signaling pathway (yeast), including pheromone to mating, cell wall stress to remodeling, high osmolarity to osmolyte synthesis and starvation to filamentation (Table 3). Genes encoding BEM1 (K11237, bud emergence protein 1), SWE1 (K03114, mitosis inhibitor protein kinase SWE1), TUP1 (K06666, general transcriptional corepressor) and negative-regulated CDC42 gene RGA1_2 (K19839, Rho-type GTPase-activating protein 1/2) were highly expressed in v9 compared to v26. This indicated that the growth-related genes were more actively transcribed in v9 than in v26. Instead, genes involved in proliferation, such as CDC42 (K04393, cell division control protein 42), STE3 (K04627, pheromone a factor receptor), BCK1 (K11229, mitogen-activated protein kinase), CTT1 (K03781, catalase) and TEAD (K09448, transcriptional enhancer factor) were expressed more in v26 than in v9.

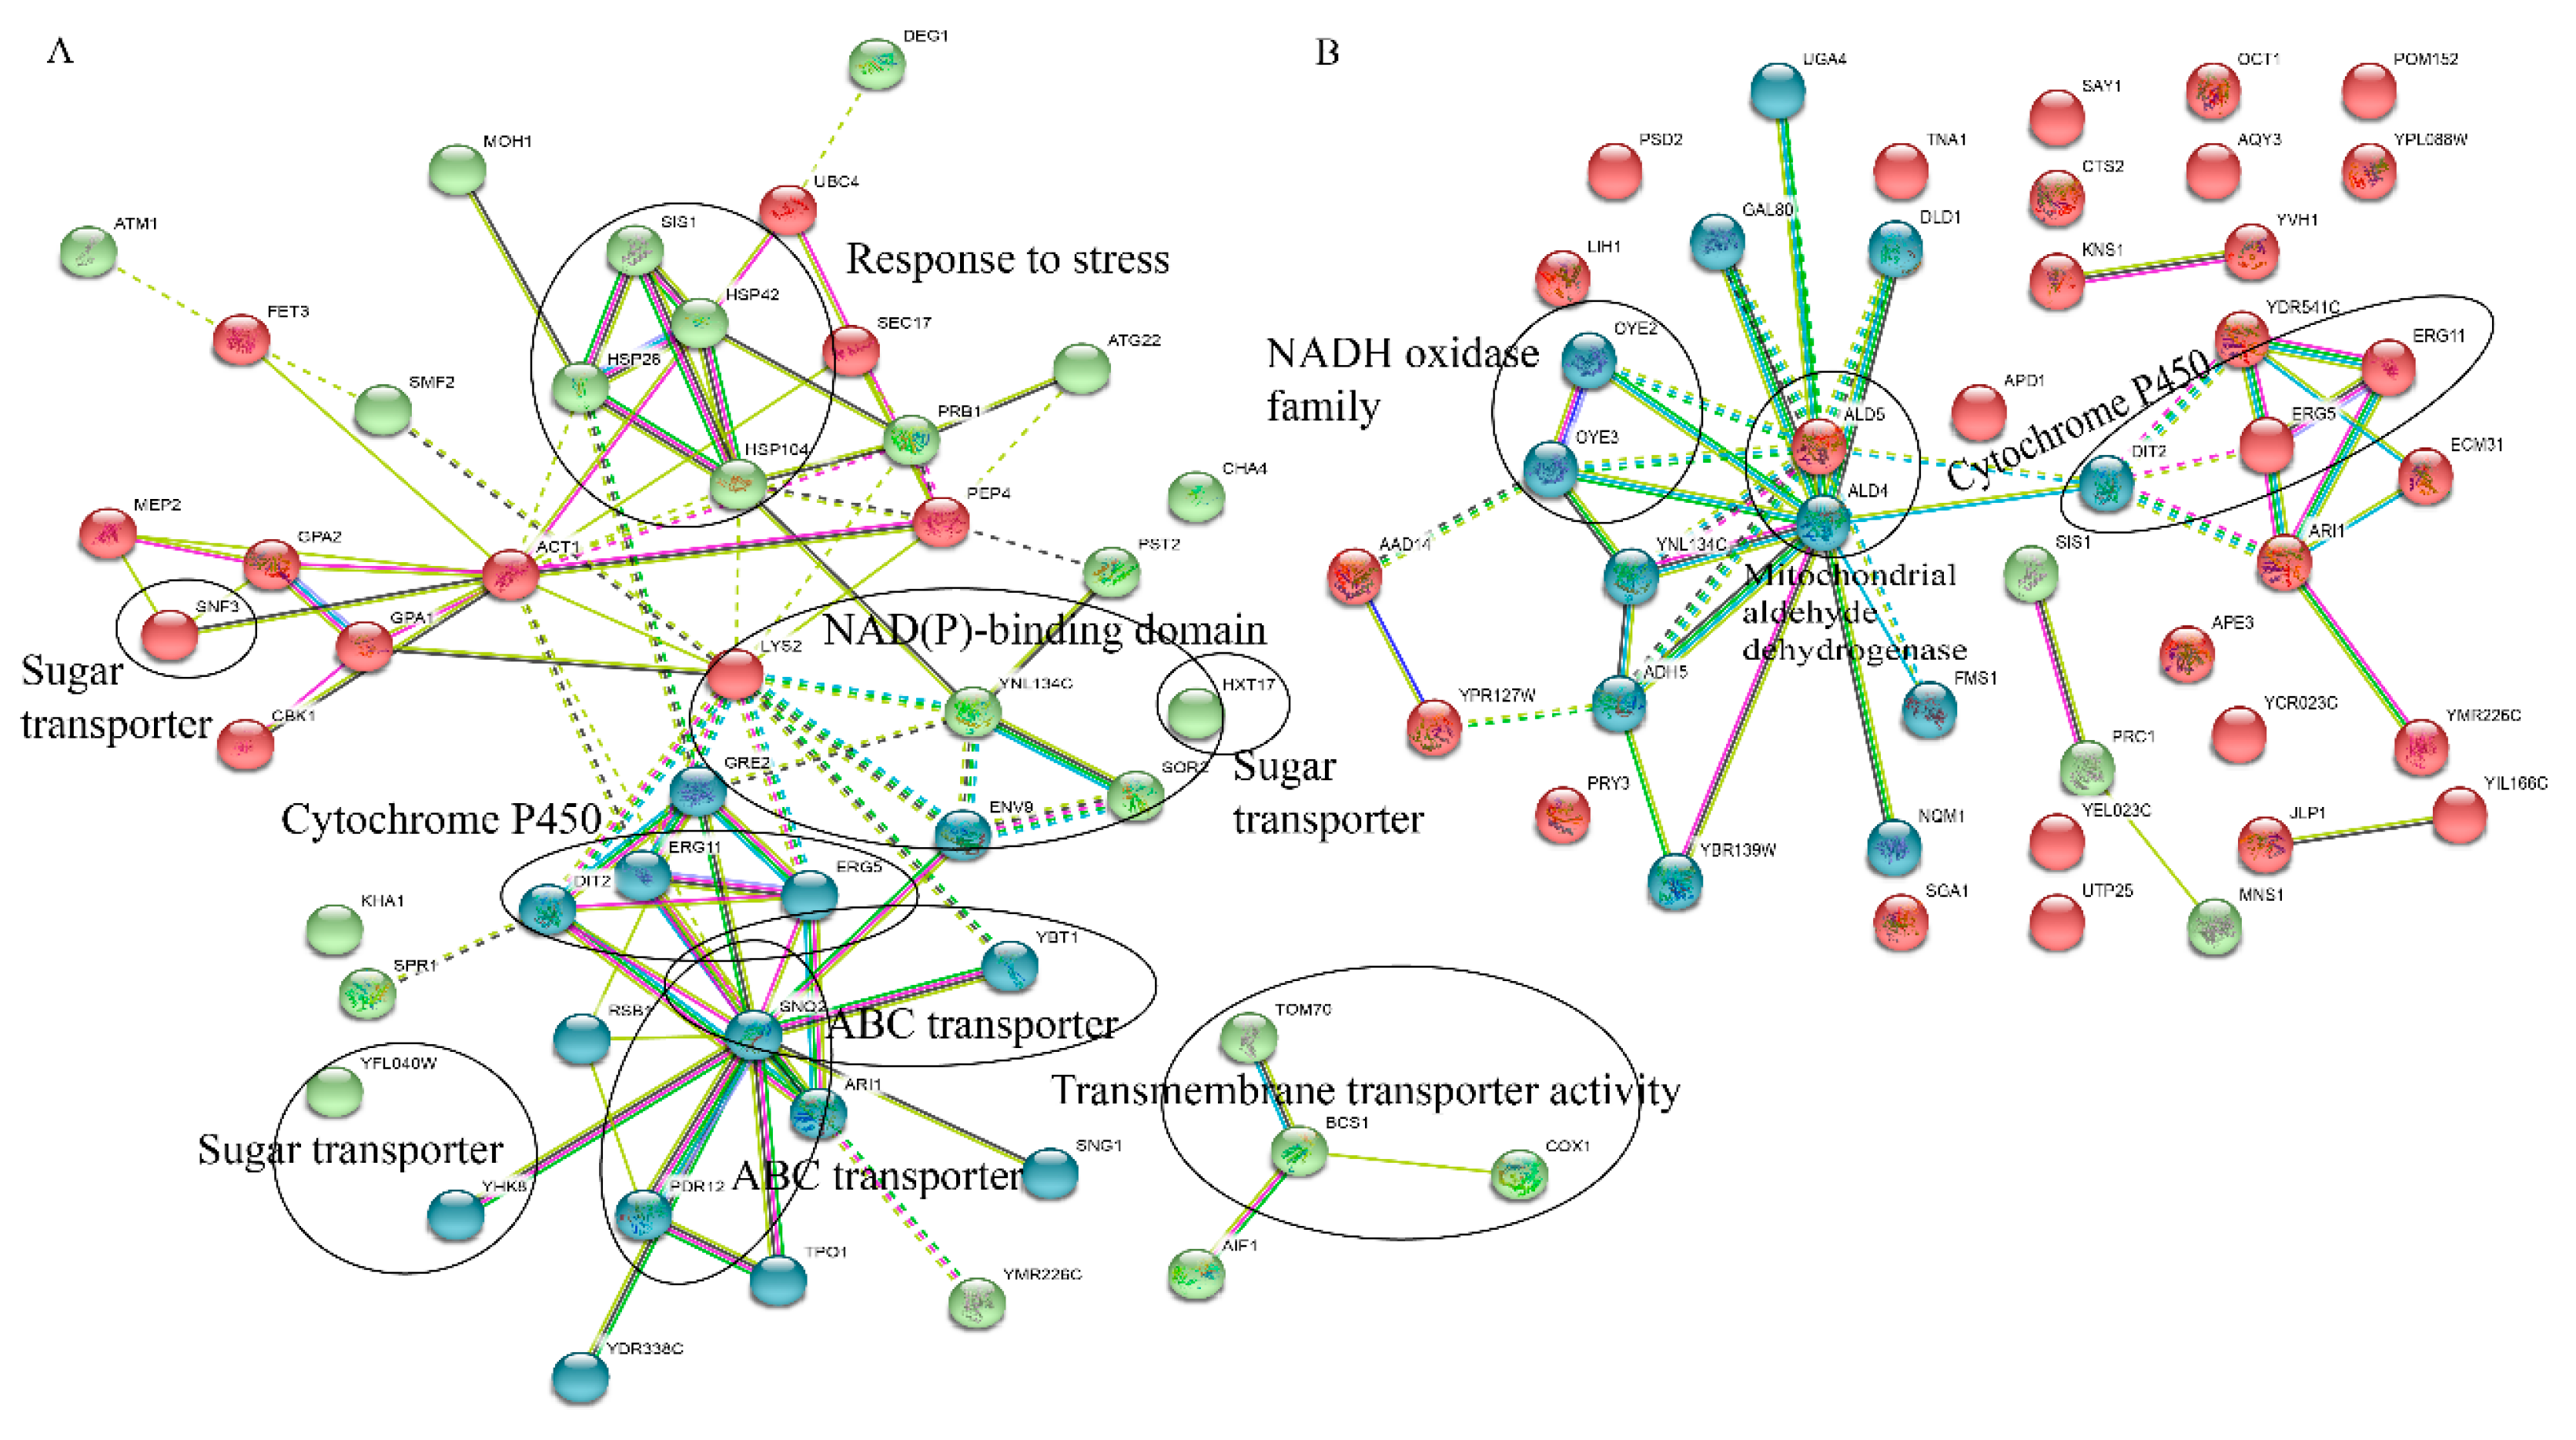
2.5. String Analysis

A total of 262 highly up-regulated DEGs and 302 highly down-regulated DEGs were obtained using string analysis (FDR < 0.001). A total of 58 up-regulated unigenes was annotated to 48 and 55 down-regulated unigenes was annotated to 44 (Figure 4). As shown in Figure 4A, up-regulated genes could be grouped into heat-shock proteins (HSPs), sugar transporters, ABC transporters, cytochrome P450, NAD(P)-binding domain and others (Figure 4A). Four heat-shock proteins, including HSP26, HSP104, HSP42 and SIS1 (Type II HSP40 co-chaperone), were highly expressed in v9 (FPKM > 1400) while those in v26 were not (FPKM < 700). Fourteen putative transporters were expressed at a higher level in v9 than those in v26. These transporters seem to be involved in various nutrient transportation; for example, four sugar transporters were found: HXT17 (hexose transporter), SNF3 (low glucose sensor that regulates glucose transport), YFL040W (transporter member of the sugar porter family) and YHK8 (presumed antiporter of the major facilitator superfamily); four ABC transporters were found: ATM1 (exports mitochondrially synthesized precursors of iron-sulfur (Fe/S) clusters to the cytosol), PDR12 (weak-acid-inducible multidrug transporter), SNQ2 (multidrug transporter) and YBT1 (bile acid transport); as well as other transporters were found: BCS1 (AAA ATPase family), COX1 (subunit I of cytochrome c oxidase), RSB1 (transport sphingoid long chain base (LCB)), SMF2 (manganese transporter), TOM70 (transit peptide receptor) and TPO1 (polyamine transporter that recognizes spermine, putrescine, and spermidine). Moreover, six up-regulated and five down-regulated unigenes were significantly enriched in the pathway of the ABC transporters (Table 4). The expression of gene ABCB1 (K05658, ATP-binding cassette, subfamily B (MDR/TAP), member 1) was higher in v9 than in v26. ABCB1 encoded the ATP-binding ATPases, which played important roles in the exportation of xenobiotics. Therefore, one can assume that v9 may more actively export xenobiotic molecules than v26.

3. Discussion

The current cultivation mode of straw mushrooms are field cultivation and indoor cultivation [2,19,20]. Strain v9 is more appropriate for cultivation in the field while v26 is mainly cultured indoor for commercial production. Compared to the indoor cultivation, the filed cultivation mode encounters more dramatic temperature changes between day and night. Temperature fluctuations lead to a series of metabolism activity adaptions; for example, changes in unsaturated fatty acid biosynthesis, as well as the accumulation of trehalose and glycogen. The cold-shock and heat-shock proteins played important physiological roles during the temperature fluctuations periods [21,22]. It is well known that the production of heat shock proteins are promoted by abnormal stress factors in various fungi. Heat-shock proteins function as molecular chaperone that participate in refolding or degradation of stress-damaged proteins [23]. For example, exposure to low temperature (i.e., 4 °C) for more than eight hours will cause irreversible damage to the V. volvacea mycelium [24]. To respond to the dramatic temperature, a number of HSP genes in V. volvacea were down-regulated after low temperature exposure [1]. In this study, we also found that the expression levels of hsp104, hsp42 and hsp26 genes in v9 was much higher than those in v26 (Figure 4). High expression of heat-shock proteins in v9 may enhances its adaptability to temperature fluctuations. This may be one of the reasons why the v9 strain was selected for field cultivation
The mycelium growth rate of the v9 strain is faster than that of the v26 strain, and the biological efficiency is higher (Figure 1). The mycelial growth performance and biological efficiency of a mushroom species is mainly attributed to its hydrolytic enzymes system [25,26]. V. volvacea had a higher number of enzymes related to the degradation of cellulose, hemicellulose and pectin compared with other basidiomycetes [3,20,27]. Our results showed several carbohydrate utilization genes in v9 was transcribed at higher levels than those in v26; for example, cellulase 1,4-β-cellobiosidase (CBH1 and CBH2), which may efficiently contribute to cellobiose releasing from cellulose. Cellobiose was an inducer for the expression of cellulase genes (e.g., 1,4-β-cellobiosidase genes) in many fungi, including T. reesei and V. volvacea [28,29]. LPMOs are involved in oxidatively cleaving glycosidic linkages, which leads the substrate to be more susceptible to hydrolysis by those conventional cellulases [30]. Further, β-glycosidase genes (bglX) were downregulated in v9. β-glycosidases release glucose from cellobiose, which represses the transcription of cellulase genes [31,32]. Such a regulation mechanism may enable v9 to maintain a higher level of expression of extracellular cellulase. Similarly, the β-D-xylosidase gene XYL4 was expressed at a higher level in v26 than it did in v9. β-D-xylosidases digested xylobiose to produce glucose, which is a repressor for xylanase gene expression [31,32]. Two (ctg9698_g1 and ctg11581_g1) of the three selected α-amylase genes (AMY) showed a higher expression level in v9 than they did in v26 (Table 2), indicating that these two AMY gene was possibly involved in starch utilization in the fast-growth stage. The hexokinase gene HK (ctg4916_g1) transcription level in v9 was around 4-fold higher than in v26, indicating that v9 was able to metabolize and transform the simple soluble sugars (e.g., glucose or fructose) into energy for the fast growth. Moreover, two TREH genes for the conversion of trehalose to glucose were differently regulated (ctg9797_g3 was upregulated in v9). The transcriptional level of malZ showed a slightly higher expression in v26 than it did in v9, which indicated a faster conversion of maltose into glucose in v26 than in v9. The higher expression of these carbohydrate utilization genes may contribute to a faster mycelium growth rate and higher biological efficiency of v9.
Our quantitative analysis and comparison of gene expression profiles in two strains suggested that MAPK modules might be involved in mycelial growth in V. volvacea. However, it remains unclear what the exact role of these MAPK pathway genes are; identifying potential regulators and targets in MAPK pathways will provide insights into the signal transduction pathways of V. volvacea. Our data also revealed that gene expression profiles were different between v9 and v 26 when MAPK signaling pathway analysis was performed (Table 3). MAPK modules serve central roles in intracellular signal transduction and are evolutionary conserved in eukaryotic cells, including yeast and fungi [33,34]. The MAPK cascade are involved in mating and pathogenic development in Ustilago maydis [35]. In Lentinula edodes, the MAPK cascade was also reported to play important roles in light signal transmission and metabolic regulation [36].
We have found an array of genes that contribute to the growth of V. volvacea and should increase our understanding of the fundamental and cellular processes of V. volvacea for commercial production and industrial use.

4. Materials and Methods

4.1. Strains and Culture Conditions

The V. volvacea dikaryotic strain v26 was isolated in a greenhouse from Foshan Zhihua Fungus Co., Ltd. (Foshan, China), and v9 was isolated in a field from Zhongshan Minzhong Edible Fungus Cooperative; both were preserved in the Fungal Culture Collection of Guangdong Key Laboratory for New Technology Research of Vegetables. The microorganisms used in the current study were maintained on potato dextrose agar (PDA, Merck, Germany) at 30 °C. The mycelial growth rate was determined in a Petri dish with a diameter of 9 cm. A 0.5 cm2 mycelial agar plug was transferred into the center of a fresh PDA plate and the colonies’ radii were measured every 24 h. Straw mushroom strains were cultivated on mixed substrates including 50% rice straw and 50% waste cotton (each with 65% water content) at 30 °C. Various developmental stages of V. volvacea were differentiated using the methods described previously by Chang and Yau [18]. At least 10 replicates for each stage were analyzed.

4.2. RNA Extraction and cDNA Library Construction and Sequencing

V. volvacea strains v9 and v26 were cultured in 250 mL flasks containing 100 mL Potato Dextrose Broth (PDB) at 30 °C for 5 days. Mycelium were collected and immediately stored in liquid nitrogen. The two replicates per strain were used to construct the comparative cDNA libraries. Total RNA was extracted using Trizol reagents. A total of 1 μg of RNA was proceeded with the Illumina TruSeq RNA Sample Preparation kit v2, including steps to purify and fragment the mRNA, carry out first-strand cDNA synthesis and second-strand cDNA synthesis, repair the ends, adenylate the 3’ ends and ligate the adaptors. Following PCR amplification, the libraries were validated using an Agilent 2100 bioanalyzer (Agilent, Santa Clara, CA 95051, USA), which indicated average cDNA fragments of ~360 bp in length.
Four cDNA libraries were sequenced using an Illumina MiSeq sequencing platform (available at Agro-biological Gene Research Center of Guangdong Academy of Agricultural Sciences, Guangzhou, China) by using a 2× 75 bp MiSeq reagent kit v3 (Illumina, San Diego, CA 92122, USA). Raw paired-end reads were submitted to the Sequence Read Archive of the NCBI (accession number: PRJNA408191).
To examine the expression of the 14 putative thiamine metabolism- as well as starch and sucrose metabolism-related genes, qRT-PCR assays were performed. The primers for the 14 genes related to thiamine metabolism, starch and sucrose metabolism are listed in Supplementary Table S1. The PCR mix was prepared with 1 μL cDNA samples as templates in the presence of a SYBR Green PCR Master Mix and gene-specific primers. The reactions were performed in a BIO-RAD Cycler IQ Multi-Color Real Time PCR Detection System (Bio-Rad, Hercules, CA, USA). The relative levels of the amplified mRNA were evaluated according to the 2−ΔΔCt method using the actin gene for normalization.

4.3. Sequence Processing and Bioinformatics Analysis

To obtain high quality sequences, the QC Toolkit (v2.3.1) was adopted to remove adaptor sequences, ambiguous reads and low-quality reads [37]. The clean reads from all samples were pooled together to perform the de novo assembly using the Trinity program (r20140717), which included three modules, namely inchworm, chrysalis and butterfly [38], with parameters of “--seqType fq --JM 50G --CPU 12 --trimmomatic”. Then the nucleotide sequences of the unigenes were aligned to the databases of NR and KEGG using the Blastx program with the e-value lower than 1e-5. Moreover, the clean reads per sample were aligned to the assembled transcripts with using Bowtie [39]. RSEM [40] was used to calculate the FPKM values (Fragments Per kb per Million reads) to obtain gene expression level, which were done through a perl script (align_and_estimate_abundance.pl --transcripts Trinity.fasta --left SeqR1.fq --right SeqR2.fq --seqType fq --est_method RSEM --aln_method bowtie --trinity_mode --prep_reference). EdgeR [41] was performed to detect differential expression with an FDR ≤ 0.05 and a relative change threshold of 2-fold. KOBAS [42] was used for enrichment analysis of the Gene Ontology and KEGG pathway. The functional differences between the two strains were considered significant using Benjamini–Hochberg FDR (corrected p < 0.05). String analysis [43] was carried out to show the protein interactive network. Figures were plotted in the R environment (v3.1.2) (http://www.r-project.org).

Supplementary Materials

Supplementary materials can be found at https://www.mdpi.com/2073-4425/11/2/161/s1.

Author Contributions

Conceptualization, M.L. and T.Y.; investigation, Q.L., H.L., Q.Z., Z.X., J.X., Y.P., S.F.; data curation, M.L. and T.Y.; writing—original draft preparation, M.L., T.Y., P.K.S., S.C. and H.H.; writing—review and editing, S.C.; project; funding acquisition, M.L. and H.H. All authors have read and agreed to the published version of the manuscript.

Funding

This research was funded by Key-Area Research and Development Program of Guangdong Province (Grant no: 2018B020206001), The Science and Technology Program of Guangdong Province (2014B020201002); The Science and Technology Program of Guangzhou (201704020038, 201904010408, 201904010432); Presidential Foundation of the Guangdong Academy of Agricultural Sciences (201810); The Open Research Fund of Guangdong Key Laboratory for New Technology Research on Vegetables (201702).

Acknowledgments

We thank Foshan Zhihua Fungus Co., Ltd., and Zhongshan Minzhong Edible Fungus Cooperative for providing the strains.

Conflicts of Interest

The authors declare no conflict of interest.

References

  1. Chang, S.; Miles, P. Edible Mushroom and Their Cultivation; CRC Press: New York, NY, USA, 1989; Volume 120, pp. 307–312. [Google Scholar]
  2. Wang, R.; Cao, H.; Zhang, G.; Tan, Q. Scientific explorations and commercial sales of the straw mushroom Volvariella volvacea (Bull.) Singer in Republican China: A brief review. Indian J. Hist. Sci. 2017, 52, 95–101. [Google Scholar]
  3. Bao, D.; Gong, M.; Zheng, H.; Chen, M.; Zhang, L.; Wang, H.; Jiang, J.; Wu, L.; Zhu, Y.; Zhu, G. Sequencing and comparative analysis of the straw mushroom (Volvariella volvacea) genome. PLoS ONE 2013, 8, e58294. [Google Scholar] [CrossRef] [PubMed]
  4. Kishida, E.; Kinoshita, C.; Sone, Y.; Misaki, A. Structures and antitumor activities of polysaccharides isolated from mycelium of Volvariella volvacea. Biosci. Biotechnol. Biochem. 1992, 56, 1308–1309. [Google Scholar] [CrossRef] [PubMed]
  5. Roy, A.; Prasad, P.; Gupta, N. Volvariella volvacea: A macrofungus having nutritional and health potential. Asian J. Pharm. Technol. 2014, 4, 110–113. [Google Scholar]
  6. Chang, S. Production of the straw-mushroom (Volvariella volvacea) from cotton wastes. Mushroom J. 1974, 98, 1019–1024. [Google Scholar]
  7. Ohm, R.A.; De Jong, J.F.; Lugones, L.G.; Aerts, A.; Kothe, E.; Stajich, J.E.; De Vries, R.P.; Record, E.; Levasseur, A.; Baker, S.E. Genome sequence of the model mushroom Schizophyllum commune. Nat. Biotechnol. 2010, 28, 957. [Google Scholar] [CrossRef] [Green Version]
  8. Chen, S.; Xu, J.; Liu, C.; Zhu, Y.; Nelson, D.R.; Zhou, S.; Li, C.; Wang, L.; Guo, X.; Sun, Y. Genome sequence of the model medicinal mushroom Ganoderma lucidum. Nat. Commun. 2012, 3, 913. [Google Scholar] [CrossRef] [Green Version]
  9. Morin, E.; Kohler, A.; Baker, A.R.; Foulongne-Oriol, M.; Lombard, V.; Nagye, L.G.; Ohm, R.A.; Patyshakuliyeva, A.; Brun, A.; Aerts, A.L. Genome sequence of the button mushroom Agaricus bisporus reveals mechanisms governing adaptation to a humic-rich ecological niche. Proc. Natl. Acad. Sci. USA 2012, 109, 17501–17506. [Google Scholar] [CrossRef] [Green Version]
  10. Chen, L.; Gong, Y.; Cai, Y.; Liu, W.; Zhou, Y.; Xiao, Y.; Xu, Z.; Liu, Y.; Lei, X.; Wang, G. Genome sequence of the edible cultivated mushroom Lentinula edodes (Shiitake) reveals insights into lignocellulose degradation. PLoS ONE 2016, 11, e0160336. [Google Scholar] [CrossRef]
  11. Chen, B.; Gui, F.; Xie, B.; Deng, Y.; Sun, X.; Lin, M.; Tao, Y.; Li, S. Composition and expression of genes encoding carbohydrate-active enzymes in the straw-degrading mushroom Volvariella volvacea. PLoS ONE 2013, 8, e58780. [Google Scholar]
  12. Wang, W.; Wang, L.; Chen, B.; Mukhtar, I.; Xie, B.; Li, Z.; Meng, L. Characterization and expression pattern of homeobox transcription factors in fruiting body development of straw mushroom Volvariella volvacea. Fungal Biol. 2019, 123, 95–102. [Google Scholar] [CrossRef] [PubMed]
  13. Zhao, X.; Yu, C.; Zhao, Y.; Liu, S.; Wang, H.; Wang, C.; Guo, L.; Chen, M. Changes in Mannitol Content, Regulation of Genes Involved in Mannitol Metabolism, and the Protective Effect of Mannitol on Volvariella volvacea at Low Temperature. Biomed. Res. Int. 2019, 2019, 1493721. [Google Scholar] [CrossRef] [PubMed] [Green Version]
  14. Zhu, Z.; Wu, X.; Lv, B.; Wu, G.; Wang, J.; Jiang, W.; Li, P.; He, J.; Chen, J.; Chen, M. A new approach for breeding low-temperature-resistant Volvariella volvacea strains: Genome shuffling in edible fungi. Biotechnol. Appl. Biochem. 2016, 63, 605–615. [Google Scholar] [CrossRef] [PubMed]
  15. Chen, B.; van Peer, A.F.; Yan, J.; Li, X.; Xie, B.; Miao, J.; Huang, Q.; Zhang, L.; Wang, W.; Fu, J. Fruiting body formation in Volvariella volvacea can occur independently of its MAT-A-controlled bipolar mating system, enabling homothallic and heterothallic life cycles. G3: Genesgenomesgenetics 2016, 6, 2135–2146. [Google Scholar] [CrossRef]
  16. Ahlawat, O.; Ahlawat, K.; Dhar, B. Influence of lignocellulolytic enzymes on substrate colonization and yield in monosporous isolates and parent strains of Volvariella volvacea (Bull. Fr.) Sing. Indian J. Microbiol. 2005, 45, 205. [Google Scholar]
  17. Ahlawat, O.; Gupta, P.; Dhar, B.; Sagar, T.; Rajendranath, R.; Rathnam, K. Profile of the extracellular lignocellulolytic enzymes activities as a tool to select the promising strains of Volvariella volvacea (Bull. ex Fr.) sing. Indian J. Microbiol. 2008, 48, 389–396. [Google Scholar] [CrossRef] [Green Version]
  18. Chang, S.T.; Yau, C.K. Volvariella volvacea and its life history. Am. J. Bot. 1971, 58, 552–561. [Google Scholar] [CrossRef]
  19. Li, Z.; Chen, M.; Yu, C.; Li, Q.; Zhou, F.; Li, Y. Five Steps to Cultivate Volvariella volvacea. Agric. Sci. Technol. 2017, 18, 1593–1594. [Google Scholar]
  20. Sakinah, M.; Misran, A.; Mahmud, T.; Abdullah, S. A review: Production and postharvest management of Volvariella volvacea. Int. Food Res. J. 2019, 26, 367–376. [Google Scholar]
  21. Tiwari, S.; Thakur, R.; Shankar, J. Role of heat-shock proteins in cellular function and in the biology of fungi. Biotechnol. Res. Int. 2015, 2015, 132635. [Google Scholar] [CrossRef] [Green Version]
  22. Aguilera, J.; Randez-Gil, F.; Prieto, J.A. Cold response in Saccharomyces cerevisiae: New functions for old mechanisms. Fems Microbiol. Rev. 2007, 31, 327–341. [Google Scholar] [CrossRef] [PubMed] [Green Version]
  23. Chen, B.; Feder, M.E.; Kang, L. Evolution of heat-shock protein expression underlying adaptive responses to environmental stress. Mol. Ecol. 2018, 27, 3040–3054. [Google Scholar] [CrossRef] [PubMed] [Green Version]
  24. Chang, S.T.; Hayes, W.A. The Biology and Cultivation of Edible Mushrooms; Academic Press: Cambridge, MA, USA, 2013. [Google Scholar]
  25. Ahlawat, O.; Gupta, P.; Kamal, S.; Dhar, B. Development of molecular and biochemical markers for selecting a potential high yielding strain of paddy straw mushroom (Volvariella volvacea). J. Plant Biochem. Biotechnol. 2008, 17, 57–63. [Google Scholar] [CrossRef]
  26. Chen, S.; Ma, D.; Ge, W.; Buswell, J.A. Induction of laccase activity in the edible straw mushroom, Volvariella volvacea. FEMS Microbiol. Lett. 2003, 218, 143–148. [Google Scholar] [CrossRef]
  27. Cai, Y.J.; Buswell, J.A.; Chang, S.T. Production of cellulases and hemicellulases by the straw mushroom, Volvariella volvacea. Mycol. Res. 1994, 98, 1019–1024. [Google Scholar] [CrossRef]
  28. Brady, S.K.; Sreelatha, S.; Feng, Y.; Chundawat, S.P.; Lang, M.J. Cellobiohydrolase 1 from Trichoderma reesei degrades cellulose in single cellobiose steps. Nat. Commun. 2015, 6, 10149. [Google Scholar] [CrossRef] [Green Version]
  29. Chen, K.; Liu, X.; Long, L.; Ding, S. Cellobiose dehydrogenase from Volvariella volvacea and its effect on the saccharification of cellulose. Process Biochem. 2017, 60, 52–58. [Google Scholar] [CrossRef]
  30. Tandrup, T.; Frandsen, K.E.H.; Johansen, K.S.; Berrin, J.-G.; Lo Leggio, L. Recent insights into lytic polysaccharide monooxygenases (LPMOs). Biochem. Soc. Trans. 2018, 46, 1431–1447. [Google Scholar] [CrossRef]
  31. Mach, R.; Zeilinger, S. Regulation of gene expression in industrial fungi: Trichoderma. Appl. Microbiol. Biotechnol. 2003, 60, 515–522. [Google Scholar] [CrossRef]
  32. Stricker, A.R.; Mach, R.L.; De Graaff, L.H. Regulation of transcription of cellulases-and hemicellulases-encoding genes in Aspergillus niger and Hypocrea jecorina (Trichoderma reesei). Appl. Microbiol. Biotechnol. 2008, 78, 211. [Google Scholar] [CrossRef]
  33. Saito, H. Regulation of cross-talk in yeast MAPK signaling pathways. Curr. Opin. Microbiol. 2010, 13, 677–683. [Google Scholar] [CrossRef] [PubMed]
  34. Stajich, J.E.; Wilke, S.K.; Ahrén, D.; Au, C.H.; Birren, B.W.; Borodovsky, M.; Burns, C.; Canbäck, B.; Casselton, L.A.; Cheng, C. Insights into evolution of multicellular fungi from the assembled chromosomes of the mushroom Coprinopsis cinerea (Coprinus cinereus). Proc. Natl. Acad. Sci. USA 2010, 107, 11889–11894. [Google Scholar] [CrossRef] [PubMed] [Green Version]
  35. Müller, P.; Weinzierl, G.; Brachmann, A.; Feldbrügge, M.; Kahmann, R. Mating and pathogenic development of the smut fungus Ustilago maydis are regulated by one mitogen-activated protein kinase cascade. Eukaryot. Cell 2003, 2, 1187–1199. [Google Scholar] [CrossRef] [PubMed] [Green Version]
  36. Tang, L.H.; Jian, H.; Song, C.Y.; Bao, D.P.; Shang, X.D.; Wu, D.Q.; Tan, Q.; Zhang, X.H. Transcriptome analysis of candidate genes and signaling pathways associated with light-induced brown film formation in Lentinula edodes. Appl. Microbiol. Biotechnol. 2013, 97, 4977–4989. [Google Scholar] [CrossRef]
  37. Patel, R.K.; Jain, M. NGS QC Toolkit: A toolkit for quality control of next generation sequencing data. PLoS ONE 2012, 7, e30619. [Google Scholar] [CrossRef]
  38. Haas, B.J.; Papanicolaou, A.; Yassour, M.; Grabherr, M.; Blood, P.D.; Bowden, J.; Couger, M.B.; Eccles, D.; Li, B.; Lieber, M. De novo transcript sequence reconstruction from RNA-seq using the Trinity platform for reference generation and analysis. Nat. Protoc. 2013, 8, 1494. [Google Scholar] [CrossRef]
  39. Langmead, B.; Trapnell, C.; Pop, M.; Salzberg, S.L. Ultrafast and memory-efficient alignment of short DNA sequences to the human genome. Genome Biol. 2009, 10, R25. [Google Scholar] [CrossRef] [Green Version]
  40. Li, B.; Dewey, C.N. RSEM: Accurate transcript quantification from RNA-Seq data with or without a reference genome. BMC Bioinform. 2011, 12, 323. [Google Scholar] [CrossRef] [Green Version]
  41. Robinson, M.D.; McCarthy, D.J.; Smyth, G.K. edgeR: A Bioconductor package for differential expression analysis of digital gene expression data. Bioinformatics 2010, 26, 139–140. [Google Scholar] [CrossRef] [Green Version]
  42. Xie, C.; Mao, X.; Huang, J.; Ding, Y.; Wu, J.; Dong, S.; Kong, L.; Gao, G.; Li, C.-Y.; Wei, L. KOBAS 2.0: A web server for annotation and identification of enriched pathways and diseases. Nucleic Acids Res. 2011, 39 (Suppl. 2), W316–W322. [Google Scholar] [CrossRef] [Green Version]
  43. Szklarczyk, D.; Gable, A.L.; Lyon, D.; Junge, A.; Wyder, S.; Huerta-Cepas, J.; Simonovic, M.; Doncheva, N.T.; Morris, J.H.; Bork, P. STRING v11: Protein–protein association networks with increased coverage, supporting functional discovery in genome-wide experimental datasets. Nucleic Acids Res. 2018, 47, D607–D613. [Google Scholar] [CrossRef] [PubMed] [Green Version]
Figure 1. Differentiating characteristics of V. volvacea strains v26 and v9. (A) The “egg” stage in the development of V. volvacea. Note that the v26 fruiting body is oval-shaped, whereas v9 is bell-shaped. (B) Mycelial growth rates of V. volvacea strains v26 and v9. (C) The biological efficiency of v26 and v9. Both strains were cultivated on rice straw and cotton waste. (D) Developmental periods of v26 and v9. Strain v9 developed faster than v26. Each experiment was repeated three times. Mycelial growth rates, biological efficiency and developmental stages time were carried out by a Student’s t test. The mycelial growth rates, biological efficiency and egg stage time were significantly different (p < 0.05, The elongation stage and mature stage developmental time were not significantly different (p > 0.05). Bar = 1 cm in (A). Data are presented as the average ± SD in (BD).
Genes 11 00161 g001
Figure 2. Functional annotation of V. volvacea. (A) Pie chart showing the percent of genes enriched on the KEGG pathways from transcriptome data. (B) GO annotation of unigenes, including the biological process, molecular function and cell component.
Genes 11 00161 g002
Figure 3. The analysis of gene expression. (A) The expression patterns from all samples were clustered. (B) The number of up/down-regulated DEGs were showed when v9 compared with v26. (C) The functional categories of the KEGG pathway enriched by up-regulated DEGs are showed. (D) The functional categories of the KEGG pathway enriched by down-regulated DEGs are displayed. (E) The pathways were significantly enriched by up-regulated DEGs (P (adj.) < 0.05). (F) The pathways were significantly enriched by down-regulated DEGs (P (adj.) < 0.05). A: Metabolism, B: Genetic Information Processing, C: Environmental Information Processing, D: Cellular Processes, H: Other and unknown. A0: Global and overview maps; AA: Carbohydrate metabolism; AE: Amino acid metabolism; AF: Metabolism of other amino acids; AG: Glycan biosynthesis and metabolism; AH: Metabolism of cofactors and vitamins; BB: Translation; BC: Folding, sorting and degradation; CA: Membrane transport; CB: Signal transduction; DA: Transport and catabolism; HA: Other and unknown.
Genes 11 00161 g003
Figure 4. STRING analysis. A protein interactive network was used to display the genes that were related to the highly up-regulated, differently expressed unigenes (A), or related to the highly down-regulated, differently expressed unigenes (B). Gene products are represented with circles and known associations between each gene or gene product are represented with a connecting line. Nodes of genes participating in similar functions are circled in red or in blue or in green. The network cluster was based on the k-means clustering method.
Genes 11 00161 g004
Table 1. The data characteristics.
SequencingRaw Reads67,399,626
Clean reads65,013,746
AssemblyUnigenes14,556
N502461
Max length16,297
Min length201
Average length1410
Total assembled bases20,524,297
AnnotationNR10,890 (86%)
KEGG10,714 (85%)
Table 2. DGEs enriched in the starch and sucrose metabolism pathways.
Unigene IDExpressionKEGGqPCR
v9-1v9-2v26-1v26-2Log2FoldChangeFDRStatusKODescriptionGene Name
ctg4916_g198.5190.2220.427.542.027213.76 × 10−31up-regulatedK00844 hexokinase [EC:2.7.1.1] HK4.51/1
ctg7672_g120.8119.758.68.551.284271.04 × 10−36up-regulatedK01178glucoamylase [EC:3.2.1.3]SGA1
ctg164_g10.990.7823.1923−4.71171.13 × 10−147down-regulatedK01178glucoamylase [EC:3.2.1.3]SGA1
ctg2341_g13.762.341.031.361.343339.35 × 10−2up-regulatedK01178glucoamylase [EC:3.2.1.3]SGA1 2.23/1
ctg9698_g139.8534.0415.4316.831.175893.42 × 10−20up-regulatedK01176 alpha-amylase [EC:3.2.1.1] AMY
ctg11581_g1271.23249.79117.41125.91.07627.15 × 10−95up-regulatedK01176 alpha-amylase [EC:3.2.1.1] AMY1.99/1
ctg8677_g23.573.9411.0810.41−1.53197.84 × 10−18down-regulatedK01176 alpha-amylase [EC:3.2.1.1] AMY
ctg3960_g16.876.382.191.841.690591.47 × 10−14up-regulatedK01225 cellulose 1,4-beta-cellobiosidase [EC:3.2.1.91] CBH12.29/1
ctg10469_g115.9116.437.615.711.343469.80 × 10−19up-regulatedK19668cellulose 1,4-beta-cellobiosidase [EC:3.2.1.91]CBH2
ctg7134_g25.736.070.434.82.211621.50 × 10−5up-regulatedK19668cellulose 1,4-beta-cellobiosidase [EC:3.2.1.91]CBH21.30/1
ctg7443_g24.93.551.590.741.796738.55 × 10−2up-regulatedK19356 lytic cellulose monooxygenase (C1-hydroxylating) [EC:1.14.99.54] E1.14.99.541.44/1
ctg2646_g13.452.90.1804.694096.75 × 10−8up-regulatedK19356 lytic cellulose monooxygenase (C1-hydroxylating) [EC:1.14.99.54] E1.14.99.542.43/1
ctg2256_g1002.882−5.9951.02 × 10−23down-regulatedK19356 lytic cellulose monooxygenase (C1-hydroxylating) [EC:1.14.99.54] E1.14.99.54
ctg10311_g12.743.0117.8717.93−2.64696.07 × 10−55down-regulatedK01187 alpha-glucosidase [EC:3.2.1.20] malZ
ctg7514_g13.491.641.081.041.318164.9 × 10−2up-regulatedK05349 beta-glucosidase [EC:3.2.1.21]bglX 1.86/1
ctg5449_g11.381.253.452.69−1.2411.35 × 10−3down-regulatedK05349 beta-glucosidase [EC:3.2.1.21]bglX
ctg1206_g11.6903.878.25−2.61451.35 × 10−2down-regulatedK05349 beta-glucosidase [EC:3.2.1.21]bglX
ctg1654_g10.8502.332.26−2.26964.85 × 10−2down-regulatedK05349 beta-glucosidase [EC:3.2.1.21]bglX
ctg2108_g101.012.43.48−2.43624.4 × 10−2down-regulatedK05349 beta-glucosidase [EC:3.2.1.21]bglX
ctg9569_g15.185.1611.912.34−1.24615.84 × 10−26down-regulatedK05349 beta-glucosidase [EC:3.2.1.21]bglX
ctg6015_g31.971.195.986.25−1.94762.98 × 10−11down-regulatedK01188beta-glucosidase [EC:3.2.1.21] E3.2.1.21
ctg7541_g15.745.4615.4718.25−1.59913.44 × 10−32down-regulatedK01188beta-glucosidase [EC:3.2.1.21] E3.2.1.21
ctg9797_g3391.26395.330.1012.6790up-regulatedK01194alpha,alpha-trehalase [EC:3.2.1.28] TREH1.59/1
ctg1603_g100.625.597.89−4.10372.06 × 10−5down-regulatedK15920beta-D-xylosidase 4 [EC:3.2.1.37] XYL4
Table 3. DGEs enriched in the pathway of the MAPK signaling pathway—yeast.
Unigene IDExpressionKEGGMAPK–Yeast Pathway
v9-1v9-2v26-1v26-2Log2FCFDRStatusKODescriptionGene Name
ctg12452_g12.424.83005.2375121.08 × 10−2up-regulatedK02218casein kinase 1 [EC:2.7.11.1] CSNK1pheromone to mating
ctg12155_g138.4338.24226.93221.38−2.552461.56 × 10−247down-regulatedK04627 pheromone a factor receptor STE3
ctg11329_g116.314.630.911.33.797961.08 × 10−51up-regulatedK19838 GTPase-activating protein SST2 SST2
ctg7267_g1108.024.222.291.6295851.66 × 10−15up-regulatedK19860 guanine nucleotide-binding protein alpha-1 subunit GPA1
ctg9995_g113.7515.654.194.952.5646132.47 × 10−97up-regulated
ctg7524_g115.4916.672.442.492.6506792.99 × 10−13up-regulated
ctg7524_g210.4611.131.341.173.0361852.17 × 10−10up-regulated
ctg12751_g13.752.25005.0718411.86 × 10−2up-regulatedK07973 guanine nucleotide-binding protein subunit gamma GNG
ctg8861_g183.5678.8524.9528.651.3784153.00 × 10−76up-regulatedK19839Rho-type GTPase-activating protein 1/2 RGA1_2
ctg7642_g16.456.0934.336.89−2.332433.27 × 10−101down-regulated
ctg4782_g12.792.237.265.49−1.30394.97 × 10−3down-regulatedK04393cell division control protein 42 CDC42
ctg3200_g17.215.981.421.822.0142581.20 × 10−20up-regulatedK11237bud emergence protein 1BEM1
ctg2668_g12.64.31005.0718421.86 × 10−2up-regulatedK04409p21-activated kinase 1 [EC:2.7.11.1] PAK1
ctg7848_g186.522.171.321.9300042.49 × 10−7up-regulatedK19833serine/threonine-protein kinase CLA4 [EC:2.7.11.1] CLA4
ctg8443_g140.0338.7116.0520.11.1230392.04 × 10−16up-regulatedK19842 RHO1 GDP-GTP exchange protein 1/2 ROM1_2 cell wall stress to remodeling
ctg6770_g131.0233.240.881.035.0140331.57 × 10−33up-regulated
ctg9497_g34.383.341.491.151.5177451.26 × 10−2up-regulated
ctg293_g11.573.720.950.272.0074661.79 × 10−2up-regulatedK19844GTPase-activating protein BEM2BEM2
ctg4687_g13.522.646.677.29−1.195296.18 × 10−24down-regulatedK00888 phosphatidylinositol 4-kinase A [EC:2.7.1.67] PI4KA
ctg5599_g14.814.5720.9118.6−2.092236.61 × 10−47down-regulatedK11229mitogen-activated protein kinase kinase kinase [EC:2.7.11.25]BCK1
ctg5657_g40.9203.772.93−2.708346.18 × 10−2down-regulatedK19806 tyrosine-protein phosphatase 2/3 [EC:3.1.3.48]PTP2_3
ctg380_g10.620.623.934.62−2.610521.05 × 10−2down-regulatedK062763-phosphoinositide dependent protein kinase-1 [EC:2.7.11.1] Pkh1
ctg8570_g33.613.221.160.841.7299085.36 × 10−6up-regulated
ctg1020_g111.0511.084.745.051.1718612.94 × 10−6up-regulatedK11246SHO1 osmosensorSHO1 high osmolarity to osmolyte synthesis
ctg9076_g22.221.335.925.44−1.689527.79 × 10−11down-regulatedK11233osomolarity two-component system, response regulator SSK1SSK1
ctg10627_g179.4269.7333.4335.061.1395853.06 × 10−71up-regulated
ctg5925_g23.984.160.560.253.1062937.58 × 10−7up-regulatedK06666 general transcriptional corepressor TUP1 TUP1
ctg8863_g127.2228.435.579.012.4277384.45 × 10−73up-regulatedK03114mitosis inhibitor protein kinase SWE1 [EC:2.7.11.1] SWE1
ctg8944_g160.3348.42125.54116.41−1.179437.93 × 10−52down-regulatedK03781catalase [EC:1.11.1.6]Ctt1
ctg5701_g143.2342.24423.49411.39−3.306670down-regulatedK09448 transcriptional enhancer factor TEADstarvation to filamentation
ctg6107_g122.3123.764.292.922.6399951.36 × 10−46up-regulated
Table 4. DGEs enriched in the pathway of the ABC transporters.
Unigene IDExpressionKEGG
v9-1v9-2v26-1v26-2Log 2-FoldChangeFDRStatusKODescriptionGene Name
ctg2182_g1547.5525.1237.32431.1391324.86 × 10−202up-regulatedK05658ATP-binding cassette,
subfamily B (MDR/TAP),
member 1 (EC:3.6.3.44)
xenobiotic-exporting ATPase
ABCB1
ctg11186_g1266.3259.757.7660.52.1342960up-regulated
ctg11186_g2274.3252.450.9361.72.2356912.83 × 10−179up-regulated
ctg10041_g153.1154.0318.9619.31.4509441.56 × 10−152up-regulated
ctg11158_g129.9226.8511.1211.81.2905075.02 × 10−79up-regulated
ctg1141_g12.795.54005.2375131.08 × 10−2up-regulated
ctg3266_g21.730.583.168.03−2.134181.2 × 10−2down-regulated
ctg4538_g10.810.414.224.44−2.768982.43 × 10−7down-regulated
ctg8579_g1111.7102.4289.9290−1.459233.27 × 10−141down-regulated
ctg11112_g130.8425.8371.7875.5−1.41942.98 × 10−157down-regulated
ctg7752_g126.9526.3253.5854.9−1.058335.22 × 10−67down-regulated

