
Comparison of the Adsorption and Desorption Dynamics of Biological Molecules on Alginate Hydrogel Microcapsules—The Case of Sugars, Polyphenols, and Proteins
 , , and
Abstract
:
1. Introduction
2. Results and Discussion
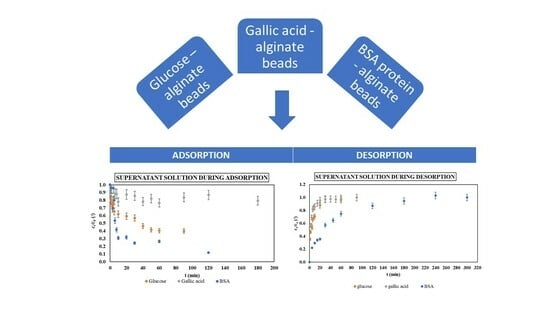
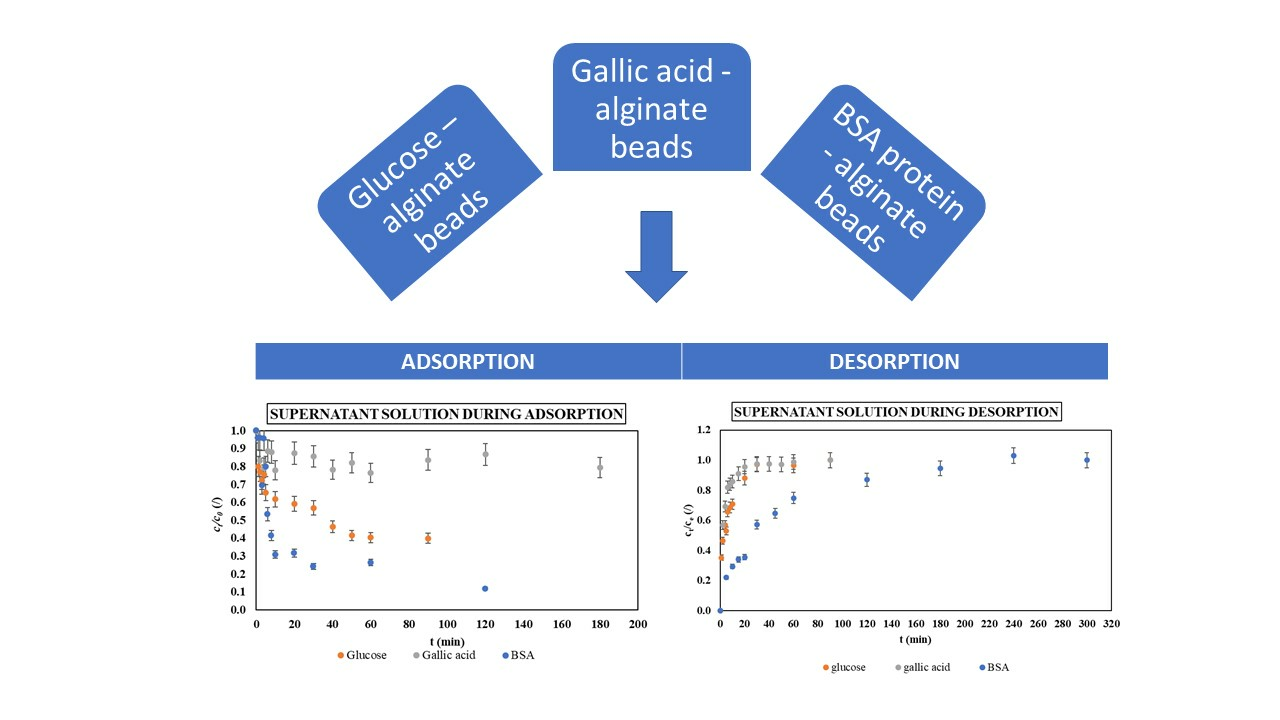
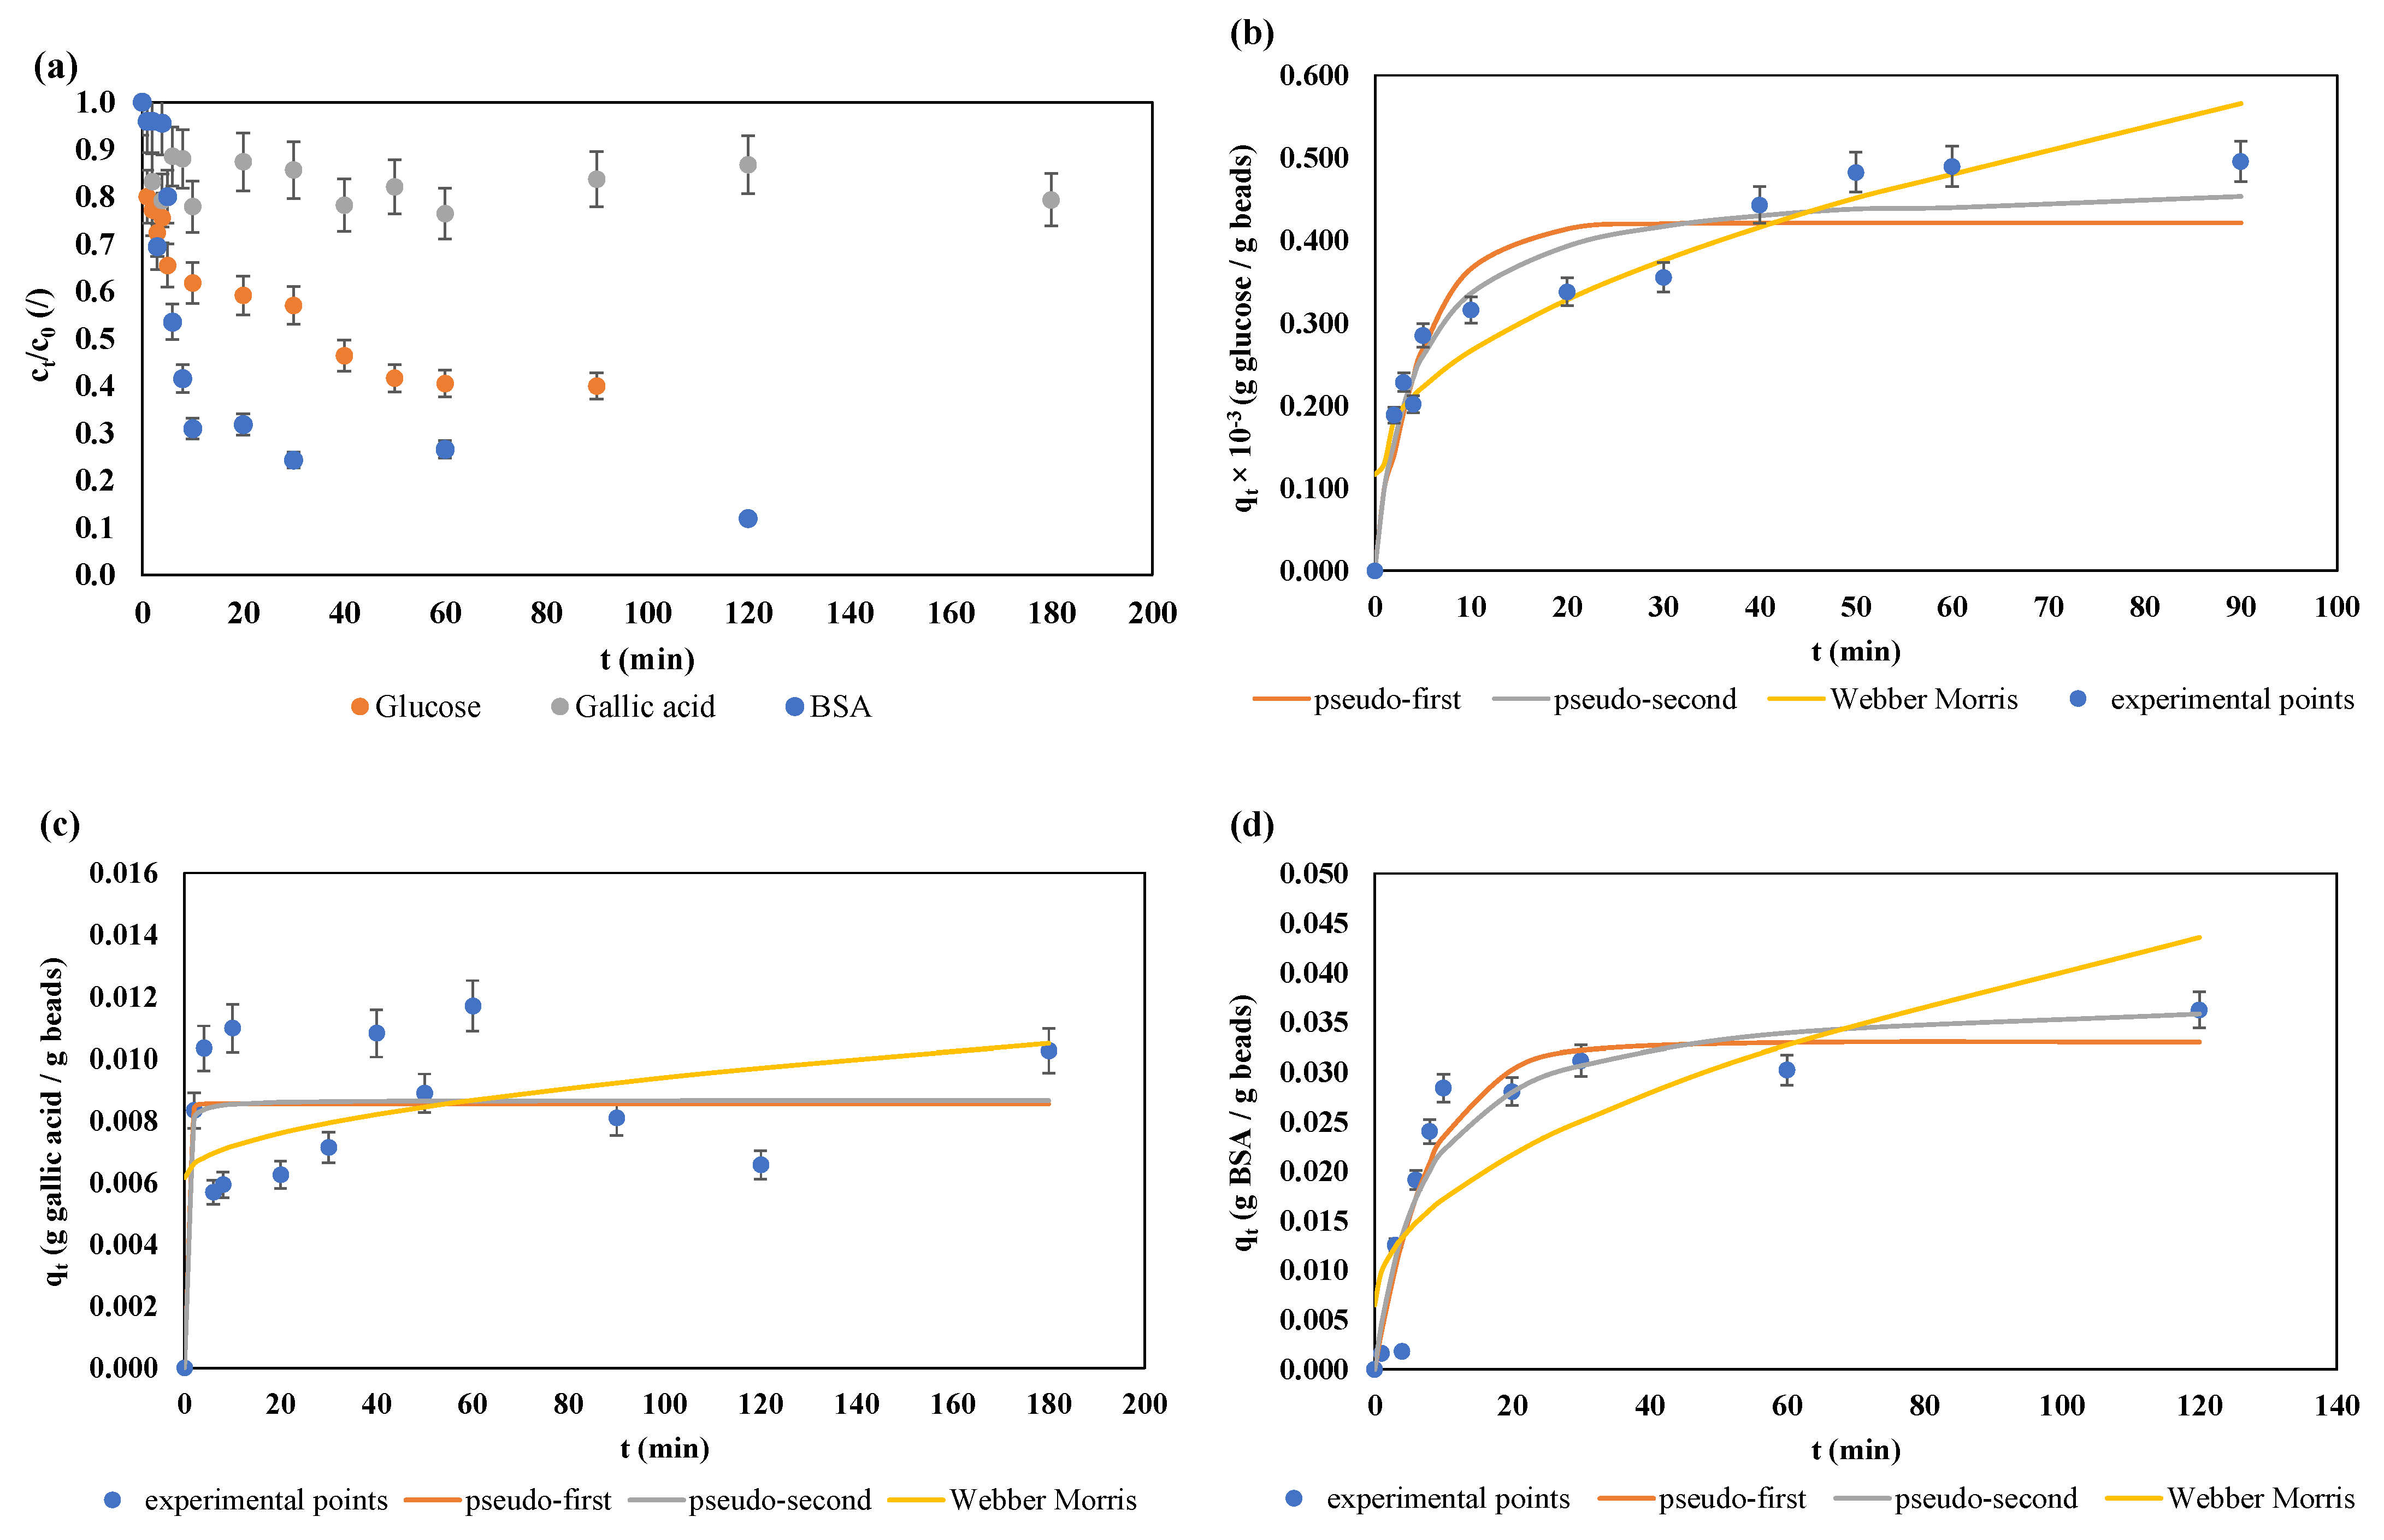
2.1. Adsorption Experiments
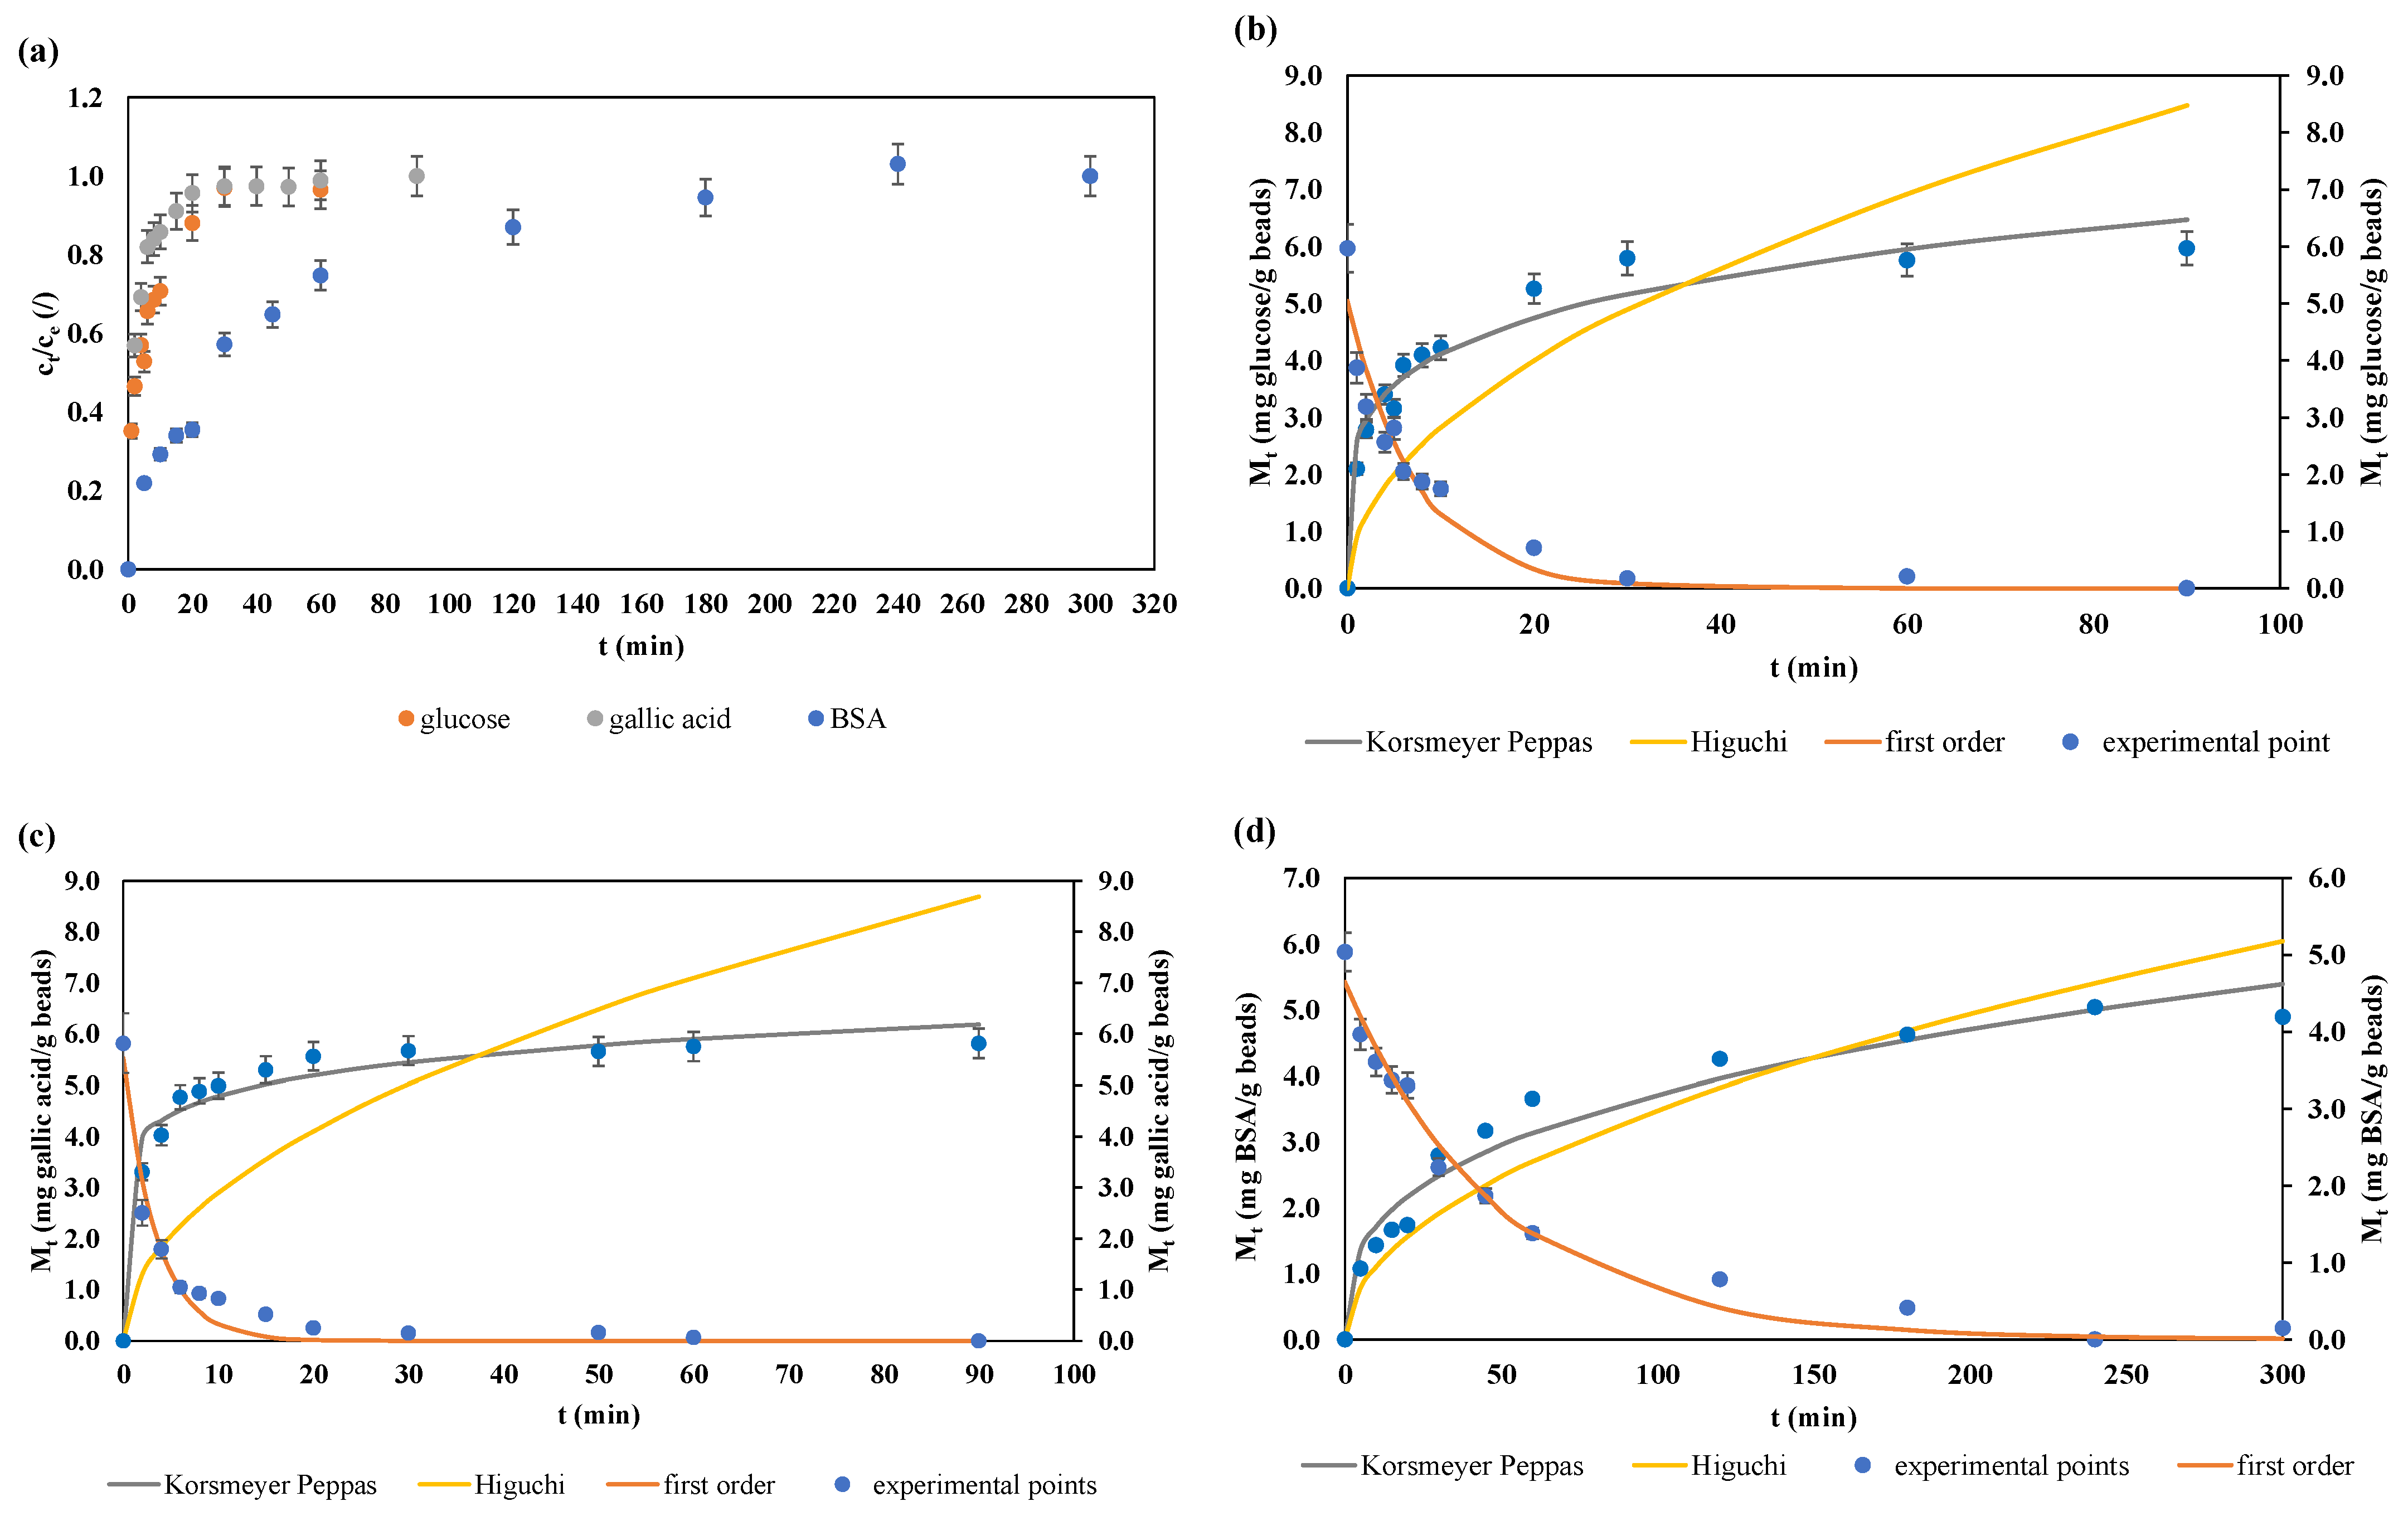
2.2. Desorption (Release) Experiments
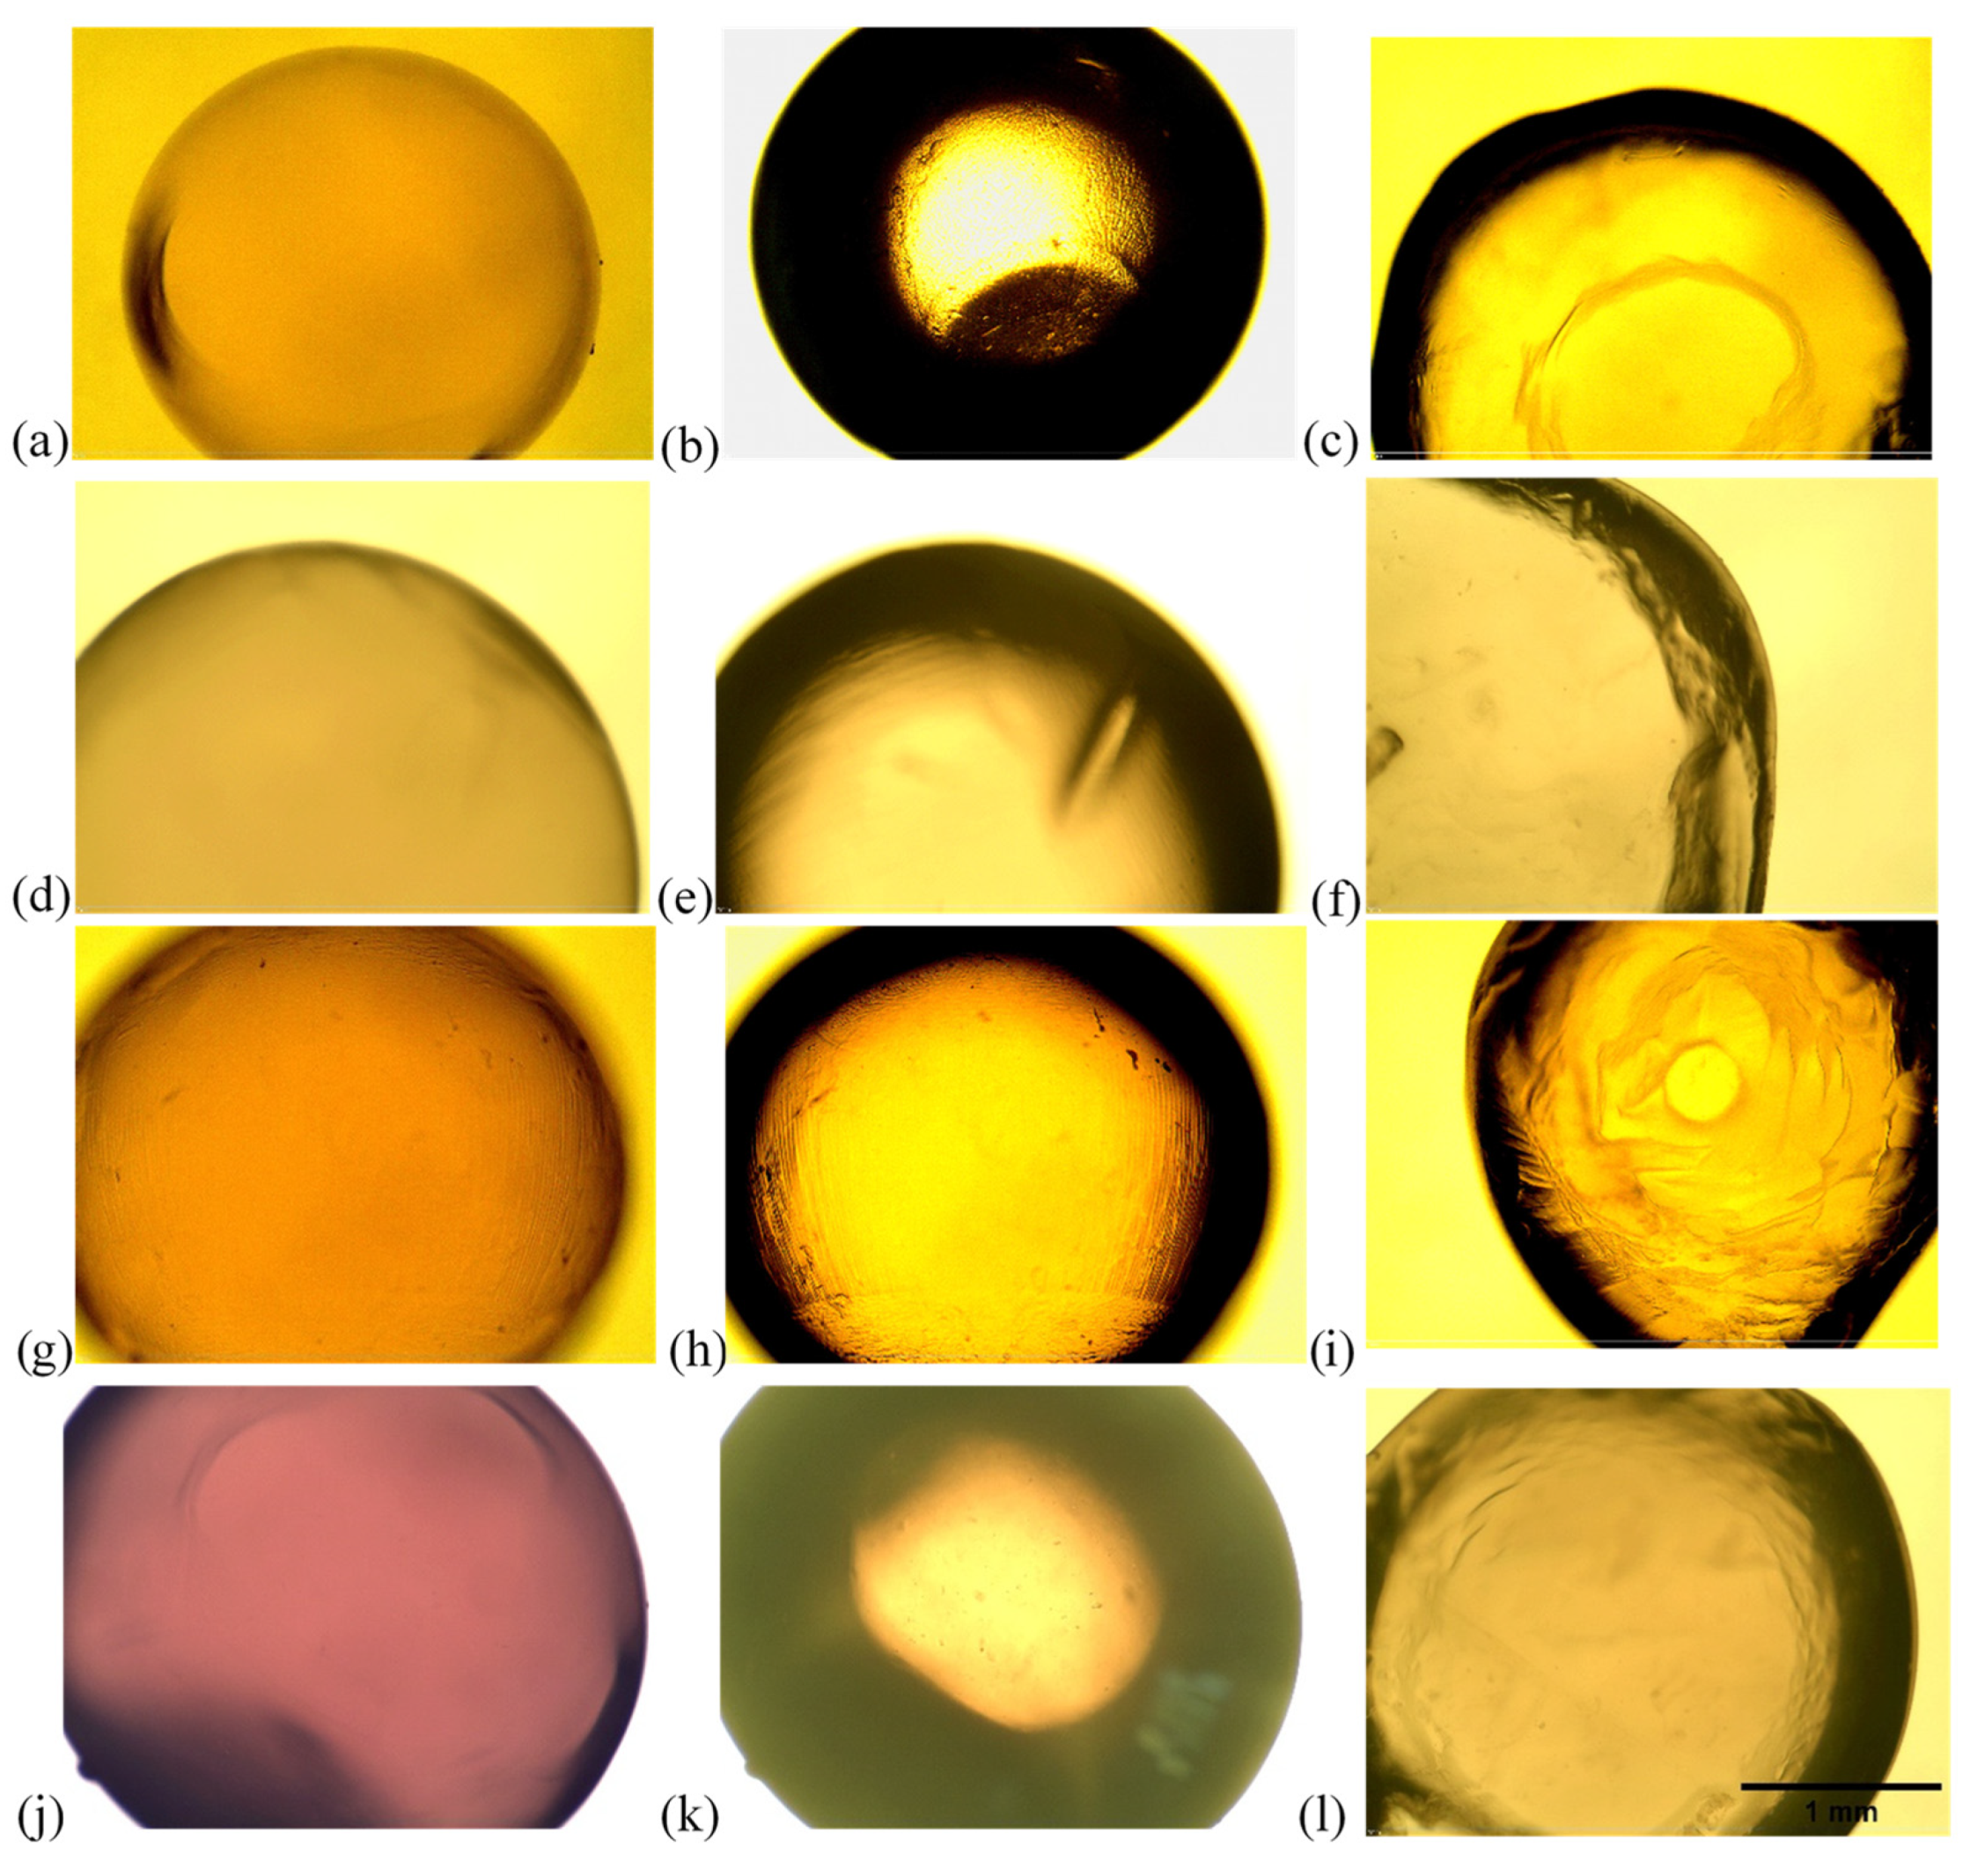
2.3. Microscopic Characterization of the Alginate Beads
2.4. Mathematical Modeling of the Adsorption and the Desorption (Release) Processes
2.4.1. Adsorption Kinetics Modeling
2.4.2. Desorption (Release) Kinetics Modeling
3. Conclusions
4. Materials and Methods
4.1. Materials
4.2. Methods
4.2.1. Adsorption Experiments
Production of Plain Alginate Beads for the Adsorption Experiments
Adsorption Experiments Procedure
4.2.2. Desorption Experiments
Production of Adsorbate-Containing Alginate Beads for the Desorption Experiments
Desorption Experiments Procedure
4.2.3. Microscopic Characterization of the Alginate Hydrogel Microbeads
4.2.4. Analysis of the Supernatants Collected during the Adsorption and Desorption Experiments
Glucose Concentration Measurement
Gallic Acid Concentration Measurement Using the Folin–Ciocalteu Reagent
Protein Concentration Measurement
4.2.5. Data Analysis and Mathematical Modeling
4.2.6. Statistical Analysis
Author Contributions
Funding
Institutional Review Board Statement
Informed Consent Statement
Data Availability Statement
Conflicts of Interest
References
- Corrêa-Filho, L.C.; Moldão-Martins, M.; Alves, V.D. Advances in the Application of Microcapsules as Carriers of Functional Compounds for Food Products. Appl. Sci. 2019, 9, 571. [Google Scholar] [CrossRef]
- Puscaselu, R.G.; Lobiuc, A.; Dimian, M.; Covasa, M. Alginate: From Food Industry to Biomedical Applications and Management of Metabolic Disorders. Polymers 2020, 12, 2417. [Google Scholar] [CrossRef] [PubMed]
- Brownlee, I.A.; Seal, C.J.; Wilcox, M.; Dettmar, P.W.; Pearson, J.P. Applications of Alginates in Food. Alginates Biol. Appl. 2009, 13, 211–228. [Google Scholar] [CrossRef]
- Bi, D.; Yang, X.; Yao, L.; Hu, Z.; Li, H.; Xu, X.; Lu, J. Potential Food and Nutraceutical Applications of Alginate: A Review. Mar. Drugs 2022, 20, 564. [Google Scholar] [CrossRef]
- Yim, Z.H.; Tiong, C.B.; Mansa, R.F.; Ravindra, P.; Chan, E.S. Release Kinetics of Encapsulated Herbal Antioxidants during Gelation Process. J. Appl. Sci. 2010, 10, 2668–2672. [Google Scholar] [CrossRef]
- Yudaev, P.; Semenova, A.; Chistyakov, E. Gel Based on Modified Chitosan for Oil Spill Cleanup. J. Appl. Polym. Sci. 2024, 141, e54838. [Google Scholar] [CrossRef]
- Peng, X.; Umer, M.; Pervez, M.N.; Hasan, K.M.F.; Habib, M.A.; Islam, M.S.; Lin, L.; Xiong, X.; Naddeo, V.; Cai, Y. Biopolymers-Based Microencapsulation Technology for Sustainable Textiles Development: A Short Review. Case Stud. Chem. Environ. Eng. 2023, 7, 100349. [Google Scholar] [CrossRef]
- Plazinski, W.; Dziuba, J.; Rudzinski, W. Modeling of Sorption Kinetics: The Pseudo-Second Order Equation and the Sorbate Intraparticle Diffusivity. Adsorption 2013, 19, 1055–1064. [Google Scholar] [CrossRef]
- Unuabonah, E.I.; Omorogie, M.O.; Oladoja, N.A. Modeling in Adsorption: Fundamentals and Applications. In Composite Nanoadsorbents; Elsevier: Amsterdam, The Netherlands, 2019; pp. 85–118. [Google Scholar] [CrossRef]
- Sahoo, T.R.; Prelot, B. Adsorption Processes for the Removal of Contaminants from Wastewater: The Perspective Role of Nanomaterials and Nanotechnology. In Nanomaterials for the Detection and Removal of Wastewater Pollutants; Elsevier: Amsterdam, The Netherlands, 2020; pp. 161–222. [Google Scholar] [CrossRef]
- Sharma, G.; Naushad, M.; Kumar, A.; Rana, S.; Sharma, S.; Bhatnagar, A.; Stadler, F.J.; Ghfar, A.A.; Khan, M.R. Efficient Removal of Coomassie Brilliant Blue R-250 Dye Using Starch/Poly(Alginic Acid-Cl-Acrylamide) Nanohydrogel. Process Saf. Environ. Prot. 2017, 109, 301–310. [Google Scholar] [CrossRef]
- Bruschi, M.L. Strategies to Modify the Drug Release from Pharmaceutical Systems; Woodhead Publishing: Sawston, UK, 2015; ISBN 9780081000922. [Google Scholar]
- Seida, Y.; Tokuyama, H. Hydrogel Adsorbents for the Removal of Hazardous Pollutants—Requirements and Available Functions as Adsorbent. Gels 2022, 8, 220. [Google Scholar] [CrossRef]
- Hossain, M.S.; Hossain, M.M.; Khatun, M.K.; Hossain, K.R. Hydrogel-Based Superadsorbents for Efficient Removal of Heavy Metals in Industrial Wastewater Treatment and Environmental Conservation. Environ. Funct. Mater. 2024, in press. [Google Scholar] [CrossRef]
- Darban, Z.; Shahabuddin, S.; Gaur, R.; Ahmad, I.; Sridewi, N. Hydrogel-Based Adsorbent Material for the Effective Removal of Heavy Metals from Wastewater: A Comprehensive Review. Gels 2022, 8, 263. [Google Scholar] [CrossRef] [PubMed]
- Zieman, J.; Cohan, M.; Wang, Y.; De La Sancha, A.; Kanungo, M.; Azzouz, R.; Smith, R.; Schmidt, K.; Kumpaty, S.; Chen, J.; et al. Development of Gelatin-Coated Hydrogel Microspheres for Novel Bioink Design: A Crosslinker Study. Pharmaceutics 2023, 15, 90. [Google Scholar] [CrossRef]
- Motelica, L.; Ficai, D.; Oprea, O.C.; Ficai, A.; Ene, V.L.; Vasile, B.S.; Andronescu, E.; Holban, A.M. Antibacterial Biodegradable Films Based on Alginate with Silver Nanoparticles and Lemongrass Essential Oil–Innovative Packaging for Cheese. Nanomaterials 2021, 11, 2377. [Google Scholar] [CrossRef]
- Geetha, P.; Latha, M.S.; Koshy, M. Biosorption of Malachite Green Dye from Aqueous Solution by Calcium Alginate Nanoparticles: Equilibrium Study. J. Mol. Liq. 2015, 212, 723–730. [Google Scholar] [CrossRef]
- Nochos, A.; Douroumis, D.; Bouropoulos, N. In Vitro Release of Bovine Serum Albumin from Alginate/HPMC Hydrogel Beads. Carbohydr. Polym. 2008, 74, 451–457. [Google Scholar] [CrossRef]
- Bušić, A.; Belščak-Cvitanović, A.; Vojvodić Cebin, A.; Karlović, S.; Kovač, V.; Špoljarić, I.; Mršić, G.; Komes, D. Structuring New Alginate Network Aimed for Delivery of Dandelion (Taraxacum officinale L.) Polyphenols Using Ionic Gelation and New Filler Materials. Food Res. Int. 2018, 111, 244–255. [Google Scholar] [CrossRef]
- Benković, M.; Sarić, I.; Jurinjak Tušek, A.; Jurina, T.; Gajdoš Kljusurić, J.; Valinger, D. Analysis of the Adsorption and Release Processes of Bioactives from Lamiaceae Plant Extracts on Alginate Microbeads. Food Bioprocess Technol. 2021, 14, 1216–1230. [Google Scholar] [CrossRef]
- Lopez-Sanchez, P.; Assifaoui, A.; Cousin, F.; Moser, J.; Bonilla, M.R.; Ström, A. Impact of Glucose on the Nanostructure and Mechanical Properties of Calcium-Alginate Hydrogels. Gels 2022, 8, 71. [Google Scholar] [CrossRef]
- Li, W.; Chen, W.; Wang, Z.; Chen, W.; Zhang, M.; Zhong, Q.; Chen, H.; Pei, J. Preparation and Characterization of Beads of Sodium Alginate/Carboxymethyl Chitosan/Cellulose Nanofiber Containing Porous Starch Embedded with Gallic Acid: An In Vitro Simulation Delivery Study. Foods 2022, 11, 1394. [Google Scholar] [CrossRef]
- Yamagiwa, K.; Kozawa, T.; Ohkawa, A. Effects of Alginate Composition and Gelling Conditions on Diffusional and Mechanical Properties of Calcium-Alginate Gel Beads. J. Chem. Eng. Jpn. 1995, 28, 462–467. [Google Scholar] [CrossRef]
- Jiao, W.; Chen, W.; Mei, Y.; Yun, Y.; Wang, B.; Zhong, Q.; Chen, H.; Chen, W. Effects of Molecular Weight and Guluronic Acid/Mannuronic Acid Ratio on the Rheological Behavior and Stabilizing Property of Sodium Alginate. Molecules 2019, 24, 4374. [Google Scholar] [CrossRef] [PubMed]
- Mohammed, C.; Lalgee, L.; Kistow, M.; Jalsa, N.; Ward, K. On the Binding Affinity and Thermodynamics of Sodium Alginate-Heavy Metal Ion Interactions for Efficient Adsorption. Carbohydr. Polym. Technol. Appl. 2022, 3, 100203. [Google Scholar] [CrossRef]
- Ramos, P.E.; Silva, P.; Alario, M.M.; Pastrana, L.M.; Teixeira, J.A.; Cerqueira, M.A.; Vicente, A.A. Effect of Alginate Molecular Weight and M/G Ratio in Beads Properties Foreseeing the Protection of Probiotics. Food Hydrocoll. 2018, 77, 8–16. [Google Scholar] [CrossRef]
- Tanaka, H.; Matsumura, M.; Veliky, I.A. Diffusion Characteristics of Substrates in Ca-Alginate Gel Beads. Biotechnol. Bioeng. 1984, 26, 53–58. [Google Scholar] [CrossRef]
- Mehmetoğlu, Ü.; Hacimusalar, M. Determination of the Effective Diffusion Coefficient of Glucose in Calcium Alginate Gel Using the Moment Analysis Technique. In Recent Advances in Biotechnology; Springer: Dordrecht, The Netherlands, 1992; pp. 383–388. [Google Scholar] [CrossRef]
- Venâncio, A.; Teixeira, J.A. Characterization of Sugar Diffusion Coefficients in Alginate Membranes. Biotechnol. Tech. 1997, 11, 183–186. [Google Scholar] [CrossRef]
- Kuo, C.K.; Ma, P.X. Controlling Diffusion of Solutes through Ionically Crosslinked Alginate Hydrogels Designed for Tissue Engineering. Mater. Res. Soc. Symp.-Proc. 2001, 662, 1–6. [Google Scholar] [CrossRef]
- Kalam, S.; Abu-Khamsin, S.A.; Kamal, M.S.; Patil, S. Surfactant Adsorption Isotherms: A Review. ACS Omega 2021, 6, 32342. [Google Scholar] [CrossRef]
- Essifi, K.; Brahmi, M.; Berraaouan, D.; Ed-Daoui, A.; El Bachiri, A.; Fauconnier, M.L.; Tahani, A. Influence of Sodium Alginate Concentration on Microcapsules Properties Foreseeing the Protection and Controlled Release of Bioactive Substances. J. Chem. 2021, 2021, 5531479. [Google Scholar] [CrossRef]
- Machado, A.R.; Silva, P.M.P.; Vicente, A.A.; Souza-Soares, L.A.; Pinheiro, A.C.; Cerqueira, M.A. Alginate Particles for Encapsulation of Phenolic Extract from Spirulina Sp. LEB-18: Physicochemical Characterization and Assessment of In Vitro Gastrointestinal Behavior. Polymers 2022, 14, 4759. [Google Scholar] [CrossRef] [PubMed]
- Essifi, K.; Lakrat, M.; Berraaouan, D.; Fauconnier, M.L.; El Bachiri, A.; Tahani, A. Optimization of Gallic Acid Encapsulation in Calcium Alginate Microbeads Using Box-Behnken Experimental Design. Polym. Bull. 2021, 78, 5789–5814. [Google Scholar] [CrossRef]
- Chuang, J.J.; Huang, Y.Y.; Lo, S.H.; Hsu, T.F.; Huang, W.Y.; Huang, S.L.; Lin, Y.S. Effects of PH on the Shape of Alginate Particles and Its Release Behavior. Int. J. Polym. Sci. 2017, 2017, 3902704. [Google Scholar] [CrossRef]
- Michaux, M.; Salinas, N.; Miras, J.; Vílchez, S.; González-Azón, C.; Esquena, J. Encapsulation of BSA/Alginate Water–in–Water Emulsions by Polyelectrolyte Complexation. Food Hydrocoll. 2021, 113, 106406. [Google Scholar] [CrossRef]
- Silverio, G.B.; Sakanaka, L.S.; Alvim, I.D.; Shirai, M.A.; Grosso, C.R.F. Production and Characterization of Alginate Microparticles Obtained by Ionic Gelation and Electrostatic Adsorption of Concentrated Soy Protein. Ciência Rural 2018, 48, e20180637. [Google Scholar] [CrossRef]
- Zhao, Y.; Li, F.; Carvajal, M.T.; Harris, M.T. Interactions between Bovine Serum Albumin and Alginate: An Evaluation of Alginate as Protein Carrier. J. Colloid Interface Sci. 2009, 332, 345–353. [Google Scholar] [CrossRef]
- Belščak-Cvitanovic, A.; Bušić, A.; Barišić, L.; Vrsaljko, D.; Karlović, S.; Špoljarić, I.; Vojvodić, A.; Mršić, G.; Komes, D. Emulsion Templated Microencapsulation of Dandelion (Taraxacum officinale L.) Polyphenols and β-Carotene by Ionotropic Gelation of Alginate and Pectin. Food Hydrocoll. 2016, 57, 139–152. [Google Scholar] [CrossRef]
- Lozano-Vazquez, G.; Lobato-Calleros, C.; Escalona-Buendia, H.; Chavez, G.; Alvarez-Ramirez, J.; Vernon-Carter, E.J. Effect of the Weight Ratio of Alginate-Modified Tapioca Starch on the Physicochemical Properties and Release Kinetics of Chlorogenic Acid Containing Beads. Food Hydrocoll. 2015, 48, 301–311. [Google Scholar] [CrossRef]
- Xu, X.; Han, Q.; Shi, J.; Zhang, H.; Wang, Y. Structural, Thermal and Rheological Characterization of Bovine Serum Albumin Binding with Sodium Alginate. J. Mol. Liq. 2020, 299, 112123. [Google Scholar] [CrossRef]
- Suksamran, T.; Opanasopit, P.; Rojanarata, T.; Ngawhirunpat, T.; Ruktanonchai, U.; Supaphol, P. Biodegradable Alginate Microparticles Developed by Electrohydrodynamic Spraying Techniques for Oral Delivery of Protein. J. Microencapsul. 2009, 26, 563–570. [Google Scholar] [CrossRef] [PubMed]
- Dima, C.; Pətraşcu, L.; Cantaragiu, A.; Alexe, P.; Dima, Ş. The Kinetics of the Swelling Process and the Release Mechanisms of Coriandrum sativum L. Essential Oil from Chitosan/Alginate/Inulin Microcapsules. Food Chem. 2016, 195, 39–48. [Google Scholar] [CrossRef]
- Simonin, J.P. On the Comparison of Pseudo-First Order and Pseudo-Second Order Rate Laws in the Modeling of Adsorption Kinetics. Chem. Eng. J. 2016, 300, 254–263. [Google Scholar] [CrossRef]
- Rezaei, A.; Nasirpour, A. Evaluation of Release Kinetics and Mechanisms of Curcumin and Curcumin-β-Cyclodextrin Inclusion Complex Incorporated in Electrospun Almond Gum/PVA Nanofibers in Simulated Saliva and Simulated Gastrointestinal Conditions. Bionanoscience 2019, 9, 438–445. [Google Scholar] [CrossRef]
- Lopez-Sanchez, P.; Fredriksson, N.; Larsson, A.; Altskär, A.; Ström, A. High Sugar Content Impacts Microstructure, Mechanics and Release of Calcium-Alginate Gels. Food Hydrocoll. 2018, 84, 26–33. [Google Scholar] [CrossRef]
- Wind, M.M.; Lenderink, H.J.W. A Capacitance Study of Pseudo-Fickian Diffusion in Glassy Polymer Coatings. Prog. Org. Coat. 1996, 28, 239–250. [Google Scholar] [CrossRef]
- Neiser, S.; Draget, K.I.; Smidsrød, O. Interactions in Bovine Serum Albumin–Calcium Alginate Gel Systems. Food Hydrocoll. 1999, 13, 445–458. [Google Scholar] [CrossRef]
- Sreya, E.S.; Kumar, D.P.; Balakrishnan, P.; Gopi, S. Science and Technology of Alginates: A Review. In Handbook of Biomass; Springer: Singapore, 2023; Volume 1, pp. 1–28. [Google Scholar] [CrossRef]
- Birkić, A.; Valinger, D.; Jurinjak Tušek, A.; Jurina, T.; Gajdoš Kljusurić, J.; Benković, M. Evaluation of the Adsorption and Desorption Dynamics of Beet Juice Red Dye on Alginate Microbeads. Gels 2021, 8, 13. [Google Scholar] [CrossRef]
- Singleton, V.L.; Rossi, J.A. Colorimetry of Total Phenolics with Phosphomolybdic-Phosphotungstic Acid Reagents. Am. J. Enol. Vitic. 1965, 16, 144–158. [Google Scholar] [CrossRef]
- Kielkopf, C.L.; Bauer, W.; Urbatsch, I.L. Bradford Assay for Determining Protein Concentration. Cold Spring Harb. Protoc. 2020, 2020, 136–138. [Google Scholar] [CrossRef]
- Dahri, M.K.; Kooh, M.R.R.; Lim, L.B.L. Application of Casuarina Equisetifolia Needle for the Removal of Methylene Blue and Malachite Green Dyes from Aqueous Solution. Alex. Eng. J. 2015, 54, 1253–1263. [Google Scholar] [CrossRef]


| Model/Parameter | Glucose | Gallic Acid | BSA |
|---|---|---|---|
| Pseudo-first-order | |||
| qe (g/g beads) | 0.00042 ± 0.00025 | 0.00855 ± 0.00612 | 0.03299 ± 0.00269 |
| k1 (min−1) | 0.203 ± 0.041 | 2.008 ± 7.12471 | 0.124 ± 0.030 |
| h0 (g/g beads min) | 8.534 × 10⁻⁵ | 0.017 | 0.0041 |
| R2 | 0.9340 | 0.7469 | 0.9429 |
| Pseudo-second-order | |||
| qe (g/g beads) | 0.00047 ± 0.00026 | 0.0087 ± 0.0010 | 0.03795 ± 0.00409 |
| k2 (g beads/g min) | 0.51215 ± 0.13758 | 771.0248 ± 2914.105 | 3.6776 ± 1.6348 |
| h0 (g/g beads min) | 2.407 × 10⁻⁴ | 0.0583 | 0.00530 |
| R2 | 0.9649 | 0.7847 | 0.9347 |
| Weber–Morris | |||
| ki (g/g beads min0.5) | 0.000047 ± 0.0000 | 0.000324 ± 0.000205 | 0.00338 ± 0.00080 |
| C (g/g) | 0.00016 ± 0.00003 | 0.00615 ± 0.001137 | 0.006536 ± 0.00388 |
| R2 | 0.9321 | 0.4140 | 0.8167 |
| Model/Parameter | Glucose | Gallic Acid | BSA |
|---|---|---|---|
| First-order | |||
| Me (mg/g beads) | 5.0368 ± 0.34470 | 5.52911 ± 0.32344 | 4.64360 ± 0.16520 |
| k (min−1) | 0.13593 ± 0.02021 | 0.28160 ± 0.03082 | 0.02019 ± 0.00188 |
| R2 | 0.9665 | 0.9804 | 0.9899 |
| Korsmeyer–Peppas | |||
| k (g beads/mg min) | 2.55760 ± 0.16960 | 3.66236 ± 0.20776 | 0.78881 ± 0.11872 |
| n | 0.20632 ± 0.02053 | 0.11653 ± 0.01767 | 0.33692 ± 0.03077 |
| R2 | 0.9784 | 0.9813 | 0.9794 |
| Higuchi | |||
| k (mg/g beads min0.5) | 0.89343 ± 0.09836 | 0.91613 ± 0.11281 | 0.34863 ± 0.01965 |
| R2 | 0.5064 | / | 0.9264 |
Disclaimer/Publisher’s Note: The statements, opinions and data contained in all publications are solely those of the individual author(s) and contributor(s) and not of MDPI and/or the editor(s). MDPI and/or the editor(s) disclaim responsibility for any injury to people or property resulting from any ideas, methods, instructions or products referred to in the content. |
© 2024 by the authors. Licensee MDPI, Basel, Switzerland. This article is an open access article distributed under the terms and conditions of the Creative Commons Attribution (CC BY) license (https://creativecommons.org/licenses/by/4.0/).
Share and Cite
Benković, M.; Laljak, I.; Valinger, D.; Jurina, T.; Sokač Cvetnić, T.; Gajdoš Kljusurić, J.; Jurinjak Tušek, A. Comparison of the Adsorption and Desorption Dynamics of Biological Molecules on Alginate Hydrogel Microcapsules—The Case of Sugars, Polyphenols, and Proteins. Gels 2024, 10, 201. https://doi.org/10.3390/gels10030201
Benković M, Laljak I, Valinger D, Jurina T, Sokač Cvetnić T, Gajdoš Kljusurić J, Jurinjak Tušek A. Comparison of the Adsorption and Desorption Dynamics of Biological Molecules on Alginate Hydrogel Microcapsules—The Case of Sugars, Polyphenols, and Proteins. Gels. 2024; 10(3):201. https://doi.org/10.3390/gels10030201
Chicago/Turabian StyleBenković, Maja, Izvorka Laljak, Davor Valinger, Tamara Jurina, Tea Sokač Cvetnić, Jasenka Gajdoš Kljusurić, and Ana Jurinjak Tušek. 2024. "Comparison of the Adsorption and Desorption Dynamics of Biological Molecules on Alginate Hydrogel Microcapsules—The Case of Sugars, Polyphenols, and Proteins" Gels 10, no. 3: 201. https://doi.org/10.3390/gels10030201