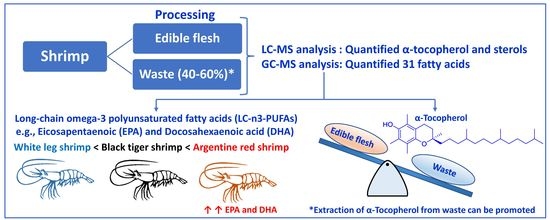
Red Shrimp Are a Rich Source of Nutritionally Vital Lipophilic Compounds: A Comparative Study among Edible Flesh and Processing Waste

 ,
, 
Abstract
:
1. Introduction
2. Materials and Methods
2.1. Raw Materials, Chemicals, and Solvents
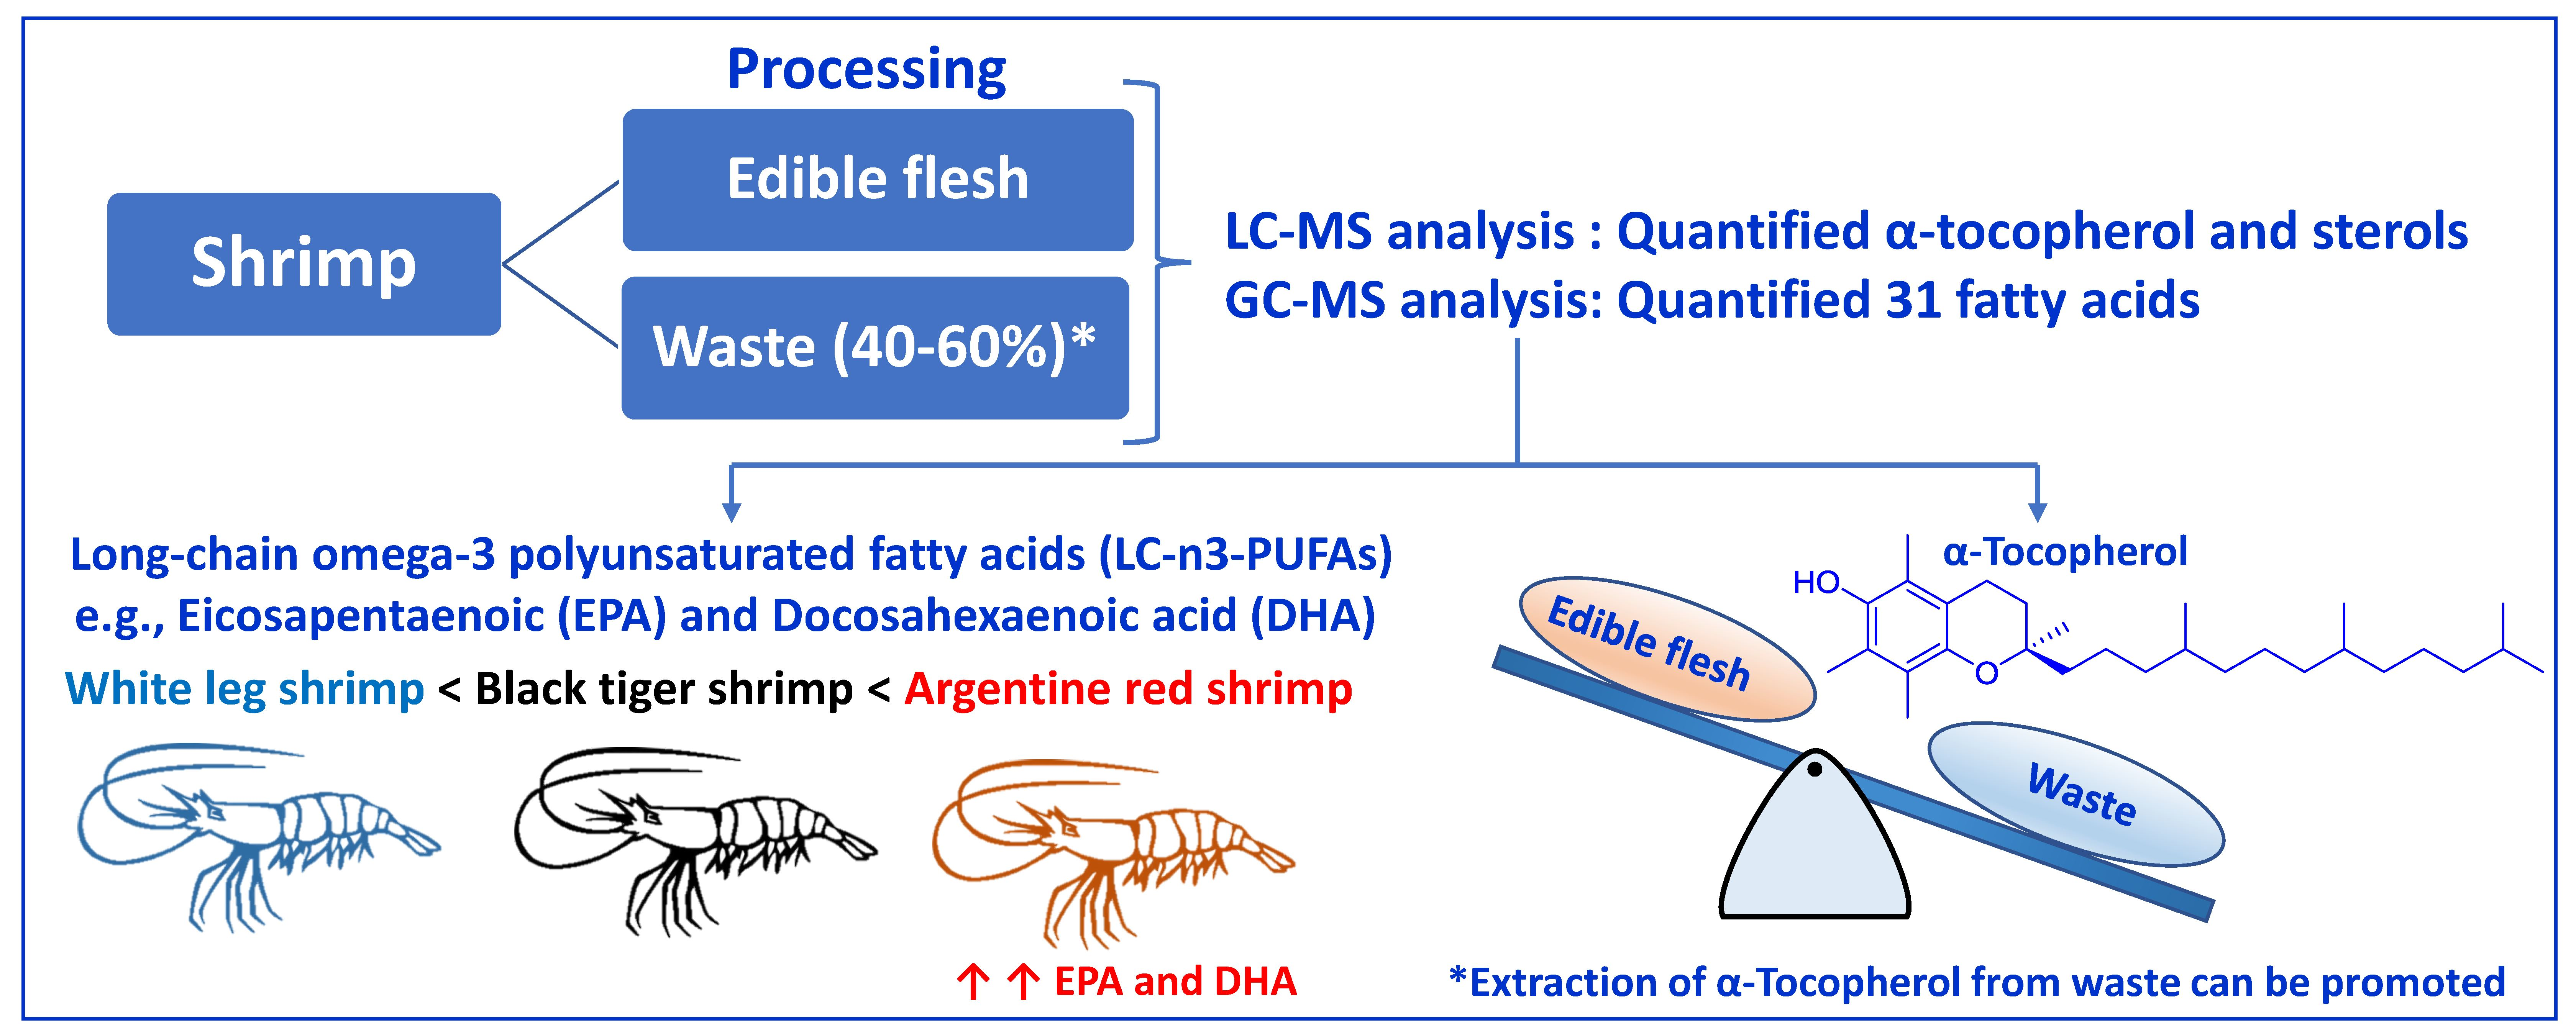
2.2. Extraction of Major Lipophilic Compounds
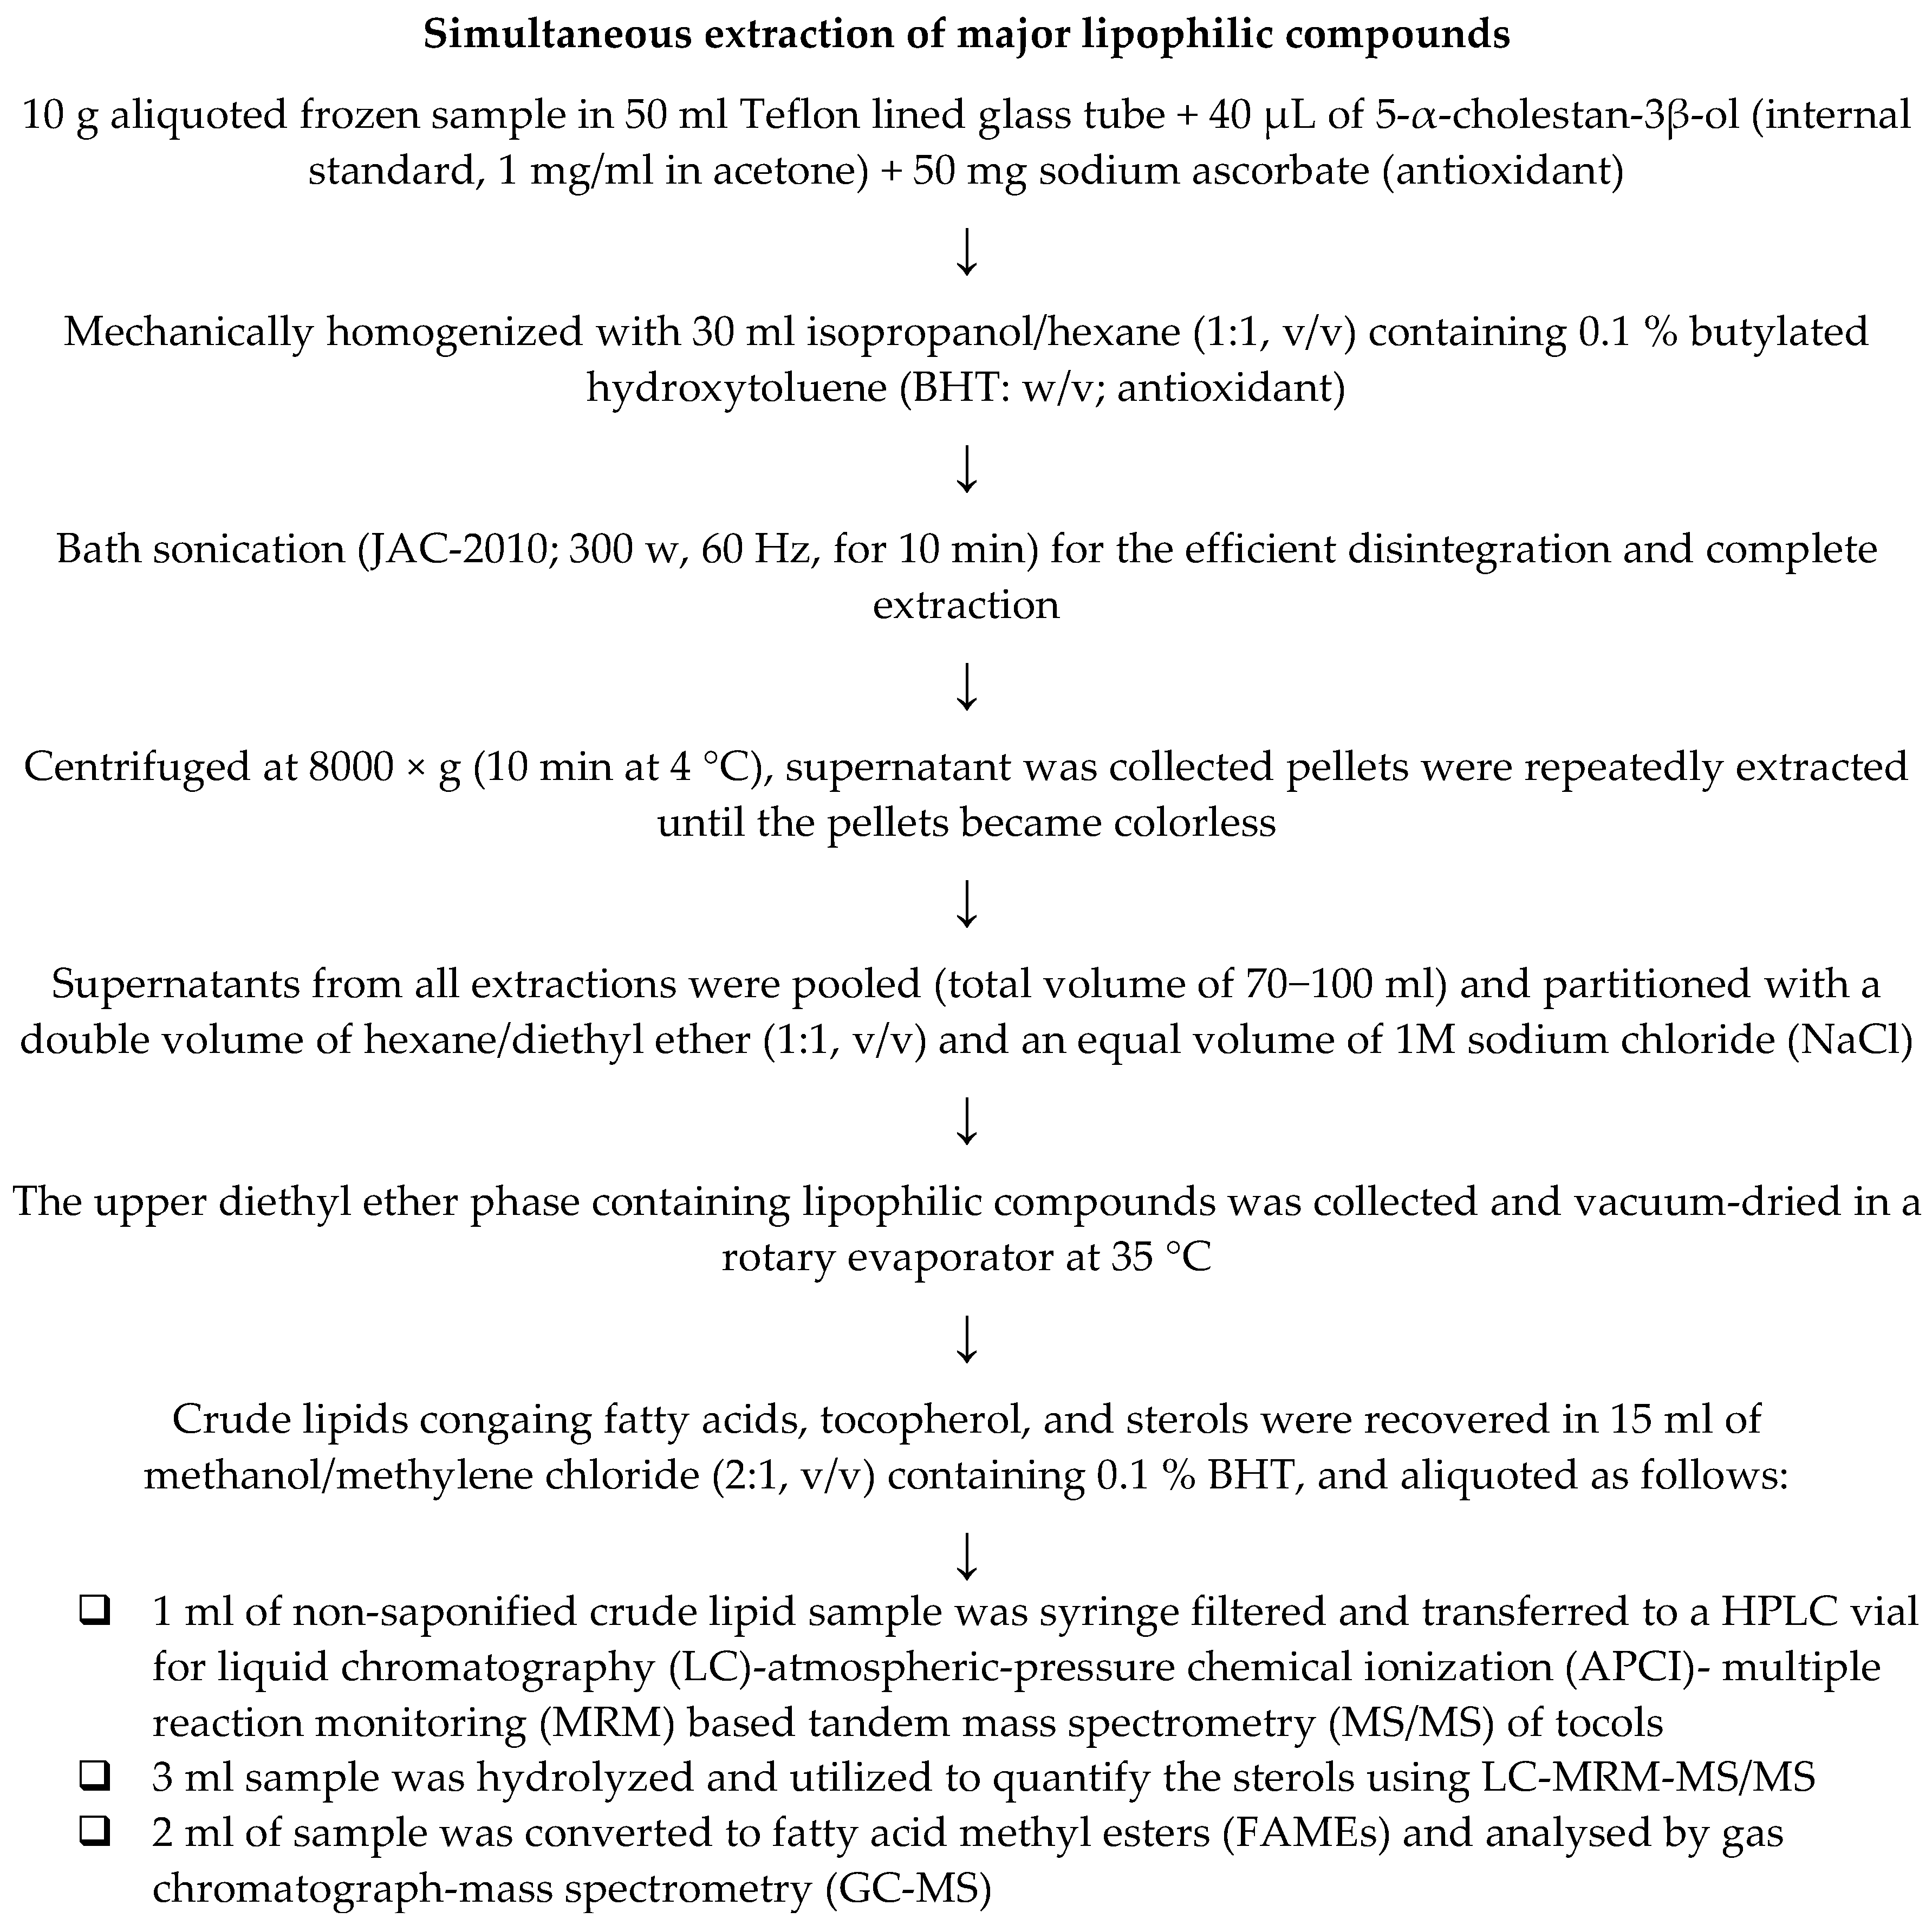
2.3. Analysis of Sterols, Tocols, and Fatty Acid Methyl Esters (FAMEs)
2.4. Calculation of Fat Quality Indices
2.5. Statistical Analysis and Quality Control
3. Results and Discussion
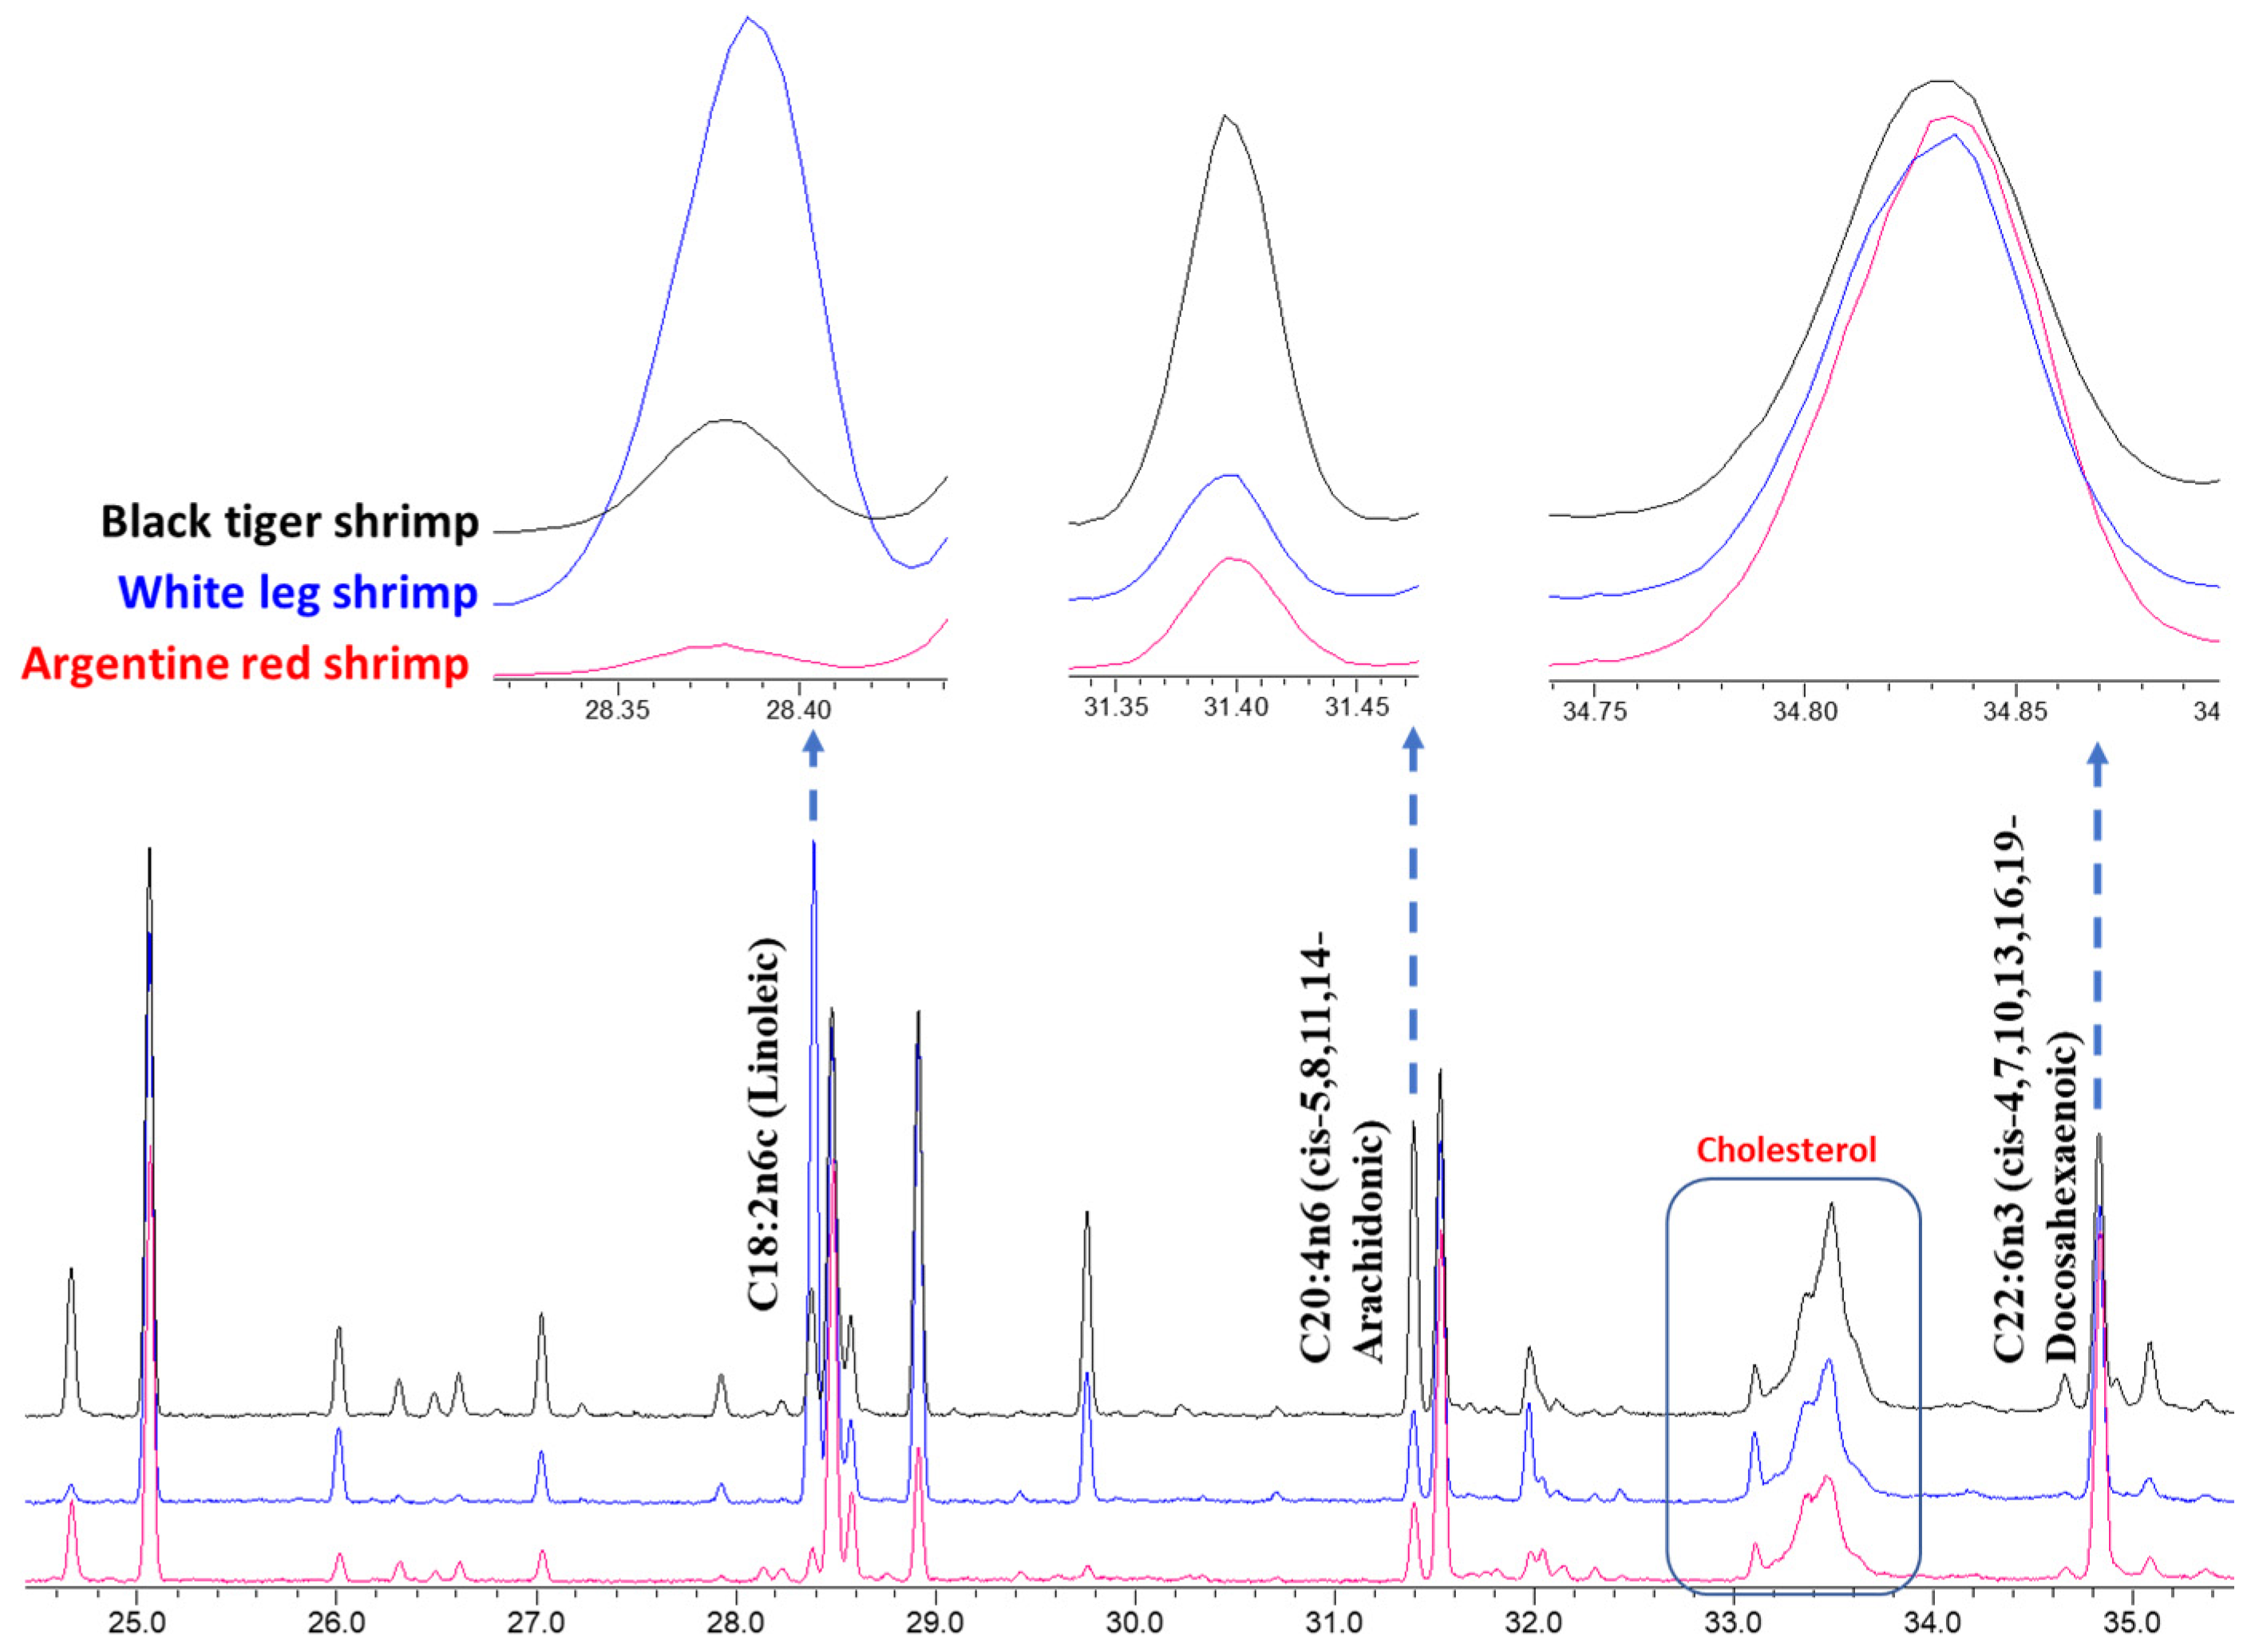
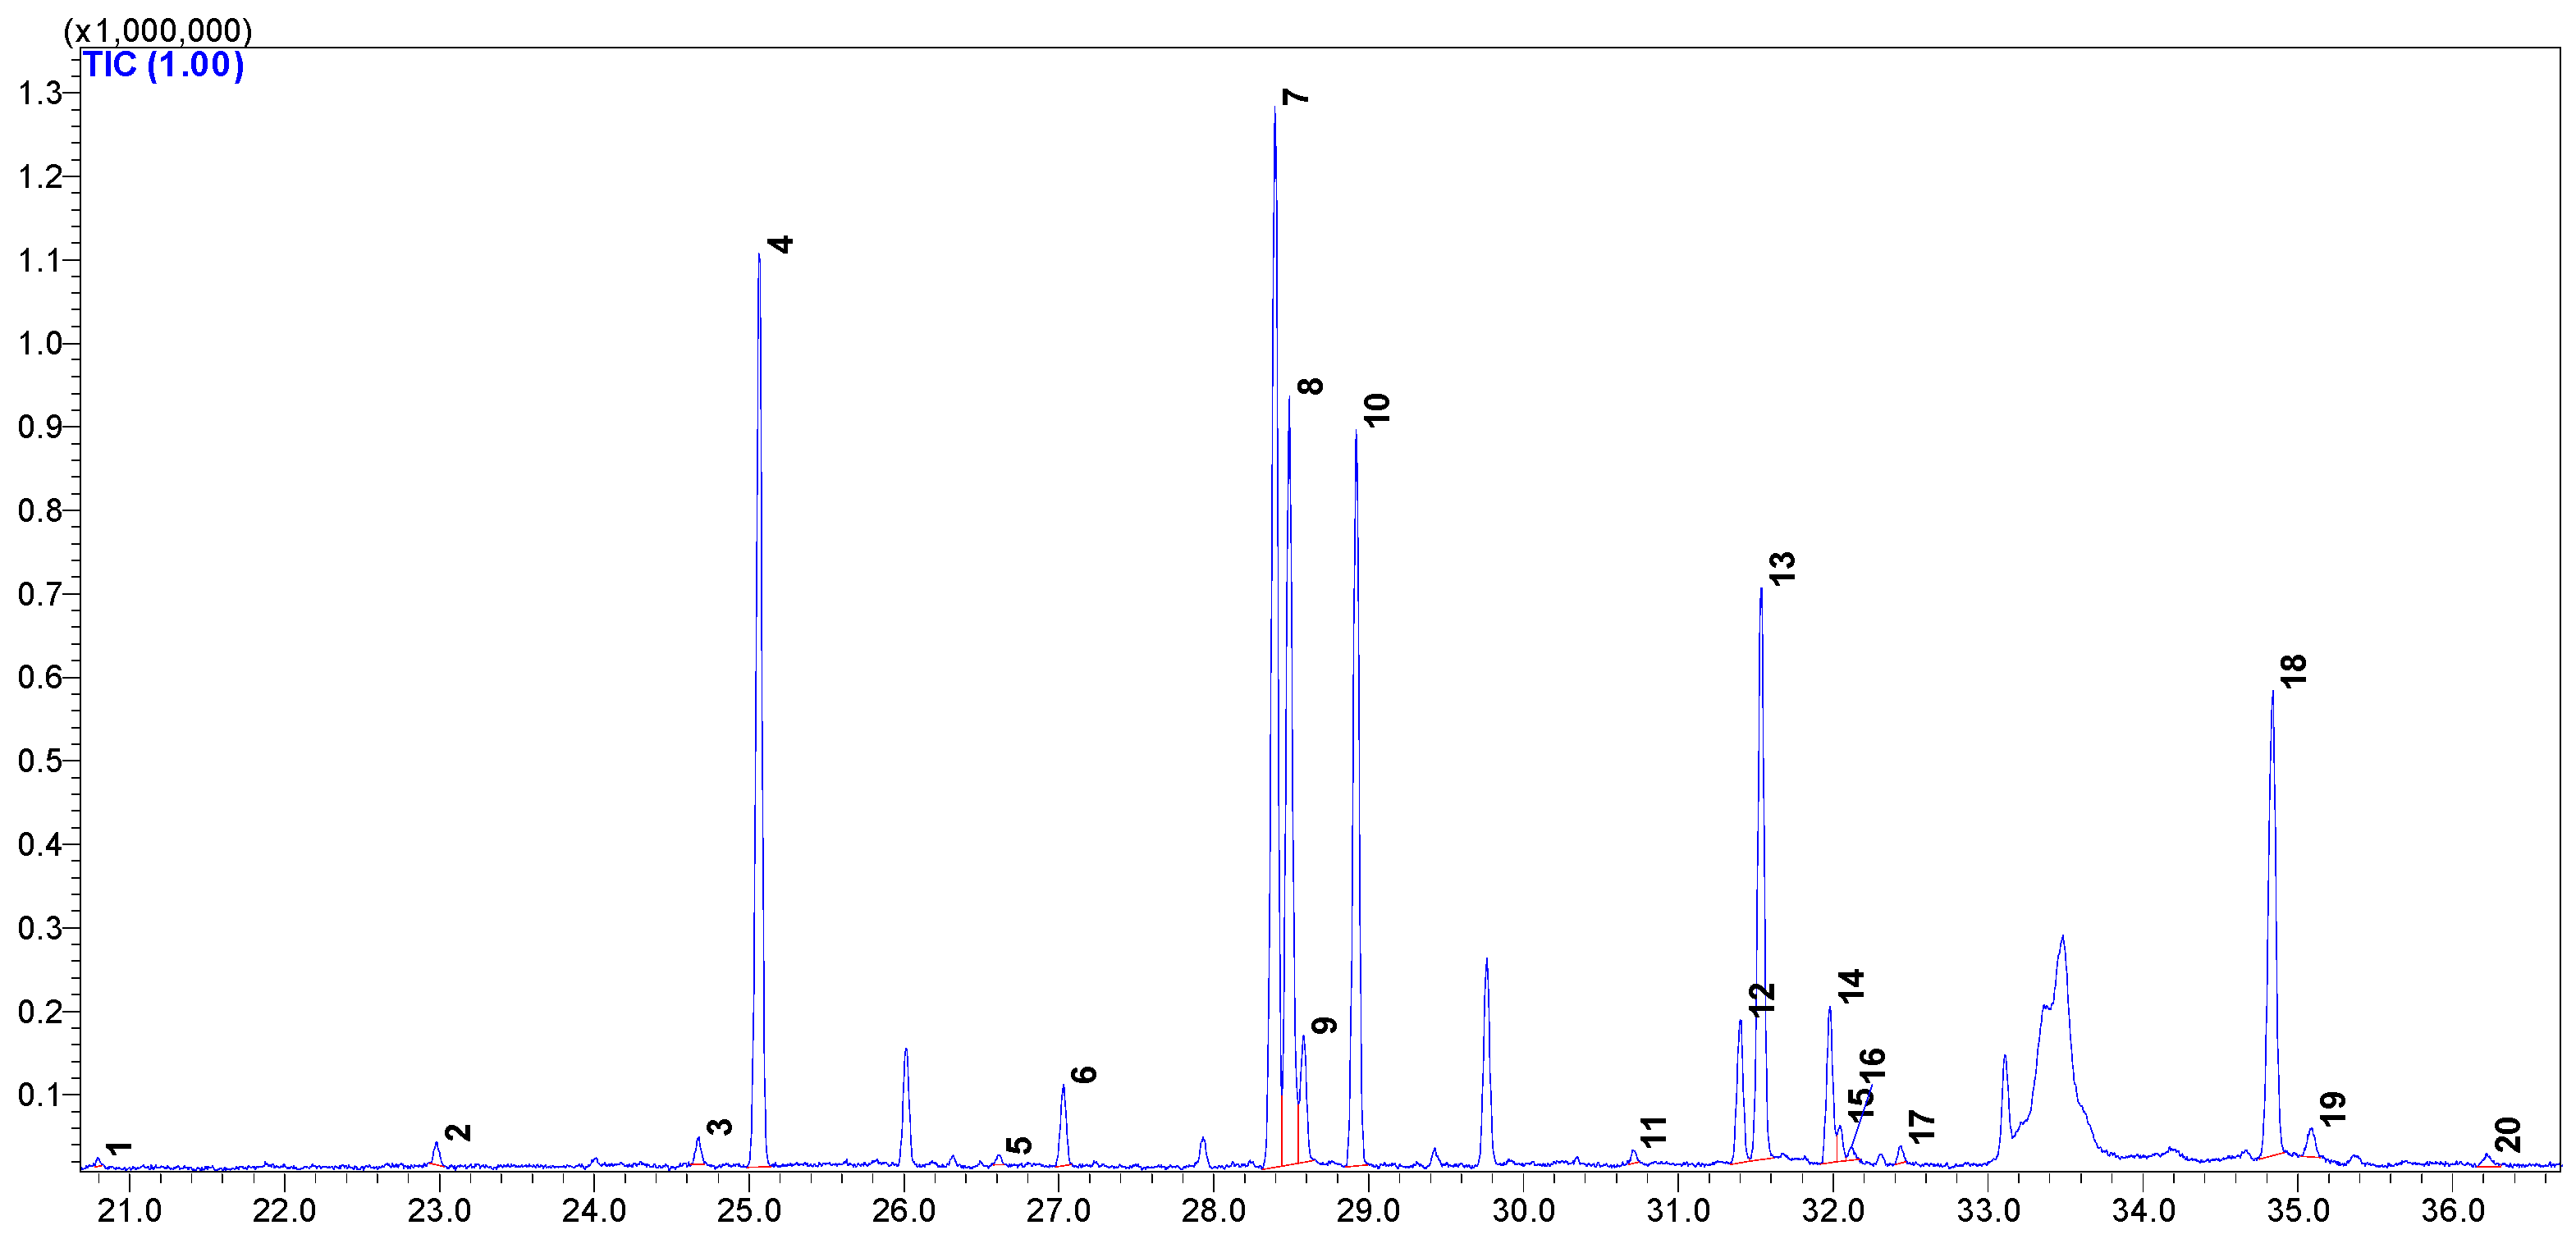
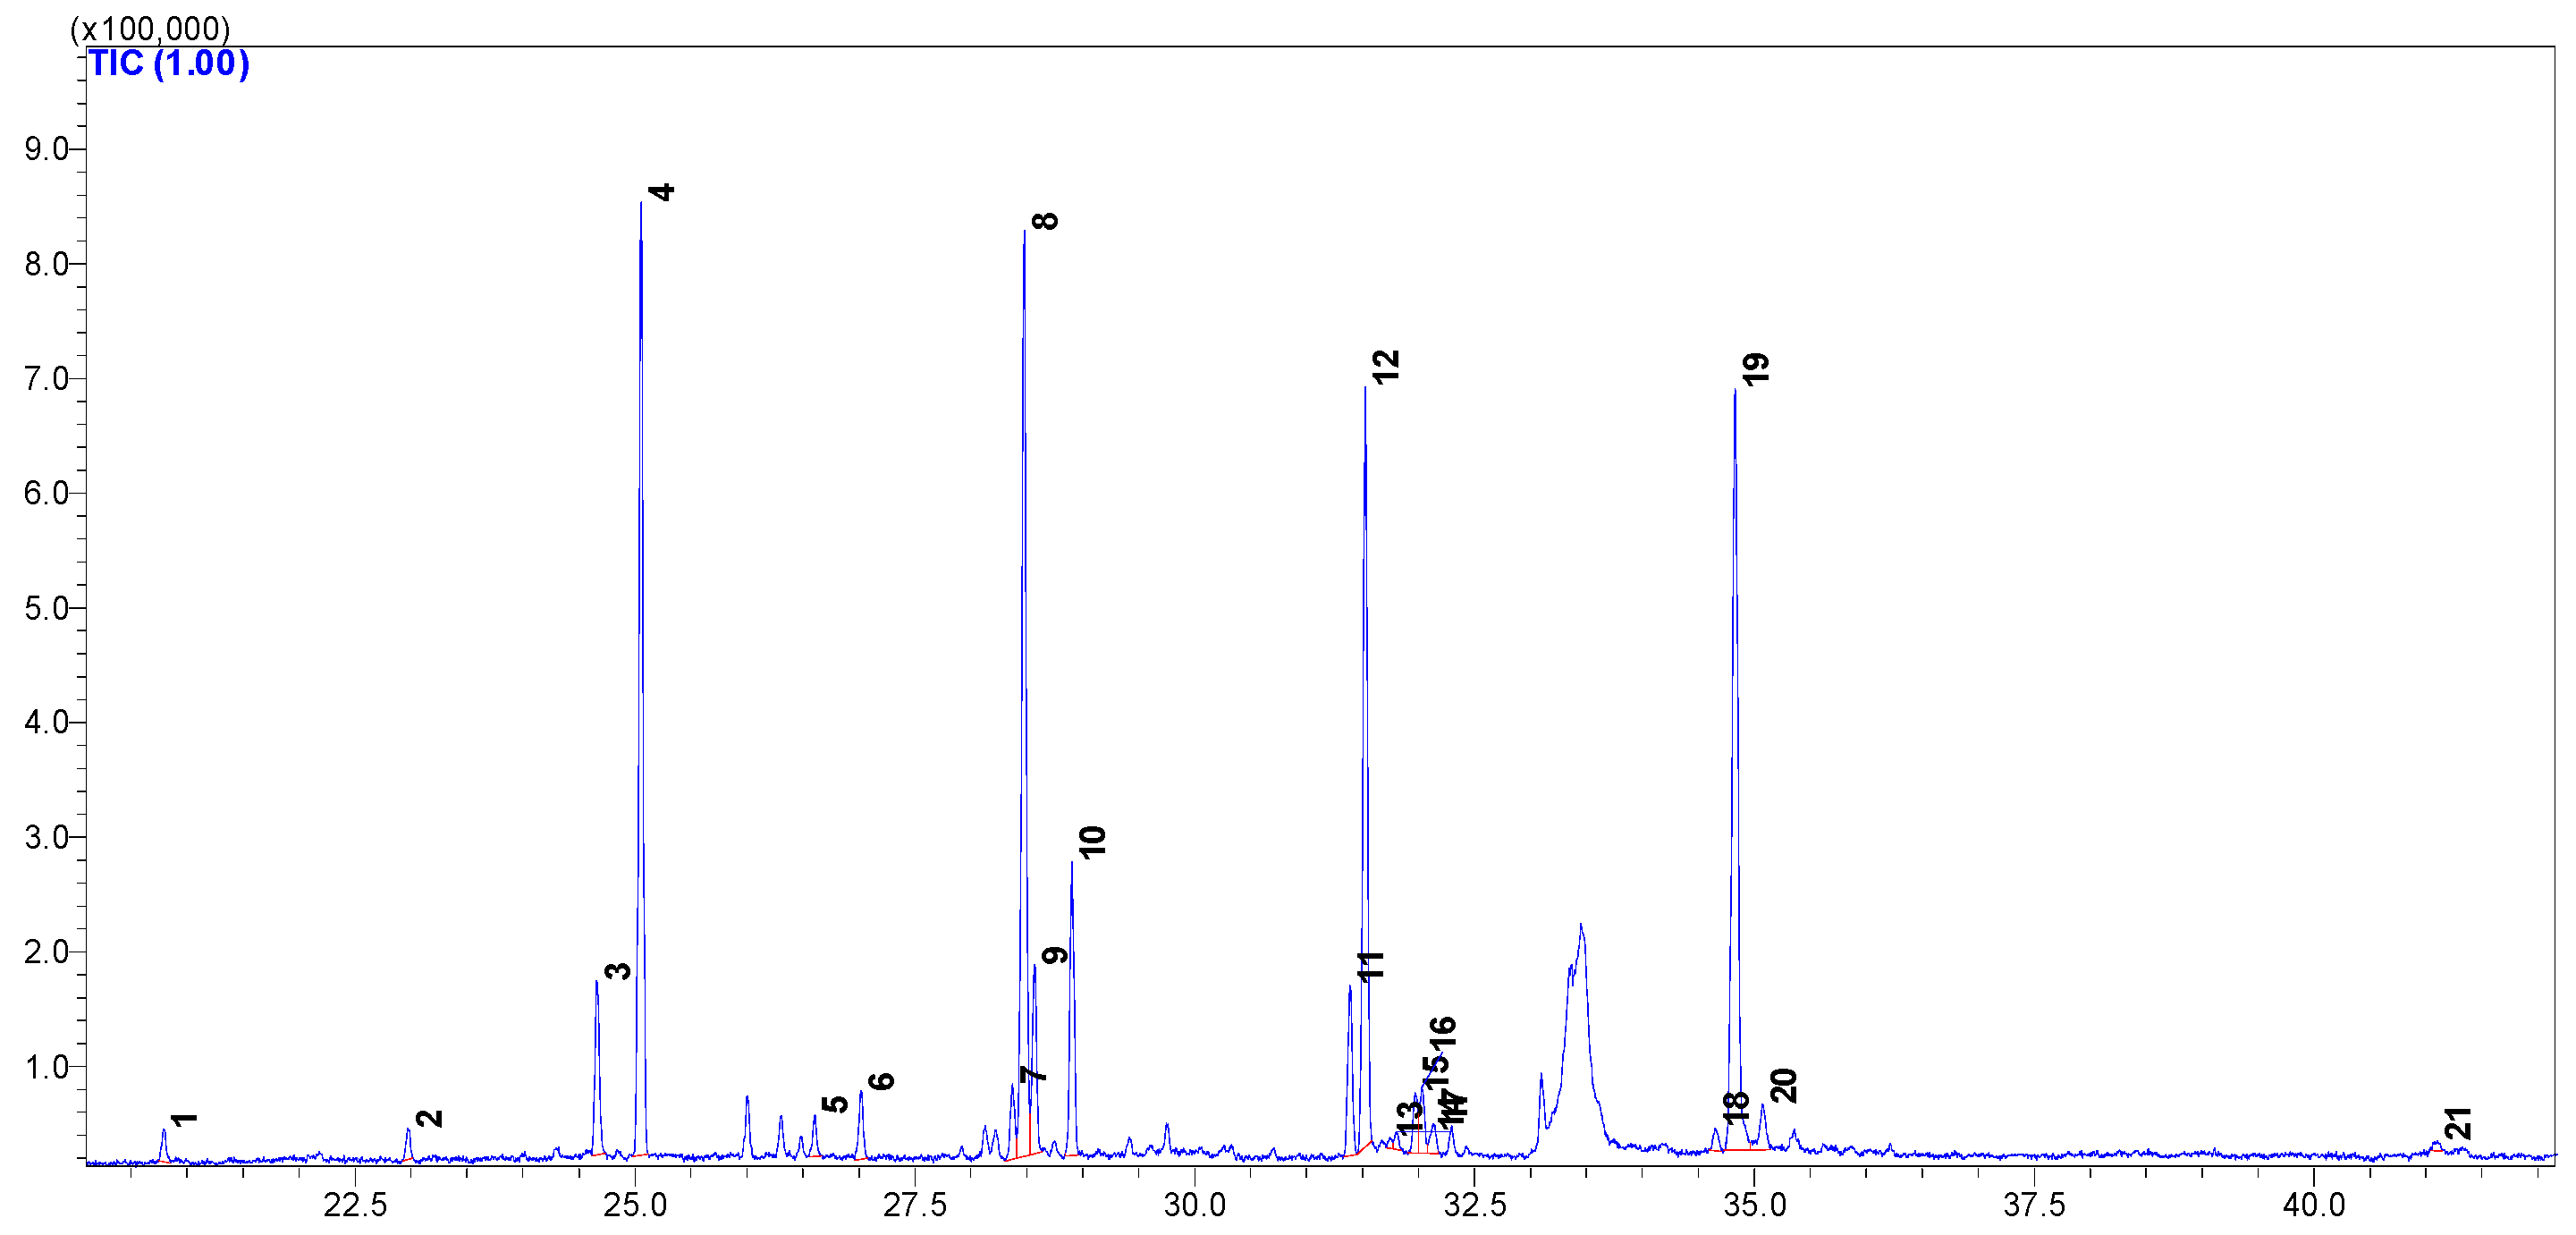
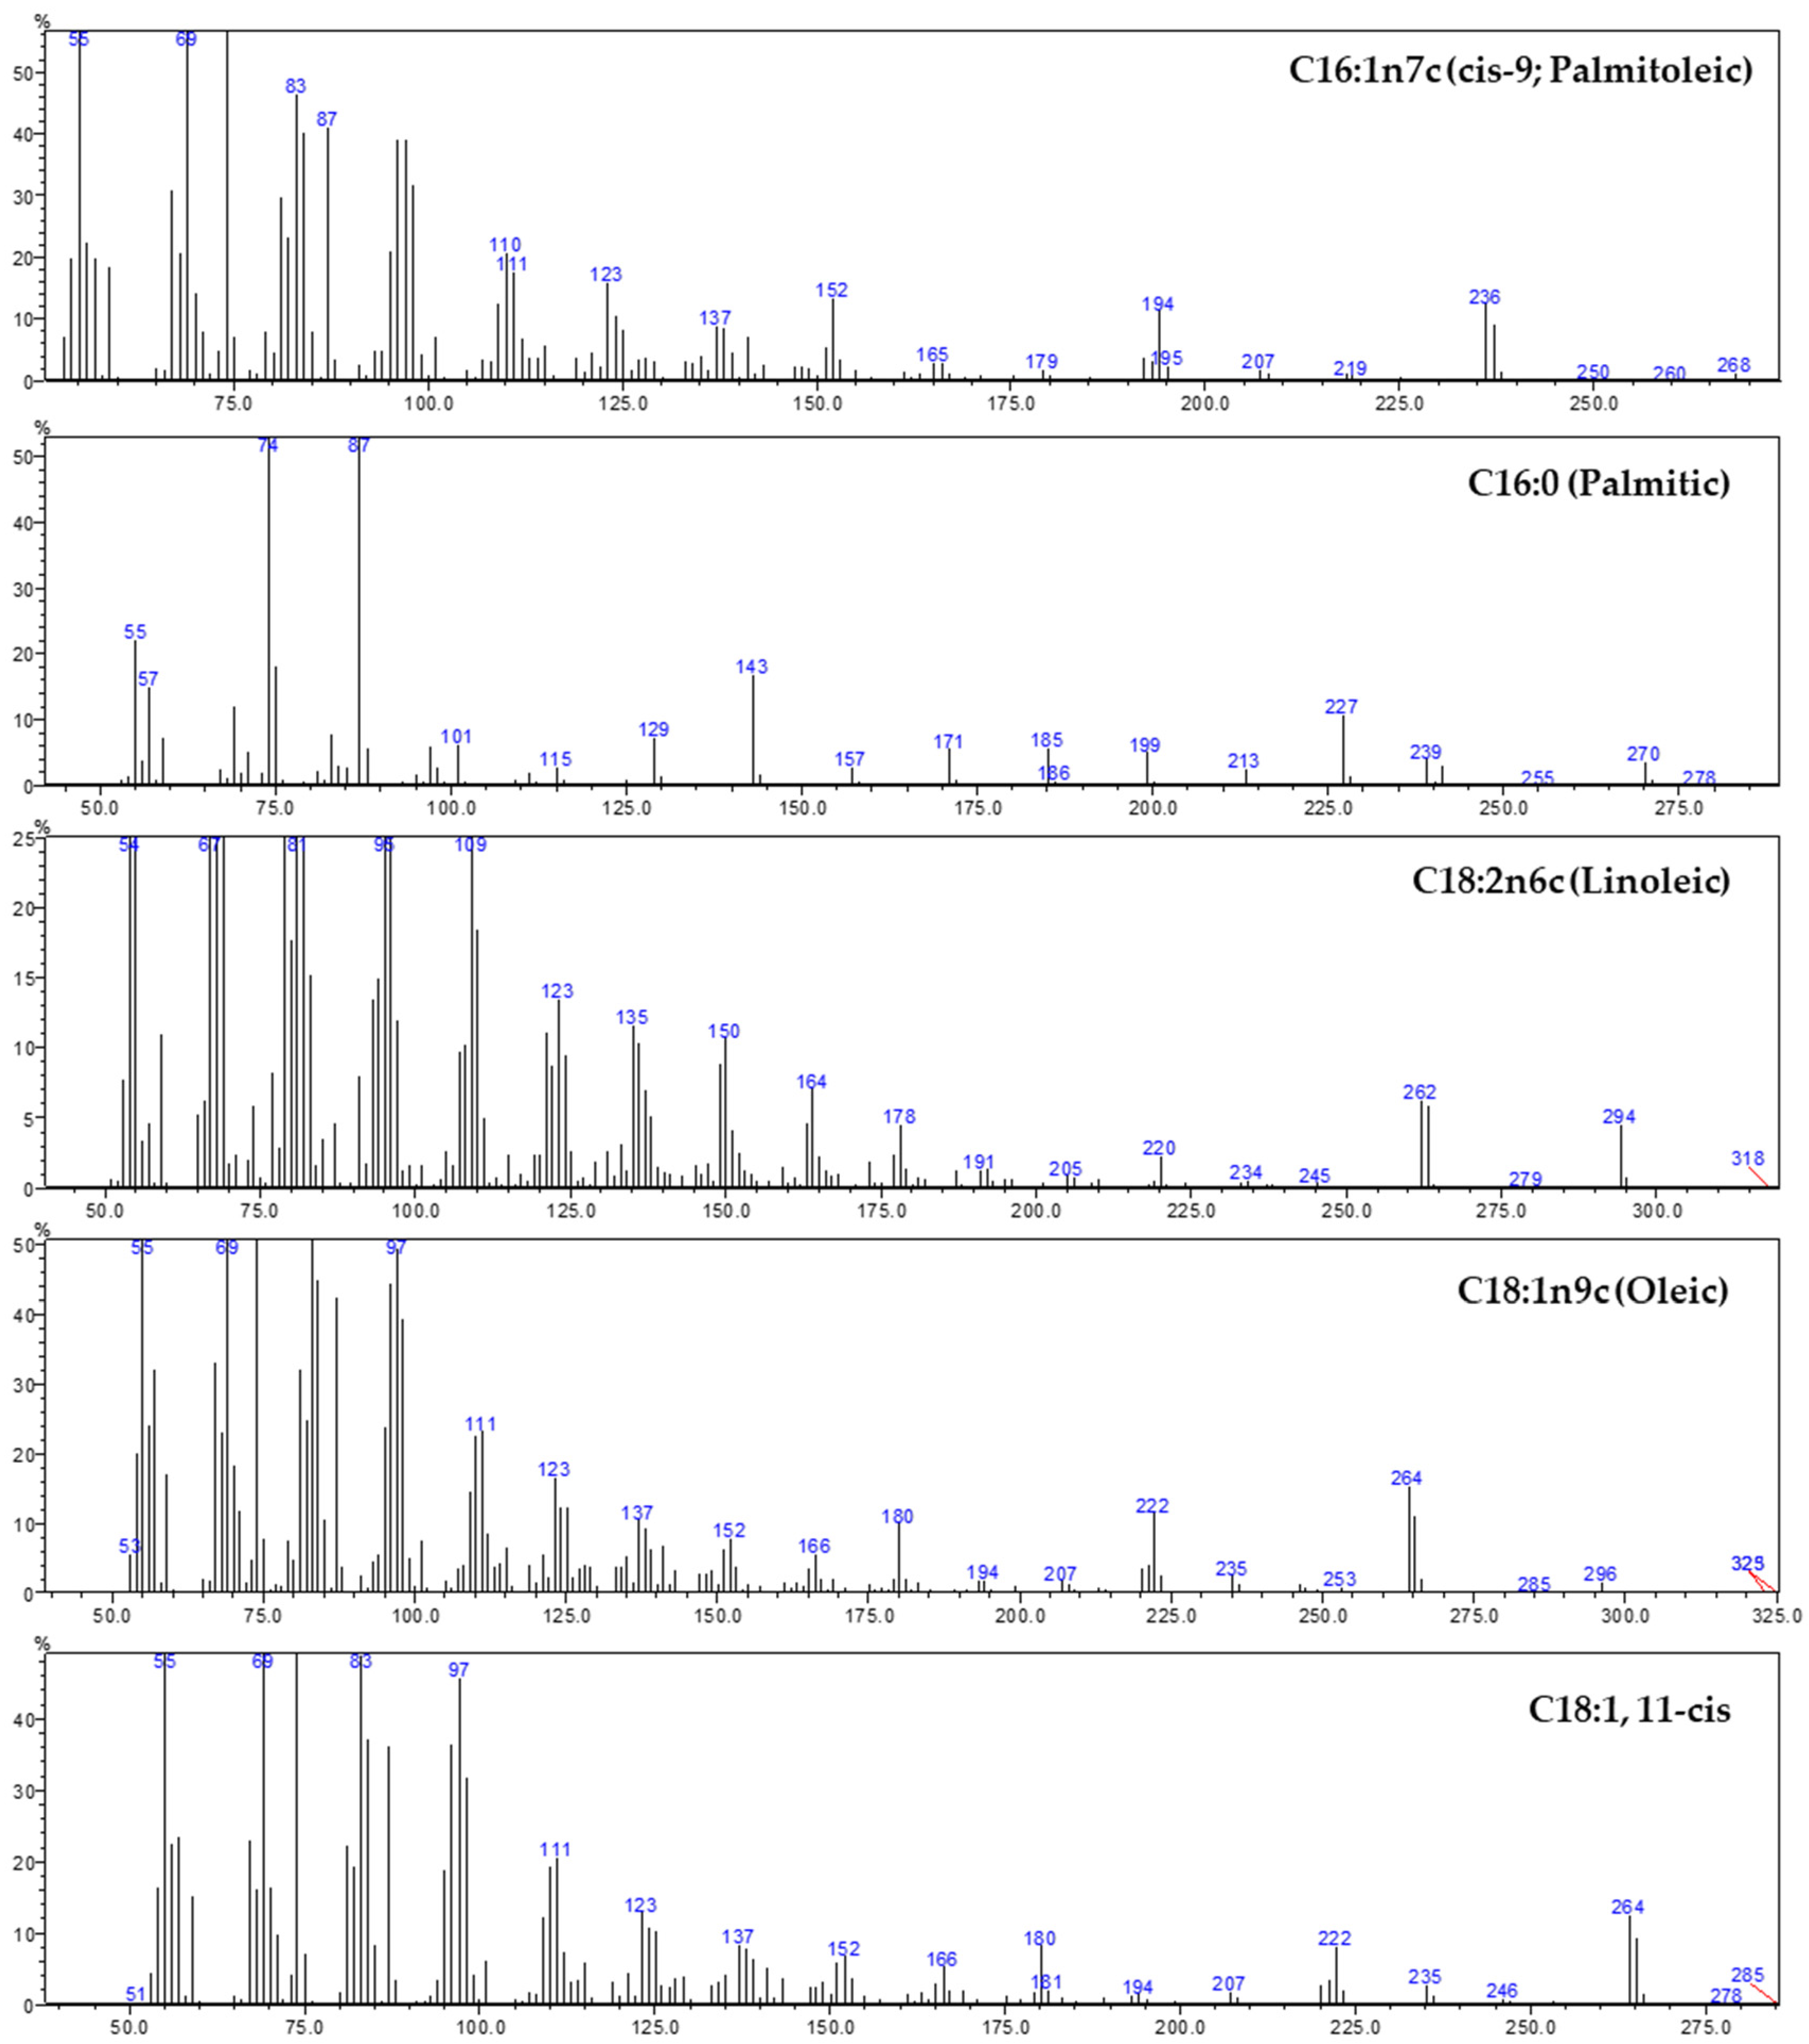
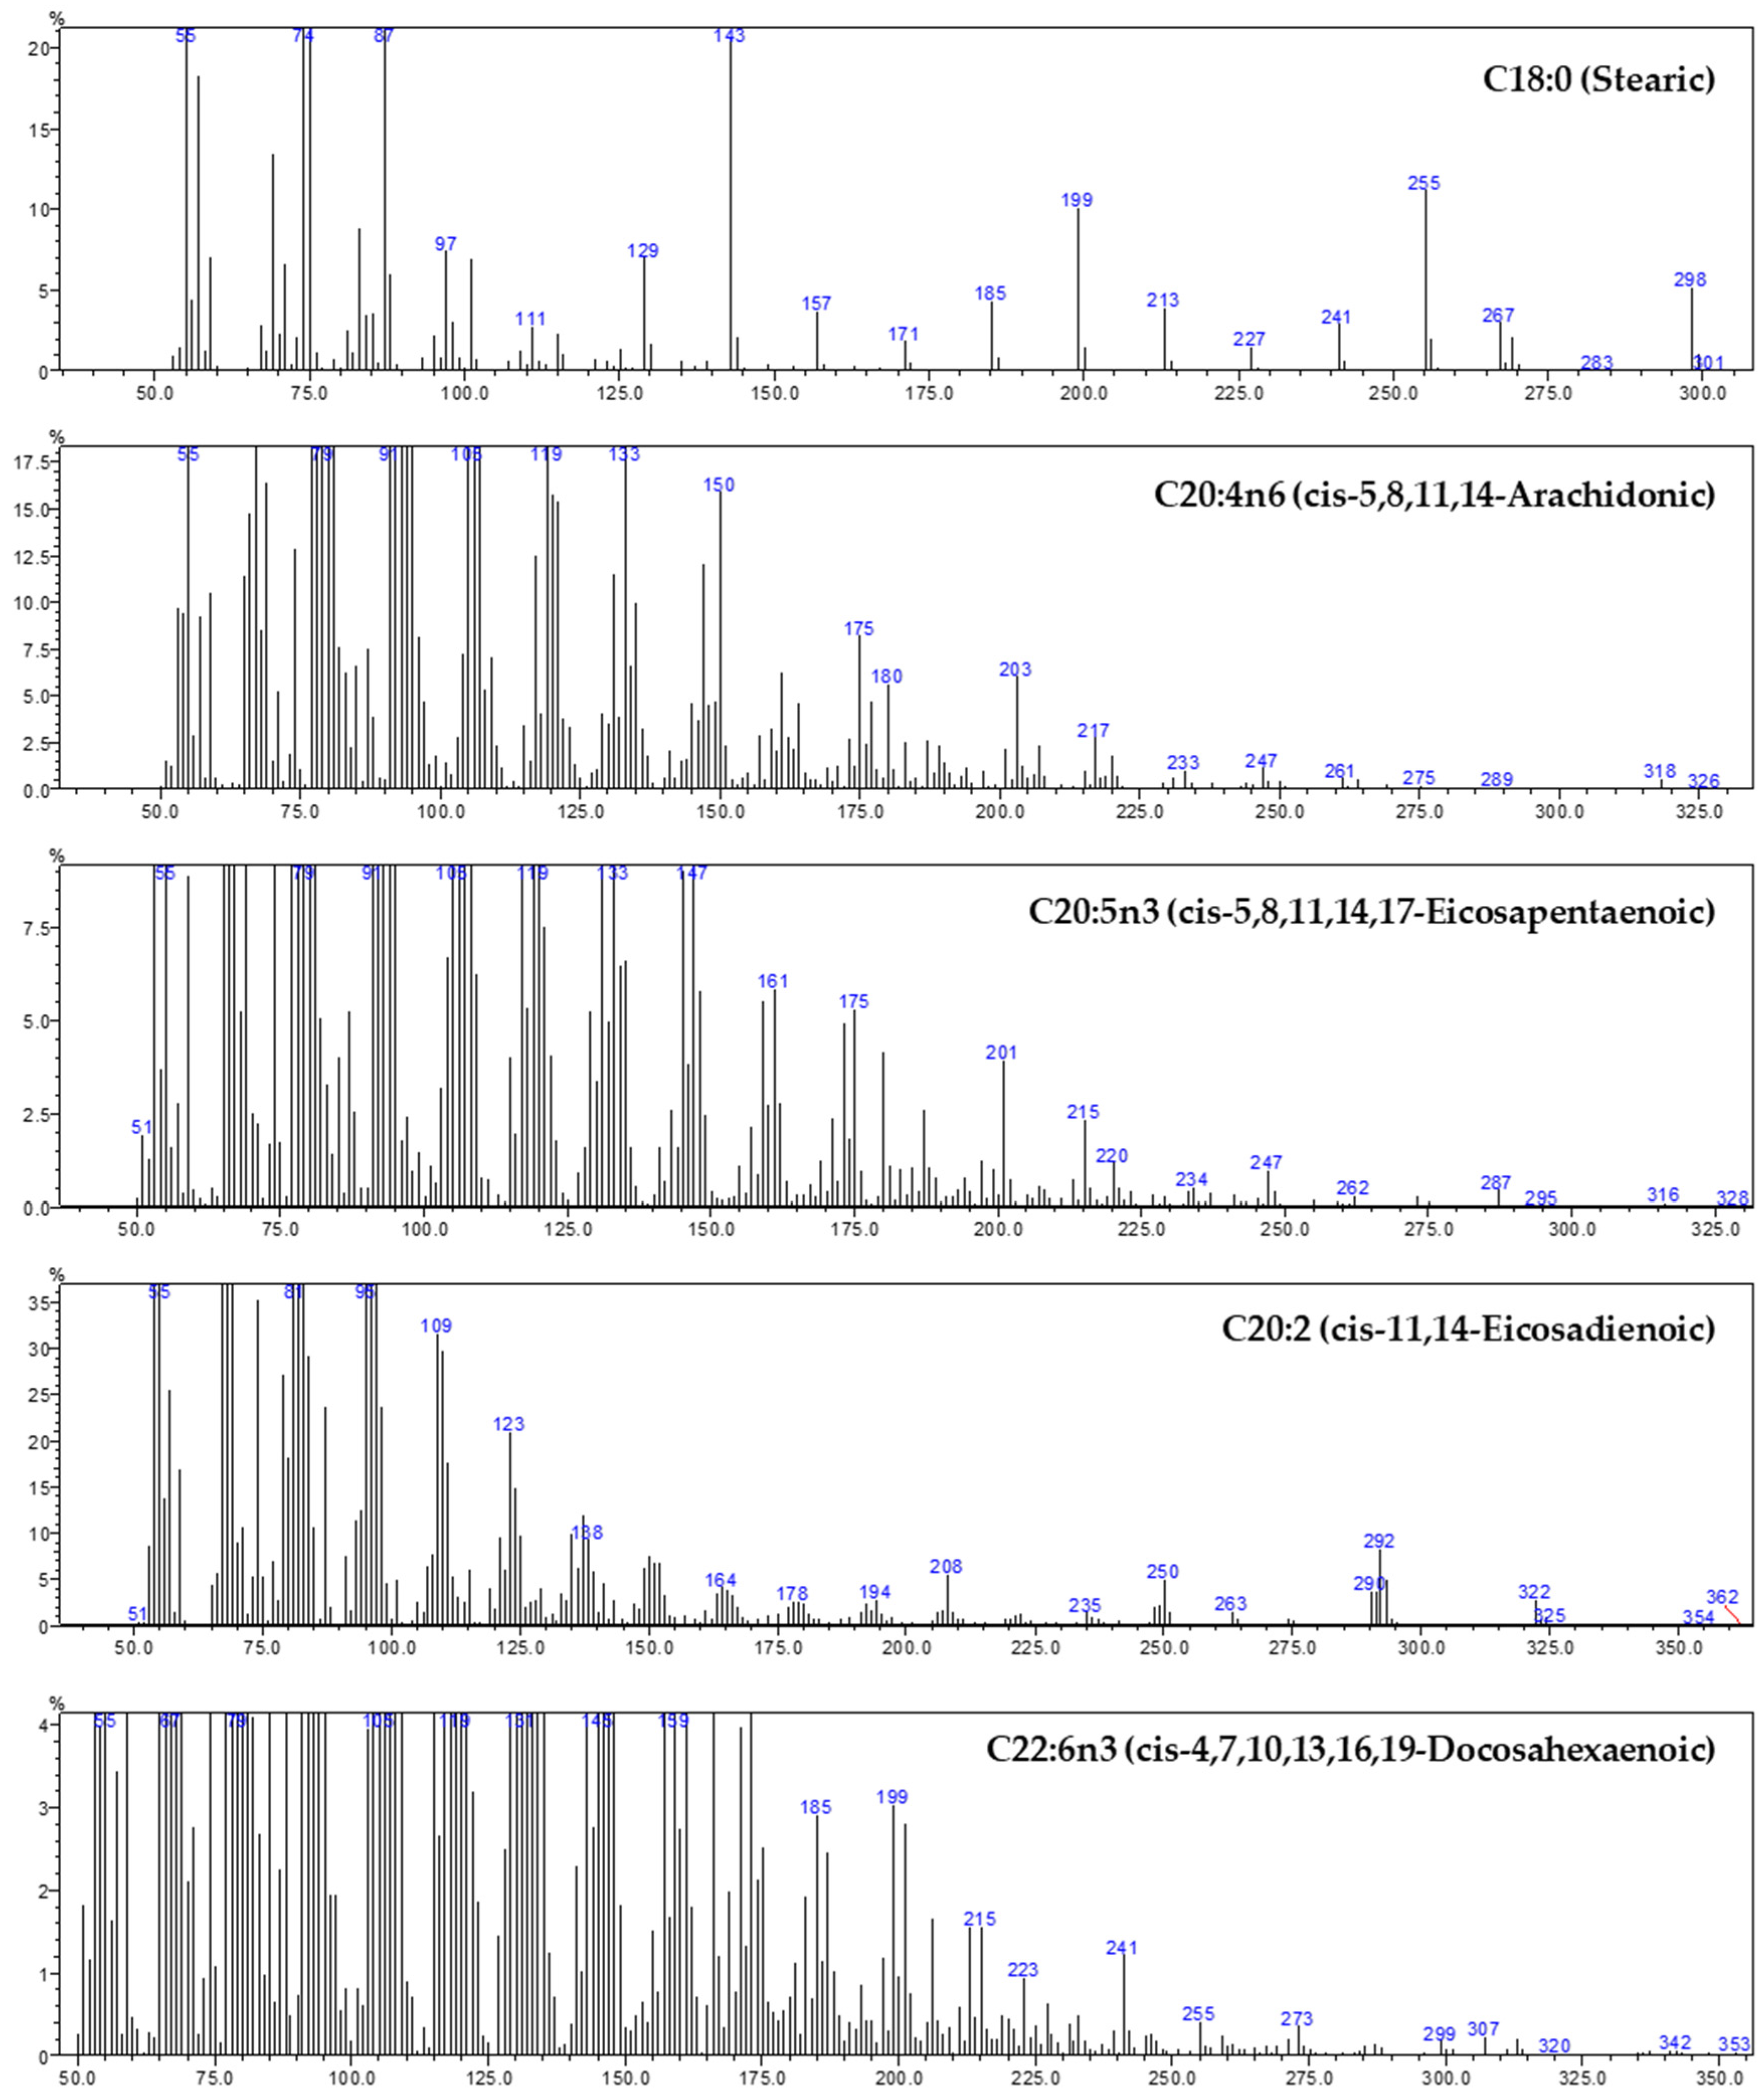
3.1. Fatty Acids Composition and Fat Quality Indices
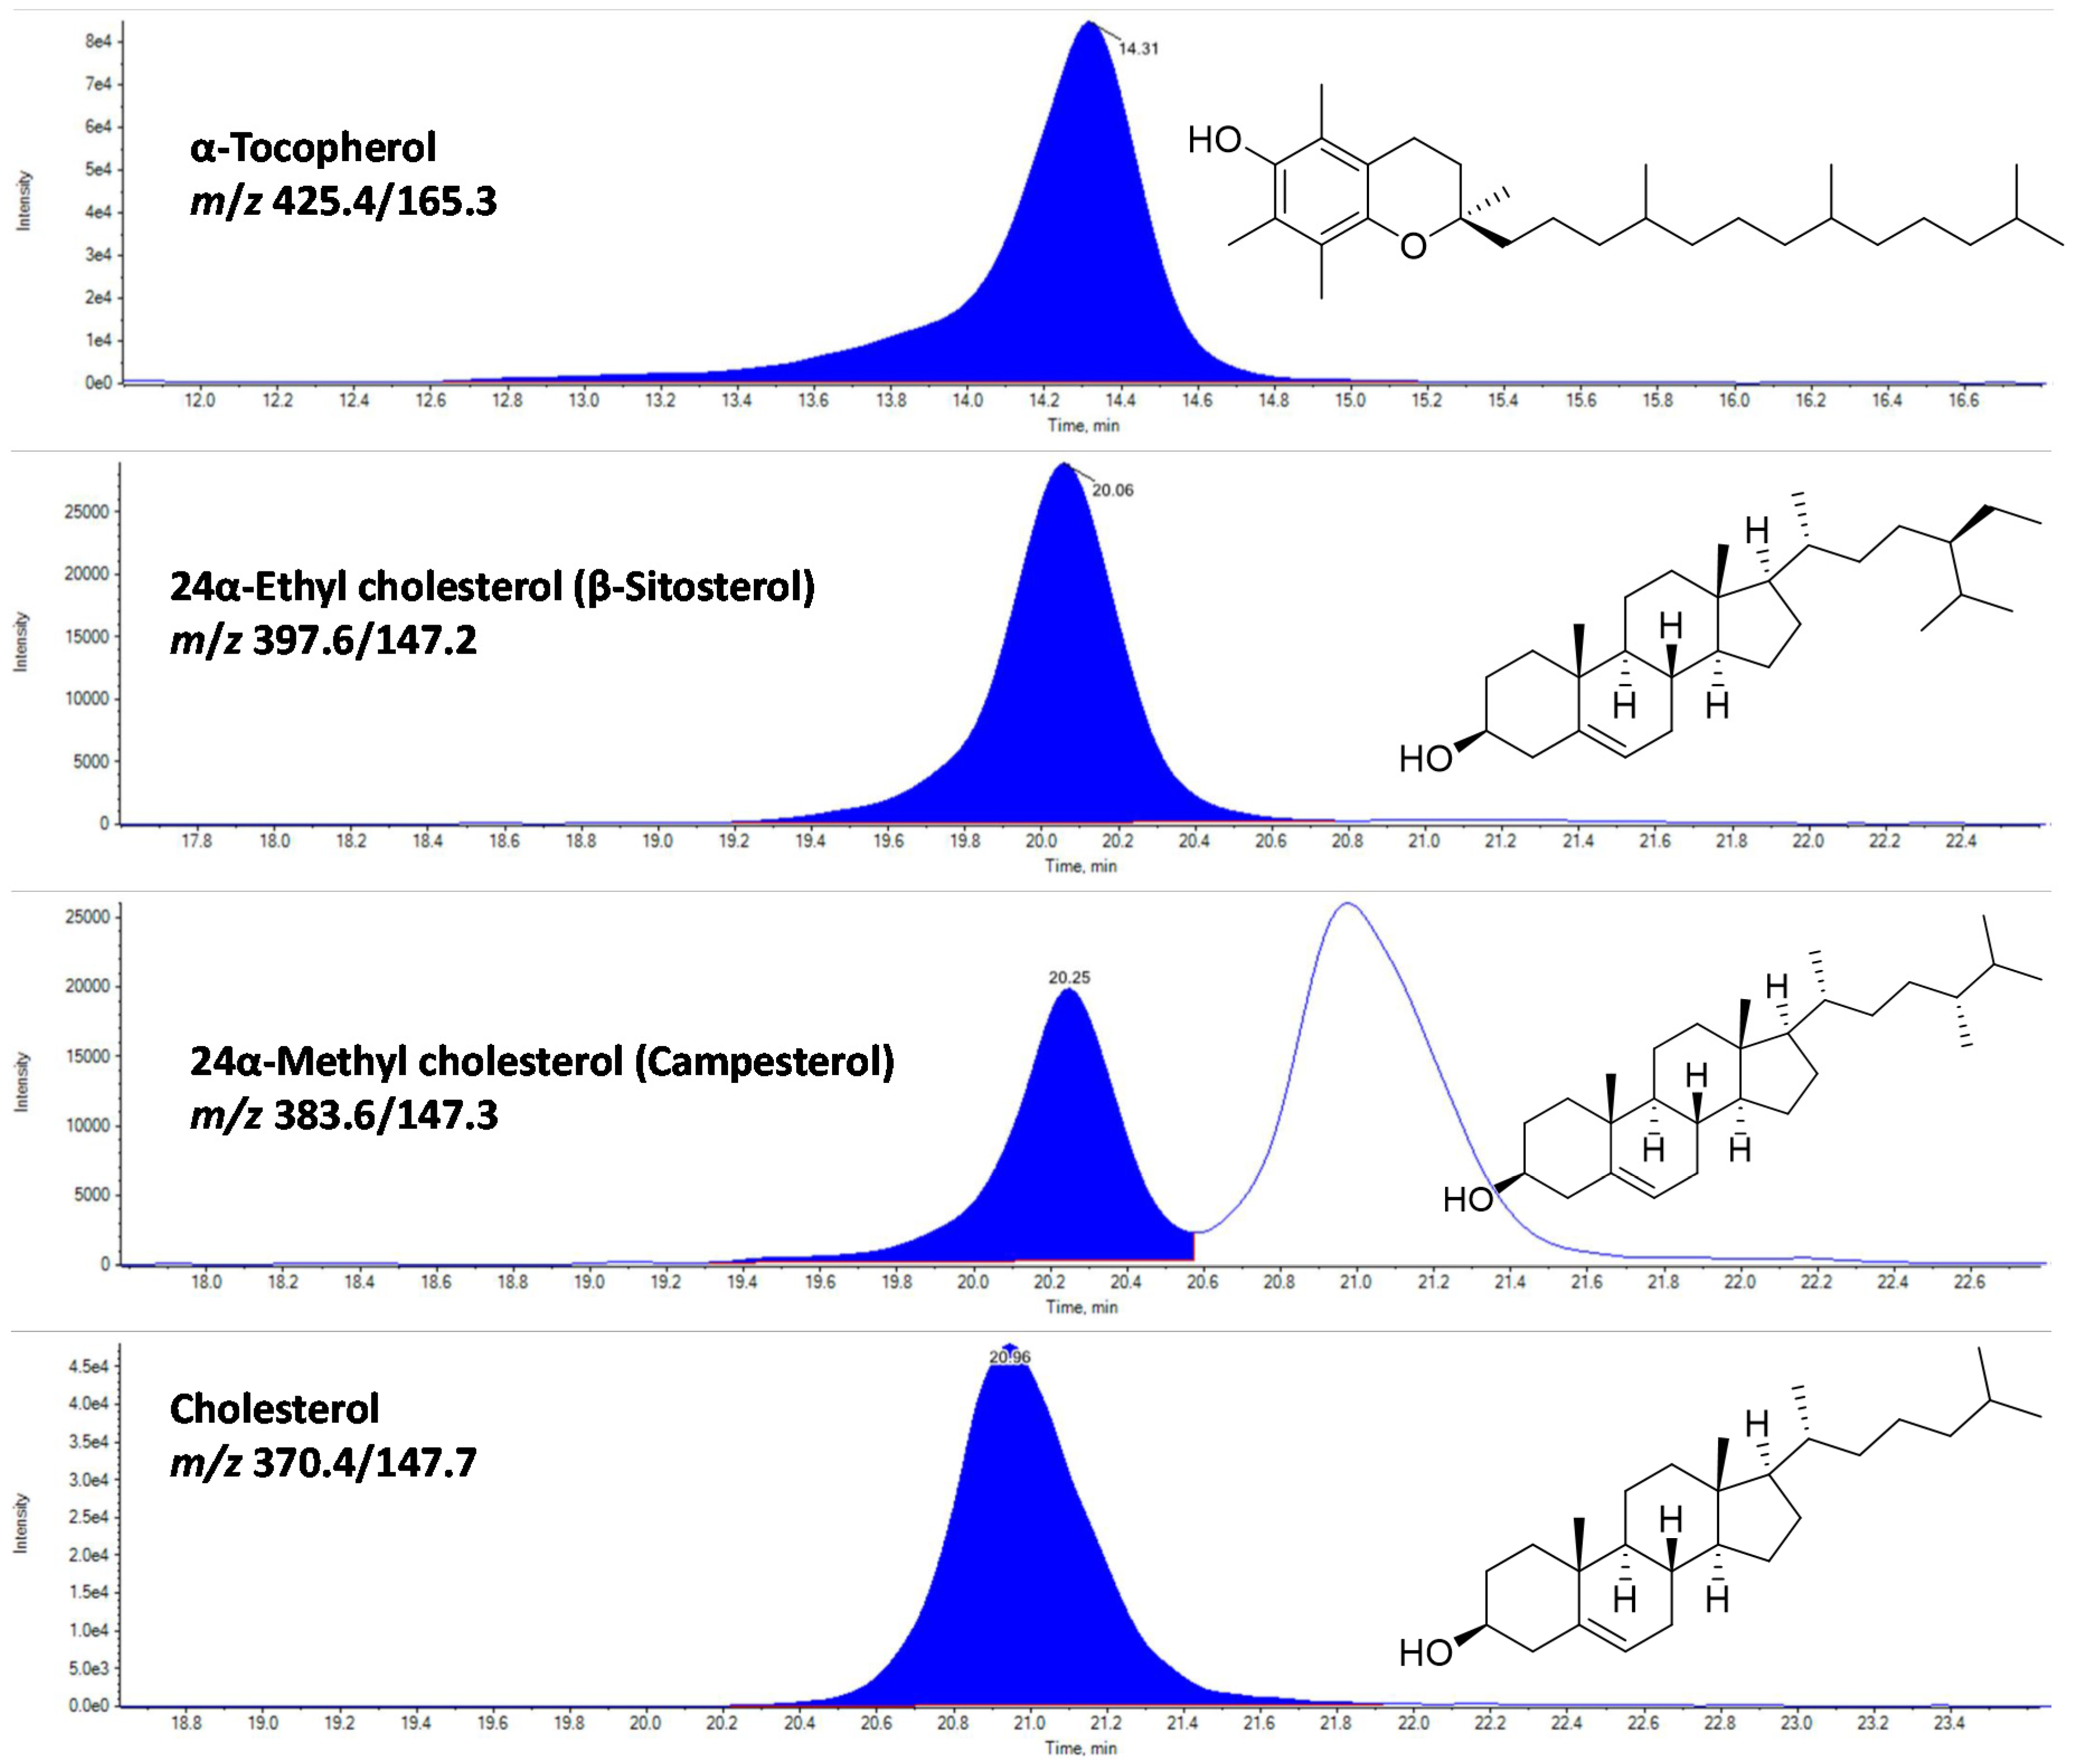
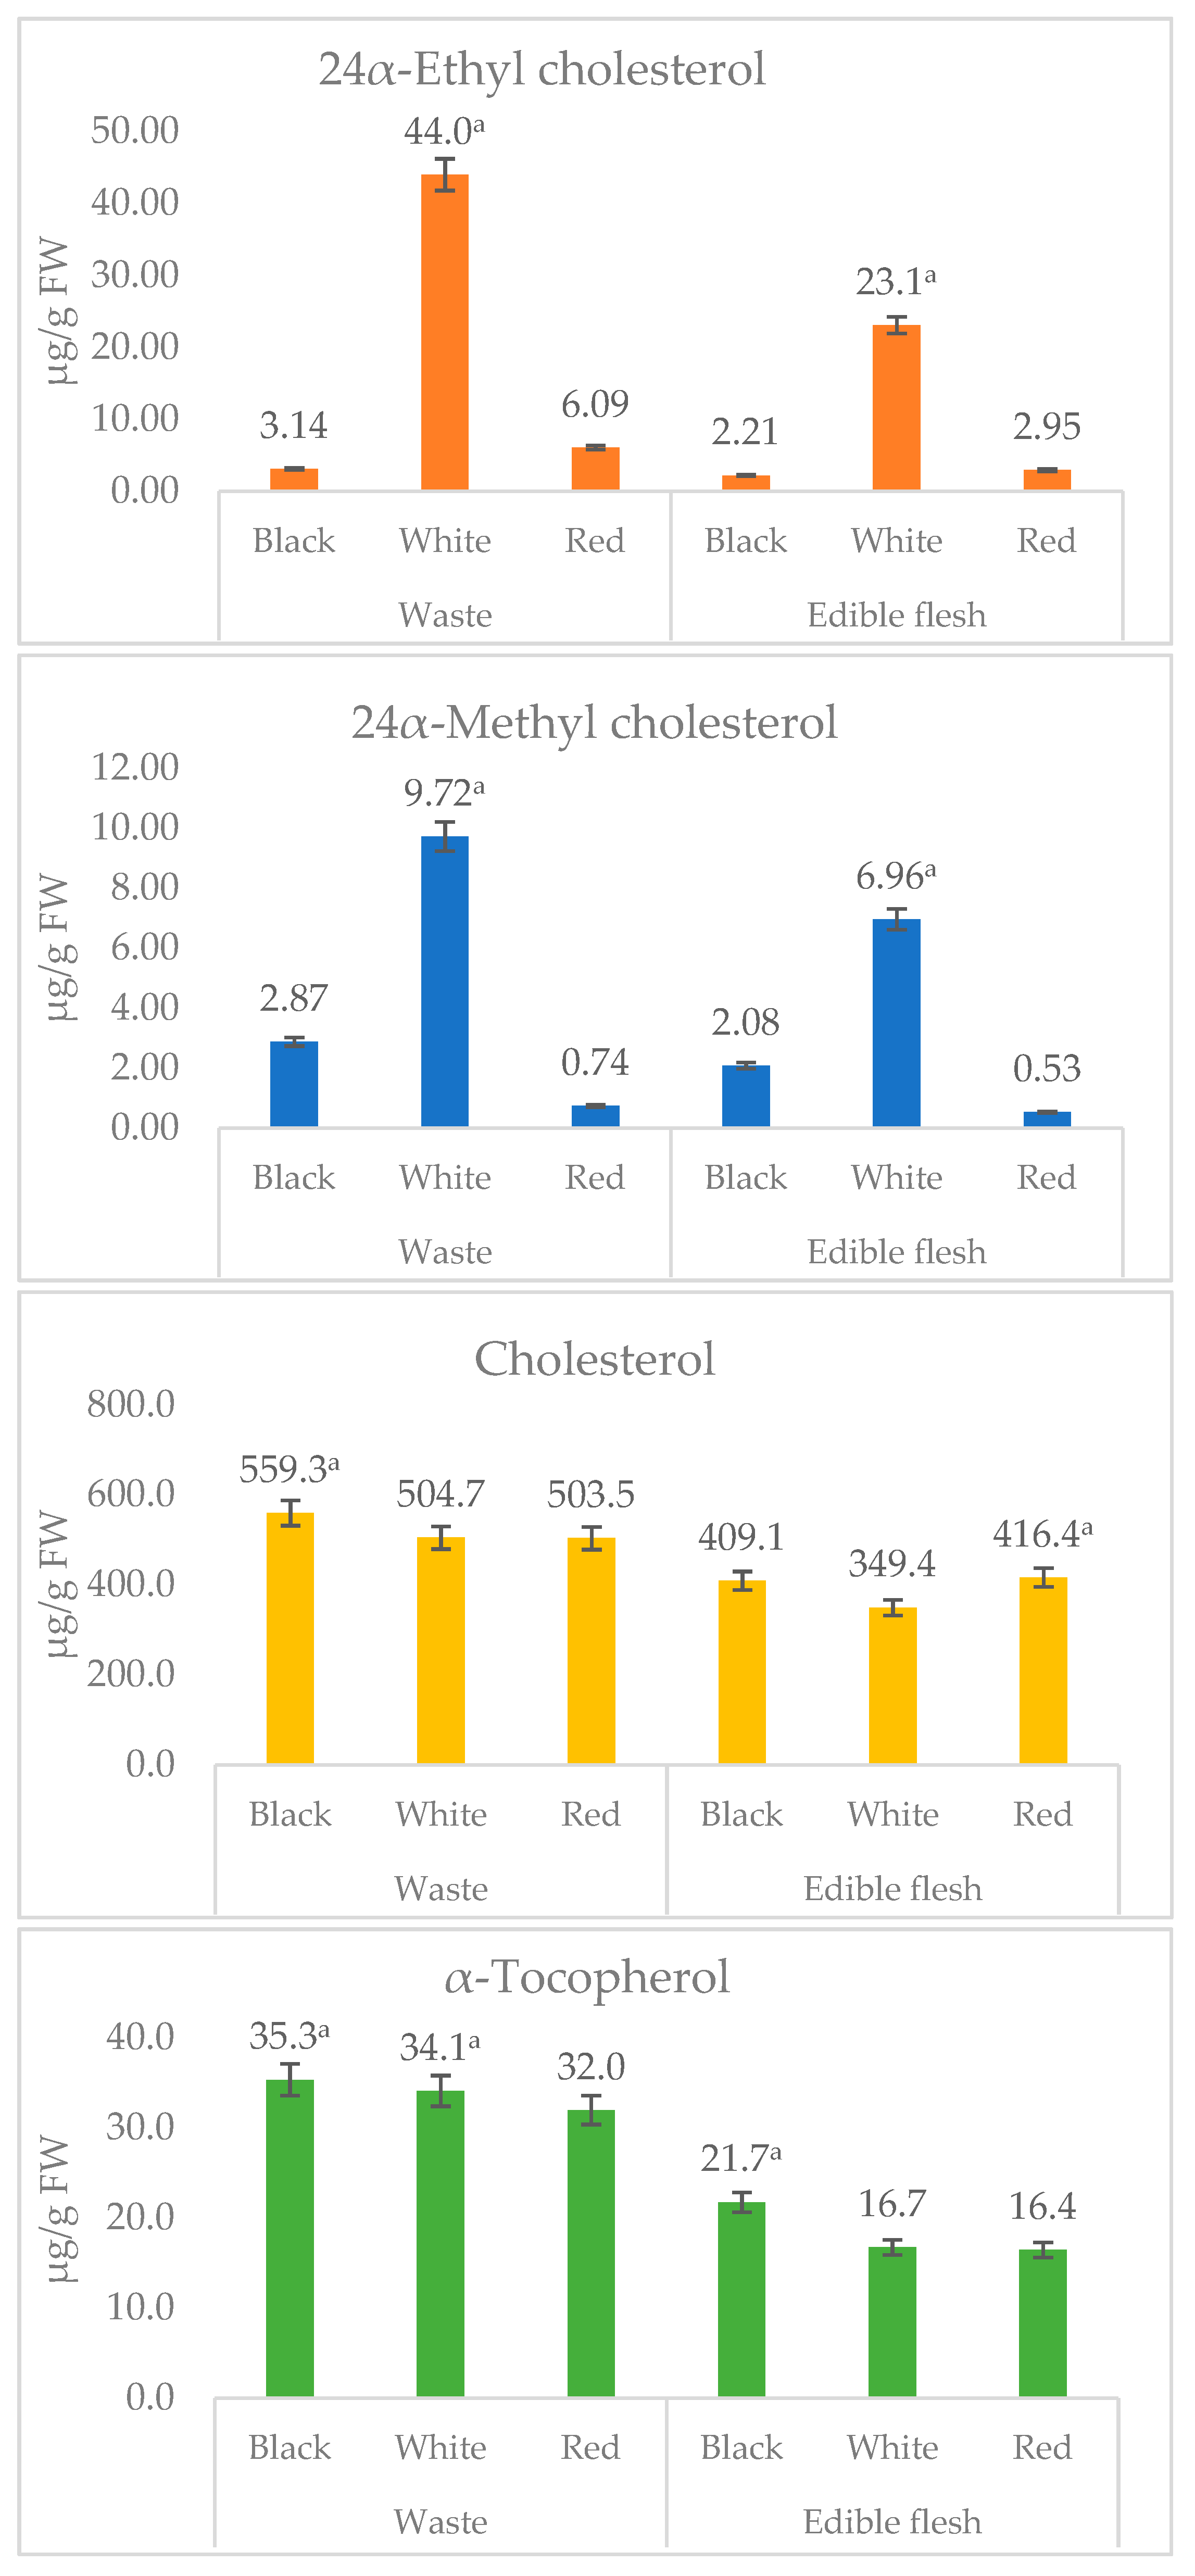
3.2. Sterols and Tocols Composition
3.3. Valorization Potential of Shrimp Processing Waste
4. Conclusions
Author Contributions
Funding
Acknowledgments
Conflicts of Interest
Appendix A


Appendix B


Appendix C

References
- FAO. The State of World Fisheries and Aquaculture 2020, Sustainability in Action; FAO: Rome, Italy, 2020; Volume 3. [Google Scholar]
- Dayal, J.S.; Ponniah, A.; Khan, H.I.; Babu, E.M.; Ambasankar, K.; Vasagam, K.K. Shrimps—A nutritional perspective. Curr. Sci. 2013, 104, 1487–1491. [Google Scholar]
- Saini, R.K.; Keum, Y.S. Omega-3 and omega-6 polyunsaturated fatty acids: Dietary sources, metabolism, and significance—A review. Life Sci. 2018, 203, 255–267. [Google Scholar] [CrossRef] [PubMed]
- Saini, R.K.; Moon, S.H.; Keum, Y.S. An updated review on use of tomato pomace and crustacean processing waste to recover commercially vital carotenoids. Food Res. Int. 2018, 108, 516–529. [Google Scholar] [CrossRef] [PubMed]
- Williamson, E.M.; Liu, X.; Izzo, A.A. Trends in use, pharmacology, and clinical applications of emerging herbal nutraceuticals. Br. J. Pharmacol. 2020, 177, 1227–1240. [Google Scholar] [CrossRef] [PubMed] [Green Version]
- Cruz, R.; Casal, S.; Mendes, E.; Costa, A.; Santos, C.; Morais, S. Validation of a Single-Extraction Procedure for Sequential Analysis of Vitamin E, Cholesterol, Fatty Acids, and Total Fat in Seafood. Food Anal. Methods 2013, 6, 1196–1204. [Google Scholar] [CrossRef] [Green Version]
- Sachindra, N.M.; Bhaskar, N.; Mahendrakar, N.S. Recovery of carotenoids from shrimp waste in organic solvents. Waste Manag. 2006, 26, 1092–1098. [Google Scholar] [CrossRef]
- Gulzar, S.; Benjakul, S. Ultrasound Waves Increase the Yield and Carotenoid Content of Lipid Extracted From Cephalothorax of Pacific White Shrimp (Litopenaeus vannamei). Eur. J. Lipid Sci. Technol. 2018, 120, 11. [Google Scholar] [CrossRef]
- Saini, R.K.; Keum, Y.-S.; Rengasamy, K.R. Profiling of nutritionally important metabolites in green/red and green perilla (Perilla frutescens Britt.) cultivars: A comparative study. Ind. Crop. Prod. 2020, 151, 112441. [Google Scholar] [CrossRef]
- Saini, R.K.; Shetty, N.P.; Giridhar, P. GC-FID/MS Analysis of Fatty Acids in Indian Cultivars of Moringa oleifera: Potential Sources of PUFA. J. Am. Oil Chem. Soc. 2014, 91, 1029–1034. [Google Scholar] [CrossRef]
- Ulbricht, T.L.V.; Southgate, D.A.T. Coronary heart disease: Seven dietary factors. Lancet 1991, 338, 985–992. [Google Scholar] [CrossRef]
- Wołoszyn, J.; Haraf, G.; Okruszek, A.; Wereńska, M.; Goluch, Z.; Teleszko, M. Fatty acid profiles and health lipid indices in the breast muscles of local Polish goose varieties. Poult. Sci. 2020, 99, 1216–1224. [Google Scholar] [CrossRef] [PubMed]
- Santos-Silva, J.; Bessa, R.J.B.; Santos-Silva, F. Effect of genotype, feeding system and slaughter weight on the quality of light lambs II. Fatty acid composition of meat. Livest. Prod. Sci. 2002, 77, 187–194. [Google Scholar] [CrossRef]
- Dorni, C.; Sharma, P.; Saikia, G.; Longvah, T. Fatty acid profile of edible oils and fats consumed in India. Food Chem. 2018, 238, 9–15. [Google Scholar] [CrossRef] [PubMed]
- Gómez-Estaca, J.; Calvo, M.M.; Álvarez-Acero, I.; Montero, P.; Gómez-Guillén, M.C. Characterization and storage stability of astaxanthin esters, fatty acid profile and α-tocopherol of lipid extract from shrimp (L. vannamei) waste with potential applications as food ingredient. Food Chem. 2017, 216, 37–44. [Google Scholar] [CrossRef] [Green Version]
- Takeungwongtrakul, S.; Benjakul, S.; H-Kittikun, A. Lipids from cephalothorax and hepatopancreas of Pacific white shrimp (Litopenaeus vannamei): Compositions and deterioration as affected by iced storage. Food Chem. 2012, 134, 2066–2074. [Google Scholar] [CrossRef]
- Sriket, P.; Benjakul, S.; Visessanguan, W.; Kijroongrojana, K. Comparative studies on chemical composition and thermal properties of black tiger shrimp (Penaeus monodon) and white shrimp (Penaeus vannamei) meats. Food Chem. 2007, 103, 1199–1207. [Google Scholar] [CrossRef]
- Simopoulos, A.P. Evolutionary aspects of the dietary omega-6/omega-3 fatty acid Ratio: Medical implications. In Evolutionary Thinking in Medicine; Springer Nature Switzerland AG: Cham, Switzerland, 2016; pp. 119–134. [Google Scholar]
- Rosa, R.; Nunes, M.L. Nutritional quality of red shrimp, Aristeus antennatus (Risso), pink shrimp, Parapenaeus longirostris (Lucas), and Norway lobster, Nephrops norvegicus (Linnaeus). J. Sci. Food Agric. 2004, 84, 89–94. [Google Scholar] [CrossRef]
- Turan, H.; Kaya, Y.; Erdem, M.E. Proximate Composition, Cholesterol, and Fatty Acid Content of Brown Shrimp (Crangon crangon L. 1758) from Sinop Region, Black Sea. J. Aquat. Food Prod. Technol. 2011, 20, 100–107. [Google Scholar] [CrossRef]
- DURMUŞ, M. Fish oil for human health: Omega-3 fatty acid profiles of marine seafood species. Food Sci. Technol. (Campinas) 2018, 39, 454–461. [Google Scholar] [CrossRef] [Green Version]
- Zhu, H.; Chen, Z.-Y. Do We No Longer Need To Worry about Dietary Cholesterol? J. Agric. Food Chem. 2017, 65, 9931–9933. [Google Scholar] [CrossRef]
- Tsape, K.; Sinanoglou, V.J.; Miniadis-Meimaroglou, S. Comparative analysis of the fatty acid and sterol profiles of widely consumed Mediterranean crustacean species. Food Chem. 2010, 122, 292–299. [Google Scholar] [CrossRef]
- Samson, F.P.; Patrick, A.T.; Fabunmi, T.E.; Yahaya, M.F.; Madu, J.; He, W.; Sripathi, S.R.; Tyndall, J.; Raji, H.; Jee, D.; et al. Oleic Acid, Cholesterol, and Linoleic Acid as Angiogenesis Initiators. ACS Omega 2020. [Google Scholar] [CrossRef] [PubMed]
- Kuang, H.; Yang, F.; Zhang, Y.; Wang, T.; Chen, G. The Impact of Egg Nutrient Composition and Its Consumption on Cholesterol Homeostasis. Cholesterol 2018, 2018, 6303810. [Google Scholar] [CrossRef] [PubMed]
- Saini, R.K.; Keum, Y.S. Tocopherols and tocotrienols in plants and their products: A review on methods of extraction, chromatographic separation, and detection. Food Res. Int. 2016, 82, 59–70. [Google Scholar] [CrossRef]
- Kamal-Eldin, A.; Budilarto, E. Tocopherols and tocotrienols as antioxidants for food preservation. In Handbook of Antioxidants for Food Preservation; Elsevier Ltd.: Amsterdam, The Netherlands, 2015; pp. 141–159. [Google Scholar]


| S/No. | Common Name | Scientific Name | Place of Origin | DOP * | % Waste |
|---|---|---|---|---|---|
| 1 | Black tiger shrimp | Penaeus monodon | Malaysia (cultivated) | June 2019 | 38.1 |
| 2 | Whiteleg shrimp | Penaeus vannamei syn. Litopenaeus vannamei | Peru (cultivated) | June 2019 | 35.6 |
| 3 | Argentine red shrimp | Pleoticus muelleri | Argentina (natural) | May 2019 | 45.4 |
| Instrumentation/Optimized Parameters | |
|---|---|
| Mass spectrometer (MS) | Triple quadrupole MS (API 3200, Applied Biosystems-SCIEX, Framingham, MA, USA) |
| LC system | Exion LC™ system (SCIEX, USA) |
| MS operating mode | APCI positive |
| Column | C30 column (250 mm × 4.6 mm, 5 μm; YMC, Wilmington, NC, USA) |
| Column temperature | 20 °C |
| Solvent system | A: Methanol/water (95/5, v/v) + 5 mM ammonium formate (AF; dissolved in water; B: tert-butyl methyl ether/methanol/water (90/7/3, v/v/v) + 5 mM AF |
| LC gradient elution | 0–100% B for a total of 45 min analysis time, followed by a 5-min post-run for the column equilibrium |
| Flow rate | 1 mL/min |
| S/No | Q1 (m/z) | Q3 (m/z) | Component Name | DP (V) | EP (V) | CE (eV) | CXP (V) | QL/QT | RT (min) |
|---|---|---|---|---|---|---|---|---|---|
| 1 | 430.5 | 165.3 | α-tocopherol (1) | 65 | 10 | 40 | 5 | QT | 14.31 |
| 2 | 430.6 | 205.3 | α-tocopherol (2) | 65 | 10 | 40 | 5 | QL | 14.31 |
| 3 | 397.6 | 147.2 | 24α-ethyl cholesterol (1) | 60 | 10 | 40 | 5 | QT | 20.06 |
| 4 | 397.6 | 161.4 | 24α-ethyl cholesterol (2) | 60 | 10 | 40 | 5 | QL | 20.06 |
| 5 | 383.6 | 161.4 | 24α-methyl cholesterol (1) | 70 | 10 | 40 | 5 | QL | 20.25 |
| 6 | 383.6 | 147.3 | 24α-methyl cholesterol (2) | 70 | 10 | 40 | 5 | QT | 20.25 |
| 7 | 370.4 | 147.7 | Cholesterol (1) | 70 | 10 | 40 | 5 | QT | 20.96 |
| 9 | 370.4 | 161.7 | Cholesterol (2) | 70 | 10 | 40 | 5 | QL | 20.96 |
| 10 | 371.7 | 109.3 | 5-α-Cholestan-3-β-ol (1) | 70 | 10 | 40 | 5 | QT | 21.92 |
| 11 | 371.7 | 135.3 | 5-α-Cholestan-3-β-ol (2) | 70 | 10 | 40 | 5 | QL | 21.92 |
| S/No | RT | Component (Fatty Acid Methyl Esters) | Processing Waste | Edible Flesh | ||||
|---|---|---|---|---|---|---|---|---|
| Black | White | Red | Black | White | Red | |||
| 1 | 20.79 | C14:0 (Myristic) | 1.30 ± 0.01 a | 0.48 ± 0.01 | 0.62 ± 0.01 | 0.59 ± 0.06 a | 0.13 ± 0.04 | 0.65 ± 0.09 a |
| 2 | 22.98 | C15:0 (Pentadecanoic) | 1.20 ± 0.02 a | 0.52 ± 0.02 | 0.60 ± 0.06 | 0.75 ± 0.02 a | 0.39 ± 0.03 | 0.60 ± 0.04 |
| 3 | 24.58 | C16:1n9c (cis-7; Hexadecenoic acid) | 0.08 ± 0.05 | 0.15 ± 0.01 | n.d. | n.d. | n.d. | n.d. |
| 4 | 24.67 | C16:1n7c (cis-9; Palmitoleic) | 5.16 ± 0.19 a | 1.21 ± 0.02 | 3.28 ± 0.09 | 4.53 ± 0.09 a | 0.48 ± 0.08 | 3.47 ± 0.13 |
| 5 | 25.07 | C16:0 (Palmitic) | 20.6 ± 0.71 a | 15.9 ± 0.25 | 16.2 ± 0.16 | 16.8 ± 0.32 | 16.8 ± 0.04 | 18.5 ± 0.17 a |
| 6 | 26.61 | C17:1 (cis-10-Heptadecenoic) | 1.24 ± 0.05 a | 0.25 ± 0.04 | 0.76 ± 0.03 | 1.25 ± 0.06 a | 0.18 ± 0.03 | 0.74 ± 0.05 |
| 7 | 27.03 | C17:0 (Heptadecanoic) | 2.93 ± 0.03 a | 0.91 ± 0.02 | 1.15 ± 0.02 | 2.99 ± 0.05 a | 1.42 ± 0.02 | 1.35 ± 0.15 |
| 8 | 28.39 | C18:2n6c (Linoleic) | 3.46 ± 0.01 | 24.6 ± 0.21 a | 1.49 ± 0.05 | 3.79 ± 0.12 | 20.1 ± 0.11 a | 1.38 ± 0.10 |
| 9 | 28.49 | C18:1n9c (Oleic) | 14.9 ± 0.24 | 21.4 ± 0.33 a | 17.8 ± 0.20 | 14.6 ± 0.25 | 14.9 ± 0.16 | 18.7 ± 0.15 a |
| 10 | 28.58 | C18:1n7c (cis-11-octadecenoic) | 3.48 ± 0.10 | 3.17 ± 0.11 | 4.10 ± 0.09 a | 2.85 ± 0.22 | 2.33 ± 0.14 | 3.62 ± 0.08 a |
| 11 | 28.92 | C18:0 (Stearic) | 10.9 ± 0.14 a | 7.76 ± 0.04 | 5.61 ± 0.12 | 11.90 ± 0.32 | 13.5 ± 0.15 a | 5.66 ± 0.14 |
| 12 | 30.71 | C19:0 (Nonadecanoic) | 0.38 ± 0.00 a | 0.29 ± 0.03 | 0.21 ± 0.04 | 0.26 ± 0.10 a | 0.26 ± 0.05 a | n.d. |
| 13 | 31.40 | C20:4n6 (cis-5,8,11,14-Arachidonic) | 7.20 ± 0.12 a | 1.47 ± 0.03 | 4.23 ± 0.08 | 8.88 ± 0.08 a | 2.69 ± 0.13 | 3.46 ± 0.03 |
| 14 | 31.53 | C20:5n3 (cis-5,8,11,14,17-Eicosapentaenoic) | 7.47 ± 0.03 | 4.69 ± 0.03 | 14.1 ± 0.06 a | 10.1 ± 0.21 | 11.1 ± 0.10 | 15.8 ± 0.24 a |
| 15 | 31.70 | C20:3n6 (cis-8,11,14-Eicosatrienoic) | 0.42 ± 0.05 | 0.22 ± 0.05 | 0.41 ± 0.07 | 0.33 ± 0.09 a | n.d. | 0.20 ± 0.05 a |
| 16 | 31.81 | C20:4n3 (cis 8,11,14,17-eicosatetraenoic; ETA) | 0.24 ± 0.05 | 0.28 ± 0.06 | 0.53 ± 0.08 a | 0.34 ± 0.24 | n.d. | 0.28 ± 0.04 |
| 17 | 31.98 | C20:2 (cis-11,14-Eicosadienoic) | 5.12 ± 0.04 a | 4.42 ± 0.06 | 1.89 ± 0.11 | 2.98 ± 0.21 a | 2.94 ± 0.03 a | 1.28 ± 0.11 |
| 18 | 32.06 | C20:1n9 (cis-11-Eicosenoic) | 0.95 ± 0.00 | 1.58 ± 0.06 | 2.15 ± 0.05 a | n.d. | 0.58 ± 0.11 | 1.40 ± 0.05 |
| 19 | 32.13 | C20:3n3 (cis-11,14,17-Eicosatrienoic) | 0.40 ± 0.04 | 0.82 ± 0.04 | 1.08 ± 0.06 a | 0.51 ± 0.11 | 0.25 ± 0.06 | 0.80 ± 0.04 a |
| 20 | 32.44 | C20:0 (Arachidic) | 0.18 ± 0.09P | 0.46 ± 0.02 a | 0.31 ± 0.03 | 0.21 ± 0.08 a | 0.32 ± 0.06 a | n.d. |
| 21 | 34.18 | C21:0 (Henicosanoic) | n.d. | 0.26 ± 0.07 a | n.d. | n.d. | n.d. | n.d. |
| 22 | 34.66 | C22:5n6 (cis- 4,7,10,13,16-docosapentaenoic; n6-DPA) | 0.77 ± 0.08 | 0.22 ± 0.02 | 0.47 ± 0.08 | 1.35 ± 0.10 a | n.d. | 0.46 ± 0.07 |
| 23 | 34.84 | C22:6n3 (cis-4,7,10,13,16,19-Docosahexaenoic) | 6.15 ± 0.33 | 6.48 ± 0.18 | 17.2 ± 0.19 a | 10.5 ± 0.38 | 10.6 ± 0.09 | 20.2 ± 0.28 a |
| 24 | 34.92 | C22:4n6 (cis-7,10,13,16-Docosatetraenoic; DTA) | 1.17 ± 0.03 a | n.d. | n.d. | 1.00 ± 0.11 a | n.d. | n.d. |
| 25 | 35.09 | C22:5n3 (cis-7,10,13,16,19-docosapentaenoate) | 2.19 ± 0.28 a | 0.89 ± 0.05 | 1.39 ± 0.15 | 2.72 ± 0.15 a | 0.65 ± 0.03 | 1.10 ± 0.29 |
| 26 | 35.73 | C22:1n9 (Erucic) | 0.00 ± 0.00 | 0.21 ± 0.07 | 0.83 ± 0.39 a | n.d. | n.d. | n.d. |
| 27 | 36.22 | C22:0 (Behenic) | 0.64 ± 0.08 | 0.49 ± 0.04 | 0.55 ± 0.11 | 0.28 ± 0.02 | 0.34 ± 0.01 a | n.d. |
| 28 | 38.74 | C23:0 (Tricosanoic) | 0.19 ± 0.07 | 0.20 ± 0.01 | n.d. | n.d. | n.d. | n.d. |
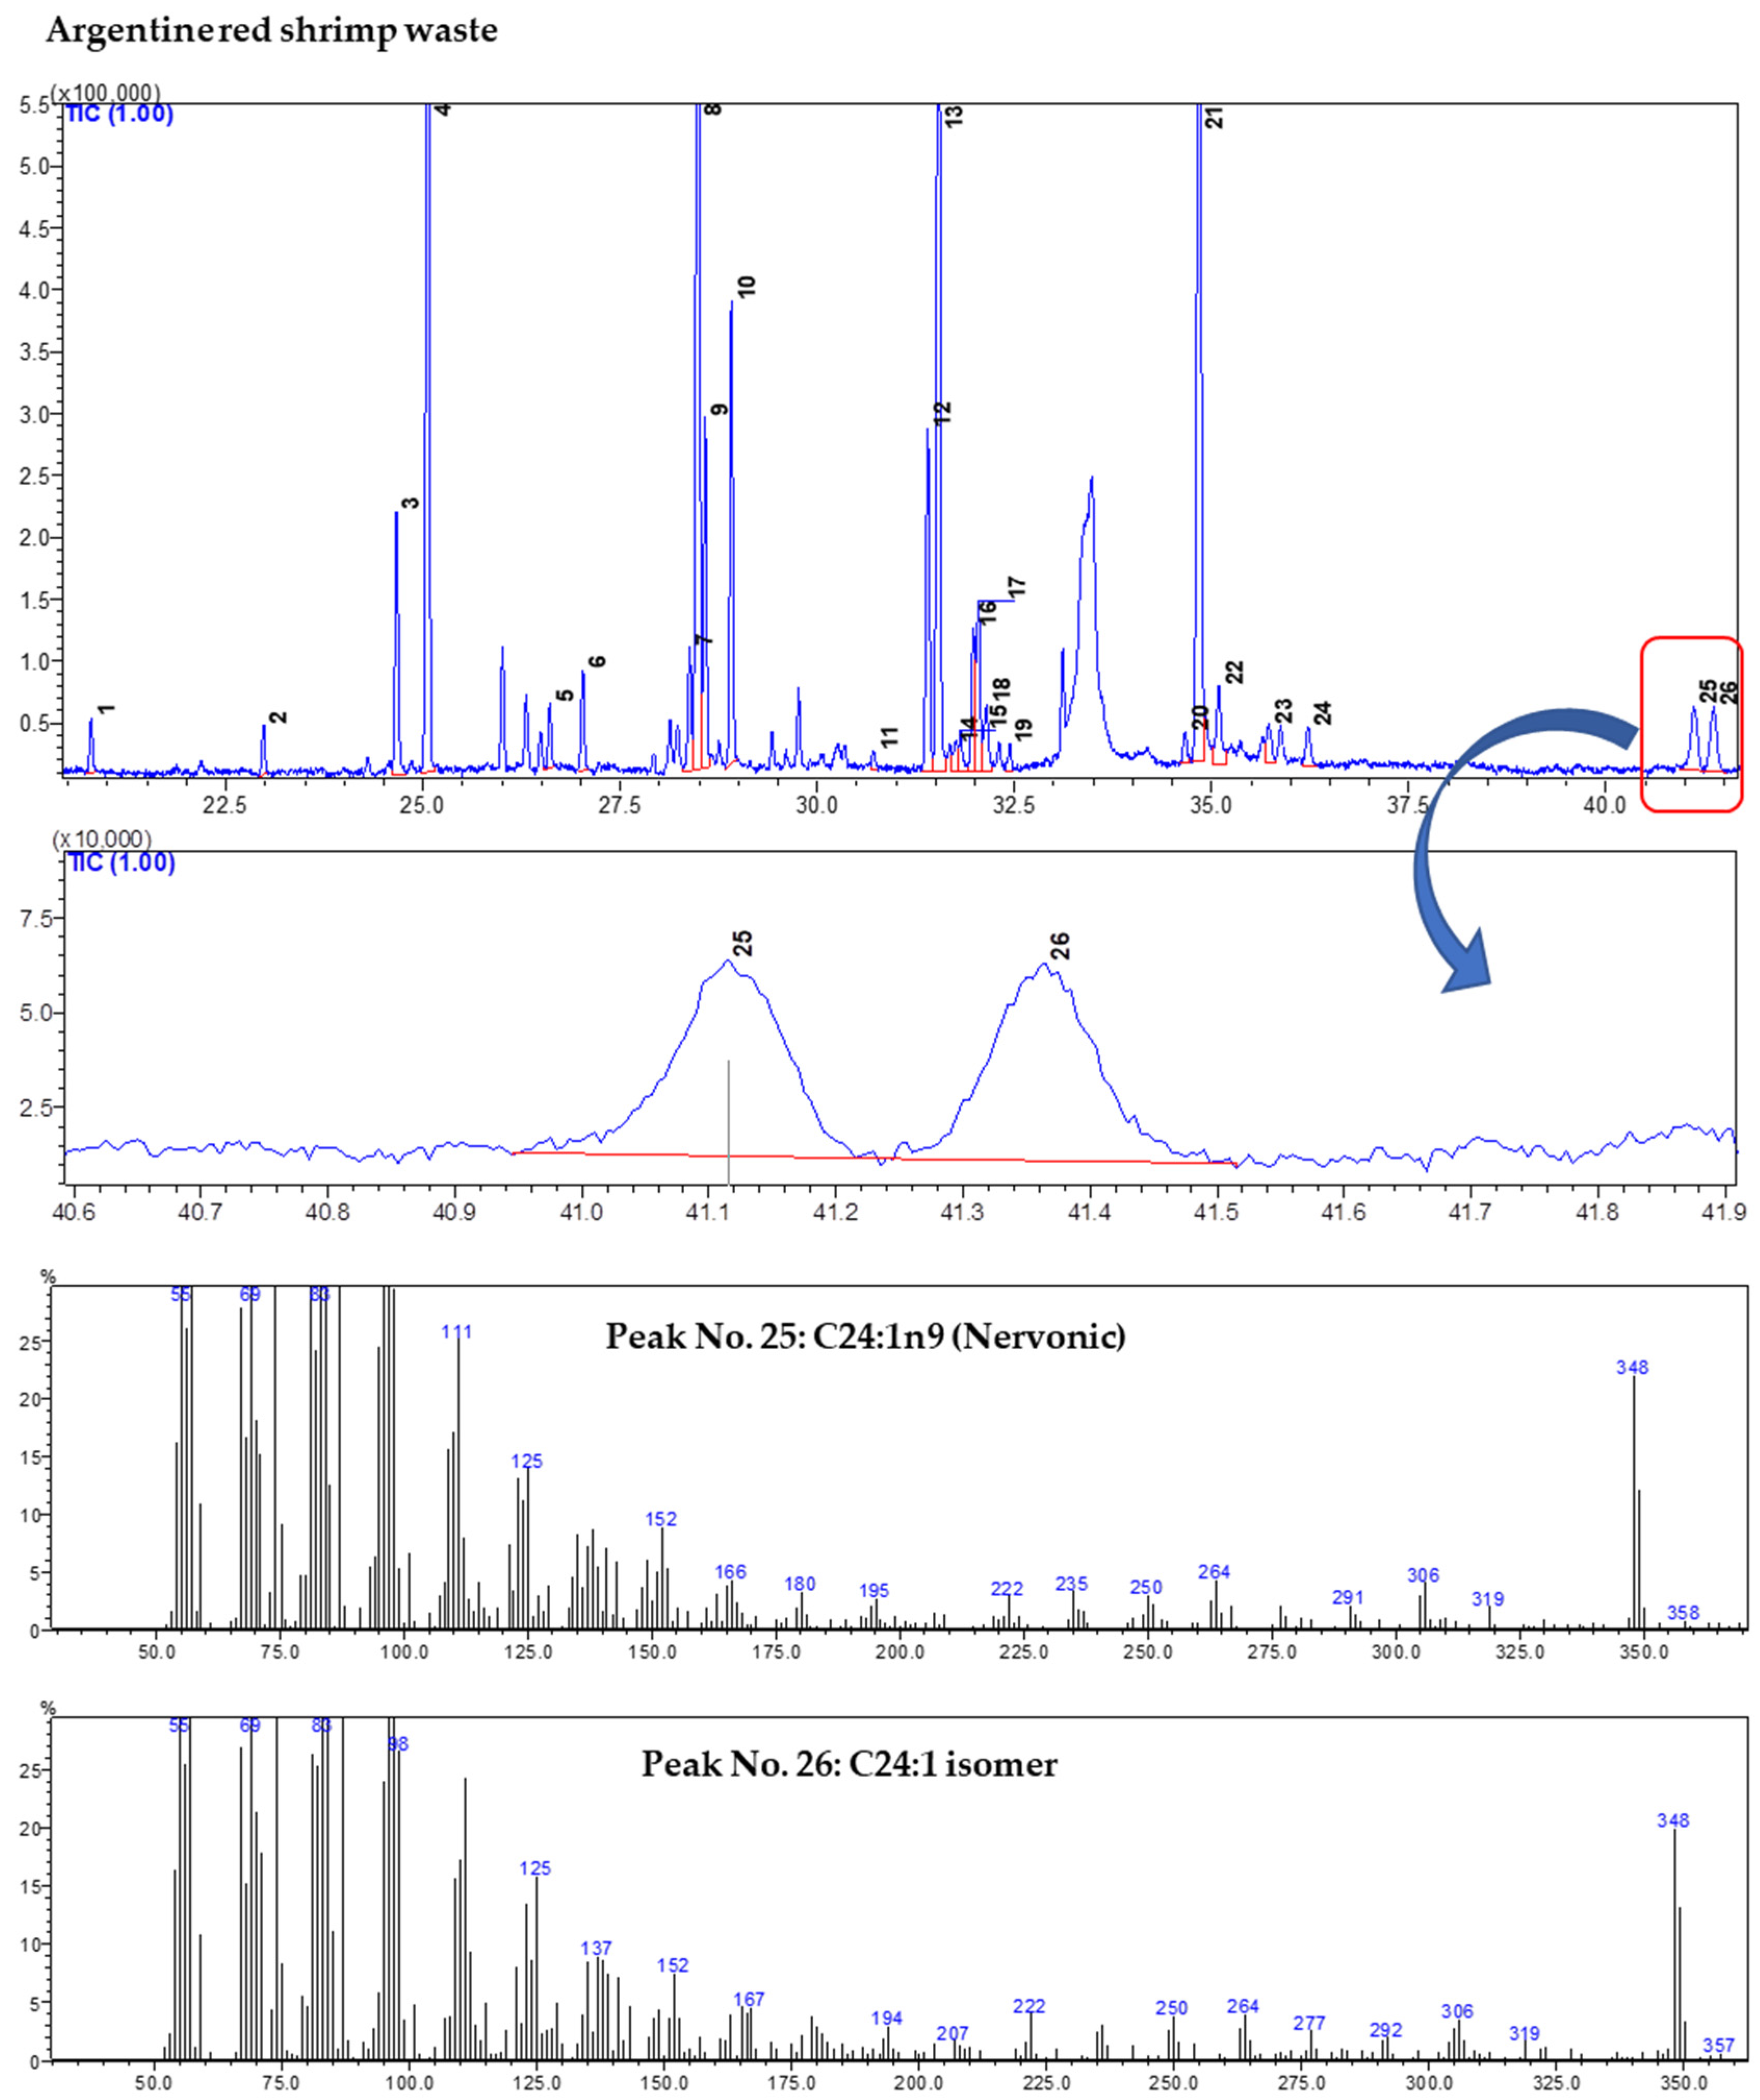
| 29 | 41.10 | C24:1n9 (Nervonic) | 0.36 ± 0.10 | 0.34 ± 0.08 | 1.56 ± 0.08 a | n.d. | n.d. | 0.36 ± 0.13 |
| 30 | 41.36 | C24:1 isomer | 0.53 ± 0.11 | 0.17 ± 0.02 | 1.57 ± 0.12 a | 0.22 ± 0.13 a | n.d. | n.d. |
| 31 | 41.86 | C24:0 (Lignoceric) | 0.39 ± 0.01 a | 0.20 ± 0.04 | n.d. | 0.20 ± 0.04 a | n.d. | n.d. |
| 32 | Total SFAs | 38.7 ± 0.60 a | 27.4 ± 0.13 | 25.2 ± 0.11 | 34.0 ± 0.62 a | 33.1 ± 0.06 a | 26.7 ± 0.53 | |
| 33 | Total MUFAs | 26.7 ± 0.30 | 28.5 ± 0.45 | 32.0 ± 0.34 a | 23.5 ± 0.43 | 18.5 ± 0.10 | 28.3 ± 0.05 a | |
| 34 | Total PUFAs | 34.6 ± 0.89 | 44.1 ± 0.31 a | 42.8 ± 0.44 a | 42.5 ± 1.01 | 48.4 ± 0.10 a | 45.0 ± 0.49 | |
| n3 PUFA | 16.5 ± 0.71 | 13.2 ± 0.17 | 34.3 ± 0.26 a | 24.2 ± 0.68 | 22.6 ± 0.06 | 38.2 ± 0.43 a | ||
| n6 PUFA | 18.1 ± 0.18 | 30.9 ± 0.22 a | 8.50 ± 0.24 | 18.3 ± 0.41 | 25.8 ± 0.14 a | 6.77 ± 0.16 | ||
| Crude lipids (% DW) | 5.95 ± 0.56 | 7.77 ± 0.68 a | 4.61 ± 0.54 | 4.60 ± 0.53 | 4.50 ± 0.50 | 3.65 ± 0.57 | ||
| Indices | Processing Waste | Edible Flesh | ||||
|---|---|---|---|---|---|---|
| Black | White | Red | Black | White | Red | |
| PUFAs/SFAs | 0.89 ± 0.04 | 1.61 ± 0.00 | 1.70 ± 0.03 a | 1.25 ± 0.05 | 1.46 ± 0.00 | 1.69 ± 0.05 a |
| PUFAs/MUFAs | 1.30 ± 0.05 | 1.55 ± 0.04 a | 1.34 ± 0.03 | 1.81 ± 0.08 | 2.62 ± 0.02 a | 1.59 ± 0.01 |
| n3/n6 | 0.91 ± 0.03 | 0.43 ± 0.01 | 4.03 ± 0.10 a | 1.32 ± 0.03 | 0.88 ± 0.01 | 5.65 ± 0.13 a |
| h/H | 2.03 ± 0.09 | 3.73 ± 0.06 a | 3.50 ± 0.04 | 3.11 ± 0.08 | 3.57 ± 0.02 a | 3.27 ± 0.06 |
| AI | 0.42 ± 0.02 a | 0.25 ± 0.00 | 0.25 ± 0.00 | 0.29 ± 0.01 a | 0.26 ± 0.00 | 0.29 ± 0.01 a |
| TI | 0.46 ± 0.02 a | 0.35 ± 0.00 | 0.18 ± 0.00 | 0.31 ± 0.01 | 0.33 ± 0.00 a | 0.18 ± 0.00 |
| C16:1 | C16:0 | C18:2n6c | C18:1n9c | C18:1n9t | C18:0 | C20:4n6 | C20:5n3 | C20:2 | C22:6n3 | Crude Lipids | α-tocopherol | 24α-EC | 24α-MC | Cholesterol | |
|---|---|---|---|---|---|---|---|---|---|---|---|---|---|---|---|
| C16:1 | 1.000 | ||||||||||||||
| C16:0 | 0.640 | 1.000 | |||||||||||||
| C18:2n6c | −0.856 | −0.476 | 1.000 | ||||||||||||
| C18:1n9c | −0.393 | −0.407 | 0.356 | 1.000 | |||||||||||
| C18:1n9t | 0.487 | 0.184 | −0.619 | 0.390 | 1.000 | ||||||||||
| C18:0 | −0.100 | 0.137 | 0.321 | −0.747 | −0.854 | 1.000 | |||||||||
| C20:4n6 | 0.845 | 0.438 | −0.650 | −0.720 | 0.020 | 0.373 | 1.000 | ||||||||
| C20:5n3 | 0.141 | 0.000 | −0.622 | −0.135 | 0.342 | −0.391 | 0.005 | 1.000 | |||||||
| C20:2 | 0.077 | 0.326 | 0.411 | −0.099 | −0.252 | 0.464 | 0.168 | −0.928 | 1.000 | ||||||
| C22:6n3 | 0.071 | −0.126 | −0.548 | 0.164 | 0.473 | −0.623 | −0.161 | 0.952 | −0.959 | 1.000 | |||||
| Crude Lipids | −0.224 | −0.119 | 0.622 | 0.473 | −0.047 | 0.021 | −0.258 | −0.920 | 0.805 | −0.776 | 1.000 | ||||
| α-tocopherol | 0.245 | 0.110 | 0.047 | 0.279 | 0.489 | −0.236 | 0.057 | −0.603 | 0.653 | −0.511 | 0.750 | 1.000 | |||
| 24α-EC | −0.810 | −0.537 | 0.952 | 0.604 | −0.371 | 0.046 | −0.731 | −0.631 | 0.383 | −0.475 | 0.738 | 0.225 | 1.000 | ||
| 24α-MC | −0.751 | −0.379 | 0.983 | 0.346 | −0.584 | 0.343 | −0.562 | −0.753 | 0.564 | −0.676 | 0.741 | 0.187 | 0.949 | 1.000 | |
| Cholesterol | 0.457 | 0.361 | −0.200 | 0.278 | 0.672 | −0.389 | 0.132 | −0.425 | 0.545 | −0.330 | 0.594 | 0.939 | −0.002 | −0.055 | 1.000 |
© 2020 by the authors. Licensee MDPI, Basel, Switzerland. This article is an open access article distributed under the terms and conditions of the Creative Commons Attribution (CC BY) license (http://creativecommons.org/licenses/by/4.0/).
Share and Cite
Saini, R.K.; Song, M.-H.; Rengasamy, K.R.R.; Ko, E.-Y.; Keum, Y.-S. Red Shrimp Are a Rich Source of Nutritionally Vital Lipophilic Compounds: A Comparative Study among Edible Flesh and Processing Waste. Foods 2020, 9, 1179. https://doi.org/10.3390/foods9091179
Saini RK, Song M-H, Rengasamy KRR, Ko E-Y, Keum Y-S. Red Shrimp Are a Rich Source of Nutritionally Vital Lipophilic Compounds: A Comparative Study among Edible Flesh and Processing Waste. Foods. 2020; 9(9):1179. https://doi.org/10.3390/foods9091179
Chicago/Turabian StyleSaini, Ramesh Kumar, Min-Ho Song, Kannan R. R. Rengasamy, Eun-Young Ko, and Young-Soo Keum. 2020. "Red Shrimp Are a Rich Source of Nutritionally Vital Lipophilic Compounds: A Comparative Study among Edible Flesh and Processing Waste" Foods 9, no. 9: 1179. https://doi.org/10.3390/foods9091179