Social Acceptance of Aquaculture in Andalusian Atlantic Coast (Spain): An Emerging Economy Sector
by
 , , and
José Ruiz-Chico
1,2,* ,
,
Antonio R. Peña-Sánchez
1,2,
José M. Biedma-Ferrer
1,3 and
Mercedes Jiménez-García
1,2 1
INDESS (University Institute for Sustainable Social Development), University of Cadiz, 11406 Jerez de la Frontera, Spain
2
Department of General Economy, Faculty of Social Sciences and Communication. University of Cadiz, Avda. de la Universidad, 4-11406 Jerez de la Frontera, Spain
3
Department of Business Administration, Faculty of Social Sciences and Communication. University of Cadiz, Avda. de la Universidad, 4-11406 Jerez de la Frontera, Spain
*
Author to whom correspondence should be addressed.
Foods 2020, 9(7), 910; https://doi.org/10.3390/foods9070910
Submission received: 18 May 2020
/
Revised: 17 June 2020
/
Accepted: 30 June 2020
/
Published: 10 July 2020
(This article belongs to the Section Food Security and Sustainability)
Abstract
:Aquaculture is an important source of food. This document analyses its acceptance by consumers from the perspective of social carrying capacity. This concept determines the point at which its development begins to be excessive, and poses difficulties to its geographical area. In this context, our work is innovative, since, although Spain is the leading aquaculture producer in the European Union, not much research on this aspect has been developed. With this objective, we carried out 579 personal interviews with consumers from the Andalusian Atlantic coast (Spain), to determine an index of acceptance for this food and its industry. After applying a principal component analysis, we stratified the samples following Dalenius-Hodges method. According to our surveys, there is a high level of acceptance, which would place aquaculture far from its saturation point, the level at which this sector generates relevant problems for society in terms of economy or environment. Respondents also recommended its further development. Women and low-income consumers were the groups with the greatest reticence about this sector. We consider that general acceptance would be improved by implementing informative campaigns, especially for these groups, that would extend consumers’ knowledge and improve their perception of this kind of food.
Keywords:
carrying capacity; consumer satisfaction; economics; employment; environment; fish; food; quality; sustainability1. Introduction
Nowadays, aquaculture is an important source of aquatic products [1], being one of the fastest- growing food producers [2,3,4]. We have been able to witness a revolution in this sector over the last few years as it seeks for its sustainable development [2,3,5]. Nevertheless, some of its techniques are still being questioned [6]. The different points of view with regards to its costs and benefits are still to be reconciled from an economic, social, and environmental perspective [7].
On the one hand, aquaculture production plants are sustainable and cost effective from the producers’ point of view [8]. The production methods are increasingly efficient, with outputs 10 times greater than agriculture farms of similar dimensions [5]. For some regions, and mainly in some developing countries, it represents a substantial part of their business [4]. Aquaculture also has the capacity to alleviate the over-exploitation of some natural aquatic resources [8]. It can also represent a quality food supply for a growing human population [9,10], and the possibility of partial harvests [11].
Nevertheless, aquaculture can also pose some environmental challenges [12]. In fact, some of the chemical products used in aquaculture may end up reaching consumers or affecting food quality and/or its organoleptic characteristics [2,13,14,15]. Other environmental hazards, such as pollution [16], the spreading of non-native species or the alteration of natural habitats, should also be considered [17]. Finally, some conflicts of interests may appear with other local or regional agents competing for the same resources (some industries, traditional fishing, ports, or tourism) [18,19].
For this reason, it is necessary to carry out a study on the current social acceptance of this industry, in order to determine its current status with regards to its maximum social carrying capacity. This is a useful concept that should allow us to determine the actual acceptable limits for aquaculture expansion [1]. In this context, we could define the point of saturation of the sector as the level at which it exceeds such limits, and starts to be considered as a major concern from a social point of view [20]. This objective, which represents the main reason for our work, is still at a developing stage and, therefore, further progress is still required [21].
Society, in general, shows some concerns with regards to the economic, social, cultural, and environmental impact of aquaculture in those places where it takes place [22,23,24]. The sustainability of the sector requires environmental neutrality, as well as social acceptance [25]. Social acceptance is a very important aspect for this activity, and it has been studied in the literature from different approaches [7,10,26,27,28].
Firstly, from a socioeconomic standpoint, the development of aquaculture is socially accepted and economically feasible [29]. According to this approach, we should also remark the works by Little et al. that establish critical limits for social saturation and indicators that make it possible to measure its social carrying capacity, i.e., the developing stage where farm development gives place to relevant conflicts with other human activities/interests [30]. Some studies on seafood farming highlight its positive economic impact against its negative effect on the environment [31]. In particular cases, the support for aquaculture is mainly based on social rather than environmental reasons [32]. In this sense, many efforts have been made to develop the sector in a more sustainable manner, so that it is better accepted by the different groups of interest [23].
A number of works can be found in the literature that deal with aquaculture’s environmental issues by analysing different approaches, its sustainability, and the role that should be played by the corresponding public administrations in relation to these challenges [7,24,33,34,35,36,37]. Other studies emphasised the positive aspects associated to this industry’s environmental sustainability despite scarce social awareness [38,39,40].
Regarding the characteristics of the products obtained from this industry, they are usually considered cleaner than traditional fish, but in fact, it may contain some toxic substances [2]. Acceptance based on product labelling has also been analysed, and a better perception has been noticed when more complete information on sustainable procedures is provided [41]. Consumers would even be prepared to pay higher prices for seafood if higher safety food standards were guaranteed [28,42].
Finally, from an ethical point of view, fish welfare is also a concern [43,44], mainly for urban citizens and/or the younger sector of the population.
In this context, the main purpose of this work is to study the social acceptance of food obtained from aquaculture plants and compare it that of other products obtained from traditional fisheries. This study has focused on the population from the Andalusian Atlantic coast, in Southwest Spain and, by identifying the most critical population groups and their attitude towards this kind of food, should contribute to determine the social acceptable level for this sector and for its development before it reaches its point of saturation. For this purpose, we have conducted 579 face-to-face interviews, which have resulted in a representative social acceptance index that should cast some light on the future development of this production sector.
Our work could be considered as innovative, since, although Spain is the leading aquaculture producer in the European Union, not much research on the socio-economic carrying capacity of Spanish aquaculture industry has been carried out. According to the information published at Web of Science, we should highlight a proposal for a bio economic fish farm model in the Canary Islands [45]. Other works have studied this topic in a more indirectly way. For example, another case in the same islands focused mainly on its environmental impact [46]. There is also a study about mussels in Galicia [47]. In Andalusia, geographic information systems were used to improve environmental management and achieve social acceptability in Cadiz, among other considerations [48]. Since they did not focus on our topic as their primary goal, their methodology was very different, and the procedures employed should be rather associated to experimental fields.
We have focused our study on this geographic scope, because marine aquaculture emerged in this Atlantic area a century ago [49]. Moreover, Andalusia had approved 155 aquaculture sites in 2018, a large part of them (129) located inland [49]. The importance of the Atlantic Provinces lies in the fact that 131 of the Andalusian establishments are mainly located in them (84.51%), with a coverage of just 20.13% of the region surface. Together with the historical importance mentioned above, this area deserves a more detailed research like this one.
This paper will describe the methodology employed for this investigation. Then, the results from the surveys that have been carried out will be outlined. After that, the results will be discussed, and finally, our main conclusions based on those results will be elaborated.
2. Materials and Methods
As the main objective of this work, the social acceptance of aquaculture will be decisive in determining its “acceptable” level of development in these areas. The particular social carrying capacity in a specific area can be optimised, according to its general level of acceptance, and by identifying the demographic groups that are more reluctant to consume aquaculture products.
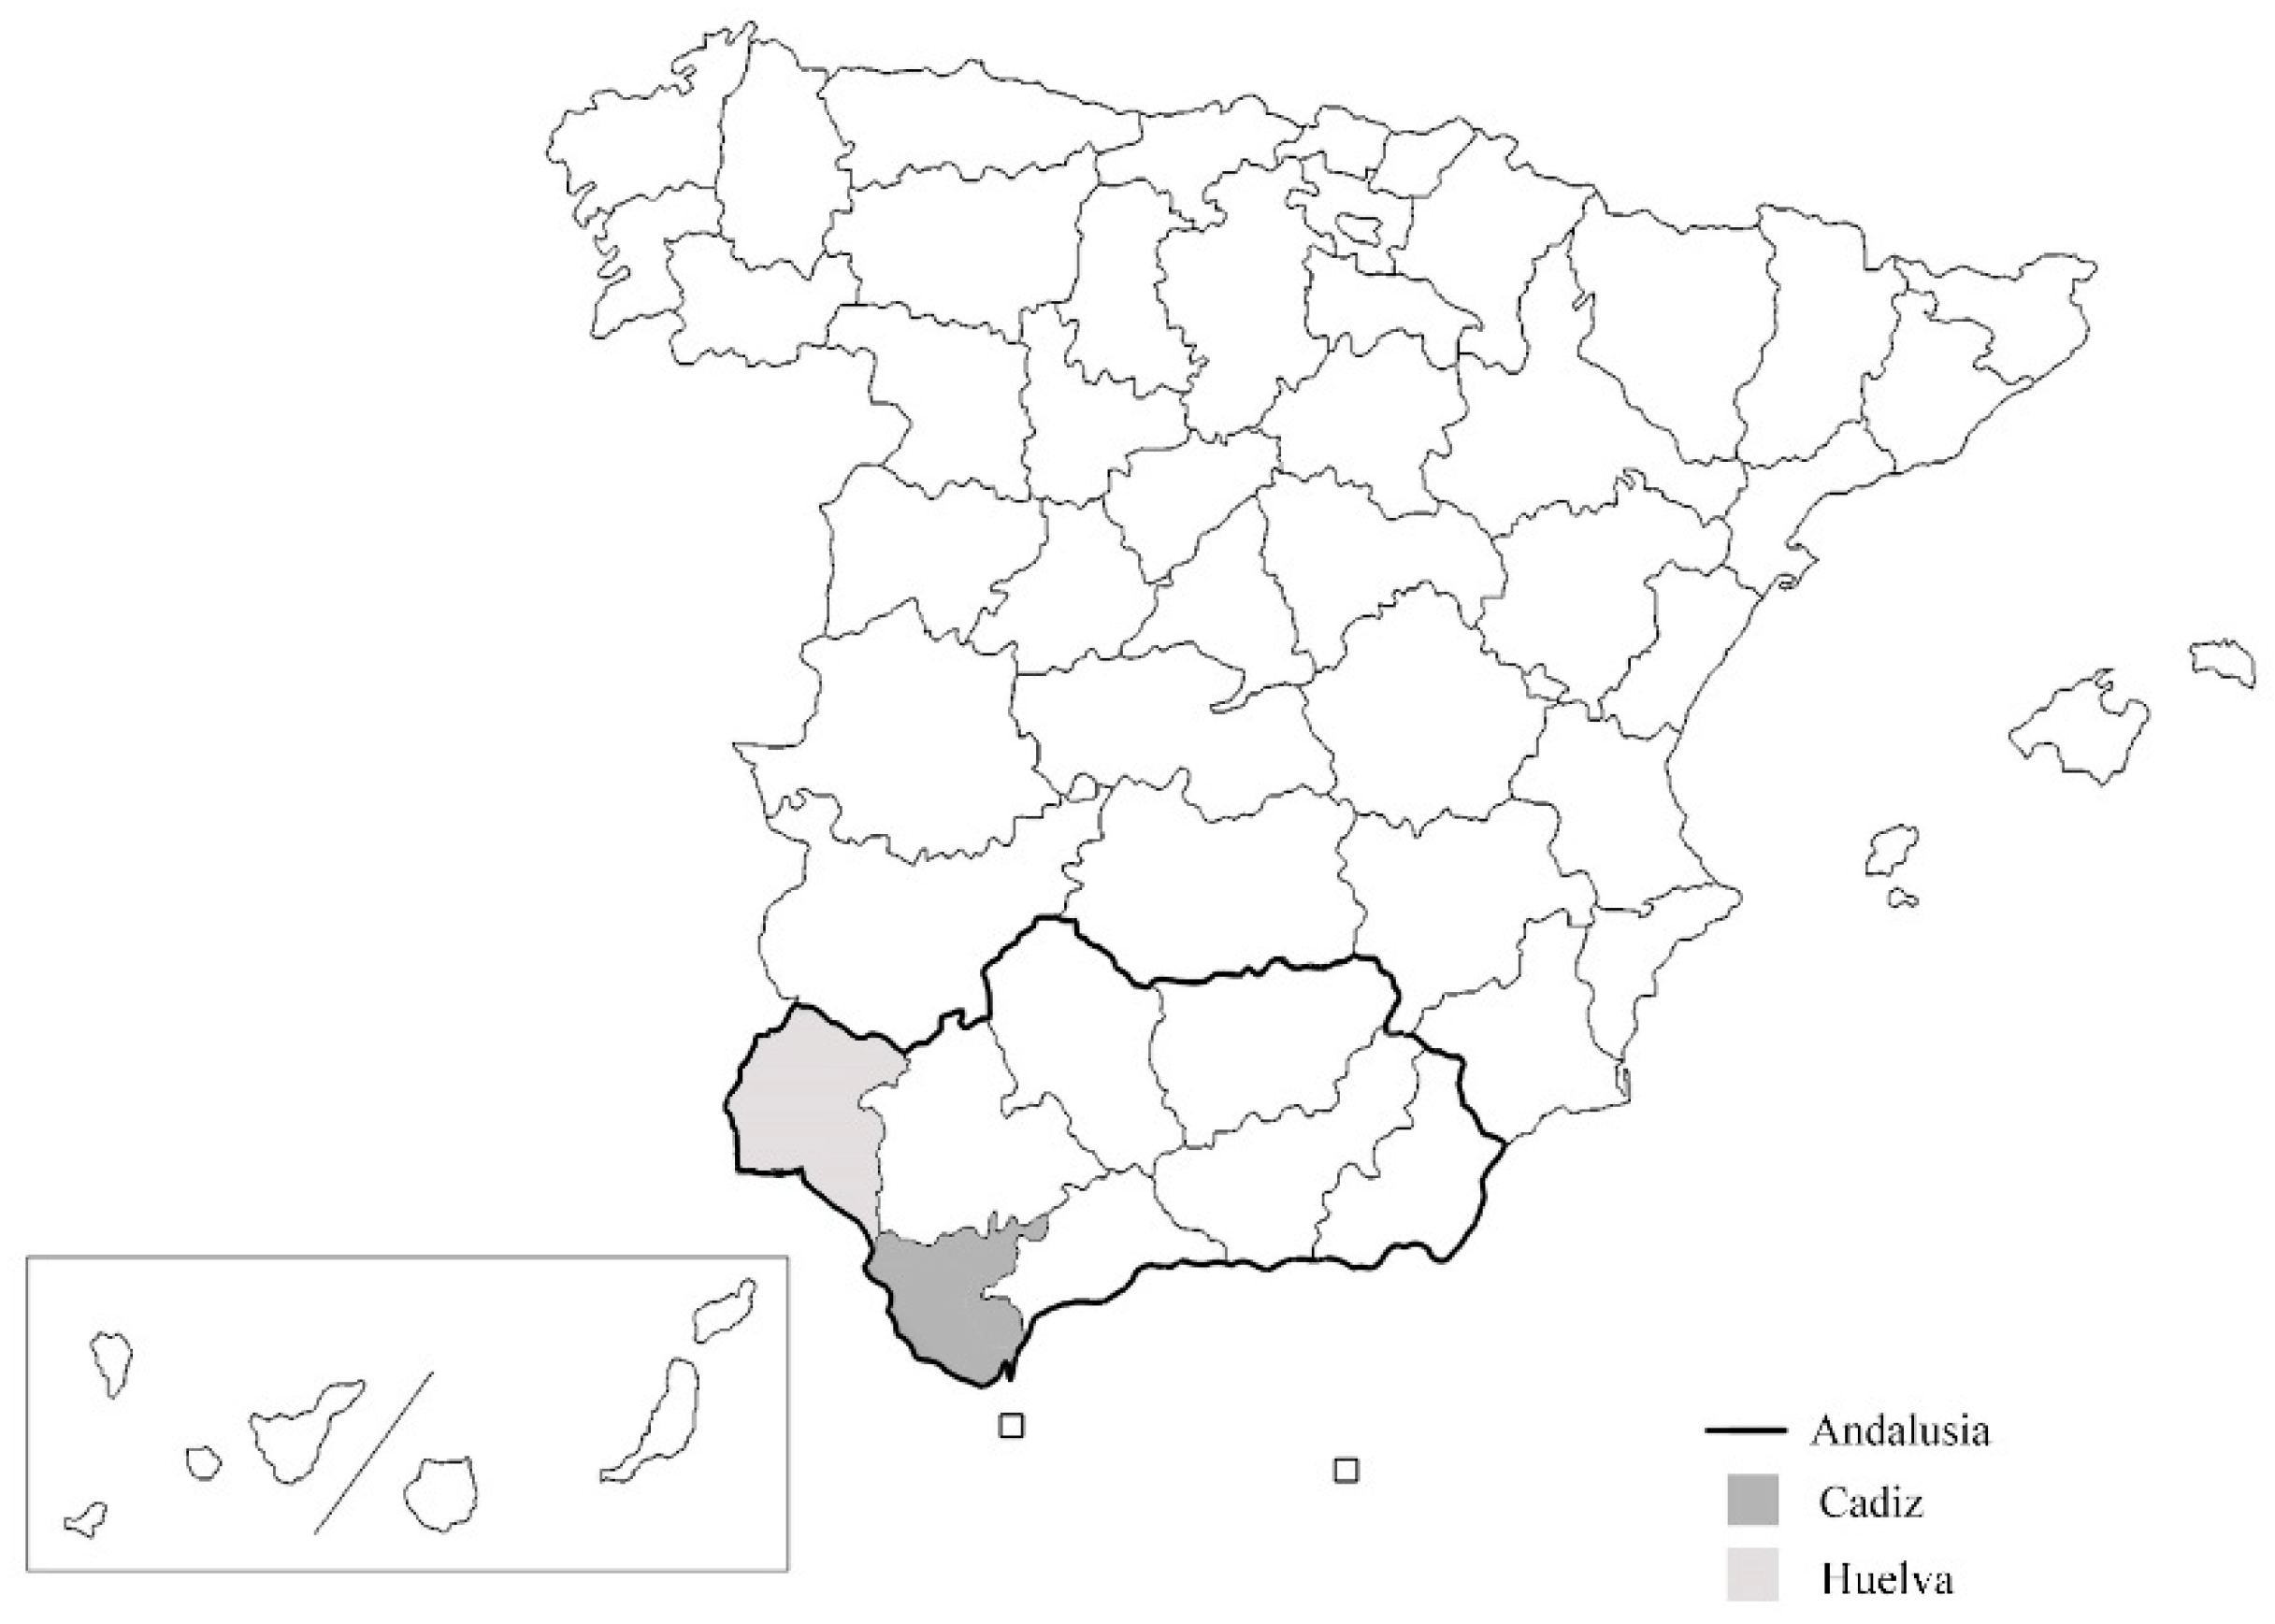
During the first stages of the study, we referred to other sources that would provide the theoretical framework for our main objective. The data obtained was used as a guideline to elaborate the subsequent questionnaire (see the Appendix A), with the use of primary sources through surveys. This is a relevant contribution of this work, since it supposes direct information from the users of the object of study. A market research company collected the survey data in the provinces of Cadiz and Huelva, the only two Atlantic provinces in Andalusia, as can be seen in Figure 1.
We opted for this methodology instead of social experiments for various reasons. First, we needed a larger, faster sample than we would get from social laboratory testing. Second, we have to meet the requirements from the project financing institution. Unfortunately, the use of experimental procedures would make the research more costly. Both approaches could be complementary and quite enriching, nevertheless, a greater budget would have to be allocated to fully cover both of them.
Our initial proposal included an objective scenario of 550 surveys and established a definite population sample. The polling company carried out the fieldwork during September 2018 by means of computer-assisted face-to-face surveys. The company completed the verification of at least 20% of the surveys delivered. This should guarantee that each individual had been actually interviewed. Likewise, they verified the consistency of the answers by asking some of the questions that were included in the survey again.
After leaving out the surveys that did not pass the researcher’s filter, we ended up with a total of 579 surveys. This represents a sampling error of +/- 4.16%, with a confidence level of 95.5%, assuming a maximum indeterminacy of around p = q = 0.5.
The polling company submitted a detailed report consisting on a simple statistical analysis of the variables, including the objective and quantifiable data. Then, we applied a number of advanced statistical methodologies to such data. As far as this work is concerned, we performed univariate analyses, mainly to determine position and dispersion measures, as well as frequency distributions. In addition, we carried out the necessary bivariate analyses to identify the possible dependencies between the variables (Pearson’s X2 tests, indicated as *).
After the revision of reference databases (such as Web of Science or Google Scholar), there is not an index like this in this field. We found, on the other hand, a good example of our methodology that had been applied to a paper on job insecurity in Toluca (Mexico) [50]. Both the method and the results were similar to what we pursue here. In our example, we selected these: “better quality”, “better taste”, “better price”, “more environmentally friendly”, “more employment”, “better employment”, “healthier”, “more variety”, and “improved availability”. We have worked with them as a semantic differential scale with 3 points, where (1) represents the greatest support for traditional fishing and (3) for aquaculture.
Before conducting a factor analysis, we validated this method by applying a Bartlett’s sphericity test [51]. This test allowed to contrast the null hypothesis that the correlation matrix is an identity, which indicated that the factor model is not suitable.
We estimated Cronbach’s alpha value in order to determine the internal consistency or reliability of these variables. Generally, any scores greater than 0.7 are acceptable [52]. We also conducted a Kaiser-Meyer-Olkin test, which measures how adequate the sample is [51]. Factor analysis would be appropriate when values remain between 0.5 and 1.
Afterwards, we carried out a factor analysis using Statgraphics Centurion XVII software. The type of factorisation applied was principal component analysis (PCA), with a varimax rotation. This type of PCA is the most commonly used and is suitable for a small number of components.
Based on a combination of two factors, the formula to determine aquaculture social acceptance index (SAI) would be as follows:
where j = 1,… n, where n is the number of subjects observed;
SAIj = V1 ∗ F1j + V2 ∗ F2j,
F1j and F2j are factors 1 and 2, which correspond to the scores from each observation j;
V1 and V2 are each factor’s weighting, which is associated to the variability explained.
Finally, once SAI calculations were completed, we proceeded to stratify them. We applied the Dalenius-Hodges method [53] to determine the five strata. This method consists of forming several groups where internal variance is the smallest, while the variance between groups is the largest one. In other words, the groups obtained are as uniform as possible inside, but they are as heterogeneous as possible between them.
3. Results
Table 1 shows the distribution of the samples that had been collected.
Table 2 shows the respondents’ degree of satisfaction with aquaculture fish as a food. We can notice a high degree of satisfaction, since 44.74% indicate that they feel very or quite satisfied with this food, although 19.17% admit that they feel little or not satisfied at all.
When we look at the degree of satisfaction according to income levels, perception improves as this variable increases. In fact, for example, the percentage grows from 33.07% to 64.52% when adding the very and quite satisfied categories. On the other hand, the population group with monthly incomes at EUR 900 or less are the ones to position “not at all satisfied” (17.69%) more frequently. This percentage drops to 6.45% when respondents belong to the over EUR 2400 monthly income category.
The respondents’ opinion on the possibility of an increase or decrease of the aquaculture activities in their area over the next years in comparison to traditional fisheries was then analysed. It can be seen from the data in Table 3 that just over half the respondents seemed to be favourable to an increment of such activities in their region. Just nearly a tenth of them believed that this activity should be reduced over time. According to these results, aquaculture has not reached a saturation point in this geographical region from the social point of view. When results are considered according to respondent’s gender, it is noteworthy that men appear as more receptive to a prospective positive evolution of the sector, since up to 57.71% of them state that it should increase, while only 45.71% of women hold the same position (p = 0.0212*). No significant differences between the monthly income categories have been found.
The respondents’ vision on this aspect should be seen together with their overall perception on the advantages and disadvantages of aquaculture. Table 4 presents the results corresponding to the respondent’s view of aquaculture advantages and disadvantages. More than one-third of the population sample indicates that this sector is considered to improve the economy in the area, one-fourth of them consider that fish product prices are a positive aspect, and, finally, one-fifth of the respondents state that this industry can provide larger amounts and variety of fish throughout the whole year. There were only a few comments with regards to environmental concerns and the possibility of species recovery.
According to respondents’ gender, economic improvement and the amount of product available are the most important aspect for men (39.13% and 21.34%), while women consider these aspects less valuable (37.12% and 18.10%). In contrast, women 27.30% value the affordable price of aquaculture products slightly more than men do (25.30%). It should be noted that when the data is analysed according to the respondents’ income levels, those with the highest purchasing power are also the ones to value the most the potential of aquaculture to improve the economy in the area (54.84%) and to commercialise more affordable products (29.03%).
Table 4 also includes the data on aquaculture possible disadvantages. In this respect, it is worth mentioning that half the respondents state that this industry does not present any inconveniences, while about one-fifth of them point to the abusive use of industrial feeds and chemical products. Specifically, according to gender groups, 22.53% of men and 17.48% of women point toward this disadvantage. With regards to worse product quality and taste, 9.49% and 7.67% of men and women cite this as an issue, respectively, while its possible negative effect on traditional fishing scores at 7.51% and 4.91% (p = 0.0237*), respectively. It should also be noted that the population group with the highest income is the most concerned over its effect on the traditional fishing sector and over the potential consequences of abusing chemical products (p = 0.0298*).
Table 5 compares aquaculture against traditional fishing in order to establish an acceptance ranking for some related aspects. The respondents specifically indicate that aquaculture produces cheaper fish (70.47%) that is more easily available in supermarkets (67.70%). In contrast, traditional fishing provides a wider variety of greater quality. It is also healthier, tastier, and more environmentally friendly.
We can see that these responses could be characterised by a pattern similar to that observed for the previous questions. Thus, by gender, men appear to be more supportive towards aquaculture than women, who seem to be more hesitant about its advantages. For example, 74.70% of men consider its products as more affordable, while only 67.18% of women see this aspect as an advantage (p = 0.0436*). Furthermore, men perceive aquaculture to be more environmentally friendly (27.67%), when just 21.17% of women agree with this aspect. When the answers are analysed according to income population groups, we can perceive a positive relation between supportive attitudes and greater monthly income. For example, most of the respondents from all the monthly income categories consider that aquaculture can provide more affordable products, nevertheless, only 60% of the respondents from the EUR 900 monthly income group agree with this statement, while the figure goes up to 80.65% in the population category whose income is over EUR 2400 a month (p = 0.0092*). With regards to health aspects, the support for traditional fishing stands out in all the population categories but decreases from 83.85% to 64.52% as we move from lowest to highest income levels (p = 0.0006*). A similar thing happens when variety is evaluated, falling from 80.77% to 58.06% (p = 0.0001*) as income level goes up.
Table 6 shows the percentage of the respondents who consider that the public institutions provide support to each kind of fish producer. More than one-third of the sample population estimate that aquaculture activities are backed up twice as much as traditional fishing. The support by the public administrations is seen as higher among men (40.32%) than among women (30.98%) (p = 0.0076*). By income level, the perception that aquaculture receives more support increases as income does so, climbing from 27.69% until up to 51.61%, which corresponds to the highest income category (p = 0.0381*).
At this stage of the research, in order to determine the acceptance index, we must take into account some of the considerations that were previously considered for the initial PCA. Firstly, the Cronbach’s alpha for these items is 0.695, which is near the minimum value accepted to confirm its reliability [52]. Table 7 also shows that, according to the Kaiser-Meyer-Olkin index, the sample is adequate for the study [51]. Bartlett’s test results are also positive, and, therefore, the factorial analysis can be conducted.
Table 8 shows the factors before and after varimax rotation. Only two of those factors were selected, since the eigenvalues of the third one are lower than one (1). The two selected factors explain nearly half the data variability. Table 9 reflects the loads of the original variables for each factor obtained. In this way, factor 1 consists of the inherent characteristics of food associated with the variables “better quality”, “better taste”, “more environmentally friendly”, and “healthier”. On the other hand, factor 2 represents more external factors, such as those generated through the activities of the companies in the sector: "better price”, “more employment”, “better employment”, “more variety”, and “improved availability”.
In this way, we calculated the index of social acceptance (SAI) of aquaculture according to the following formula:
SAIj = 0.2682 ∗ F1j + 0.2183 ∗ F2j,
The percentage of variance explained were 0.2682 and 0.2183. Then, the indices of the 579 samples were determined for the range from -56.29058 until 110.9008. In this case, the samples were divided into five levels following Dalenius and Hodges stratification procedure [53]: very low, low, medium, high, and very high.
Table 10 shows the frequency distribution that was obtained, where 32.12% of the samples indicate a high or very high acceptance of aquaculture activities, while acceptance would be low or very low for 42.14% of them.
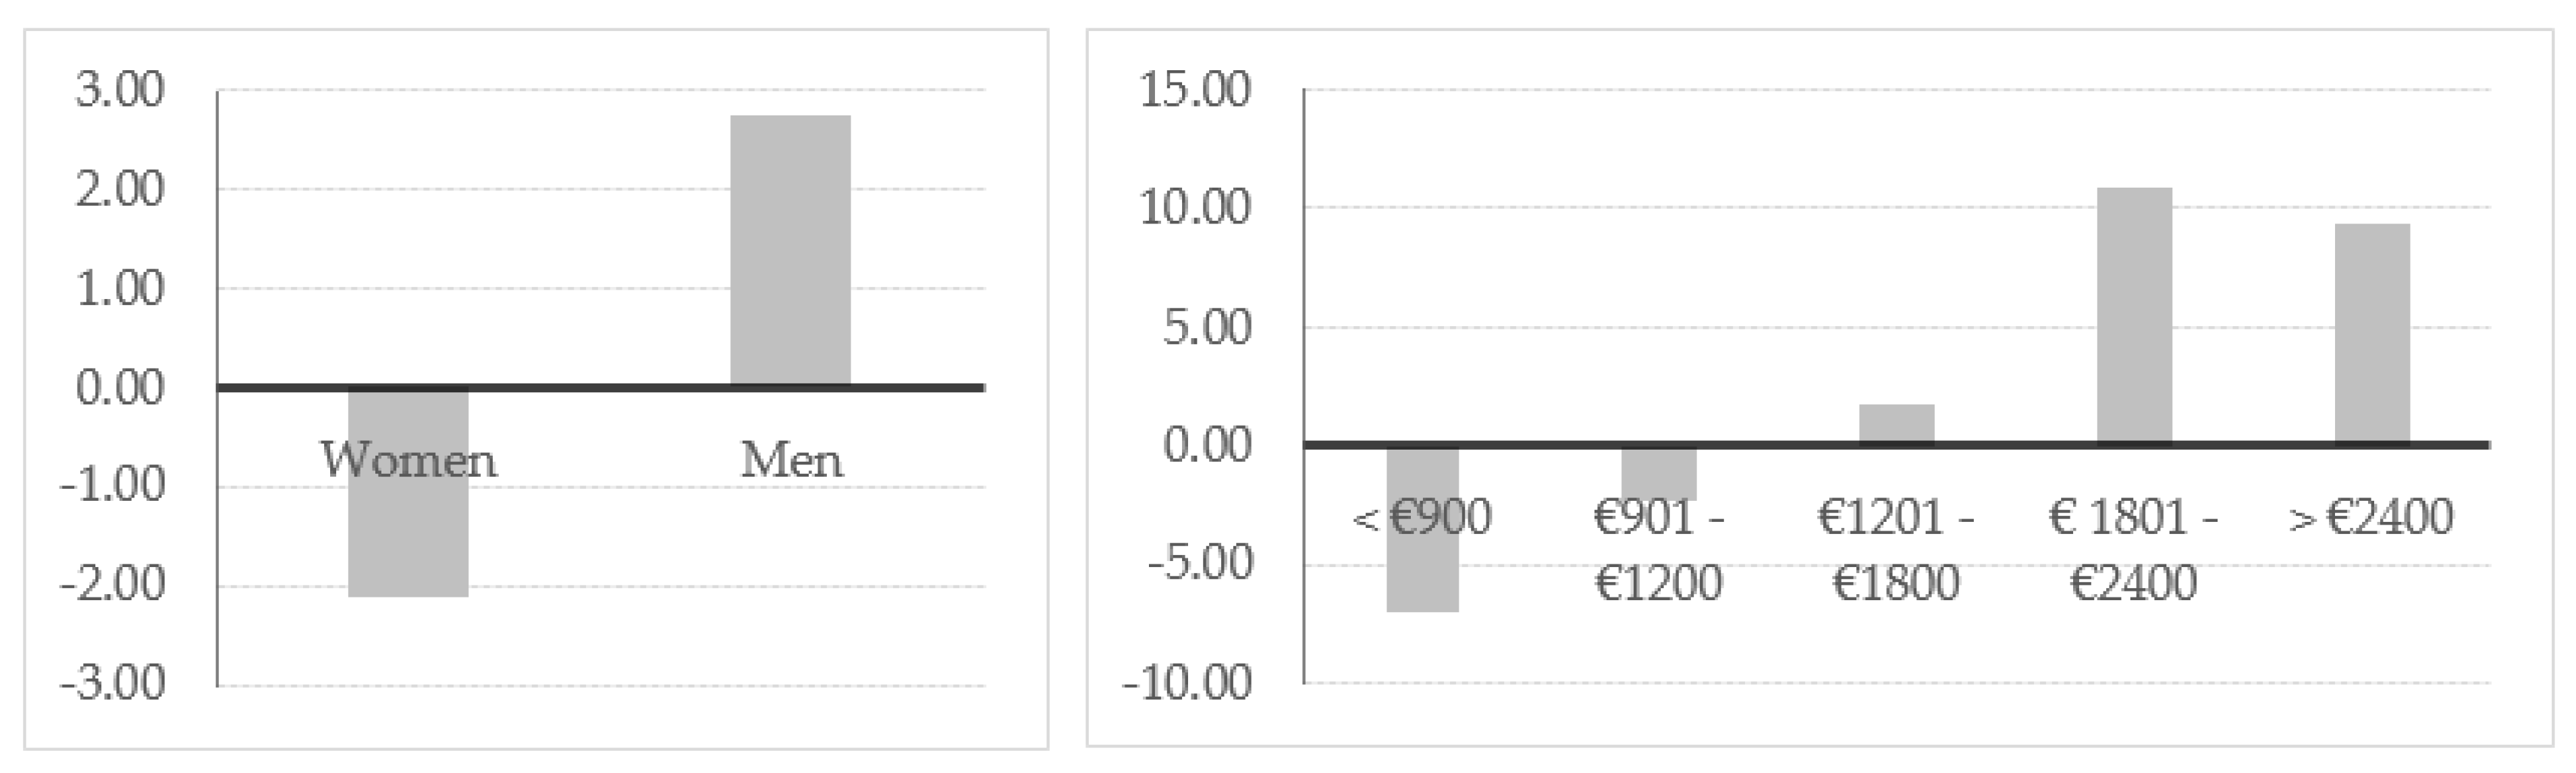
As we can see in Figure 2, the average index obtained is higher for men than for women. With regards to the respondent’s income level, this indicator increases as the corresponding income category does, with negative or lower values corresponding to the lower income categories.
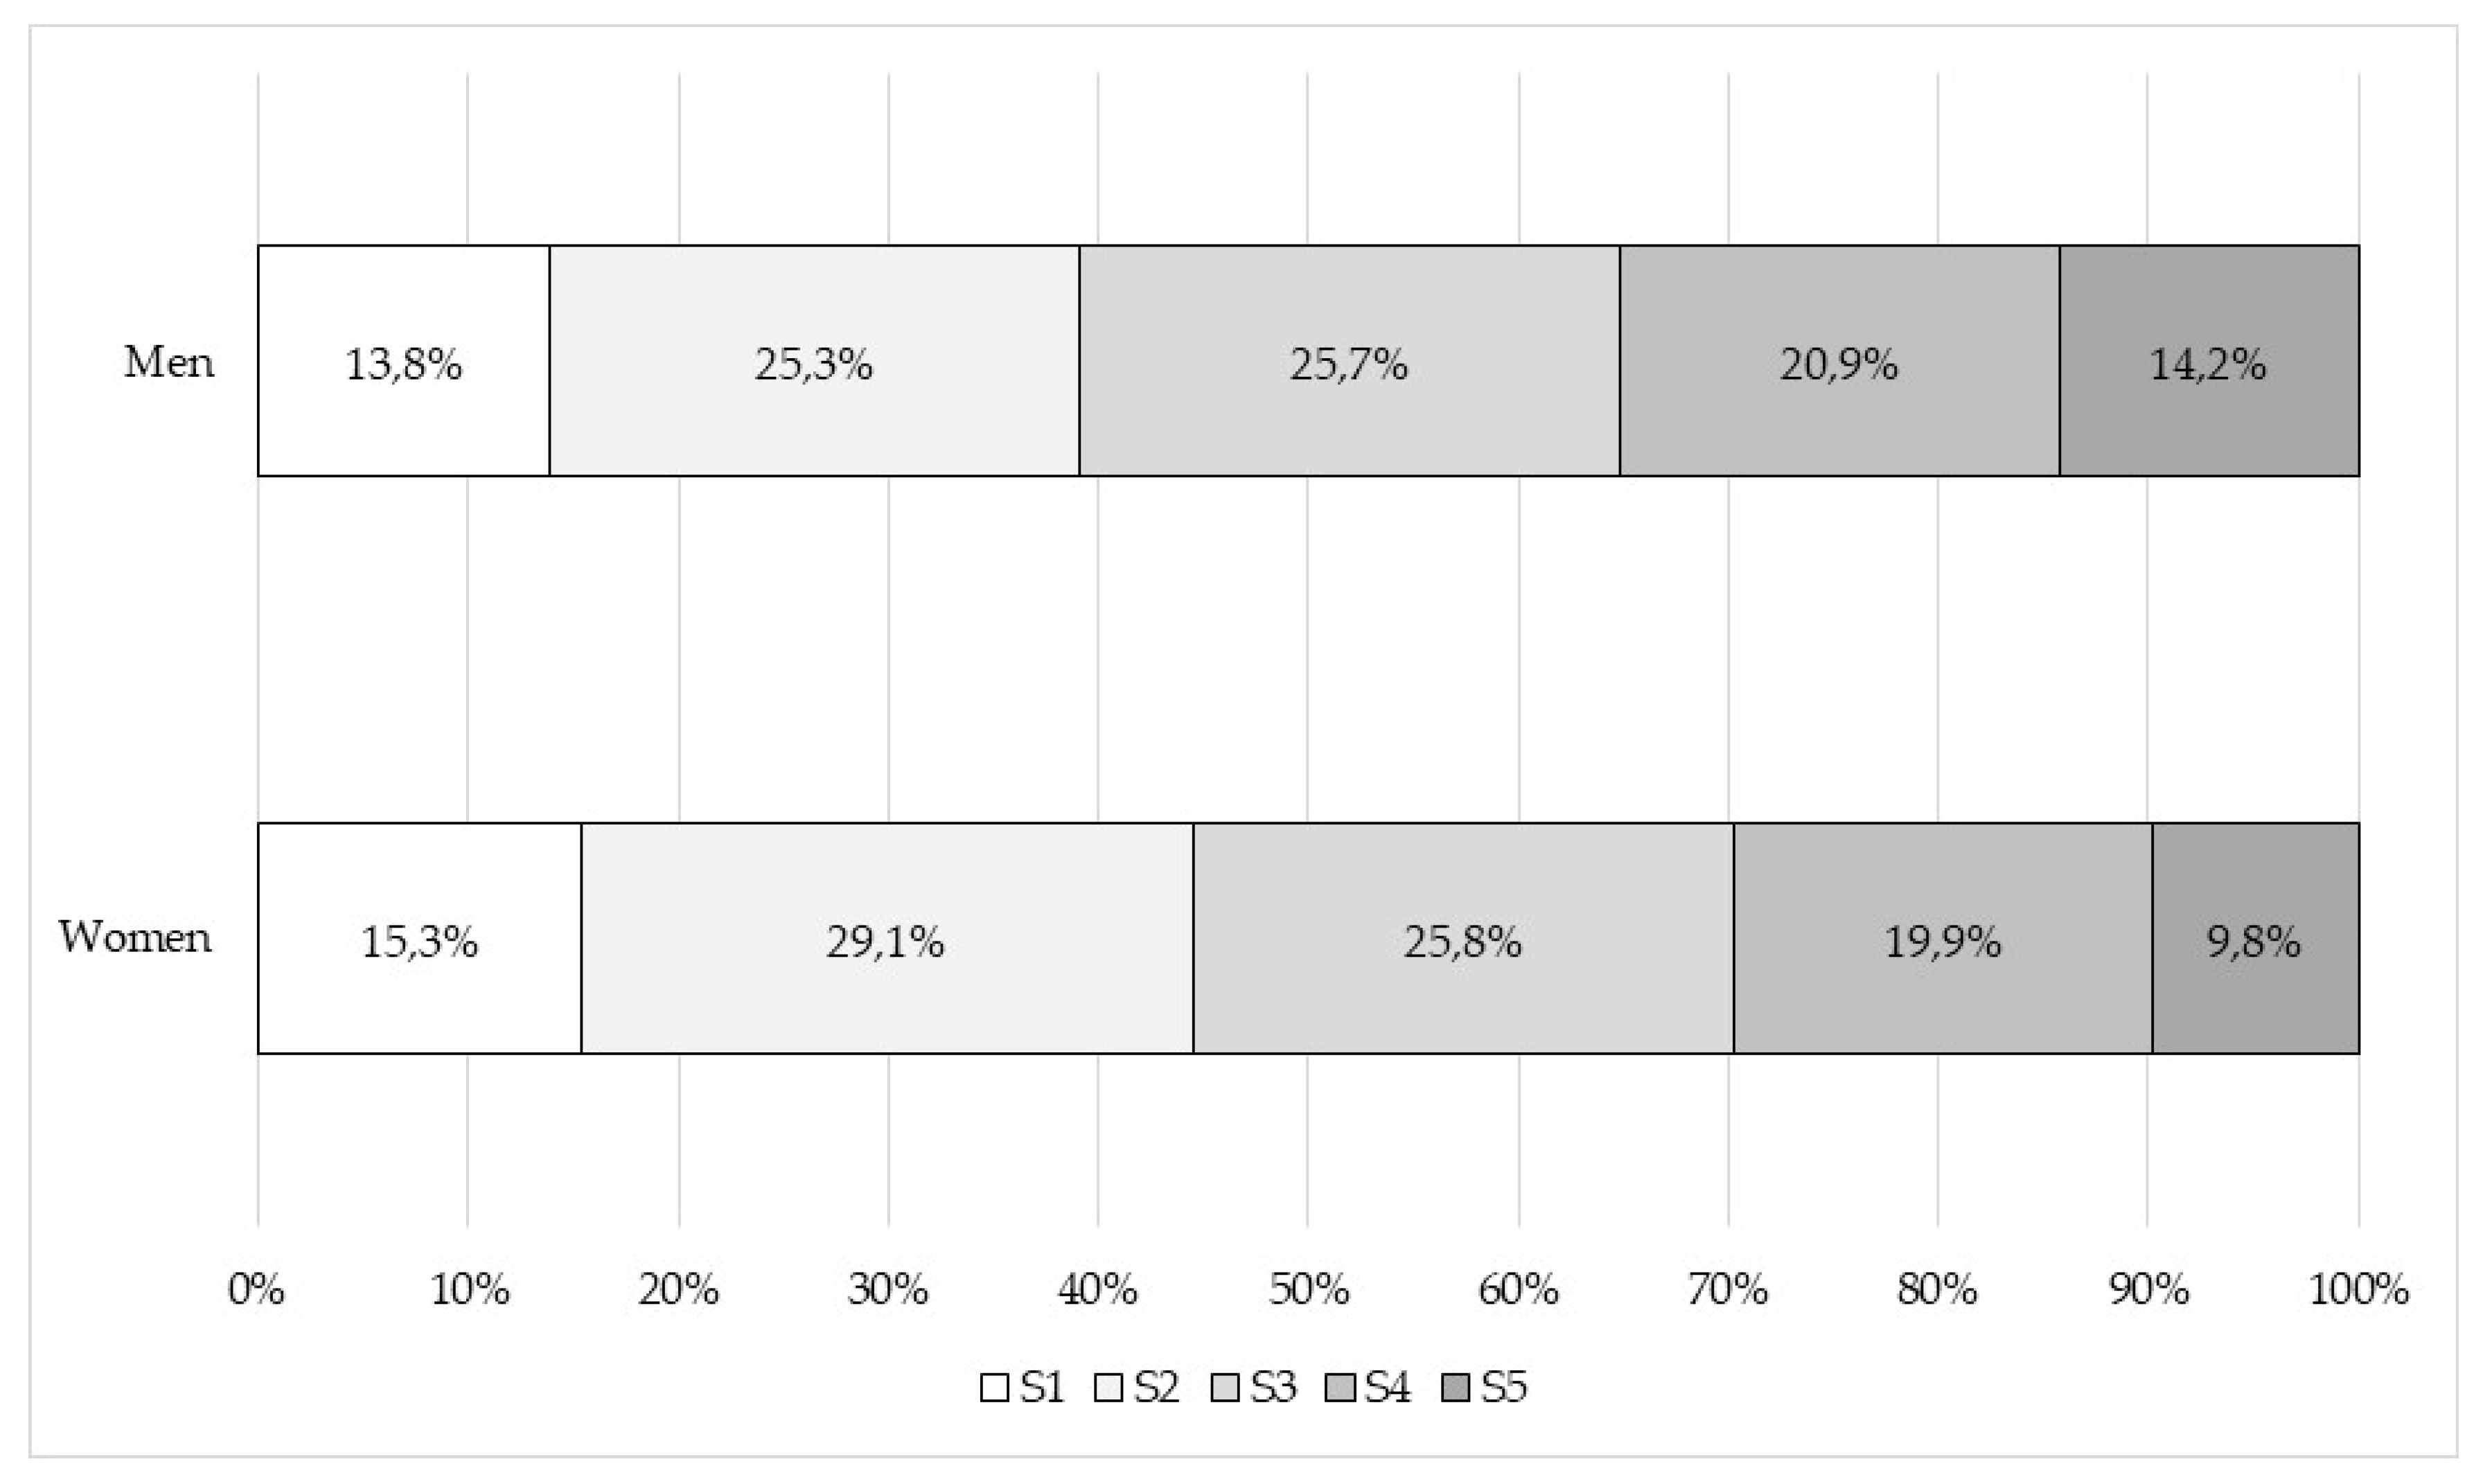
Figure 3 shows the distribution of the SAI within each gender category. It can be seen that the percentage of men increases as the degree of acceptance goes up. Therefore, men show a high or very high acceptance level with a percentage of 35.2%, i.e., 5.4 percentage points above women’s level of acceptance (29.8%).
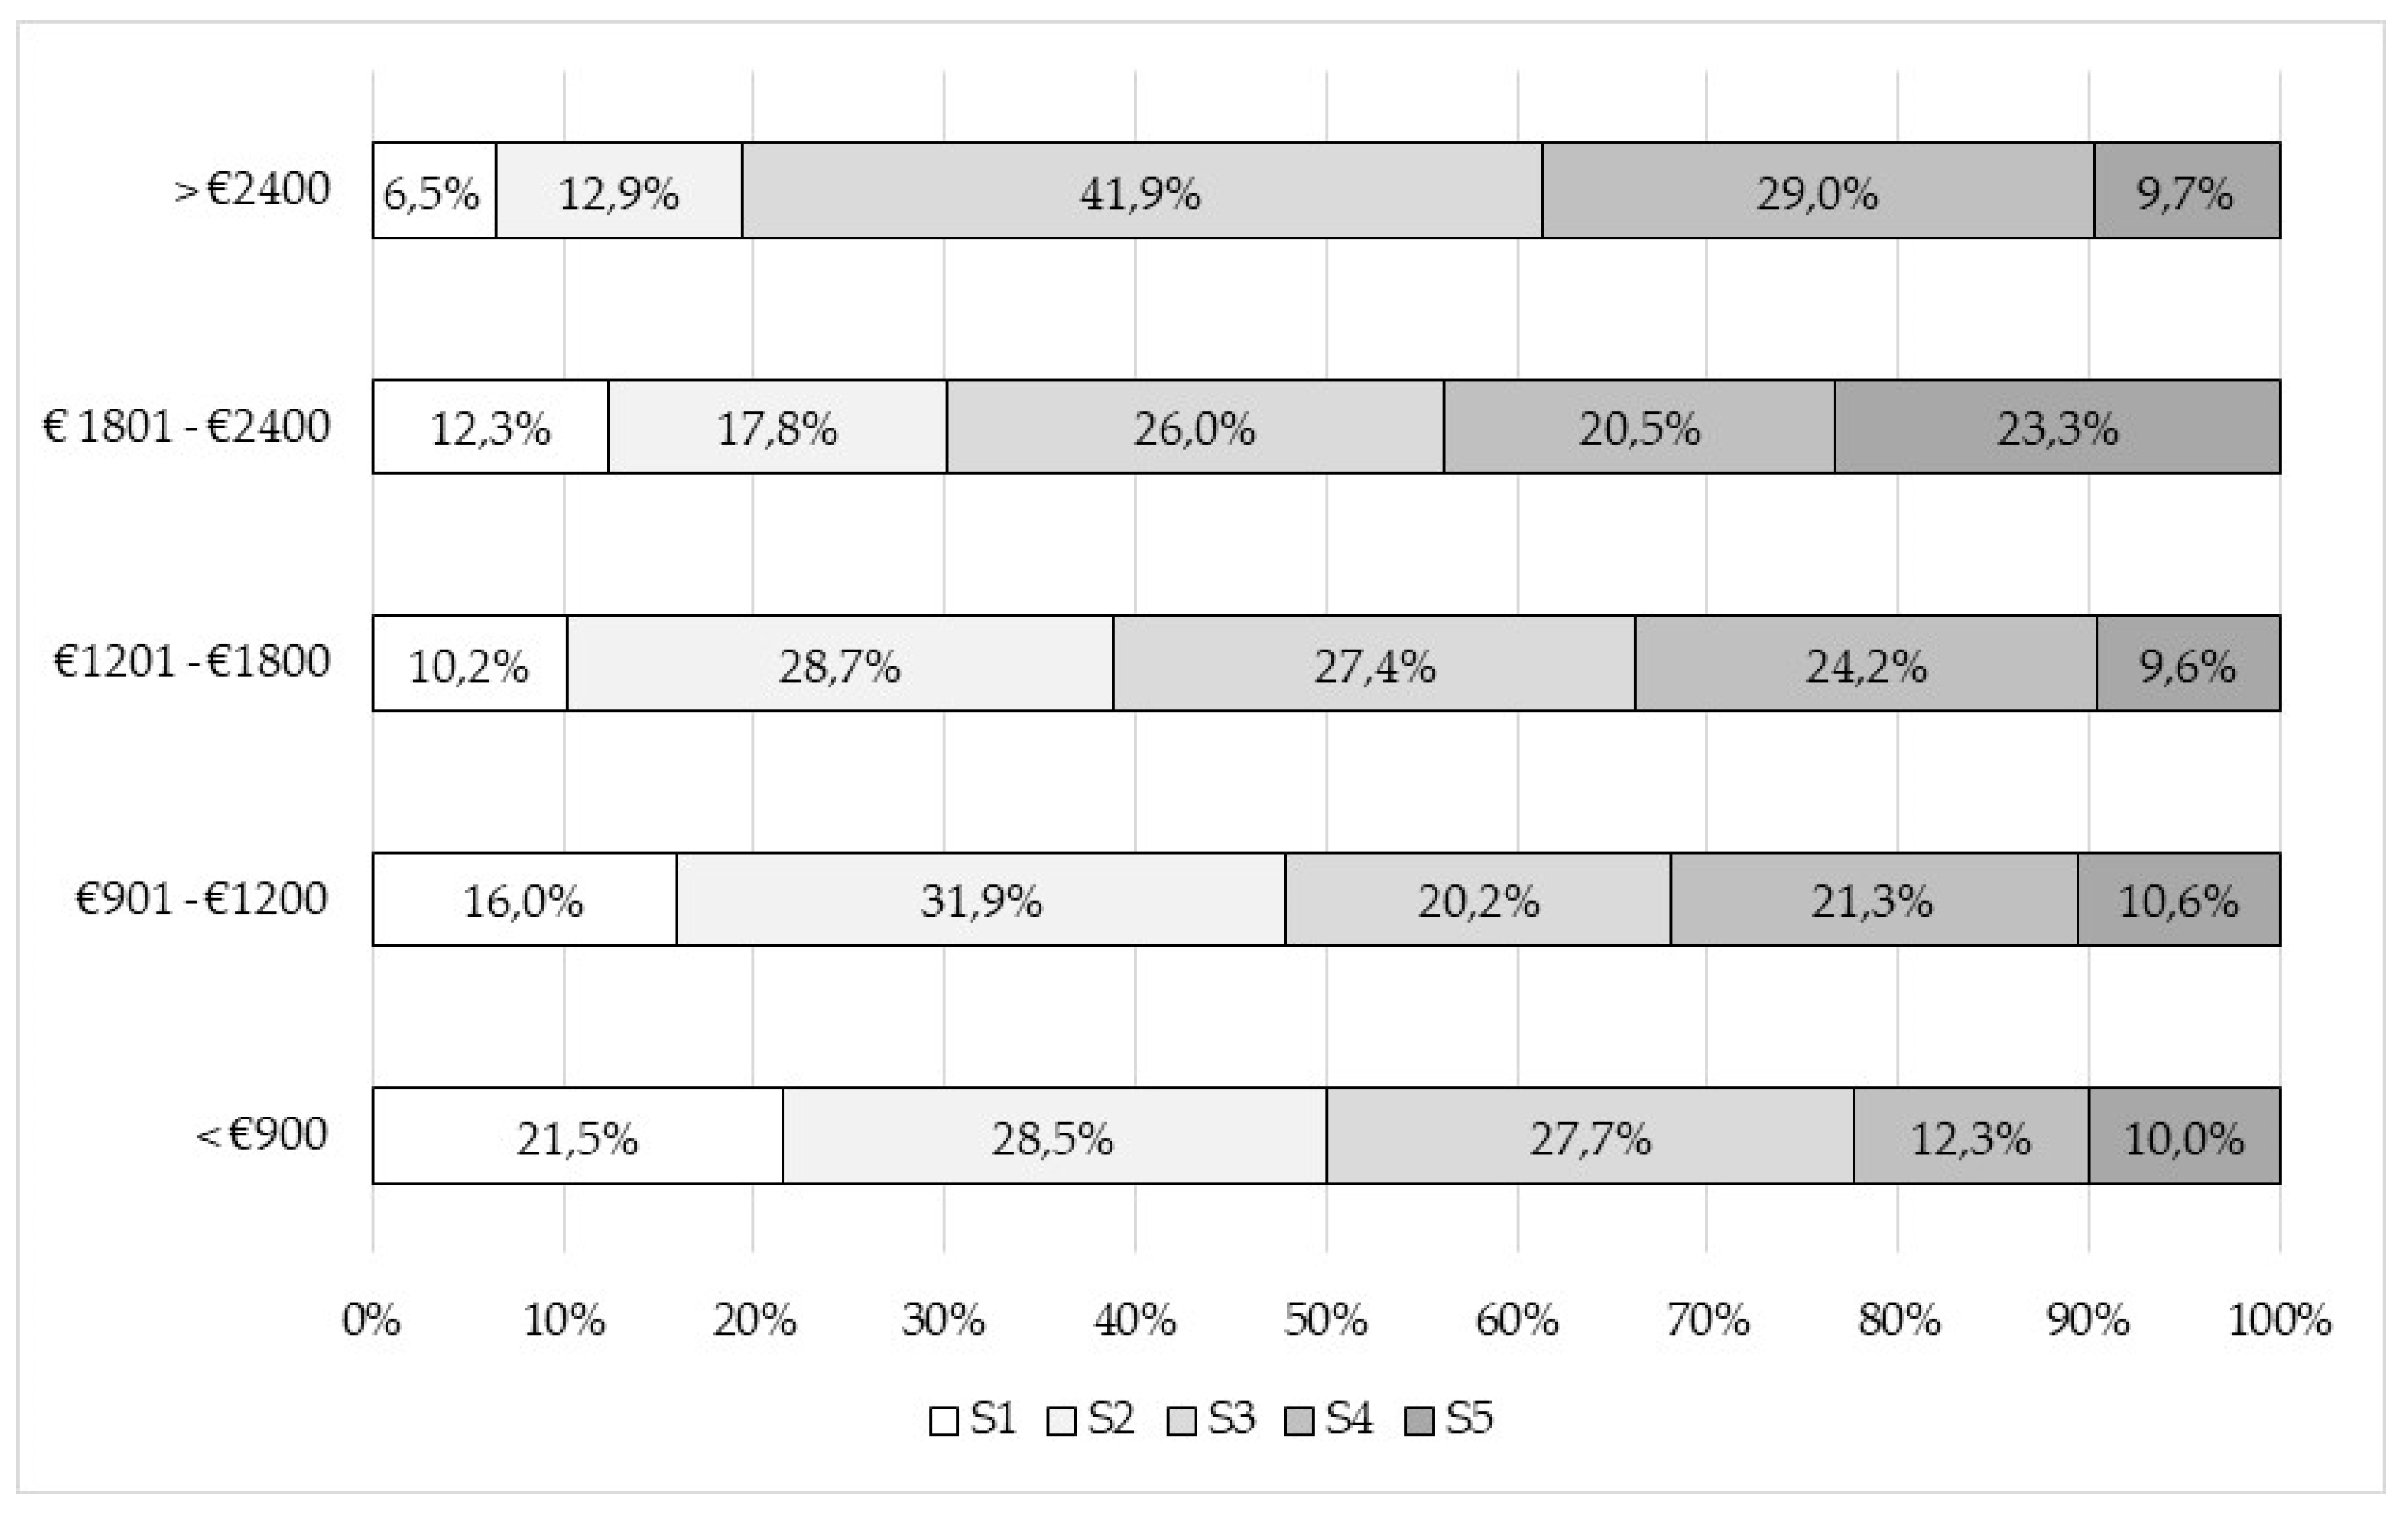
Finally, Figure 4 shows the SAI distribution according to income level categories. In can be seen that SAI goes up as income does so. Thus, the population category with income below EUR 900 show an acceptance index of 50% (medium, high, or very high), while the respondents from the highest income category reach a SAI of up to 80.6%. In the same way, the lowest SAI levels correspond to the categories with higher incomes.
4. Discussion
The general objective of this work is to determine the social acceptance in Andalusian Atlantic provinces (Spain) of aquaculture industries compared to that of traditional fisheries based on their corresponding social carrying capacity. This data should contribute to the development of this industry by preventing unwanted changes in this geographical region. For this purpose, the index of social acceptance, as the representative perception of aquaculture by the population of interest, has been determined by reducing all the possible variables to just a few relevant factors.
Our study is justified on the basis of the scarce research works on Spanish aquaculture activities that can be found in the literature, despite being the leading producer in the European Union. Most works on this topic are still at a development stage, and, consequently, further studies are still required [21] to realise the necessary development of this industry.
The results from our study are consistent with those found in the literature. Thus, general respondents from these provinces showed a high level of satisfaction with aquaculture (44.74%) [54]. In fact, according to the general SAI that has been determined for the whole population sample, 32.12% of the respondents showed a high or very high acceptance level, even if these results are below the expected results when compared to previous observations.
In this order of things, most respondents believe that aquaculture activities should increase in the next few years (50.95%). In addition, more than one-third of the respondents (35.06%) think that official institutions largely provide support to this industry. As a result, this support from the administration might be perceived (or is sometimes perceived) as a threat to traditional fisheries [7].
Consumers seem to be aware of the considerable benefits that aquaculture represent with regards to employment and economic improvement in this area (38%) [25]. In this sense, the outcome of our study indicates that aquaculture if perceived as a source of more affordable food (26.42%), of a greater variety and amount (19.52%). This is in agreement with the conclusions reached by Claret et al. [55]. On the other hand, regarding the possible drawbacks, it should be mentioned that over half the population sample (54.58%) did not point out any specific negative aspects. Nevertheless, some of the respondents (19.69%) stated that abusive use of feeds and/or chemicals should be avoided by the operating companies, while the quality and taste of the fish should be improved (8.46%). Previous studies had already highlighted the environmental problems and health risks related to salmon-producing activities [1]. On the other hand, some works claim that consumers would be prepared to accept higher prices if a greater degree of food safety was ensured [2,42]. It seems rather obvious that consumers’ perception should be taken into account for the development of any prospective studies on the technical and commercial aspects of this industry.
The results obtained from our survey have been analysed according to gender and income level categories. In this regards, we would like to point out that fish consumption has already been studied from these perspectives, while acceptance of aquaculture in itself has never been covered by any of the studies that can be found in the literature until present. This is why we regard our work as a genuinely innovative approach.
First of all, some relevant differences can be highlighted between men and women’s perception of the subject. While men have a more positive attitude towards aquaculture, women seem to stand on a more reserved position. For example, men consider it more environmentally friendly than women do.
The average acceptance index obtained is higher for men than it is for women. In fact, men’s general acceptance index is 5.4 percentage points greater. Particularly, with regards to a prospective future increment of this activity, men are more favourable than women by 12 percentage points. Additionally, the percentage of men who perceive that public administrations provide support to this industry is 9.3 points higher compared to that of women.
Moreover, men grant higher scores than women to other aspects, such as benefits, economic improvement, and product quality. In contrast, women perceive more affordable prices as a more relevant aspect than men do. Regarding the respondents’ perception of aquaculture’s negative aspects, men score higher than women when it comes to pointing out the abuse of artificial feeds and/or chemicals, lower product quality, and taste as the possible disadvantages when compared to traditional fishing.
Some substantial differences can also be found with regard to the different monthly income categories. In general, the degree of support for aquaculture increases according to higher income levels. For example, the total percentage of respondents that are very or quite satisfied with aquaculture doubles as we move from the EUR 900 monthly income category to the over EUR 2400 monthly income level. In the same way, the index of social acceptance increases according to income categories, where lower income groups also show the lowest acceptance levels. Thus, this indicator reaches a difference of 30.6 percentage points between the lowest and the highest income categories.
When questioned on aquaculture advantages and disadvantages, those respondents from the higher income categories showed more concern in relation to economic improvements and affordable prices, but also about the possible impact on traditional fishing, as well as the negative consequences of abusive employment of chemical products. Aquaculture products are perceived as more affordable by all the population income categories, although support goes up in direct relation with greater incomes, with a difference of 20.65 percentage points between the lowest and the highest categories. On the other hand, the percentage of preference for traditional fishing products decreases as income increases. For example, the percentage of respondents that perceive traditional fish as healthier falls by 19.33 percentage points between the lowest and the highest income population categories. A similar thing happens with the perception of product variety, which equally drops by 22.71 per cent as income goes up.
In relation to the prospective evolution of this sector, most population categories seemed to perceive aquaculture as a growing industry. Likewise, aquaculture is also perceived as an industry that receives support from official institutions to a greater extent.
Since the most reluctant groups (women and low-income population) are key collectives for the development of the aquaculture industry. Communication campaigns (informative or advertising) should target these profiles to spread the benefits of these products in order to reduce any concerns about them [22,25,55]. In this sense, social acceptance by this sector should be gained by enhancing the quality and sustainable aspects of aquaculture food products [25]. Promotion campaigns should focus on spreading the idea that they take into account consumers ‘opinion and pay special attention to any specific information in relation to their concerns [41]. These targets should be more easily achieved when related to aquaculture’s positive aspects, even if its more obviously negative sides would be a harder obstacle to overcome.
We can, therefore, affirm that according to the results obtained, aquaculture is far from its saturation point expressed as its maximum social carrying capacity. Analogous studies based on other Spanish regions (Galicia) have come to a similar conclusion [47].
5. Conclusions
First of all, we would like to highlight that, according to our results, there is a considerably positive attitude towards aquaculture products in general. Nevertheless, we should also point out that our expectations have not been fully met in this regard. In this sense, it is noteworthy that the two dimensions that have been brought to light by the resulting index should be considered as intrinsically related both to the product as well as to the activity of the companies. In addition, the fact that most people think that this activity should increase in their geographical region seem to indicate that this sector is socially perceived as far from its saturation point.
Based on the behavioural profiles that have been obtained, we can conclude that the attitude towards aquaculture is slightly better among men than among women, who prefer the products from traditional fisheries. A more positive attitude has also been observed in a direct relation with higher income levels of the population. Accordingly, the respondents with lower income tend to stand at a more reluctant position with respect to this industry. Consequently, we would recommend that any media campaigns that intend to increase the current acceptance levels of these industrial activities should mainly target the most critical population categories that have been identified by our research work [32,35].
We should finally highlight some of the peculiarities and limitations that we consider should be more thoroughly analysed in future studies on this topic. In the first place, the emphasis on socio-economic aspects leads the authors to apply a survey methodology that is more typical of social sciences, other than experimentation, which is more prevalent in other fields of knowledge.
Undoubtedly, in coming years, as further lines of research are covered, we will apply more complex and advanced techniques that will enrich these conclusions, even by combining them with experiments in social laboratories. According to the index obtained, these kinds of indicators have always a risk of excessive simplification [21]. We can develop them more deeply in the future. We should also delve into aspects such as the acceptance analysis by the age of the respondents, because we rejected this question after receiving the surveys. Furthermore, a joint analysis of the survey results according to gender and income level is still to be carried out. For these variables (gender, income level, age) we could apply a qualitative methodology to identify those factors (maybe society, family, culture, or education) that determine these opinions, and the possible existence of cognitive biases.
Furthermore, in future approaches, we would like to broaden this analysis in order to include other Spanish geographic areas or to focus on particular aquaculture species. We would also consider the possibility of applying similar studies to other countries, since their differences in consumption habits and their particular experience in a diversity of contexts might be rather enlightening.
Author Contributions
Conceptualisation, J.R.-C.; A.R.P.-S.; J.M.B.-F.; and M.J.-G.; methodology, A.R.P.-S.; and J.M.B.-F.; software, J.R.-C.; and M.J.-G.; validation, M.J.-G.; formal analysis, J.R.-C.; and A.R.P.-S.; investigation, J.R.-C.; and J.M.B.-F.; resources, A.R.P.-S.; and J.M.B.-F.; data curation, J.M.B.-F.; and M.J.-G.; writing—original draft preparation, J.R.-C.; A.R.P.-S.; and J.M.B.-F.; writing—review and editing, J.R.-C.; and M.J.-G.; visualisation, J.R.-C.; and A.R.P.-S.; supervision, J.M.B.-F.; and M.J.-G.; project administration, A.R.P.-S.; funding acquisition, J.R.-C.; and A.R.P.-S. All authors have read and agreed to the published version of the manuscript.
Funding
This research has been partially supported by the “LIFE IP INTEMARES” project “Integrated, innovative and participatory management of the Natura 2000 Network in the Spanish marine environment”, coordinated by the Ministry for Ecological Transition, by means of the “Biodiversity Foundation”, which finances it through the Program Pleamar and the European Maritime and Fisheries Fund (EMFF). We would also like to thank the management of the project by CTAQUA (Andalusian Aquaculture Technology Centre). This publication and research have also been partially granted by INDESS (Research Universitary Institute for Sustainable Social Development of the University of Cadiz) (Spain) and the University of Cadiz (Spain).
Conflicts of Interest
The authors declare no conflict of interest.
Appendix A
Questionnaire used for the survey (Extract)
| What is Your Level of Satisfaction with Aquaculture Fish? | |||||
| Not at all satisfied | Little satisfied | Somewhat satisfied | Quite satisfied | Very satisfied | Don’t know/No answer |
| According to You, Which Advantages Can Aquaculture Companies Generate in This Region? (You Can Select Several Options) |
| Economic improvement (more employment) |
| Greater quantity and variety of fish |
| Better quality, healthier |
| Cheaper prices |
| Environmental care; recovery of species |
| Others |
| Don’t know/No answer |
| According to You, What Disadvantages Problems Can Aquaculture Companies Cause in This Region? (You Can Select Several Options) |
| Abuse of chemicals |
| Impact on the environment |
| Worse quality and taste |
| Damage to traditional fishing |
| Others |
| Don’t know/No answer |
| In the Coming Years, Aquaculture in Your Region Should.... | |||
| Increase | Remain the same | Decrease | Don’t know/No answer |
| In Your Opinion, What Type of Fish Production are the Public Administrations Supporting the Most? | ||||
| Traditional fisheries | Aquaculture | Both equally | None | Don’t know/No answer |
| When Comparing Aquaculture and Traditional Fisheries, Which One do You Think Stands Out in These Aspects? | |||
| Traditional | Don’t know/No answer | Aquaculture | |
| Better price | ○ | ○ | ○ |
| Improved availability | ○ | ○ | ○ |
| More variety | ○ | ○ | ○ |
| Better quality | ○ | ○ | ○ |
| Healthier | ○ | ○ | ○ |
| Better taste | ○ | ○ | ○ |
| More employment | ○ | ○ | ○ |
| Better employment | ○ | ○ | ○ |
| More environmentally friendly | ○ | ○ | ○ |
| Gender of the Respondent | |
| Female | Male |
| Monthly Gross Income Level of the Respondent (€) | ||||
| 900 or less | 901–1200 | 1201–1800 | 1801–2400 | 2400 or over |
References
- Kluger, L.C.; Filgueira, R.; Byron, C.J. Using media analysis to scope priorities in social carrying capacity assessments: A global perspective. Mar. Policy 2019, 99, 252–261. [Google Scholar] [CrossRef]
- Cole, D.W.; Cole, R.; Gaydos, S.J.; Gray, J.; Hyland, G.; Jacques, M.L.; Powell-Dunford, N.; Sawhney, C.; Au, W.W. Aquaculture: Environmental, toxicological, and health issues. Int. J. Hyg. Environ. Health 2019, 212, 369–377. [Google Scholar] [CrossRef] [PubMed]
- Garlock, T.; Asche, F.; Anderson, J.; Bjørndal, T.; Kumar, G.; Lorenzen, K.; Ropicki, A.; Smith, M.D.; Tveterås, R. A global blue revolution: Aquaculture growth across regions, species, and countries. Rev. Fish. Sci. Aquac. 2020, 28, 107–116. [Google Scholar] [CrossRef]
- Tacon, A.G.J. Trends in global aquaculture and aquafeed production: 2000–2017. Rev. Fish. Sci. Aquac. 2020, 28, 43–56. [Google Scholar] [CrossRef]
- Gonzalez-Laxe, F. La acuicultura y el desarrollo economico. Boletín. Inst. Español Oceanogr. 2011, 18, 265–274. [Google Scholar]
- Bostock, J.; McAndrew, B.; Richards, R.; Jauncey, K.; Telfer, T.; Lorenzen, K.; Little, D.; Ross, L.; Handisyde, N.; Gatward, I.; et al. Aquaculture: Global status and trends. Philos. Trans. R. Soc. B Biol. Sci. 2010, 365, 2897–2912. [Google Scholar] [CrossRef]
- Mazur, N.A.; Curtis, A.L. Understanding community perceptions of aquaculture: Lessons from Australia. Aquac. Int. 2008, 16, 601–621. [Google Scholar] [CrossRef] [Green Version]
- Bene, C.; Arthur, R.; Norbury, H.; Allison, E.H.; Beveridge, M.; Bush, S.; Campling, L.; Leschen, W.; Little, D.; Squires, D.; et al. Contribution of fisheries and aquaculture to food security and poverty reduction: Assessing the current evidence. World Dev. 2016, 79, 177–196. [Google Scholar] [CrossRef]
- Varadi, L.; Szucs, I.; Pekar, F.; Blokhin, S.; Csavas, I. Aquaculture development trends in Europe. In Aquaculture in the Third Millennium: Technical, Proceedings of the Conference on Aquaculture in the Third Millennium, Bangkok, Thailand, 20–25 February 2000; Subasinghe, R.P., Bueno, P., Phillips, M.J., Hough, C., McGladdery, S.E., Arthur, J.R., Eds.; FAO: Bangkok, Thailand; Italy, Rome, 2001; pp. 397–416. [Google Scholar]
- Katranidis, S.; Nitsi, E.; Vakrou, A. Social acceptability of aquaculture development in coastal areas: The case of two Greek islands. Coast Manag. 2003, 31, 37–53. [Google Scholar] [CrossRef]
- Estrada-Perez, A.; Ruiz-Velazco, J.M.; Hernandez-Llamas, A.; Zavala-Leal, I.; Martinez-Cardenas, L. Deterministic and stochastic models for analysis of partial harvesting strategies and improvement of intensive commercial production of whiteleg shrimp (Litopenaeusvannamei). Aquac. Eng. 2016, 70, 56–62. [Google Scholar] [CrossRef]
- Espinosa, A.; Bermudez, M.D. La acuicultura y su impacto al medio ambiente. Estud. Soc. 2012, 2, 219–232. [Google Scholar]
- Black, K.D. Sustainability of aquaculture. In Environmental Impacts of Aquaculture; Black, K.D., Ed.; Sheffield Academic Press: Sheffield, UK, 2001; pp. 199–212. [Google Scholar]
- Naylor, R.L.; Goldburg, R.J.; Primavera, J.H.; Kautsky, N.; Beveridge, M.C.M.; Clay, J.; Folke, C.; Lubchenco, J.; Mooney, H.; Troell, M. Effect of aquaculture on world fish supplies. Nature 2001, 405, 1017–1024. [Google Scholar] [CrossRef] [PubMed] [Green Version]
- Sapkota, A.; Sapkota, A.R.; Kucharski, M.; Burke, J.; McKenzie, S.; Walker, P.; Lawrence, R. Aquaculture practices and potential human health risks: Current knowledge and future priorities. Environ. Int. 2008, 34, 1215–1226. [Google Scholar] [CrossRef] [PubMed]
- Borja, A. Los impactos ambientales de la acuicultura y la sostenibilidad de esta actividad. Boletín. Inst. Español Oceanogr. 2011, 18, 41–49. [Google Scholar]
- Lima, L.B.; Oliveira, F.J.M.; Giacomini, H.C.; Lima-Junior, D.P. Expansion of aquaculture parks and the increasing risk of non-native species invasions in Brazil. Rev. Aquac. 2018, 10, 111–122. [Google Scholar] [CrossRef]
- Maya-Jariego, I.; Ramos, D.H.; Del Corral, D.F. Relations between professional groups in the Atlantic and Mediterranean fishing enaprilclaves of Andalusia (Spain): A personal networks approach with clustered graphs. Mar. Policy 2016, 72, 48–58. [Google Scholar] [CrossRef] [Green Version]
- Billing, S.L. Using public comments to gauge social licence to operate for finfish aquaculture: Lessons from Scotland. Ocean Coast Manag. 2018, 165, 401–415. [Google Scholar] [CrossRef]
- Inglis, G.J.; Hayden, B.J.; Ross, A.H. An overview of factors affecting the carrying capacity of coastal embayments for mussel culture. In NIWA Client Report; CHC00/69 Project No. MFE00505; National Institute of Water and Atmospheric Research Ltd.: Christchurch, New Zealand, 2000. [Google Scholar]
- Aubert, A.; Aschenbroich, A.; Gaertner, J.C.; Latchere, O.; Archambault, P.; Gaertner-Mazouni, N. Assessment of carrying capacity for bivalve mariculture in subtropical and tropical regions: The need for tailored management tools and guidelines. Rev. Aquac. 2020. [Google Scholar] [CrossRef]
- Kaiser, M.; Stead, S.M. Uncertainties and values in European aquaculture: Communication, management and policy issues in times of “changing public perceptions”. Aquac. Int. 2002, 10, 469–490. [Google Scholar] [CrossRef]
- Mazur, N.A.; Curtis, A.L. Risk perceptions, aquaculture, and issues of trust: Lessons from Australia. Soc. Natur. Resour. 2006, 19, 791–808. [Google Scholar] [CrossRef]
- Liu, J.; Shi, Y.; Sarpe, D.; Neculita, M.; Zhang, X. Stakeholder perception for sustainable development and pollution of coastal aquaculture. J. Environ. Prot. Ecol. 2011, 12, 1424–1432. [Google Scholar]
- FOESA (SpanishAquacultureObservatoryFoundation). Valoracion de la Sostenibilidad de la Acuicultura en España; FOESA: Madrid, Spain, 2012. [Google Scholar]
- Carvalho, P. Results of a South Australian Coastal Aquaculture Survey. Waves and Regional Ripples (November); Marine and Coastal Community Network: Adelaide, Australia, 1998. [Google Scholar]
- Wilson, D. Community Consultation Survey of Aquaculture Developments in the Bowen Region; Queensland Department of State Development: Brisbane, Australia, 2001. [Google Scholar]
- Barrington, K.; Ridler, N.; Chopin, T.; Robinson, S.; Robinson, B. Social aspects of the sustainability of integrated multi-trophic aquaculture. Aquac. Int. 2010, 18, 201–211. [Google Scholar] [CrossRef]
- Fernandez-Mendez, J.I. Caracteristicas y problemas de la pesca en Mexico. In Pesca, Acuacultura e Investigacion en Mexico; Guzman, P., Fuentes, D.F., Eds.; Centro de Estudios para el Desarrollo Rural Sustentable y la Soberania Alimentaria: Mexico, Mexico, 2006; pp. 158–170. [Google Scholar]
- Little, D.C.; Murray, F.J.; Leschen, W.; Waley, D. Socio-economic factors affecting aquaculture site selection and carrying capacity. In Site Selection and Carrying Capacities for Inland and Coastal Aquaculture; Ross, L.G., Telfer, T.C., Falconer, L., Soto, D., Aguilar-Majarrez, J., Eds.; FAO Fisheries and Aquaculture Proceedings 21: Rome, Italy, 2013; pp. 103–114. [Google Scholar]
- D’Anna, L.M.; Murray, G.D. Perceptions of shellfish aquaculture in British Columbia and implications for well-being in marine social-ecological systems. Ecol. Soc. 2015, 20. [Google Scholar] [CrossRef] [Green Version]
- Dalton, T.; Jin, D.; Thompson, R.; Katzanek, A. Using normative evaluations to plan for and manage shellfish aquaculture development in Rhode Island coastal waters. Mar. Policy 2017, 83, 194–203. [Google Scholar] [CrossRef]
- Beveridge, M.C. Piscicultura en jaulas y corrales. In Modelos Para Calcular la Capacidad de Carga y las Repercusiones en el Ambiente (No. 04; SH151, B4.); FAO Doc. Tec. Pesca: Rome, Italy, 1986. [Google Scholar]
- Whitmarsh, D.; Palmieri, M.G. Social acceptability of marine aquaculture: The use of survey-based methods for eliciting public and stakeholder preferences. Mar. Policy 2009, 33, 452–457. [Google Scholar] [CrossRef]
- Byron, C.; Link, J.; Costa-Pierce, B.; Bengtson, D. Calculating ecological carrying capacity of shellfish aquaculture using mass-balance modeling: Narragansett Bay, Rhode Island. Ecol. Model. 2011, 222, 1743–1755. [Google Scholar] [CrossRef]
- Byron, C.; Link, J.; Costa-Pierce, B.; Bengtson, D. Integrating science into management: Ecological carrying capacity of bivalve shellfish aquaculture. Mar. Policy 2011, 35, 363–370. [Google Scholar] [CrossRef]
- Byron, C.; Link, J.; Costa-Pierce, B.; Bengtson, D. Modeling ecological carrying capacity of shellfish aquaculture in highly flushed temperate lagoons. Aquaculture 2011, 314, 87–99. [Google Scholar] [CrossRef]
- Blackstone, L. Environmental Consumer Research: National Fisheries Institute; Len Blackstone Ad. Group: Washington, WA, USA, 2001. [Google Scholar]
- Aslin, H.J.; Byron, I.G. Community Perceptions of Fishing: Implications for Industry Image, Marketing and Sustainability; Fisheries Research and Development Corporation and Bureau of Rural Sciences: Canberra, Australia, 2003. [Google Scholar]
- Mazur, N.A.; Aslin, H.; Curtis, A.L.; Byron, I.; Magpantay, C. Community Perceptions of Aquaculture: Report on the Eyre Peninsula; Bureau of Rural Sciences: Canberra, Australia, 2004. [Google Scholar]
- Simoes, J.S.; Marsico, E.T.; Da Cruz, A.G.; De Freitas, M.Q.; Doro, L.H.; Conte-Junior, C.A. Effect of sustainability information on consumers’ liking of freshwater prawn (Macrobrachiumrosenbergii). J. Sci. Food Agric. 2015, 95, 3160–3164. [Google Scholar] [CrossRef]
- Garza-Gil, M.D.; Vazquez-Rodriguez, M.X.; Varela-Lafuente, M.M. Marine aquaculture and environment quality as perceived by Spanish consumers. The case of shellfish demand. Mar. Policy 2016, 74, 1–5. [Google Scholar] [CrossRef]
- Kupsala, S.; Jokinen, P.; Vinnari, M. Who cares about farmed fish? Citizen perceptions of the welfare and the mental abilities of fish. J. Agric. Env. Ethic 2013, 26, 119–135. [Google Scholar] [CrossRef]
- Martos-Sitcha, J.A.; Mancera, J.M.; Prunet, P.; Magnoni, L.J. Welfare and stressors in fish: Challenges facing aquaculture. Front. Physiol. 2020, 11, 162. [Google Scholar] [CrossRef] [PubMed]
- Rabasso, M.; Hernandez, J.M. Bioeconomic analysis of the environmental impact of a marine fish farm. J. Environ. Manag. 2015, 158, 24–35. [Google Scholar] [CrossRef]
- Martin, J.V.; Henriquez, N.G.; Trabaue, R.H.; Dominguez, L.M.; Rodriguez, M.G. Preliminary studies on environmental impact of cage aquaculture in Canary Islands. WIT Trans. Ecol. Environ. 2000, 43, 85–91. [Google Scholar]
- Duarte, P.; Labarta, U.; Fernandez-Reiriz, M.J. Modelling local food depletion effects in mussel rafts of Galician Rias. Aquaculture 2008, 274, 300–312. [Google Scholar] [CrossRef] [Green Version]
- Silva, C.; Yañez, E.; Martin-Diaz, M.L.; DelValls, T.A. Assessing a bioremediation strategy in a shallow coastal system affected by a fish farm culture-application of GIS and shellfish dynamic models in the Rio San Pedro, SW Spain. Mar. Pollut. Bull. 2012, 64, 751–765. [Google Scholar] [CrossRef] [PubMed]
- Andalusian Agricultural and Fisheries Management Agency (AGAPA). Acuicultura Marina Andalucía 2018, Andalusian Agricultural and Fisheries Management Agency and Ministry of Agriculture, Livestock, Fisheries and Sustainable Development; AGAPA: Sevilla, Spain, 2019. [Google Scholar]
- Roman-Sanchez, Y.G.; Sollova-Manenova, V. Precariedad laboral de jóvenes asalariados en la ciudad de Toluca, 2005–2010. Convergencia 2015, 67, 129–152. [Google Scholar] [CrossRef] [Green Version]
- Uriel-Jimenez, E.; Aldas-Manzano, J. Análisis multivariante aplicado; Thomson Ed.: Madrid, Spain, 2005. [Google Scholar]
- Santesmases-Mestre, M. Dyane: Version 4; Diseño y Analisis de Encuestas en Investigacion Social y de Mercados; Piramide: Madrid, Spain, 2009. [Google Scholar]
- Dalenius, T.; Hodges, J.L., Jr. Minimum variance stratification. J. Am. Stat. Assoc. 1959, 54, 88–101. [Google Scholar] [CrossRef]
- APROMAR (Aquaculture Business Association of Spain). La acuicultura en España 2019; Apromar: Chiclana, Spain, 2019. [Google Scholar]
- Claret, A.; Guerrero, L.; Aguirre, E.; Rincon, L.; Hernandez, M.D.; Martinez, I.; Peleteiro, J.B.; Grau, A.; Rodríguez-Rodríguez, C. Consumer preferences for sea fish using conjoint analysis: Exploratory study of the importance of country of origin, obtaining method, storage conditions and purchasing price. Food Qual. Prefer. 2012, 26, 259–266. [Google Scholar] [CrossRef]
Figure 1.
Andalusian Atlantic coast in Spain.

Figure 2.
Index of acceptance by gender and income level.

Figure 3.
Social acceptance index (SAI) percentage distribution within gender categories.

Figure 4.
SAI distribution within income level categories.


Table 1.
Sample distribution.
| Gender | n | % | Income Level (€/month) | n | % |
|---|---|---|---|---|---|
| Women | 326 | 56.30% | Less than or equal to 900 | 130 | 22.45% |
| Men | 253 | 43.70% | 901–1200 | 188 | 32.47% |
| 1201–1800 | 157 | 27.12% | |||
| 1801–2400 | 73 | 12.61% | |||
| More than 2400 | 31 | 5.35% | |||
| TOTAL | 579 | 100% | TOTAL | 579 | 100% |
Table 2.
Degree of satisfaction with aquaculture fish as food.
| n | % | |
|---|---|---|
| Very satisfied | 54 | 9.33 |
| Quite satisfied | 205 | 35.41 |
| Somewhat satisfied | 133 | 22.97 |
| Little satisfied | 51 | 8.81 |
| Not at all satisfied | 60 | 10.36 |
| Don’t know/No answer | 76 | 13.13 |
| TOTAL | 579 | 100 |
Table 3.
In the next coming years, aquaculture should.
| n | % | |
|---|---|---|
| Increase | 295 | 50.95 |
| Remain the same | 158 | 27.29 |
| Decrease | 51 | 8.81 |
| Don’t know/No answer | 75 | 12.95 |
| TOTAL | 579 | 100 |
Table 4.
Perception of the potential advantages and disadvantages of aquaculture.
| Advantages | n | % | Disadvantages | n | % |
|---|---|---|---|---|---|
| Economic improvement (more employment) | 220 | 38.00 | Abuse of chemicals | 114 | 19.69 |
| Cheaper price | 153 | 26.42 | Worse quality and taste | 49 | 8.46 |
| Greater amount and fish variety | 113 | 19.52 | Damage to traditional fishing | 35 | 6.04 |
| Better quality, healthier | 77 | 13.30 | Environmental impact | 11 | 1.90 |
| Respect for the environment; recovery of species | 17 | 2.94 | |||
| Others | 13 | 2.25 | Others | 17 | 2.94 |
| None | 62 | 10.71 | None | 316 | 54.58 |
| Don’t know/No answer | 48 | 8.29 | Don’t know/No answer | 71 | 12.26 |
| TOTAL | 703 | 121.43 | TOTAL | 603 | 105.87 |
Table 5.
Comparison between aquaculture fish and traditional fish.
| Aquaculture Fish | Don’t Know/ No Answer | Traditional Fish | ||||
|---|---|---|---|---|---|---|
| n | % | n | % | n | % | |
| Better price | 408 | 70.47 | 72 | 12.44 | 99 | 17.10 |
| Improved availability | 392 | 67.70 | 93 | 16.06 | 94 | 16.23 |
| More employment | 242 | 41.8 | 80 | 13.82 | 257 | 44.39 |
| Better employment | 238 | 41.11 | 117 | 20.21 | 224 | 38.69 |
| More environmentally friendly | 139 | 24.01 | 100 | 17.27 | 340 | 58.72 |
| More variety | 123 | 21.24 | 55 | 9.50 | 401 | 69.26 |
| Healthier | 82 | 14.16 | 51 | 8.81 | 446 | 77.03 |
| Better quality | 54 | 9.33 | 41 | 7.08 | 484 | 83.59 |
| Better taste | 30 | 5.18 | 55 | 9.50 | 494 | 85.32 |
Table 6.
Perception of support by public administrations.
| n | % | |
|---|---|---|
| Traditional fish | 101 | 17.44 |
| Aquaculture fish | 203 | 35.06 |
| Both equally | 57 | 9.84 |
| None | 106 | 18.31 |
| Don’t know/No answer | 112 | 19.34 |
| TOTAL | 579 | 100 |
Table 7.
Previous principal component analysis (PCA) results.
| Test | Value |
|---|---|
| Kaiser-Meyer-Olkin index | 0.74866 |
| Determinant of the correlation matrix | 0.175141 |
| X2 | 1000.2913 |
| Degrees of freedom | 36 |
| p | 0.0000 |
Table 8.
Variance explained.
| Original Values | Values after Varimax Rotation | ||||
|---|---|---|---|---|---|
| Factor 1 | Factor 2 | Factor 3 1 | Factor 1 | Factor 2 | |
| Eigenvalues | 2.7741 | 1.6043 | 0.9521 | 2. 4138 | 1.9646 |
| % Variance | 30.82% | 17.83% | 10.58% | 26.82% | 21.83% |
| % Accumulated Variance | 30.82% | 48.65% | 59.23% | 26.82% | 48.65% |
1 Not Selected.
Table 9.
Factor loads after Varimax rotation.
| Factor 1 | Factor 2 | |
|---|---|---|
| Better quality | 0.8387 | 0.0096 |
| Better taste | 0.7695 | −0.0040 |
| More environmentally friendly | 0.5134 | 0.2393 |
| Healthier | 0.8076 | 0.1366 |
| Better price | −0.0730 | 0.6552 |
| More employment | 0.2386 | 0.6437 |
| Better employment | 0.2568 | 0.6362 |
| More variety | 0.2529 | 0.4061 |
| Improved availability | −0.1015 | 0.6894 |
Table 10.
Stratification of the acceptance levels.
| Categories | Stratum | Square Root of Absolute Cumulative Frequency (Intervals) | Acceptance (Intervals) | n | % |
|---|---|---|---|---|---|
| Very low | S1 | 0; 28.6522 | −56.2906; −32.8838 | 85 | 14.68% |
| Low | S2 | 28.6522; 57.3044 | −32.8838; −9.4770 | 159 | 27.46% |
| Medium | S3 | 57.3044; 85.9567 | −9.4770; 10.5860 | 149 | 25.73% |
| High | S4 | 85.9567; 114.6089 | 10.5860; 40.6804 | 118 | 20.38% |
| Very high | S5 | 114.6089; 143.2611 | 40.6804; 110.9008 | 68 | 11.74% |
© 2020 by the authors. Licensee MDPI, Basel, Switzerland. This article is an open access article distributed under the terms and conditions of the Creative Commons Attribution (CC BY) license (http://creativecommons.org/licenses/by/4.0/).
Share and Cite
MDPI and ACS Style
Ruiz-Chico, J.; Peña-Sánchez, A.R.; Biedma-Ferrer, J.M.; Jiménez-García, M. Social Acceptance of Aquaculture in Andalusian Atlantic Coast (Spain): An Emerging Economy Sector. Foods 2020, 9, 910. https://doi.org/10.3390/foods9070910
AMA Style
Ruiz-Chico J, Peña-Sánchez AR, Biedma-Ferrer JM, Jiménez-García M. Social Acceptance of Aquaculture in Andalusian Atlantic Coast (Spain): An Emerging Economy Sector. Foods. 2020; 9(7):910. https://doi.org/10.3390/foods9070910
Chicago/Turabian StyleRuiz-Chico, José, Antonio R. Peña-Sánchez, José M. Biedma-Ferrer, and Mercedes Jiménez-García. 2020. "Social Acceptance of Aquaculture in Andalusian Atlantic Coast (Spain): An Emerging Economy Sector" Foods 9, no. 7: 910. https://doi.org/10.3390/foods9070910
Note that from the first issue of 2016, this journal uses article numbers instead of page numbers. See further details here.