Article

Effect of Wheat Bran Incorporation on the Physical and Sensory Properties of a South African Cereal Fried Dough

by
Fortunate N. Ndlala
,
Oluwatoyin O. Onipe
,
Tabea M. Mokhele
,
Tonna A. Anyasi
and
Afam I. O. Jideani
*
Department of Food Science and Technology, School of Agriculture, University of Venda, Private Bag X5050, Thohoyandou 0950, Limpopo Province, South Africa
*
Author to whom correspondence should be addressed.
Foods 2019, 8(11), 559; https://doi.org/10.3390/foods8110559
Submission received: 3 October 2019 / Revised: 22 October 2019 / Accepted: 1 November 2019 / Published: 7 November 2019
(This article belongs to the Section Grain)

Abstract

:
This study investigated the effect of wheat bran (WB) supplementation on the physical and sensory properties of a South African cereal fried dough (magwinya). The physical properties, instrumental texture, and sensory profile were determined for magwinya (100:0, control) and for wheat flour to wheat-bran ratios of 95:5 (MWB5), 90:10 (MWB10), 85:15 (MWB15), and 80:20 (MWB20). An increase in the proportion of WB in the fried dough showed no significant difference on the specific volume (1.47–1.54) of samples. The chroma value (30.19–22.29), lightness (35.92–28.98), and hue angle (55.03–47.77) decreased, while ∆E increased distinctly with the addition of WB. Magwinya supplemented with WB was less cohesive and easy to chew. Significant correlations were found between instrumental hardness and sensory springiness (r = −0.63; p < 0.05), as well as between instrumental cohesiveness and sensory springiness (r = −0.71; p < 0.01). Two principal components were identified, which accounted for 85.1% of the variance in the instrumental data. A substitution level of 5 and 10% WB was similar to the sensory properties of the control in taste, texture, and overall acceptability and can replace part of the wheat flour in the cereal fried dough production.

1. Introduction

Magwinya, a prevalent street snack in South Africa, is a deep-fried dough which can take up a large amount of oil during the frying process. The snack is a fermented confectionary produced from wheat flour, sugar, yeast, salt, and lukewarm water by processing operations such as mixing, kneading, shaping, and frying. It is a golden-brown fried snack, round, crisp crust, and has an innermost part like a baked rather than a fried product. Although not yet categorized in the healthy snack group, magwinya is quite popular [1].
Bran is made up of the hard-outer layers of cereal grain such as corn, wheat, rice, oats, barley, rye, and millet [2]. This outer layer provides fiber, minerals, B vitamins, and bioactive compounds that increase bulk and regulates the absorption and excretion of nutrients from the body [3]. Wheat (Triticum aestivum) is one of the massively produced cereals mainly used for human consumption and livestock feed. The human consumption of wheat bran (WB) has gradually increased over the years, as shown by a 48% worldwide increase in wheat bran-incorporated food products over a ten-year period [4]. The incorporation of WB in fried foods leads to the formation of a barrier that limits the movement of fat. This is due to the fact that WB has been reported to possess a potential for fat reduction in fried products [4]. WB is utilized as an additional source of dietary fiber and helps in the relief of constipation by speeding up the intestinal transit time, increasing stool output, and bowel movement frequency, thus preventing colon cancer. Regular consumption of dietary bran-rich foods can also reduce the danger of hypercholesterolemia, hypertension, breast cancer, and type 2-diabetes. Similarly, the addition of WB in cereal-based products helps certain rheological changes such as increased dough, water absorption, and reduced loaf volume, thereby enhancing the quality characteristics of end products [5]. Food produce enriched with WB includes bread, muffin, bran flakes, yogurt, tarhana soup, doughnuts, pasta, noodles, and biscuits.
Sensory evaluation is defined by Lawless & Heymann [6] as a scientific method for measuring, analyzing and interpreting human responses to products as perceived through their sense of touch, taste, sight, smell, or sound. It is always used in assessing consumer’s responses during the development of existing or new products. Texture, a sensory attribute, is a presentation of the food’s structure and response to force [7]. The classification of texture attributes into categories introduced by Szczesniak et al. [8] gave rise to a profiling method of texture description. Such a texture profile analysis (TPA) is applicable to both sensory and instrumental measurements. Texture profiling with instrumental method involves test substance compression and quantifying the mechanical parameters from the force-deformation curves recorded [9]. There, however, exist a lack of information on the instrumental texture and sensory profile of magwinya. This research thus seeks to fill that gap with the information that will be generated.

2. Materials and Methods

2.1. Samples and Sample Preparation

Coarse wheat bran (Snowflake, South Africa), cake wheat flour (Pioneer Foods, South Africa), instant dry yeast (Rymco Ltd., South Africa), sugar (“Selati” TSB Sugar, Malelane, South Africa), salt (Cerebos, South Africa), sunflower oil (Spar, South Africa) were purchased at Shoprite and Spar grocery stores, Thohoyandou, South Africa. Five sample blends used for wheat bran magwinya production were prepared based on wheat flour to wheat-bran ratios of 100:0 (control sample), 95:5 (MWB5), 90:10 (MWB10), 85:15 (MWB15) and 80:20 (MWB20).
The traditional method of Kwinda et al. [10] was employed in the process of magwinya (control) and wheat bran magwinya production. The following ingredients: composite flour (100 g), salt (1 g), sugar (15 g), yeast (1 g), and 100 mL lukewarm water (25–26 °C) were weighed and mixed manually for 5 min to obtain a homogenous wet sticky dough which was formed before fermentation at ambient temperature 21 °C for 45 min. The dough was squeezed into cooking oil and fried for 5 min at 180 °C using a fryer (Russell Hobbs, model RDF 300, UK) to produce the different composite cereal fried dough samples (Figure 1).

2.2. Volume and Weight Measurement of Wheat Bran Magwinya Samples

The rapeseed displacement method of the American Association of Cereal Chemists (AACC) [11], method number 10-05-01, with some modifications, was used for the determination of sample volume. A 1000 mL beaker was filled with finger millet grains. The grains were then poured out and used in refilling the box containing wheat bran magwinya samples. The final level of the grain minus the initial level obtained was taken. The volume of displaced grain is equal to the volume of the wheat bran magwinya samples. The final weight of the cooled cereal fried dough samples was measured using a weight balance.

2.3. Specific Volume of Wheat Bran Magwinya Samples

The specific volume was obtained by dividing the loaf volume of wheat bran fried dough by its corresponding weight, as shown in Equation (1) [12].
Specific   volume   =   V   ( cm 3 ) Wt   ( g )

2.4. Color Determination of Wheat Bran Magwinya Samples

Color analysis was performed following the method of Onipe et al. [13] in a ColorFlex 45/0 Spectrophotometer (Hunterlab, Reston, VA, USA) with illuminant D65 and a 10° observer. The instrument was calibrated by covering a zero-calibration mask (CM-A124) followed by the white calibration plate (CM-A120). The samples were then analyzed by placing them on the sample holder (CM-A128) covered with a black container. Three replicates of the crust and crumb for each wheat bran magwinya sample were analyzed for L* (luminosity), a* (opposition of colors green and red), and b* (opposition of colors blue and yellow). Chroma (C*), hue (h), and total color difference (∆E) were calculated using Equations (2)–(4).
Chroma   =   a 2 + b 2
Hue =   tan - 1 ( b a )
Δ E   =   [ ( L   -   Lc ) 2   +   ( a   -   ac ) 2   +   ( b   -   bc ) 2 ]
where Lc, ac, and bc represent color values for the control sample.

2.5. Texture Profile Analysis

The standard method of AACC [11] method 74-09 with slight modifications was adopted in the measurement of texture profile (hardness, springiness, cohesiveness, and chewiness) of composite cereal fried dough samples using a texture analyzer TA-XT2i (Stable Micro Systems, Godalming, England). Fresh samples were used for analysis after cooling to ambient temperature for 1 h. Before conducting the test, the probe was calibrated. Samples with sides of about 2 cm were cut from the wheat bran magwinya crumb and placed centrally beneath the probe ((p/36 R cylinder probe (36 mm)) to meet with a consistent flat surface. The compression test was selected in the texture analysis using a 5-kg load cell, and the sample was compressed to 35% of its original height. A two-cycle compression was set with a strain force of 50%, pre-test speed: 1.0 mm, test speed: 2.0 mm, post speed: 2.0 mm, and trigger force of 5 g. Readings were carried out in triplicates and sensory attribute parameters obtained from the curves. The four TPA parameters of hardness, cohesiveness, springiness, and chewiness were calculated at the time of the test by determining the load and displacement at predetermined points on the TPA curve. Hardness was obtained as the maximum load expressed in kg and applied to the samples during the first compression. Cohesiveness was obtained as the ratio of the area under the curve for the second compression to that under the curve for the first compression. Springiness was expressed as the ratio of the duration of contact with the sample during the second compression to that during the first compression, while chewiness was expressed as the mathematical product of hardness, cohesiveness and springiness.

2.6. Descriptive Sensory Analysis

Eight-member trained sensory panel was used for the analysis. The members were selected using screening tests, which included taste (bitter, sweet, sour, salty, and umami) identification and exercises to describe differences among the composite cereal fried dough. The generic description analysis method [14] was used for determining the sensory profile of the wheat bran magwinya samples. The sensory panelists were trained in ten sessions of 2 h per day during which a total of twenty-one sensory attributes (appearance, aroma, texture, flavor, and aftertaste) with definitions, reference standards and methodology of the evaluation were developed (Table 1). Magwinya samples were cooled for 1 h on medium-sized stainless steel cooling trays before slicing to a uniform thickness and placed on a transparent plastic container coded with random three-digit codes. Each attribute was evaluated on a 10-point scale (1–10) anchored with verbal descriptions. Evaluation of the five wheat bran magwinya samples and control was replicated three times in sessions of 1.5 h per day for three days. This was done in a sensory laboratory with individual booths under white light at room temperature following standard good sensory practices (Figure 2). Training procedures for panelists followed the guidelines of Munoz [15] and Meilgaard et al. [16] with bottled water provided as palate cleansers and responses collected using questionnaires.

2.7. Consumer Acceptability Test

Evaluation properties of appearance (crust color, crumb color), texture, taste, aroma, flavor and overall acceptability of wheat bran magwinya samples were conducted as described by Meilgaard et al. [16]. Wheat bran cereal fried dough samples for the panelists’ evaluation were coded with three-digit numbers and presented randomly to eighty (80) untrained panel members that were recruited at the University of Venda, South Africa. The panelists comprising males and females of different age groups were given consent forms each to fill before being asked to analyze the samples based on the evaluation properties. A nine-point hedonic scale test having 9 as like extremely, 5 as neither like nor dislike, and 1 as dislike extremely was used in the evaluation of wheat bran magwinya quality. The samples were sliced into portions of about 50 g that included both the crust and crumb. The intention of creating a context in which all wheat bran magwinya were assessed was to focus all participants on the concept of likeness. Participants were then asked to observe, smell, and taste each sample of the composite cereal fried dough. After evaluating each sample, participants then judged sample likeliness using the questionnaires provided. Bottled water was provided as a palate cleanser, and a break of 60 s was taken before evaluating the next sample.

2.8. Statistical Analysis

The mean and standard deviation (SD) of the analyzed data are the results of triplicate analysis. A one-way analysis of variance (ANOVA) at 95% confidence level (p ≤ 0.05) using Duncan’s Multiple Range Test was used in separating the means of triplicate determinations. Statistical analysis by ANOVA for determining the effect of level of bran addition (independent variables) on parameters measured (dependent variables) was done using IBM SPSS Statistics for Windows version 22 (IBM Corp., Armonk, NY, USA). Triplicate scores were further averaged, standardized (1/standard deviation), and subjected to principal component analysis (PCA) using Minitab version 17 (Minitab Inc, State College, PA, USA).

3. Results and Discussion

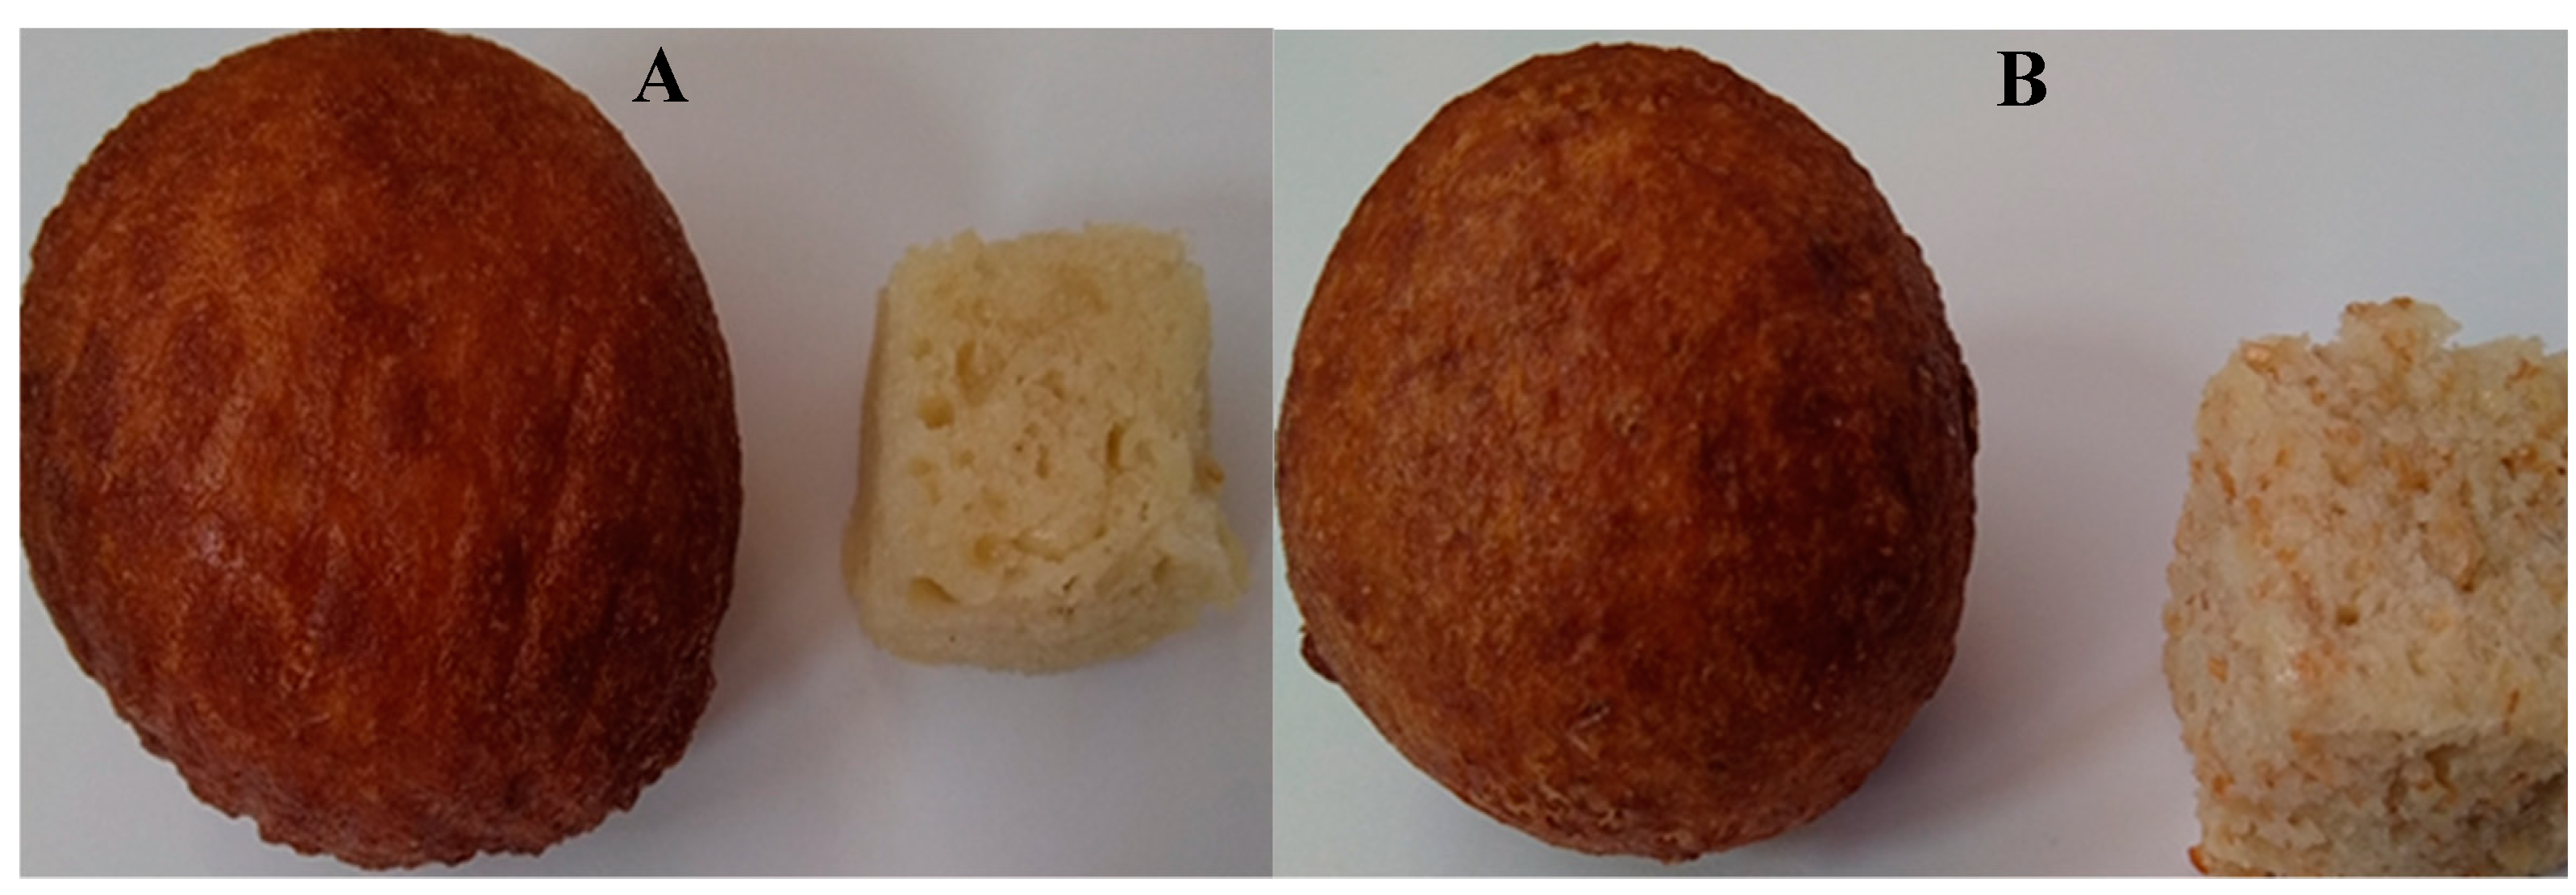
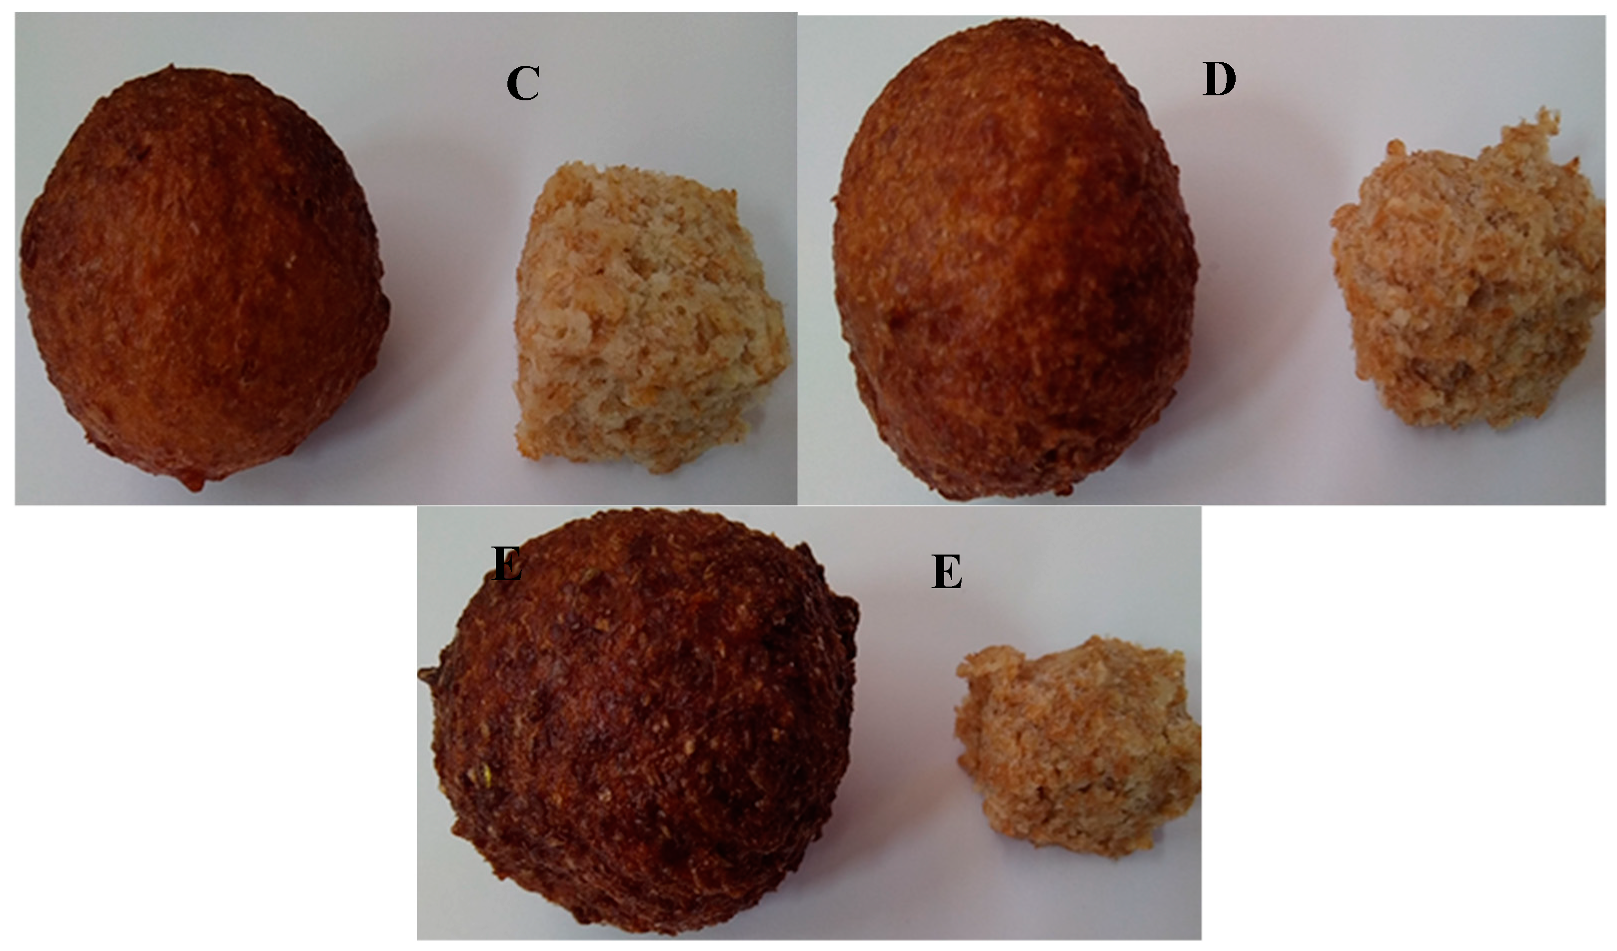
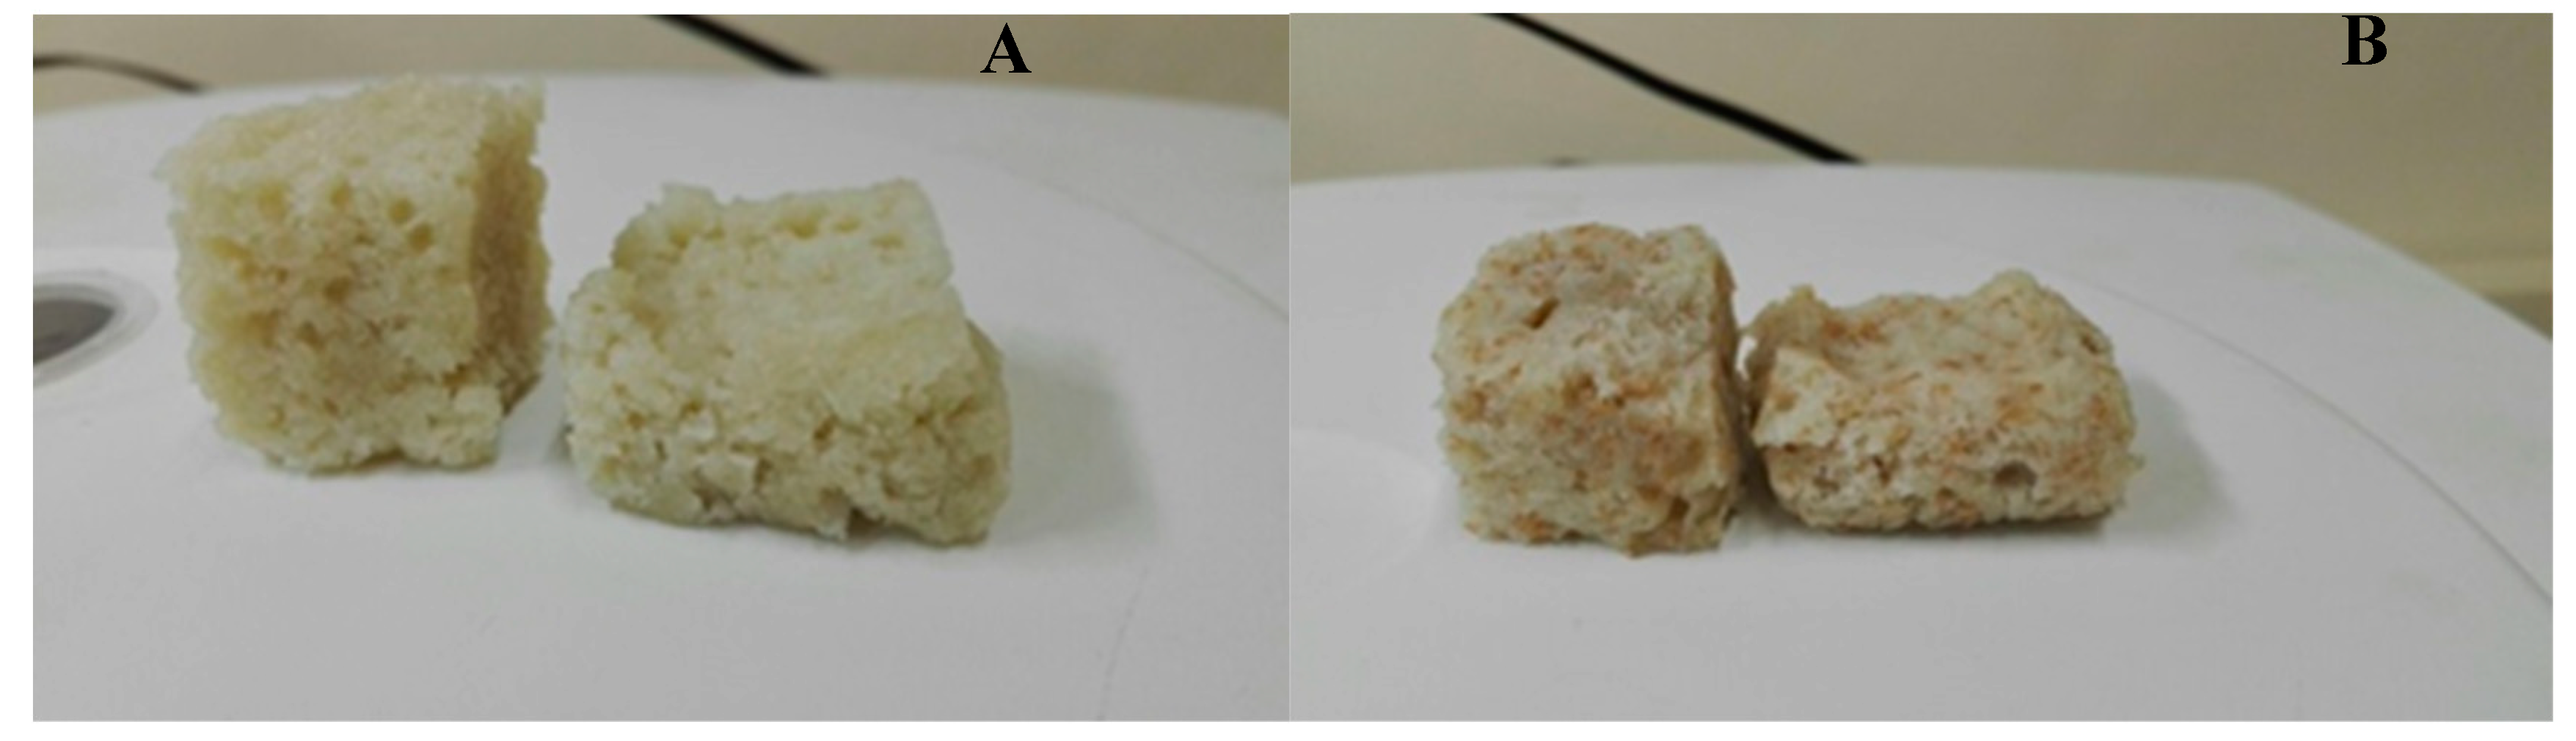
3.1. Color Profile of Wheat Bran Magwinya

Color is one of the main factors that affect food product acceptability at the time of consumer purchase [17]. The color of the crust and crumb has been an important parameter for fried products. Fried products are likely to obtain a dark crust, and significant limitation of product darkening could negatively affect the sensory properties of the final product. The color (L*, a*, b*) characteristics of crumb and crust of wheat bran magwinya samples are presented in Table 2. Crumb of the cereal fried dough samples partially substituted with WB had significantly (p < 0.05) lower L* values compared to the control. Increasing the amount of WB in wheat bran magwinya formula, gradually reduced the L* with the significant difference among all-composite fried dough samples. Almeida et al. [18] also reported a decrease in luminosity in bread crumb with increased addition of wheat bran from 5–20%.
The crumb and crust of magwinya samples containing WB were darker compared to the control. This observed trend was supported by decreasing L* values as the WB content increased in the cereal fried dough (Table 2). The crust of sample MWB20 was significantly darker than MWB15, MWB10, MWB5, and the control. This decrease in lightness can be majorly attributed to the influence of the dark color of WB introduced to the dough formulation. In addition, caramelization and Maillard reaction, which occurs during frying, caused the color change in the crust of wheat bran magwinya [13,19]. Crumb redness (a*) values significantly increased as WB content increased in the samples. Wheat bran has been reported to have high redness intensity [20]. Therefore, its incorporation in the cereal fried dough increased the redness of the crumb of the composite fried, though. Crumb yellowness (b*) values reported in this work were in close range to those reported by Onipe et al. [13]. This might be due to the brown pigment of WB. The yellowness of the crust of wheat bran magwinya was significantly different from the control. Chroma, as stated in the works of Pathare et al. [21], describes the intensity of colorfulness perceived by humans. Chroma values of the crumb (20.23–21.65) were lower than that of the crust (22.29–30.19). This shows that the intensity of color in the crust is much more than the crumb due to wheat bran incorporation. Wheat bran magwinya crumb had significantly higher (p < 0.05) Chroma values when compared to the control. Conversely, the crust of the cereal fried dough showed a reduction in the Chroma value upon the addition of WB. The crumb and crust hue angle values of the fried dough containing WB were significantly lower than the control samples (Table 2). Hue angle qualitatively describes the traditional color of a product in terms of actual colors like red or green. Hue angles of the crumb ranged from 65.46° to 84.55° while that of the crust was from 47.57° to 55.03°. The hue values fall between 0° and 90° for which 0° represents red, while 90° represents yellow [21].

3.2. Weight, Volume, and Specific Volume Measurement

The weight of wheat bran cereal fried dough samples ranged from 43.10 to 53.83 g (Table 3) with a significant difference (p < 0.05) observed among these values. The control sample-specific volume was not significantly different upon the addition of 5–20% WB. During magwinya sample production, the dough was squeezed using a hand to frying oil, which produced non-uniform magwinya samples as a result of inconsistent dough size. Kim et al. [22] reported in their work that loaf volume, as well as specific loaf volume, decreased significantly with an increased proportion of WB in bread. Samples MWB5 and MWB10 (which represent the lower portion of WB incorporation) had the highest volume. This is most likely due to the higher level of gluten present in wheat flour compared to composite blends, which could not properly retain carbon dioxide gas during proofing. An increased loaf weight might be due to the WB that absorbed high-water and the reduced air entrapment, resulting in heavy dough [23].

3.3. Textural Profile Analysis (TPA)

Textural properties play a remarkable role in the perception and acceptability of any processed food product. Processing conditions and ingredient formulations show a direct impact on the textural behavior of food products. The texture properties of magwinya were described using hardness, cohesiveness, springiness, and chewiness attributes (Table 4). Furthermore, while hardness relates to the force applied by the molar teeth to compress the food, chewiness relates to the number of chews necessary for food to be swallowed. Cohesiveness relates to the amount of deformation undergone by a material before rupture when biting completely through the samples using molars. Springiness relates to the degree or rate at which the sample returns to its original size/shape after partial compression between the tongue and palate [24,25]. The WB added to the cereal fried dough decreased cohesiveness and chewiness while an increase was observed for hardness. Regarding springiness, there was no observed change (p > 0.05) in the different concentrations of WB (Table 4). However, an increase in magwinya hardness with an increasing amount of WB occurred in all four cereal fried dough samples. Magwinya produced using WB-wheat flour composite exhibited harder texture than the control (100% wheat flour), although similar results were reported by Sobota et al. [26]. The hardness in baked food production is affected by factors such as moisture content and migration as well as the redistribution of water in a product. Other factors, such as gluten-starch interactions and starch retrogradation, are vital phenomena contributing to the hardness of fried or baked products [27]. As reported by Shittu et al. [28], starch after bread baking, retrogrades and gels within the inter-granular spaces, leading to rigidity and hardening of bread.
Suspension refers to the rate at which a deformed product returns to its undeformed state when the deforming force is removed, while chewability is the energy required to bring solid foods into a state of ready to swallow. Both phenomena are directly related to hardness and chewiness [29]. In general, a change in substitution level did not show a significant effect on elasticity and chewing. The increase of WB in the flour gave magwinya a less cohesive and easy to chew characteristic. The elasticity of cereal fried dough substituted with 5, 10, 15, and 20% WB was comparable with the control. Chewiness of magwinya from 15% WB compared well with that of 20% WB. Conversely, samples from 5 and 10% WB and control differed markedly from those of 15 and 20% WB, like those of 15 and 20% WB were observed to be the easiest to chew. As observed for hardness, elasticity was seen to be strongly influenced by moisture content, moisture redistribution, and retrogradation of the starch. Therefore, increasing the WB fraction is likely to result in a greater downgrade upon the cooling of fried magwinya [27].

3.4. Descriptive Sensory Analysis of Wheat Bran Magwinya

The descriptive sensory analysis gives good insight on nature and size (quantity or intensity) of sensory attributes as perceived by humans while consuming food products. The product profiling information gathered with the method assists in understanding the effect of ingredients on sensory properties of products useful for predicting potential consumer responses to new products [6]. Table 5 shows the effect of WB addition on magwinya sensory properties. The choice of cereal (wheat bran) significantly influenced the appearance, aroma, and flavor attributes of magwinya samples. Cereal fried dough incorporated with 20% WB received higher ratings compared with fried dough without WB (control) for appearance, aroma, aftertaste, and texture. Cohesive texture increased with the addition of WB, and this increase indicates that magwinya prepared with WB possess the higher ability of resistance towards magwinya structure deformed under the teeth. With the use of the descriptive sensory method, evaluation included several steps outside and inside the mouth: from the first bite through mastication, swallowing, and residual feeling in the mouth and throat. The application of this method is, however, based on standard scales [30].
The springiness of the cereal fried dough samples significantly (p < 0.05) increased upon the addition of WB in their formulation. The springiness of the fried dough samples containing 15 and 20% WB showed a significant difference (p < 0.05). As observed in the works of Hoseney et al. [31], the interaction between gelatinized starch and gluten dough causes the dough to be more elastic, thereby leading to the formation of a continuous sponge structure of bread after heating. Thus, the high springiness in MWB15 and MWB20 (Table 5) could be attributed to dilution of the gluten structure in composite magwinya. Sample MWB20 was observed to be hard and difficult to chew than the control, which might be due to the higher gluten content of the samples. The addition of WB gluten flour in the production of the cereal fried dough increased the gluten strength of the wheat flour, hence strengthening the overall structure of the fried dough. This observation agrees with the work of Sabianis and Tzia [32], who reported that the hardness of bread increased as the amount of WB increased. Similarly, the addition of WB increased ratings for crust brownness, dry aftertaste, evenness appearance, and toasted ‘burnt’ aroma, while ratings decreased for crumb lightness and crust smoothness. Other properties of grittiness, lingering, and dryness of magwinya incorporated with WB can be minimized by reducing the WB particle size from coarse to fine particle size through milling of the bran. As reported by Zhang and Moore [33], bread containing fine particle size bran had lighter crust color, better crust appearance, and less gritty mouth-feel than bread containing coarse or medium particle size bran.

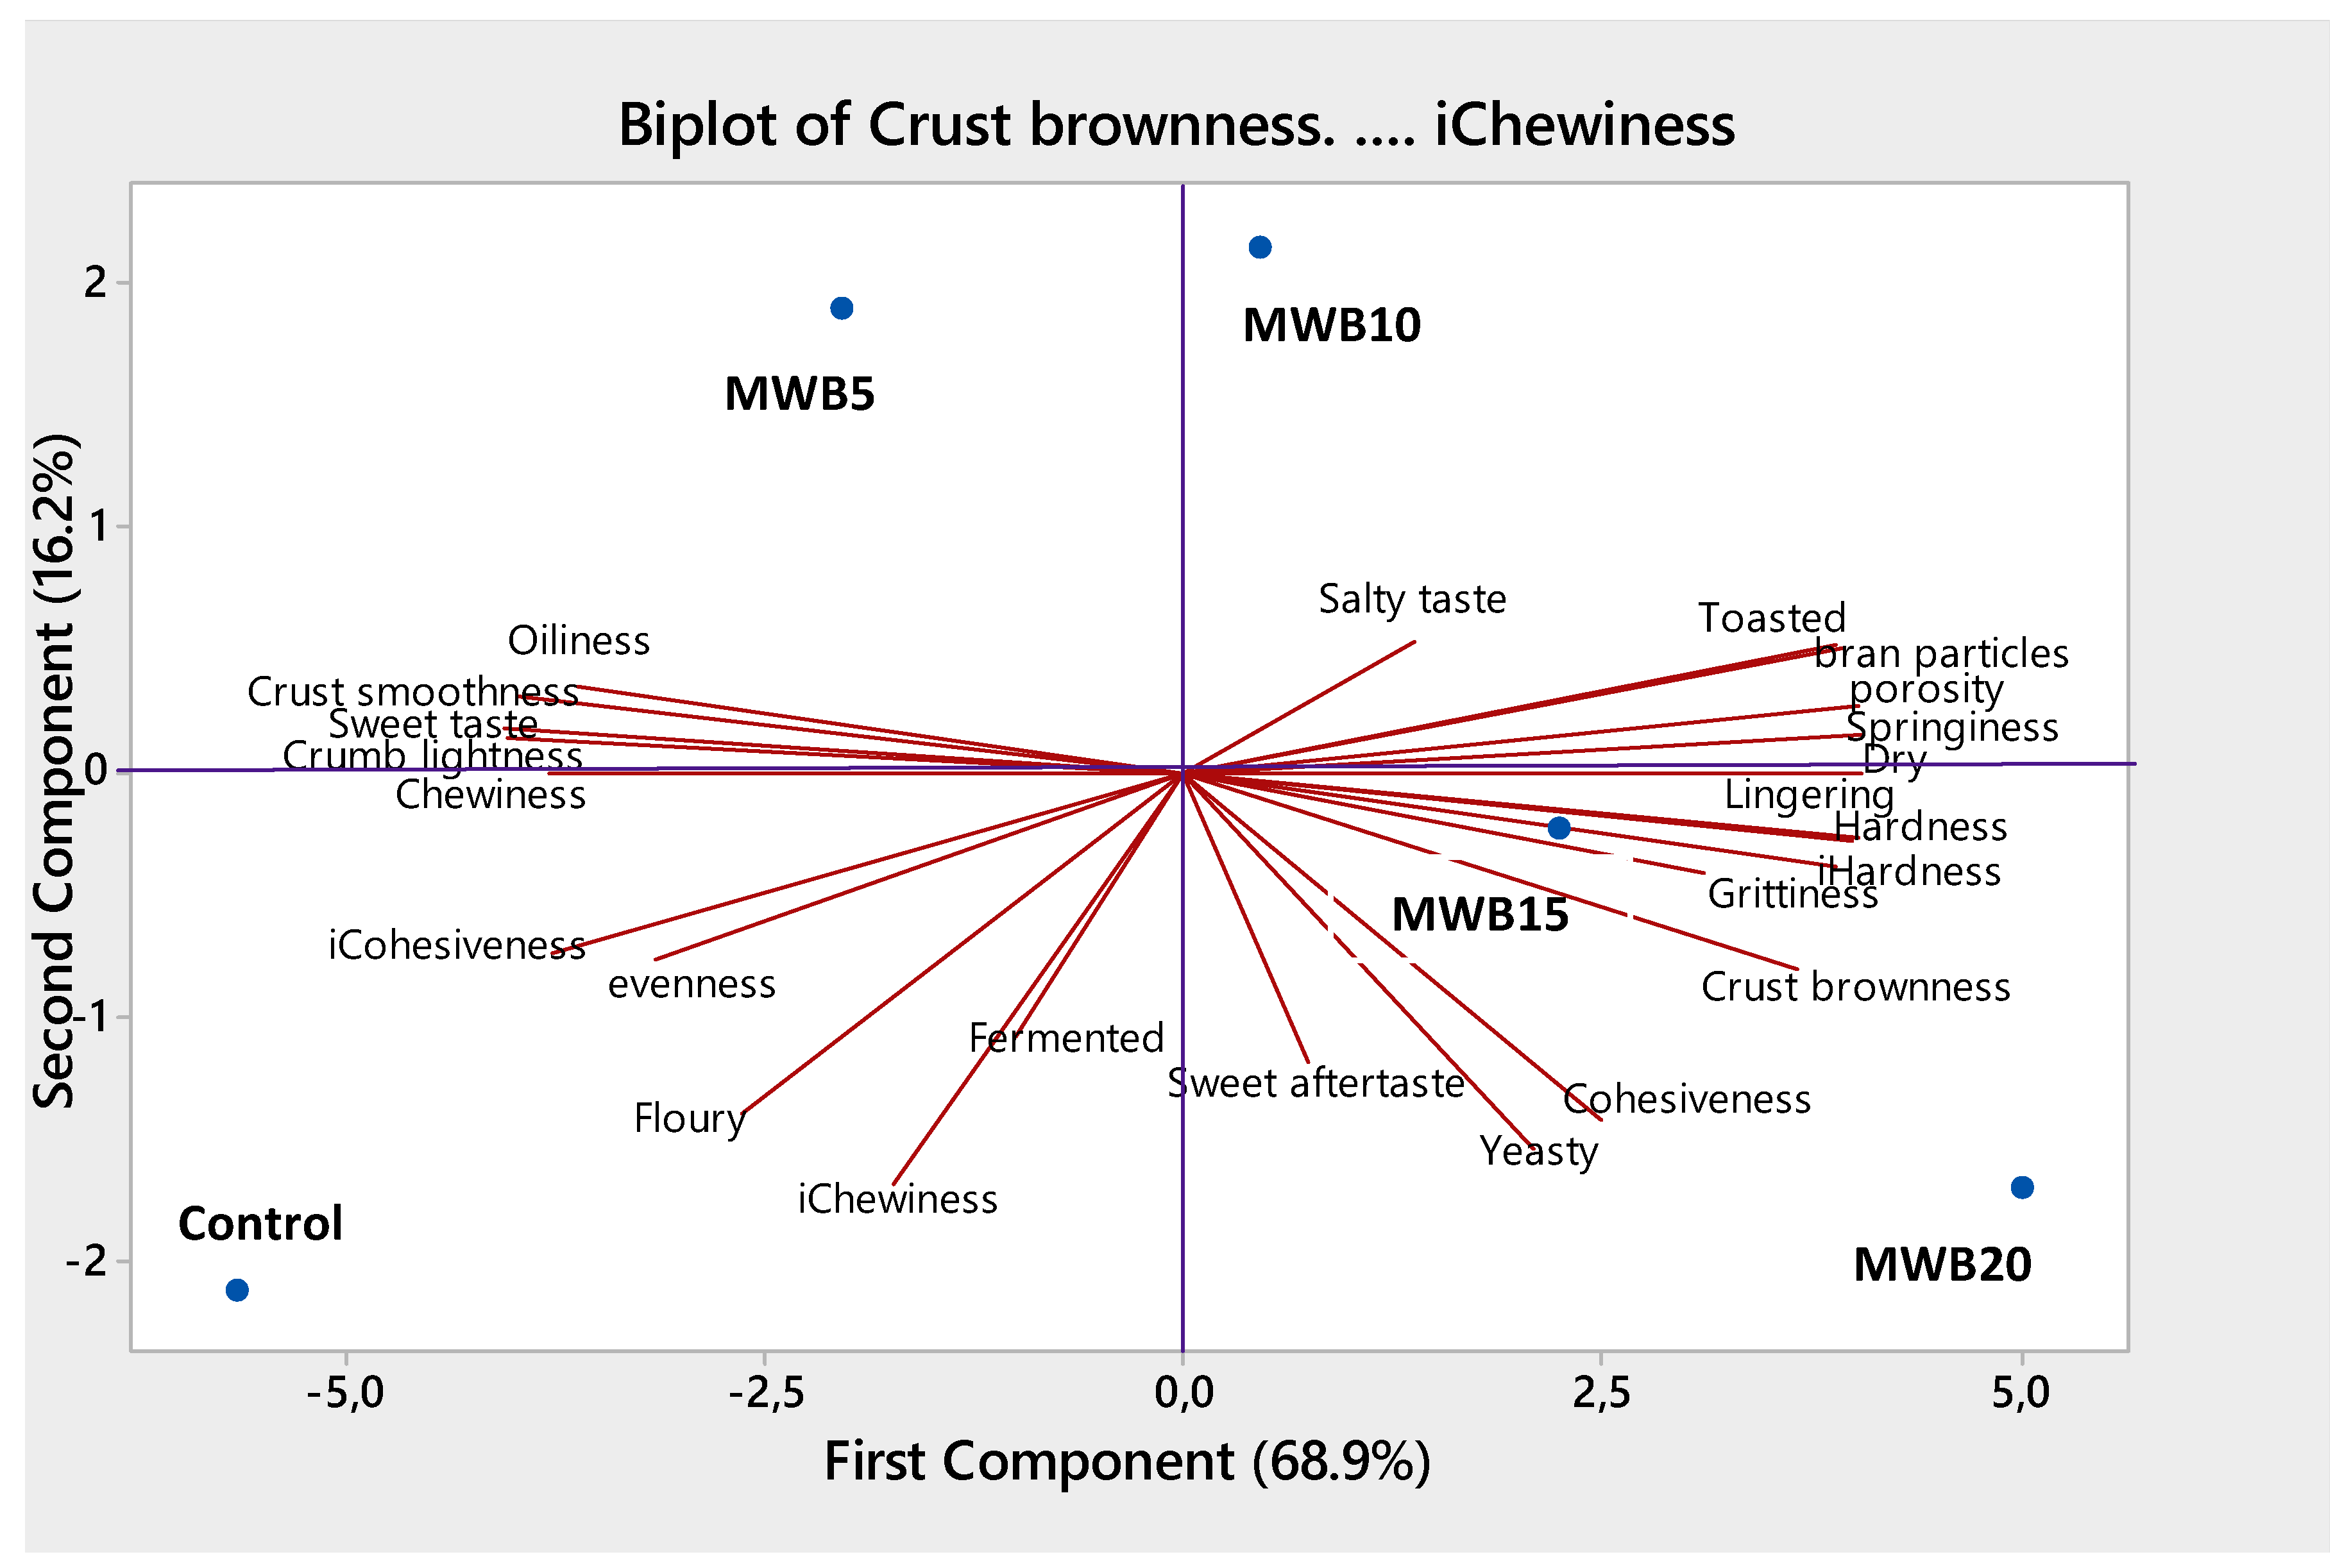
3.5. Principal Component Analysis of Sensory and Instrumental Properties of Magwinya

Principal component analysis (PCA) on the sensory and instrumental data (Figure 3) showed that the first and second principal components represented 16.2% and 68.9% of the observed variation (85.1% in total). PC1 separated the cereal fried dough based on the addition of WB, with PC2 WB magwinya to the left and top right, while magwinya without WB more to the bottom left. Cereal fried dough with 10, 15, and 20% WB were identified as more aftertaste intense with a lingering, grittiness, and drier aftertaste. The lack of aftertaste, texture, and flavor attributes at the bottom left of the plot shows that the control magwinya, in contrast, was generally perceived as the norm. Visual and color attributes, crust brownness, and hard texture, are also distinctive factors of PC1. PC2 separated the fried dough with added WB at a different concentration at the top and bottom right, from the control towards the bottom left. Control magwinya had a floury and fermented aroma and a more even appearance. The aftertaste of magwinya with WB was observed to be more dry, lingering, and gritty, but the control fried dough had a more intense overall floury aroma. The more intense floury taste might be due to the volume of flour used without further addition of composite ingredients. In general, it was observed that cereal fried dough with WB was more cohesive, had a more dry, lingering and gritty aftertaste, hard texture, and toasted aroma compared to the control magwinya. Hardness is mainly attributed to the amylose and amylopectin matrix, which contributes to overall bread texture [34]. Gomez et al. [19] reported that bread hardness was due to interactions between gluten and fibrous materials. Furthermore, baking conditions (temperature and time variables), state of the bread components (such as fibers, starch, gluten, whether damaged or undamaged) as well as the amount of absorbed water during dough mixing contributes to the final texture of the bread [17,19].

3.6. Consumer Acceptability of Magwinya

The mean scores given by consumers for appearance, taste, aroma, texture, and overall acceptability of magwinya samples are presented in Table 6. The mean score for overall acceptability on a nine-point Hedonic scale ranged from 5.58 to 7.58 for all five samples. The sample that did not differ significantly (p > 0.05) from the control in overall acceptability was the sample with 5% WB, indicating that most consumers preferred the 5% WB magwinya sample. Archana and Jamuna [35] in their work reported that phulkas and chapathis (unleavened bread) with a 5% WB level of incorporation, were statistically not significantly different, but at 10 and 15% level, showed extreme significant differences. However, in our work, a significant difference (p < 0.05) was observed between the control and composite fried dough in terms of texture, appearance, aroma, taste, and overall acceptability. These results are similar to those of Archana and Jamuna [35] who reported that the texture of phulkas and chapathis, having products with 5% WB, showed similar results with the control in this study, while products with 10 and 15% WB showed significant differences.
The overall acceptability was determined based on quality scores obtained from the evaluation of taste, texture, aroma, and appearance (crumb and crust color). At 0 and 5% WB level of substitution, magwinya scored highest in all four attributes, including overall acceptability, and this could be due to higher oil content of control magwinya, which gave it a better texture, flavor, and moist appearance. Cereal fried dough containing 20% WB received the lowest rating. Pomeranz et al. [36] reported that a progressively lesser score for the quality attributes of all bread products was observed as the level of incorporation of WB increased. For products MWB10 and MWB15, all attributes were significantly different from the control product. The appearance of magwinya samples in this study was rated uniform, as only fried dough with 20% WB received a lower score compared to the control. The samples fried with 20% WB differed in taste from the control, while the remaining samples had a taste comparable to the control. Evaluation of the texture also showed greater variability between sample MWB20 and the control as sample MWB20 received a significantly lower rating than the control. It is evident from the result that the control fried dough was more acceptable to the consumers, followed by magwinya with 5, 10, 15, and 20% level of WB supplementation. This could be attributed to the fact that consumers were becoming more accustomed to the quality attributes of the control sample. As alluded in the work of Osterman-Porcel et al. [37], the contributing attributes for consumer acceptability of the cereal fried dough containing wheat bran include taste, texture, aroma, and color. However, authors Ishida and Steel [38] in their work opined that taste and tenderness are factors to be considered in order to increase the acceptance of products containing fiber.
As further observed in the consumer acceptance scores of samples, the control cereal fried dough sample obtained a significantly high (p < 0.05) rating for taste when compared to other samples containing WB at a different level of substitution. The score for the taste of the control sample was also the highest among all parameters in the consumer acceptability scores of magwinya. In comparison to the sensory profile of samples (Table 5), the sensory attribute of flavor (sweetness) recorded high ratings, with the control sample recording a significantly high rating when compared to other cereal fried dough WB composite samples. The significantly high scores of sweetness in sensory profile and taste for consumer acceptability shows that the flavor of a product also influences the consumer acceptability of that product. This observation agrees with the findings of Serrem et al. [17], who compared the sensory characteristics and its influence on the consumer acceptability of composite biscuits by school children.

3.7. Correlation between Sensory and Instrumental Measurements of Texture

Correlation between sensory and instrumental measurements of texture prompts detecting instruments to evaluate the nature of food in industries. Thus, understanding what is perceived during the sensory evaluation of the texture in the mouth and refining instrumental methods to perfect sensory evaluation, thereby anticipating the consumer’s response as the level of sympathy and overall acceptance of a new product [9,39,40]. Pearson’s correlation coefficient between sensory and instrumental texture attributes are presented in Table 7. Instrumental hardness was negatively correlated with sensory springiness (r = −0.63, p < 0.05), negatively correlated with sensory cohesiveness (r = −0.58, p < 0.05), and positively correlated with sensory chewiness (r = 0.30). The negative correlation between instrumental hardness and sensory springiness indicated that as the hardness of the products increased, their springiness decreased.
The significance and importance of the correlation coefficients may be relative to the type of product being studied. Instrumental cohesiveness was negatively correlated with sensory springiness (r = −0.71, p < 0.01) while sensory springiness was negatively correlated with instrumental hardness (r = −0.63, p < 0.05). The springier samples were less hard and less chewy. However, instrumental cohesiveness may not be an accurate predictor of the perceived sensory cohesiveness when comparing food samples containing different ingredients [41,42]. The description of sensory perception of cohesiveness may, thus require more than one physical measurement. The instrumental measurement of cohesiveness can provide a good evaluation of the sensory attribute of cohesiveness for some food systems such as gels, but not for other diverse food groups [43]. In this study, instrumental springiness was insignificant to either parameter due to the constant variable. Insignificant positive correlations were, however, found between sensory chewiness and all instrumental parameters. Correlation varies with the amount of mechanical deformation, sample dimensions, and type of sensory panelists (consumers or trained assessors). Further research should thus be directed towards the standardization of procedures for both sensory and instrumental testing.

4. Conclusions

This work showed that the addition of WB had a significant impact on the magwinya’s textural, physical properties, and sensory qualities. Cereal fried dough containing more than 5% wheat bran had significantly higher hard texture than control magwinya, thus making them less acceptable by consumers. Composite fried dough samples containing more than 5% wheat bran were perceived as less acceptable in sensory quality, thereby revealing that panelists generally preferred magwinya with 5% wheat bran. However, obtained results indicate that the poor floury aroma, as well as the low specific volume of the control cereal fried dough, could be improved using wheat bran, which shows great potential as a new ingredient of fiber-enriched magwinya. It is advantageous to seriously explore the possibility of using wheat bran composite flours for commercial production of cereal fried/baked foods. This will result in a positive effect of reducing the cost of production, especially as wheat bran is considered a cheap waste product, thus mitigating food waste and its effects.

Author Contributions

F.N.N., O.O.O. and A.I.O.J. conceptualized the research; F.N.N., O.O.O., T.M.M. and A.I.O.J. performed the experiments and conducted statistical analysis; F.N.N., O.O.O., T.M.M., T.A.A., and A.I.O.J. designed, wrote, reviewed and edited the manuscript.

Funding

The authors acknowledge the financial support to AIOJ from the DST-NRF Centre of Excellence in the Food Security SMART Foods Project (Project ID: 160201) and the Technology Innovation Agency, South Africa.

Conflicts of Interest

The authors declare no conflict of interest.

References

  1. Henk, W. “Oliebollen”. Retrieved 2014-07-13. 2014. Available online: Home.hccnet.nl (accessed on 10 October 2018).
  2. Kent, L.M. Technology of Cereals; Pergamon Press Limited: Oxford, UK, 2014; p. 130. [Google Scholar]
  3. Reisinger, M.; Tirpanalan, O.; Pruckler, M.; Huber, F.; Kneifel, W.; Novalin, S. Wheat bran biorefinery—A detailed investigation on hydrothermal and enzymatic treatment. Bioresour. Technol. 2013, 144, 179–185. [Google Scholar] [CrossRef]
  4. Onipe, O.O.; Jideani, A.I.O.; Beswa, D. Composition & functionality of wheat bran and its application in some cereal food products. Int. J. Food Sci. Technol. 2015, 50, 2509–2518. [Google Scholar]
  5. Sozer, N.; Cicerelli, L.; Heinio, R.L.; Poutanen, K. Effect of wheat bran addition on in vitro starch digestibility. Physicomechanical and sensory properties of biscuits. J. Cereal Sci. 2014, 60, 105–113. [Google Scholar] [CrossRef]
  6. Lawless, H.T.; Heymann, H. Sensory Evaluation of Food Principles and Practices, 2nd ed.; Springer Science and Business Media, LLC: New York, NY, USA, 2010; pp. 25–30. [Google Scholar]
  7. Meullenet, J.; Lyon, B.G.; Carpenter, J.A.; Lyon, C.E. Relationship between sensory and instrumental texture profile attributes. J. Sens. Stud. 1998, 13, 77–93. [Google Scholar] [CrossRef]
  8. Szczesniak, A.S.; Brandt, M.A.; Friedman, H.H. Development of standard ratings scales for mechanical parameters and correlation between the objective and sensory methods of texture evaluation. J. Food Sci. 1963, 28, 397–403. [Google Scholar] [CrossRef]
  9. Analia, B.G.L.; Sandra, N.G. Correlation between instrumental and sensory ratings by evaluation of some texture reference scales. Int. J. Food Sci. Technol. 2011, 46, 1977–1985. [Google Scholar]
  10. Kwinda, O.; Onipe, O.O.; Jideani, A.I.O. The effect of oat bran and psyllium husk fibre on oil reduction and some physicochemical properties of magwinya—Deep-fried dough. CyTA J. Food 2018, 16, 247–254. [Google Scholar] [CrossRef]
  11. American Association of Cereal Chemists (AACC). Approved Methods of the AACC, 10th ed.; AACC International: St. Paul, MN, USA, 2000. [Google Scholar]
  12. Horsfall, D.M.; Lucy, E.; Nwaojigwa, S.U. Chemical composition, functional and baking properties of wheat-plantain composite flours. Afr. J. Food Agric. Nutr. 2007, 7, 1–22. [Google Scholar]
  13. Onipe, O.O.; Beswa, D.; Jideani, V.A.; Jideani, A.I.O. Optimization of processing conditions for oil reduction of magwinya (deep-fried cereal dough). Afr. J. Sci. Technol. Innov. Dev. 2018, 10, 209–218. [Google Scholar] [CrossRef]
  14. Einstein, M.A. Descriptive techniques and their hybridization. In Sensory Science Theory and Applications in Foods; Lawless, H.T., Klein, B.P., Eds.; Marcel Decker: New York, NY, USA, 1991; p. 317. [Google Scholar]
  15. Munoz, A.M. Development and application of texture reference scales. J. Sens. Stud. 2006, 1, 55–83. [Google Scholar] [CrossRef]
  16. Meilgaard, M.C.; Civille, G.V.; Carr, B.T. Sensory Evaluation Techniques, 4th ed.; C.R.C. Press L.L.C.: New York, NY, USA, 2007; pp. 90–201. [Google Scholar]
  17. Serrem, C.A.; De Kock, H.L.; Taylor, J.R.N. Nutritional quality, sensory quality and consumer acceptability of sorghum and bread wheat biscuits fortified with defatted soy flour. Int. J. Food Sci. Technol. 2011, 46, 74–83. [Google Scholar] [CrossRef]
  18. Almeida, E.L.; Chang, Y.K.; Steel, C.J. Dietary fibre sources in bread: Influence on technological quality. LWT Food Sci. Technol. 2013, 50, 545–553. [Google Scholar] [CrossRef] [Green Version]
  19. Gomez, M.; Ronda, F.; Caballero, P.; Apesteguía, A. Effect of dietary fibre on dough rheology and bread quality. Afr. J. Food Sci. 2003, 216, 51–56. [Google Scholar] [CrossRef]
  20. Onipe, O.O.; Beswa, D.; Jideani, A.I.O. Effect of size reduction on colour, hydration and rheological properties of wheat bran. Food Sci. Technol. 2017, 37, 389–396. [Google Scholar] [CrossRef] [Green Version]
  21. Pathare, P.B.; Opara, U.L.; Al-Said, F.A. Colour measurement and analysis in fresh and processed foods: A Review. Food Bioprocess Technol. 2013, 6, 36–60. [Google Scholar] [CrossRef]
  22. Kim, B.K.; Chun, Y.G.; Cho, A.R.; Park, D.G. Effect of micro-particulated wheat bran on the physical properties of bread. Int. J. Food Sci. Nutr. 2013, 64, 122–129. [Google Scholar] [CrossRef]
  23. Kim, B.K.; Chun, Y.G.; Cho, A.R.; Park, D.G. Reduction in fat uptake of doughnut by micro-particulated wheat bran. Int. J. Food Sci. Nutr. 2012, 63, 987–995. [Google Scholar] [CrossRef]
  24. Tunick, M.H. Rheology of dairy foods that gel, stretch and fracture. J. Dairy Sci. 2000, 83, 1892–1898. [Google Scholar] [CrossRef]
  25. Gwartney, E.A.; Larick, D.K.; Foegeding, E.A. Sensory texture and mechanical properties of stranded and particulate whey protein emulsion gels. J. Food Sci. 2002, 69, 333–339. [Google Scholar] [CrossRef]
  26. Sobota, A.; Rzedzicki, Z.; Zarzycki, P.; Kuzawinska, E. Application of common wheat bran for the industrial production of high-fibre pasta. Int. J. Food Sci. Technol. 2015, 50, 111–119. [Google Scholar] [CrossRef]
  27. Eriksson, E.; Koch, K.; Tortoe, C.; Akonor, P.T.; Oduro-yeboah, C. Evaluation of the Physical and Sensory Characteristics of Bread Produced from Three Varieties of Cassava and Wheat Composite Flours. J. Food Public Health 2014, 4, 214–222. [Google Scholar]
  28. Shittu, T.A.; Raji, A.O.; Sanni, I.O. Bread from composite cassava-wheat flour: I. Effect of baking time and temperature on some physical properties of bread loaf. Food Res. Int. 2007, 40, 280–290. [Google Scholar] [CrossRef]
  29. Fonseca Filho, A.A.; Arau’Jo, W.M.C.; Falcirolli, D.M.C.; Pilla, N.; Marques, A.O. Evaluation of the technologic quality of bread enriched with wheat bran. Food Res. Int. 2007, 8, 17–25. [Google Scholar]
  30. Chauvin, M.A.; Younce, F.; Ross, C.; Swanson, B.G. Standard scales for crispness, crankiness and crunchiness in dry and wet foods: Relationship with acoustical determinations. J. Texture Stud. 2008, 39, 345–368. [Google Scholar] [CrossRef]
  31. Delcour, J.A.; Hoseney, R.C. Principles of Cereal Science and Technology, 3rd ed.; American Association of Cereal Chemists, Inc.: St Paul, MN, USA, 2010; pp. 203–206. [Google Scholar]
  32. Sabianis, D.; Tzia, C. Effect of rice, corn and soy flour addition on characteristics of bread product from different wheat cultivars. Food Bioprocess Technol. 2009, 2, 68–79. [Google Scholar] [CrossRef]
  33. Zhang, D.; Moore, W.R. Wheat bran particle size effects on bread baking performance and quality. J. Sci. Food Agric. 1999, 79, 805–809. [Google Scholar] [CrossRef]
  34. Deep, N.; Yadav-Krishna, K.; Singh-Jagbir, R. Studies on Fortification of Wheat Flour with Defatted Rice Bran for ‘Chapatti’ Making. J. Food Sci. Technol. 2010, 49, 96–102. [Google Scholar]
  35. Archana, S.H.; Jamuna, P. Wheat bran: Composition, Functionality and Incorporation in Unleavened Bread. J. Food Qual. 2002, 25, 197–211. [Google Scholar] [CrossRef]
  36. Pomeranz, Y.; Shogren, M.; Finney, K.F.; Bechtel, D.B. Fibre in bread making—Effect of functional properties. Cereal Chem. 2007, 54, 25–41. [Google Scholar]
  37. Ostermann-Porcel, M.V.; Quirogan-Panelo, N.; Rinaldoni, A.N.; Campderos, M.E. Incorporation of okara into gluten free Cookies with high quality and nutritional value. J. Food Qual. 2017. [Google Scholar] [CrossRef]
  38. Ishida, P.M.G.; Steel, C.J. Physicochemical and sensory characteristics of pan bread samples available in the Brazilian market. Food Sci. Technol. 2014, 34, 746–754. [Google Scholar] [CrossRef] [Green Version]
  39. Szczesniak, A.S. Correlating sensory with instrumental texture measurements texture measurements- an overview of recent developments. J. Texture Stud. 1987, 18, 1–15. [Google Scholar] [CrossRef]
  40. Scheuer, P.M.; Luccio, M.D.; Zibetti, A.W.; de Miranda, M.Z.; de Francisco, A. Relationship between Instrumental and Sensory Texture Profile of Bread Loaves Made with Whole Wheat Flour and Fat Replacer. J. Texture Stud. 2016, 47, 14–23. [Google Scholar] [CrossRef]
  41. Rana, P. Development of high fibre biscuits using wheat bran and pigeon broken thesis food technology G.B. J. Sci. Food Agric. 2006, 27, 101–107. [Google Scholar]
  42. Omoba, O.S.; Taylor, J.R.N.; De Kock, H.L. Sensory and Nutritive Profiles of Biscuits from Whole Grain Sorghum and Pearl Millet Plus Soya Flour with and without Sourdough Fermentation. 2015. Available online: http://hdl.handle.net/2263/52487 (accessed on 10 October 2018).
  43. Hough, G.; Contarini, A.; Munoz, A. Training a texture profile panel and constructing standard rating scales in Argentina. J. Texture Stud. 1994, 25, 45–57. [Google Scholar] [CrossRef]
Figure 1. South African cereal fried dough (magwinya) samples (left: whole sample; right: crumb). A = 100% WF (control); B = 95% WF + 5% WB; C = 90% WF + 10% WB; D = 85% WF + 15% WB; E = 80% WF + 20% WB. WF = wheat flour; WB = wheat bran.
Foods 08 00559 g001aFoods 08 00559 g001b
Figure 2. Illustrations showing texture analysis of magwinya samples. A = 100% WF (control); B = 95% WF + 5% WB.
Foods 08 00559 g002
Figure 3. Principal component analysis plot of wheat bran cereal fried dough with loading coordinates for sensory properties.
Foods 08 00559 g003
Table 1. Descriptive vocabulary and definitions to evaluate the sensory properties of magwinya samples.
AttributeDefinitionScale anchors (0–10)
Appearance
 Crumb darknessDegree of color darkness in the crust ranging from light brown to dark brownLess dark = 1, more dark = 10
 Crumb lightnessDegree of lightness in the crumb ranging from white to dark brownLess light = 1, more light = 10
 PorosityThe extent of perforation of the cereal fried dough surface and crumb. This encompasses the holes and cracks allowing the permeation of airLess pores = 1, more pores = 10
 Crust smoothnessThe visual appearance of crust contour from smooth to roughLess smooth = 1, more smooth = 10
 Bran particlesThe quantity of wheat bran specks on the surfaceLess bran particles = 1, more bran particles = 10
 Evenness of colorThe evenness of color on the surfaceLess evenness = 1, more evenness = 10
Aroma
 YeastyOdor associated with aromatic exchange from yeast fermentationLess yeasty = 1, more yeasty = 10
 FlouryThe aromatics associated with standard baking flour, e.g., wheat flourLess floury = 1, more floury = 10
 FermentedIntensity of aroma associated with beerLess fermented = 1, more fermented = 10
 Oily or rancidThe overall flavor impression of oilLess oily = 1, more oily = 10
 Toasted ‘burnt’The odor impression of bread and crumb after baking/heatingLess toasted = 1, more toasted = 10
Flavor
 Sweet tasteFundamental taste sensation of which sucrose is typicalLess sweet = 1, more sweet = 10
 Salty tasteFundamental taste sensation elicited by sodium chlorideLess salty = 1, more salty = 10
 Oily or rancidThe overall flavor impression of oilLess oily = 1, more oily = 10
Oral texture
 HardnessForce required to bite completely through the sample placed between the molarsLess hardness = 1, more hardness = 10
 ChewinessCondition of necessitating chewing or of being difficult to chewLess chewiness = 1, more chewiness = 10
 CohesivenessState of cohering or sticking togetherLess cohesiveness = 1, more cohesiveness = 10
 SpringinessThe degree or rate at which the sample returns to its original size/shape after partial compression between the tongue and palateLess springiness = 1, more springiness = 10
After flavor
 DryDegree of which sample feels dry while chewing and absorbs salivaLess dry = 1, more dry = 10
 Lingering tasteLength of time which the taste last after the swallowLess lingering = 1, more lingering = 10
 Grittiness residueDegree to which small particles remainLess gritty = 1, more gritty residues = 10
 Sweet aftertasteFundamental taste sensation of which sucrose is typicalLess sweet = 1, more sweet aftertaste = 10
Table 2. Color parameters of magwinya samples.
ColorControlMWB5MWB10MWB15MWB20
Crumb
L*62.42 c ± 1.9356.34 bc ± 0.3951.20 b ± 1.0151.67 b ± 1.0747.20 a ± 1.51
a*1.94 a ± 0.815.68 b ± 0.547.40 c ± 0.447.96 c ± 0.158.98 d ± 0.15
b*20.13 a ± 1.1019.61 a ± 0.3619.04 a ± 0.1919.49 a ± 0.9019.70 a ± 0.99
 Chroma20.23 a ± 1.1520.42 a ± 0.4920.55 a ± 0.3121.06 a ± 0.7621.65 a ± 0.86
 Hue84.55 d ± 2.0873.86 c ± 1.2068.76 b ± 0.9767.76 ab ± 1.2965.46 a ± 1.53
 ∆E-7.18 a ± 0.3512.53 b ± 1.0812.36 b ± 1.0516.80 c ± 1.44
Crust
L*35.92 b ± 0.4435.92 b ± 0.5933.67 b ± 2.1131.00 a ± 1.0528.98 a ± 1.27
a*17.29 bc ± 0.3818.23 c ± 0.4417.09 b ± 0.3616.23 b ± 0.5714.96 a ± 0.93
b*24.74 c ± 1.1824.74 c ± 0.2318.70 b ± 0.1018.79 b ± 1.2316.52 a ± 1.80
 Chroma30.19 bc ± 1.1835.03 c ± 7.4926.00 b ± 1.6824.83 b ± 1.2922.29 a ± 1.95
 Hue55.03 b ± 0.7353.62 b ± 0.9147.57 a ± 0.5549.16 a ± 0.9847.77 a ± 1.41
 ∆E-1.09 a ± 0.366.66 b ± 0.627.81 b ± 1.6111.02 c ± 2.30
Values are means ± standard deviations from triplicate determinations. Means in the same row with different superscript are significantly different (p < 0.05). Control = 100% WF; MWB5 = 95% WF + 5% WB; MWB10 = 90% WF + 10% WB; MWB15 = 85% WF + 15% WB; MWB20 = 80% WF + 20% WB. MWB = magwinya wheat bran.
Table 3. Weight, volume, and specific volume of magwinya samples.
PropertiesControlMWB5MWB10MWB15MWB20
Weight51.57 b ± 3.5353.83 b ± 1.9952.10 b ± 1.9543.10 a ± 0.7951.83 b ± 4.54
Volume76.67 a ± 5.7780.00 a ± 10.0080.00 a ± 10.0063.33 a ± 11.5576.67 a ± 11.55
Specific volume1.49 a ± 0.171.49 a ± 0.181.54 a ± 0.211.47 a ± 0.251.47 a ± 0.09
Values are means ± standard deviations from triplicate determinations. Means in the same row with different superscript are significantly different (p < 0.05). Control = 100% WF; MWB5 = 95% WF + 5% WB; MWB10 = 90% WF + 10% WB; MWB15 = 85% WF + 15% WB; MWB20 = 80% WF + 20% WB.
Table 4. Texture profile analysis of magwinya.
ParametersControlMWB5MWB10MWB15MWB20
Hardness (g)475.94 a ± 36.01500.85 ab ± 45.64562.56 b ± 38.80649.46 c ± 42.40667.14 c ± 52.83
Cohesiveness0.55 a ± 0.080.40 b ± 0.020.36 b ± 0.020.35 b ± 0.020.33 b ± 0.03
Chewiness261.70 a ± 40.44198.63 b ± 19.87204.11 b ± 9.87224.85 ab ± 13.74221.63 ab ± 14.06
Springiness0.98 a ± 0.001.00 a ± 0.001.00 a ± 0.001.00 a ± 0.001.00 a ± 0.00
Values are means ± standard deviations from triplicate determinations. Means in the same row with different superscript are significantly different (p < 0.05). Control = 100% WF; MWB5 = 95% WF + 5% WB; MWB10 = 90% WF + 10% WB; MWB15 = 85% WF + 15% WB; MWB20 = 80% WF + 20% WB.
Table 5. Descriptive sensory profile of wheat bran magwinya.
Sensory AttributesControlMWB5MWB10MWB15MWB20
Appearance
 Crust-brownness6.04 a ± 0.365.92 a ± 0.516.21 a ± 0.076.96 b ± 0.318.38 c ± 0.45
 Crumb-lightness6.71 c ± 1.195.83 bc ± 0.924.92 b ± 0.524.42 ab ± 0.382.88 a ± 1.09
 Bran particles3.04 a ± 2.625.29 ab ± 0806.46 bc ± 1.016.75 bc ± 0.768.33 c ± 0.38
 Crust smoothness6.42 d ± 0.475.79 cd ± 0.644.58 bc ± 1.124.00 ab ± 0.782.96 a ± 0.19
 Evenness0.40 a ± 1.236.33 a ± 1.085.67 a ± 0.455.92 a ± 0.956.29 a ± 0.52
 Porosity4.04 a ± 1.134.08 a ± 0.444.33 a ± 0.834.42 a ± 0.264.67 a ± 1.02
Aroma
 Yeasty4.63 ab ± 0.753.63 a ± 0.824.21 ab ± 0.444.42 ab ± 0.635.08 b ± 0.73
 Floury4.38 a ± 0.574.17 a ± 0.694.08 a ± 0.364.46 a ± 0.384.21 a ± 0.50
 Fermented4.63 a ± 0.134.58 a ± 0.944.25 a ± 0.784.38 a ± 0.784.58 a ± 1.05
 Toasted ‘burnt’3.42 a ± 0.854.63 ab ± 0.654.92 b ± 0.735.13 b ± 0.765.75 b ± 0.75
 Oily4.71 a ± 0.694.21 a ± 1.214.58 a ± 0.473.96 a ± 1.343.33 a ± 0.31
Flavor
 Sweetness5.63 b ± 0.575.58 ab ± 0.385.29 ab ± 0,265.00 ab ± 0.754.54 a ± 0.59
 Saltiness2.17 a ± 0.512.54 a ± 0.192.75 a ± 0,882.92 a ± 0.812.54 a ± 0.47
Texture
 Hardness3.92 a ± 1.404.63 ab ± 1.025.54 abc ± 1.206.17 b ± 0.077.21 c ± 0.19
 Cohesiveness5.29 ab ± 1.405.08 a ± 1.025.08 a ± 1.205.42 ab ± 0.076.33 b ± 0.19
 Springiness4.17 a ± 1.285.08 ab ± 0.625.42 ab ± 0.265.83 b ± 0.476.21 b ± 1.00
 Chewiness5.54 a ± 0.595.46 a ± 0.145.38 a ± 0.505.42 a ± 0.264.79 a ± 0.19
Aftertaste
 Sweetness4.83 a ± 0.075.04 a ± 0.635.13 a ± 0.335.29 a ± 0.795.17 a ± 0.51
 Gritty (residues)4.50 a ± 0.884.38 a ± 0.824.75 a ± 0.335.08 a ± 0.514.88 a ± 1.02
 Lingering4.71 a ± 0.724.75 a ± 1.074.83 a ± 0.625.21 a ± 0.855.63 a ± 0.82
 Dry4.12 a ± 1.354.88 ab ± 1.525.54 ab ± 0.266.08 bc ± 0.197.33 c ± 0.26
Values are means ± standard deviations from triplicate determinations. Means in the same row with different superscript are significantly different (p < 0.05). Control = 100% WF; MWB5 = 95% WF + 5% WB; MWB10 = 90% WF + 10% WB; MWB15 = 85% WF+ 15% WB; MWB20 = 80% WF + 20% WB.
Table 6. Consumer acceptance scores of magwinya.
ParametersControlMWB5MWB10MWB15MWB20
Appearance7.48 d ± 1.447.05 cd ± 1.446.05 b ± 1.886.49 bc ± 1.874.36 a ± 2.36
Aroma7.18 c ± 1.517.00 c ± 1.506.39 b ± 1.386.45 b ± 1.535.09 a ± 2.31
Texture7.58 c ± 1.527.18 c ± 1.616.46 b ± 1.416.60 b ± 1.784.78 a ± 2.41
Taste7.71 c ± 1.327.35 bc ± 1.76.94 b ± 1.566.91 b ± 1.535.60 a ± 2.14
Overall acceptability7.58 c ± 1.32741 c ± 1.416.83 b ± 1.466.92 b ± 1.485.58 a ± 2.04
Values are means ± standard deviations from eighty consumers. Means in the same row with different superscript are significantly different (p < 0.05). Control = 100% WF; MWB5 = 95% WF + 5% WB; MWB10 = 90% WF + 10% WB; MWB15 = 85% WF + 15% WB; MWB20 = 80% WF + 20% WB.
Table 7. Correlation between the instrumental and sensory texture attributes of magwinya.
Sensory Texture AttributesInstrumental Texture Attributes
IhardnessIcohesivenessIchewiness
Hardness−0.81 **−0.61 *−0.74 **
Cohesiveness−0.58 *−0.05−0.32
Springiness−0.63 *−0.71 **−0.67 **
Chewiness0.300.350.30
** Correlation is significant at the 0.01 level. * Correlation is significant at the 0.05 level.

