
Processing-Induced Markers in Proteins of Commercial Plant-Based Drinks in Relation to Compositional Aspects

 ,
,
Abstract
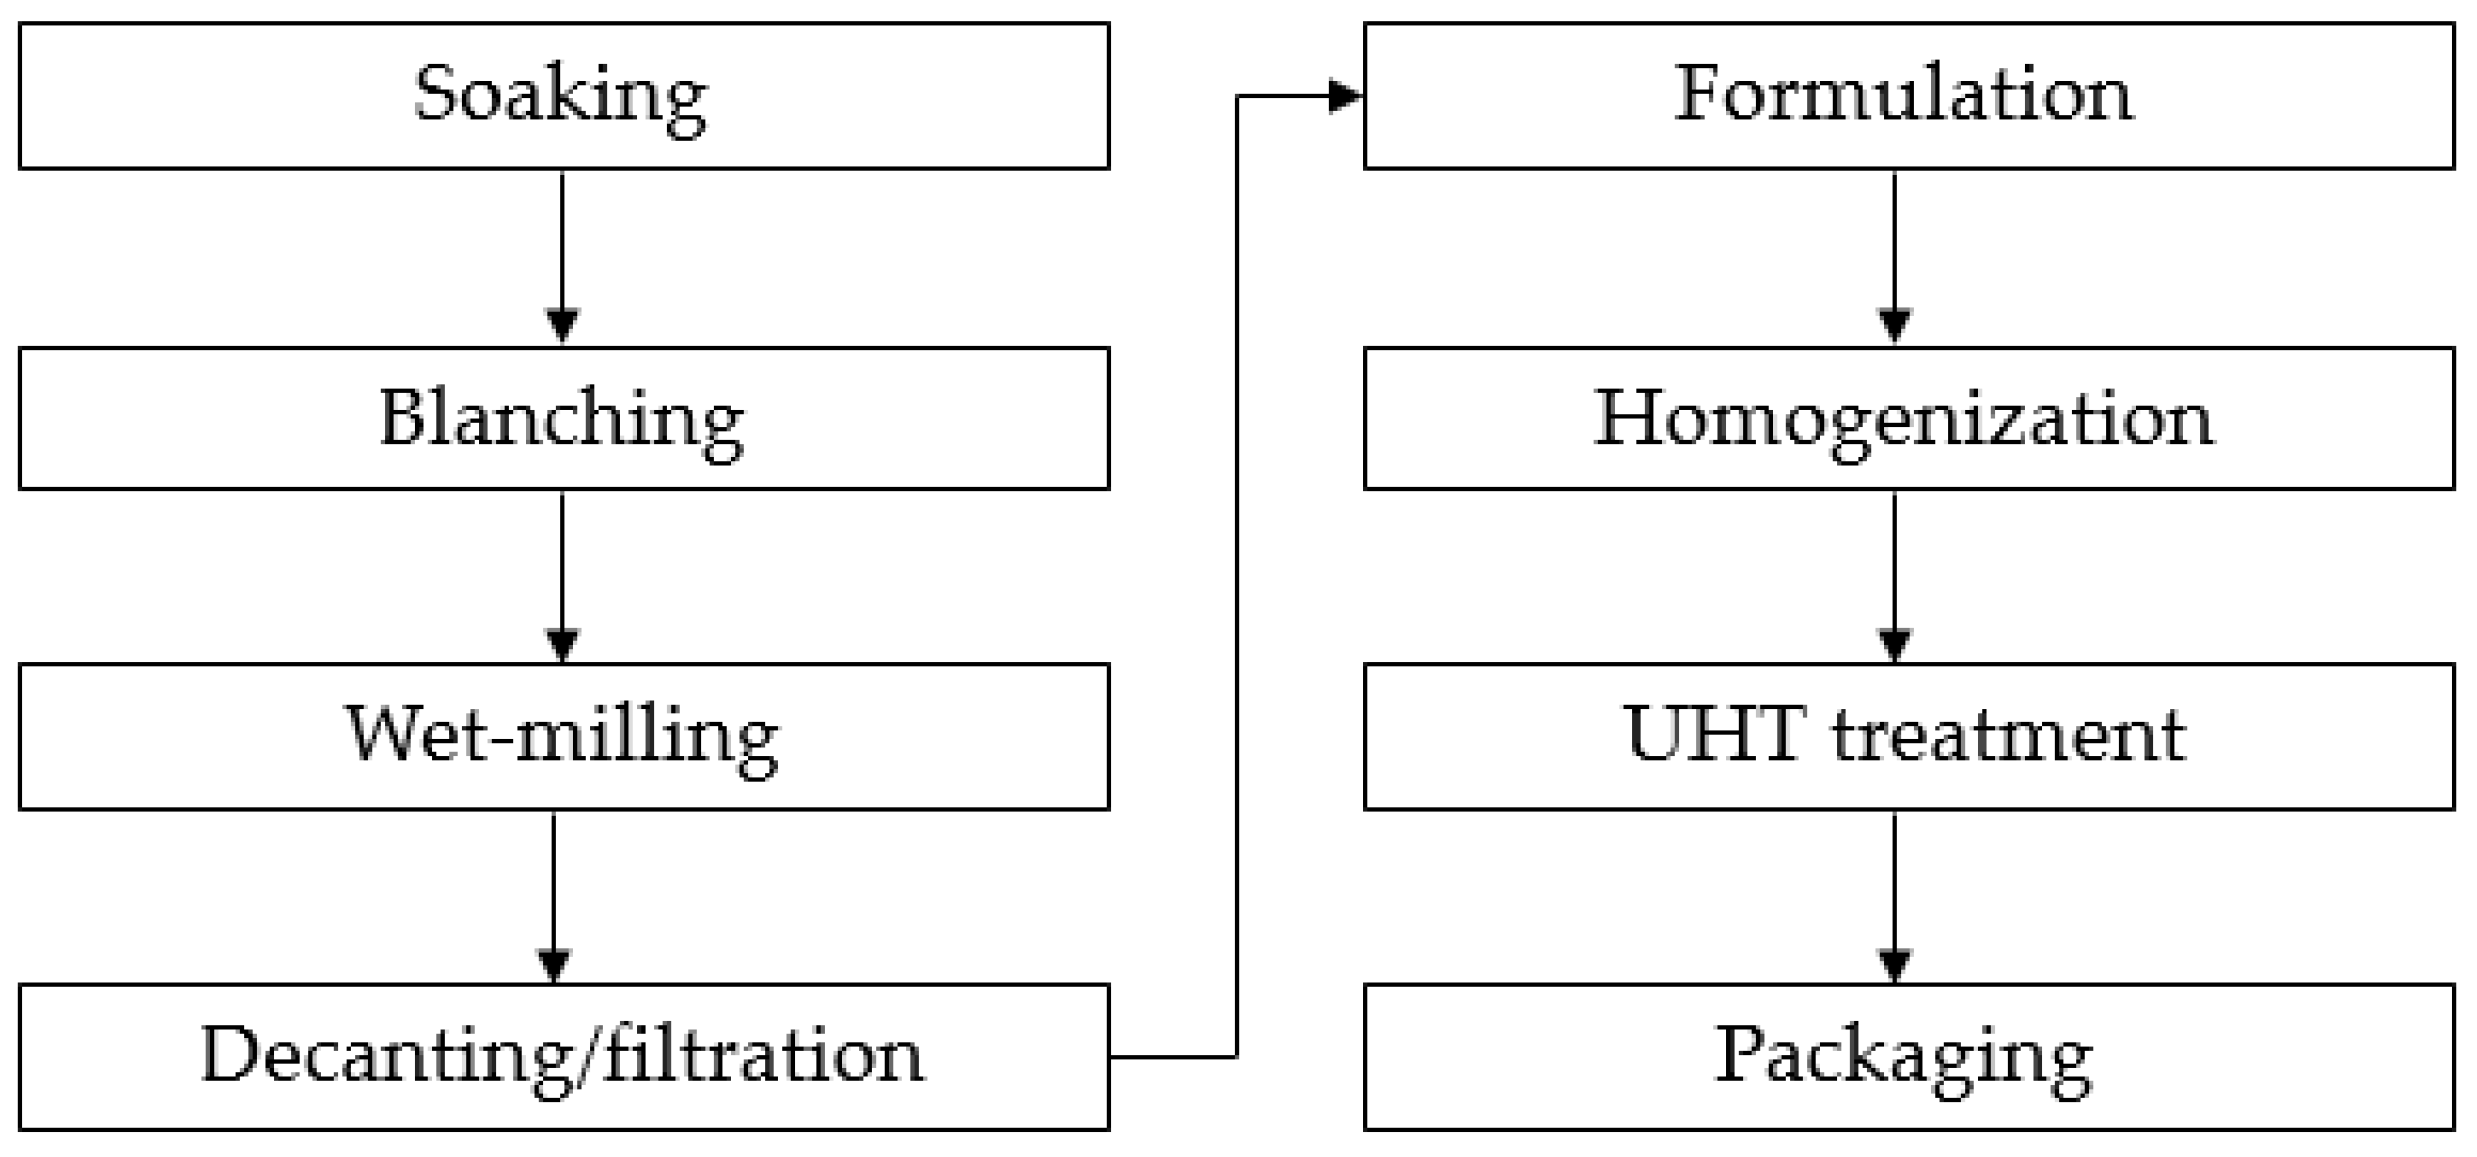
:1. Introduction
2. Materials and Methods
2.1. Samples of Plant-Based Drinks
2.2. Validation of Protein Contents in the PBDs
2.3. Sodium Dodecyl Sulphate Polyacrylamide Gel Electrophoresis (SDS-PAGE)
2.4. Particle Size
2.5. Quantification of Levels of Processing-Induced Markers by MRM LC-MS Triple-Q
2.6. Statistical Analysis
3. Results and Discussion
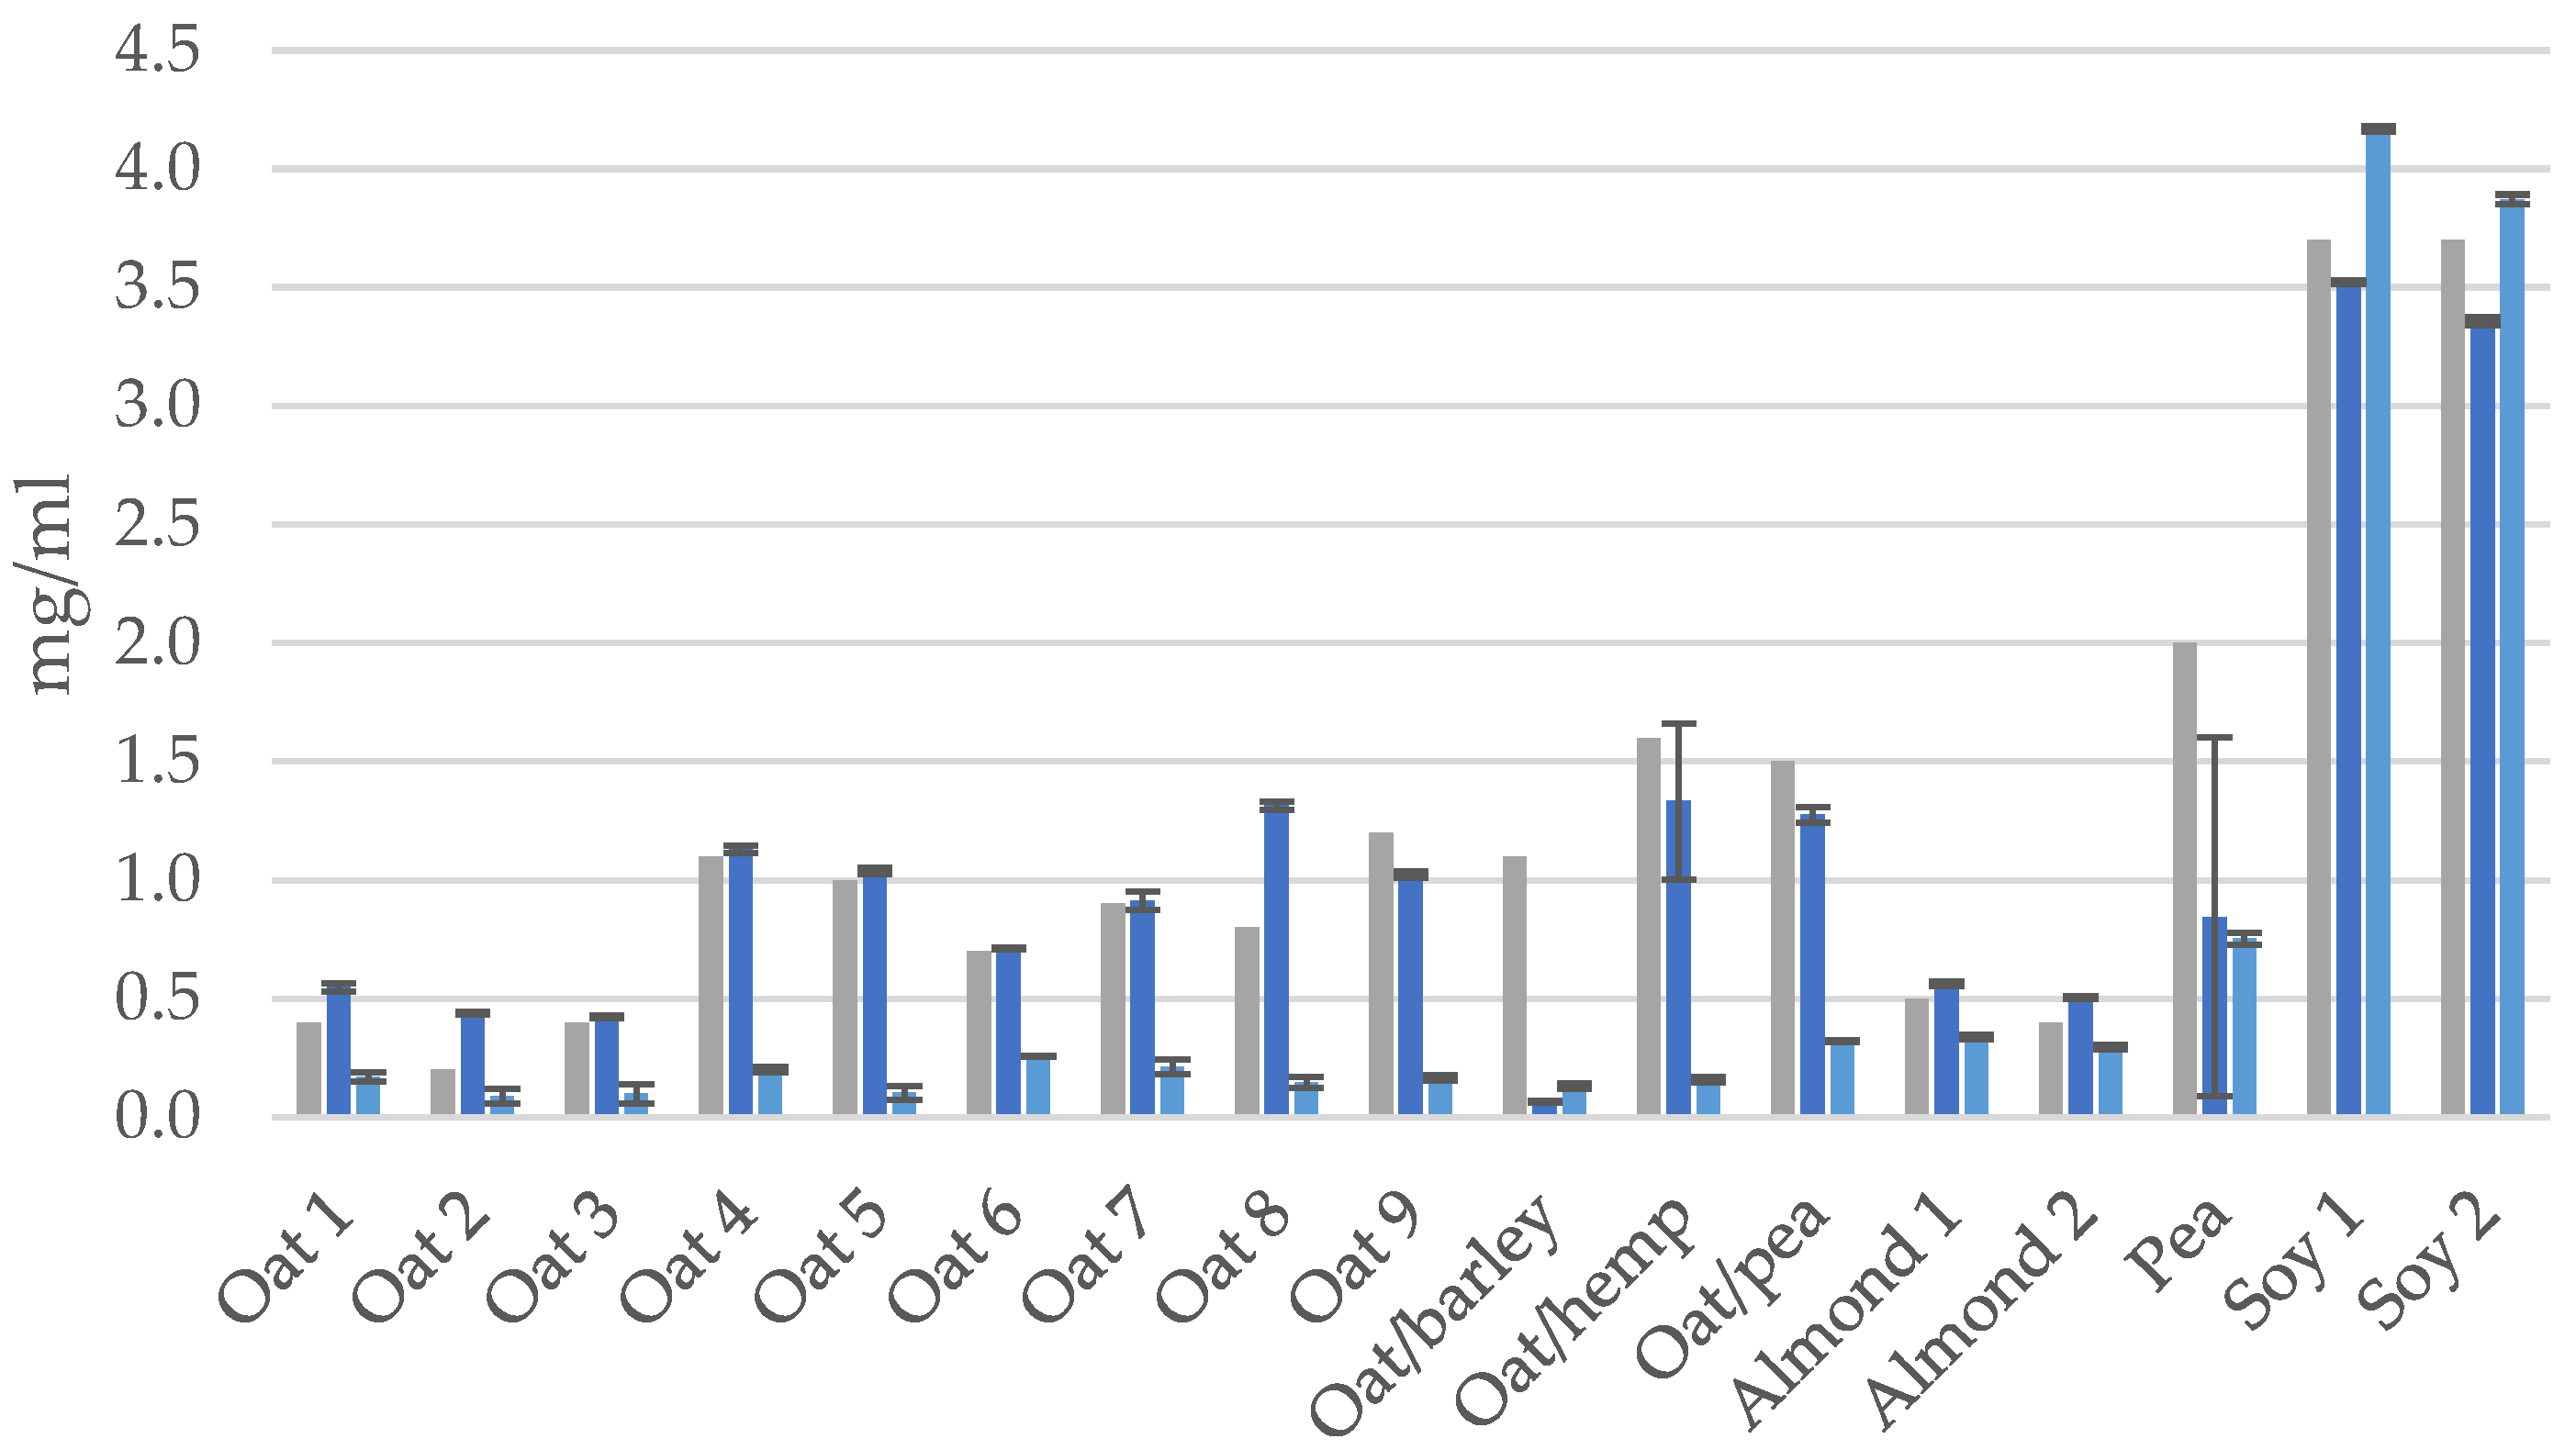
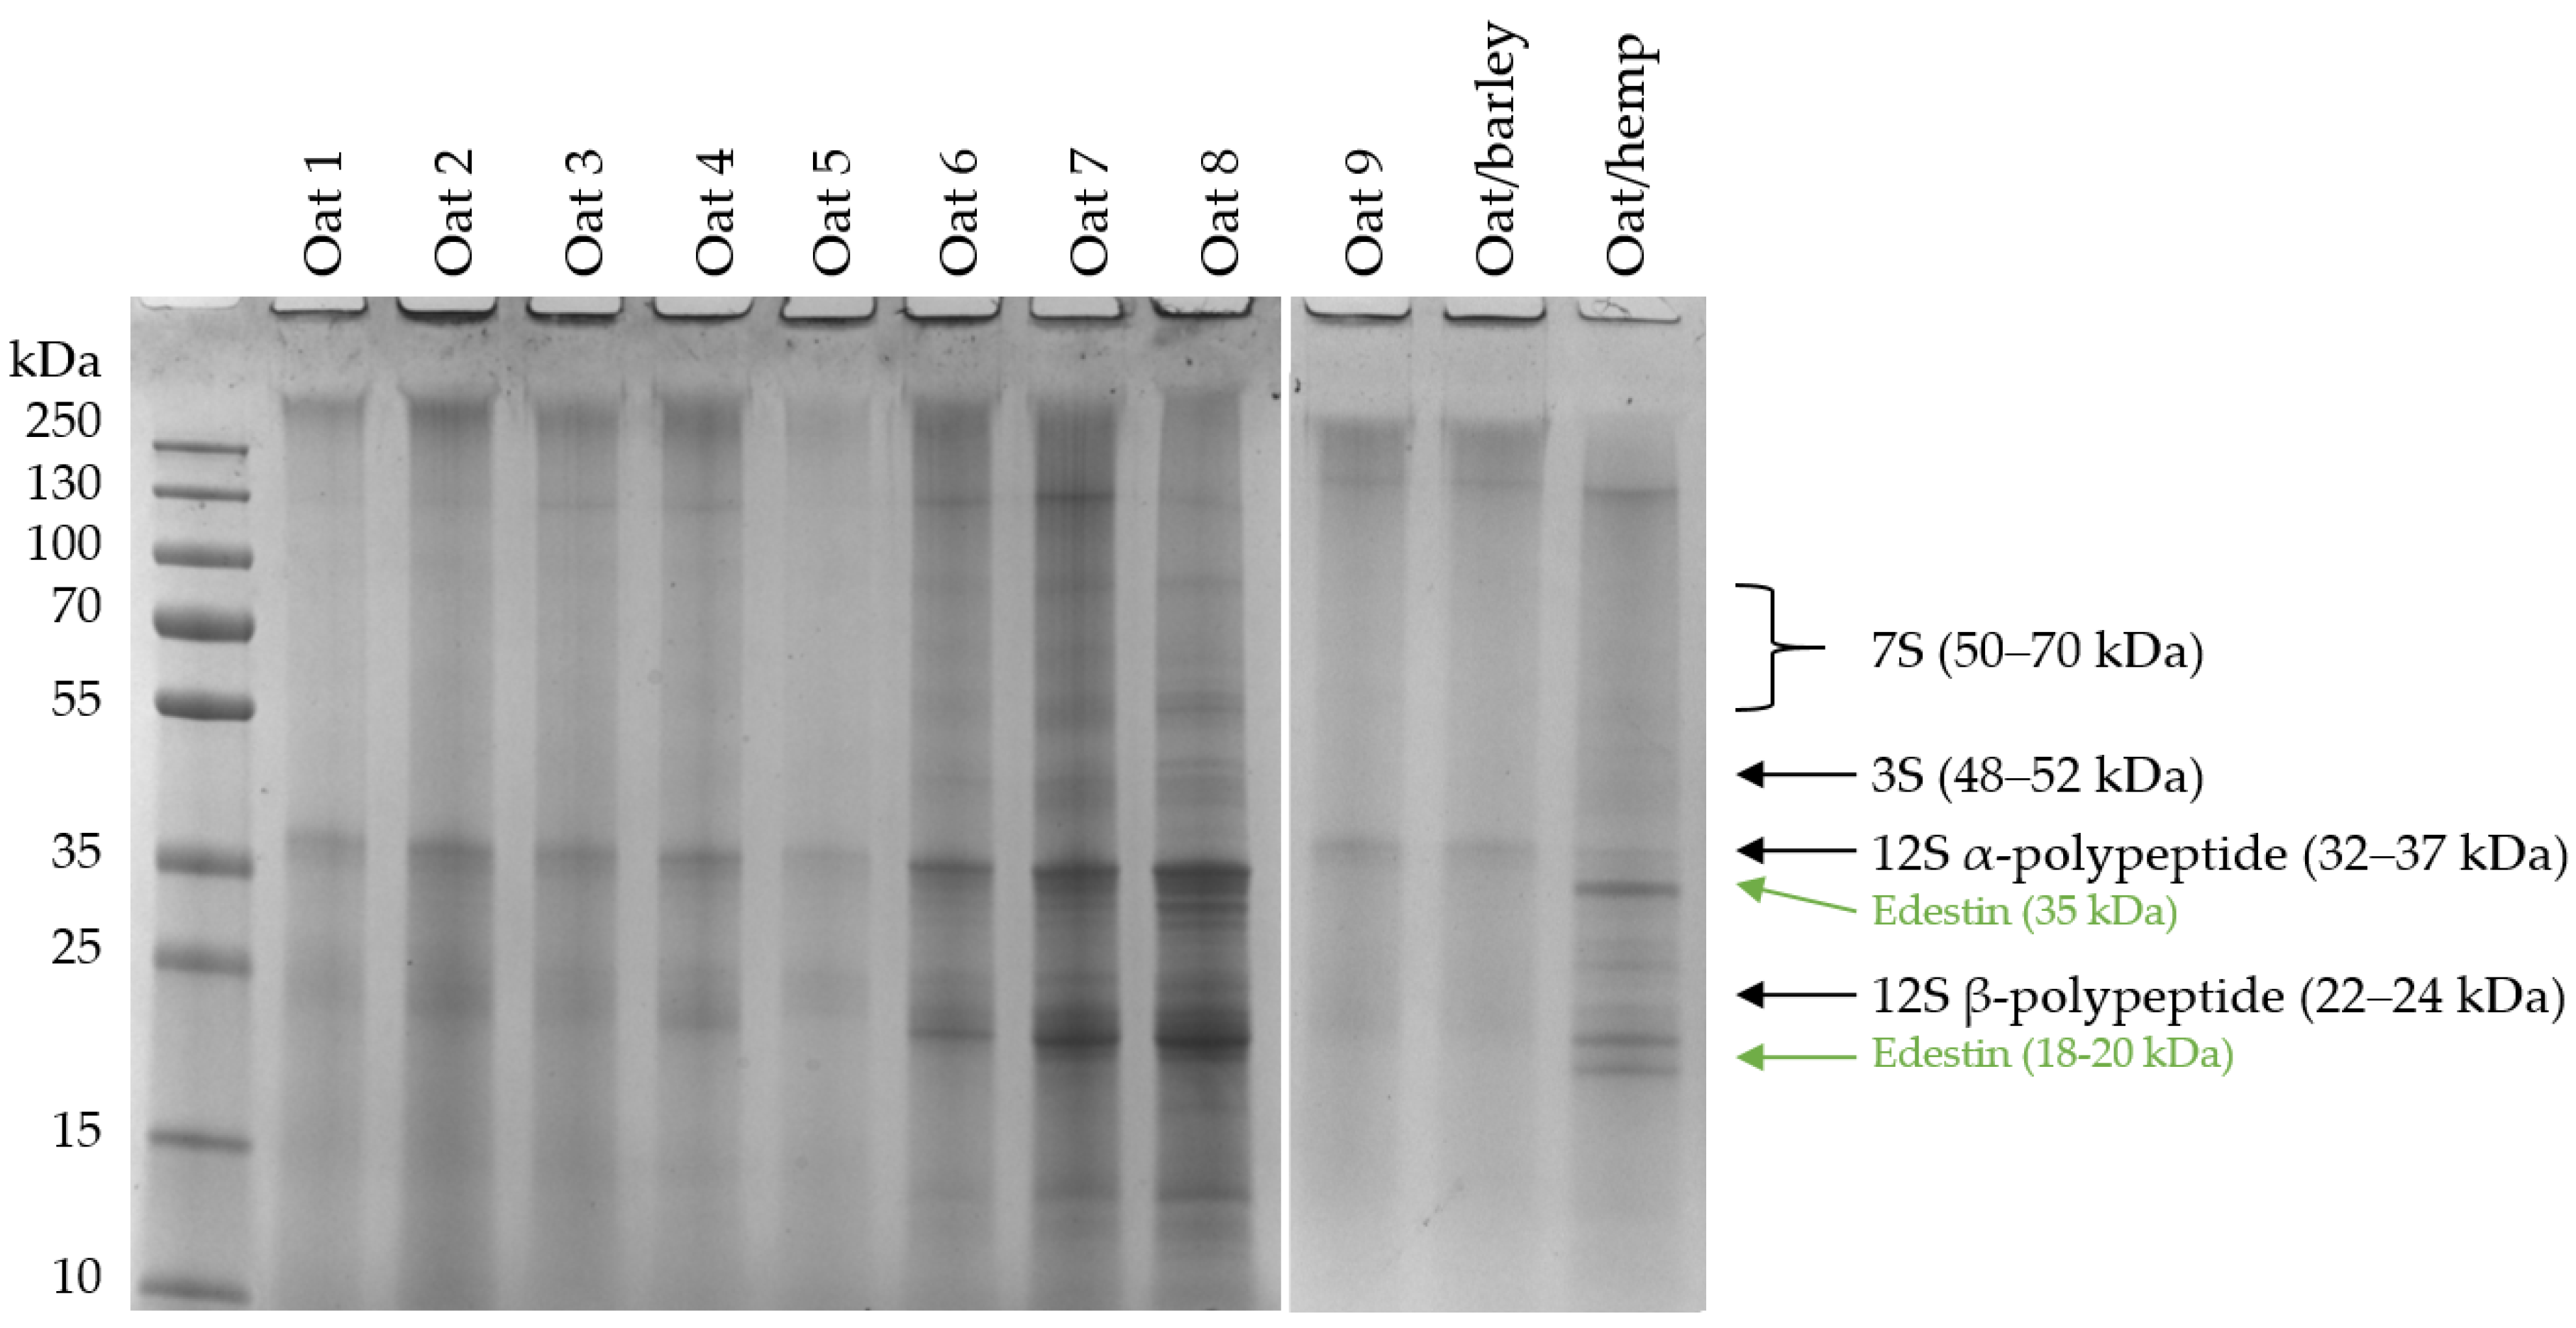
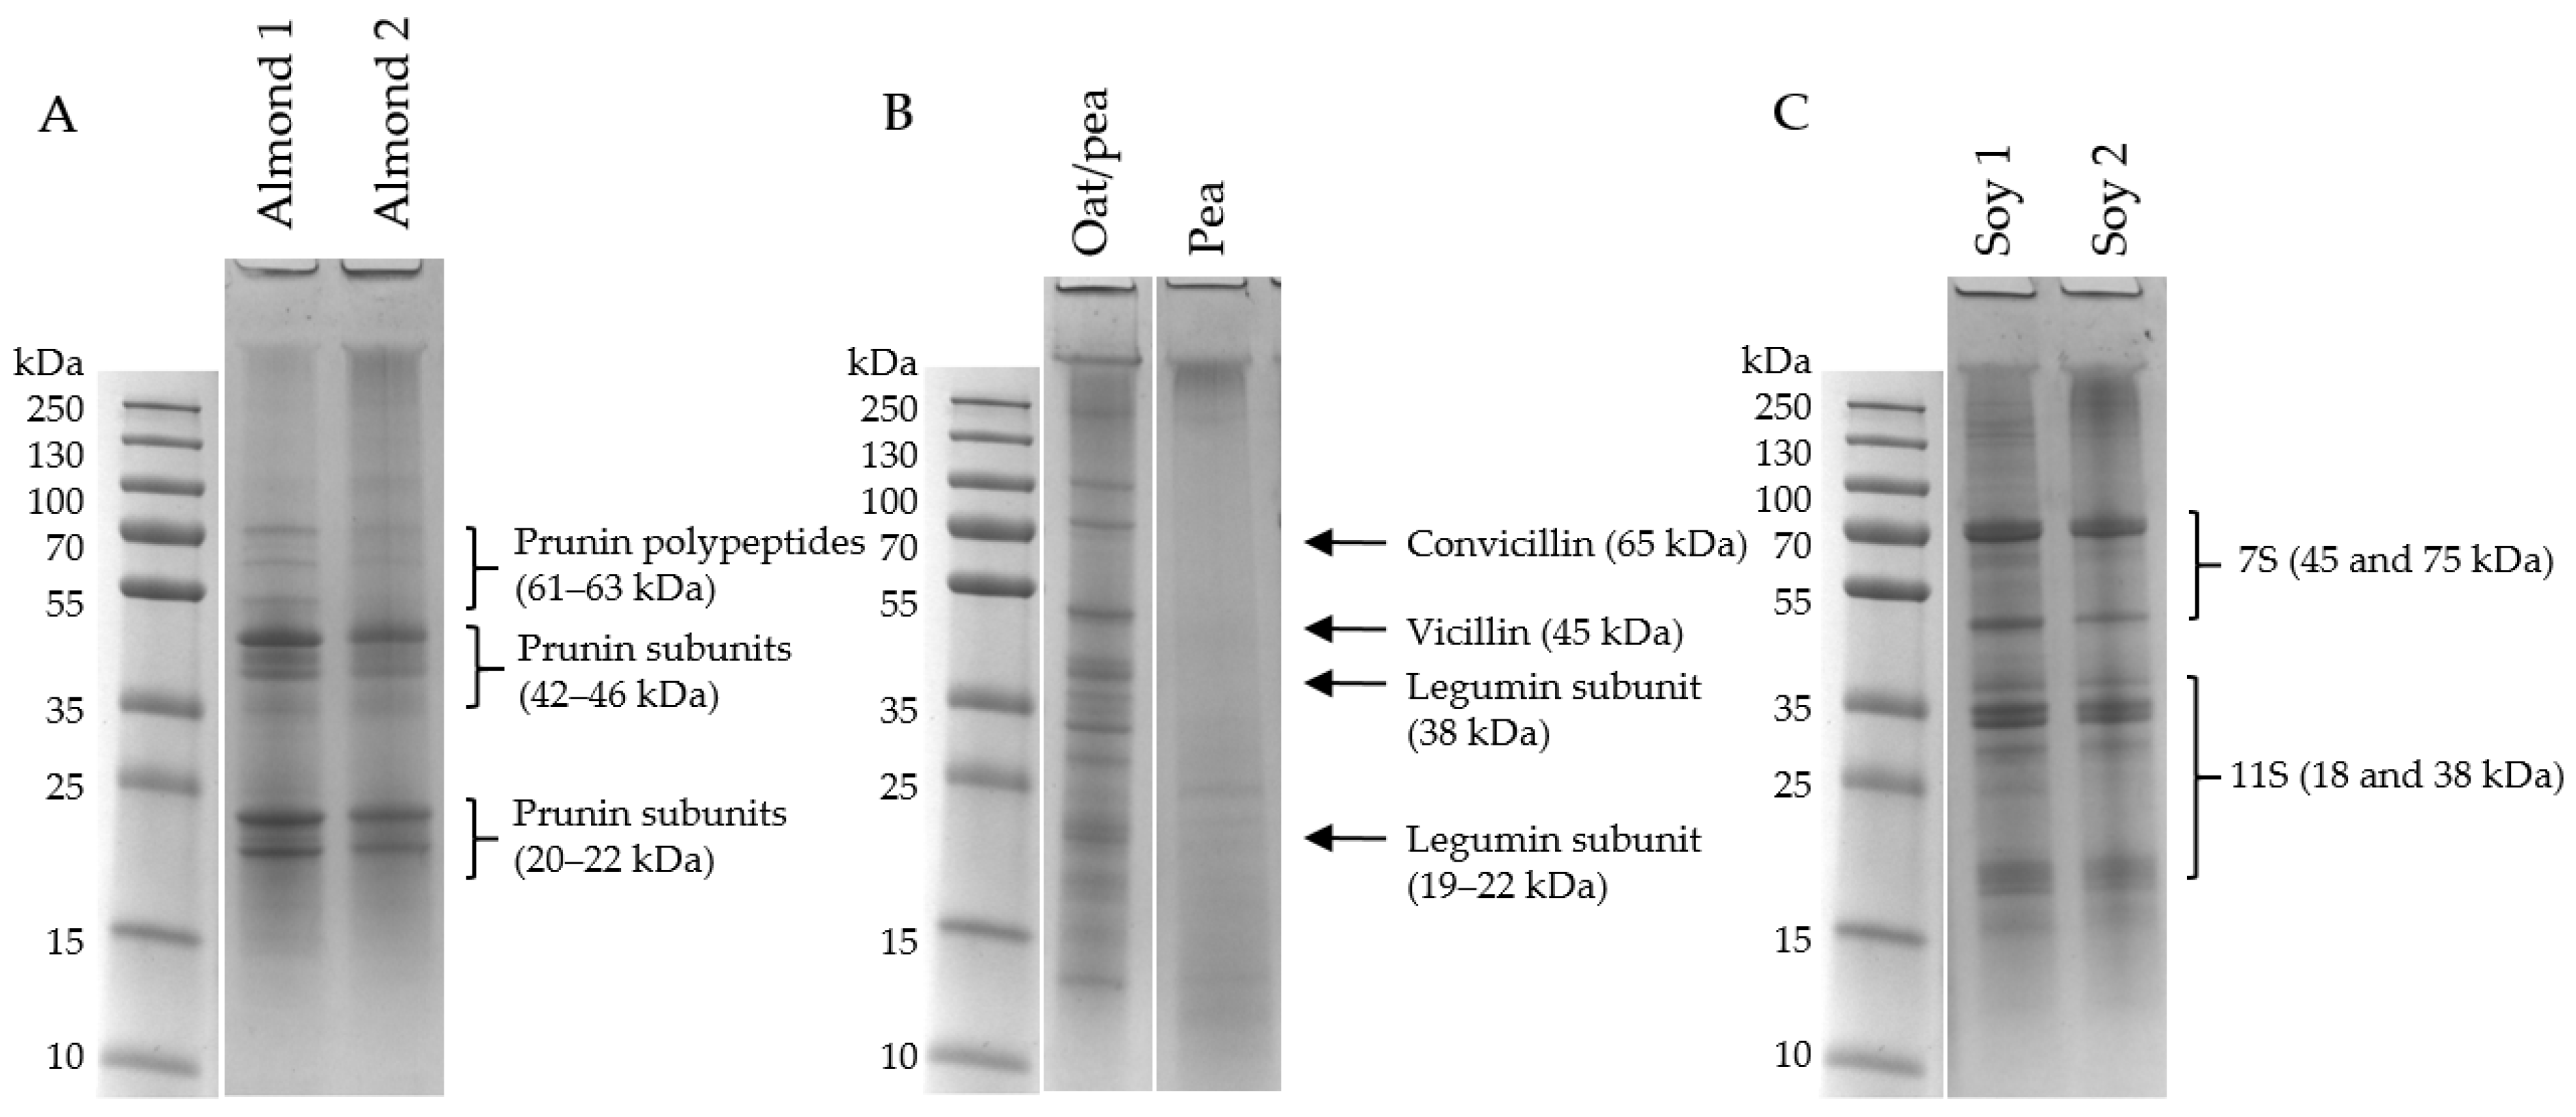
3.1. Protein Contents and Compositions in the PBDs
3.2. Particle Size before and after Filtration of PBDs
3.3. Processing-Induced Markers
4. Conclusions
Supplementary Materials
Author Contributions
Funding
Data Availability Statement
Conflicts of Interest
References
- GrandViewResearch. Dairy Alternatives Market Size, Share & Trends Analysis Report by Product (Soy Milk, Almond Milk, Rice Milk), by Formulation (Plain, Flavored), by Application (Food, Beverages), and Segment Forecasts, 2019–2025; Grand View Research: San Francisco, CA, USA, 2019. [Google Scholar]
- Fuentes, C.; Fuentes, M. Making a market for alternatives: Marketing devices and the qualification of a vegan milk substitute. J. Mark. Manag. 2017, 33, 529–555. [Google Scholar] [CrossRef]
- Sethi, S.; Tyagi, S.K.; Anurag, R.K. Plant-based milk alternatives an emerging segment of functional beverages: A review. J. Food Sci. Technol. 2016, 53, 3408–3423. [Google Scholar] [CrossRef] [PubMed]
- The Brainy Insights. Plant-Based Beverages Market Size Type (Soy, Almond, Coconut, Oats, Cashew) Distribution Channel (Online, Offline) Flavor (Plain, Flavored), Regions, Global Industry Analysis, Share, Growth, Trends, and Forecast 2022 to 2030; The Brainy Insights: Pune, India, 2022. [Google Scholar]
- Walther, B.; Guggisberg, D.; Badertscher, R.; Egger, L.; Portmann, R.; Dubois, S.; Haldimann, M.; Kopf-Bolanz, K.; Rhyn, P.; Zoller, O.; et al. Comparison of nutritional composition between plant-based drinks and cow’s milk. Front. Nutr. 2022, 9, 988707. [Google Scholar] [CrossRef] [PubMed]
- Jakobsen, J.; Danielsen, M.; Langwagen, M.; Švarc, P.L.; Poulsen, A.; Trolle, E. Nutrient Content in Plant-Based Beverages; DTU Fødevareinstituttet: Lyngby, Denmark, 2022. [Google Scholar]
- Schilling, W.; Lesak, D. The Making of a Plant-Based Beverage. Food Technology Magazine, 1 April 2022. [Google Scholar]
- Deswal, A.; Deora, N.S.; Mishra, H.N. Optimization of Enzymatic Production Process of Oat Milk Using Response Surface Methodology. Food Bioprocess Technol. 2013, 7, 610–618. [Google Scholar] [CrossRef]
- Mäkinen, O.E.; Sozer, N.; Ercili-Cura, D.; Poutanen, K. Protein From Oat: Structure, process, functioality, and nutrition. In Sustainable Protein Sources; Academic Press: Cambridge, MA, USA, 2016; pp. 105–119. [Google Scholar]
- Nielsen, S.D.; Le, T.T.; Knudsen, L.J.; Rauh, V.; Poulsen, N.A.; Larsen, L.B. Development and application of a multiple reaction monitoring mass spectrometry method for absolute quantification of lysinoalanine and lanthionine in dairy products. Int. Dairy J. 2020, 105, 104693. [Google Scholar] [CrossRef]
- Nielsen, S.D.; Knudsen, L.J.; Baekgaard, L.T.; Rauh, V.; Larsen, L.B. Influence of Lactose on the Maillard Reaction and Dehydroalanine-Mediated Protein Cross-Linking in Casein and Whey. Foods 2022, 11, 897. [Google Scholar] [CrossRef] [PubMed]
- Baxter, J.H. Free amino acid stability in reducing sugar systems. J. Food Sci. 1995, 60, 405–408. [Google Scholar] [CrossRef]
- Aguilera-Toro, M.; Poulsen, N.A.; Akkerman, M.; Rauh, V.; Larsen, L.B.; Nielsen, S.D. Development in Maillard Reaction and Dehydroalanine Pathway Markers during Storage of UHT Milk Representing Differences in Casein Micelle Size and Sedimentation. Foods 2022, 11, 1525. [Google Scholar] [CrossRef] [PubMed]
- Jones, D.B. Factors for Converting Percentages of Nitrogen in Foods and Feeds into Percentages of Protein; US Department of Agriculture: Washington, DC, USA, 1931; Volume 183, pp. 1–22.
- Sheng, B.; Nielsen, S.D.; Glantz, M.; Paulsson, M.; Poulsen, N.A.; Larsen, L.B. Effects of genetic variants and sialylation on in vitro digestibility of purified κ-casein. J. Dairy Sci. 2022, 105, 2803–2814. [Google Scholar] [CrossRef] [PubMed]
- Kjeldahl, J. Neue Methode zur Bestimmung des Stickstoffs in organischen Körpern. Z. Anal. Chem. 1883, 22, 366–383. [Google Scholar] [CrossRef]
- Bradford, M.M. A rapid and sensitive method for the quantitation of microgram quantities of protein utilizing the principle of protein-dye binding. Anal. Biochem. 1976, 12, 248–254. [Google Scholar] [CrossRef]
- Mäkinen, O.E.; Uniacke-Lowe, T.; O’Mahony, J.; Arendt, E. Physicochemical and acid gelation properties of commercial UHT-treated plant-based milk substitutes and lactose free bovine milk. Food Chem. 2015, 168, 630–638. [Google Scholar] [CrossRef] [PubMed]
- Lásztity, R. Oat grain—A wonderful reservoir of natural nutrients and biologically active substances. Food Rev. Int. 1998, 14, 99–119. [Google Scholar] [CrossRef]
- Sun, X.; Sun, Y.; Li, Y.; Wu, Q.; Wang, L. Identification and Characterization of the Seed Storage Proteins and Related Genes of Cannabis sativa L. Front. Nutr. 2021, 8, 678421. [Google Scholar] [CrossRef] [PubMed]
- De Angelis, E.; Bavaro, S.L.; Forte, G.; Pilolli, R.; Monaci, L. Heat and Pressure Treatments on Almond Protein Stability and Change in Immunoreactivity after Simulated Human Digestion. Nutrients 2018, 10, 1679. [Google Scholar] [CrossRef] [PubMed]
- Chang, C.Y.; Jin, J.D.; Chang, H.L.; Huang, K.C.; Chiang, Y.F.; Ali, M.; Hsia, S.M. Antioxidative Activity of Soy, Wheat and Pea Protein Isolates Characterized by Multi-Enzyme Hydrolysis. Nanomaterials 2021, 11, 1509. [Google Scholar] [CrossRef] [PubMed]
- Kim, S.Y.; Park, P.S.W.; Rhee, K.C. Functional properties of proteolytic enzyme modified soy protein isolate. J. Agric. Food Chem. 1990, 38, 651–656. [Google Scholar] [CrossRef]


| Oat 1 | Oat 2 | Oat 3 | Oat 4 | Oat 5 | Oat 6 | Oat 7 | Oat 8 | Oat 9 | |
|---|---|---|---|---|---|---|---|---|---|
| Energy (kJ/kcal) | 199/47 | 143/34 | 150/36 | 264/63 | 297/71 | 143/34 | 209/50 | 237/58 | 204/49 |
| Protein (g/100 g) | 0.4 | 0.2 | 0.4 | 1.1 | 1 | 0.7 | 0.9 | 0.8 | 1.2 |
| Fat (g/100 g) | 1.3 | 1.2 | 1.4 | 3.4 | 2.9 | 1.4 | 1.2 | 0.5 | 1.5 |
| Saturated fat (g/100 g) | 0.5 | 0.2 | 0.2 | 0.3 | 0.3 | 0.2 | 0.1 | 0.1 | 0.2 |
| Carbohydrates (g/100 g) | 8 | 5.6 | 5.3 | 6.7 | 9.6 | 4.3 | 8.5 | 12 | 7.1 |
| Sugars (g/100 g) | 3.2 | 3.1 | 3.6 | 1.6 | 4.1 | 0 | 3.7 | 2 | 3.3 |
| Fibre (g/100 g) | 1 | N/A | 0.5 | 0.7 | 1 | 0.5 | N/A | N/A | N/A |
| Salt (g/100 g) | 0.08 | 0.09 | 0.12 | 0.12 | 0.1 | 0.09 | 0.1 | 0.02 | 0.17 |
| Calcium (m g/100 g) | N/A | 120 | 120 | 120 | 120 | N/A | 120 | N/A | N/A |
| Shelf life | 9 m, RT | 5 m, 5 °C | 9 m, RT | 9 m, RT | 12 m, RT | 9 m, RT | 12 m, RT | 9 m, RT | 1–2 m, 5 °C |
| Heat treatment | UHT | UHT | UHT | UHT | UHT | UHT | UHT | N/A | UHT |
| Oat/Hemp | Oat/Barley | Oat/Pea | Almond 1 | Almond 2 | Pea | Soy 1 | Soy 2 | |
|---|---|---|---|---|---|---|---|---|
| Energy (kJ/kcal) | 220/52 | 206/49 | 241/59 | 87/21 | 89/21 | 142/34 | 147/35 | 217/52 |
| Protein (g/100 g) | 1.6 | 1.1 | 1.5 | 0.5 | 0.4 | 2 | 3.7 | 3.7 |
| Fat (g/100 g) | 1.4 | 1.4 | 2.3 | 1.2 | 0.9 | 2.1 | 2.1 | 2.2 |
| Saturated fat (g/100 g) | 0.3 | 0.1 | 0.3 | 0.1 | 0.1 | 0.2 | 0.4 | 0.4 |
| Carbohydrates (g/100 g) | 7.7 | 7.6 | 8 | 2 | 2.7 | 2 | 0.6 | 4 |
| Sugars (g/100 g) | 3.2 | 3.7 | 2.5 | 1.9 | 2.4 | 2 | 0.1 | 3.4 |
| Fibre (g/100 g) | N/A | N/A | N/A | 0.1 | 0.3 | N/A | 0.6 | 0.8 |
| Salt (g/100 g) | 0.13 | 0.12 | 0.3 | 0.1 | 0.1 | 0.2 | 0.04 | 0.16 |
| Calcium (m g/100 g) | N/A | N/A | N/A | 120 | 120 | 120 | N/A | 120 |
| Shelf life | 1–2 m, 5 °C | 1–2 m, 5 °C | 21 d, 5 °C | 9 m, RT | 9 m, RT | 12 m, RT | 9 m, RT | 9 m, RT |
| Heat treatment | UHT | UHT | N/A | UHT | UHT | UHT | UHT | UHT |
| Sample | Z-Average [nm] | |||
|---|---|---|---|---|
| Before Filtration | After Filtration 1 | |||
| Oat 1 | 609.7 bcde | ±40.58 | 232.6 ab | ±4.05 |
| Oat 2 | 742.2 defg | ±27.52 | 261.3 bcd | ±1.77 |
| Oat 3 | 538.6 abcd | ±4.29 | 228.4 ab | ±4.04 |
| Oat 4 | 802.3 efg | ±44.65 | 218.7 a | ±2.49 |
| Oat 5 | 707.8 cdef | ±15.45 | 219.1 ab | ±1.68 |
| Oat 6 | 1432.3 j | ±184.82 | 336.2 ef | ±31.33 |
| Oat 7 | 933.3 gh | ±17.62 | 233.0 ab | ±4.61 |
| Oat 8 | 1983.0 k | ±107.24 | 358.7 f | ±18.90 |
| Oat 9 | 490.3 abd | ±14.59 | 235.5 abc | ±0.81 |
| Oat/hemp | 1070.0 hi | ±46.63 | 208.3 a | ±11.43 |
| Oat/barley | 720.8 defg | ±14.24 | 236.4 abc | ±6.62 |
| Oat/pea | 1201.3 i | ±53.32 | 300.3 de | ±20.09 |
| Almond 1 | 604.7 bcde | ±16.87 | 275.9 cd | ±3.90 |
| Almond 2 | 541.1 abcd | ±15.88 | 284.2 d | ±6.22 |
| Pea | 833.0 fg | ±62.70 | 224.0 ab | ±0.43 |
| Soy 1 | 443.4 ab | ±7.66 | 285.5 d | ±4.04 |
| Soy 2 | 377.1 a | ±4.95 | 225.5 ab | ±3.15 |
| Sample | Furosine | CEL | CML | LAN | Lys | |||||
|---|---|---|---|---|---|---|---|---|---|---|
| Oat 1 | 2.108 f | ±0.378 | 0.051 ef | ±0.014 | 0.440 e | ±0.090 | 0.772 d | ±0.190 | 22.305 abc | ±0.115 |
| Oat 2 | 1.215 de | ±0.140 | 0.038 cde | ±0.006 | 0.270 d | ±0.030 | 0.513 cd | ±0.057 | 25.795 abc | ±0.585 |
| Oat 3 | 0.181 abc | ±0.001 | 0.023 abcd | ±0.001 | 0.107 ab | ±0.001 | 0.211 abc | ±0.003 | 30.386 bc | ±1.617 |
| Oat 4 | 0.496 abc | ±0.014 | 0.032 abcde | ±0.000 | 0.200 bcd | ±0.005 | 0.823 d | ±0.047 | 30.718 bc | ±1.932 |
| Oat 5 | 1.271 e | ±0.049 | 0.047 ef | ±0.003 | 0.251 cd | ±0.019 | 0.282 abc | ±0.014 | 13.670 ab | ±0.073 |
| Oat 6 | 0.004 a | ±0.000 | 0.042 de | ±0.003 | 0.553 e | ±0.029 | 0.349 bc | ±0.028 | 25.411 abc | ±0.165 |
| Oat 7 | 0.232 abc | ±0.007 | 0.014 ab | ±0.000 | 0.107 ab | ±0.002 | 0.224 abc | ±0.008 | 34.786 c | ±0.090 |
| Oat 8 | 0.135 abc | ±0.004 | 0.010 a | ±0.001 | 0.058 ab | ±0.002 | 0.174 ab | ±0.012 | 42.548 cd | ±5.358 |
| Oat 9 | 0.708 cd | ±0.119 | 0.048 ef | ±0.006 | 0.270 d | ±0.048 | 0.785 d | ±0.153 | 37.380 c | ±5.183 |
| Oat/hemp | 0.403 abc | ±0.007 | 0.015 abc | ±0.003 | 0.108 abc | ±0.001 | 0.421 bc | ±0.031 | 20.088 abc | ±0.368 |
| Oat/barley | 0.612 bc | ±0.031 | 0.035 bcde | ±0.002 | 0.201 bcd | ±0.007 | 0.263 abc | ±0.019 | 30.865 bc | ±3.215 |
| Oat/pea | 0.101 abc | ±0.002 | 0.069 fg | ±0.001 | 0.077 ab | ±0.000 | 0.159 ab | ±0.015 | 65.461 de | ±5.578 |
| Almond 1 | 0.039 a | ±0.000 | 0.083 gh | ±0.001 | 0.062 ab | ±0.001 | 0.132 ab | ±0.009 | 33.080 bc | ±2.400 |
| Almond 2 | <LOQ | 0.102 h | ±0.005 | 0.039 ab | ±0.002 | 0.112 ab | ±0.005 | 5.667 a | ±0.547 | |
| Pea | 0.209 abc | ±0.008 | 0.050 ef | ±0.000 | 0.172 bcd | ±0.001 | 0.035 a | ±0.001 | 63.941 e | ±0.736 |
| Soy 1 | 0.008 a | ±0.000 | 0.053 ef | ±0.003 | 0.036 a | ±0.003 | 0.225 abc | ±0.011 | 63.386 de | ±6.030 |
| Soy 2 | 0.255 abc | ±0.012 | 0.065 fg | ±0.003 | 0.129 abcd | ±0.007 | 0.290 abc | ±0.013 | 72.706 e | ±13.150 |
Disclaimer/Publisher’s Note: The statements, opinions and data contained in all publications are solely those of the individual author(s) and contributor(s) and not of MDPI and/or the editor(s). MDPI and/or the editor(s) disclaim responsibility for any injury to people or property resulting from any ideas, methods, instructions or products referred to in the content. |
© 2023 by the authors. Licensee MDPI, Basel, Switzerland. This article is an open access article distributed under the terms and conditions of the Creative Commons Attribution (CC BY) license (https://creativecommons.org/licenses/by/4.0/).
Share and Cite
Roland, I.S.; Aguilera-Toro, M.; Nielsen, S.D.-H.; Poulsen, N.A.; Larsen, L.B. Processing-Induced Markers in Proteins of Commercial Plant-Based Drinks in Relation to Compositional Aspects. Foods 2023, 12, 3282. https://doi.org/10.3390/foods12173282
Roland IS, Aguilera-Toro M, Nielsen SD-H, Poulsen NA, Larsen LB. Processing-Induced Markers in Proteins of Commercial Plant-Based Drinks in Relation to Compositional Aspects. Foods. 2023; 12(17):3282. https://doi.org/10.3390/foods12173282
Chicago/Turabian StyleRoland, Ida Schwartz, Miguel Aguilera-Toro, Søren Drud-Heydary Nielsen, Nina Aagaard Poulsen, and Lotte Bach Larsen. 2023. "Processing-Induced Markers in Proteins of Commercial Plant-Based Drinks in Relation to Compositional Aspects" Foods 12, no. 17: 3282. https://doi.org/10.3390/foods12173282