
Current Application of Advancing Spectroscopy Techniques in Food Analysis: Data Handling with Chemometric Approaches

1
Department of Food and Nutrition, University of Helsinki, 00014 Helsinki, Finland
2
Department of Computer Sciences, University of Helsinki, 00560 Helsinki, Finland
3
Nano and Molecular Systems Research Unit, University of Oulu, 90014 Oulu, Finland
4
Research Unit of Mathematical Sciences, University of Oulu, 90014 Oulu, Finland
5
Biopharmaceutical and Toxicological Analysis Research Team, Laboratory of Pharmacology and Toxicology, Faculty of Medicine and Pharmacy, University Mohammed V in Rabat, Rabat BP 6203, Morocco
6
Shenzhen Hospital, Southern Medical University, Shenzhen 518005, China
7
Chemometrics group, Faculty of Science, University of Copenhagen, Rolighedsvej 26, 1958 Frederiksberg, Denmark
*
Authors to whom correspondence should be addressed.
Foods 2023, 12(14), 2753; https://doi.org/10.3390/foods12142753
Submission received: 13 February 2023
/
Revised: 30 June 2023
/
Accepted: 18 July 2023
/
Published: 19 July 2023
(This article belongs to the Special Issue Advanced Spectroscopy Techniques in Food Analysis: Qualitative and Quantitative Chemometric Approaches)
Abstract
:In today’s era of increased food consumption, consumers have become more demanding in terms of safety and the quality of products they consume. As a result, food authorities are closely monitoring the food industry to ensure that products meet the required standards of quality. The analysis of food properties encompasses various aspects, including chemical and physical descriptions, sensory assessments, authenticity, traceability, processing, crop production, storage conditions, and microbial and contaminant levels. Traditionally, the analysis of food properties has relied on conventional analytical techniques. However, these methods often involve destructive processes, which are laborious, time-consuming, expensive, and environmentally harmful. In contrast, advanced spectroscopic techniques offer a promising alternative. Spectroscopic methods such as hyperspectral and multispectral imaging, NMR, Raman, IR, UV, visible, fluorescence, and X-ray-based methods provide rapid, non-destructive, cost-effective, and environmentally friendly means of food analysis. Nevertheless, interpreting spectroscopy data, whether in the form of signals (fingerprints) or images, can be complex without the assistance of statistical and innovative chemometric approaches. These approaches involve various steps such as pre-processing, exploratory analysis, variable selection, regression, classification, and data integration. They are essential for extracting relevant information and effectively handling the complexity of spectroscopic data. This review aims to address, discuss, and examine recent studies on advanced spectroscopic techniques and chemometric tools in the context of food product applications and analysis trends. Furthermore, it focuses on the practical aspects of spectral data handling, model construction, data interpretation, and the general utilization of statistical and chemometric methods for both qualitative and quantitative analysis. By exploring the advancements in spectroscopic techniques and their integration with chemometric tools, this review provides valuable insights into the potential applications and future directions of these analytical approaches in the food industry. It emphasizes the importance of efficient data handling, model development, and practical implementation of statistical and chemometric methods in the field of food analysis.
1. Introduction
The growing world population is increasing the demand for food in multiple ways, which is leading to a higher demand for safety and quality control of commercialized products. Food can become contaminated by chemicals and physical substances through accidental or intentional means. In recent years, there have been several major cases of food adulteration, highlighting the critical need for controlling product authentication [1]. In one instance, wheat gluten samples were infused with melamine to improve their protein content. In 2008, China experienced a milk scandal where milk was found to be adulterated with melamine, and in 2012, India had a similar scandal where milk was found to be adulterated with detergent, urea, and other substances [2]. Several noteworthy incidents occurred in 2005, including the adulteration of chili powder with dye and the contaminated chili powder in Indian Worcestershire sauce [3]. Gelatin-like chemicals were used in the aquaculture market recently to increase weight in many instances in China. Spices are frequently adulterated with ground material worldwide, particularly in Europe and India [4,5]. These incidents demonstrate the importance of product authentication and quality control in the food industry to protect consumers from harmful and potentially dangerous adulterated products. To gain economic benefit, consumers are at risk of being exposed to serious health threats if food products are adulterated with cheap or chemical materials. This was seen in the Chinese milk scandal, where six infants passed and several thousand were hospitalized. A further case is the contamination of paprika with lead oxide to give it a reddish color, which caused over sixty hospitalized. In recent years, both controlling agencies and the public have grown increasingly concerned about the application of the phthalate plasticizer di-2-ethylhexyl phthalate as a clouding agent in beverages and food [6,7]. In the past decade, both food and feed products have been found to be adulterated. Some of the most adulterated agro-food commodities include honey, edible oils, and spices. Additionally, it has been reported that food products such as milk products, fruit extract, flour, coffee, alcohol, and meats, are being adulterated more frequently [8]. All these examples illustrate a significant global problem that poses a threat to consumers and has prompted food authorities to increase their scrutiny and inspection of the food production chain from farming to consumption.
Food adulteration can occur for various reasons, including complex production processes and long supply chains. Therefore, authentication is crucial for both labeling organizations and industries that must test raw materials and finished products to ensure compliance with specifications [9]. Additionally, confirming the authenticity of the food is essential for maintaining quality and preventing economic fraud. To address authentication challenges and ensure product quality, fast, reliable, and competent analytical methods are needed. The detection of composition properties and contaminants in food and agricultural commodities can be accomplished using a wide variety of physical and chemical methods. These properties, such as density, texture, color, acidity, and solubility, are typically measured by physical or chemical methods. The chemical composition of the samples determines the different chemical techniques involved and used in the identification of components and contamination detection of food commodities [10]. Despite being powerful analytical techniques, separation techniques including liquid-chromatography or gas-chromatography are not always suitable when the workflow is rapid and the experiments are costly, as the samples may be damaged during the study process. Therefore, advanced spectroscopic techniques, along with chemometrics, are now being used for the quality analysis and authentication of a wide range of food products. The main advantages of these techniques are that they are non-damaging, rapid, ecologically friendly, and economical. Spectroscopy data are complex and are typically handled by chemometric approaches for supervised and unsupervised pattern recognition, such as hierarchical cluster analysis (HCA), principal component analysis (PCA), linear discriminant analysis (LDA), soft independent modeling of class analogy (SIMCA), and partial least squares-discriminant analysis (PLS-DA) among others. These tools are mainly used to assess classes, such as attributing samples as either adulterated/unadulterated or authentic/not authentic. In addition to the qualitative chemometric approaches, there are also quantitative approaches including multivariate calibration tools, including principal component regression (PCR), and partial least squares (PLS) [11,12]. These tools are mainly used for quantitative parameters to quantify the number of adulterants and fatty acids content, based on data generated from spectroscopic techniques.
The focus of this review is to provide an overview of recent studies on advanced spectroscopy techniques and chemometric methods that are widely utilized in food evaluation, safety assessment, quality analysis, and manufacturing processes. The review aims to emphasize the advantages of these techniques over traditional analytical methods and underscore the importance of efficient data handling, model construction, and practical implementation of statistical and chemometric approaches in the field of food analysis. Additionally, the review aims to discuss the potential applications and future directions of these techniques in the food industry, while addressing the challenges associated with traditional analytical methods, including their destructiveness, laborious nature, time consumption, cost, and negative environmental impact.
2. Chemometric Approaches in Spectroscopy Data
The advancement of modern instruments, represented by spectroscopy techniques, has accelerated the development of the food industry and food research in recent decades. As a result, the data available to food analysts has become increasingly complex. Not only does the amount of data tend to be large, but the dimensionality of the data can also increase dramatically. Effectively analyzing and managing large amounts of spectroscopy data from food production, food processing, and food research is both a practical and theoretical issue. Chemometrics, which combines the power of statistics and mathematics for use by chemists, provides a valuable solution to the challenging analytical issues in food spectroscopy analysis. The general framework and pipeline of advanced spectroscopic techniques coupled with chemometric approaches applied in food analysis is illustrated in Figure 1. Advanced spectroscopic techniques combined with chemometric approaches are of great significance in food analysis. These techniques provide fast, precise, and non-destructive measurements of diverse food properties (Figure 1). Their integration offers multiple advantages, such as rapid analysis, non-destructive measurement, multivariate data analysis, quality control, process optimization, and allergen detection. These advancements contribute significantly to enhancing food safety, ensuring quality assurance, and safeguarding consumer protection. On the other hand, several chemometric tools have been developed and validated to be powerful in terms of information extraction, multivariate relationship analysis, prediction, and discrimination analysis, among others, in food spectroscopy data analytics. A roadmap workflow example in Figure 2 for using chemometric tools to handle spectral data in different scenarios for either qualitative or quantitative purposes. However, the interpretation of spectroscopy data, be it in the form of signals or images, can be intricate without the aid of statistical and innovative chemometric approaches. These approaches encompass crucial steps, including pre-processing, exploratory analysis, variable selection, regression, classification, and data integration. By employing these methods, researchers can extract pertinent information and effectively manage the complexities inherent in spectroscopic data.
2.1. Pre-Processing Techniques
Pre-processing plays a crucial role in spectral data analysis as it prepares the data for further analysis and modeling. Various pre-processing techniques are employed to address common challenges such as scattering correction, baseline correction, peak shift alignment, denoising, and handling missing values. Effective pre-processing is essential for enhancing the performance of models by eliminating artifacts from the data and reducing fitting errors. By applying appropriate pre-processing methods, the spectral data becomes more reliable and conducive to accurate analysis and interpretation. In the context of missing data, several chemometric tools have been developed to address this issue [13]. For instance, maximum likelihood PCA-based imputation [14], as well as data regression methods like KDR-PLSR (kernel density-ratio-based partial least squares regression) and KDR-PCR (kernel density-ratio-based principal components regression) [14], have recently emerged as highly effective approaches for handling missing data. For multi-way data, such as fluorescence data, practical solutions for missing data imputation include alternating least squares with single imputation, Parallel Factor (PARAFAC) analysis, and the Levenberg-Marquardt method [15,16]. These techniques offer reliable and efficient means to impute missing data, enabling more comprehensive and accurate analyses of complex datasets. In the context of scatter correction, Multiplicative Scatter Correction (MSC) [17], Standard Normal Variate (SNV) [18], and other normalization methods are widely employed chemometrics techniques. These methods effectively address the issue of scatter in spectral data. Additionally, advancements in scatter correction tools have led to the development of new versions and improved approaches [17]. To tackle baseline drift problems in spectral data, adaptive reweighing schemes for polynomial fitting and penalized least squares [19], as well as Tikhonov regularization [20], have proven successful in removing unwanted baseline variations. These techniques offer reliable means to address baseline drift and enhance the accuracy of subsequent analysis.
In order to mitigate peak shift problems, several methods have been reported to be useful. Automatic time shift alignment (ATSA) [21], coherent point drift peak alignment [22], Global peak alignment with point matching algorithm [23], and PARAFAC Applied to Shift Invariant Amplitude Spectra (PARASIAS) [24] are among the techniques that have demonstrated effectiveness in aligning peaks accurately despite shifts or distortions. Derivative calculation of spectral data is a promising solution to some different artefacts problems especially when it is combined with other techniques, e.g., combining the first derivative and simple spectral ratio can correct both the additive effects and multiplicative effects [25].
Overall, the utilization of these advanced techniques in scatter correction, baseline drift correction, and peak shift alignment significantly improve the quality and reliability of spectral data, facilitating more robust and accurate analyses in various chemometric applications.
2.2. Variable Selection Tools
Variable selection is a valuable technique in spectral data analysis as it enhances model performance, provides better interpretations, and reduces measurement costs [26]. Several popular methods are commonly used in chemometrics for spectral data analysis, including model factors and assessment, model-based feature importance statistics, interval partial least squares regression (iPLS) [27], and genetic algorithm (GA) [28]. When considering model parameters, variables with lower loadings and regression coefficients may not be as important as those with higher values. In the case of model-based variable importance statistics, variables such as variables important for projection (VIP) [29], which measures the contribution of a variable in describing the data, and selectivity ratios [30], which evaluate the predictive performance of variables, are commonly used in chemometrics analysis of spectral data. These statistics help identify the most influential variables in the model. The iPLS is a variable selection method that operates by selecting windows of variables, making the selection of window size a critical aspect of iPLS. On the other hand, GA performs variable selection by simulating the process of natural selection, estimating models involving patterns in variable generation [26]. However, GA requires more complex parameter settings compared to other variable selection methods. Regardless of the specific variable selection method employed, it is important to remember that validation is always necessary to avoid erroneous conclusions resulting from overfitting. Validation procedures help ensure the robustness and reliability of the selected variables and the overall model performance.
In summary, the utilization of variable selection techniques in spectral data analysis offers improved model performance, interpretability, and cost-effectiveness. Methods such as iPLS, GA, and model-based feature importance statistics contribute to selecting relevant variables and enhancing the accuracy and reliability of chemometric analyses. Validation procedures are crucial to validate the selected variables and mitigate the risk of overfitting.
2.3. Exploratory and Clustering Tools
Exploratory data analysis is a critical component of food spectroscopy data analysis, serving as a means to understand descriptive statistical characteristics and gain multivariate insights from complex datasets. A range of exploratory analysis tools, including both graphical techniques and quantitative dimensionality reduction techniques, are widely utilized in the analysis of food spectroscopy data. Graphical techniques such as box plots, histograms, and scatter plots are valuable for visualizing the distribution, variation, and presence of missing values in samples. These tools are commonly employed in the analysis of metabolite data obtained from mass spectroscopy [31]. By utilizing graphical tools, researchers can effectively explore the properties and patterns present within the data.
Principal Component Analysis (PCA) is a representative dimensionality reduction technique and one of the most popular tools employed in food spectroscopy data analysis. The earliest invention of PCA dates back to the early 20th century [32]. However, this first invention focused more on the modeling property and explained the variation of PCA. However, it was later expanded upon by Hotelling, who introduced the concept of PCA as a linear combination of variables [33]. Nowadays, PCA is now widely recognized for its ability to reveal complex relationships within multivariate data, making it a powerful tool for obtaining an overview of complex datasets. It is frequently used to explore relationships between samples and variables, identify outliers, discover and determine patterns (groups), as well as generating new hypotheses [34]. Moreover, PCA can also be utilized for conducting clustering analysis. By examining the relationships between samples, PCA can effectively divide samples with different statistical characteristics into distinct groups. In addition to PCA, Hierarchical Cluster Analysis (HCA) [35] and k-means clustering analysis [36] are widely used as clustering analysis tools in food spectroscopy data analysis. In the format of a dendrogram, HCA constructs a dendrogram that hierarchically divides samples into groups based on their similarities, facilitating the identification of distinct clusters. On the other hand, K-means clustering analysis partitions objects into k-clusters, with each object belonging to the group with the closest average.
Overall, exploratory data analysis, comprising graphical techniques, dimensionality reduction methods like PCA, and clustering analysis tools such as HCA and k-means, enables researchers to gain insights into complex food spectroscopy datasets. These approaches facilitate the understanding of data properties, identification of patterns, and generation of hypotheses, ultimately advancing the knowledge and interpretation of food analysis.
2.4. Regression and Prediction Tools
Prediction models are essential in food spectroscopy data analysis, as they enable the successful prediction of chemical and physical properties, supporting green food research and the sustainable food industry. Partial least squares (PLS) regression is a standard chemometric method used for prediction analysis of spectral data [37]. By projecting the predictor variables and response variables onto a new space, PLS seeks to uncover the underlying relationship between X and Y matrices by modeling the covariance structures in this new space [38]. PLS has the added advantage of effectively handling the collinearity problem often encountered in spectral data [39]. In addition to PLS, N-way PLS [40] is a powerful tool for handling multi-way spectral data and the N-way PLS model is advantageous in well modeling performance, robustness to noise, stabilized solution, and improved prediction capabilities [41] specifically for multi-way spectral data. Various other regression methods, such as support vector machine (SVM) regression artificial neural network (ANN) and multiple linear regression (MLR), are also employed in spectral data analysis [42]. MLR is a linear regression method that establishes the relationship between independent variables and dependent variables by fitting a linear model. However, MLR has strict assumptions that need to be met, including constant variance of the residuals, multivariate normality, and linear assumption [43], which can limit its applications in certain cases. In contrast, SVM regression and ANN are often utilized for non-linear prediction analysis in spectral data. For instance, ANN can capture highly non-linear relationships between inputs and outputs, enabling the prediction of an output variable based on input data [44]. The non-linear models such as SVM and ANN can offer attractive predictive performance in many applications [42], but the issue of overfitting must be carefully addressed. Therefore, validation is a crucial step in non-linear prediction analysis to ensure the reliability and generalization of the models when applied to spectral data.
In short, prediction models, including PLS regression, N-way PLS, SVM regression, ANN, and MLR, are valuable tools in food spectroscopy data analysis. These models enable the prediction of chemical and physical properties, and their selection depends on the nature of the data, linearity assumptions, and the need for handling collinearity or capturing non-linear relationships. Validation procedures are essential to evaluate and validate the performance of these models, ensuring their accuracy and robustness in spectral data analysis.
2.5. Classification Tools
Classification is an essential task in food analysis, aimed at identifying and assigning categories to samples in order to detect pattern differences and enable subsequent analysis. Various chemometrics techniques are employed for the classification analysis in food analysis, including tree-based methods, regression-based methods, discriminant analysis, and neural networks, among others. One popularly used classification tool in food analysis is partial least squares-discriminant analysis (PLS-DA) [45]. PLS-DA is a discrimination method based on PLS regression but incorporates an additional classification step based on the thresholding of predicted y-values. Another method, the soft independent modelling class analogy (SIMCA) method combines the concept of PCA in performing classification analysis [46]. SIMCA utilizes the residuals from disjoint PCA models to assign samples to one or several classes, with the critical distance being based on the F-distribution [47]. In addition to PLS-DA and SIMCA models, Linear Discriminant Analysis (LDA) [48] and SVM [49] are also frequently used for classification analysis in food analysis. LDA models the differences between groups by finding a linear combination of features and projecting them from a higher dimensional space into a lower dimensional space, effectively separating them into distinct classes. On the other hand, SVM can also be used for non-linear classification analysis. In the case of non-linear classification, SVM employs a kernel function to transform the data from a non-linear space to a linear space, enabling the classification task in a high-dimensional space. However, it’s important to note that performing SVM classification on large spectroscopy datasets may be time-consuming due to the training and kernel computation requirements.
In brief, classification is a fundamental data analysis task in food analysis, and several chemometric techniques such as PLS-DA, SIMCA, LDA, and SVM are commonly utilized for this purpose. These methods enable the identification of patterns and the assignment of samples to different categories, facilitating subsequent analysis and decision-making in the field of food analysis. It’s important to consider the nature of the data, linear or non-linear relationships, and computational considerations when selecting the appropriate classification method for a given analysis.
2.6. Mixture Analysis Tools
Mixture analysis is a critical area of focus in food analysis, driven by advancements in omics technologies and the demand for improved production processes in the food industry. A wide range of chemometric tools is employed to analyze mixtures in food, encompassing both two-way analytical methods and multi-way analytical methods.
Multivariate curve resolution-alternating least squares (MCR-ALS) is one of the representative two-way chemometrics tools used for food mixture analysis. It allows for the extraction of chemically meaningful bilinear models from a data matrix that includes mixed measurements, with an additive model structure [50]. Basically, MCR-ALS decomposes the mixture data matrix into two matrices and a residual matrix. For instance, in the case of high-performance liquid chromatography with diode array detection (HPLC-DAD) data, MCR-ALS separates the data into a matrix containing elution profiles of all components, another matrix containing the corresponding pure spectra, and a residual matrix of the same dimensions as the raw data, capturing unexplained variations. Although MCR-ALS encounters challenges such as permutation ambiguity, intensity ambiguity, and rotational ambiguity, these issues can be partially addressed through specific strategies [51]. Parallel Factor Analysis (PARAFAC) [52] and Parallel Factor Analysis2 (PARAFAC2) [53] models are widely used multi-way models for complex mixture analysis. These models generalize the bilinear models to handle multi-way data. Instead of generating a set of bilinear components, PARAFAC and PARAFAC2 decompose the high-order tensor data into a set of trilinear components (in the case of three-way data) in which each vector represents the information from each mode. Due to the unique advantages of PARAFAC and PARAFAC2 models [54], they are powerful for decomposing the pure chemical from the multi-way fluorescence and mass spectroscopy data. The main difference between PARAFAC and PARAFAC2 models is that the strict multilinear assumption in the PARAFAC model is relaxed in PARAFAC2 model, meaning that the profiles for each slab in the multi-way data is not required to be the same in PARAFAC2 model if the cross products of the components keep the same [55].
In outline, mixture analysis holds significant importance in food analysis, and a range of chemometric tools are applied for this purpose. MCR-ALS is a powerful two-way method for mixture analysis, while PARAFAC and PARAFAC2 models are widely used in multi-way analysis of complex mixtures. These methods enable the extraction of chemically meaningful information from mixture data, aiding in the identification and characterization of individual components within complex food matrices. While certain challenges exist, strategies have been developed to address them and enhance the reliability and applicability of these chemometric tools in mixture analysis.
In this section, a general overview was provided regarding the various chemometric tools utilized for handling spectroscopy data. These tools encompass pre-processing techniques, exploratory analysis methods, variable selection approaches, regression models, classification algorithms, and mixture analysis methodologies. However, the specific methodologies and algorithms underlying each technique were not thoroughly explored, nor were the advantages or disadvantages of individual approaches discussed in detail.
3. Advanced Spectroscopy Techniques with Chemometrics in Food Analysis
Advanced spectroscopy techniques paired with chemometric tools are crucial in analyzing food by providing a fast, non-destructive, and efficient means of obtaining detailed information about food samples. This information can be used to improve the quality, safety, and authenticity of food products. Table 1 summarizes recent applications of advanced spectroscopic techniques and chemometric approaches for quantitative analysis in food whereas a summary of recent applications of advanced spectroscopic techniques linked to chemometric approaches for qualitative analysis in food can be found in Table 2. In this section, the focus was on discussing the most notable studies conducted on advanced spectroscopic techniques, including X-ray-based methods, hyperspectral and multispectral imaging, NMR, Raman, IR, UV, visible, fluorescence, and portable techniques. These studies were examined with respect to their applications, both qualitative and quantitative, and their overall utility in the field of food analysis.
3.1. X-ray-Fluorescence-Based Methods
Energy dispersive X-ray spectroscopy (EDXRF) is a technique commonly used for determining mineral content in food samples. Additionally, its association with the unsupervised and supervised data analysis tools demonstrated its efficiency to deal with the challenges of food analysis. The scope of this section is to discuss the application and usefulness of X-ray-based spectroscopic techniques in combination with chemometric tools for qualitative and quantitative analysis of various food samples.
For example, [57] EDXRF has been applied with PLS Regression for analyzing the micronutrient zinc in biofortified banana samples. This method showed good results mainly on low limits of detection (LOD) and quantification (LOQ). Another research work, conducted by Gamela et al. [56] used the same combination of EDXRF and PLS to determine not only zinc but also the contents of copper and strontium in cocoa bean samples. The study proved satisfactory results through the evaluation of developed PLS models in terms of the same criteria. Additionally, this study has been extended and proved the ability of EDXRF to be fused with Laser Induced Breakdown Spectroscopy (LIBS) to determine the micronutrient potassium in cocoa beans using the supervised technique of multivariate calibration. This fusion showed besides the satisfactory results an advantage to minimize the matrix effect induced by samples of cocoa beans.
The combination of Energy-Dispersive X-ray Fluorescence (EDXRF) and chemometric tools have been used for qualitative purposes too. Galvan et al. [113] carried out an analysis by EDXRF under two measurement conditions, to classify the geographical area of two food species and also according to the production mode by PLS-DA. These food species were tomato and sweet pepper samples Based on the good results of classification EDXRF was considered an excellent technique for authentication of plant-based food products based on the mineral elements K, Ca, Mn, and Fe. Another study for the same qualitative purpose [115] carried out by the association of X-ray Fluorescence (XRF) to (PCA) permitted to identify elements like Cl, K, Ca, Fe, Br, Cl, Rb and Sr which establish a clear fingerprint pattern of the tomato. Similarly, other work applied several chemometrics tools for the discrimination of Italian Extra Virgin Olive Oil (EVOO) geo-markers through the analysis of mineral constituents using EDXRF and associated with PCA and SIMCA [114]. Besides EDXRF and XRF, Total-Reflection X-ray Fluorescence was also employed for food screening [172]. For example, different wine samples from two different geographical regions of Croatia were discriminated against based on the analysis of thirteen metal contents through the association of TXRF with PCA, cluster analysis, and Linear Discriminant Analysis (LDA). Thanks mainly to PCA, elements such as K, Mn, Ba, and Ni were determined as the most relevant to characterize between different origins of wines [117]. TXRF has already been associated with both PCA to obtain the clustering of the bean seeds according to their geographical origin, then it was coupled to PLS-DA for classification purposes [116]. Specific studies that utilize EDXRF in combination with chemometric tools for qualitative and quantitative analysis of various food samples are highlighted. The end points emphasize EDXRF’s efficiency in determining mineral content, addressing challenges in food analysis, and its application in food authentication and geographical classification.
XRF-based methods are commonly used in food quality control and analysis due to their non-invasive and time-efficient nature. They can simultaneously detect and quantify trace elements and contaminants in food. However, they have limitations such as limited sensitivity, making them unsuitable for some applications, and being a surface analysis technique, they may not provide information on deeper layers of the sample. The presence of other compounds in the food matrix may also interfere with the analysis, necessitating calibration and standardization to minimize such effects.
3.2. Hyperspectral and Multispectral Imaging
In contrast to traditional spectroscopy, hyperspectral imaging affords continuous and high-resolution narrow-band spectral data linked to both physical and chemical sample composition [173]. With The HSI, an object’s spectral and spatial information can be retrieved simultaneously by integrating spectroscopic and imaging techniques. This technique has immense potential and has been reported in the detection of various food adulteration, especially when it is associated with chemometric approaches for quantitative purposes. The scope of the proposed paragraph is to discuss the application and advantages of hyperspectral and multispectral imaging combined with chemometric tools in detecting food adulteration, assessing food composition, monitoring food quality, and classifying different food products.
Various studies have been conducted recently on wheat flour to estimate its different contents [174]. Unlike conventional methods, HSI is a reagent-free, non-invasive [175]. One of the special HSI characteristics is to exhibit metabolic transformations, making it useful to assess food composition. A significant amount of recent work has been focused on the application of HSI to various food and agricultural products and animal products. For instance, hyperspectral imaging was used within 400–800 nm to develop a method for analyzing impurities of mites in wheat flour through the supervised chemometric tool of ANN [119]. Benzoyl peroxide, which can also be found as a bleaching agent in wheat [85], was investigated using shortwave infrared (SWIR) HSI and PLS regression [65]. The estimation of talcum content has also been done using hyperspectral imaging and the SNV-PLS model, which proved to estimate adequately the talcum content [64]. In terms of food analyzed by HSI, research by Al-Sarayreh et al. investigated the efficiency of hyperspectral imaging systems to detect meat adulteration, depending on its storage conditions. This analysis proved efficiently the advantage of CNN compared to SVM for this analysis purpose [120]. In addition to wheat and meat, HSI has also been applied to other food samples such as cheese. Priyashantha et al. developed and evaluated a predictive model based on coupling the NIR-HS imaging technique and PLS for determining the maturity state of cheese. The model was then applied on a pixel-wise basis, producing prediction images, and allowing for the determination of how and where the maturity spread in the cheese [58]. On the same food product, PLS and Monte Carlo Cross Validation (MCCV) were applied to HSI to detect the main wavelengths of fat and microbial transglutaminase (mTG), which is responsible for the color and yield of the cheese. Additionally, this study mentioned the possibility of using HSI to inspect the cheese remotely through its transparent foil [59]. Potato is another food sample that has recently started to be useful for monitoring its quality with HSI. Lu et al. assessed the impact of storage times on the evolution of solanine content in potatoes by using HSI in the spectral region of 500–1000 nm and support vector regression (SVR) and then allowed estimating the edibility of the potatoes [60]. Besides solanine content, the color is another indicator, that is also considered as a parameter to judge the quality of potatoes. Xiao et al. combined HSI in the region of 477–947 nm and used and compare two supervised tools: (PLS) and (LS-SVM) for predicting this last parameter [61]. The sweet potato has been subjected to HSI analysis. Tian et al. investigated how the moisture and total anthocyanin contents of potato samples under various drying conditions, by using HSI in the region of 400–1000 nm and PLS. The obtained results of this method showed a low prediction error and a high R2p [62]. The use of HSI has been shown to be useful in predicting specific parameters that characterize food products. Recently, Li et al. analyzed the quality of plum fruit based on color and soluble solid content using HSI and PLSR and showed how short-wave infrared (SWIR) hyperspectral imaging can predict soluble solid content, [63]. Sun et al. monitored the quality of melon through its indicators as sweetness and hardness by associating NIR hyperspectral imaging system to PLSR [66].
Besides the quantitative advantages of HSI that have been cited, HSI has also been widely used for qualitative purposes. HSI in the spectral domain has been applied to detect chilling injury in agri-food products, which could not be achieved without subjecting HSI to multivariate data analysis. For example, Cen et al. employed HSI in reflectance (500–675 nm) and transmittance (675–1000 nm) modes with supervised classification tools for the detection of chilling injury in cucumbers [124]. Tsouvaltzis et al. evaluated the chilling injury in eggplant fruit by coupling visible and Near-Infrared (NIR) HSI to classification tools such as PLS-DA, SVM, and KNN to classify eggplant fruit according to storage temperature [131]. Recently, Babellahi et al. demonstrated the convenience of HSI with PLS-DA to discriminate between cold-stored green peppers that can be impacted by chilling injury and fresh ones [123]. Another example applied to fruits; peaches might have chill damage during cold storage which Pan et al. associated HSI to Artificial Neural Network (ANN) to differentiate normal peaches from chill-damaged ones [121]. Sun et al. assessed the classification of peaches based on the chilling injury by PLS-DA, SVM, and ANN with Spectral Angle Mapper (SAM) which achieved the best classification performances [122]. Related to the application of HSI on peaches, Li et al. investigated and compared Long-Wavelength-Near-Infrared (LW-NIR) and Short-Wavelength-Near-Infrared (SW-NIR) hyperspectral imaging by associating them with PCA and the approach of watershed segmentation for discriminating bruised from healthy peaches [118]. This study clearly proved the advantage of SW-NIR in detecting early bruises in peaches. Moreover, bruises have also been identified in blueberries samples by SWIR hyperspectral image and the developed models based on two approaches: considering Least Squares-Support Vector Machine (LS-SVM) with full spectra and optimum selected wavelengths by (CARS) (CARS-LS-SVM model) [126]. There are many factors that can lead to bruising food items. For example, Hyperspectral imaging technology applied in the region 400–1000 nm, was used with PLS-DA to classify bruised tomatoes that were caused by falling damage, detection times, falling heights or fruit sizes [127]. Besides fruits and vegetables, HSI with chemometric tools has shown its convenience in the qualitative analysis of wheat. Zhao et al. developed an approach based on a hybrid CNN model with hyperspectral imaging technology to classify different varieties of wheat seed [129,176]. In addition to wheat seeds, maize seeds were classified through the association of HSI with the chemometric approach of Radial Basis Function Neural Network (RBFNN) [130]. Soares et al. also presented a new strategy for fast and non-destructive classification of cotton, based mainly on coupling NIR-HSI images to PLS-DA. The results of this method showed good accuracy in the classification of test samples, with correct classification rates [125]. The endpoints of this section are to emphasize the potential of hyperspectral and multispectral imaging in providing continuous and high-resolution spectral data linked to physical and chemical composition, their non-invasive and reagent-free nature, and their ability to analyze various food samples.
Hyperspectral and multispectral imaging are valuable tools for food quality control and analysis, with advantages and limitations to consider. These imaging techniques offer non-destructive analysis and high spatial resolution for detailed surface analysis, simultaneous detection of multiple analytes, and real-time analysis for efficient quality control. However, hyperspectral, and multispectral imaging equipment can be expensive, have limited penetration for internal composition analysis, may lack sensitivity for detecting low analyte levels, and require complex image processing and specialized expertise for data analysis.
3.3. Infrared Spectroscopy
Infrared including (NIR) and (MIR) are ones of the conventional spectroscopy that have been usually used with many multivariate data analysis tools in food quantitative analysis. The scope of the proposed paragraph is to discuss the application and benefits of infrared spectroscopy with chemometrics, in quantitative and qualitative analysis of food components, such as carbohydrates, proteins, fats, and moisture content, as well as the determination of functional groups, carbon, and nitrogen.
MIR is responsible mainly for detecting functional groups as well as carbon and nitrogen, whereas NIR is used for determining carbohydrates, proteins, fats, and moisture content in various foods [177]. However, the method is not sensitive enough for samples containing just small amounts of target components. The fundamental vibrations occur when absorbed in the NIR [178]. Wang et al. combined NIR PLSR to estimate the content of potato flour in steamed bread [67]. Recently, the same association of NIR with PLS regression was applied to wheat flour samples to estimate the quantity of low-content talcum. In this study, several chemometrics were applied with PLS together to select the effective feature as genetic algorithm and elastic net, thus improving the capacity of the PLS model [68]. In addition to talcum, zearalenone might have an impact on the quality and safety of wheat grains. Recently, a study was carried out to determine zearalenone in wheat by NIR spectroscopy and (SVM) model. The results were significantly improved after the application of a variable selection approach called least absolute shrinkage and selection operator (LASSO) to extract useful spectral regions of NIR. In contrast to the contents that can have an impact on wheat, the determination of valuable contents has been featured in many recent research works [73]. Kamboj et al. predicted quality parameters mainly protein and carbohydrate of wheat content that has been stored at different temperatures using NIR Spectroscopy (NIRS) with PLS, MLR, and SVM [70]. Additionally, the fatty acid value is also considered an important indicator of the quality of wheat flour, particularly during storage. Therefore, Jiang et al. demonstrated the feasibility of using portable NIR spectroscopy in conjunction with appropriate chemometric methods to achieve quantitative determination of fatty acid values in wheat flour during storage. Jiang et al. used a method called variable combination population analysis (VCPA) in addition to PLS to improve NIR spectral characteristic wavelengths [72]. In addition to the chemometric tools that were cited and used for quantitative purposes, MCR-ALS is one of the chemometric tools that is combined with FT-NIR spectroscopy to estimate certain characteristics of food samples. For instance, an assessment of the combination of multivariate tools, including PLS regression and MCR-ALS, was used to predict antioxidant activity from clove and pomegranate extracts. The results showed that MCR-ALS with FT-NIR stood out among PLS with high R2 and low RMSEP [74]. Another application of PLS and MCR associated with FT-NIR was used successfully to estimate peanut oil adulterants, [75]. Castro et al. also proved the efficiency of coupling FT-NIR with MCR-ALS for the quantitative purpose of four adulterants at low levels in a complex mixture of saffron, including onion, calendula, pomegranate, and turmeric [76]. In terms of determining adulterants in saffron, PLS-R was applied to FT-NIR data of saffron to estimate lotus stamens and corn stigmas. This study proved the efficiency of combining PLS with the variable selection approach of competitive adaptive reweighted sampling (CARS) showing good results [77]. Additionally, crocin I and II were analyzed using near-infrared spectroscopy and chemometrics. Crocin I and II are considered the most important indicators of the quality and commercial value of saffron [179]. Le et al. used FT-NIR and PLS to determine these two contents in saffron with low RMSECV [78].
Many studies have shown how MIR and NIR spectroscopy are efficient for the qualitative analysis of different food varieties comprised for example identification, classification, and authentication, based on, for example, country of origin. For instance, Liang et al. used NIR spectroscopy appropriately for the detection of zebra chip disease using Canonical Discriminant Analysis with a low classification error rate [71]. Discriminative analysis was applied to durum wheat to determine if they were contaminated by ochratoxin by combining FT-IR and FT-NIR with PLS-DA and PCA-LDA. In this study, FT-IR and FT-NIR were convenient spectroscopic techniques for discrimination purposes [133]. PLS-DA was compared to other classification tools such as HCA, SVM, and ANN to identify and classify Panax notoginseng with its adulterants. The classification purpose of this work was achieved by both PLS-DA and SVM with 100% classification accuracy [79]. PLS-DA showed its efficiency in detecting the freshness of rice based on storage time using FT-NIR with an accuracy of 96%, whereas the application of KNN achieved an accuracy of 100% [136]. In relation to the analysis of rice by NIR, L.-H. Xie et al. led a discrimination of two kinds of rice, waxy, which contains very low apparent amylose content, and non-waxy rice. The developed PLS-DA model allowed the recognition of these two types of rice with 100% accuracy [139]. Detecting fake eggs from authentic ones is another example that proves the efficiency of FT-IR and chemometrics in this field of food analysis. Joshi et al. showed how PLS-DA and SVM achieved a good classification of 100% [81]. The authenticity of the native was subjected to FT-NIR analysis by Chen et al. who proved the efficiency of using Data-Driven Class Modeling (DD-SIMCA) as an alternative tool for this classification [134]. The end points of the paragraph are to emphasize the effectiveness of infrared spectroscopy in estimating the content of target components in food samples, such as potato flour, talcum, zearalenone, protein, carbohydrate, fatty acid values, and antioxidant activity. The paragraph also mentioned the successful application of chemometric approaches in enhancing the accuracy and reliability of quantitative analysis using NIR and MIR spectroscopy.
Overall, infrared spectroscopy is a powerful and versatile tool for food quality control and analysis. However, limitations such as limited penetration, sample homogeneity requirements, calibration requirements, complexity of data analysis, and interference from other components should be taken into consideration when using this technique.
3.4. Raman Spectroscopy
Raman spectroscopy is a vibration spectroscopy technique that is based on monochromatic light diffusion. It involves the excitation of a sample by collisions with photons, which causes the sample to reach an unstable state of virtual energy. The scope of the proposed paragraph is to discuss the application of Raman spectroscopy in food analysis, both qualitatively and quantitatively.
Raman spectroscopy was carried out for the determination of fat content in various food samples such as milk and meat. Heterogeneous foods have recently been detected chemically with Raman microscopy [180]. This combination is used qualitatively and quantitatively to evaluate food value. Many organic components are detected and identified based on the absorption curves. Microscopic food species can be analyzed too. Raman microscopy has been carried out to determine the main composition of wheat and to detect protein content changes during milling [181,182]. Raman spectroscopy detects changes in protein secondary structure, conformational changes in lipid-binding proteins.
Based on the Raman spectrum, it is possible to estimate the relative concentration of food contents. For instance, a recent study aimed to determine starch using Raman spectroscopy and a linear regression model for a specific band, and PLS regression for a specific spectral region [183], which confirmed the efficiency of association of FT-Raman to PLS for the estimation of gluten content in flour [184]. Carotenoids have been determined in tomatoes by Raman spectroscopy and PLS regression and proved low prediction error [88]. The main characteristic of Raman spectroscopy is that it can directly measure aqueous solutions because of the low effect of water, and even the sample preparation of liquids for Raman analysis is simple, which can be considered an advantage to estimating the contents in food liquids such as milk [185]. Whey is one of the contents that has been quantified accurately in the milk [89]. In addition to whey, macronutrients such as fat, lactose, and protein have been successfully quantified in commercial yoghurt samples using FT-Raman spectroscopy and PLS models [90]. In a recent study, milk adulterants such as sodium bicarbonate, maltodextrin, and whey were also analyzed using Raman spectroscopy and the PLS chemometric tool, with a low detection limit [91]. A handheld Raman spectrometer has also been applied to quantify lard in adulterated butter, another milk derivative, through PLS [186]. Richardson et al. demonstrated how Raman spectroscopy is able with PLS to detect coconut water adulteration [112]. In a recent study, various variable selection approaches were tested on surface-enhanced Raman scattering spectra of rice, used with PLS for quantifying the target residue analyte of chlorpyrifos [109].
As it has shown its relevance for quantitation, Raman spectroscopy has proven its efficiency with chemometric tools in many recent studies. For example, Robert et al. built a classification model using SVM and PLS-DA to discriminate lamb meat from beef meat despite the similar chemical composition of these two species [147]. Hai Chao et al. classified duck meat according to the residues of testosterone propionate and testosterone nandrolone using Raman Spectroscopy and Support Vector Classification (SVC) which shows a classification rate of 100% for the test set [86]. Other residues that have an impact on duck meat and have been subjected to analysis by means of Raman spectroscopy and chemometrics are sulfonamides, comprised of sulfadimidine and sulphapyridine [187]. A recent research work used a support vector classification on Raman Spectroscopic data to classify duck meat into four groups, which are as follows: samples free of residues, samples containing one of the two residues, and samples containing both residues [87]. Another mode of Raman spectroscopy called Spatially Offset Raman Spectroscopy, which allows to measure the chemical compounds under the surface of meat tissues [188]. Besides that, a study has also proven that the use of Raman spectroscopy in combination with the SVM method can discriminate rice samples according to their regions with high-rate accuracy [148]. Raman was applied to differentiate four categories of milk species of cow, buffalo, goat, and human. Thus, Principal Component Analysis (PCA) besides Random Forest (RF) was applied on Raman data to highlight and characterize the Raman spectra of different milk samples with high accuracy of 93.7% [144]. In addition to benchtop Raman, Handheld Raman spectroscopic devices have shown their efficiency using SIMCA to classify milk samples from adulterated ones [189]. In addition to milk and its derivative samples, PLS-DA was employed with Raman to accurately classify a milk derivative of cheese whether it was adulterated by starch or not [93]. Related to handheld Raman, Aykas, et al. succeeded in seeking to characterize commercial honey by combining handheld Raman equipment and SIMCA [190]. A recent research work monitors according to a new method the adulteration in cassava starch, by means of Raman spectroscopy and supervised tool One-Class Modelling (OC-SVM) which proved its higher accuracy compared to the SIMCA, allowing for the discrimination of samples [191]. Discriminant analysis by PLS-DA of coffee genotypes by Raman spectroscopy based on two main contents, kahweol and fatty acids, has shown how Raman with chemometrics was more effective compared to sensorial analysis [192]. Sha et al. combined Raman with PCA, HCA, and SVM for feature extraction to improve the efficiency of identification of rice varieties [176]. For oil samples, Jiménez-Carvelo et al. used chemometrics for the classification and characterization of pure olive oil from adulterated using Raman spectroscopy in addition to NIR by employing classification models. While PCA was used to reduce the features, other supervised techniques were applied to for the discrimination goal [193]. Raman analysis was also employed to discriminate waste cooking oil from edible vegetable oil. Thanks to PCA, signals at 869, 969, 1302, and 1080 cm−1 were found to be the most important features to differentiate between these two types of oils. In addition, PCA demonstrated its ability to separate adulterated from pure oils when the adulteration proportions reached 10% and 20% [194]. The endpoints of this part include the successful application of Raman spectroscopy in estimating the content of specific food components and the detection and classification of various residues and adulterants in food samples.
Finally, Raman spectroscopy is a valuable method for analyzing and controlling the quality of food, offering several advantages such as non-destructiveness, molecular specificity, sensitivity, minimal sample preparation, and high spatial resolution. However, when using this technique, some limitations must be considered, including its limited penetration depth, susceptibility to fluorescence interference, equipment cost, complexity of data analysis, and sensitivity to water.
3.5. NMR Analysis
Nuclear magnetic resonance (NMR) is a spectroscopic technique used to determine the molecular structure and physical properties of substances, and efficiently used to ensure the quality of different varieties of food samples [195]. The scope of the proposed paragraph is to discuss the application of NMR spectroscopy in food analysis, both qualitatively and quantitatively. It focuses on the use of NMR spectroscopy and chemometric tools for food identification, discrimination, and characterization purposes.
For example, the combination of low and high-field NMR and chemometrics, including PLS-R and SVR, has proved its ability to accurately estimate essential quality parameters of edible oils, especially to detect potential adulteration. The results summarized in statistical parameters indicate that all developed models, whether of PLS-R or SVR on the three different fields of NMR, were similar. In addition to oil applications, Haddad et al. have carried out a quantitative analysis of fatty acids based on 1H-NMR variables as predictors and relative mass percentages of fatty acids as targets, including caproic, caprylic, capric, oleic, palmitic, and margaric [110]. Fatty acids have been accurately estimated in hen egg samples by 1H-NMR and PLS regression [108]. Proton nuclear magnetic resonance (1H-NMR) associated with chemometrics were combined to investigate the camellia oil adulterants with other vegetable oils [170]. In addition to 1H-NMR, 1H TD-NMR was combined efficiently with PLS regression to detect the percentage of adulterants such as water and whey in milk products varied from 5% to 50% through milk package and without sample preparation [105]. Besides PLS regression, Sun et al. successfully set up a model to detect moisture content through the association of low-field NMR and ANN with a low RMSE [107].
As previously shown, NMR spectroscopy supported by multivariate data analysis tools has been applied for various qualitative purposes in different foods. For example, Milani et al. successfully explored the versatility of 1H NMR with pattern recognition of PCA and SIMCA for identification and discrimination of pure Brazilian coffee from adulterated ones by corn, barley, or even coffee husks. The built SIMCA model ensured its high classification accuracy [168]. In relation to these quality analysis of coffee, 1H NMR data of roasted coffee samples were analyzed qualitatively by OPLS-DA to characterize organic roasted coffee from conventional coffee. The orthogonal signal correction (OSC) allowed for the extraction of the main features of each coffee category and thus improved the PLS-DA model discrimination. While fatty acids, β-(1-3)-d-galactopyranose, quinic acid, and its cyclic ester were the major metabolites characterizing organic roasted coffee, conventional coffee was characterized mainly by trigonelline and chlorogenic acid isomers [163]. The OSC filter was used with PCA (OSC-PCA) and applied to HR MAS 1H NMR data of cocoa beans to discriminate them based on their origin, whether they were American or African, based on the fatty acids, acetate, and saccharides components [167]. In another research work, both 1H NMR and 13C NMR were employed to analyze refined edible oils from different sources. By applying PCA on the 1H NMR or on 13C NMR, it was possible to identify and characterize these plants based on their fatty acids [171]. Amino acids were analyzed by NMR and explored by chemometric tools in fruits, since they are considered essential metabolites in cell function and enable distinction between plants of the same fruit. For example, Botoran et al. identified ten kinds of amino acids that allowed for the observation of differences and distinctions of different varieties of juice using PCA and LDA, which accurately classified juices from different plant sources [162]. In the honey adulteration problem, Rachineni et.al analyzed successfully honey by associating 1H NMR with supervised machine learning (neural network) for the characterization purpose of authentic honey from the adulterated whether by sugar, brown rice syrup or jaggery syrup [169]. The endpoints of the paragraph include the successful application of NMR spectroscopy combined with chemometrics, and machine learning, in accurately estimating and detecting various quality parameters and adulterants in food samples.
Overall, NMR spectroscopy is a valuable tool for food quality control and analysis, offering numerous advantages such as non-destructiveness, molecular specificity, sensitivity, and versatility. Additionally, it allows for quantitative analysis, making it particularly useful for determining the concentration of specific compounds in food products. However, the technique also has limitations that should be considered, including equipment cost, limited penetration, sample preparation requirements, and sensitivity to sample properties.
3.6. UV-Visible
UV-visible spectroscopy is known as one of the most sensitive techniques for determining less concentrated contents in food samples. Its association with multivariate tools offers an added advantage for such quantitative analysis. This technique uses electromagnetic radiation between 200 and 800 nm and detects two different aspects: color and fat oxidation [104]. The scope of the proposed paragraph is to discuss the application of UV-visible spectroscopy in food analysis, particularly for quantitative and qualitative purposes.
In addition to other analytical techniques, a recent research work for the same food product employed UV-Vis with PLS regression to accurately determine squalene in Extra virgin olive oils (EVOO) [100]. Wu et al. integrated empirical mode decomposition with SVR (EMD-SVR) to evaluate the quality of edible blend oils samples, concluding that EMD-SVR was more accurate for the quantitative analysis of ternary edible blend oil [101]. Zhang et al. developed models by coupling UV-Vis to Partial least squares regression (PLS) and principal component regression (PCR) for the quantitation of acid value in various oils. The PLS models performed well compared to PCR models [102]. In addition to different oil analyses, UV-Vis spectroscopy was proved to be more efficient as a method associated with PLS instead of univariate tools for the quantitation of grape-must caramel in Balsamic vinegars of different varieties of wine vinegars [103].
The UV-Vis spectroscopy has been combined with multivariate techniques for various qualitative purposes in food analysis. For instance, UV-Vis combined with MCR-ALS is a suitable tool to pursue the autoxidation of edible oils and to monitor the quality of extra virgin olive oil (EVOO) in different packaging systems [157]. In addition to olive oil samples, multivariate discrimination tools using UV-Vis spectroscopy, such as PLS-DA and SVM, have been used to distinguish between two specific mint species, such as spearmint and peppermint, while SIMCA has been used to detect outlier samples other than the two species [161]. Similarly, coffee has been analyzed by UV-Vis spectroscopy and SIMCA to accurately classify and discriminate between Peaberry and normal coffee [158]. In addition to SIMCA and PLS-DA, artificial neural networks (ANN) have been applied to UV-Vis spectroscopy to discriminate between vinegars produced from different raw materials, showing the discrimination efficiency compared to PLS-DA [159]. Another study used UV-Vis spectroscopy and ANN to discriminate between vinegars adulterated with spirit vinegar or acetic acid [160]. The end points of the paragraph include the successful application of UV-visible spectroscopy combined with multivariate techniques for food analysis adulteration, improved discrimination, and classification purposes.
Generally, UV-Visible spectroscopy is a valuable tool for food quality control and analysis, with several advantages such as simplicity, non-destructiveness, versatility, and cost-effectiveness. However, it has limitations in sensitivity, interference, and surface analysis that should be considered while using this technique.
3.7. Fluorescence Spectroscopy
Fluorescence spectroscopy is a technique that focuses mainly on the molecular level. It refers to the process in which a specific wavelength of light is irradiated in a solution, and the fluorescent substance in the solution absorbs the released energy. The scope of the proposed paragraph is to discuss the application of fluorescence spectroscopy in food analysis, both for quantitative and qualitative purposes. It highlights the molecular-level focus of fluorescence spectroscopy and its ability to detect and analyze various elements in food samples.
In recent years, fluorescence spectroscopy has been applied for the analysis of various elements of food. For example, a recent research study exhibited the application of front-face fluorescence mode spectroscopy and supervised PLS to estimate cow milk adulteration with other milk kind [196]. Another study used excitation-emission matrix (EEM) fluorescence spectroscopy and second-order calibration ways, like (PARAFAC) and (U-PLS), to detect and estimate the content of melamine in milk [98]. Additionally, fluorescence spectroscopy has been used to detect and quantify adulteration in olive oils [156]. Three-dimensional fluorescence spectra were subjected to analyze the same analysis purpose using the supervised approach of GA-SVR [99].
Many studies have shown the potential of fluorescence spectroscopy combined with multivariate data analysis tools for the qualitative analysis of various food samples. For example, Yuan et al. [155] conducted a comparative study using excitation-emission matrix fluorescence, FTIR, and vis-NIR on different types of vegetable oils for discrimination purposes using advanced chemometric tools (PCA, multiway-PCA, PLS-DA, and unfold-PLS-DA). The study found that FTIR and Vis-NIR, were more suitable compared to EEM for the identification of vegetable oil species. This is because most chemical components in vegetable oil produce FTIR and NIR absorption, while only a small number of fluorophores produce fluorescence [155]. Another study proved the same classification results of these techniques for detecting olive oil adulteration. This highlights the importance of combining analytical techniques with the appropriate chemometric tool [154]. Fluorescence spectroscopy has been combined with chemometrics to distinguish pure Aroeira honey from adulterated. The advanced chemometric methods (PARAFAC, PLS-DA, unfolded PLS-DA (UPLS-DA), and N-way PLS-DA (NPLS-DA)) were used to decompose the spectral data and build classification models. This qualitative analysis has proven the convenience of fluorescence spectroscopy with UPLS-DA for this kind of honey analysis [151]. It can be noted from previous research that multi-way chemometric techniques are often applied conveniently to EEMs data, whether on edible oils, honey, or beverages, as demonstrated by Fang et al. for the classification of Chinese lager beers made by different manufacturers [152]. The end points of the paragraph include the successful application of fluorescence spectroscopy combined with multivariate data analysis tools for quantitative and qualitative analysis of various food samples.
Fluorescence spectroscopy is a powerful tool for food quality control and analysis, offering advantages such as high sensitivity, specificity, non-destructiveness, and rapid analysis. However, there are certain limitations that should be considered when using this technique, including the complexity of sample preparation, potential interference from other compounds, limited penetration depth, and high instrumentation costs.
3.8. Fusion of Spectroscopic Techniques
In recent years, the strategy of data fusion combined with multivariate statistical analysis, that has been widely used to ensure the safety of food and to extract more information for both qualitative and quantitative purposes. The scope of the proposed paragraph is to discuss the application of data fusion combined with multivariate statistical analysis in food analysis for both qualitative and quantitative purposes. It highlights the use of various spectroscopic techniques such as UV-VIS, NIR, Raman, FT-IR, FT-Raman, and MID, and their fusion with multivariate statistical models for food analysis.
A recent research work developed PLS and ANN models for the quantification of adulteration in honey, using data fusion of non-pre-processed UV-VIS and NIR spectra [96]. Vis-NIR and Raman have also been merged and applied to predict the storage time of infant formula between 0–12 months [95]. UV-Vis-NIR was combined with PLS to accurately quantify cholesterol in egg yolk, whether in the shell or in pasteurized form [94]. Additionally, the combination of PLS regression with the data fusion of FT-IR with Raman spectroscopy allowed the determination of peroxide values and acid values in oils [197]. A study was elaborated to test merging mid-infrared (MIR) with Raman spectroscopy for the fructose syrup determination in honey samples. The PLS model was used to estimate the adulterant, and the results were improved after the data fusion compared to the results obtained by each of the two spectroscopic techniques [198]. The same conclusion was achieved by a recent research work that evaluated the data fusion of NIR and MIR, combined with the sequential orthogonalized partial least square regression (SOPLS), to estimate different quality traits of tubers and root flours. These traits included different chemical compounds including for example amylose and protein [69].
The efficiency of data fusion methodology for qualitative purposes has been proved by Yao et al., who established a method based mainly on Fourier transform infrared (FT-IR) and ultraviolet (UV) spectroscopies associated with data fusion to distinguish different regions of mushroom samples [150]. A synergistic strategy of FT-Raman and NIR for the classification of two classes of hazelnut: unadulterated and adulterated with almonds using SIMCA was also demonstrated. The obtained results proved that merging the two techniques can be more effective than using each technique alone, based on sensitivity and specificity [142]. NIR and MID were also used with the SVM model to discriminate natural honey from syrup-adulterated one. In this case study, Huang et al. showed two levels of data fusion. A low level, in which redundant and irrelevant variables were introduced, and an intermediate level, where PCA was applied to extract the feature variables. The results acquired from this study had a significant increase in SVM model parameters of accuracy, precision, and sensitivity using the intermediate-level data fusion [132]. The endpoints of this section include the successful application of data fusion methodologies with chemometrics for quantification of adulteration, for estimating different chemicals, as well as for qualitative purposes and classifying unadulterated and adulterated food samples. However, there are limitations to consider when using data fusion methodologies in food analysis. The success of data fusion relies on the compatibility and complementarity of the combined techniques and the availability of appropriate statistical models. Proper calibration and validation procedures are necessary to ensure the reliability and robustness of the fused data. Furthermore, data fusion may introduce additional complexity and computational requirements, requiring careful data preprocessing and analysis. It is also important to consider the specific requirements and limitations of each spectroscopic technique and statistical model being used for data fusion.
The fusion of spectroscopic techniques provides an advanced tool for food quality control and analysis, offering advantages such as enhanced accuracy, complementary information, improved sensitivity, and non-destructiveness. However, it should be noted that this technique has some limitations, such as complexity, high equipment cost, sample preparation requirements, and limited penetration depth. These factors should be considered before implementing this technique for food analysis.
3.9. Portable Spectroscopic Techniques
The food industry is constantly seeking faster, more accurate ways to assess the safety and quality of their products while also detecting possible adulteration. Portable spectroscopic equipment, such as Raman, NIR and HSI among other techniques, have become increasingly popular due to their portability, accuracy, and ability to control food products [199]. The scope of the proposed paragraph is to discuss the application of portable spectroscopy techniques in the food industry for assessing food safety and quality, detecting adulteration, and enabling in-process monitoring. It highlights the advantages of portable spectroscopy equipment, such as Raman, NIR, and HSI, including their portability, accuracy, low sample preparation requirements, and cost-effectiveness.
Portable spectroscopies equipment in general requires less sample preparation and less hazardous consumption than traditional laboratory-based processes, granting fast results on food quality and safety. Furthermore, these technologies provide the food industry the low cost-effective analysis and product safety [200,201]. Portable spectroscopy techniques are highly effective in detecting food fraud and contaminants, such as pesticides, heavy metals, and pathogens. Previous developments in portable fluorescence and Raman spectroscopy have enabled water detection in milk and honey products with less expensive syrups, respectively [202,203]. Moreover, they are involved to analyze food quality attributes, for instance, mid-infrared spectroscopy used for fatty acid profile and fat content in lamb meat [202], and the amount of fat in meat and its degree of tenderness [204]. The NIR-HSI as a portable technique coupled with chemometric tools was showed excellent application in different food products [205,206].
Portable spectroscopy techniques were demonstrated to be a valuable solution for food manufacturers and processors, as they can be used for in-process monitoring of food quality and safety. The technology can also be used for post-harvest processing, such as the detection of mold and fungal infections in food products [207]. In addition, they have demonstrated to be versatile in identifying various food tampering and contaminants, including pesticides, heavy metals, and biological contaminants. They are also beneficial with chemometrics for quality control testing and authentication for rapid food chain analysis aimed at a perfect digital traceability system [201]. For a deep understanding, a recent review article provides an overview of how miniaturized NIR spectroscopy can be applied to address a range of issues in food-related settings [208]. They provide a comprehensive summary of the latest research trends, highlighting key factors driving the development of the micro-NIR analytical framework for modern food analysis, quality control, and safety risk monitoring. Emphasis is placed on the significance of combining complementary tools with the NIR analytical method, which enhances its precision, dependability, and versatility for food applicability. The endpoints of this section include the successful use of portable spectroscopy techniques and the use of chemometric tools for detecting food fraud and contaminants, analyzing food quality attributes, monitoring in-process food quality, safety, and rapid food chain analysis.
Finally, to highlight portable spectroscopy tools have several advantages in food applications, including non-destructive sample analysis, rapid analysis where timely decisions are needed, in situ analysis which is particularly useful in food-based applications. However, there are also some limitations to the use of portable spectroscopy techniques in food applications, such as limited accuracy particularly for complex samples, limited range of wavelengths which may not be suitable for all applications, regular calibration requirements which can be time-consuming, sensitivity to environmental conditions such as temperature and humidity, and often more cost-effective than traditional laboratory-based techniques [201]. These limitations should be taken into account when implementing portable spectroscopy in food analysis and quality control processes.
4. Importance of Integrating Advanced Spectroscopy Techniques in Food Analysis
The use of advanced spectroscopy techniques in food analysis is crucial for several reasons. The scope of the proposed paragraph is to discuss the significance of advanced spectroscopy techniques in food analysis, including their non-destructive nature, ability to provide detailed information about food composition, and the use of chemometric tools for data analysis. Firstly, techniques such as NIR, Raman, FTIR, and UV-Vis offer a non-destructive and non-intrusive way of analyzing food samples, making them ideal for large-scale analysis in the food industry without affecting the quality or safety of the samples. Secondly, they provide detailed information about the chemical composition and structure of food, which can be used to classify and identify different food types, detect contamination, and monitor food quality changes. Lastly, the implementation of advanced chemometric tools enables effective analysis of complex spectral data for food quality assessment. The food industry faces a significant challenge in ensuring consistent quality and overall food safety information throughout the entire supply chain, from production to distribution, to meet consumer demands and expand the market. To address this challenge, advanced non-invasive technologies are increasingly being used to monitor the nutritional and hygienic properties of raw and end food products. The initial perception of a food’s quality is often based on its texture, while the nanostructures in food play a role in determining its color, shape, and sensory appeal (Figure 3).
Spectroscopy techniques can help to determine the presence and quantity of key components like flavonoids and antioxidants in food, which play a vital role in assessing its quality. The effectiveness of using anthocyanin profile, color image analysis, and NIR-HSI to differentiate between different grape varieties, with the aid of Stepwise Linear Discriminant Analysis (SLDA) that was created for each dataset to differentiate grapes based on their variety.
Spectroscopic methods provide a valuable means to assess the quality of food by determining the presence and quantity of important components such as flavonoids and antioxidants. The combination of anthocyanin profiling, color image analysis, and near-infrared hyperspectral imaging (NIR-HSI), along with the aid of dataset-specific Stepwise Linear Discriminant Analysis (SLDA), proves effective in distinguishing between different grape varieties based on their specific characteristics. In addition, it can be concluded that NIR spectroscopy holds substantial promise for the non-destructive determination of total phenolics and flavonoids [209]. The content of flavonoids in food can be influenced by various factors, including seasonality, food maturity, and preparation methods employed. In this sense, the spectroscopy methods such as Visible/NIR were used to determine the levels of flavonoids in food [210]. These techniques are employed by various industries including the milk, meat, coffee, and wine sectors to analyze the composition of food [211]. Assessing the quality of food based solely on sensory evaluation may not suffice, particularly for intricate evaluations. Advanced spectroscopy equipment with chemometrics is highly recommended in such scenarios as it offers advantages that are not attainable through manual inspection alone.
Traditional methods of food quality detection can be cumbersome, repetitive, destructive, and take up a lot of time. Non-destructive methods, on the other hand, offer a more efficient way of gaining both quantitative and qualitative data without destroying the sample. The recent developments in non-destructive food quality assessment techniques include imaging, spectroscopy, and cutting-edge approaches such as electronic nose, electronic tongue, dielectric, and acoustic methods [212]. For instance, conventional methods of analysis and detection, for instance, thin-layer chromatography and high-performance liquid chromatography (HPLC) are yet largely used in the basic food industry to detect food quality. Nevertheless, these procedures are damaging, laborious, and time-consuming. Consequently, spectroscopic techniques were demonstrated their use and importance for food quality control including visible/infrared (VIS/IR) [212,213], Raman spectroscopy [214], NMR [215], and HSI [216].
In contrast, the field of food authentication poses a major challenge that can be addressed using advanced spectroscopic tools. Adulteration in food is often accomplished by substituting ingredients with cheaper options that are not easily distinguishable by either consumers or conventional analytical techniques [217]. To confirm the geographical origin, storage conditions, and processing methods listed on food labels, it is necessary to analyze specific components in samples. Hence, the development of trustworthy and effective analytical methods is vital for creating new policies, programs, and techniques to verify food authentication.
The scope of the proposed paragraph is to emphasize the importance of advanced spectroscopy techniques in food analysis, including their non-destructive nature, ability to provide detailed chemical information, and the role of chemometric tools in analyzing complex spectral data. The endpoints are to highlight the use of spectroscopy techniques for assessing food quality, detecting adulteration, and verifying food authentication. However, it should be noted that the paragraph does not delve into the specific methodologies or algorithms associated with spectroscopy techniques and chemometric data analysis. However, there are limitations to consider when using spectroscopy techniques in food analysis. These limitations include the influence of various factors on the content of flavonoids in food, the need for dataset-specific analysis methods, and the challenges associated with distinguishing food adulteration using conventional analytical techniques.
In summary, the integration of different spectroscopy techniques either separately or in a combination or fusion can also enhance the overall performance of food analysis. This can be achieved by using chemometric data analysis approaches.
5. Food Application and Aspects
Spectroscopic methods involve the use of electromagnetic radiation through absorption, transmission, and emission, and are based on the wavelength of the radiation. Unlike traditional techniques, spectroscopic methods have become essential tools for determining food properties through real-time monitoring and non-invasive techniques. Recently, advanced spectroscopic techniques combined with chemometric approaches have been developed and applied in various food applications and areas such as sensory analysis, adulteration detection, chemical analysis, mycotoxin detection, parasitic infection detection, internal physiological analysis, and others.
5.1. Sensory Attributes
The sensory characteristics of basic foods, such as structure, color, toughness, texture, and outside defects, are crucial elements of food quality. The color of a food is generated by the reflection of distinct wavelengths in the visible light section. The structure of a product, which is often determined by its size, weight, or volume, can influence consumer preferences and final consumption. Hardness is a primary indicator of food property, indicating the texture and moisture content of food. External defects, which occur during or after harvest, are another common sensory attribute that greatly impacts food quality. Consequently, precise, and timely forecasting of these sensory characteristics is a primary concern for the farming and food industry. The scope of the proposed paragraph is to discuss the importance of sensory characteristics in food quality and the role of spectroscopy techniques combined with chemometrics in evaluating these characteristics. It highlights the significance of texture, color, hardness, and external defects in determining food quality and consumer preferences.
The sensory characteristics of texture and color were established using VIS and NIR spectroscopy. The VIS/NIR spectroscopy was shown to be a reliable method for evaluating the quality of dry beans during the canning process [218]. A discriminatory linear model was applied to classify the canned beans into two categories: “acceptable” and “unacceptable”. The model achieved an ordinary classification accuracy of 72.60%. As sensors and instruments improve, it is expected that VIS/NIR spectroscopy will meet the necessary requirements for its use. The evaluation of basic foods using HSI systems mainly focuses on color, hardness, and external defects. In a recent study [219], the color of fresh soybeans was determined using an active contour model to segment the spectral images. This HSI technique was found to be more effective in acquiring the mean reflectance and entropy parameters of the image. A PLSR model was established to detect the color of processed soybeans with a good R2 of 0.74 and used HSI in the range of 400–1000 nm to discriminate rice samples based on color and shape. Five shape features (minor axis length, major axis length, perimeter, length-width ratio, and eccentricity) and one-color feature (degree of chalkiness) were utilized as inputs for a back propagation neural network (BPNN) model, resulting in a high classification accuracy of 94.45%. The performance of PLSR and PCR in evaluating the hardness of wheat samples using HSI in the wavelength range of 960–1700 nm and found that PLSR outperformed PCR. Additionally, hyperspectral imaging was also significantly used to determine the surface defects of potatoes [220]. The effectiveness of the proposed method in identifying kernels where the germination process has begun was demonstrated through experiments involving three wheat cultivars. The results achieved 100% accuracy for the samples utilized in this study [221]. The surface defects of potatoes were also determined using the HSI technique. Moreover, the results were combined with the SVM classification tool to achieve a high-accuracy performance in determining the surface defects of potatoes [222]. The endpoints of the paragraph include the effectiveness of spectroscopy techniques, such as VIS/NIR and HSI, in determining the color, hardness, and external defects of food samples. It also highlights the successful application of discriminatory models and neural networks in classifying and predicting sensory characteristics based on spectroscopic data.
Spectroscopic techniques are useful in food sensory analysis to measure properties such as color, texture, and flavor. The advantages of these techniques include objective measurement, non-destructiveness, and rapid results. They can provide a detailed analysis of food chemical composition, helping to identify changes due to processing or storage. However, limitations include the need for calibration and reference materials, the possibility of interference from other compounds, and the complexity of data analysis. The cost of equipment and expertise required may also be a barrier for smaller food businesses.
5.2. Adulteration Attributes
Adulteration refers to the practice of mixing inferior quality substances with superior original substances and or/by adding ingredients of lower quality, which can negatively impact the completeness and nutritional value of food products [217]. Often, the presence of contaminated materials is very comparable to that of the initial products, making it complicated to differentiate them when blended. Additionally, establishing the species and source of staple foods is important in protecting consumers from potential fraud, as food geographical indications cannot be confirmed solely from food labels. Thus, reliable analysis of adulteration is required to confirm the quality of the product. The scope of the proposed paragraph is to discuss the problem of food adulteration and the role of spectroscopic techniques with chemometrics in detecting and differentiating adulterated food samples. It highlights the challenges posed by adulteration, including the difficulty in differentiating contaminated materials from the original products and the importance of confirming the species and source of staple foods.
Spectroscopic techniques, such as Transmission Raman spectroscopy, have been used to achieve this goal. In a recent study, Transmission Raman spectroscopy was used to differentiate rice samples based on their geographic origin using PCA and LDA [223]. Similarly, Feng et al. (2013) used a combination of Raman spectroscopy and multivariate data analysis techniques to differentiate rice samples from various regions of China, with an overall accuracy of over 90% [224]. Different types of rice samples and their geographical origin were effectively discriminated using 1H-NMR spectroscopy and multivariate data analysis. The accuracy of wheat flour sample discrimination using a simple linear model was 80% [225]. The study by Esteve Agelet et al. (2012) tested the feasibility of NIR spectroscopy to discriminate viable-germinating corn and soybeans from dead seeds and found that dead corn kernels could be discriminated with an accuracy of 99% using partial least squares discriminant analysis (PLS-DA) [226], Haughey et al. (2013) used NIR spectroscopy (833–2632 nm) to detect adulteration of soybeans with melamine and achieved R2 values ranging from 0.89 to 0.99 using PLSR and PCR algorithms [227]. The use of Fourier transform mid-infrared (FT-MIR) spectroscopy and discriminant analysis was successful in detecting adulterated potato and sweet potato starch by Liu et al. (2013) [228]. Similarly, FT-IR spectroscopy and discriminant analysis were combined for the geographical differentiation of dried lentil seeds [229]. For imaging spectroscopy, it was examined to identify different types of wheat kernels, and found that better results were obtained by selecting three specific wavelength intervals. The ability of NIR spectroscopy to detect adulteration of soybeans by melamine was demonstrated, with R2 values of 0.89 to 0.99 using PLSR and PCR algorithms [230]. NIR spectroscopy was also used to distinguish viable-germinating corn and soybeans from dead seeds, with perfect accuracy based on PCA and PLS-DA [231]. The NIR and HSI in combination with PCA to detect residues of 0.10% peanuts in wheat flour, with an R2 of 0.95 [232]. All these spectroscopic techniques demonstrated very great accomplishments in detecting different forms of food fraud and authentication. The end points of the paragraph include the effectiveness of spectroscopic techniques in detecting and differentiating adulterated food samples based on their chemical composition. It mentions the advantages of spectroscopic techniques, such as high sensitivity, specificity, and non-destructiveness, which allow for the identification of small changes in the food samples.
Spectroscopic techniques detect food adulteration by analyzing the chemical composition of food samples. Advantages include high sensitivity, specificity, and non-destructiveness, which can identify small changes in the food sample. Limitations include the need for calibration and reference materials, interference from other compounds, limited applicability, and cost of equipment and expertise.
5.3. Chemical Attributes
The chemical composition of food plays a crucial role in determining its nutritional value and consumer acceptance. The scope of the proposed paragraph is to discuss the chemical composition of food, focusing on cereals and legumes, and highlight the importance of accurate measurement and control of their chemical components for determining nutritional value and food quality. The main chemical components in cereals and legumes are carbohydrates, protein, moisture, fiber, fat, and ash. Starch, a type of carbohydrate, is composed of helical amylose and branched amylopectin. The nutritional value and consumer acceptance of food are significantly influenced by its chemical composition. Cereals and legumes primarily consist of carbohydrates, protein, moisture, fibre, fat, and ash. For instance, maize can range from 20% to 36%, sorghum from 21% to 35%, wheat from 17% to 29%, barley from 11% to 26%, rice from 8% to 37%, pea from 34% to 37%, and potatoes from 18% to 23% [233]. Among these components, starch, a type of carbohydrate, is composed of amylose and amylopectin. The relative proportions of amylose and amylopectin in starch have a notable influence on the quality of food products such as bread and noodles [234]. The content of those chemicals can vary greatly which can influence the food quality properties and high-performance techniques needed to control their concentrations. Staple foods are primarily composed of proteins, which contribute to their structural and functional properties, affecting their quality and taste. Moisture content is a major factor that influences the shelf life and germination success of staple foods. The fiber in these foods, made up of cellulose, hemicellulose, lignin, pectin, and gums, can help lower cholesterol levels but does not provide energy. Lipids are the most energy-dense component, providing more energy per gram than carbohydrates and proteins. Ash content, which is the inorganic residue after organic matter is burned, indicates the presence of minerals in the food sample. Moisture content is commonly measured through drying with an oven or Karl Fisher titration, both of which have low efficiency [235]. The content of crude fat in staple foods can be measured by extracting the dried material using ether or petroleum ether. The crude protein content is typically determined using Kjeldahl or Dumas methods, which quantify the organic nitrogen content [236]. However, these traditional methods are destructive, time-consuming, and require a long preparation time. To overcome these limitations, the use of non-destructive and rapid detection methods is desired. The VIS/IR spectroscopy techniques hold the potential for determining the chemical components in staple foods. Nie et al., demonstrated that VIS/NIR spectroscopy in the range of 400 to 1000 nm can be used non-destructively to determine the presence of the poisonous phytohemagglutinin in beans by monitoring the boiling time of yard-long beans [237]. Both NIR and MIR techniques were used to verify the chemical characteristics, as well as protein, lipid, moisture, and ash amounts in soybean, while PLSR models showed good performance [238]. The preparation and determination of staple food samples using VIS/IR spectroscopy techniques take less than five minutes, compared to the 10–16 h required by traditional methods. FT-NIR spectroscopy has been shown to estimate the concentration of moisture, protein, lipid, ash, and carbohydrate in Brazilian soybeans with high accuracy [239]. The protein and moisture content had the best results with correlation coefficients of 0.81 and 0.80, respectively. NIR spectroscopy has also been used to accurately predict the crude protein content in potatoes, with high correlation coefficients ranging from 0.86 to 0.95 using PLSR for calibration [240]. The VIS/NIR (446–1125 nm) was applied for chemical components in two varieties of potato tubers [241]. The chemical and enzymatic compositions of staple foods, including phenolics, flavonoids, anthocyanins, carotenoids, dioscin, and catalase, have been screened using NIR or MIR spectroscopy and analyzed using chemometric methods namely HCA, PCA, SVM and PLS-DA, producing good predictive ability [241,242,243]. The endpoints of this section include the advantages of spectroscopic techniques in offering high sensitivity, specificity, and non-destructiveness for food chemical analysis. It mentions their ability to quickly identify small changes in food composition and measure parameters such as acidity, pH, and moisture content.
Spectroscopic techniques offer high sensitivity, specificity, and non-destructiveness for food chemical analysis. They can quickly identify small changes in food composition and measure parameters such as acidity, pH, and moisture content. However, limitations include the need for calibration and reference materials, interference from other compounds, and the complexity of data analysis. The cost of equipment and expertise required may also be a barrier for smaller food businesses.
5.4. Mycotoxin Attributes
The presence of mold and its associated toxins during post-harvest storage can result in a decrease in food quality, leading to losses in nutrients and market value, as well as pose serious food safety risks. The scope of the proposed paragraph is to discuss the presence of mold and mycotoxins in post-harvest storage and their negative impact on food quality, safety, and market value. It emphasizes the harmful effects of mycotoxins, such as aflatoxins and Fusarium toxins, which are known to be carcinogenic and linked to liver and lung cancer in humans.
Mycotoxins, like aflatoxins and Fusarium toxins, are harmful byproducts produced by mold and are recognized as carcinogenic, linked to liver and lung cancer in humans. According to estimates, as much as 25% of crops grown for both animal feed and human consumption globally may be contaminated with mycotoxins [244]. Mycotoxin amounts for essential food products have been specifically restricted by the EU [245]. In the USA, 20 ppb (parts per billion) of aflatoxin amounts in food and 100 ppb in feed are permitted for the administrative market [246]. Giving to the FAO, one billion metric tons of food are rotten worldwide yearly caused by mycotoxins [247]. Hence, the ability to accurately detect various levels of fungal contamination can greatly aid in controlling plant diseases and reducing food safety hazards. Currently, the methods for identifying and measuring toxins consist primarily of thin-layer chromatography and high-performance liquid chromatography, but these methods are both expensive and time-consuming and involve the destruction of samples [248]. The detection of mycotoxins in staple foods can be performed quickly and easily using IR spectroscopy. The NIR spectroscopy in the range of 950–1650 nm was used in conjunction with PLSR to detect total fungal and yellow-green Aspergillus flavus infections in rice [249]. However, the accuracy levels for both total fungi and yellow-green A. flavus infections were not high. The PLS was based on full cross-validation to detect fumonisin contamination in maize through NIR spectroscopy, achieving a high R2 of 0.91. This demonstrates that NIR spectroscopy is a viable alternative tool for detecting fumonisin infections [250]. The FT-MIR spectroscopy in the range of 2500–16,000 nm with an attenuated total reflectance unit to differentiate peanut kernels contaminated with aflatoxin and non-aflatoxin strains. The “Acceptable” stream (aflatoxin ≤ 20 ppb) was separated from “Mildly” (20 < aflatoxin < 300 ppb), “Highly Toxic” (300 < aflatoxin < 1200 ppb), and “Highly Moldy” (aflatoxin > 1200 ppb) through classification. The fingerprint region (5556–12,500 nm) was utilized to predict the A. flavus and A. parasiticus species with varying levels of contamination based on PLS regression, achieving an R2 of 99.98% [251]. The utilization of the Raman technique in combination with PCA allows for the non-invasive detection of deoxynivalenol (commonly known as vomitoxin) in contaminated wheat and barley [252]. The benefits of this approach consist of the utilization of a NIR laser excitation (1064 nm), which minimized disruption from the fluorescence of biological substances. The endpoints of the paragraph highlight the advantages of spectroscopic techniques in food mycotoxin analysis, including high sensitivity, specificity, and non-destructiveness. It emphasizes the ability of these techniques with chemometric models to detect even small amounts of mycotoxins in food samples and provide rapid measurements of various chemical parameters.
Spectroscopic techniques offer advantages in food mycotoxin analysis such as high sensitivity, specificity, and non-destructiveness. These techniques can detect even small amounts of mycotoxins in food samples and provide rapid measurements of various chemical parameters. However, limitations include the need for calibration and reference materials, the interference of other compounds in the sample, and the limited applicability of certain techniques to specific mycotoxins.
5.5. Parasitic Contamination
Staple foods can be degraded and lose market value due to contamination from parasitic insects. The scope here is to discuss the contamination of staple foods by parasitic insects and the detrimental effects they have on food quality and market value. The activities of parasitic insects, both external and internal, and their impact are highlighted.
The insects not only feed directly on the food, but also create heat and moisture through their metabolic activity, leading to localized hotspots and spoilage. This results in weight loss, nutrient depletion, reduced germination ability, and increased risk of contamination during storage. External insects like the Oryzaephilus surinamensis and internal insects such as Sitophilus granarius can both harm stored products. Some insects like the sweet potato weevil (Cylas formicarius elegantulus) do most of the damage inside the food without significant external changes. Others, like the rice weevil (Sitophilus oryzae) and lesser grain borer (Rhyzopertha dominica), lay eggs, larvae, or pupae in seeds, continuing their destructive activity for up to 7 weeks, until the adult insects emerge and leave an exit hole, making the damage visible [253].
The detection of parasitic insect infestations in staple foods is crucial for the food industry. Such infestations can decrease the quality and value of the food. Internal infestations are more challenging to detect and require effective methods for inspection. HSI, a spectral information technique, has the potential to provide information about internal infestations through reflectance or absorbance measurements. A study by Singh et al. (2009) used LW-NIR HSI (900–1700 nm) to differentiate between insect-infested and healthy wheat kernels, achieving an accuracy of over 85% with LDA and QDA classifiers [254]. The endpoints of the paragraph emphasize the importance of detecting parasitic insect infestations in staple foods to mitigate the negative effects on food quality and value. Internal infestations are highlighted as being more challenging to detect and requiring effective inspection methods.
Spectroscopic techniques detect parasitic contamination in food with high sensitivity, specificity, and non-destructiveness. These techniques rapidly and precisely measure various chemical parameters, but limitations include the need for calibration and reference materials, the possibility of inaccurate results due to other compounds in the sample, and limitations in detectability for certain parasites. The cost and expertise required may also be a barrier for smaller food applications.
5.6. Internal Functional Characteristics
Functional disturbances within staple crop plants are linked to irregular growth patterns brought on by less-than-ideal environmental factors. The scope here is to discuss briefly some examples of the internal functional characteristics disturbances within staple crop plants such as those caused by environmental factors.
The functional disturbances include variations in temperature, moisture, oxygen, nutrients, the presence of toxic gases, and a deficiency in growth regulators. The symptoms of these internal conditions appear to be root tuber disorders such as hollow heart, black heart, and internal brown spot. Overuse of nitrogen fertilizer during the growth phase can cause hollow heart in tubers, a condition where the tuber’s core dies or splits, creating a cavity [255]. This disorder is commonly triggered by the rapid growth of the tuber and results in reduced storage life, poorer quality chips, and an unattractive appearance. Blackheart is a condition that arises when there’s insufficient oxygen during the tuber’s growth or storage period. Tubers cultivated in excessively damp areas or those exposed to severe temperatures are more prone to this condition. Internal brown spot refers to the internal death of the tuber’s central tissue, which significantly diminishes its culinary worth. Other physiological damage, such as freezing or chilling injuries, occurs due to extended exposure to freezing temperatures post-harvest. The symptoms of these injuries manifest as grey or black patches, or a brown discoloration around the tuber’s vascular ring. Even though these internal physiological disorders may not be immediately visible, they greatly affect the quality and value of root and tuber crops. X-ray examination has been reported to successfully detect hollow hearts in potatoes but attempts to use acoustic methods for detection have been unsuccessful [256], although unsuccessful using an acoustics method [257]. Traditional methods are also heavily dependent on the orientation of the potato. However, spectroscopic techniques have been shown to be effective for the non-destructive prediction of internal physiological disorders, including black heart, hollow heart, and internal brown spot in root tubers. The VIS/NIR transmission spectroscopy (513–850 nm) used to compare three different morphological correction methods combined with PLS-DA and PCA to detect black hearts in potatoes. The best performance was found with height-corrected transmittance. Using six wavelengths (839, 817, 741, 711, 698 and 678 nm), the overall validation classification rate for the black heart was 96.53% [258]. The HSI in the 1000–1700 nm range was applied to distinguish hollow heart and internal brown spots in tubers. Specifically, the HSI technique was applied to detect the presence of hollow hearts in potato tubers [259]. An accurate recognition rate of 89.10% was achieved by combining support vector machine (SVM) with various image processing techniques. Similarly, time-resolved reflectance spectroscopy (540–900 nm) was used for non-destructive external measurement of internal brown spots in potato tubers [260]. By internal detection of healthy tissue and black spots, the most sensitive wavelength for detection was found to be 690 nm. The endpoints of the paragraph emphasize the negative effects of these internal physiological disorders on the quality and value of root and tuber crops.
Spectroscopic techniques offer insights into food’s internal functional characteristics, such as composition, structure, and functional properties, with high sensitivity, specificity, and non-destructiveness. They allow for rapid and precise measurements of various chemical and physical parameters. However, challenges arise from the need for calibration and reference materials, potential interference from other compounds, and limitations in the applicability of certain techniques. Moreover, the cost of equipment and expertise required may be an obstacle.
6. Conclusions
In conclusion, advancing spectroscopy techniques offer a game-changing solution for food composition analysis, presenting a non-destructive, rapid, cost-effective, and eco-friendly alternative to traditional methods. These techniques provide valuable insights into food quality, chemical components, composition, structure-function relationships, and sensory attributes, eliminating the need for extensive sample preparation in many cases, thus saving time and resources. Coupled with appropriate chemometric multivariate methods, spectroscopy enables comprehensive and accurate analyses of various food materials.
This review has highlighted recent studies showcasing the effectiveness of spectroscopy techniques, such as hyperspectral and multispectral imaging, NMR, IR, Raman, X-ray-based methods, fluorescence, and UV-visible, in conjunction with chemometric approaches for diverse food analysis applications. From determining the chemical composition and identifying geographical origin to ensuring food safety and traceability, monitoring storage and preservation, assessing sensory characteristics, evaluating microbial quality, and detecting food spoilage, these techniques have shown immense potential and versatility in the food industry.
Looking ahead, the future of spectroscopic techniques in food analysis appears highly promising. As technology continues to advance, these techniques are expected to become even more powerful, accurate, and efficient, opening new avenues of research and application. It is strongly recommended that food businesses and researchers embrace spectroscopy in their analyses and consider integrating these techniques into their standard practices to enhance the overall efficiency and quality of food analysis.
However, it is crucial to acknowledge the challenges and limitations that may arise with spectroscopic methods, such as issues related to sample heterogeneity, sensitivity, accuracy, and the need for proper calibration and reference materials. Chemometric methods, while invaluable, require careful handling to avoid issues like overfitting and to ensure reliable results, potential drawbacks of chemometric methods, such as overfitting or the need for extensive data processing and model optimization should be also considered.
As the field progresses, further research and development are essential to optimize and expand the capabilities of spectroscopic techniques in food analysis. By addressing these challenges and pushing the boundaries of innovation, spectroscopy can revolutionize the food industry, bolstering food safety, quality control, and product innovation in a sustainable and impactful manner.
Author Contributions
Conceptualization, methodology, and validation, M.K.; formal analysis and investigation, M.K., M.A.M., M.T. and H.Y.; resources, M.K.; writing—original draft preparation, M.K., M.A.M., M.T. and H.Y.; writing—review and editing, M.K.; supervision, project administration and funding acquisition, M.K. All authors have read and agreed to the published version of the manuscript.
Funding
Open access funding provided by University of Helsinki.
Data Availability Statement
The data used to support the findings of this study can be made available by the corresponding author upon request.
Conflicts of Interest
The authors declare no conflict of interest.
References
- Lakshmi, V.; Pradesh, A. Food Adulteration. Int. J. Sci. Invent. Today 2012, 1, 106–113. [Google Scholar]
- The Lancet. Melamine and Food Safety in China. Lancet 2009, 373, 353. [Google Scholar] [CrossRef] [PubMed]
- Ramesh, R.; Jha, S.; Lawrence, F.; Dodd, V. From Mumbai to Your Supermarket: On the Murky Trail of Britain’s Biggest Food Scandal. Guardian 2005, 23. [Google Scholar]
- Wu, D.; Shi, H.; He, Y.; Yu, X.; Bao, Y. Potential of Hyperspectral Imaging and Multivariate Analysis for Rapid and Non-Invasive Detection of Gelatin Adulteration in Prawn. J. Food Eng. 2013, 119, 680–686. [Google Scholar] [CrossRef]
- Lohumi, S.; Lee, S.; Lee, H.; Cho, B.-K. A Review of Vibrational Spectroscopic Techniques for the Detection of Food Authenticity and Adulteration. Trends Food Sci. Technol. 2015, 46, 85–98. [Google Scholar] [CrossRef]
- Yen, T.-H.; Lin-Tan, D.-T.; Lin, J.-L. Food Safety Involving Ingestion of Foods and Beverages Prepared with Phthalate-Plasticizer-Containing Clouding Agents. J. Formos. Med. Assoc. 2011, 110, 671–684. [Google Scholar] [CrossRef] [Green Version]
- Yang, J.; Hauser, R.; Goldman, R.H. Taiwan Food Scandal: The Illegal Use of Phthalates as a Clouding Agent and Their Contribution to Maternal Exposure. Food Chem. Toxicol. 2013, 58, 362–368. [Google Scholar] [CrossRef]
- Schneider, A. Asian Honey, Banned in Europe, Is Flooding US Grocery Shelves. Am. Bee J. 2011, 151, 933. [Google Scholar]
- Baeten, V.; Dardenne, P. Spectroscopy: Developments in Instrumentation and Analysis. Grasas Y Aceites 2002, 53, 45–63. [Google Scholar] [CrossRef]
- Joshi, V.C.; Srinivas, P.V.; Khan, I.A. Rapid and Easy Identification of Illicium Verum Hook. f. and Its Adulterant Illicium Anisatum Linn. by Fluorescent Microscopy and Gas Chromatography. J. AOAC Int. 2005, 88, 703–706. [Google Scholar] [CrossRef]
- Gemperline, P. Practical Guide to Chemometrics; CRC Press: Boca Raton, FL, USA, 2006; ISBN 0429119569. [Google Scholar]
- Otto, M. Chemometrics: Statistics and Computer Application in Analytical Chemistry; John Wiley & Sons: Hoboken, NJ, USA, 2016; ISBN 3527340971. [Google Scholar]
- Folch-Fortuny, A.; Arteaga, F.; Ferrer, A. Missing Data Imputation Toolbox for MATLAB. Chemom. Intell. Lab. Syst. 2016, 154, 93–100. [Google Scholar] [CrossRef] [Green Version]
- Folch-Fortuny, A.; Arteaga, F.; Ferrer, A. Assessment of Maximum Likelihood PCA Missing Data Imputation. J. Chemom. 2016, 30, 386–393. [Google Scholar] [CrossRef]
- Elcoroaristizabal, S.; Bro, R.; García, J.A.; Alonso, L. PARAFAC Models of Fluorescence Data with Scattering: A Comparative Study. Chemom. Intell. Lab. Syst. 2015, 142, 124–130. [Google Scholar] [CrossRef]
- Tomasi, G.; Bro, R. PARAFAC and Missing Values. Chemom. Intell. Lab. Syst. 2005, 75, 163–180. [Google Scholar] [CrossRef]
- Wu, Y.; Peng, S.; Xie, Q.; Han, Q.; Zhang, G.; Sun, H. An Improved Weighted Multiplicative Scatter Correction Algorithm with the Use of Variable Selection: Application to near-Infrared Spectra. Chemom. Intell. Lab. Syst. 2019, 185, 114–121. [Google Scholar] [CrossRef]
- Mishra, P.; Nordon, A.; Roger, J.-M. Improved Prediction of Tablet Properties with Near-Infrared Spectroscopy by a Fusion of Scatter Correction Techniques. J. Pharm. Biomed. Anal. 2021, 192, 113684. [Google Scholar] [CrossRef]
- Zhang, Z.-M.; Chen, S.; Liang, Y.-Z. Baseline Correction Using Adaptive Iteratively Reweighted Penalized Least Squares. Analyst 2010, 135, 1138–1146. [Google Scholar] [CrossRef]
- Skogholt, J.; Liland, K.H.; Indahl, U.G. Baseline and Interferent Correction by the Tikhonov Regularization Framework for Linear Least Squares Modeling. J. Chemom. 2018, 32, e2962. [Google Scholar] [CrossRef]
- Li, Z.; Wang, Y.; Yu, J.; Guo, Y.; Cao, W. Deep Learning Based Radiomics (DLR) and Its Usage in Noninvasive IDH1 Prediction for Low Grade Glioma. Sci. Rep. 2017, 7, 5467. [Google Scholar] [CrossRef] [Green Version]
- Li, Z.; Kim, S.; Zhong, S.; Zhong, Z.; Kato, I.; Zhang, X. Coherent Point Drift Peak Alignment Algorithms Using Distance and Similarity Measures for Two-dimensional Gas Chromatography Mass Spectrometry Data. J. Chemom. 2020, 34, e3236. [Google Scholar] [CrossRef]
- Deng, B.; Kim, S.; Li, H.; Heath, E.; Zhang, X. Global Peak Alignment for Comprehensive Two-Dimensional Gas Chromatography Mass Spectrometry Using Point Matching Algorithms. J. Bioinform. Comput. Biol. 2016, 14, 1650032. [Google Scholar] [CrossRef] [PubMed] [Green Version]
- Yu, H.; Bro, R.; Gallagher, N.B. PARASIAS: A New Method for Analyzing Higher-Order Tensors with Shifting Profiles. Anal. Chim. Acta 2022, 1238, 339848. [Google Scholar] [CrossRef] [PubMed]
- Mishra, P.; Biancolillo, A.; Roger, J.M.; Marini, F.; Rutledge, D.N. New Data Preprocessing Trends Based on Ensemble of Multiple Preprocessing Techniques. TrAC Trends Anal. Chem. 2020, 132, 116045. [Google Scholar] [CrossRef]
- Andersen, C.M.; Bro, R. Variable Selection in Regression—A Tutorial. J. Chemom. 2010, 24, 728–737. [Google Scholar] [CrossRef]
- Li, Y.; Fang, T.; Zhu, S.; Huang, F.; Chen, Z.; Wang, Y. Detection of Olive Oil Adulteration with Waste Cooking Oil via Raman Spectroscopy Combined with IPLS and SiPLS. Spectrochim. Acta A Mol. Biomol. Spectrosc. 2018, 189, 37–43. [Google Scholar] [CrossRef] [PubMed]
- Zhang, Z.; Trevino, V.; Hoseini, S.S.; Belciug, S.; Boopathi, A.M.; Zhang, P.; Gorunescu, F.; Subha, V.; Dai, S. Variable Selection in Logistic Regression Model with Genetic Algorithm. Ann. Transl. Med. 2018, 6, 45. [Google Scholar] [CrossRef] [PubMed] [Green Version]
- Mao, S.; Lu, C.; Li, M.; Ye, Y.; Wei, X.; Tong, H. Identification of Key Aromatic Compounds in Congou Black Tea by Partial Least-square Regression with Variable Importance of Projection Scores and Gas Chromatography–Mass Spectrometry/Gas Chromatography–Olfactometry. J. Sci. Food Agric. 2018, 98, 5278–5286. [Google Scholar] [CrossRef]
- Kvalheim, O.M. Variable Importance: Comparison of Selectivity Ratio and Significance Multivariate Correlation for Interpretation of Latent-variable Regression Models. J. Chemom. 2020, 34, e3211. [Google Scholar] [CrossRef] [Green Version]
- Azizan, A.; Lee, A.X.; Abdul Hamid, N.A.; Maulidiani, M.; Mediani, A.; Abdul Ghafar, S.Z.; Zolkeflee, N.K.Z.; Abas, F. Potentially Bioactive Metabolites from Pineapple Waste Extracts and Their Antioxidant and α-Glucosidase Inhibitory Activities by 1H NMR. Foods 2020, 9, 173. [Google Scholar] [CrossRef] [Green Version]
- Pearson, K. LIII. On Lines and Planes of Closest Fit to Systems of Points in Space. Lond. Edinb. Dublin Philos. Mag. J. Sci. 1901, 2, 559–572. [Google Scholar] [CrossRef] [Green Version]
- Hotelling, H. Analysis of a Complex of Statistical Variables into Principal Components. J. Educ. Psychol. 1933, 24, 417. [Google Scholar] [CrossRef]
- Bro, R.; Smilde, A.K. Principal Component Analysis. Anal. Methods 2014, 6, 2812–2831. [Google Scholar] [CrossRef] [Green Version]
- Granato, D.; Santos, J.S.; Escher, G.B.; Ferreira, B.L.; Maggio, R.M. Use of Principal Component Analysis (PCA) and Hierarchical Cluster Analysis (HCA) for Multivariate Association between Bioactive Compounds and Functional Properties in Foods: A Critical Perspective. Trends Food Sci. Technol. 2018, 72, 83–90. [Google Scholar] [CrossRef]
- Tleis, M.; Callieris, R.; Roma, R. Segmenting the Organic Food Market in Lebanon: An Application of k-Means Cluster Analysis. Br. Food J. 2017, 119, 1423–1441. [Google Scholar] [CrossRef]
- Moro, M.K.; dos Santos, F.D.; Folli, G.S.; Romao, W.; Filgueiras, P.R. A Review of Chemometrics Models to Predict Crude Oil Properties from Nuclear Magnetic Resonance and Infrared Spectroscopy. Fuel 2021, 303, 121283. [Google Scholar] [CrossRef]
- Lee, G.; Lee, K. Feature Selection Using Distributions of Orthogonal PLS Regression Vectors in Spectral Data. BioData Min. 2021, 14, 1–16. [Google Scholar] [CrossRef]
- Vong, R.; Geladi, P.; Wold, S.; Esbensen, K. Source Contributions to Ambient Aerosol Calculated by Discriminat Partial Least Squares Regression (PLS). J. Chemom. 1988, 2, 281–296. [Google Scholar] [CrossRef]
- Bro, R. Multiway Calibration. Multilinear Pls. J. Chemom. 1996, 10, 47–61. [Google Scholar] [CrossRef]
- Yu, H.; Guo, L.; Kharbach, M.; Han, W. Multi-Way Analysis Coupled with near-Infrared Spectroscopy in Food Industry: Models and Applications. Foods 2021, 10, 802. [Google Scholar] [CrossRef]
- Rocha, W.F.d.C.; do Prado, C.B.; Blonder, N. Comparison of Chemometric Problems in Food Analysis Using Non-Linear Methods. Molecules 2020, 25, 3025. [Google Scholar] [CrossRef]
- Ausati, S.; Amanollahi, J. Assessing the Accuracy of ANFIS, EEMD-GRNN, PCR, and MLR Models in Predicting PM 2.5. Atmos. Environ. 2016, 142, 465–474. [Google Scholar] [CrossRef]
- Li, L.-N.; Liu, X.-F.; Yang, F.; Xu, W.-M.; Wang, J.-Y.; Shu, R. A Review of Artificial Neural Network Based Chemometrics Applied in Laser-Induced Breakdown Spectroscopy Analysis. Spectrochim. Acta Part B Spectrosc. 2021, 180, 106183. [Google Scholar] [CrossRef]
- Lee, L.C.; Liong, C.-Y.; Jemain, A.A. Partial Least Squares-Discriminant Analysis (PLS-DA) for Classification of High-Dimensional (HD) Data: A Review of Contemporary Practice Strategies and Knowledge Gaps. Analyst 2018, 143, 3526–3539. [Google Scholar] [CrossRef] [PubMed]
- Branden, K.V.; Hubert, M. Robust Classification in High Dimensions Based on the SIMCA Method. Chemom. Intell. Lab. Syst. 2005, 79, 10–21. [Google Scholar] [CrossRef] [Green Version]
- Bylesjö, M.; Rantalainen, M.; Cloarec, O.; Nicholson, J.K.; Holmes, E.; Trygg, J. OPLS Discriminant Analysis: Combining the Strengths of PLS-DA and SIMCA Classification. J. Chemom. A J. Chemom. Soc. 2006, 20, 341–351. [Google Scholar] [CrossRef]
- Xia, J.; Zhang, J.; Zhao, Y.; Huang, Y.; Xiong, Y.; Min, S. Fourier Transform Infrared Spectroscopy and Chemometrics for the Discrimination of Paper Relic Types. Spectrochim. Acta A Mol. Biomol. Spectrosc. 2019, 219, 8–14. [Google Scholar] [CrossRef]
- Luts, J.; Ojeda, F.; Van de Plas, R.; De Moor, B.; Van Huffel, S.; Suykens, J.A.K. A Tutorial on Support Vector Machine-Based Methods for Classification Problems in Chemometrics. Anal. Chim. Acta 2010, 665, 129–145. [Google Scholar] [CrossRef]
- De Juan, A.; Jaumot, J.; Tauler, R. Multivariate Curve Resolution (MCR). Solving the Mixture Analysis Problem. Anal. Methods 2014, 6, 4964–4976. [Google Scholar] [CrossRef]
- Jaumot, J.; Tauler, R. MCR-BANDS: A User Friendly MATLAB Program for the Evaluation of Rotation Ambiguities in Multivariate Curve Resolution. Chemom. Intell. Lab. Syst. 2010, 103, 96–107. [Google Scholar] [CrossRef]
- Bro, R. PARAFAC. Tutorial and Applications. Chemom. Intell. Lab. Syst. 1997, 38, 149–171. [Google Scholar] [CrossRef]
- Yu, H.; Bro, R. PARAFAC2 and Local Minima. Chemom. Intell. Lab. Syst. 2021, 219, 104446. [Google Scholar] [CrossRef]
- ten Berge, J.M.F.; Kiers, H.A.L. Some Uniqueness Results for PARAFAC2. Psychometrika 1996, 61, 123–132. [Google Scholar] [CrossRef]
- Yu, H.; Augustijn, D.; Bro, R. Accelerating PARAFAC2 Algorithms for Non-Negative Complex Tensor Decomposition. Chemom. Intell. Lab. Syst. 2021, 214, 104312. [Google Scholar] [CrossRef]
- Gamela, R.R.; Pereira-Filho, E.R.; Pereira, F.M.V. Minimal-Invasive Analytical Method and Data Fusion: An Alternative for Determination of Cu, K, Sr, and Zn in Cocoa Beans. Food Anal. Methods 2021, 14, 545–551. [Google Scholar] [CrossRef]
- Sperança, M.A.; Mayorquín-Guevara, J.E.; da Cruz, M.C.P.; de Almeida Teixeira, G.H.; Pereira, F.M.V. Biofortification Quality in Bananas Monitored by Energy-Dispersive X-ray Fluorescence and Chemometrics. Food Chem. 2021, 362, 130172. [Google Scholar] [CrossRef] [PubMed]
- Priyashantha, H.; Höjer, A.; Saedén, K.H.; Lundh, Å.; Johansson, M.; Bernes, G.; Geladi, P.; Hetta, M. Use of Near-Infrared Hyperspectral (NIR-HS) Imaging to Visualize and Model the Maturity of Long-Ripening Hard Cheeses. J. Food Eng. 2020, 264, 109687. [Google Scholar] [CrossRef]
- Darnay, L.; Králik, F.; Oros, G.; Koncz, Á.; Firtha, F. Monitoring the Effect of Transglutaminase in Semi-Hard Cheese during Ripening by Hyperspectral Imaging. J. Food Eng. 2017, 196, 123–129. [Google Scholar] [CrossRef]
- Lu, B.; Sun, J.; Yang, N.; Hang, Y. Fluorescence Hyperspectral Image Technique Coupled with HSI Method to Predict Solanine Content of Potatoes. J. Food Process. Preserv. 2019, 43, e14198. [Google Scholar] [CrossRef]
- Xiao, Q.; Bai, X.; He, Y. Rapid Screen of the Color and Water Content of Fresh-Cut Potato Tuber Slices Using Hyperspectral Imaging Coupled with Multivariate Analysis. Foods 2020, 9, 94. [Google Scholar] [CrossRef] [Green Version]
- Tian, X.-Y.; Aheto, J.H.; Bai, J.-W.; Dai, C.; Ren, Y.; Chang, X. Quantitative Analysis and Visualization of Moisture and Anthocyanins Content in Purple Sweet Potato by Vis–NIR Hyperspectral Imaging. J. Food Process. Preserv. 2021, 45, e15128. [Google Scholar] [CrossRef]
- Li, B.; Cobo-Medina, M.; Lecourt, J.; Harrison, N.; Harrison, R.J.; Cross, J. V Application of Hyperspectral Imaging for Nondestructive Measurement of Plum Quality Attributes. Postharvest Biol. Technol. 2018, 141, 8–15. [Google Scholar] [CrossRef]
- He, H.-J.; Chen, Y.; Li, G.; Wang, Y.; Ou, X.; Guo, J. Hyperspectral Imaging Combined with Chemometrics for Rapid Detection of Talcum Powder Adulterated in Wheat Flour. Food Control 2023, 144, 109378. [Google Scholar] [CrossRef]
- Kim, G.; Lee, H.; Baek, I.; Cho, B.-K.; Kim, M.S. Quantitative Detection of Benzoyl Peroxide in Wheat Flour Using Line-Scan Short-Wave Infrared Hyperspectral Imaging. Sens. Actuators B Chem. 2022, 352, 130997. [Google Scholar] [CrossRef]
- Sun, M.; Zhang, D.; Liu, L.; Wang, Z. How to Predict the Sugariness and Hardness of Melons: A near-Infrared Hyperspectral Imaging Method. Food Chem. 2017, 218, 413–421. [Google Scholar] [CrossRef] [PubMed]
- Wang, H.; Lv, D.; Dong, N.; Wang, S.; Liu, J. Application of Near-Infrared Spectroscopy for Screening the Potato Flour Content in Chinese Steamed Bread. Food Sci. Biotechnol. 2019, 28, 955–963. [Google Scholar] [CrossRef]
- Du, C.; Sun, L.; Bai, H.; Zhao, Z.; Li, X.; Gai, Z. Quantitative Detection of Talcum Powder in Wheat Flour Based on Near-Infrared Spectroscopy and Hybrid Feature Selection. Infrared Phys. Technol. 2022, 123, 104185. [Google Scholar] [CrossRef]
- Kandpal, L.M.; Mouazen, A.M.; Masithoh, R.E.; Mishra, P.; Lohumi, S.; Cho, B.-K.; Lee, H. Sequential Data-Fusion of near-Infrared and Mid-Infrared Spectroscopy Data for Improved Prediction of Quality Traits in Tuber Flours. Infrared Phys. Technol. 2022, 127, 104371. [Google Scholar] [CrossRef]
- Kamboj, U.; Guha, P.; Mishra, S. Comparison of PLSR, MLR, SVM Regression Methods for Determination of Crude Protein and Carbohydrate Content in Stored Wheat Using near Infrared Spectroscopy. Mater. Today Proc. 2022, 48, 576–582. [Google Scholar] [CrossRef]
- Liang, P.-S.; Haff, R.P.; Hua, S.-S.T.; Munyaneza, J.E.; Mustafa, T.; Sarreal, S.B.L. Nondestructive Detection of Zebra Chip Disease in Potatoes Using Near-Infrared Spectroscopy. Biosyst. Eng. 2018, 166, 161–169. [Google Scholar] [CrossRef]
- Jiang, H.; Liu, T.; Chen, Q. Quantitative Detection of Fatty Acid Value during Storage of Wheat Flour Based on a Portable Near-Infrared (NIR) Spectroscopy System. Infrared Phys. Technol. 2020, 109, 103423. [Google Scholar] [CrossRef]
- Ning, H.; Wang, J.; Jiang, H.; Chen, Q. Quantitative Detection of Zearalenone in Wheat Grains Based on Near-Infrared Spectroscopy. Spectrochim. Acta A Mol. Biomol. Spectrosc. 2022, 280, 121545. [Google Scholar] [CrossRef] [PubMed]
- Câmara, A.B.F.; de Oliveira, K.G.; Santos, M.C.D.; de Lima, R.R.S.; de Lima, K.M.G.; de Carvalho, L.S. Multivariate Assessment for Predicting Antioxidant Activity from Clove and Pomegranate Extracts by MCR-ALS and PLS Models Combined to IR Spectroscopy. Food Chem. 2022, 384, 132321. [Google Scholar] [CrossRef] [PubMed]
- Castro, R.C.; Ribeiro, D.S.M.; Santos, J.L.M.; Páscoa, R.N.M.J. Comparison of near Infrared Spectroscopy and Raman Spectroscopy for the Identification and Quantification through MCR-ALS and PLS of Peanut Oil Adulterants. Talanta 2021, 230, 122373. [Google Scholar] [CrossRef]
- Castro, R.C.; Ribeiro, D.S.M.; Santos, J.L.M.; Páscoa, R.N.M.J. Near Infrared Spectroscopy Coupled to MCR-ALS for the Identification and Quantification of Saffron Adulterants: Application to Complex Mixtures. Food Control 2021, 123, 107776. [Google Scholar] [CrossRef]
- Li, S.; Xing, B.; Lin, D.; Yi, H.; Shao, Q. Rapid Detection of Saffron (Crocus sativus L.) Adulterated with Lotus Stamens and Corn Stigmas by near-Infrared Spectroscopy and Chemometrics. Ind. Crops. Prod. 2020, 152, 112539. [Google Scholar] [CrossRef]
- Li, S.; Shao, Q.; Lu, Z.; Duan, C.; Yi, H.; Su, L. Rapid Determination of Crocins in Saffron by Near-Infrared Spectroscopy Combined with Chemometric Techniques. Spectrochim. Acta A Mol. Biomol. Spectrosc. 2018, 190, 283–289. [Google Scholar] [CrossRef]
- Liu, P.; Wang, J.; Li, Q.; Gao, J.; Tan, X.; Bian, X. Rapid Identification and Quantification of Panax Notoginseng with Its Adulterants by near Infrared Spectroscopy Combined with Chemometrics. Spectrochim. Acta A Mol. Biomol. Spectrosc. 2019, 206, 23–30. [Google Scholar] [CrossRef]
- Liu, Y.; Wang, Y.; Xia, Z.; Wang, Y.; Wu, Y.; Gong, Z. Rapid Determination of Phytosterols by NIRS and Chemometric Methods. Spectrochim. Acta A Mol. Biomol. Spectrosc. 2019, 211, 336–341. [Google Scholar] [CrossRef]
- Joshi, R.; Baek, I.; Joshi, R.; Kim, M.S.; Cho, B.-K. Detection of Fabricated Eggs Using Fourier Transform Infrared (FT-IR) Spectroscopy Coupled with Multivariate Classification Techniques. Infrared Phys. Technol. 2022, 123, 104163. [Google Scholar] [CrossRef]
- Mazivila, S.J.; Páscoa, R.N.M.J.; Castro, R.C.; Ribeiro, D.S.M.; Santos, J.L.M. Detection of Melamine and Sucrose as Adulterants in Milk Powder Using Near-Infrared Spectroscopy with DD-SIMCA as One-Class Classifier and MCR-ALS as a Means to Provide Pure Profiles of Milk and of Both Adulterants with Forensic Evidence: A Short Communication. Talanta 2020, 216, 120937. [Google Scholar]
- Novianty, I.; Gilang Baskoro, R.; Iqbal Nurulhaq, M.; Achirul Nanda, M. Empirical Mode Decomposition of Near-Infrared Spectroscopy Signals for Predicting Oil Content in Palm Fruits. Inf. Process. Agric. 2022; in press. [Google Scholar]
- Başar, B.; Özdemir, D. Determination of Honey Adulteration with Beet Sugar and Corn Syrup Using Infrared Spectroscopy and Genetic-algorithm-based Multivariate Calibration. J. Sci. Food Agric. 2018, 98, 5616–5624. [Google Scholar] [CrossRef] [PubMed]
- Qin, J.; Kim, M.S.; Chao, K.; Gonzalez, M.; Cho, B.-K. Quantitative Detection of Benzoyl Peroxide in Wheat Flour Using Line-Scan Macroscale Raman Chemical Imaging. Appl. Spectrosc. 2017, 71, 2469–2476. [Google Scholar] [CrossRef]
- Yuan, H.; Liu, M.; Huang, S.; Zhao, J.; Tao, J. Classification and Detection of Testosterone Propionate and Nandrolone Residues in Duck Meat Using Surface-Enhanced Raman Spectroscopy Coupled with Multivariate Analysis. Poult. Sci. 2021, 100, 296–301. [Google Scholar] [CrossRef]
- Ning, X.; Mu-Hua, L.; Hai-Chao, Y.; Shuang-Gen, H.; Xiao, W.; Jin-Hui, Z.; Jian, C.; Ting, W.; Wei, H.; Yi-Xin, S. Classification of Sulfadimidine and Sulfapyridine in Duck Meat by Surface Enhanced Raman Spectroscopy Combined with Principal Component Analysis and Support Vector Machine. Anal. Lett. 2020, 53, 1513–1524. [Google Scholar] [CrossRef]
- Hara, R.; Ishigaki, M.; Kitahama, Y.; Ozaki, Y.; Genkawa, T. Excitation Wavelength Selection for Quantitative Analysis of Carotenoids in Tomatoes Using Raman Spectroscopy. Food Chem. 2018, 258, 308–313. [Google Scholar] [CrossRef] [PubMed]
- de Oliveira Mendes, T.; Manzolli Rodrigues, B.V.; Simas Porto, B.L.; Alves da Rocha, R.; de Oliveira, M.A.L.; de Castro, F.K.; dos Anjos, V.d.C.; Bell, M.J.V. Raman Spectroscopy as a Fast Tool for Whey Quantification in Raw Milk. Vib. Spectrosc. 2020, 111, 103150. [Google Scholar] [CrossRef]
- Czaja, T.; Baranowska, M.; Mazurek, S.; Szostak, R. Determination of Nutritional Parameters of Yoghurts by FT Raman Spectroscopy. Spectrochim. Acta A Mol. Biomol. Spectrosc. 2018, 196, 413–417. [Google Scholar] [CrossRef]
- Tian, H.; Chen, S.; Li, D.; Lou, X.; Chen, C.; Yu, H. Simultaneous Detection for Adulterations of Maltodextrin, Sodium Carbonate, and Whey in Raw Milk Using Raman Spectroscopy and Chemometrics. J. Dairy. Sci. 2022, 105, 7242–7252. [Google Scholar] [CrossRef]
- Bērziņš, K.; Harrison, S.D.L.; Leong, C.; Fraser-Miller, S.J.; Harper, M.J.; Diana, A.; Gibson, R.S.; Houghton, L.A.; Gordon, K.C. Qualitative and Quantitative Vibrational Spectroscopic Analysis of Macronutrients in Breast Milk. Spectrochim. Acta A Mol. Biomol. Spectrosc. 2021, 246, 118982. [Google Scholar] [CrossRef]
- de Sá Oliveira, K.; de Souza Callegaro, L.; Stephani, R.; Almeida, M.R.; de Oliveira, L.F.C. Analysis of Spreadable Cheese by Raman Spectroscopy and Chemometric Tools. Food Chem. 2016, 194, 441–446. [Google Scholar] [CrossRef]
- Puertas, G.; Vázquez, M. Cholesterol Determination in Egg Yolk by UV-VIS-NIR Spectroscopy. Food Control 2019, 100, 262–268. [Google Scholar] [CrossRef]
- Wang, X.; Esquerre, C.; Downey, G.; Henihan, L.; O’Callaghan, D.; O’Donnell, C. Development of Chemometric Models Using Vis-NIR and Raman Spectral Data Fusion for Assessment of Infant Formula Storage Temperature and Time. Innov. Food Sci. Emerg. Technol. 2021, 67, 102551. [Google Scholar] [CrossRef]
- Valinger, D.; Longin, L.; Grbeš, F.; Benković, M.; Jurina, T.; Gajdoš Kljusurić, J.; Jurinjak Tušek, A. Detection of Honey Adulteratio—The Potential of UV-VIS and NIR Spectroscopy Coupled with Multivariate Analysis. LWT 2021, 145, 111316. [Google Scholar] [CrossRef]
- Galvan, D.; Tanamati, A.A.C.; Casanova, F.; Danieli, E.; Bona, E.; Killner, M.H.M. Compact Low-Field NMR Spectroscopy and Chemometrics Applied to the Analysis of Edible Oils. Food Chem. 2021, 365, 130476. [Google Scholar] [CrossRef]
- Barreto, M.C.; Braga, R.G.; Lemos, S.G.; Fragoso, W.D. Determination of Melamine in Milk by Fluorescence Spectroscopy and Second-Order Calibration. Food Chem. 2021, 364, 130407. [Google Scholar] [CrossRef]
- Gu, H.; Lv, R.; Huang, X.; Chen, Q.; Dong, Y. Rapid Quantitative Assessment of Lipid Oxidation in a Rapeseed Oil-in-Water (o/w) Emulsion by Three-Dimensional Fluorescence Spectroscopy. J. Food Compos. Anal. 2022, 114, 104762. [Google Scholar] [CrossRef]
- Tarhan, İ. A Comparative Study of ATR-FTIR, UV–Visible and Fluorescence Spectroscopy Combined with Chemometrics for Quantification of Squalene in Extra Virgin Olive Oils. Spectrochim. Acta A Mol. Biomol. Spectrosc. 2020, 241, 118714. [Google Scholar] [CrossRef]
- Wu, X.; Bian, X.; Lin, E.; Wang, H.; Guo, Y.; Tan, X. Weighted Multiscale Support Vector Regression for Fast Quantification of Vegetable Oils in Edible Blend Oil by Ultraviolet-Visible Spectroscopy. Food Chem. 2021, 342, 128245. [Google Scholar] [CrossRef]
- Zhang, W.; Li, N.; Feng, Y.; Su, S.; Li, T.; Liang, B. A Unique Quantitative Method of Acid Value of Edible Oils and Studying the Impact of Heating on Edible Oils by UV–Vis Spectrometry. Food Chem. 2015, 185, 326–332. [Google Scholar] [CrossRef]
- Ríos-Reina, R.; Azcarate, S.M.; Camiña, J.; Callejón, R.M. Assessment of UV–Visible Spectroscopy as a Useful Tool for Determining Grape-Must Caramel in High-Quality Wine and Balsamic Vinegars. Food Chem. 2020, 323, 126792. [Google Scholar] [CrossRef]
- Cavdaroglu, C.; Ozen, B. Prediction of Vinegar Processing Parameters with Chemometric Modelling of Spectroscopic Data. Microchem. J. 2021, 171, 106886. [Google Scholar] [CrossRef]
- Santos, P.M.; Pereira-Filho, E.R.; Colnago, L.A. Detection and Quantification of Milk Adulteration Using Time Domain Nuclear Magnetic Resonance (TD-NMR). Microchem. J. 2016, 124, 15–19. [Google Scholar] [CrossRef]
- Liu, J.; Zhang, J.; Tan, Z.; Hou, Q.; Liu, R. Detecting the Content of the Bright Blue Pigment in Cream Based on Deep Learning and Near-Infrared Spectroscopy. Spectrochim. Acta A Mol. Biomol. Spectrosc. 2022, 270, 120757. [Google Scholar] [CrossRef]
- Sun, Q.; Zhang, M.; Yang, P. Combination of LF-NMR and BP-ANN to Monitor Water States of Typical Fruits and Vegetables during Microwave Vacuum Drying. LWT 2019, 116, 108548. [Google Scholar] [CrossRef]
- Hajjar, G.; Haddad, L.; Rizk, T.; Akoka, S.; Bejjani, J. High-Resolution 1H NMR Profiling of Triacylglycerols as a Tool for Authentication of Food from Animal Origin: Application to Hen Egg Matrix. Food Chem. 2021, 360, 130056. [Google Scholar] [CrossRef]
- Jiang, L.; Mehedi Hassan, M.; Jiao, T.; Li, H.; Chen, Q. Rapid Detection of Chlorpyrifos Residue in Rice Using Surface-Enhanced Raman Scattering Coupled with Chemometric Algorithm. Spectrochim. Acta A Mol. Biomol. Spectrosc. 2021, 261, 119996. [Google Scholar] [CrossRef]
- Haddad, L.; Francis, J.; Rizk, T.; Akoka, S.; Remaud, G.S.; Bejjani, J. Cheese Characterization and Authentication through Lipid Biomarkers Obtained by High-Resolution 1H NMR Profiling. Food Chem. 2022, 383, 132434. [Google Scholar] [CrossRef]
- Wang, T.; Wu, H.-L.; Long, W.-J.; Hu, Y.; Cheng, L.; Chen, A.-Q.; Yu, R.-Q. Rapid Identification and Quantification of Cheaper Vegetable Oil Adulteration in Camellia Oil by Using Excitation-Emission Matrix Fluorescence Spectroscopy Combined with Chemometrics. Food Chem. 2019, 293, 348–357. [Google Scholar] [CrossRef]
- Richardson, P.I.C.; Muhamadali, H.; Ellis, D.I.; Goodacre, R. Rapid Quantification of the Adulteration of Fresh Coconut Water by Dilution and Sugars Using Raman Spectroscopy and Chemometrics. Food Chem. 2019, 272, 157–164. [Google Scholar] [CrossRef]
- Galvan, D.; de Andrade, J.C.; Effting, L.; Lelis, C.A.; Melquiades, F.L.; Bona, E.; Conte-Junior, C.A. Energy-Dispersive X-ray Fluorescence Combined with Chemometric Tools Applied to Tomato and Sweet Pepper Classification. Food Control 2023, 143, 109326. [Google Scholar] [CrossRef]
- Scatigno, C.; Festa, G. A First Elemental Pattern and Geo-Discrimination of Italian EVOO by Energy Dispersive X-ray Fluorescence and Chemometrics. Microchem. J. 2021, 171, 106863. [Google Scholar] [CrossRef]
- Panebianco, S.; Mazzoleni, P.; Barone, G.; Musumarra, A.; Pellegriti, M.G.; Pulvirenti, A.; Scordino, A.; Cirvilleri, G. Feasibility Study of Tomato Fruit Characterization by Fast XRF Analysis for Quality Assessment and Food Traceability. Food Chem. 2022, 383, 132364. [Google Scholar] [CrossRef] [PubMed]
- Allegretta, I.; Squeo, G.; Gattullo, C.E.; Porfido, C.; Cicchetti, A.; Caponio, F.; Cesco, S.; Nicoletto, C.; Terzano, R. TXRF Spectral Information Enhanced by Multivariate Analysis: A New Strategy for Food Fingerprint. Food Chem. 2023, 401, 134124. [Google Scholar] [CrossRef] [PubMed]
- Vitali Čepo, D.; Karoglan, M.; Borgese, L.; Depero, L.E.; Marguí, E.; Jablan, J. Application of Benchtop Total-Reflection X-ray Fluorescence Spectrometry and Chemometrics in Classification of Origin and Type of Croatian Wines. Food Chem. X 2022, 13, 100209. [Google Scholar] [CrossRef]
- Li, J.; Chen, L.; Huang, W. Detection of Early Bruises on Peaches (Amygdalus persica L.) Using Hyperspectral Imaging Coupled with Improved Watershed Segmentation Algorithm. Postharvest Biol. Technol. 2018, 135, 104–113. [Google Scholar] [CrossRef]
- He, P.; Wu, Y.; Wang, J.; Ren, Y.; Ahmad, W.; Liu, R.; Ouyang, Q.; Jiang, H.; Chen, Q. Detection of Mites Tyrophagus putrescentiae and Cheyletus eruditus in Flour Using Hyperspectral Imaging System Coupled with Chemometrics. J. Food Process. Eng. 2020, 43, e13386. [Google Scholar] [CrossRef]
- Al-Sarayreh, M.; Reis, M.M.; Yan, W.Q.; Klette, R. Potential of Deep Learning and Snapshot Hyperspectral Imaging for Classification of Species in Meat. Food Control 2020, 117, 107332. [Google Scholar] [CrossRef]
- Pan, L.; Zhang, Q.; Zhang, W.; Sun, Y.; Hu, P.; Tu, K. Detection of Cold Injury in Peaches by Hyperspectral Reflectance Imaging and Artificial Neural Network. Food Chem. 2016, 192, 134–141. [Google Scholar] [CrossRef]
- Sun, Y.; Gu, X.; Sun, K.; Hu, H.; Xu, M.; Wang, Z.; Tu, K.; Pan, L. Hyperspectral Reflectance Imaging Combined with Chemometrics and Successive Projections Algorithm for Chilling Injury Classification in Peaches. LWT 2017, 75, 557–564. [Google Scholar] [CrossRef]
- Babellahi, F.; Paliwal, J.; Erkinbaev, C.; Amodio, M.L.; Chaudhry, M.M.A.; Colelli, G. Early Detection of Chilling Injury in Green Bell Peppers by Hyperspectral Imaging and Chemometrics. Postharvest Biol. Technol. 2020, 162, 111100. [Google Scholar] [CrossRef]
- Cen, H.; Lu, R.; Zhu, Q.; Mendoza, F. Nondestructive Detection of Chilling Injury in Cucumber Fruit Using Hyperspectral Imaging with Feature Selection and Supervised Classification. Postharvest Biol. Technol. 2016, 111, 352–361. [Google Scholar] [CrossRef]
- Carreiro Soares, S.F.; Medeiros, E.P.; Pasquini, C.; de Lelis Morello, C.; Harrop Galvão, R.K.; Ugulino Araújo, M.C. Classification of Individual Cotton Seeds with Respect to Variety Using Near-Infrared Hyperspectral Imaging. Anal. Methods 2016, 8, 8498–8505. [Google Scholar] [CrossRef]
- Fan, S.; Li, C.; Huang, W.; Chen, L. Detection of Blueberry Internal Bruising over Time Using NIR Hyperspectral Reflectance Imaging with Optimum Wavelengths. Postharvest Biol. Technol. 2017, 134, 55–66. [Google Scholar] [CrossRef]
- Sun, Y.; Pessane, I.; Pan, L.; Wang, X. Hyperspectral Characteristics of Bruised Tomatoes as Affected by Drop Height and Fruit Size. LWT 2021, 141, 110863. [Google Scholar] [CrossRef]
- Susič, N.; Žibrat, U.; Širca, S.; Strajnar, P.; Razinger, J.; Knapič, M.; Vončina, A.; Urek, G.; Gerič Stare, B. Discrimination between Abiotic and Biotic Drought Stress in Tomatoes Using Hyperspectral Imaging. Sens. Actuators B Chem. 2018, 273, 842–852. [Google Scholar] [CrossRef] [Green Version]
- Zhao, X.; Que, H.; Sun, X.; Zhu, Q.; Huang, M. Hybrid Convolutional Network Based on Hyperspectral Imaging for Wheat Seed Varieties Classification. Infrared Phys. Technol. 2022, 125, 104270. [Google Scholar] [CrossRef]
- Zhao, Y.; Zhu, S.; Zhang, C.; Feng, X.; Feng, L.; He, Y. Application of Hyperspectral Imaging and Chemometrics for Variety Classification of Maize Seeds. RSC Adv. 2018, 8, 1337–1345. [Google Scholar] [CrossRef]
- Tsouvaltzis, P.; Babellahi, F.; Amodio, M.L.; Colelli, G. Early Detection of Eggplant Fruit Stored at Chilling Temperature Using Different Non-Destructive Optical Techniques and Supervised Classification Algorithms. Postharvest Biol. Technol. 2020, 159, 111001. [Google Scholar] [CrossRef]
- Huang, F.; Song, H.; Guo, L.; Guang, P.; Yang, X.; Li, L.; Zhao, H.; Yang, M. Detection of Adulteration in Chinese Honey Using NIR and ATR-FTIR Spectral Data Fusion. Spectrochim. Acta A Mol. Biomol. Spectrosc. 2020, 235, 118297. [Google Scholar] [CrossRef]
- De Girolamo, A.; von Holst, C.; Cortese, M.; Cervellieri, S.; Pascale, M.; Longobardi, F.; Catucci, L.; Porricelli, A.C.R.; Lippolis, V. Rapid Screening of Ochratoxin A in Wheat by Infrared Spectroscopy. Food Chem. 2019, 282, 95–100. [Google Scholar] [CrossRef]
- Chen, H.; Tan, C.; Lin, Z. Non-Destructive Identification of Native Egg by near-Infrared Spectroscopy and Data Driven-Based Class-Modeling. Spectrochim. Acta A Mol. Biomol. Spectrosc. 2019, 206, 484–490. [Google Scholar] [CrossRef] [PubMed]
- Marquetti, I.; Link, J.V.; Lemes, A.L.G.; Scholz, M.B.d.S.; Valderrama, P.; Bona, E. Partial Least Square with Discriminant Analysis and near Infrared Spectroscopy for Evaluation of Geographic and Genotypic Origin of Arabica Coffee. Comput. Electron. Agric. 2016, 121, 313–319. [Google Scholar] [CrossRef]
- Miao, X.; Miao, Y.; Tao, S.; Liu, D.; Chen, Z.; Wang, J.; Huang, W.; Yu, Y. Classification of Rice Based on Storage Time by Using near Infrared Spectroscopy and Chemometric Methods. Microchem. J. 2021, 171, 106841. [Google Scholar] [CrossRef]
- Rovira, G.; Miaw, C.S.W.; Martins, M.L.C.; Sena, M.M.; de Souza, S.V.C.; Callao, M.P.; Ruisánchez, I. One-Class Model with Two Decision Thresholds for the Rapid Detection of Cashew Nuts Adulteration by Other Nuts. Talanta 2023, 253, 123916. [Google Scholar] [CrossRef]
- Visconti, L.G.; Rodríguez, M.S.; Di Anibal, C. V Determination of Grated Hard Cheeses Adulteration by near Infrared Spectroscopy (NIR) and Multivariate Analysis. Int. Dairy J. 2020, 104, 104647. [Google Scholar] [CrossRef]
- Xie, L.-H.; Tang, S.-Q.; Wei, X.-J.; Sheng, Z.-H.; Shao, G.-N.; Jiao, G.-A.; Hu, S.-K.; Wang-Lin; Hu, P.-S. Simultaneous Determination of Apparent Amylose, Amylose and Amylopectin Content and Classification of Waxy Rice Using near-Infrared Spectroscopy (NIRS). Food Chem. 2022, 388, 132944. [Google Scholar] [CrossRef]
- Ziegler, J.U.; Leitenberger, M.; Longin, C.F.H.; Würschum, T.; Carle, R.; Schweiggert, R.M. Near-Infrared Reflectance Spectroscopy for the Rapid Discrimination of Kernels and Flours of Different Wheat Species. J. Food Compos. Anal. 2016, 51, 30–36. [Google Scholar] [CrossRef]
- Rozali, N.L.; Azizan, K.A.; Singh, R.; Syed Jaafar, S.N.; Othman, A.; Weckwerth, W.; Ramli, U.S. Fourier Transform Infrared (FTIR) Spectroscopy Approach Combined with Discriminant Analysis and Prediction Model for Crude Palm Oil Authentication of Different Geographical and Temporal Origins. Food Control 2022, 146, 109509. [Google Scholar] [CrossRef]
- Márquez, C.; López, M.I.; Ruisánchez, I.; Callao, M.P. FT-Raman and NIR Spectroscopy Data Fusion Strategy for Multivariate Qualitative Analysis of Food Fraud. Talanta 2016, 161, 80–86. [Google Scholar] [CrossRef]
- Unuvar, A.; Boyaci, I.H.; Koksel, H. A Novel Approach for Rapid Discrimination of Common and Durum Wheat Flours Using Spectroscopic Analyses Combined with Chemometrics. J. Cereal Sci. 2021, 100, 103269. [Google Scholar] [CrossRef]
- Amjad, A.; Ullah, R.; Khan, S.; Bilal, M.; Khan, A. Raman Spectroscopy Based Analysis of Milk Using Random Forest Classification. Vib. Spectrosc. 2018, 99, 124–129. [Google Scholar] [CrossRef]
- de Oliveira Mendes, T.; Porto, B.L.S.; Almeida, M.R.; Fantini, C.; Sena, M.M. Discrimination between Conventional and Omega-3 Fatty Acids Enriched Eggs by FT-Raman Spectroscopy and Chemometric Tools. Food Chem. 2019, 273, 144–150. [Google Scholar] [CrossRef] [PubMed]
- Nieuwoudt, M.K.; Holroyd, S.E.; McGoverin, C.M.; Simpson, M.C.; Williams, D.E. Raman Spectroscopy as an Effective Screening Method for Detecting Adulteration of Milk with Small Nitrogen-Rich Molecules and Sucrose. J. Dairy Sci. 2016, 99, 2520–2536. [Google Scholar] [CrossRef] [PubMed] [Green Version]
- Robert, C.; Fraser-Miller, S.J.; Jessep, W.T.; Bain, W.E.; Hicks, T.M.; Ward, J.F.; Craigie, C.R.; Loeffen, M.; Gordon, K.C. Rapid Discrimination of Intact Beef, Venison and Lamb Meat Using Raman Spectroscopy. Food Chem. 2021, 343, 128441. [Google Scholar] [CrossRef]
- Tian, F.; Tan, F.; Li, H. An Rapid Nondestructive Testing Method for Distinguishing Rice Producing Areas Based on Raman Spectroscopy and Support Vector Machine. Vib. Spectrosc. 2020, 107, 103017. [Google Scholar] [CrossRef]
- Wu, X.; Xu, B.; Ma, R.; Gao, S.; Niu, Y.; Zhang, X.; Du, Z.; Liu, H.; Zhang, Y. Botanical Origin Identification and Adulteration Quantification of Honey Based on Raman Spectroscopy Combined with Convolutional Neural Network. Vib. Spectrosc. 2022, 123, 103439. [Google Scholar] [CrossRef]
- Yao, S.; Li, T.; Li, J.; Liu, H.; Wang, Y. Geographic Identification of Boletus Mushrooms by Data Fusion of FT-IR and UV Spectroscopies Combined with Multivariate Statistical Analysis. Spectrochim. Acta A Mol. Biomol. Spectrosc. 2018, 198, 257–263. [Google Scholar] [CrossRef]
- Antônio, D.C.; de Assis, D.C.S.; Botelho, B.G.; Sena, M.M. Detection of Adulterations in a Valuable Brazilian Honey by Using Spectrofluorimetry and Multiway Classification. Food Chem. 2022, 370, 131064. [Google Scholar] [CrossRef]
- Fang, H.; Wu, H.-L.; Wang, T.; Long, W.-J.; Chen, A.-Q.; Ding, Y.-J.; Yu, R.-Q. Excitation-Emission Matrix Fluorescence Spectroscopy Coupled with Multi-Way Chemometric Techniques for Characterization and Classification of Chinese Lager Beers. Food Chem. 2021, 342, 128235. [Google Scholar] [CrossRef]
- Jiménez-Carvelo, A.M.; Lozano, V.A.; Olivieri, A.C. Comparative Chemometric Analysis of Fluorescence and near Infrared Spectroscopies for Authenticity Confirmation and Geographical Origin of Argentinean Extra Virgin Olive Oils. Food Control 2019, 96, 22–28. [Google Scholar] [CrossRef]
- Meng, X.; Yin, C.; Yuan, L.; Zhang, Y.; Ju, Y.; Xin, K.; Chen, W.; Lv, K.; Hu, L. Rapid Detection of Adulteration of Olive Oil with Soybean Oil Combined with Chemometrics by Fourier Transform Infrared, Visible-near-Infrared and Excitation-Emission Matrix Fluorescence Spectroscopy: A Comparative Study. Food Chem. 2023, 405, 134828. [Google Scholar] [CrossRef]
- Yuan, L.; Meng, X.; Xin, K.; Ju, Y.; Zhang, Y.; Yin, C.; Hu, L. A Comparative Study on Classification of Edible Vegetable Oils by Infrared, near Infrared and Fluorescence Spectroscopy Combined with Chemometrics. Spectrochim. Acta A Mol. Biomol. Spectrosc. 2022, 288, 122120. [Google Scholar] [CrossRef] [PubMed]
- Uncu, O.; Ozen, B. A Comparative Study of Mid-Infrared, UV–Visible and Fluorescence Spectroscopy in Combination with Chemometrics for the Detection of Adulteration of Fresh Olive Oils with Old Olive Oils. Food Control 2019, 105, 209–218. [Google Scholar] [CrossRef]
- Gonçalves, T.R.; Rosa, L.N.; Gonçalves, R.P.; Torquato, A.S.; Março, P.H.; Marques Gomes, S.T.; Matsushita, M.; Valderrama, P. Monitoring the Oxidative Stability of Monovarietal Extra Virgin Olive Oils by UV–Vis Spectroscopy and MCR–ALS. Food Anal. Methods 2018, 11, 1936–1943. [Google Scholar] [CrossRef]
- Suhandy, D.; Yulia, M. Peaberry Coffee Discrimination Using UV-Visible Spectroscopy Combined with SIMCA and PLS-DA. Int. J. Food Prop. 2017, 20, S331–S339. [Google Scholar] [CrossRef]
- Torrecilla, J.S.; Aroca-Santos, R.; Cancilla, J.C.; Matute, G. Linear and Non-Linear Modeling to Identify Vinegars in Blends through Spectroscopic Data. LWT-Food Sci. Technol. 2016, 65, 565–571. [Google Scholar] [CrossRef]
- Cavdaroglu, C.; Ozen, B. Detection of Vinegar Adulteration with Spirit Vinegar and Acetic Acid Using UV–Visible and Fourier Transform Infrared Spectroscopy. Food Chem. 2022, 379, 132150. [Google Scholar] [CrossRef]
- Kucharska-Ambrożej, K.; Martyna, A.; Karpińska, J.; Kiełtyka-Dadasiewicz, A.; Kubat-Sikorska, A. Quality Control of Mint Species Based on UV-VIS and FTIR Spectral Data Supported by Chemometric Tools. Food Control 2021, 129, 108228. [Google Scholar] [CrossRef]
- Botoran, O.R.; Ionete, R.E.; Miricioiu, M.G.; Costinel, D.; Radu, G.L.; Popescu, R. Amino Acid Profile of Fruits as Potential Fingerprints of Varietal Origin. Molecules 2019, 24, 4500. [Google Scholar] [CrossRef] [Green Version]
- Consonni, R.; Polla, D.; Cagliani, L.R. Organic and Conventional Coffee Differentiation by NMR Spectroscopy. Food Control 2018, 94, 284–288. [Google Scholar] [CrossRef]
- de Moura Ribeiro, M.V.; Boralle, N.; Redigolo Pezza, H.; Pezza, L.; Toci, A.T. Authenticity of Roasted Coffee Using1H NMR Spectroscopy. J. Food Compos. Anal. 2017, 57, 24–30. [Google Scholar] [CrossRef] [Green Version]
- da Silva, L.A.; Flumignan, D.L.; Tininis, A.G.; Pezza, H.R.; Pezza, L. Discrimination of Brazilian Lager Beer by 1H NMR Spectroscopy Combined with Chemometrics. Food Chem. 2019, 272, 488–493. [Google Scholar] [CrossRef] [PubMed]
- Gougeon, L.; da Costa, G.; Guyon, F.; Richard, T. 1H NMR Metabolomics Applied to Bordeaux Red Wines. Food Chem. 2019, 301, 125257. [Google Scholar] [CrossRef]
- Marseglia, A.; Acquotti, D.; Consonni, R.; Cagliani, L.R.; Palla, G.; Caligiani, A. HR MAS 1H NMR and Chemometrics as Useful Tool to Assess the Geographical Origin of Cocoa Beans–Comparison with HR 1H NMR. Food Res. Int. 2016, 85, 273–281. [Google Scholar] [CrossRef]
- Milani, M.I.; Rossini, E.L.; Catelani, T.A.; Pezza, L.; Toci, A.T.; Pezza, H.R. Authentication of Roasted and Ground Coffee Samples Containing Multiple Adulterants Using NMR and a Chemometric Approach. Food Control 2020, 112, 107104. [Google Scholar] [CrossRef]
- Rachineni, K.; Rao Kakita, V.M.; Awasthi, N.P.; Shirke, V.S.; Hosur, R.V.; Chandra Shukla, S. Identifying Type of Sugar Adulterants in Honey: Combined Application of NMR Spectroscopy and Supervised Machine Learning Classification. Curr. Res. Food Sci. 2022, 5, 272–277. [Google Scholar] [CrossRef]
- Shi, T.; Zhu, M.; Chen, Y.; Yan, X.; Chen, Q.; Wu, X.; Lin, J.; Xie, M. 1H NMR Combined with Chemometrics for the Rapid Detection of Adulteration in Camellia Oils. Food Chem. 2018, 242, 308–315. [Google Scholar] [CrossRef]
- Zhang, Y.; Zhao, Y.; Shen, G.; Zhong, S.; Feng, J. NMR Spectroscopy in Conjugation with Multivariate Statistical Analysis for Distinguishing Plant Origin of Edible Oils. J. Food Compos. Anal. 2018, 69, 140–148. [Google Scholar] [CrossRef]
- Borgese, L.; Bilo, F.; Tsuji, K.; Fernández-Ruiz, R.; Margui, E.; Streli, C.; Pepponi, G.; Stosnach, H.; Yamada, T.; Vandenabeele, P.; et al. First Total Reflection X-ray Fluorescence Round-Robin Test of Water Samples: Preliminary Results. Spectrochim. Acta Part B Spectrosc. 2014, 101, 6–14. [Google Scholar] [CrossRef]
- Xue, X.; Chen, Z.; Wu, H.; Gao, H. Identification of Guiboutia Species by NIR-HSI Spectroscopy. Sci. Rep. 2022, 12, 11507. [Google Scholar] [CrossRef]
- Tao, F.; Ngadi, M. Recent Advances in Rapid and Nondestructive Determination of Fat Content and Fatty Acids Composition of Muscle Foods. Crit. Rev. Food Sci. Nutr. 2018, 58, 1565–1593. [Google Scholar] [CrossRef] [PubMed]
- Wu, D.; Sun, D.-W. Advanced Applications of Hyperspectral Imaging Technology for Food Quality and Safety Analysis and Assessment: A Review—Part I: Fundamentals. Innov. Food Sci. Emerg. Technol. 2013, 19, 1–14. [Google Scholar] [CrossRef]
- Sha, M.; Zhang, D.; Zhang, Z.; Wei, J.; Chen, Y.; Wang, M.; Liu, J. Improving Raman Spectroscopic Identification of Rice Varieties by Feature Extraction. J. Raman Spectrosc. 2020, 51, 702–710. [Google Scholar] [CrossRef]
- Alamprese, C.; Casale, M.; Sinelli, N.; Lanteri, S.; Casiraghi, E. Detection of Minced Beef Adulteration with Turkey Meat by UV–Vis, NIR and MIR Spectroscopy. LWT-Food Sci. Technol. 2013, 53, 225–232. [Google Scholar] [CrossRef]
- Tammer, M.G. Sokrates: Infrared and Raman Characteristic Group Frequencies: Tables and Charts; Wiley: Chichester, UK, 2004. [Google Scholar]
- Mehrnia, M.-A.; Jafari, S.-M.; Makhmal-Zadeh, B.S.; Maghsoudlou, Y. Rheological and Release Properties of Double Nano-Emulsions Containing Crocin Prepared with Angum Gum, Arabic Gum and Whey Protein. Food Hydrocoll. 2017, 66, 259–267. [Google Scholar] [CrossRef]
- Cai, C.; Huang, J.; Zhao, L.; Liu, Q.; Zhang, C.; Wei, C. Heterogeneous Structure and Spatial Distribution in Endosperm of High-Amylose Rice Starch Granules with Different Morphologies. J. Agric. Food Chem. 2014, 62, 10143–10152. [Google Scholar] [CrossRef]
- Jääskeläinen, A.-S.; Holopainen-Mantila, U.; Tamminen, T.; Vuorinen, T. Endosperm and Aleurone Cell Structure in Barley and Wheat as Studied by Optical and Raman Microscopy. J. Cereal Sci. 2013, 57, 543–550. [Google Scholar] [CrossRef]
- Piot, O.; Autran, J.-C.; Manfait, M. Spatial Distribution of Protein and Phenolic Constituents in Wheat Grain as Probed by Confocal Raman Microspectroscopy. J. Cereal Sci. 2000, 32, 57–71. [Google Scholar] [CrossRef]
- Nakajima, S.; Kuroki, S.; Ikehata, A. Selective Detection of Starch in Banana Fruit with Raman Spectroscopy. Food Chem. 2023, 401, 134166. [Google Scholar] [CrossRef]
- Czaja, T.; Mazurek, S.; Szostak, R. Quantification of Gluten in Wheat Flour by FT-Raman Spectroscopy. Food Chem. 2016, 211, 560–563. [Google Scholar] [CrossRef]
- Tay, M.; Fang, G.; Chia, P.L.; Li, S.F.Y. Rapid Screening for Detection and Differentiation of Detergent Powder Adulteration in Infant Milk Formula by LC–MS. Forensic Sci. Int. 2013, 232, 32–39. [Google Scholar] [CrossRef] [PubMed]
- Taylan, O.; Cebi, N.; Tahsin Yilmaz, M.; Sagdic, O.; Bakhsh, A.A. Detection of Lard in Butter Using Raman Spectroscopy Combined with Chemometrics. Food Chem. 2020, 332, 127344. [Google Scholar] [CrossRef] [PubMed]
- Wang, Q.; Lonergan, S.M.; Yu, C. Rapid Determination of Pork Sensory Quality Using Raman Spectroscopy. Meat Sci. 2012, 91, 232–239. [Google Scholar] [CrossRef] [Green Version]
- Fowler, S.M.; Hopkins, D.L.; Torley, P.J.; Gill, H.; Blanch, E.W. Investigation of Chemical Composition of Meat Using Spatially Off-Set Raman Spectroscopy. Analyst 2019, 144, 2618–2627. [Google Scholar]
- Karunathilaka, S.R.; Yakes, B.J.; He, K.; Brückner, L.; Mossoba, M.M. First Use of Handheld Raman Spectroscopic Devices and On-Board Chemometric Analysis for the Detection of Milk Powder Adulteration. Food Control 2018, 92, 137–146. [Google Scholar] [CrossRef]
- Aykas, D.P.; Shotts, M.-L.; Rodriguez-Saona, L.E. Authentication of Commercial Honeys Based on Raman Fingerprinting and Pattern Recognition Analysis. Food Control 2020, 117, 107346. [Google Scholar] [CrossRef]
- Kelis Cardoso, V.G.; Poppi, R.J. Cleaner and Faster Method to Detect Adulteration in Cassava Starch Using Raman Spectroscopy and One-Class Support Vector Machine. Food Control 2021, 125, 107917. [Google Scholar] [CrossRef]
- Figueiredo, L.P.; Borém, F.M.; Almeida, M.R.; de Oliveira, L.F.C.; de Carvalho Alves, A.P.; dos Santos, C.M.; Rios, P.A. Raman Spectroscopy for the Differentiation of Arabic Coffee Genotypes. Food Chem. 2019, 288, 262–267. [Google Scholar] [CrossRef]
- Jiménez-Carvelo, A.M.; Osorio, M.T.; Koidis, A.; González-Casado, A.; Cuadros-Rodríguez, L. Chemometric Classification and Quantification of Olive Oil in Blends with Any Edible Vegetable Oils Using FTIR-ATR and Raman Spectroscopy. LWT 2017, 86, 174–184. [Google Scholar] [CrossRef] [Green Version]
- Jin, H.; Li, H.; Yin, Z.; Zhu, Y.; Lu, A.; Zhao, D.; Li, C. Application of Raman Spectroscopy in the Rapid Detection of Waste Cooking Oil. Food Chem. 2021, 362, 130191. [Google Scholar] [CrossRef]
- Trimigno, A.; Marincola, F.C.; Dellarosa, N.; Picone, G.; Laghi, L. Definition of Food Quality by NMR-Based Foodomics. Curr. Opin. Food Sci. 2015, 4, 99–104. [Google Scholar] [CrossRef]
- Ullah, R.; Khan, S.; Ali, H.; Bilal, M. Potentiality of Using Front Face Fluorescence Spectroscopy for Quantitative Analysis of Cow Milk Adulteration in Buffalo Milk. Spectrochim. Acta A Mol. Biomol. Spectrosc. 2020, 225, 117518. [Google Scholar] [CrossRef]
- Liu, H.; Chen, Y.; Shi, C.; Yang, X.; Han, D. FT-IR and Raman Spectroscopy Data Fusion with Chemometrics for Simultaneous Determination of Chemical Quality Indices of Edible Oils during Thermal Oxidation. LWT 2020, 119, 108906. [Google Scholar] [CrossRef]
- Li, Y.; Huang, Y.; Xia, J.; Xiong, Y.; Min, S. Quantitative Analysis of Honey Adulteration by Spectrum Analysis Combined with Several High-Level Data Fusion Strategies. Vib. Spectrosc. 2020, 108, 103060. [Google Scholar] [CrossRef]
- Wang, W.; Paliwal, J. Near-Infrared Spectroscopy and Imaging in Food Quality and Safety. Sens. Instrum. Food Qual. Saf. 2007, 1, 193–207. [Google Scholar] [CrossRef]
- Kademi, H.I.; Ulusoy, B.H.; Hecer, C. Applications of Miniaturized and Portable near Infrared Spectroscopy (NIRS) for Inspection and Control of Meat and Meat Products. Food Rev. Int. 2019, 35, 201–220. [Google Scholar] [CrossRef]
- McVey, C.; Elliott, C.T.; Cannavan, A.; Kelly, S.D.; Petchkongkaew, A.; Haughey, S.A. Portable Spectroscopy for High Throughput Food Authenticity Screening: Advancements in Technology and Integration into Digital Traceability Systems. Trends Food Sci. Technol. 2021, 118, 777–790. [Google Scholar] [CrossRef]
- Herrero, A.M. Raman Spectroscopy a Promising Technique for Quality Assessment of Meat and Fish: A Review. Food Chem. 2008, 107, 1642–1651. [Google Scholar] [CrossRef]
- Özbalci, B.; Boyaci, İ.H.; Topcu, A.; Kadılar, C.; Tamer, U. Rapid Analysis of Sugars in Honey by Processing Raman Spectrum Using Chemometric Methods and Artificial Neural Networks. Food Chem. 2013, 136, 1444–1452. [Google Scholar] [CrossRef]
- Prieto, N.; Dugan, M.E.R.; Juárez, M.; López-Campos, Ó.; Zijlstra, R.T.; Aalhus, J.L. Using Portable Near-Infrared Spectroscopy to Predict Pig Subcutaneous Fat Composition and Iodine Value. Can. J. Anim. Sci. 2017, 98, 221–229. [Google Scholar] [CrossRef]
- Mishra, P.; Sytsma, M.; Chauhan, A.; Polder, G.; Pekkeriet, E. All-in-One: A Spectral Imaging Laboratory System for Standardised Automated Image Acquisition and Real-Time Spectral Model Deployment. Anal. Chim. Acta 2022, 1190, 339235. [Google Scholar] [CrossRef] [PubMed]
- Mishra, P.; Nordon, A.; Asaari, M.S.M.; Lian, G.; Redfern, S. Fusing Spectral and Textural Information in Near-Infrared Hyperspectral Imaging to Improve Green Tea Classification Modelling. J. Food Eng. 2019, 249, 40–47. [Google Scholar] [CrossRef] [Green Version]
- Bwambok, D.K.; Siraj, N.; Macchi, S.; Larm, N.E.; Baker, G.A.; Pérez, R.L.; Ayala, C.E.; Walgama, C.; Pollard, D.; Rodriguez, J.D. QCM Sensor Arrays, Electroanalytical Techniques and NIR Spectroscopy Coupled to Multivariate Analysis for Quality Assessment of Food Products, Raw Materials, Ingredients and Foodborne Pathogen Detection: Challenges and Breakthroughs. Sensors 2020, 20, 6982. [Google Scholar] [CrossRef] [PubMed]
- Beć, K.B.; Grabska, J.; Huck, C.W. Miniaturized NIR Spectroscopy in Food Analysis and Quality Control: Promises, Challenges, and Perspectives. Foods 2022, 11, 1465. [Google Scholar] [CrossRef]
- Hassan, H.; Fan, M.; Zhang, T.; Yang, K. Prediction of Total Phenolics and Flavonoids Contents in Chinese Wild Rice (Zizania latifolia) Using FT-NIR Spectroscopy. Am. J. Food Technol. 2015, 10, 109–117. [Google Scholar] [CrossRef] [Green Version]
- Fu, Y.; Liu, W.; Soladoye, O. Towards innovative food processing of flavonoid compounds: Insights into stability and bioactivity. Lwt Food Sci. Technol. 2021, 150, 111968. [Google Scholar] [CrossRef]
- Power, A.C.; Chapman, J.; Chandra, S.; Cozzolino, D. Ultraviolet-Visible Spectroscopy for Food Quality Analysis. In Evaluation Technologies for Food Quality; Woodhead Publishing: Sawston, UK, 2019; pp. 91–104. [Google Scholar]
- Ali, M.M.; Hashim, N. Non-Destructive Methods for Detection of Food Quality. In Future Foods; Elsevier: Amsterdam, The Netherlands, 2022; pp. 645–667. [Google Scholar]
- Xu, W.; Liu, X.; Xie, L.; Ying, Y. Comparison of Fourier Transform Near-Infrared, Visible near-Infrared, Mid-Infrared, and Raman Spectroscopy as Non-Invasive Tools for Transgenic Rice Discrimination. Trans. ASABE 2014, 57, 141–150. [Google Scholar]
- Corvucci, F.; Nobili, L.; Melucci, D.; Grillenzoni, F.-V. The Discrimination of Honey Origin Using Melissopalynology and Raman Spectroscopy Techniques Coupled with Multivariate Analysis. Food Chem. 2015, 169, 297–304. [Google Scholar] [CrossRef]
- Ohtsuki, T.; Sato, K.; Abe, Y.; Sugimoto, N.; Akiyama, H. Quantification of Acesulfame Potassium in Processed Foods by Quantitative 1H NMR. Talanta 2015, 131, 712–718. [Google Scholar] [CrossRef]
- Nogales-Bueno, J.; Rodríguez-Pulido, F.J.; Heredia, F.J.; Hernández-Hierro, J.M. Comparative Study on the Use of Anthocyanin Profile, Color Image Analysis and near-Infrared Hyperspectral Imaging as Tools to Discriminate between Four Autochthonous Red Grape Cultivars from La Rioja (Spain). Talanta 2015, 131, 412–416. [Google Scholar] [CrossRef]
- Marvin, H.J.P.; Bouzembrak, Y.; Janssen, E.M.; van der Fels-Klerx, H.J.; van Asselt, E.D.; Kleter, G.A. A Holistic Approach to Food Safety Risks: Food Fraud as an Example. Food Res. Int. 2016, 89, 463–470. [Google Scholar] [CrossRef] [PubMed]
- Mendoza, F.A.; Cichy, K.; Lu, R.; Kelly, J.D. Evaluation of Canning Quality Traits in Black Beans (Phaseolus vulgaris L.) by Visible/near-Infrared Spectroscopy. Food Bioproc. Tech. 2014, 7, 2666–2678. [Google Scholar] [CrossRef]
- Wang, L.; Liu, D.; Pu, H.; Sun, D.-W.; Gao, W.; Xiong, Z. Use of Hyperspectral Imaging to Discriminate the Variety and Quality of Rice. Food Anal. Methods 2015, 8, 515–523. [Google Scholar] [CrossRef]
- Mahesh, S.; Jayas, D.S.; Paliwal, J.; White, N.D.G. Comparison of Partial Least Squares Regression (PLSR) and Principal Components Regression (PCR) Methods for Protein and Hardness Predictions Using the near-Infrared (NIR) Hyperspectral Images of Bulk Samples of Canadian Wheat. Food Bioproc. Tech. 2015, 8, 31–40. [Google Scholar] [CrossRef]
- Barbedo, J.; Guarienti, E.; Tibola, C. Detection of sprout damage in wheat kernels using NIR hyperspectral imaging. Biosyst. Eng. 2018, 175, 124–132. [Google Scholar] [CrossRef] [Green Version]
- Ji, Y.; Sun, L.; Li, Y.; Li, J.; Liu, S.; Xu, X.; Yuantong, X. Non-destructive classification of defective potatoes based on hyperspectral imaging and support vector machine. Infrared Phys. Technol. 2019, 99, 71–79. [Google Scholar] [CrossRef]
- Li, F.; Wang, J.; Xu, L.; Wang, S.; Zhou, M.; Yin, J.; Lu, A. Rapid Screening of Cadmium in Rice and Identification of Geographical Origins by Spectral Method. Int. J. Environ. Res. Public Health 2018, 15, 312. [Google Scholar] [CrossRef] [Green Version]
- Lamanna, R.; Cattivelli, L.; Miglietta, M.L.; Troccoli, A. Geographical Origin of Durum Wheat Studied by 1H-NMR Profiling. Magn. Reson. Chem. 2011, 49, 1–5. [Google Scholar] [CrossRef]
- Monakhova, Y.B.; Rutledge, D.N.; Roßmann, A.; Waiblinger, H.; Mahler, M.; Ilse, M.; Kuballa, T.; Lachenmeier, D.W. Determination of Rice Type by 1H NMR Spectroscopy in Combination with Different Chemometric Tools. J. Chemom. 2014, 28, 83–92. [Google Scholar] [CrossRef]
- Agelet, L.E.; Ellis, D.D.; Duvick, S.; Goggi, A.S.; Hurburgh, C.R.; Gardner, C.A. Feasibility of near Infrared Spectroscopy for Analyzing Corn Kernel Damage and Viability of Soybean and Corn Kernels. J. Cereal. Sci. 2012, 55, 160–165. [Google Scholar] [CrossRef] [Green Version]
- Haughey, S.A.; Graham, S.F.; Cancouët, E.; Elliott, C.T. The Application of Near-Infrared Reflectance Spectroscopy (NIRS) to Detect Melamine Adulteration of Soya Bean Meal. Food Chem. 2013, 136, 1557–1561. [Google Scholar] [CrossRef] [PubMed]
- Liu, J.; Wen, Y.; Dong, N.; Lai, C.; Zhao, G. Authentication of Lotus Root Powder Adulterated with Potato Starch and/or Sweet Potato Starch Using Fourier Transform Mid-Infrared Spectroscopy. Food Chem. 2013, 141, 3103–3109. [Google Scholar] [CrossRef] [PubMed]
- Kouvoutsakis, G.; Mitsi, C.; Tarantilis, P.A.; Polissiou, M.G.; Pappas, C.S. Geographical Differentiation of Dried Lentil Seed (Lens culinaris) Samples Using Diffuse Reflectance Fourier Transform Infrared Spectroscopy (DRIFTS) and Discriminant Analysis. Food Chem. 2014, 145, 1011–1014. [Google Scholar] [CrossRef]
- Serranti, S.; Cesare, D.; Bonifazi, G. The Development of a Hyperspectral Imaging Method for the Detection of Fusarium-Damaged, Yellow Berry and Vitreous Italian Durum Wheat Kernels. Biosyst. Eng. 2013, 115, 20–30. [Google Scholar] [CrossRef]
- Panero, J.; Silva, H.; Panero, P.; Smiderle, O.; Panero, F.; Faria, F.; Rodríguez, A. Separation of Cultivars of Soybeans by Chemometric Methods Using Near Infrared Spectroscopy. J. Agric. Sci. 2018, 10, 351–360. [Google Scholar] [CrossRef] [Green Version]
- Mishra, P.; Herrero-Langreo, A.; Barreiro, P.; Roger, J.M.; Diezma, B.; Gorretta, N.; Lleó, L. Detection and Quantification of Peanut Traces in Wheat Flour by near Infrared Hyperspectral Imaging Spectroscopy Using Principal-Component Analysis. J. Near Infrared Spectrosc. 2015, 23, 15–22. [Google Scholar] [CrossRef]
- Zhang, Z.; Li, E.; Fan, X.; Yang, C.; Ma, H.; Gilbert, R. The effects of the chain-length distributions of starch molecules on rheological and thermal properties of wheat flour paste. Food Hydrocoll. 2020, 101, 105563. [Google Scholar] [CrossRef]
- Li, Q.; Li, C.; Li, E.; Gilbert, R.; Xu, B. A molecular explanation of wheat starch physicochemical properties related to noodle eating quality. Food Hydrocoll. 2020, 108, 106035. [Google Scholar] [CrossRef]
- Corpaş, L.; Hădărugă, N.G.; David, I.; Pîrşan, P.; Hădărugă, D.I.; Isengard, H.-D. Karl Fischer Water Titration− Principal Component Analysis Approach on Wheat Flour. Food Anal. Methods 2014, 7, 1353–1358. [Google Scholar] [CrossRef]
- Dreher, J.; Blach, C.; Terjung, N.; Gibis, M.; Weiss, J. Influence of protein content on plant-based emulsified and crosslinked fat crystal networks to mimic animal fat tissue. Food Hydrocoll. 2020, 106, 105864. [Google Scholar] [CrossRef]
- Nie, P.; Wu, D.; Yang, Y.; He, Y. Fast Determination of Boiling Time of Yardlong Bean Using Visible and near Infrared Spectroscopy and Chemometrics. J. Food Eng. 2012, 109, 155–161. [Google Scholar] [CrossRef]
- Ferreira, D.S.; Galão, O.F.; Pallone, J.A.L.; Poppi, R.J. Comparison and Application of Near-Infrared (NIR) and Mid-Infrared (MIR) Spectroscopy for Determination of Quality Parameters in Soybean Samples. Food Control 2014, 35, 227–232. [Google Scholar] [CrossRef]
- Ferreira, D.S.; Pallone, J.A.L.; Poppi, R.J. Fourier Transform Near-Infrared Spectroscopy (FT-NIRS) Application to Estimate Brazilian Soybean [Glycine Max (L.) Merril] Composition. Food Res. Int. 2013, 51, 53–58. [Google Scholar] [CrossRef] [Green Version]
- López, A.; Arazuri, S.; Jarén, C.; Mangado, J.; Arnal, P.; de Galarreta, J.I.R.; Riga, P.; López, R. Crude Protein Content Determination of Potatoes by NIRS Technology. Procedia Technol. 2013, 8, 488–492. [Google Scholar] [CrossRef] [Green Version]
- Rady, A.M.; Guyer, D.E.; Kirk, W.; Donis-González, I.R. The Potential Use of Visible/near Infrared Spectroscopy and Hyperspectral Imaging to Predict Processing-Related Constituents of Potatoes. J. Food Eng. 2014, 135, 11–25. [Google Scholar] [CrossRef]
- Uarrota, V.G.; Moresco, R.; Coelho, B.; da Costa Nunes, E.; Peruch, L.A.M.; de Oliveira Neubert, E.; Rocha, M.; Maraschin, M. Metabolomics Combined with Chemometric Tools (PCA, HCA, PLS-DA and SVM) for Screening Cassava (Manihot esculenta Crantz) Roots during Postharvest Physiological Deterioration. Food Chem. 2014, 161, 67–78. [Google Scholar] [CrossRef] [Green Version]
- Sanchez, T.; Ceballos, H.; Dufour, D.; Ortiz, D.; Morante, N.; Calle, F.; Zum Felde, T.; Dominguez, M.; Davrieux, F. Prediction of Carotenoids, Cyanide and Dry Matter Contents in Fresh Cassava Root Using NIRS and Hunter Color Techniques. Food Chem. 2014, 151, 444–451. [Google Scholar] [CrossRef]
- Kovalsky, P.; Kos, G.; Nährer, K.; Schwab, C.; Jenkins, T.; Schatzmayr, G.; Sulyok, M.; Krska, R. Co-Occurrence of Regulated, Masked and Emerging Mycotoxins and Secondary Metabolites in Finished Feed and Maize—An Extensive Survey. Toxins 2016, 8, 363. [Google Scholar] [CrossRef] [Green Version]
- Cheli, F.; Battaglia, D.; Gallo, R.; Dell’Orto, V. EU Legislation on Cereal Safety: An Update with a Focus on Mycotoxins. Food Control 2014, 37, 315–325. [Google Scholar] [CrossRef]
- Yao, H.; Hruska, Z.; Kincaid, R.; Brown, R.L.; Bhatnagar, D.; Cleveland, T.E. Hyperspectral Image Classification and Development of Fluorescence Index for Single Corn Kernels Infected with Aspergillus Flavus. Trans. ASABE 2013, 56, 1977–1988. [Google Scholar]
- Twarużek, M.; Skrzydlewski, P.; Kosicki, R.; Grajewski, J. Mycotoxins survey in feed materials and feedingstuffs in years 2015–2020. Toxicon Off. J. Int. Soc. Toxinology 2021, 202, 27–39. [Google Scholar] [CrossRef]
- Ahmed, N.; Khan, S.H.; Anjum, M.A.; Rehman, A. A Cost Effective Preparative Thin Layer Chromatography Cleanup Method for High Performance Liquid Chromatography Analysis of Aflatoxins B1, B2 and G2. Adv. Life Sci. 2014, 2, 1–4. [Google Scholar]
- Sirisomboon, C.D.; Putthang, R.; Sirisomboon, P. Application of near Infrared Spectroscopy to Detect Aflatoxigenic Fungal Contamination in Rice. Food Control 2013, 33, 207–214. [Google Scholar] [CrossRef]
- Della Riccia Giacomo, D.Z.S. A Multivariate Regression Model for Detection of Fumonisins Content in Maize from near Infrared Spectra. Food Chem. 2013, 141, 4289–4294. [Google Scholar] [CrossRef] [PubMed]
- Kaya-Celiker, H.; Mallikarjunan, P.K.; Schmale III, D.; Christie, M.E. Discrimination of Moldy Peanuts with Reference to Aflatoxin Using FTIR-ATR System. Food Control 2014, 44, 64–71. [Google Scholar] [CrossRef]
- Kim, K.; Shim, W.; Kim, J.; Chung, D. Development of a simultaneous lateral flow strip test for the rapid and simple detection of deoxynivalenol and zearalenone. J. Food Sci. 2014, 79, M2048–M2055. [Google Scholar] [CrossRef] [PubMed]
- Singh, C.B.; Jayas, D.S.; Paliwal, J.; White, N.D.G. Identification of Insect-Damaged Wheat Kernels Using Short-Wave near-Infrared Hyperspectral and Digital Colour Imaging. Comput. Electron. Agric. 2010, 73, 118–125. [Google Scholar] [CrossRef]
- Singh, C.B.; Jayas, D.S.; Paliwal, J.; White, N.D.G. Detection of Insect-Damaged Wheat Kernels Using near-Infrared Hyperspectral Imaging. J. Stored Prod. Res. 2009, 45, 151–158. [Google Scholar] [CrossRef]
- Jenni, S.; Truco, M.; Michelmore, R. Quantitative trait loci associated with tipburn, heat stress-induced physiological disorders, and maturity traits in crisphead lettuce. Theor. Appl. Genet. 2013, 126, 3065–3079. [Google Scholar] [CrossRef]
- Bamberg, J.; Lombard, K.; Palta, J.; Workmaster, B.; Atucha, A. Survival of Solanum jamesii Tubers at Freezing Temperatures. Am. J. Potato Res. 2020, 97, 497–504. [Google Scholar] [CrossRef]
- Elbatawi, I.E. An Acoustic Impact Method to Detect Hollow Heart of Potato Tubers. Biosyst. Eng. 2008, 100, 206–213. [Google Scholar] [CrossRef]
- Zhou, Z.; Zeng, S.; Li, X.; Zheng, J. Nondestructive Detection of Blackheart in Potato by Visible/near Infrared Transmittance Spectroscopy. J. Spectrosc. 2015, 2015, 786709. [Google Scholar] [CrossRef] [Green Version]
- Dacal-Nieto, A.; Formella, A.; Carrión, P.; Vazquez-Fernandez, E.; Fernández-Delgado, M. Non–Destructive Detection of Hollow Heart in Potatoes Using Hyperspectral Imaging. In Proceedings of the International Conference on Computer Analysis of Images and Patterns, Seville, Spain, 29–31 August 2011; Springer: Berlin/Heidelberg, Germany, 2011; pp. 180–187. [Google Scholar]
- Vanoli, M.; Rizzolo, A.; Spinelli, L.; Parisi, B.; Torricelli, A. Non Destructive Detection of Internal Brown Spot in Potato Tubers by Time-Resolved Reflectance Spectroscopy: Preliminary Results on a Susceptible Cultivar. In Proceedings of the International Conference of Agricultural Engineering, CIGRAgeng 2012, Valencia, Spain, 8–12 July 2012. [Google Scholar]
Figure 1.
A general workflow of advanced spectroscopic techniques combined with chemometric approaches for food analysis.
Figure 1.
A general workflow of advanced spectroscopic techniques combined with chemometric approaches for food analysis.

Figure 2.
A roadmap example for chemometric approaches applied to different spectroscopic data for both quantitative and qualitative food analysis purposes.
Figure 2.
A roadmap example for chemometric approaches applied to different spectroscopic data for both quantitative and qualitative food analysis purposes.

Figure 3.
Factors that affect the quality of food.


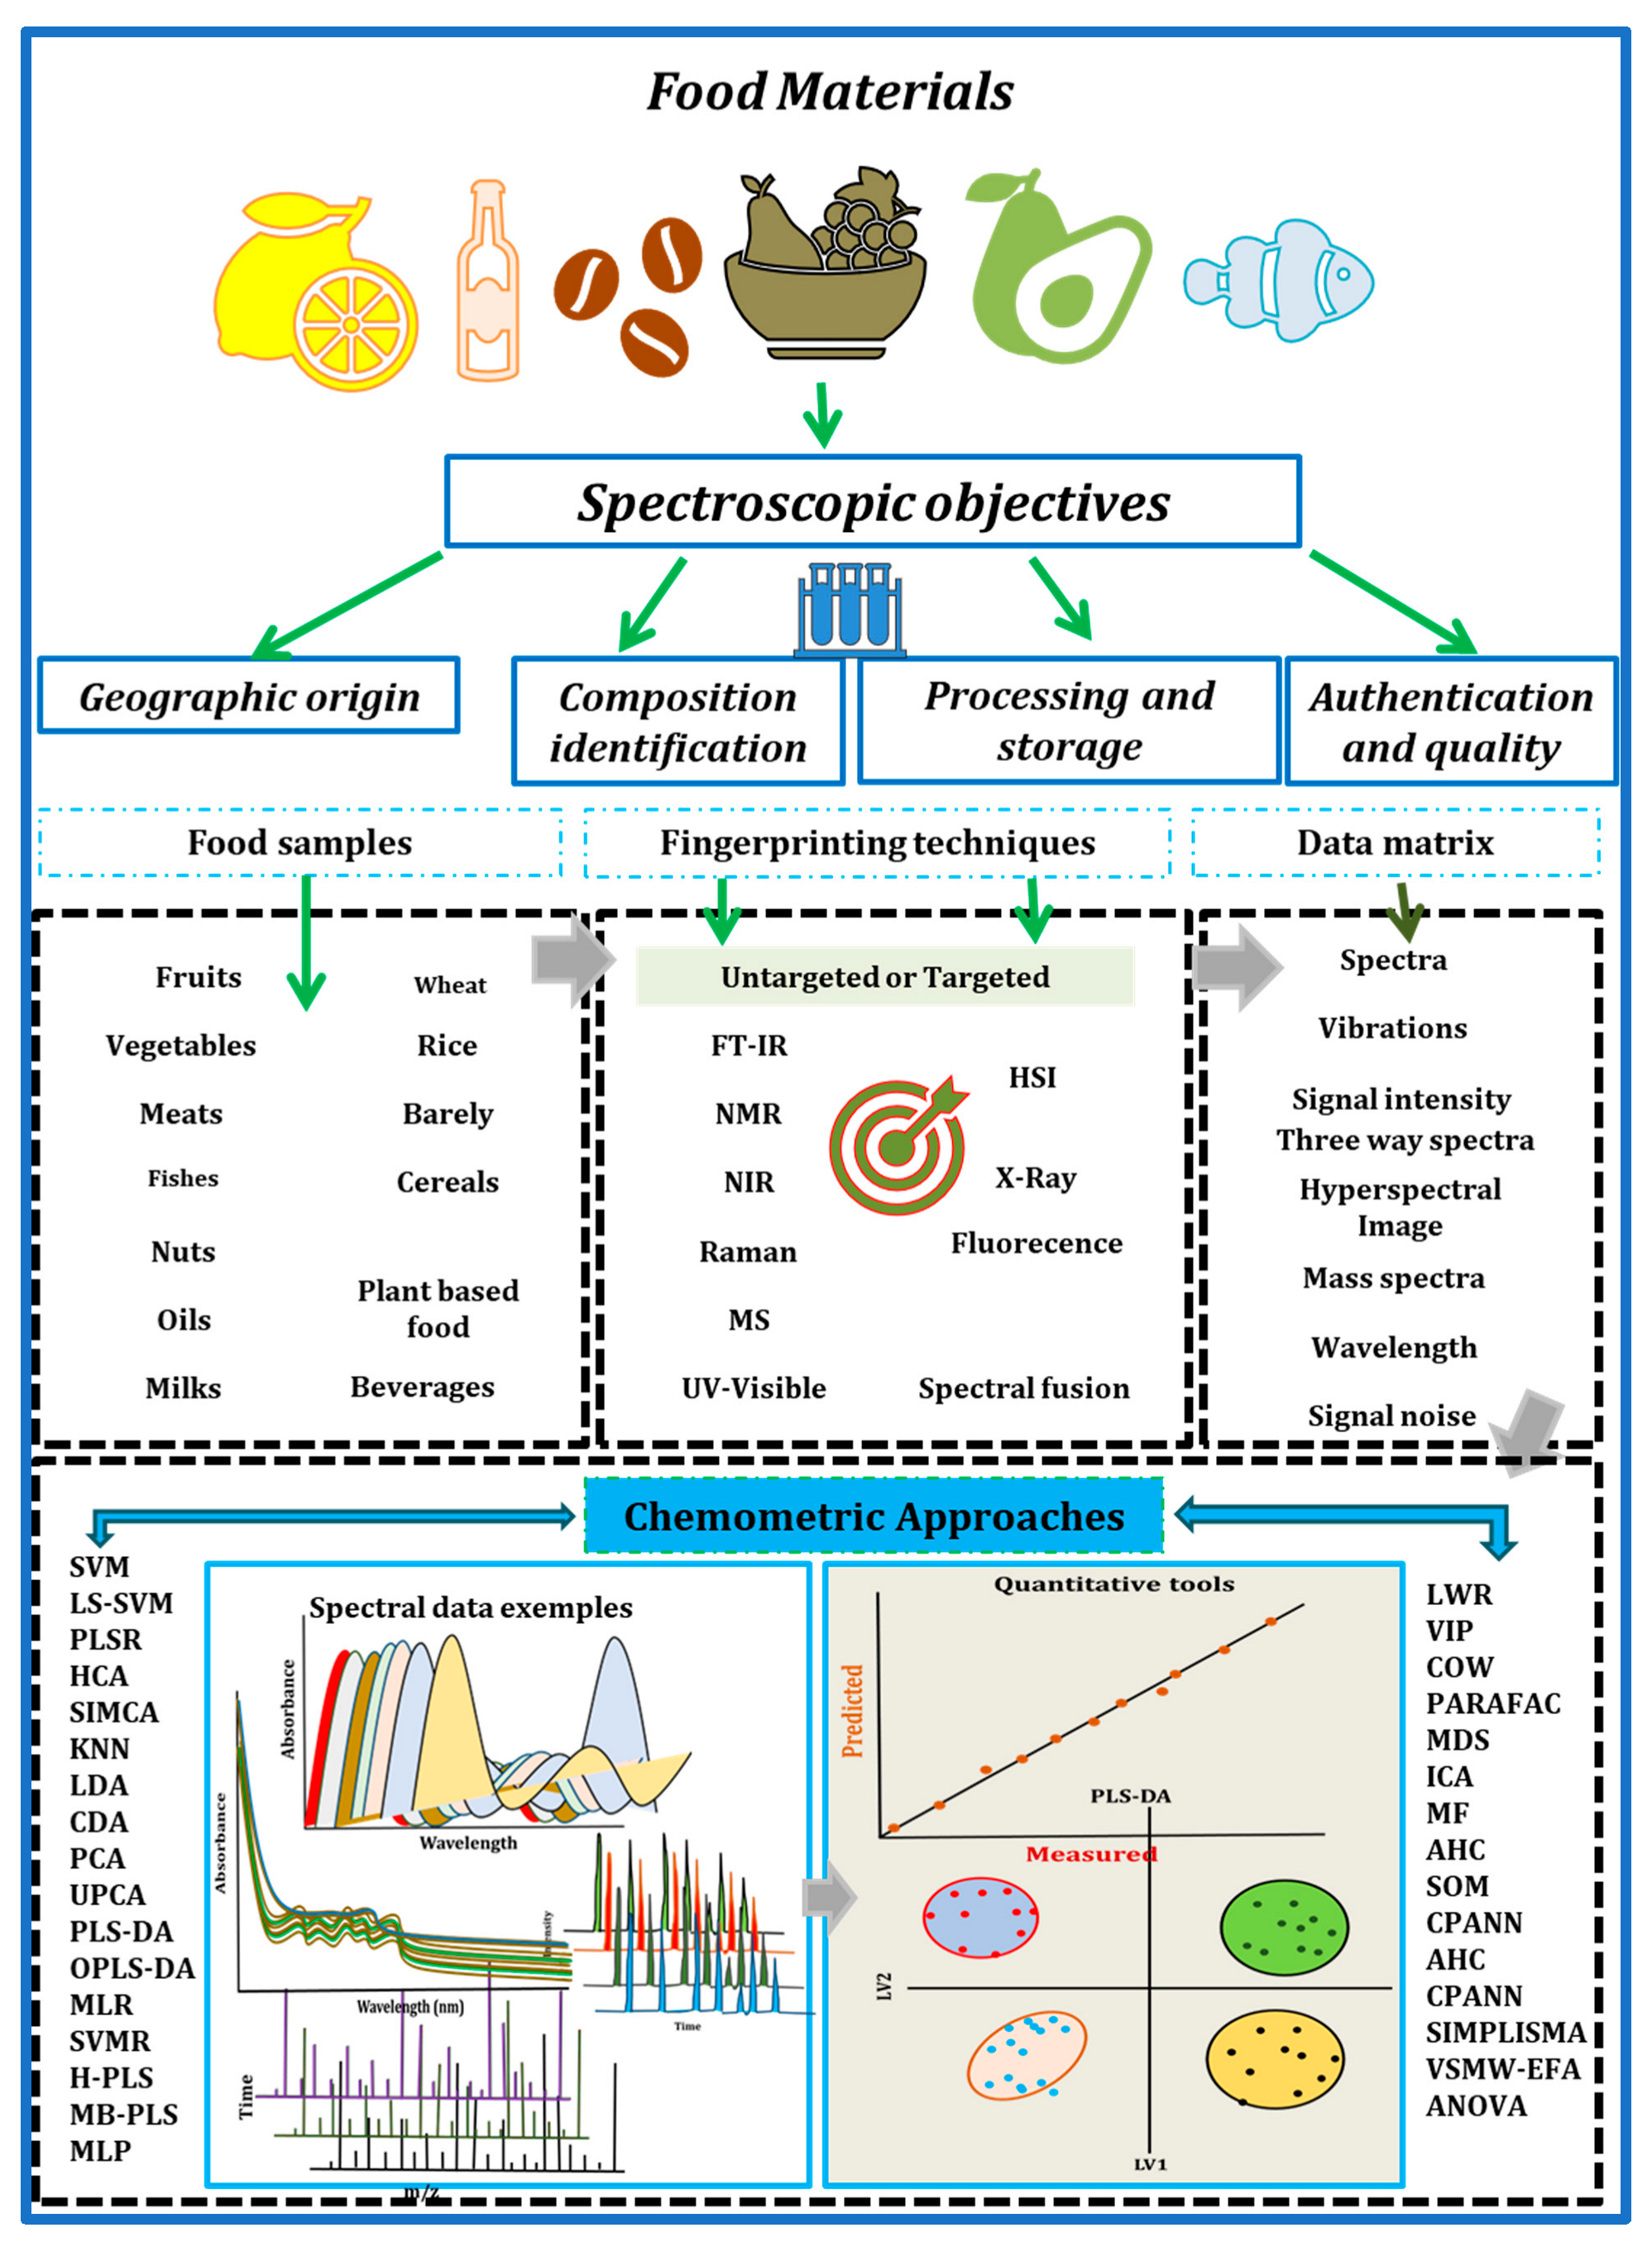
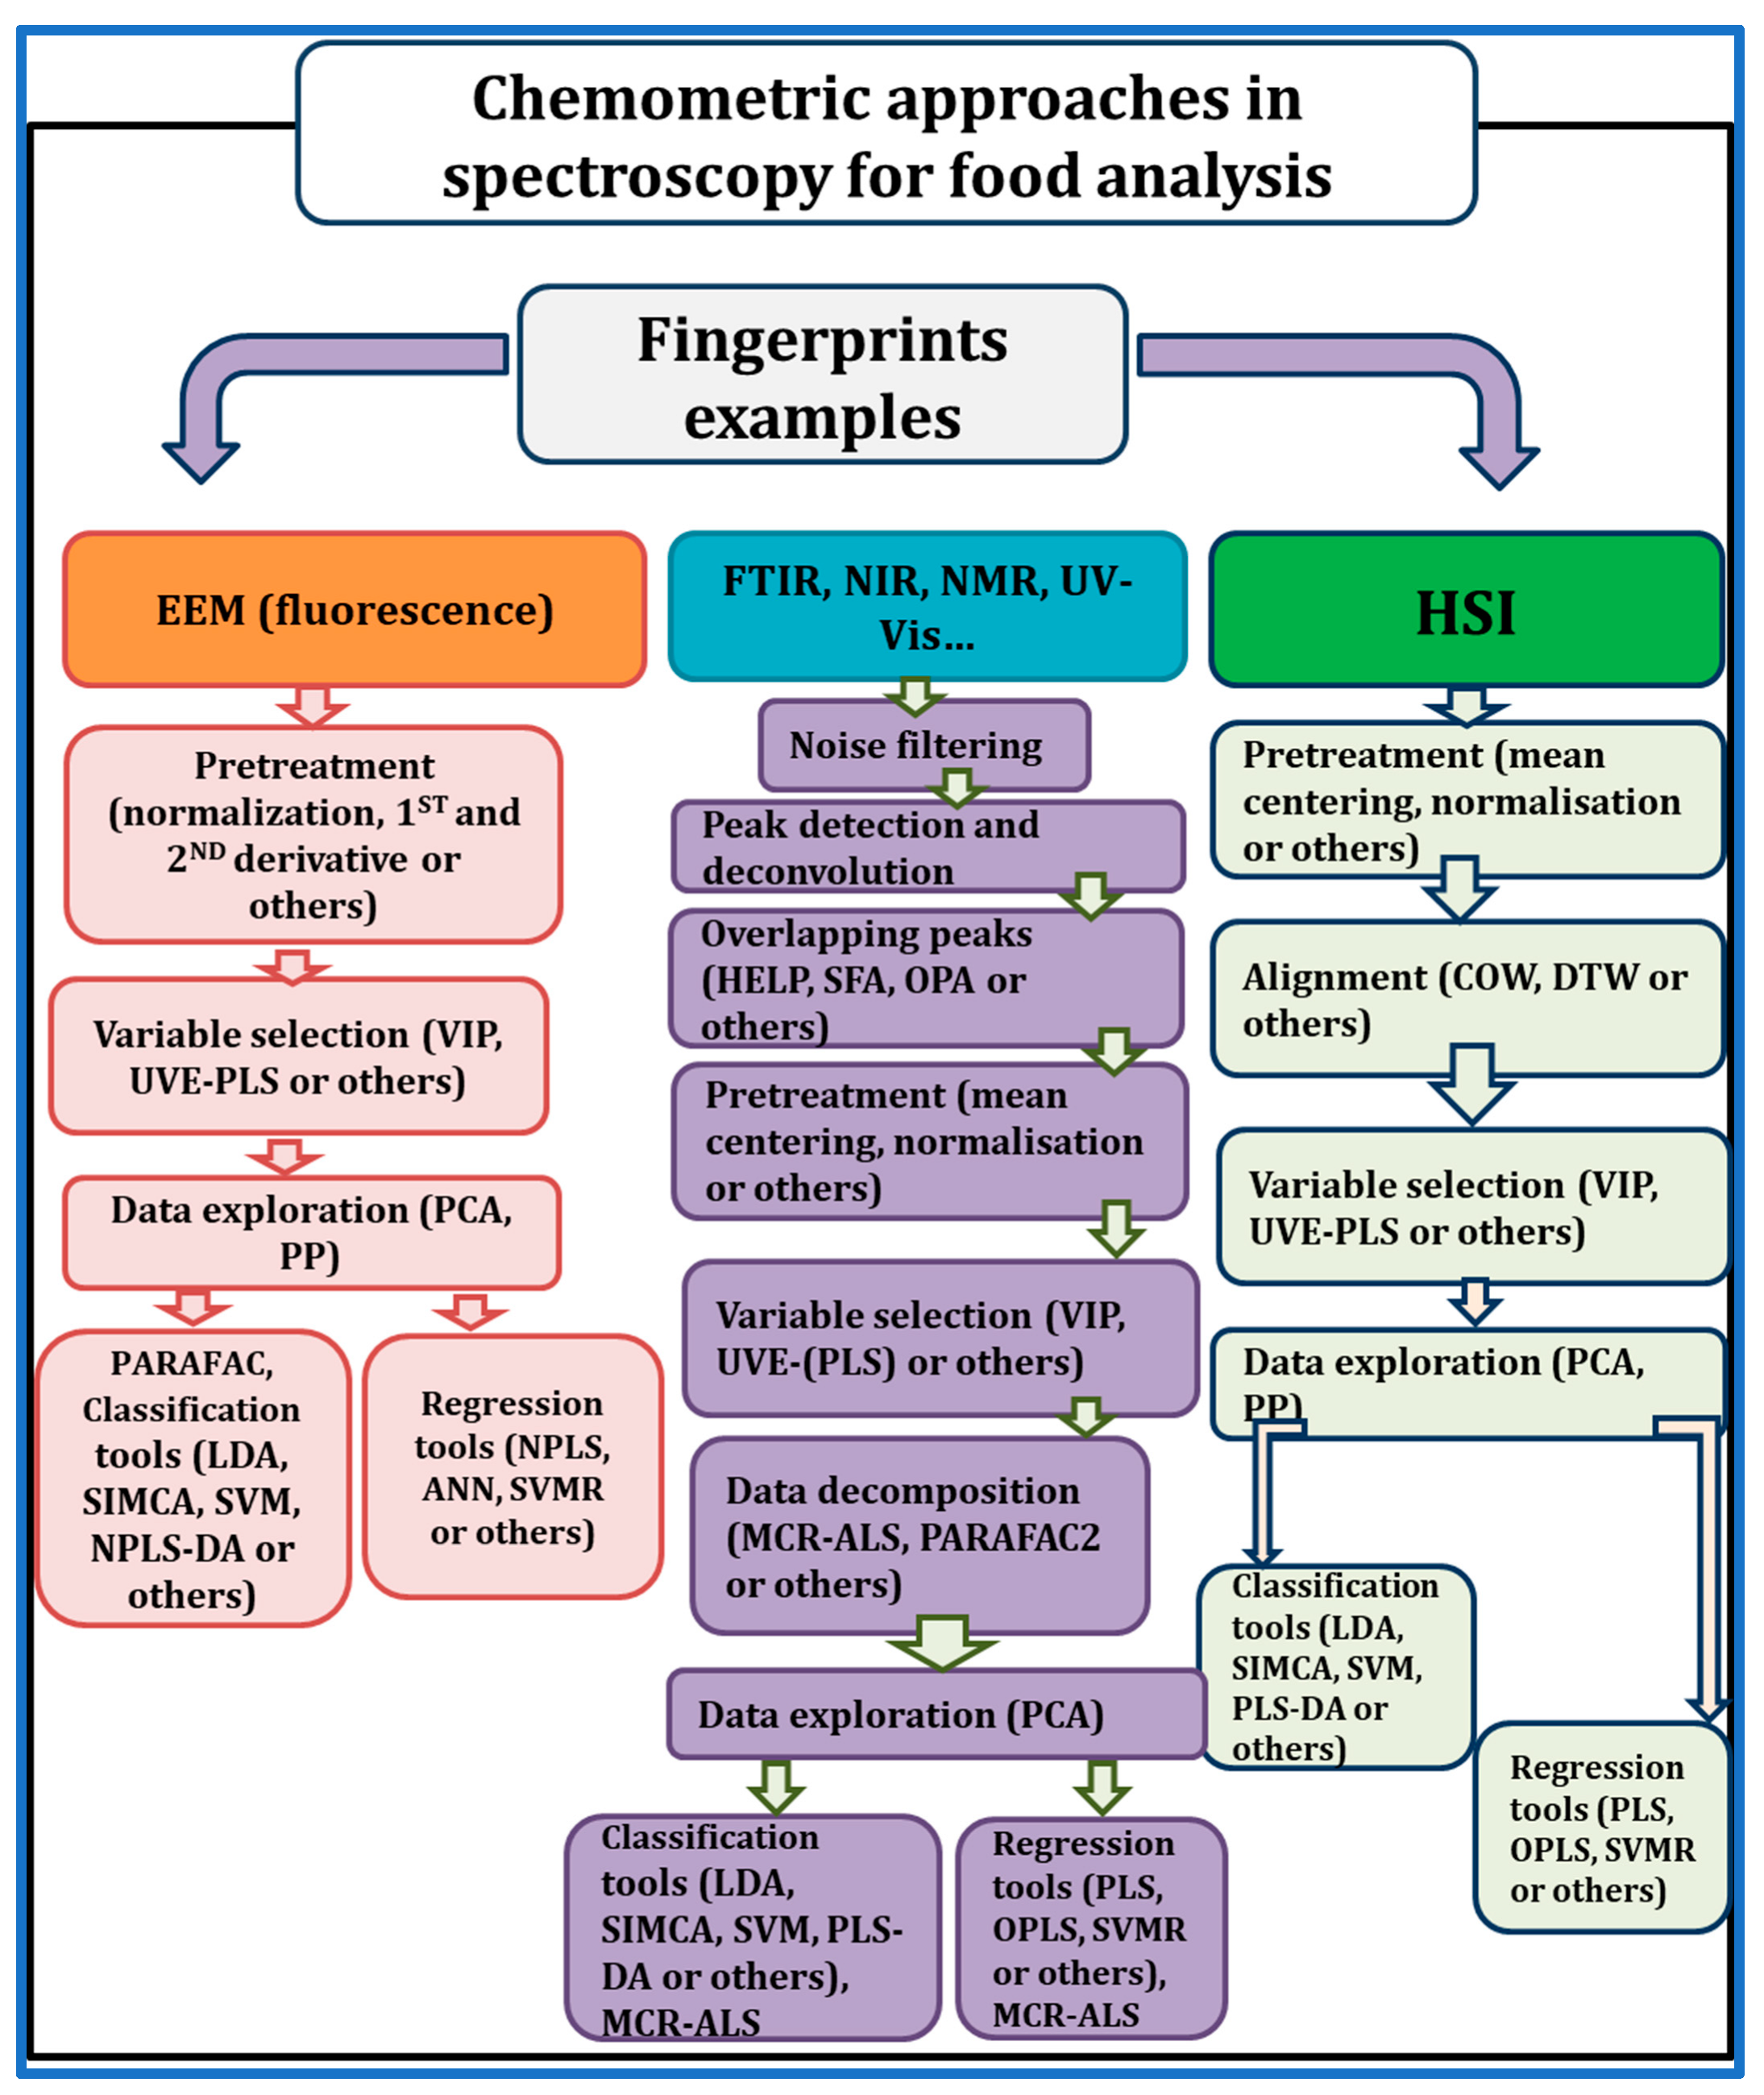
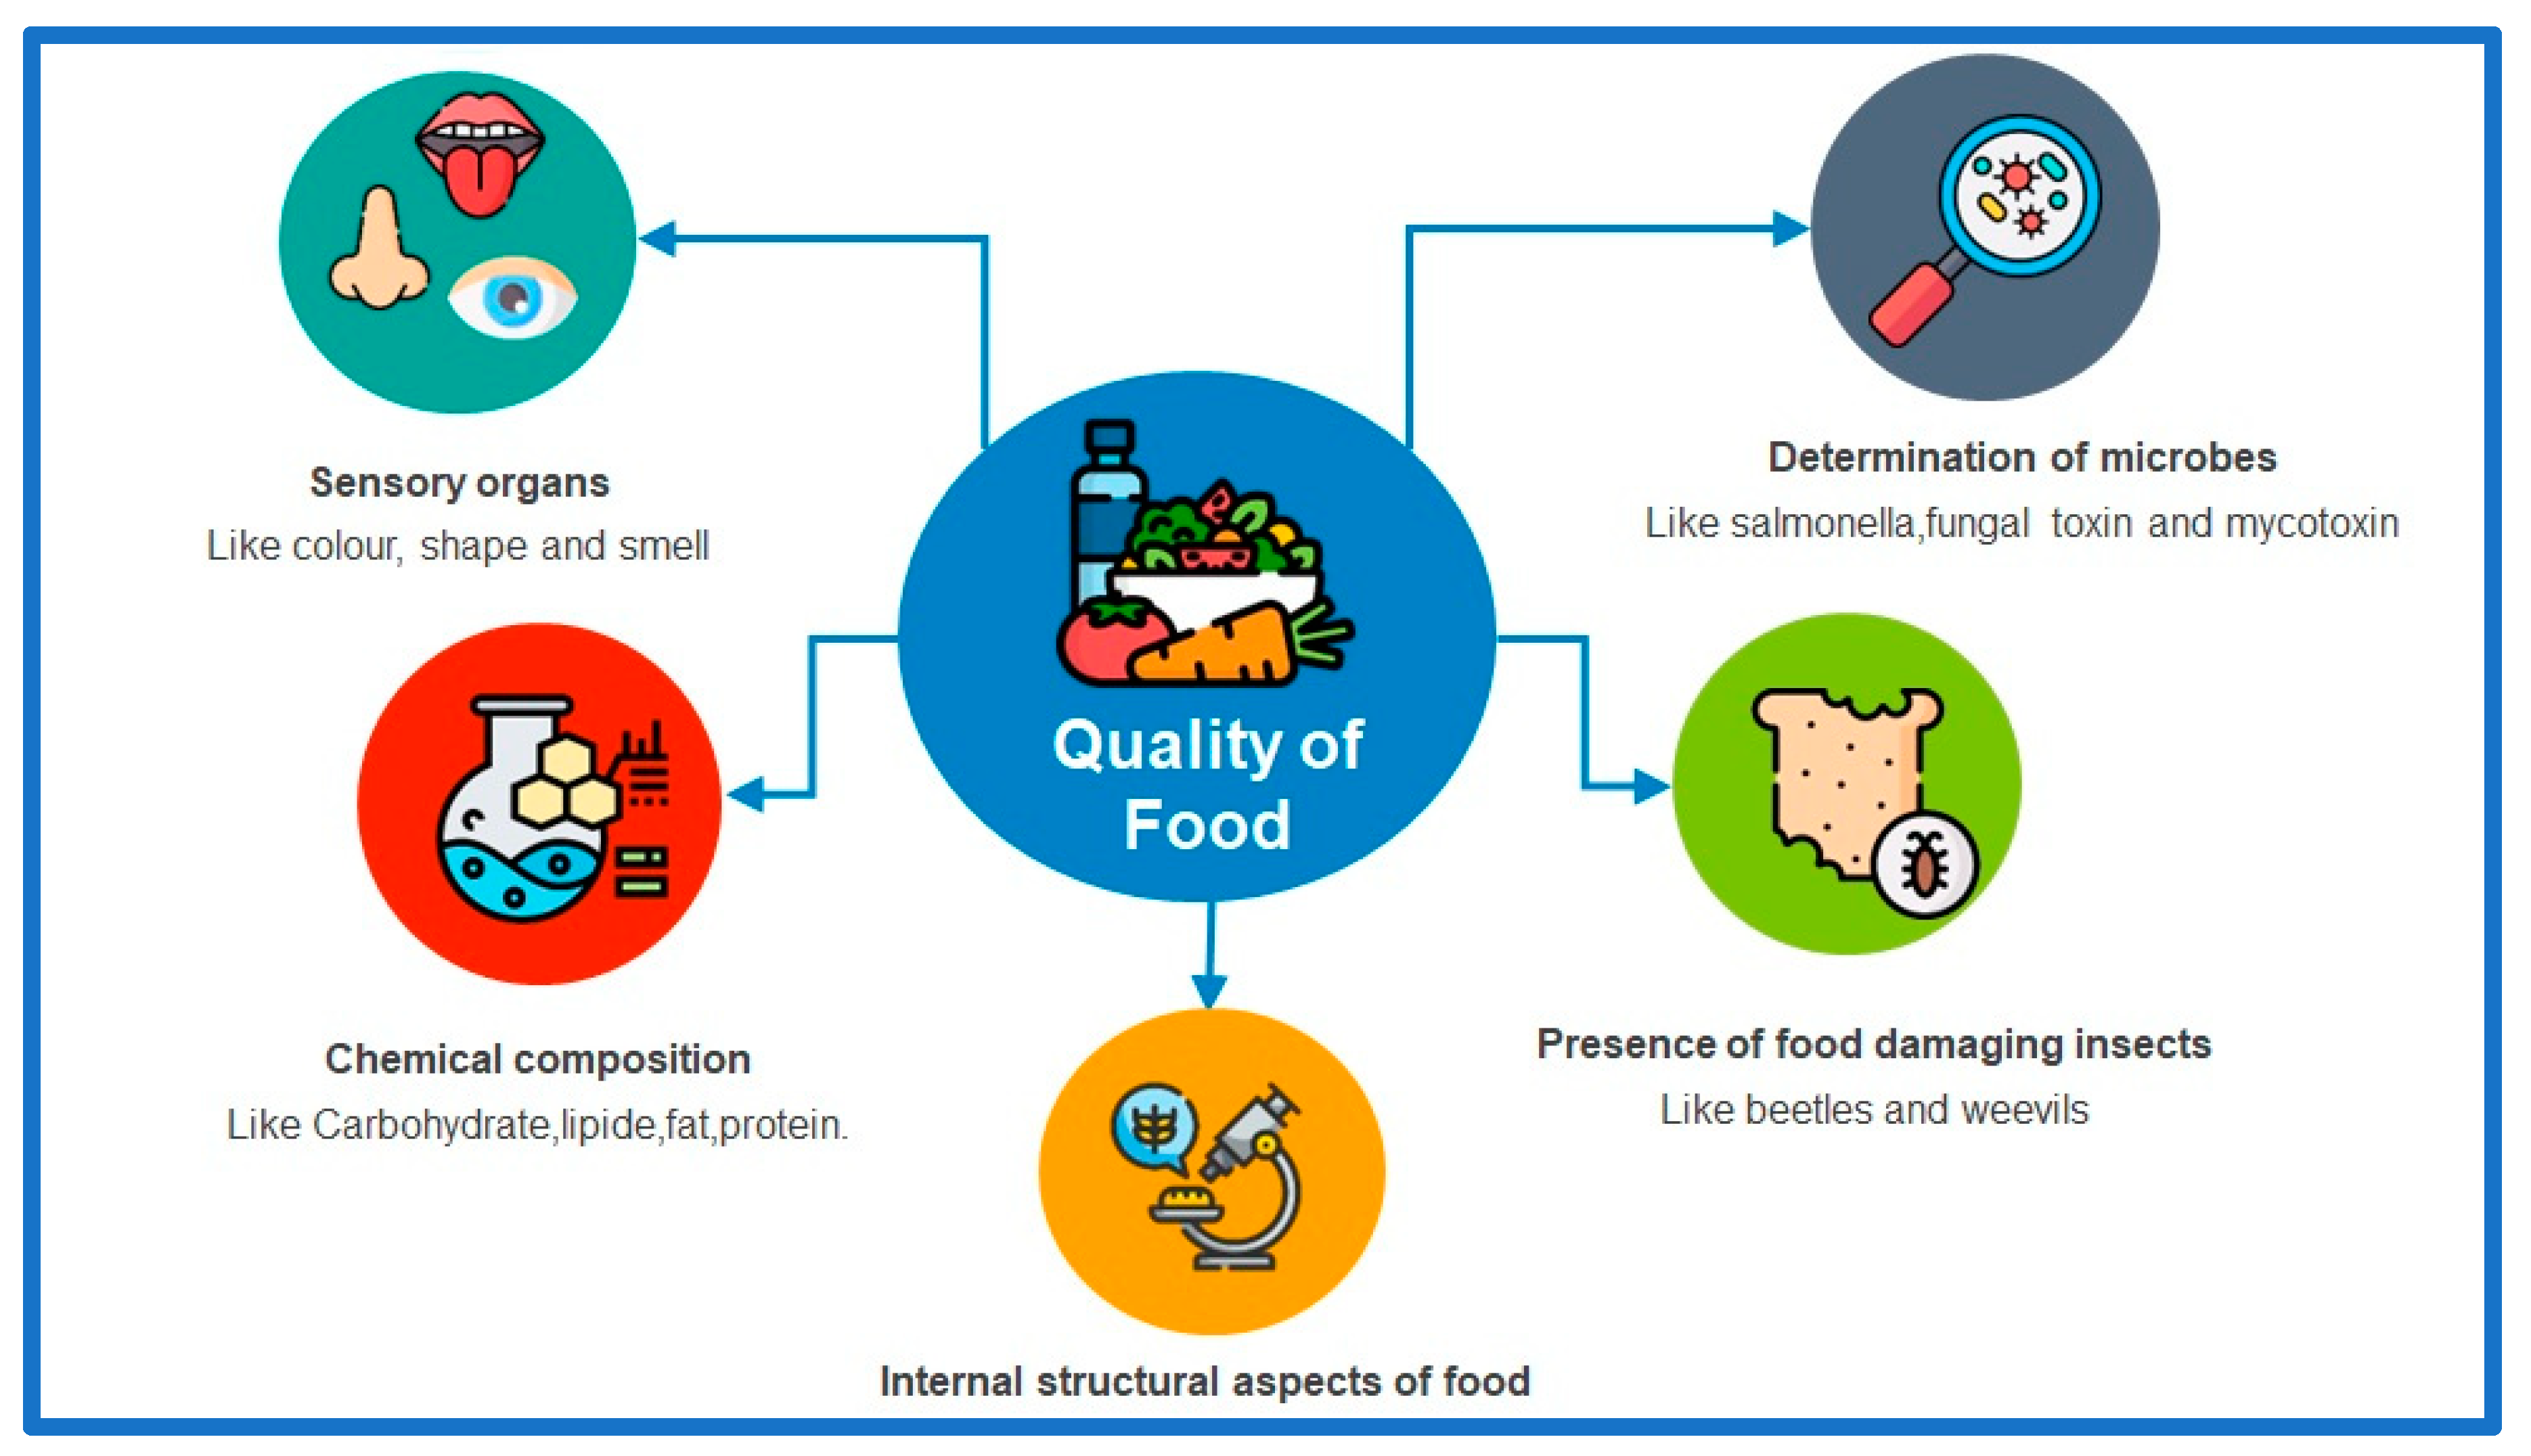
Table 1.
Advanced spectroscopic techniques combined with chemometric approaches for quantitative analysis in food application. Table was ordered regarding used techniques.
Table 1.
Advanced spectroscopic techniques combined with chemometric approaches for quantitative analysis in food application. Table was ordered regarding used techniques.
| Quantitative Analysis | ||||||
|---|---|---|---|---|---|---|
| Authors | Food Materials | Fingerprinting Technique | Analysed Components | Objectives | Chemometric Analysis | Ref. |
| Gamela et al. | Cocoa beans | EDXRF | Cu, K, Sr and Zn | Cocoa beans | PLS | [56] |
| Sperança et al. | Bananas | X-ray fluorescence | Zn | Determination Zn content in Banans | PLS | [57] |
| Priyashantha et al. | Cheese | Near-infrared hyperspectral (NIR-HS) imaging | - | Explain the relationship between average spectra and cheese maturity | PLS | [58] |
| Darnay et al. | Semi-hard cheese | HSI | Transglutaminase | Detection of the enzyme of transglutaminase in the cheese | PLS | [59] |
| Lu et al. | Potatoes | Fluorescence HSI | Solanine | Predict the solanine content in potatoes | SVR | [60] |
| Xiao et al. | Fresh-cut potato | HSI | Color parameters (bruising index) and water content | Assess the quality of potatoes | LS-SVM and PLS | [61] |
| Tian et al. | Purple sweet potato | Vis-NIR HSI | Moisture and anthocyanins | Predict the critical indexes of moisture and anthocyanins in purple sweet potato | PLSR | [62] |
| Li et al. | Plum | VNI-HSI | Nan | Predict the soluble solid contents and the color of two plums cultivars | PLS | [63] |
| He et al. | Wheat flour | HSI | Talcum powder | Detection of talcum powder adulterated in wheat flour | SNV-CARS-PLS | [64] |
| Kim et al. | Wheat flour | SWIR-HSI | Benzoyl peroxide | Detecting the bleaching agent of benzoyle peroxide in wheat flour | PLS | [65] |
| Sun et al. | Melons | HSI | Nan | Predict the sugariness and hardness of melons | PLS, SVM and ANN | [66] |
| Wang et al. | Chinese steamed bread | FT-NIR | Potato flour content | Predicting potato flour in Chinese steamed bread | PLS-R | [67] |
| Tu et al. | Wheat flour | FT-NIR | Talcum powder | Quantitation of low content of talcum powder in wheat flour | Gradient-boosted decision tree (GBDT) | [68] |
| Kandpal | Tuber flour | NIR and MIR | Chemical components:amylose, starch, protein, glucose, cellulose, and moisture contents | Prediction of quality traits in tuber traits by mean of Data fusion of FT-IR and FT-NIR | SOPLS | [69] |
| Kamboj et al. | Wheat | FT-NIR | Crude protein and carbohydrate | Compare chemometrics for predicting the quality parameters of wheat | PLS, MLR, SVM | [70] |
| Liang et al. | Potatoes | FT-NIR | Sugar content | Detection of zebra chip disease (ZC) in potatoes | PLS | [71] |
| Jiang et al. | Wheat flour | Portable NIR | Fatty acid | Quantitation of fatty acids in wheat | Variable combination population analysis (VCPA), extreme learning machine (ELM) | [72] |
| Ning et al. | Wheat grains | FT-NIR | Zearalenone | Detection of zearalenone in wheat | SVM | [73] |
| Cámara et al. | Clove and pomegranate | IR | Antioxidant activity | Estimation of antioxidant activity in clove and pomegranate | MCR-ALS and PLS | [74] |
| Castro et al. | Peanut oil | NIR and Raman | Adulterants (corn oil and vegetable oil) | Assessment of vibrational spectroscopy with chemometrics | MCR-ALS and PLS regression | [75] |
| Castro et al. | Saffron | FT-NIR | Saffron adulterants (onion, calendula, pomegranate, and turmeric) | Detection of Saffron adulterants | MCR-ALS and PLS regression | [76] |
| Li et al. | Saffron | FT-NIR | Saffron adulterants (lotus stamens and corn stigmas) | Detection of saffron adulterants | Synergistic interval PLS (SI-PLS), competitive adaptive reweighted sampling PLS (CARS-PLS) | [77] |
| Li et al. | Saffron | FT-NIR | Corcin | Determination of corcin content in Saffron | PLS | [78] |
| Liu et al. | Panax notoginseng | FT-NIR | Adulterants (hizoma curcumae, Curcuma longa and rhizoma alpiniae offcinarum) | Quantification of Panax notoginseng with its adulterants | PCR, PLS, ELM and SVR | [79] |
| Liu et al. | Vegetable oils | FT-NIR | Phytosterols | Determination of phytosterols in vegetable oils | Pls | [80] |
| Joshi et al. | Eggs | FTIR | Constituents of eggs (yolk and albumen) | Detection of fabricated eggs | PLS-DA and SVM | [81] |
| Mazivila et al. | Milk | FT-NIR | Melamine and sucrose | Estimation the adulterant contents in the milk | MCR-ALS | [82] |
| Novianty et al. | Palm fruit | FT-NIR | Oil content | Quantitation of oil content in palm fruit | EMD-ANN | [83] |
| Basar et al. | Honey | FTIR | Adulterant (beet sugar and corn syrup) | Determination of honey adulteration | Genetic-algorithm-based inverse least squares (GILS) and (PLS) | [84] |
| Qin et al. | Wheat flour | Raman chemical imaging | Benzoyl peroxide | Detection of benzoyle peroxide | PLS | [85] |
| Yuan et al. | Duck meat | Surface-enhanced Raman | Testosterone propionate and nandrolone residues | Quantitation of residues in the duck meat | LS-SVR | [86] |
| Nakajima et al. | Banana | Raman | Starch | Quantification of starch in banana | PLS | [87] |
| Hara et al. | Tomatoes | Raman | Carotenoids | Determination of carotenoids in tomatoes | PLS | [88] |
| De Olieveira mendes et al. | Raw milk | Raman | Whey | Quantitation of whey in raw milk | PLS | [89] |
| Czaja et al. | Youghurts | Raman | Fat, lactose, and protein | Determination of nutritional parameters of yoghurts | PCA and PLS | [90] |
| Tian et al. | Milk | Raman | Adulterants (maltodextrin, sodium carbonate, and whey) | Prediction of adulterants in raw milk | PLS | [91] |
| Berzins et al. | Breast milk | Raman and FTIR | Macronutrients (protein, fat, and carbohydrate) | Determination of macronutrients in the breast milk | PLS | [92] |
| De sa oliveira et al. | Spreadable cheese | Raman | Starch | Quantitation of starch in adulterated spreadable cheese | PLS | [93] |
| Liu et al. | Edible oils | Raman and FT-IR data fusion | Peroxide values and acid values | Determination of chemical quality indices of edible oils during thermal oxidation | PLS | [89] |
| Puertas et al. | Egg yolk | Data fusion of FTIR and UV-Vis | Cholesterol | Prediction of cholesterol in egg yolk | PLS and PCR | [94] |
| Wang et al. | Infant formula | Vis-NIR and Raman data fusion | - | Assessment of infant formula storage temperature and time | SVM | [95] |
| Valinger et al. | Honey | UV-Vis and NIR data fusion | Sugar syrups | Detection of honey adulteration | PLS and ANN | [96] |
| Wang et al. | Camelia oil | Excitation-emission matrix fluorescence | Vegetable oils | Quantitation of adulterant in camelia oil | N-PLS and PARAFAC | [97] |
| Baretto et al. | Milk | Fluorescence | Melamine | Determination of melamine in milk | PARAFAC and UPLS | [98] |
| Gu et al. | Rapessed oil in water | Fluorescence | Lipid | Quantitative assessment of lipid oxidation in a rapeseed oil-in-water | GA-SVR | [99] |
| Tarhan | Extra virgin olive oil (EVOO) | FTIR, UV–Vis and fluorescence | Squalene | Quantification of squalene in extra virgin olive oils | PLS | [100] |
| Wu et al. | Edible blend oil | UV-Vis | Adulterant (vegetable oil) | Quantification of vegetable oils in edible blend oil | Weighted multiscale SVR | [101] |
| Zhang et al. | Edible oils | UV-Vis | Acid value | Impact of heating on edible oils | PLS and PCR | [102] |
| Rios-Reina et al. | Wine and balsamic vinegar | UV-Vis | Grape-must caramel (E-150d caramel) | Quantitation of grape-must caramel in wine and balsamic vinegars | PLS | [103] |
| Cavdaroglu et al. | Vinegar | UV-Vis and MIR | Phenolic components, p-coumaric and syringic acids, citric and acetic acids, | Predict quality and chemical parameters of vinegar | PLS and OPLS | [104] |
| Santos et al. | Milk | NMR | Adulterants (Whey, urea, hydrogen peroxide, synthetic urine and synthetic milk) | Quantification of milk adulteration | PLS | [105] |
| Liu et al. | Cream | NMR | Artificial bright blue pigment | Detecting additives content in cream | PLS and MLR | [106] |
| Sun et al. | Carrot, banana and pleurotus eryngii | NMR | Moisture | Monitor water states of typical fruits and vegetables during microwave vacuum drying | PLS, SVM and BP-ANN | [107] |
| Hajjar et al. | Hen egg | NMR | Fatty acids | Quantification of fatty acids in hen eggs | PLS | [108] |
| Galvan et al. | Edible oils | NMR | Fatty acids and iodine value | Analysis of edible oils | PLS and SVR | [109] |
| Haddad et al. | Cheese | NMR | Fatty acids | Quantitation of individual fatty acids | PLS | [110] |
| Jiang et al. | Rice | Surface-enhanced Raman scattering | Chlorpyrifos residue | Quantify chlorpyrifos residues in rice samples | GA-PLS, UVE-PLS, VCPA-PLS and CARS-PLS | [111] |
| Richardson et al. | Coconut water | Raman | Sugars | Detection of adulteration in Coconut water | PLS | [112] |
Table 2.
Advanced spectroscopic techniques combined with chemometric approaches for qualitative analysis in food application. Table was ordered regarding used techniques.
Table 2.
Advanced spectroscopic techniques combined with chemometric approaches for qualitative analysis in food application. Table was ordered regarding used techniques.
| Qualitative Analysis | ||||||
|---|---|---|---|---|---|---|
| Authors | Food Materials | Fingerprinting Technique | Analysed Components | Objectives | Chemometric Analysis | Ref. |
| Galvan et al. | Tomato and sweet paper | EDXRF | - | Discrimination of tomato or sweet pepper samples effectively according to the agronomic production mode or geographical origin | PLS-DA | [113] |
| Scatigno et al. | EVOO | EDXRF | Ni, Fe and Ti | Discrimination of EVOO | PCA | [114] |
| Panebianco et al. | Tomato fruit | XRF | - | Establish an assessment procedure for the origin and quality assessment of Sicilian tomato fruits | PCA | [115] |
| Allegretta | Beans | TXRF | - | Clustering of the seeds of beans according to their geographical origin | PCA and PLS-DA | [116] |
| Vitali et al. | Croatian wines | TXRF | Contents of metals (K, Ca, Fe, Cu, Zn, Mn, Sr, Rb, Ba, Pb, Ni, Cr and V) | Classification of origin and type of Croatian wines | PCA and cluster analysis | [117] |
| Li et al. | Peaches | Short-wave near-infrared (SW-NIR) and long-wave near-infrared (LW-NIR) hyperspectral imaging | - | Detection bruises in peaches | PCA | [118] |
| He et al. | Flour | Vis-NIR HSI | Mites Tyrophagus putrescentiae and Cheyletus eruditus | Detection of mites Tyrophagus putrescentiae and Cheyletus eruditus in flour | Random forest and PCA-ANN | [119] |
| Al-Sarayreh et al. | Meat | NIR-Vis HSI | - | Deep learning approach for red-meat classification by combining the spectral and spatial features of HSI data | CNN | [120] |
| Pan et al. | Peaches | Hyperspectral reflectance imaging | - | Detection of cold injury in peaches | ANN | [121] |
| Sun et al. | Peaches | Hyperspectral reflectance imaging | - | Characterization of chilling injury in peaches | PLS-DA, ANN and SVM | [122] |
| Babellahi et al. | Green bell peppers | HSI | - | Detection of chilling injury in green bell peppers | PLS-DA | [123] |
| Cen et al. | Cucumber fruit | HSI | - | Detection of chilling injury in cucumber fruit | SVM and KNN | [124] |
| Carreiro Soares et al. | Cotton seeds | HSI | - | Discrimination of different varieties of seeds | PLS-DA | [125] |
| Fan et al. | Blueberry | HSI | - | Detection of blueberry internal bruising over time | LS-SVM | [126] |
| Sun et al. | Tomatoes | HSI | - | Characterization of bruised tomatoes | PLS-DA | [127] |
| Susic et al. | Tomatoes | HSI | - | Discrimination between abiotic and biotic drought stress in tomatoes | PLS-DA PLS-SVM | [128] |
| Zhao et al. | Wheat seeds | HSI | - | Characterization the purity of wheat seeds | CNN | [129] |
| Zhao et al. | Maize seeds | HSI | - | Classification of maize seeds | Neural network | [130] |
| Tsouvaltzis et al. | Eggplant fruit | FT-NIR and NIR-HSI | - | Evaluating the temperature effect on chilling injury of eggplant | PLS-DA, SVM and KNN | [131] |
| Liang et al. | Potatoes | FT-NIR | Sucrose, glucose fructose | Detection of zebra chip disease (ZC) in potatoes | Canonical discriminant analysis | [71] |
| Huang et al. | Honey | NIR and FTIR | Syrup adulterant | Distinguish the normal honey from adulterant one | SVM | [132] |
| De Girolamo | Wheat | FT-MIR and FT-NIR | Ochratoxin A | Assessment of the adulteration of wheat by ochratoxin | PLS-DA and PC-LDA | [133] |
| Chen et al. | Eggs | FT-NIR | - | Verifying the authenticity of native eggs | Data-driven-based class-modeling (DDCM), PCA | [134] |
| Liu et al. | Panax notoginseng | FT-NIR | Adulterants (rhizoma curcuma, Curcuma longa and rhizoma alpiniae offcinarum) | Identification of panax notoginseng with its adulterants | PLS-DA and SVM | [79] |
| Marquetti et al. | Arabica Coffee | FT-NIR | - | Evaluation of geographic and genotypic origin of arabica coffee | PLS-DA | [135] |
| Mazivila et al. | Milk | FT-NIR | Melamine and sucrose | Discrimination of pure milk from the adulterant one | DD-SIMCA | [82] |
| Miao et al. | Rice | FT-NIR | - | Classification of rice based on storage time | PCA, KNN and PLS-DA | [136] |
| Rovira et al. | Cashew nuts | FT-NIR | Adulterants (peanuts) | Characterization of the adulterant cashew nuts by other nuts | SIMCA | [137] |
| Visconti et al. | Cheese | FT-NIR | Cellulose and silicon dioxide | Determination of additives in the grated hard cheese | PLS-DA | [138] |
| Xie et al. | Waxy rice | FT-NIR | Amylose and amylopectin | Determination of quality parameters by FT-NIR | Modified PLS (MPLS) | [139] |
| Ziegler et al. | Kernels and flours | FT-NIR | - | Differentiation of flours and kernels of costly ancient species from less expensive bread wheat | PLS-DA | [140] |
| Joshi et al. | Eggs | FTIR | Constituents of eggs (yolk and albumen) | Detection of fabricated eggs | PLS-DA and SVM | [81] |
| Rozali et al. | Crude palm oil | FTIR | - | Authentication of different geographical and temporal origins of crude palm oils | OPLS-DA | [141] |
| Li et al. | Hazelnuts | FT-Raman and NIR data fusion | Almonds adulterant | Discriminate the unadulterated hazelnuts from the adulterated hazelnuts with almonds | SIMCA | [142] |
| Yuan et al. | Duck meat | Surface-enhanced Raman | Testosterone propionate and nandrolone residues | Classification of duck meat based on residues | Particle swarm optimization–support vector classification (PSO-SVC) | [86] |
| Unuvar et al. | Durum wheat flour | Raman spectroscopy, FT-NIR, synchronous fluorescence spectroscopy (SFS), (ATR-FTIR) | - | Distinguishing common and durum wheat flour samples with different genotypes | PCA, PLS-DA | [143] |
| Amjad et al. | Milk | Raman | Proteins, milk fats, lactose | Differentiation between milk samples of different species | Random forest classifier (RF), PCA | [144] |
| De Oliveira et al. | Enriched eggs | Raman | Omega-3 fatty acids | Discrimination between conventional and omega-3-fatty acids enriched eggs | PLS-DA | [145] |
| De sa oliveira et al. | Spreadable cheese | Raman | Starch | Classify spreadable cheese as adulterated or without starch | PLS-DA | [93] |
| Nieuwoudt et al. | Milk | Raman spectroscopy | Nitrogen-rich molecules and sucrose | Detecting adulteration of milk | PLS-DA | [146] |
| Ning et al. | Duck meat | Raman | Sulfadimidine and Sulphapyridine | Classification of duck meat based on Sulfadimidine and Sulphapyridine | SVM and PCA | [87] |
| Robert et al. | Meat | Raman | - | Discrimination between different species of meat (intact beef, venison, and lamb meat) | PLS-DA | [147] |
| Tian et al. | Milk | Raman spectroscopy | Adulterants ofaltodextrin, sodium carbonate, and whey | Distinguishing raw milk from the adulterated one | PLS-DA | [91] |
| Tian et al. | Rice | Raman spectroscopy | - | Distinguishing rice based on producing areas | PCA-KNN, SPA-KNN, PCA-LS-SVM and SPA-LS-SVM | [148] |
| Wu et al. | Honey | Raman spectroscopy | Adulterants (fructose corn syrup, rice syrup, maltose syrup, blended syrup) | Characterization of adulterant honey | CNN | [149] |
| Wang et al. | Infant formula | Vis-NIR and Raman data fusion | - | Assessment of infant formula storage temperature and time | SVM | [95] |
| Yao et al. | Boletus mushrooms | Data fusion of FT-IR and UV | - | Discrimination of different geographical origins of Boletus mushrooms | PLS-DA and SVM | [150] |
| Antonio et al. | Honey | Spectrofluorimetry | Adulterants (corn syrup, sugar cane molasses and polyfloral honey) | Detection of adulterations in a valuable Brazilian honey | Multilinear PLS-DA (NPLS-DA), unfolded PLS-DA (UPLS-DA), PARAFAC | [151] |
| Fang et al. | Chinese lager beers | Excitation-emission matrix fluorescence | - | Characterization and classification of Chinese pale lager beers produced by different manufacturers | PARAFAC-KNN | [152] |
| Jiménez-Carvelo et al. | Extra virgin olive oils | Fluorescence and NIR | Adulterant (vegetable oil) | Authenticate the geographic origin of Argentinean EVOO samples | NPLS–DA | [153] |
| Meng et al. | Olive oil | Excitation-emission matrix fluorescence | Adulterant (soybean) | Detection of adulteration of olive oil with soybean oil | Multiway-PCA (MPCA), ANN, PLS-DA | [154] |
| Yuan et al. | Edible vegetable oils | Infrared, NIR and fluorescence | - | Identification of different vegetable oils | MPCA, NPLS-DA | [155] |
| Uncu et al. | Fresh olive oils | Mid-infrared, UV–Vis and fluorescence | Adulterant (old olive oil) | Detection of adulteration of olive oil | OPLS-DA | [156] |
| Gonçalves et al. | Monovarietal Extra Virgin Olive Oils | UV-Vis | Phenolic compounds | Monitor the behavior of autoxidative processes through the storage time in two packaging systems of different EVOO | MCR-ALS | [157] |
| Suhandy et al. | Peaberry coffee | UV-Vis | - | Classify coffee samples as either pure peaberry or pure normal coffee | SIMCA and PLS-DA | [158] |
| Torrecilla | Vinegar | UV-Vis | - | Characterization of vinegars produced from six different raw materials | PLS-DA and ANN | [159] |
| Cavdaroglu et al. | Vinegar | UV-vis and FTIR | Adulterant (spirit vinegar and acetic acid) | Discrimination of non-adulterated vinegar from the adulterated | ANN | [160] |
| Kucharska-Ambrożej et al. | Mint | UV-Vis and FTIR | Distinguish between two species of mint (peppermint or spearmint) | PLS-DA and SVM | [161] | |
| Botoran et al. | Fruits | NMR | Amino acid | Differentiation of the fruit samples in varietal origin | PCA and LDA | [162] |
| Consonni et al. | Coffee | NMR | Fatty acids, β-(1-3)-d-galactopyranose, quinic acid and its cyclic ester) | Characterizing organic roasted coffee from the conventional roasted coffee | OPLS-DA | [163] |
| De Moura Ribeiro et al. | Roasted coffee | NMR | Adulterants (corn, coffee husks, barley, and soybean) | Investigating the authenticity of the roasted coffee | PCA | [164] |
| Da Silva et al. | Larger beer | NMR | Carbohydrates | Discriminate lager beer samples from two different classes, according to their style and information provided on the label | PCA, PLS-DA | [165] |
| Gougeon et al. | Wines | NMR | - | Classifying wines of different geographical origins | OSC-PLS-DA | [166] |
| Marseglia et al. | Cocoa beans | NMR | Amino acids, polyalcohols, organic acids, sugars, methylxanthines, lipids | Assess the geographical origin of cocoa beans | OSC-PCA, OPLS-DA | [167] |
| Milani | Ground coffee | NMR | Adulterants | Authentication of roasted and ground coffee based on adulterants | PCA, SIMCA | [168] |
| Rachineni et al. | Honey | NMR | Adulterants (brown rice syrup, corn syrup, and jaggery syrup) | Identifying type of sugar adulterants in honey | Deep learning-based neural network | [169] |
| Santos et al. | Milk | NMR | Adulterants (Whey, urea, hydrogen peroxide, synthetic urine and synthetic milk) | Detection of adulterated milk | SIMCA, KNN | [105] |
| Shi et al. | Camelia oils | NMR | Adulterants (cheap vegetable oils) | Detection of adulteration in camellia oils | PCA, OPLS-DA | [170] |
| Zhang et al. | Edible oils | NMR | Fatty acids | Distinguishing plant origin of edible oils | PCA, OPLS-DA | [171] |
Disclaimer/Publisher’s Note: The statements, opinions and data contained in all publications are solely those of the individual author(s) and contributor(s) and not of MDPI and/or the editor(s). MDPI and/or the editor(s) disclaim responsibility for any injury to people or property resulting from any ideas, methods, instructions or products referred to in the content. |
© 2023 by the authors. Licensee MDPI, Basel, Switzerland. This article is an open access article distributed under the terms and conditions of the Creative Commons Attribution (CC BY) license (https://creativecommons.org/licenses/by/4.0/).
Share and Cite
MDPI and ACS Style
Kharbach, M.; Alaoui Mansouri, M.; Taabouz, M.; Yu, H. Current Application of Advancing Spectroscopy Techniques in Food Analysis: Data Handling with Chemometric Approaches. Foods 2023, 12, 2753. https://doi.org/10.3390/foods12142753
AMA Style
Kharbach M, Alaoui Mansouri M, Taabouz M, Yu H. Current Application of Advancing Spectroscopy Techniques in Food Analysis: Data Handling with Chemometric Approaches. Foods. 2023; 12(14):2753. https://doi.org/10.3390/foods12142753
Chicago/Turabian StyleKharbach, Mourad, Mohammed Alaoui Mansouri, Mohammed Taabouz, and Huiwen Yu. 2023. "Current Application of Advancing Spectroscopy Techniques in Food Analysis: Data Handling with Chemometric Approaches" Foods 12, no. 14: 2753. https://doi.org/10.3390/foods12142753
Note that from the first issue of 2016, this journal uses article numbers instead of page numbers. See further details here.