
Comparison of Self-Report Questionnaire and Eye Tracking Method in the Visual Preference Study of a Youth–Beverage Model

Abstract
:
1. Introduction
2. Materials and Methods
2.1. Participants
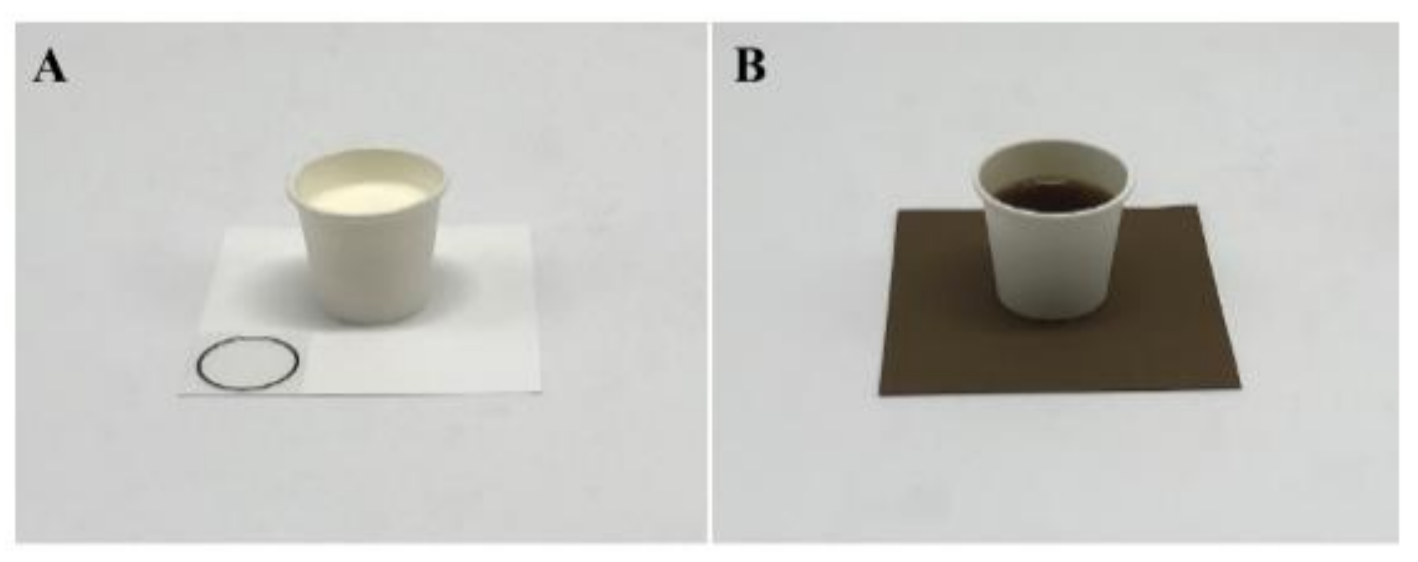
2.2. Visual Samples
2.3. Description Evaluation
2.4. SRQ Operation
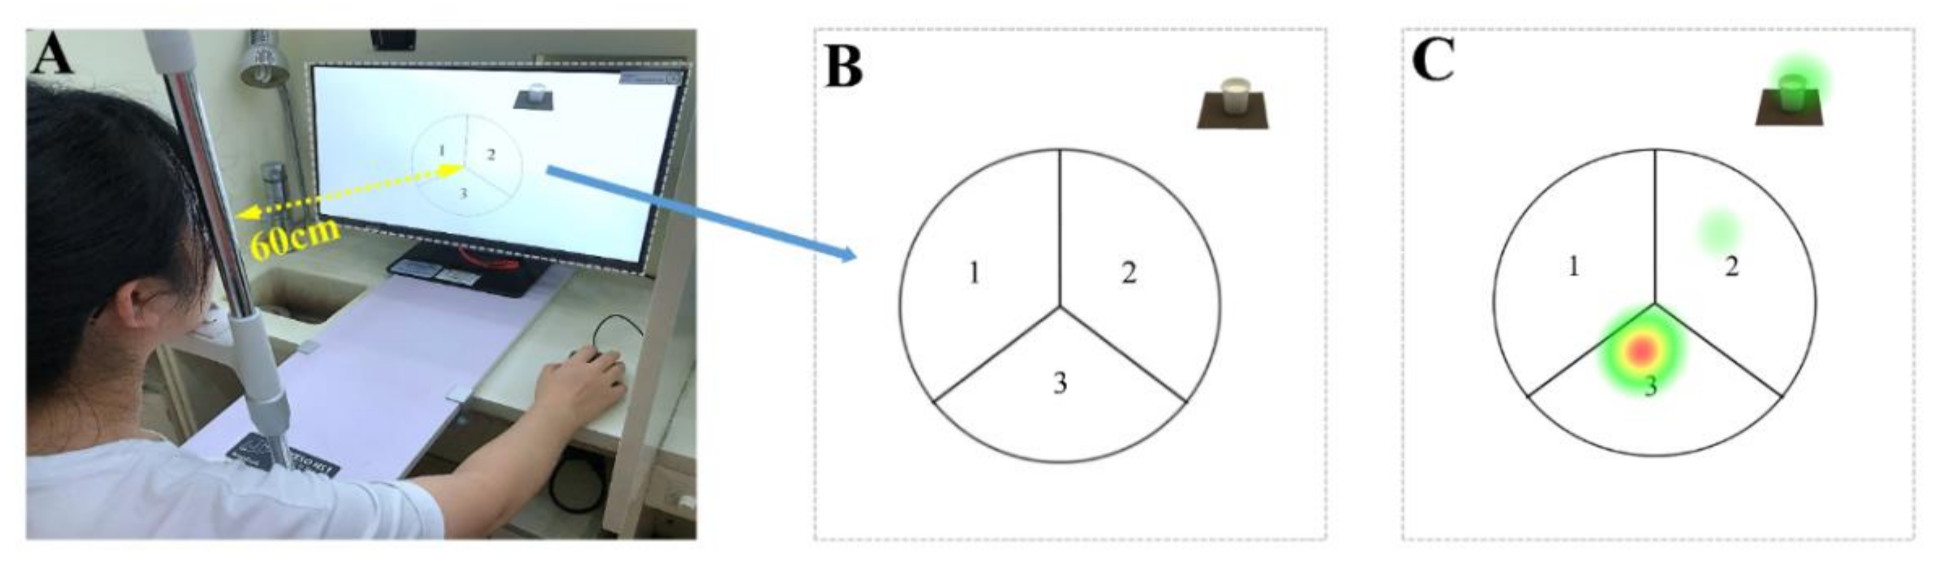
2.5. ET Operation
2.6. Data Processing
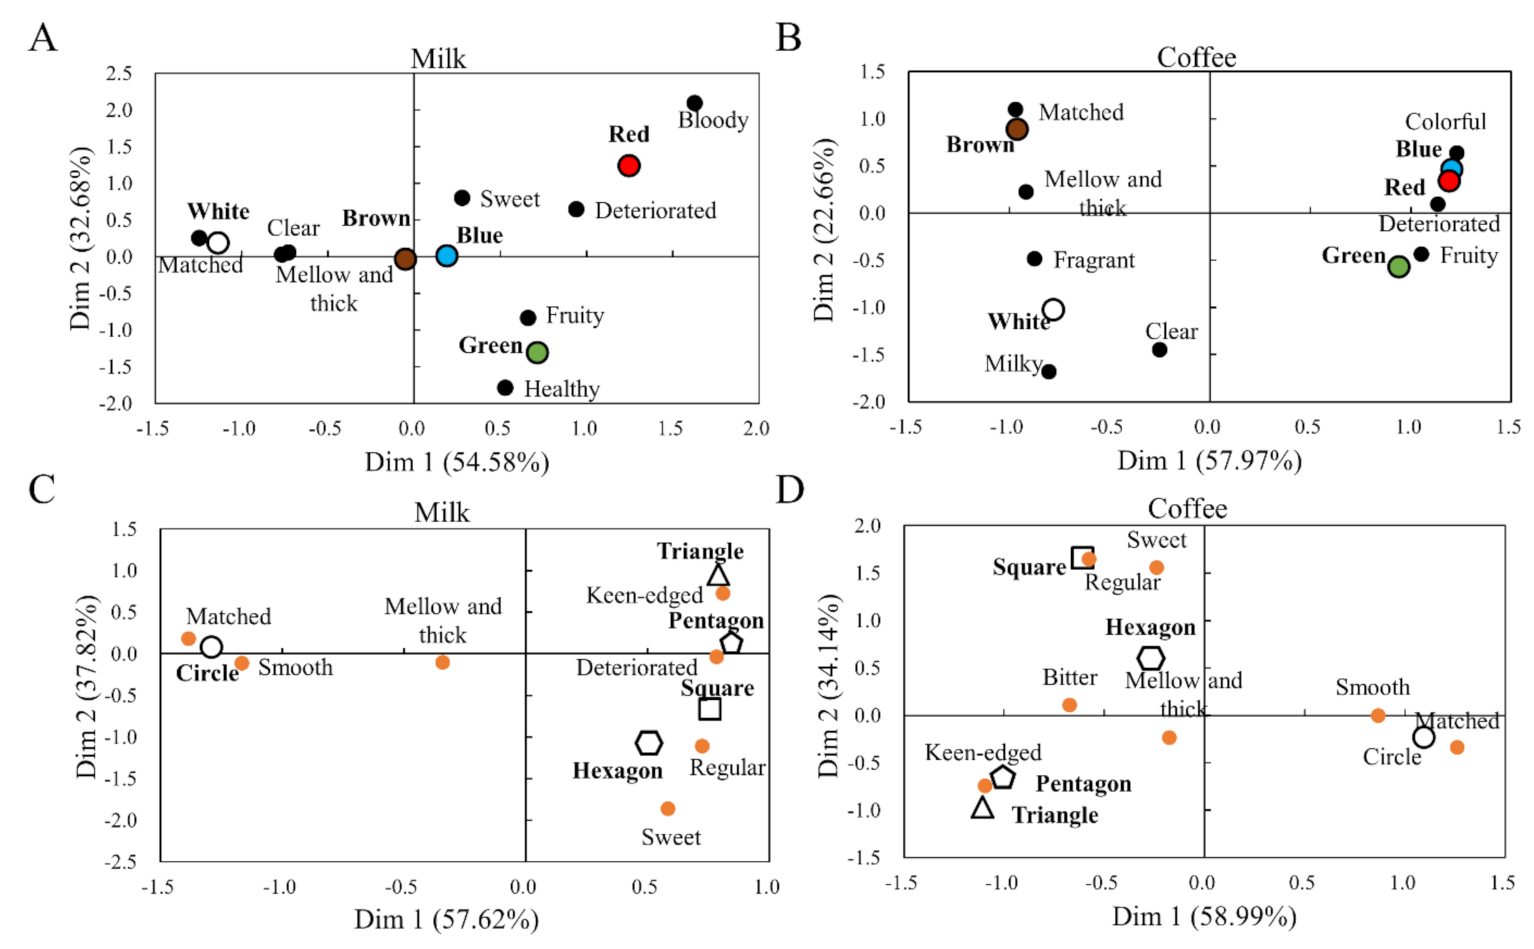
2.6.1. Correspondence Analysis
2.6.2. ET Gaze Processing
2.6.3. Random Forest Classifier
2.7. Statistical Analysis
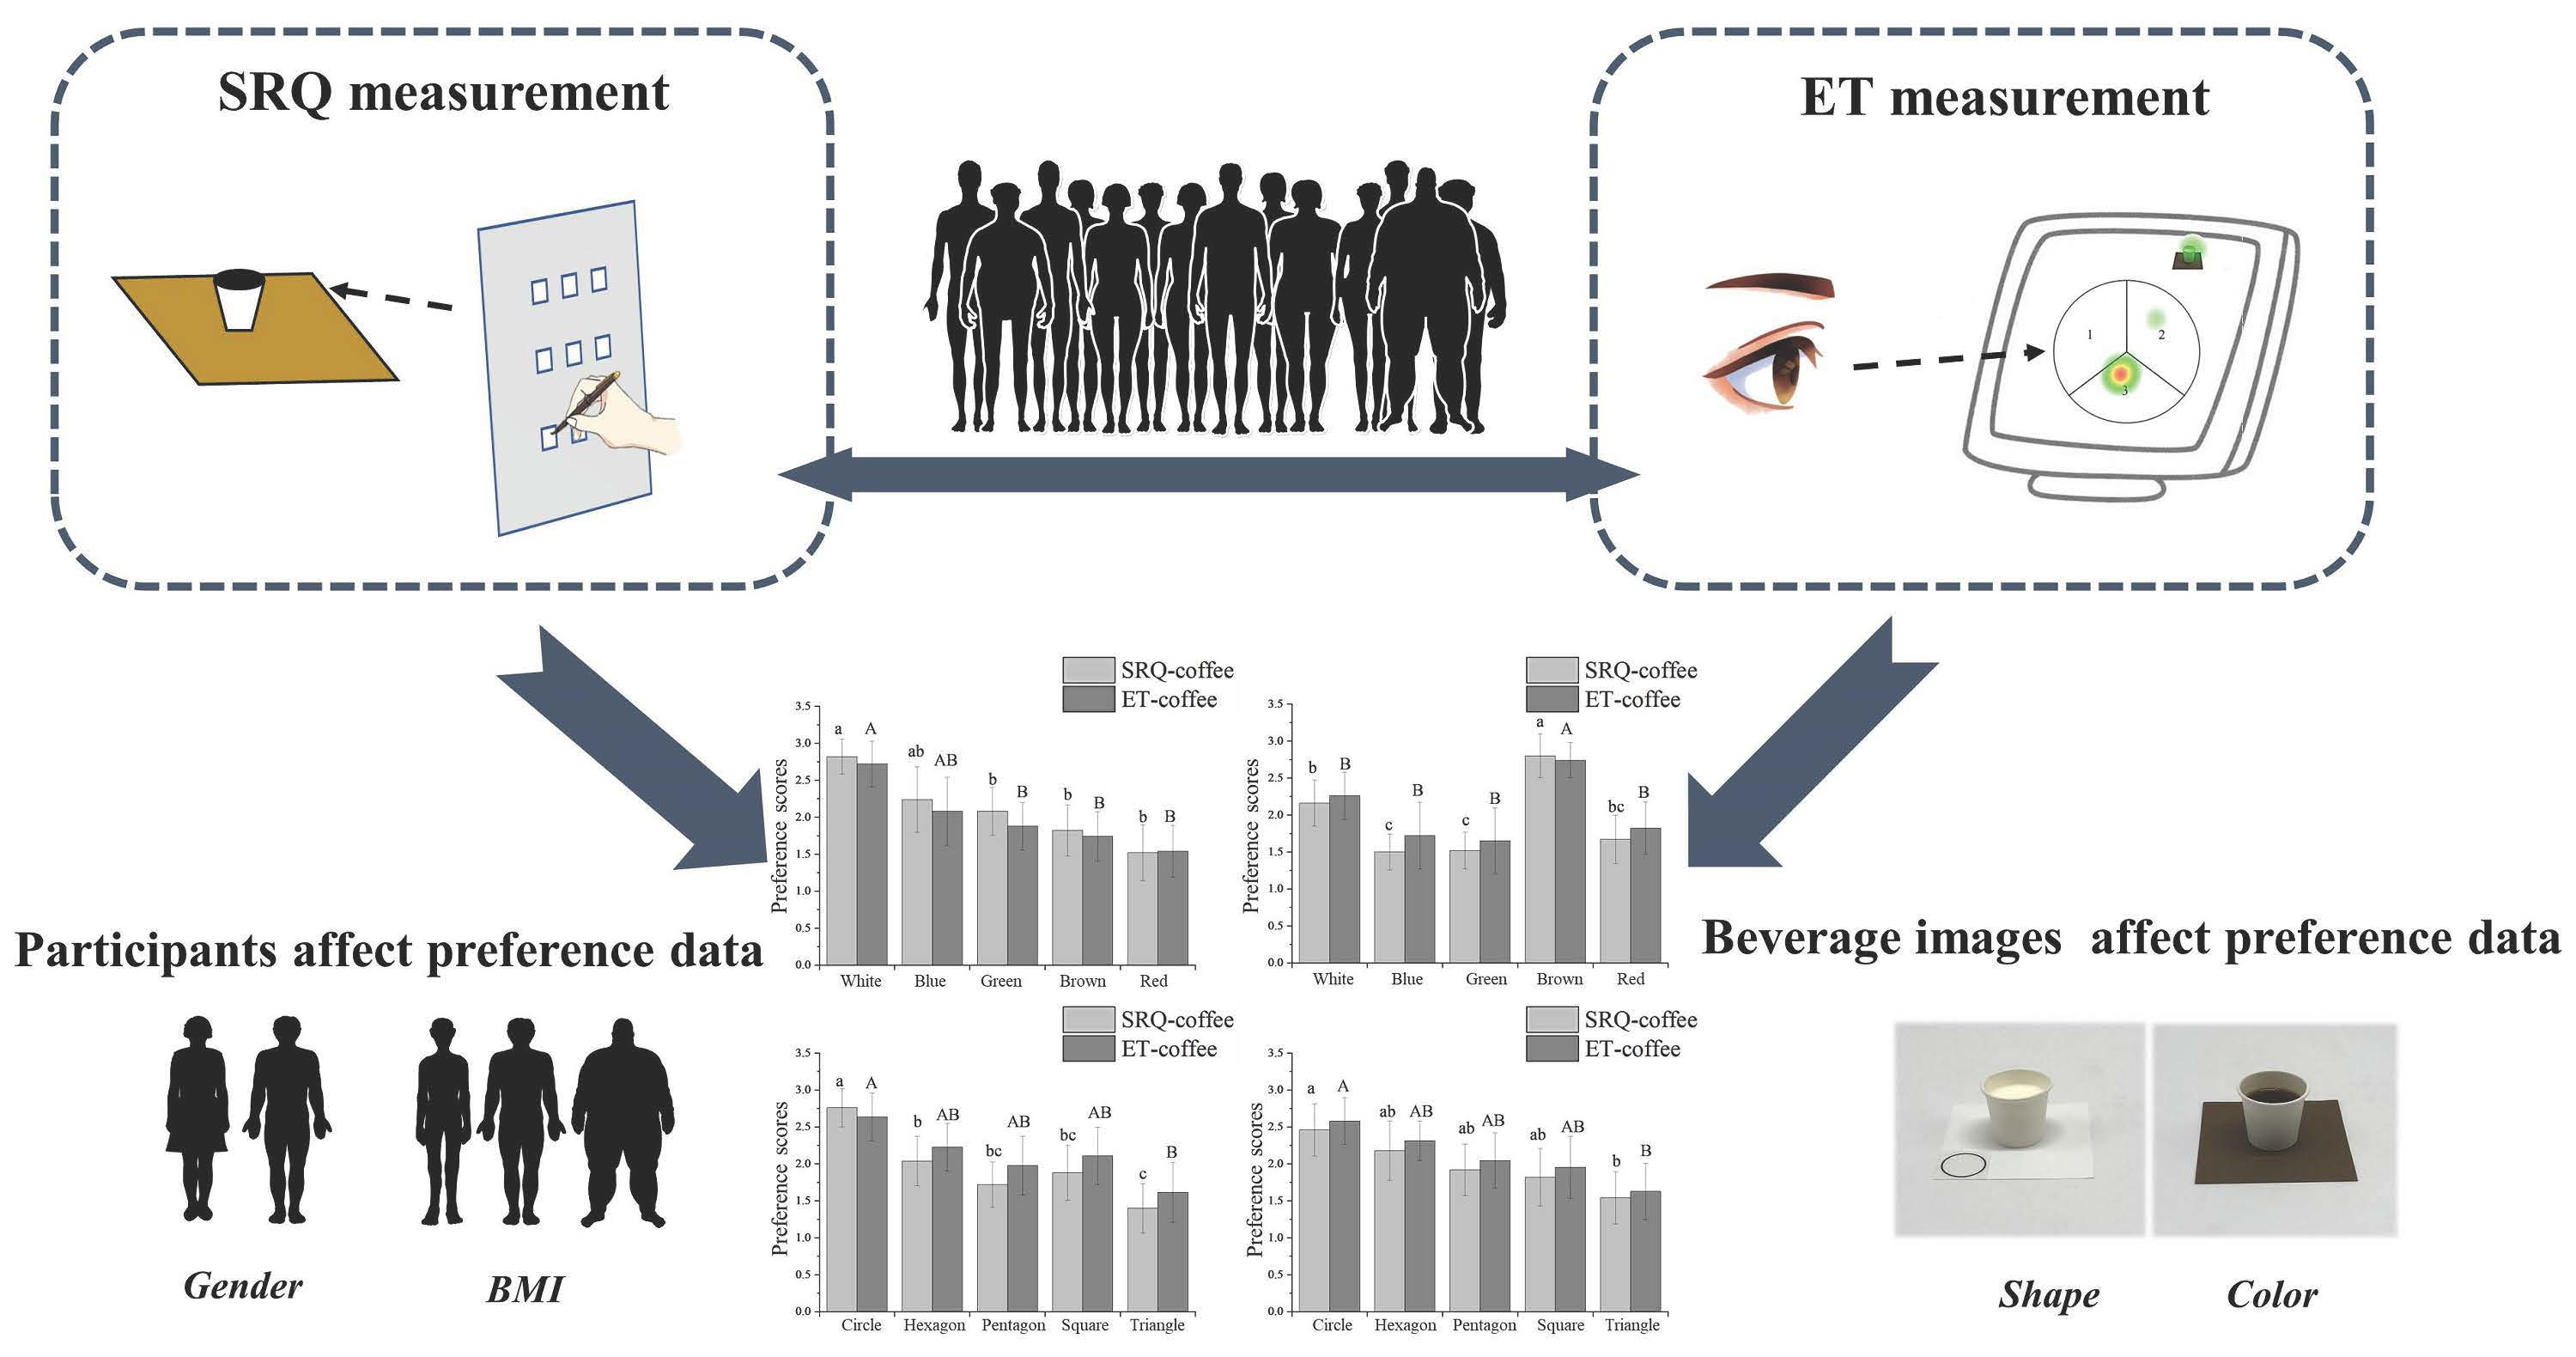
3. Results
3.1. Correspondence analysis
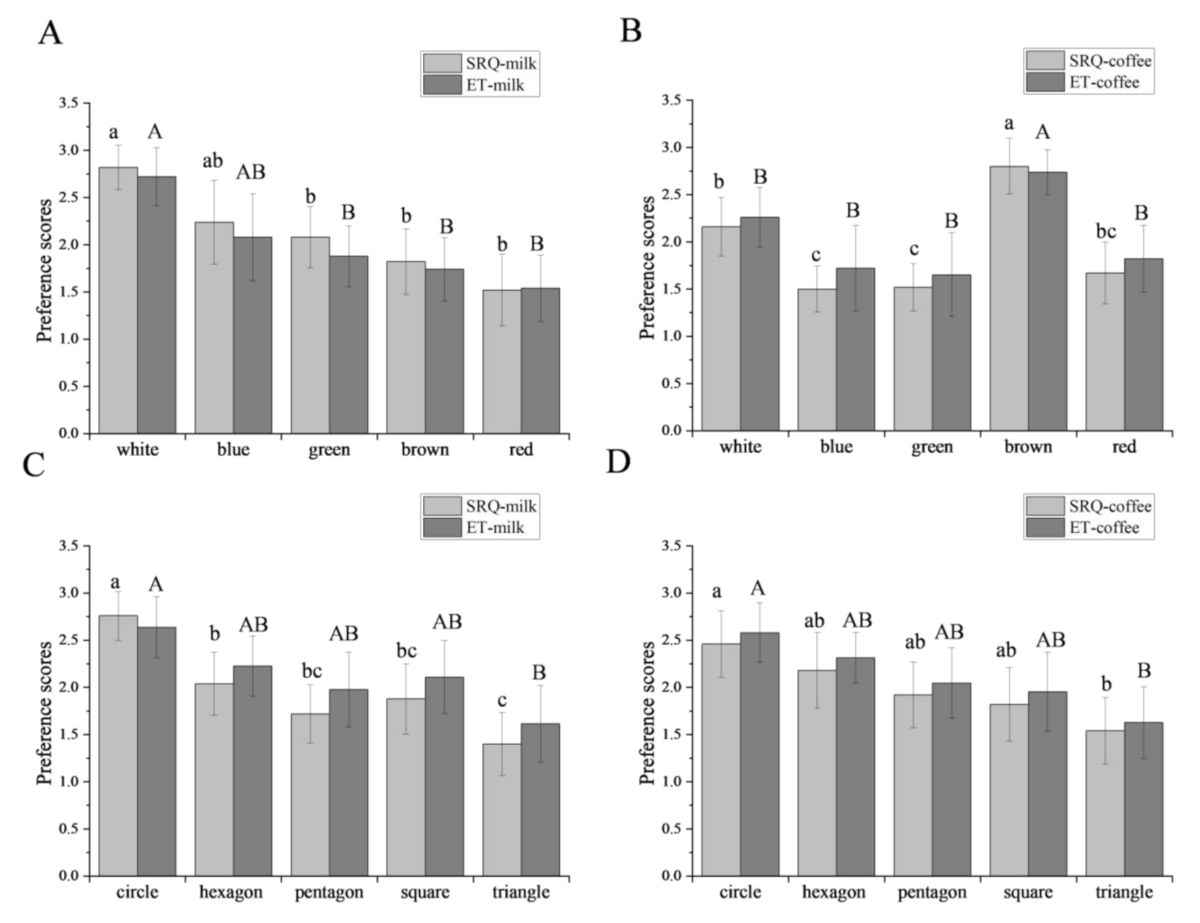
3.2. Preferences of the Whole Group
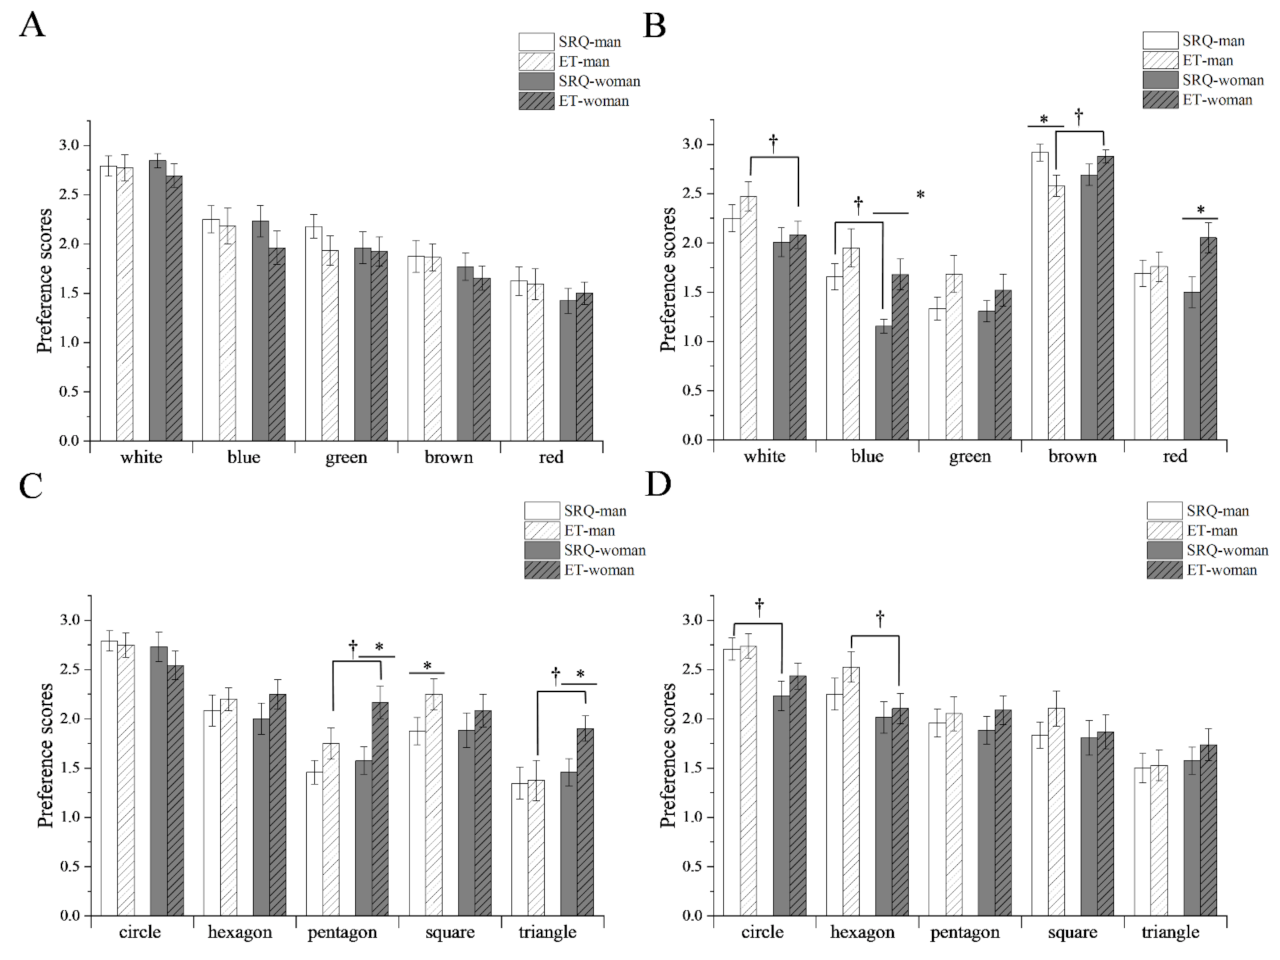
3.3. Preferences of the Gender Groups
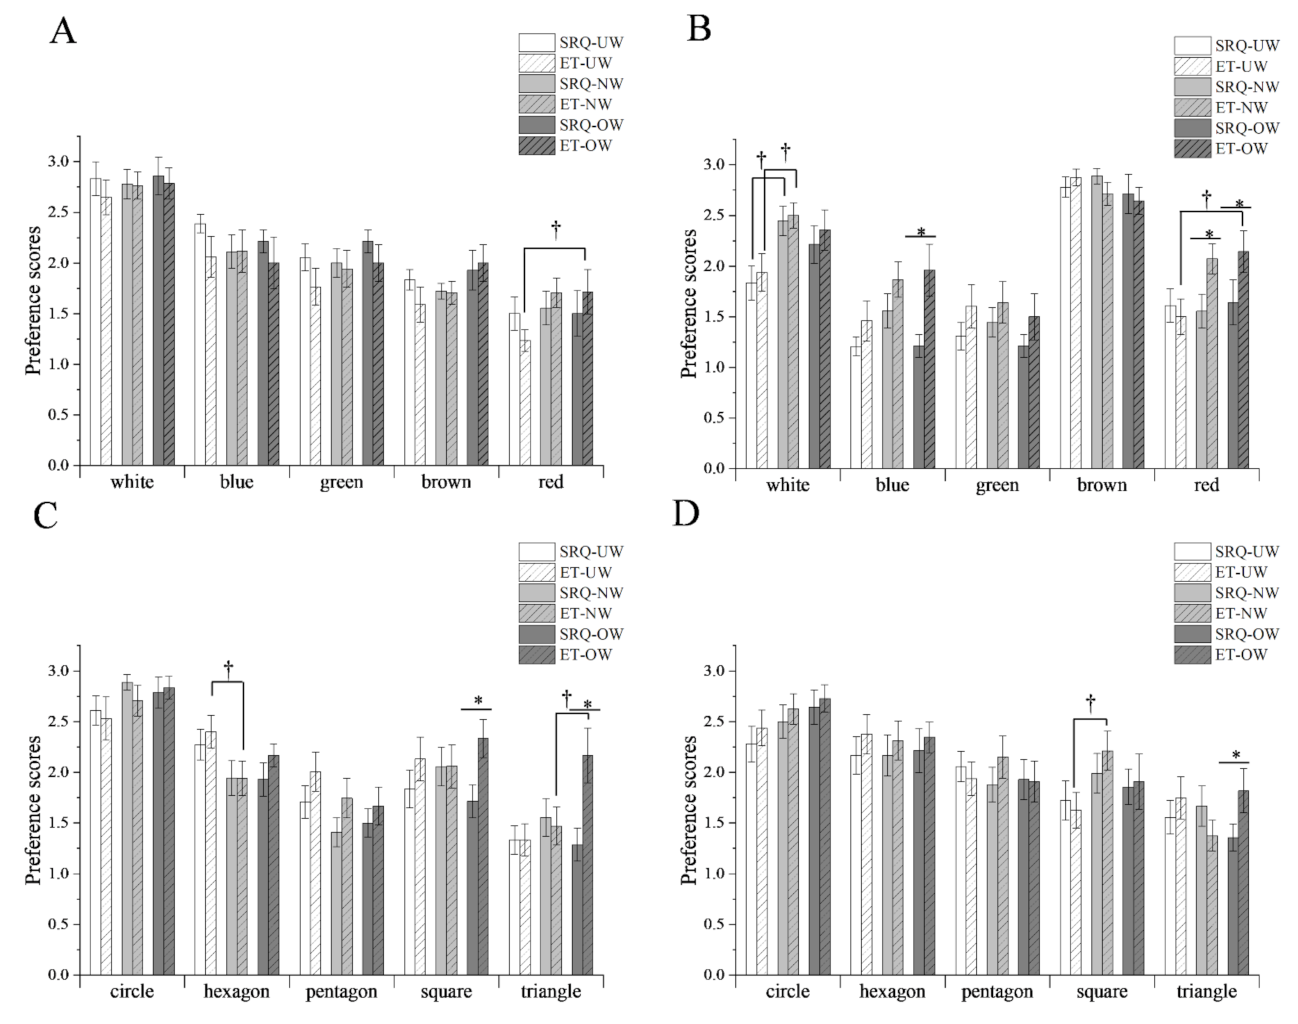
3.4. Preferences of the BMI Groups
3.5. Random Forest Classifier Analysis
4. Discussion
5. Conclusions
Supplementary Materials
Author Contributions
Funding
Institutional Review Board Statement
Informed Consent Statement
Data Availability Statement
Conflicts of Interest
References
- Jaeger, S.R.; Xia, Y.; Le Blond, M.; Beresford, M.K.; Hedderley, D.I.; Cardello, A.V. Supplementing hedonic and sensory consumer research on beer with cognitive and emotional measures, and additional insights via consumer segmentation. Food Qual. Prefer. 2019, 73, 117–134. [Google Scholar] [CrossRef]
- Laureati, M.; Sandvik, P.; Almli, V.L.; Sandell, M.; Zeinstra, G.G.; Methven, L.; Wallner, M.; Jilani, H.; Alfaro, B.; Proserpio, C. Individual differences in texture preferences among European children: Development and validation of the Child Food Texture Preference Questionnaire (CFTPQ). Food Qual. Prefer. 2020, 80, 103828. [Google Scholar] [CrossRef]
- Spence, C.; Velasco, C. On the multiple effects of packaging colour on consumer behaviour and product experience in the ‘food and beverage’ and ‘home and personal care’ categories. Food Qual. Prefer. 2018, 68, 226–237. [Google Scholar] [CrossRef]
- Nyitrai, Á.; Urbin, Á.; Nagy, B.V.; Sipos, L. Novel approach in sensory color masking: Effects of colored environments on chocolates with different cocoa content. Food Qual. Prefer. 2022, 95, 104363. [Google Scholar] [CrossRef]
- Moller, A.; Elliot, A.; Maier, M. Basic Hue-Meaning Associations. Emotion 2009, 9, 898–902. [Google Scholar] [CrossRef] [Green Version]
- Spence, C. On the psychological impact of food colour. Flavour 2015, 4, 21. [Google Scholar] [CrossRef] [Green Version]
- Werthmann, J.; Jansen, A.; Roefs, A. Worry or craving? A selective review of evidence for food-related attention biases in obese individuals, eating-disorder patients, restrained eaters and healthy samples. Proc. Nutr. Soc. 2014, 74, 99–114. [Google Scholar] [CrossRef]
- Lagast, S.; Gellynck, X.; Schouteten, J.J.; De Herdt, V.; De Steur, H. Consumers’ emotions elicited by food: A systematic review of explicit and implicit methods. Trends Food Sci. Technol. 2017, 69, 172–189. [Google Scholar] [CrossRef]
- Kaneko, D.; Toet, A.; Brouwer, A.-M.; Kallen, V.; Erp, J. Methods for Evaluating Emotions Evoked by Food Experiences: A Literature Review. Front. Psychol. 2018, 9, 911. [Google Scholar] [CrossRef] [Green Version]
- Morin, C. Neuromarketing: The New Science of Consumer Behavior. Society 2011, 48, 131–135. [Google Scholar] [CrossRef] [Green Version]
- Dalenberg, J.R.; Gutjar, S.; ter Horst, G.J.; de Graaf, K.; Renken, R.J.; Jager, G. Evoked Emotions Predict Food Choice. PLoS ONE 2014, 9, e115388. [Google Scholar] [CrossRef] [PubMed]
- de Wijk, R.A.; Noldus, L.P.J.J. Using implicit rather than explicit measures of emotions. Food Qual. Prefer. 2021, 92, 104125. [Google Scholar] [CrossRef]
- Ismael, D.; Ploeger, A. Development of a Sensory Method to Detect Food-Elicited Emotions Using Emotion-Color Association and Eye-Tracking. Foods 2019, 8, 217. [Google Scholar] [CrossRef] [PubMed] [Green Version]
- Dijksterhuis, A.; Bos, M.W.; Nordgren, L.F.; van Baaren, R.B. On making the right choice: The deliberation-without-attention effect. Science 2006, 311, 1005–1007. [Google Scholar] [CrossRef] [PubMed] [Green Version]
- Motoki, K.; Saito, T.; Onuma, T. Eye-tracking research on sensory and consumer science: A review, pitfalls and future directions. Food Res. Int. 2021, 145, 110389. [Google Scholar] [CrossRef] [PubMed]
- Orquin, J.L.; Mueller Loose, S. Attention and choice: A review on eye movements in decision making. Acta Psychol. 2013, 144, 190–206. [Google Scholar] [CrossRef] [Green Version]
- Shimojo, S.; Simion, C.; Shimojo, E.; Scheier, C. Gaze bias both reflects and influences preference. Nat. Neurosci. 2003, 6, 1317–1322. [Google Scholar] [CrossRef]
- Piqueras-Fiszman, B.; Velasco, C.; Salgado-Montejo, A.; Spence, C. Using combined eye tracking and word association in order to assess novel packaging solutions: A case study involving jam jars. Food Qual. Prefer. 2013, 28, 328–338. [Google Scholar] [CrossRef]
- Mehrabian, A.; Russell, J.A. An Approach to Environmental Psychology; MIT Press: Cambridge, UK, 1974. [Google Scholar]
- Lin, I.Y. Evaluating a servicescape: The effect of cognition and emotion. Int. J. Hosp. Manag. 2004, 23, 163–178. [Google Scholar] [CrossRef]
- Bitner, M.J. Servicescapes: The Impact of Physical Surroundings on Customers and Employees. J. Mark. 1992, 56, 57–71. [Google Scholar] [CrossRef]
- Schreuder, E.; van Erp, J.; Toet, A.; Kallen, V.L. Emotional Responses to Multisensory Environmental Stimuli: A Conceptual Framework and Literature Review. SAGE Open 2016, 6, 2158244016630591. [Google Scholar] [CrossRef] [Green Version]
- Vidal, L.; Tárrega, A.; Antúnez, L.; Ares, G.; Jaeger, S.R. Comparison of Correspondence Analysis based on Hellinger and chi-square distances to obtain sensory spaces from check-all-that-apply (CATA) questions. Food Qual. Prefer. 2015, 43, 106–112. [Google Scholar] [CrossRef]
- Antúnez, L.; Machín, L.; Ares, G.; Jaeger, S.R. Visual attention to rate-all-that-apply (RATA) questions: A case study with apple images as food stimuli. Food Qual. Prefer. 2019, 72, 136–142. [Google Scholar] [CrossRef]
- Manippa, V.; van der Laan, L.N.; Brancucci, A.; Smeets, P.A.M. Health body priming and food choice: An eye tracking study. Food Qual. Prefer. 2019, 72, 116–125. [Google Scholar] [CrossRef]
- Goyal, S.; Miyapuram, K.P.; Lahiri, U. Predicting Consumer’s Behavior Using Eye Tracking Data. In Proceedings of the 2015 Second International Conference on Soft Computing and Machine Intelligence (ISCMI), Hong Kong, China, 23–24 November 2015; pp. 126–129. [Google Scholar]
- Deng, X.; Liu, Z.; Zhan, Y.; Ni, K.; Zhang, Y.; Ma, W.; Shao, S.; Lv, X.; Yuan, Y.; Rogers, K.M. Predictive geographical authentication of green tea with protected designation of origin using a random forest model. Food Control 2020, 107, 106807. [Google Scholar] [CrossRef]
- Jaeger, S.R.; Beresford, M.K.; Paisley, A.G.; Antúnez, L.; Vidal, L.; Cadena, R.S.; Giménez, A.; Ares, G. Check-all-that-apply (CATA) questions for sensory product characterization by consumers: Investigations into the number of terms used in CATA questions. Food Qual. Prefer. 2015, 42, 154–164. [Google Scholar] [CrossRef]
- Tepper, B.J.; Banni, S.; Melis, M.; Crnjar, R.; Tomassini Barbarossa, I. Genetic sensitivity to the bitter taste of 6-n-propylthiouracil (PROP) and its association with physiological mechanisms controlling body mass index (BMI). Nutrients 2014, 6, 3363–3381. [Google Scholar] [CrossRef] [Green Version]
- Mora, M.; Urdaneta, E.; Chaya, C. Emotional response to wine: Sensory properties, age and gender as drivers of consumers’ preferences. Food Qual. Prefer. 2018, 66, 19–28. [Google Scholar] [CrossRef]
- Yarar, N.; Machiels, C.J.A.; Orth, U.R. Shaping up: How package shape and consumer body conspire to affect food healthiness evaluation. Food Qual. Prefer. 2019, 75, 209–219. [Google Scholar] [CrossRef]
- Gromski, P.S.; Correa, E.; Vaughan, A.A.; Wedge, D.C.; Turner, M.L.; Goodacre, R. A comparison of different chemometrics approaches for the robust classification of electronic nose data. Anal. Bioanal. Chem. 2014, 406, 7581–7590. [Google Scholar] [CrossRef]
- Vadiveloo, M.; Principato, L.; Morwitz, V.; Mattei, J. Sensory variety in shape and color influences fruit and vegetable intake, liking, and purchase intentions in some subsets of adults: A randomized pilot experiment. Food Qual. Prefer. 2019, 71, 301–310. [Google Scholar] [CrossRef] [PubMed]
- Yasui, Y.; Tanaka, J.; Kakudo, M.; Tanaka, M. Relationship between preference and gaze in modified food using eye tracker. J. Prosthodont. Res. 2019, 63, 210–215. [Google Scholar] [CrossRef] [PubMed]
- Sung, Y.-C.; Tang, D.-L. Unconscious processing embedded in conscious processing: Evidence from gaze time on Chinese sentence reading. Conscious. Cogn. 2007, 16, 339–348. [Google Scholar] [CrossRef] [PubMed]


| Datasets | Prediction Datasets Accuracy (%) | Participant Parameter Contribution | Visual Parameter Contribution | |||||
|---|---|---|---|---|---|---|---|---|
| BMI | Gender | Sum | Color | Shape | Sum | |||
| Milk | WCM-ET | 74.3 | 0.16 | 0.09 | 0.25 | 0.29 | 0.46 | 0.75 |
| WCM-SRQ | 76.4 | 0.50 | 0.22 | 0.72 | 0.19 | 0.09 | 0.28 | |
| Coffee | BCC-ET | 67.3 | 0.33 | 0.06 | 0.39 | 0.19 | 0.42 | 0.61 |
| BCC-SRQ | 67.2 | 0.47 | 0.12 | 0.59 | 0.17 | 0.24 | 0.41 | |
Publisher’s Note: MDPI stays neutral with regard to jurisdictional claims in published maps and institutional affiliations. |
© 2022 by the authors. Licensee MDPI, Basel, Switzerland. This article is an open access article distributed under the terms and conditions of the Creative Commons Attribution (CC BY) license (https://creativecommons.org/licenses/by/4.0/).
Share and Cite
Sun, H.; Wang, W.; Liu, X.; Zhu, B.; Huang, Y.; Leng, X.; Jia, L. Comparison of Self-Report Questionnaire and Eye Tracking Method in the Visual Preference Study of a Youth–Beverage Model. Foods 2022, 11, 505. https://doi.org/10.3390/foods11040505
Sun H, Wang W, Liu X, Zhu B, Huang Y, Leng X, Jia L. Comparison of Self-Report Questionnaire and Eye Tracking Method in the Visual Preference Study of a Youth–Beverage Model. Foods. 2022; 11(4):505. https://doi.org/10.3390/foods11040505
Chicago/Turabian StyleSun, Hongbo, Wanxin Wang, Xinnan Liu, Benzhong Zhu, Yue Huang, Xiaojing Leng, and Lu Jia. 2022. "Comparison of Self-Report Questionnaire and Eye Tracking Method in the Visual Preference Study of a Youth–Beverage Model" Foods 11, no. 4: 505. https://doi.org/10.3390/foods11040505