
Sill Role Effect on the Flow Characteristics (Experimental and Regression Model Analytical)
by
 , , ,
, , ,
Hamidreza Abbaszadeh
1 ,
,
Reza Norouzi
1 ,
,
Veli Sume
2,
Alban Kuriqi
3 ,
,
Rasoul Daneshfaraz
1,* and
John Abraham
4 1
Department of Civil Engineering, Faculty of Engineering, University of Maragheh, Maragheh 5518183111, Iran
2
Department of Civil Engineering, Faculty of Engineering and Architecture, Recep Tayyip Erdogan University, Rize 53100, Türkiye
3
Civil Engineering Research and Innovation for Sustainability, Instituto Superior Técnico, Universidade de Lisboa, 1049-001 Lisboa, Portugal
4
School of Engineering, University of St. Thomas, St. Paul, MN 33901, USA
*
Author to whom correspondence should be addressed.
Fluids 2023, 8(8), 235; https://doi.org/10.3390/fluids8080235
Submission received: 17 July 2023
/
Revised: 13 August 2023
/
Accepted: 17 August 2023
/
Published: 21 August 2023
(This article belongs to the Special Issue Pipe Flow: Research and Applications)
Abstract
:This study investigates the effects of gate openings and different sill widths on the sluice gate’s energy dissipation and discharge coefficient (Cd). The physical model of the sills includes rectangular sills of different dimensions. The results show that the gate opening size is inversely related to the Cd for a gate without a sill. In addition, increasing the gate opening size for a given discharge decreases the relative energy dissipation, and increasing the Froude number increases the relative energy dissipation. The results also show that the Cd and relative energy dissipation decrease when the width of the sill is decreased, thus increasing the total area of the flux flowing through the sluice gate and vice versa. According to the experimental results, the relative energy dissipation and the Cd of the sluice gate are larger for all sill widths than without the sill. Finally, non-linear polynomial relationships are presented based on dimensionless parameters for predicting the relative energy dissipation and outflow coefficient.
1. Introduction
The gates are structures where water flow is regulated and controlled based on the height of the gate openings from the lower surface. The most common type of structure is the sluice gate (a gate that moves in a vertical plane); flow accuracy is based on the energy loss and discharge coefficient (Cd). Designers often exercise extreme care when controlling and distributing water in irrigation networks to avoid wasting water.
Structures for river control, such as locks, should always be selected correctly and according to the conditions of the area in question so as not to have problems later. Multiple gates (e.g., double/triple) are used when the design height of the gate exceeds the design criteria [1]. Multiple gates are very expensive. Gate dimensions can be reduced through the use of a sill. The sill will reduce the gate structure’s height and the force on the gate body. Therefore, a combination of gate and sill can be considered.
Henry [2] and Rajaratnam and Subramanya [3] were the first studies to determine the Cd value of sluice gates. Rajaratnam [4] studied the free flow in sluice gates and established an equation to estimate the Cd value. Swamee [5] determined the Cd of sluice gates subjected to free flow conditions; the relationship included the dependence of upstream depth and gate opening. Shivapur and Prakash [6] studied the sluice gates at different positions and established a relationship for Cd. Using Mathematica software, Nasehi Oskuyi and Salmasi [7] determined the Cd value of sluice gates. Their results agreed well with the results of Henry [2]. Daneshfaraz et al. [8] studied the edge shapes of sluice gates and their impact on flow characteristics using FLOW-3D. They found a flow contraction coefficient for sluice gates with sharp edges upward and downward, and round edges decrease when the sluice gate opening/specific energy upstream is less than 0.4 and increase for larger ratios. Salmasi et al. [9] evaluated the Cd of inclined gates using multiple machine intelligence models. Their study showed that the Cd value increases with increasing angle. In Salmasi and Abraham study [10], laboratory experiments were performed to quantify the Cd for oblique sluice gates. They showed that the sluice gate slope has an effect on the Cd; using a gate increases the Cd.
For a sill/gate combination, it is worth mentioning an experimental study on the shape and height of the sill below the sluice gate [11]. The results showed that the Cd increases when a sill is employed. Salmasi and Norouzi [12] showed that a circular sill increases the Cd value by at least 23–31%. Karami et al. [13] numerically investigated the effect of geometric sill shape on Cd; they found that the semicircular sill has a greater effect. Salmasi and Abraham [14] carried out experiments on sills. They found that a sill plays an effective role in increasing Cd. Ghorbani et al. [15] analyzed sluice gate Cd using the H2O method and soft computing models. Lauria et al. [16] studied sluice gates for wide-crowned weirs. They found that it is possible to operate a weir so that viscous effects can be neglected.
The dissipation and discharge performance of hydraulic structures such as sills can affect the stability and strength of structures in the riverbed and channels. The structure must be efficient and economically viable when comparing and designing dissipator structures to reduce flow energy. In addition, a stilling basin requires increased construction time and cost, specialized components and materials, skilled labor, and accuracy in design and construction. In contrast, sill elements are simple and inexpensive.
In all of the above studies, various studies have been conducted on the effect of sills. In addition, there is a need to study the sill with different widths to prevent sediment accumulation upstream of the gate and under the sluice gate, as well as their effects on the hydraulic capacity, the corresponding Cd, and energy dissipation, which were studied in this research. This research intends to improve the design of hydraulic control structures. Due to the importance of the subject, the Cd and energy dissipation in the conditions without a sill, with a suppressed sill, and with an unsuppressed sill are investigated at various gate openings.
2. Materials and Methods
2.1. Experimental Equipment
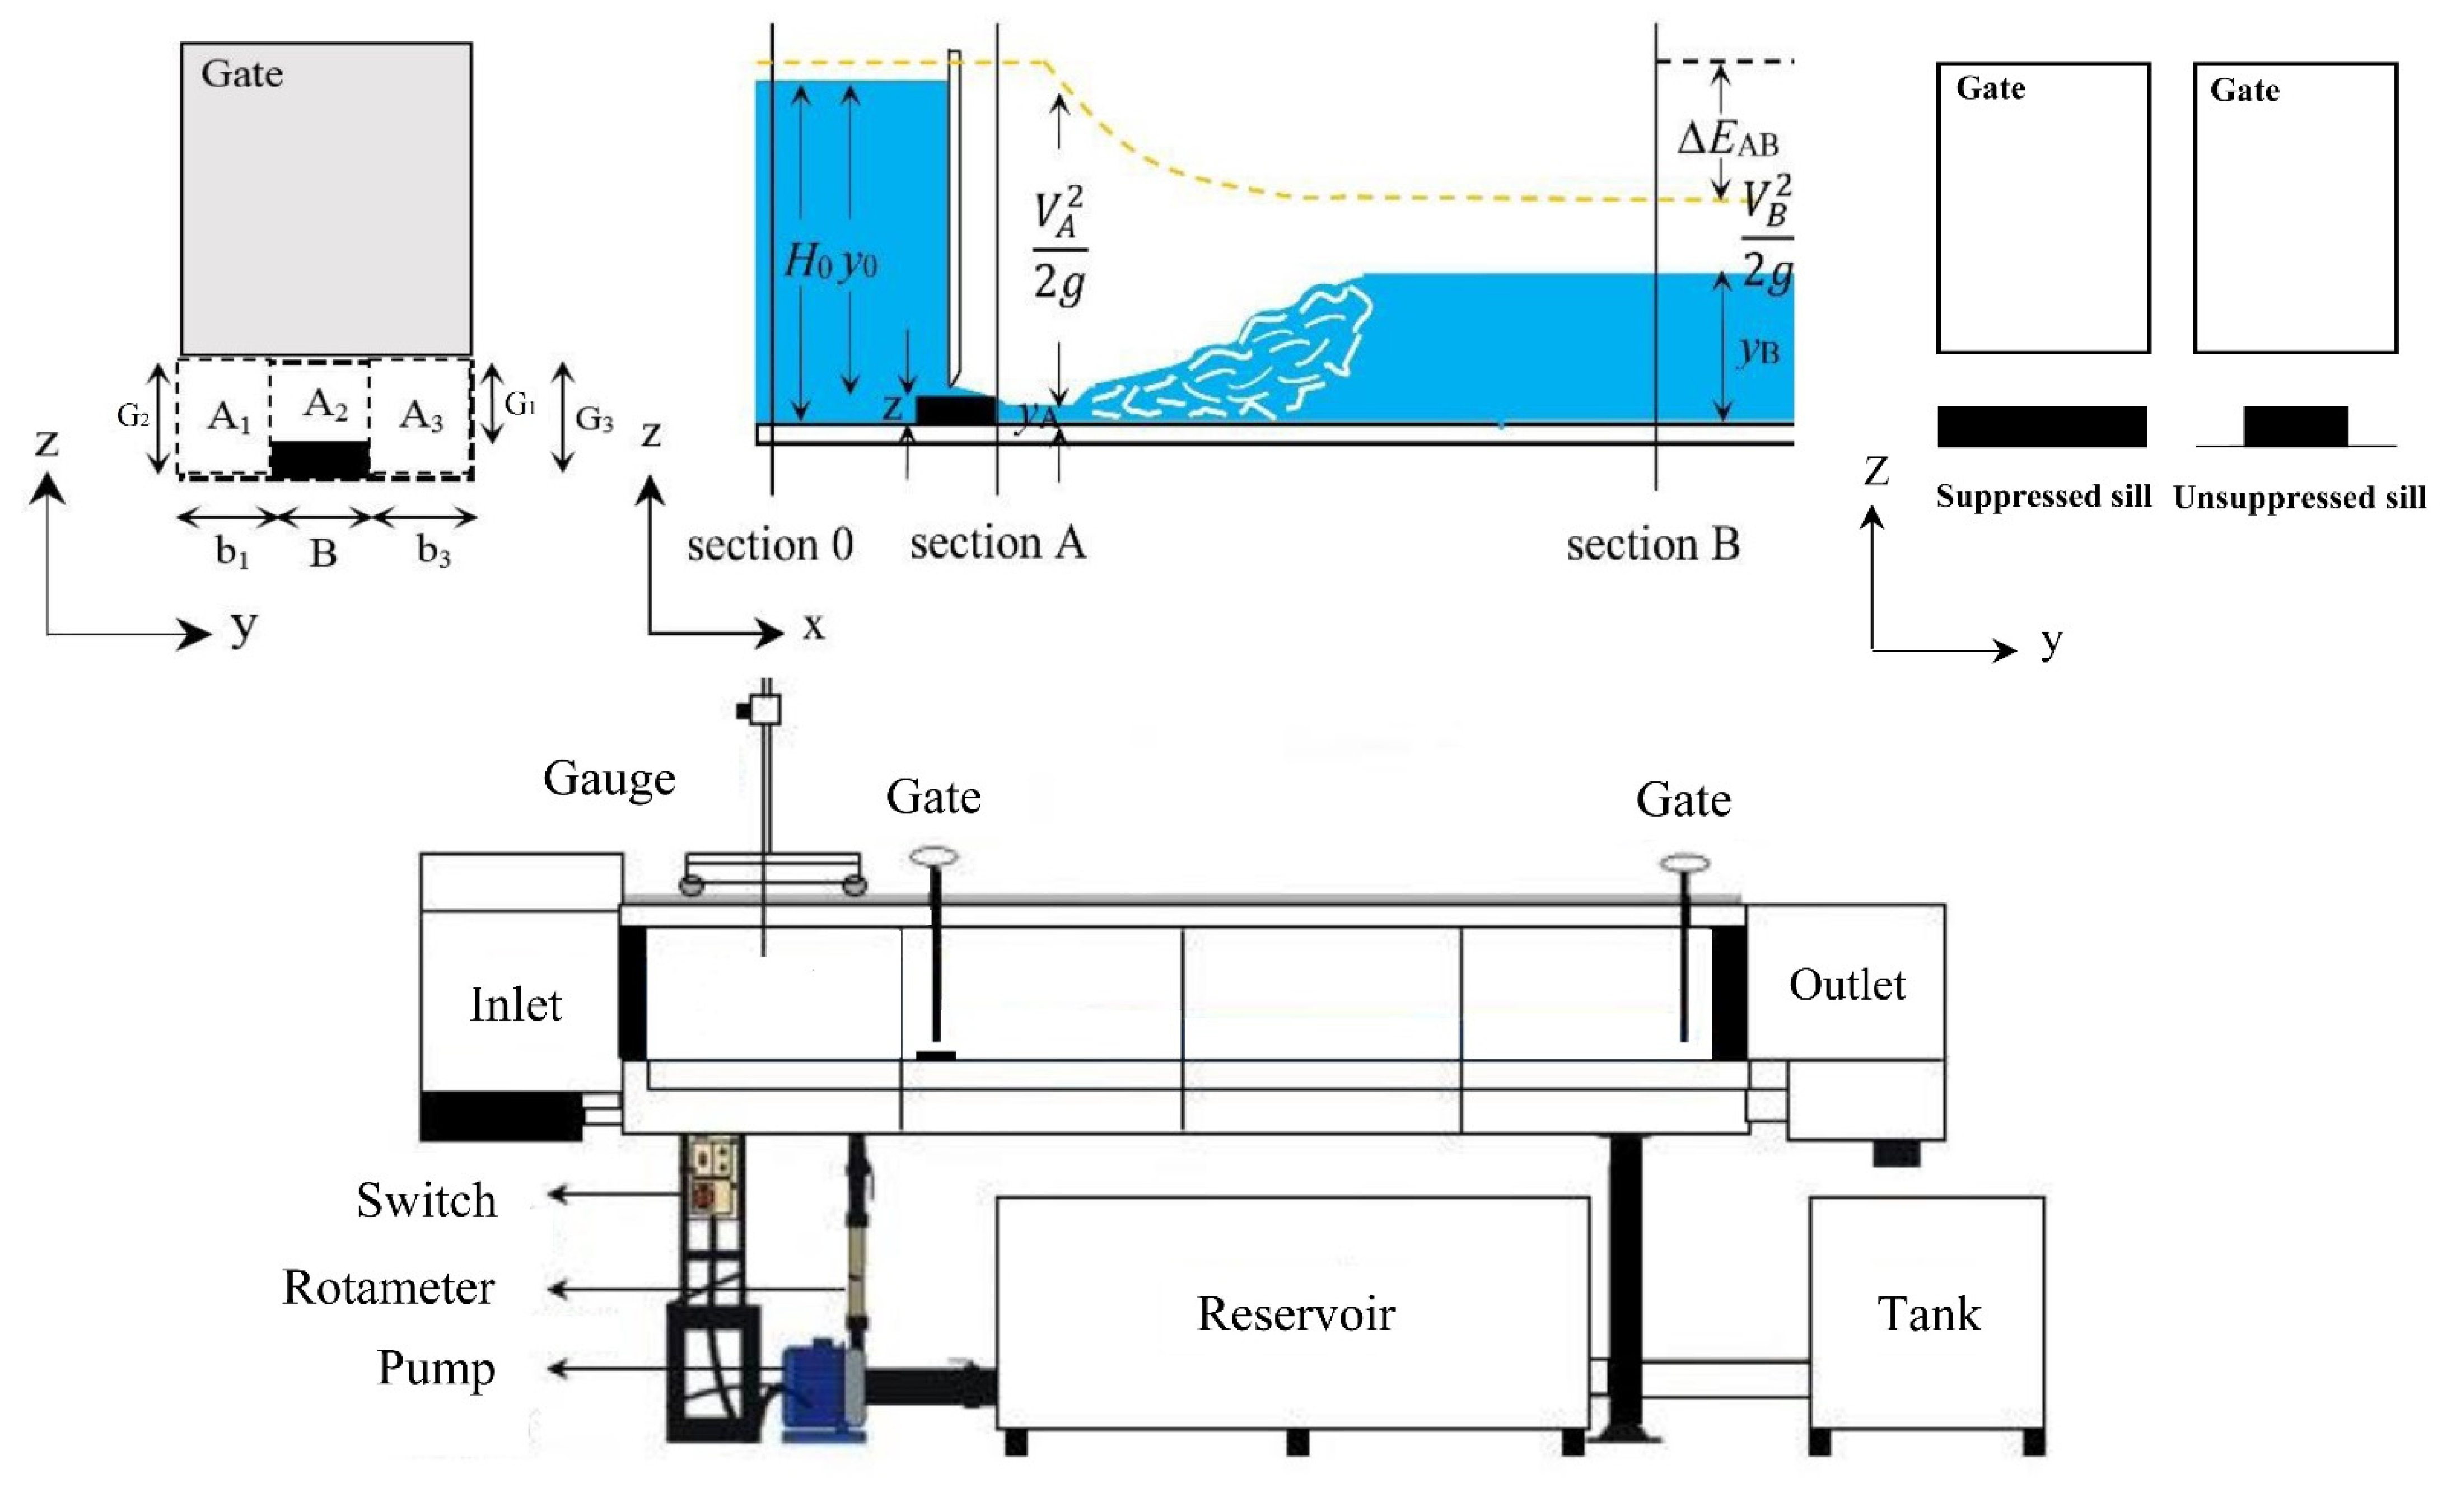
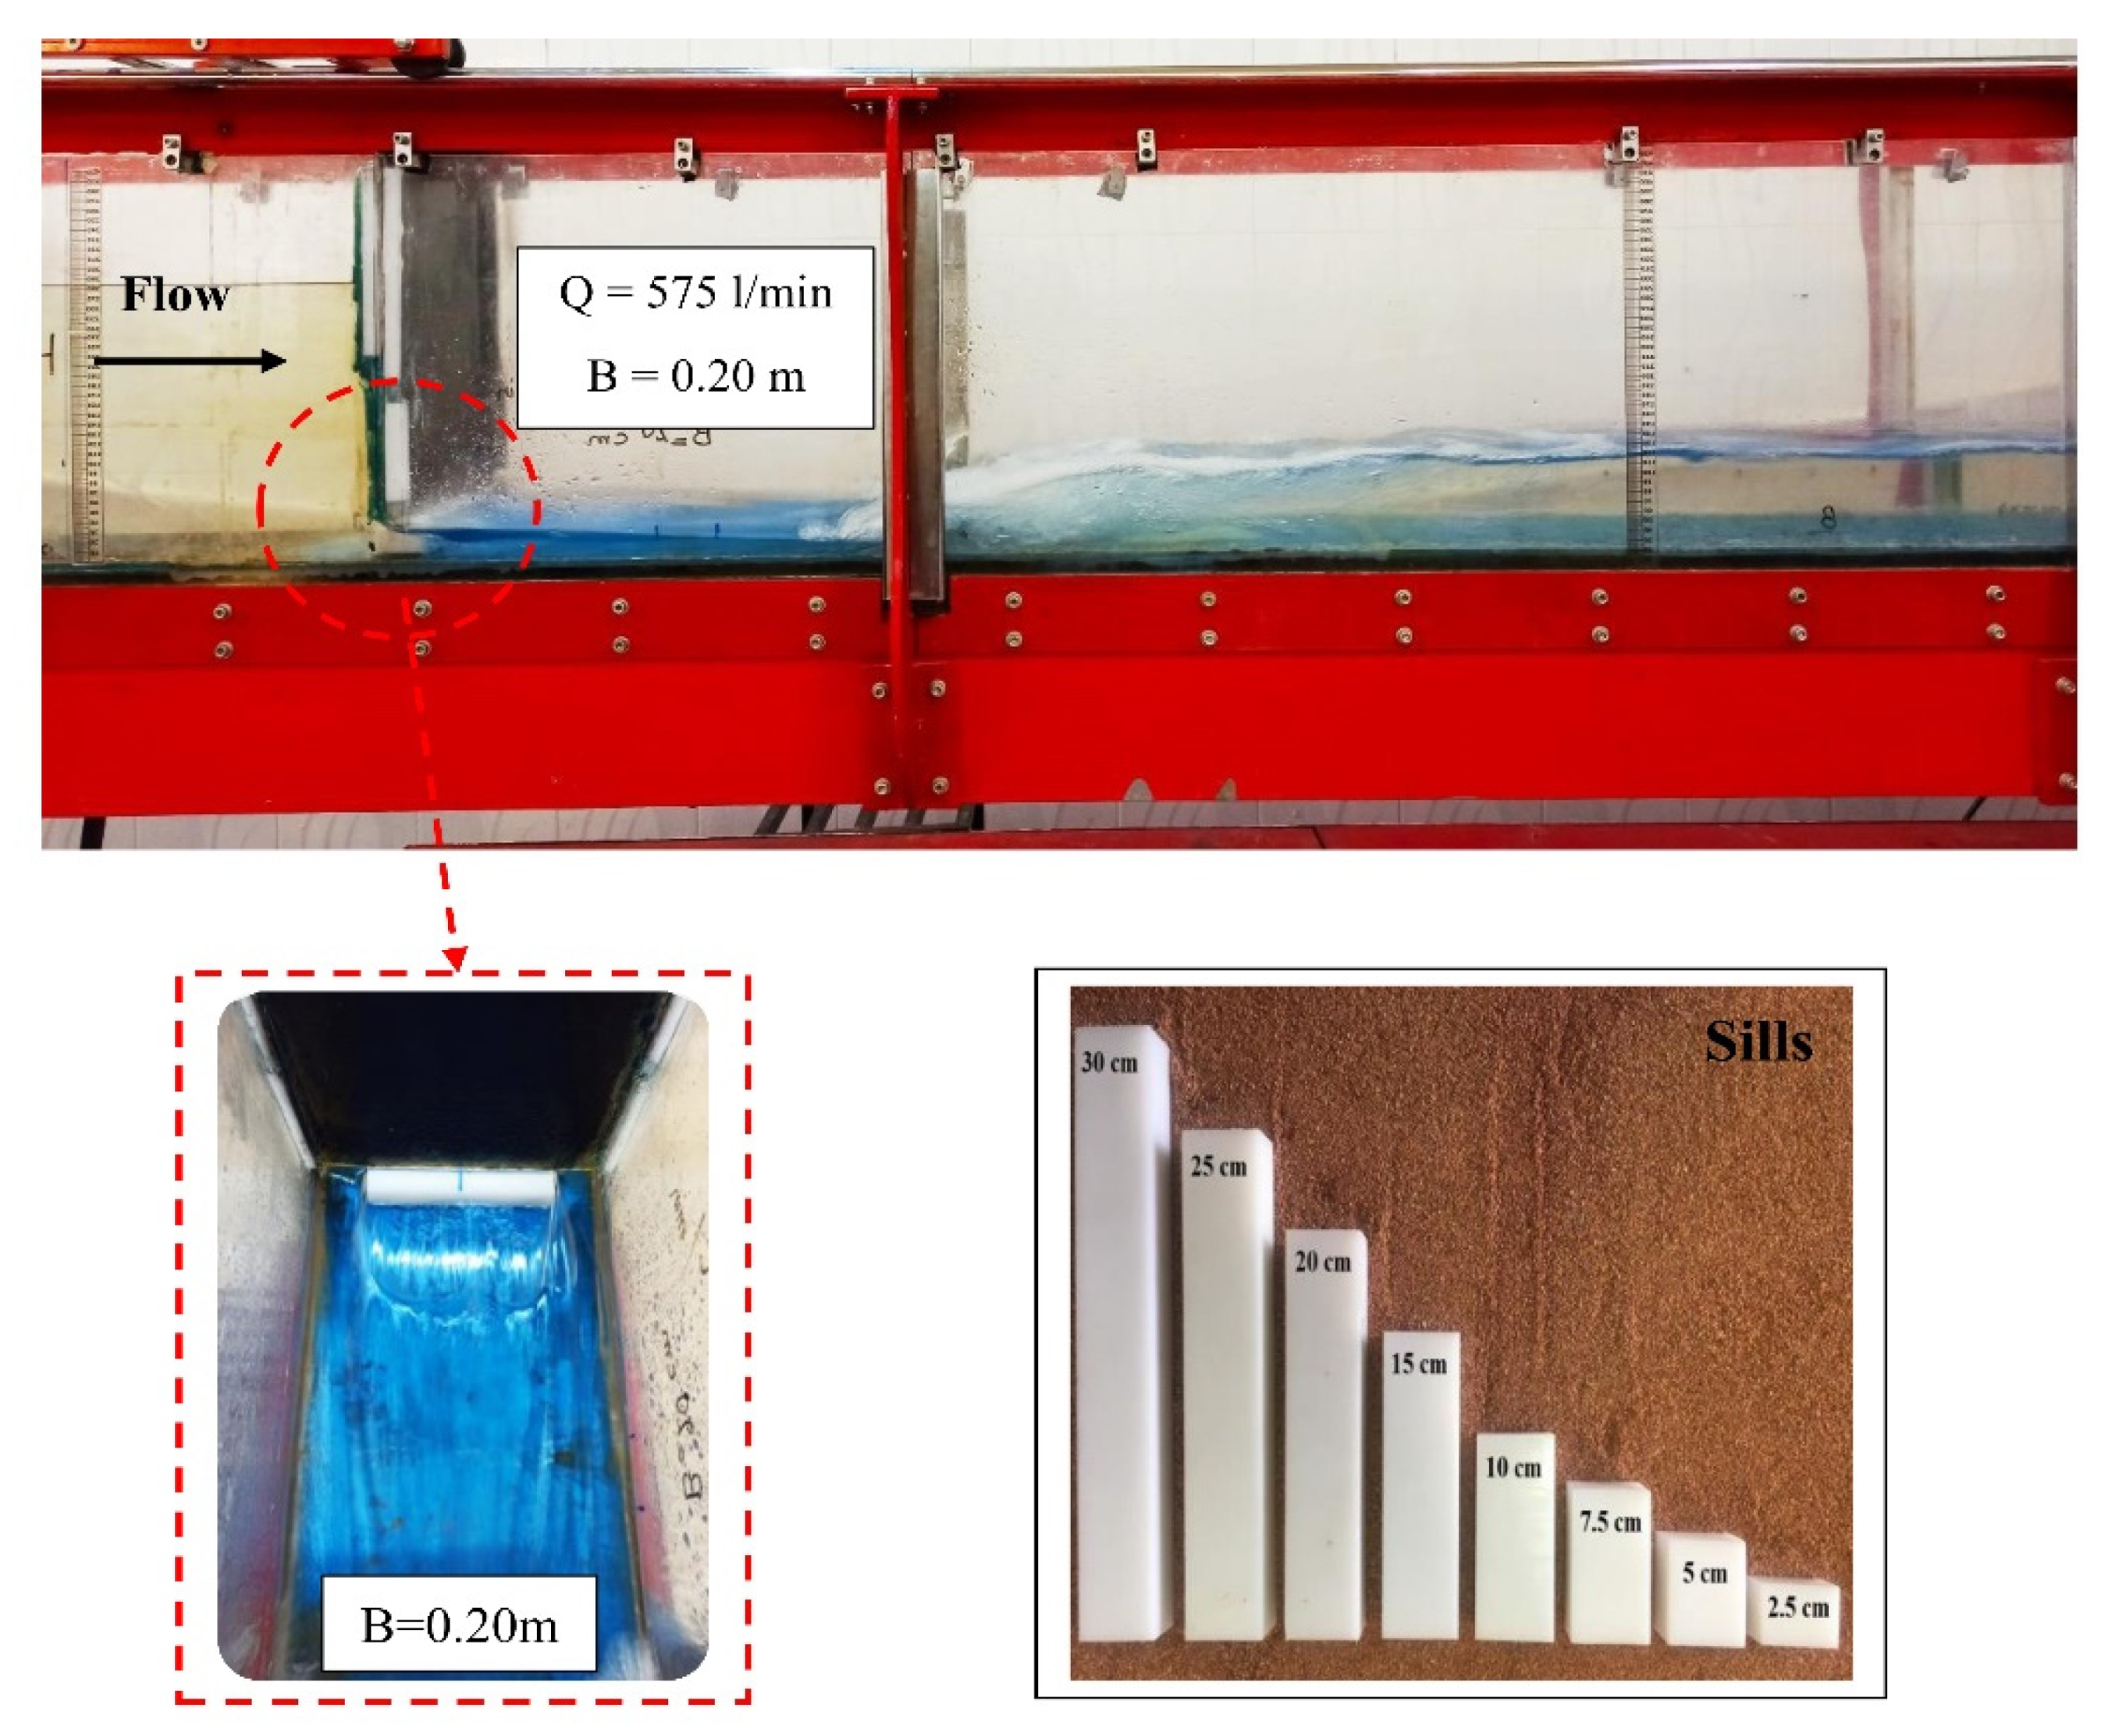
Here, an experimental facility with a flow-controlling flume of a rectangular cross-section shape with 5 m length, 0.3 m width, and 0.5 m depth with transparent polymeric walls was used to conduct the experiments. The channel bottom slope could be modified but was set to horizontal during the experiments. A pump provided a flow of 900 L per minute to the flume, and a rotameter with a relative error of ±2% was installed on the flume to read the inlet flow. Stilling plates reduced the turbulence entering the reservoir. The point gauge (±1 mm) was used with a movable rail to measure water depth at four cross-section locations, and their average was calculated. Another gate was installed downstream to stabilize the hydraulic jump within the channel. Experiments were conducted in two modes with and without sills in different openings. This study conducted experiments with polyethylene sills, with a thickness and height of 0.05 m and 0.03 m, respectively. Various sill widths were employed (0.025, 0.05, 0.075, 0.10, 0.15, 0.20, 0.25, and 0.30 m) below the sluice gate. A schematic image of the sluice gate sill and experimental channel of the present study is shown in Figure 1. A total of 111 experiments were conducted in a discharge range of 150 to 750 L/min to investigate the energy dissipation and Cd of the vertical sluice gate. Figure 2 shows photographs of the physical experiment.
2.2. Dimensional Analysis
Energy conservation/loss between sections A and B is calculated using the energy principle according to Equation (1):
where EA and EB are the specific energies of water in sections A and B, respectively. yA is the depth of water in section A or, in other words, the initial depth; yB is the depth of water in section B or the following depth; VA and VB are the velocities averaged over depth in sections A and B, respectively; and g is the gravitational acceleration. In Equation (1), α is the correction factor for kinetic energy and is equal to
In Equation (2), Vi is the velocity in section i, Ai is the cross-sectional area of i, A is the total area of the section (A = ∑Ai), and V is the velocity averaged over depth in the entire section.
The parameters affecting energy dissipation are
In Equation (3), Q is the discharge, W represents the channel width, B quantifies the sill width, L is the sill thickness, Z is the sill height, ρ is density, and μ is dynamic viscosity. Considering ρ, g, and yA as iterative variables and using the π-Buckingham, Equation (4) emerges as
In Equation (4), FrA and ReA are the Froude and Reynolds numbers, respectively, in section A. Some of the parameters in the above relationship, such as channel width, thickness, and sill height, have assumed specific values and are not present in the research objectives, so the effects of these parameters have been ignored. In the present study, since the flow is turbulent, the Reynolds number can be ignored [17,18,19]. To make the parameters meaningful, the dimensional analysis of the present study was summarized and calculated in Equation (5) by dividing some of them by each other.
The discharge rate below the sluice gate without sill (Equation (6)) and with sill (Equation (7)) can be calculated under free flow conditions:
where H0 is the upstream water depth of the sluice gate, G1 is the gate opening with suppressed sill and without sill, WG1 is the flow area under the gate, and Cd is the discharge coefficient.
According to this, Equation (7) is modified to Equation (8) for the unsuppressed sill situation:
where A1, A3, and A2 are the areas of the flow without the sill and above the unsuppressed sill, respectively (Figure 1).
The magnitude of the Cd in the condition without a sill depends on the upstream depth and the openings. The functional dependence is [5]
For the sill situation, the most important parameters affecting the Cd are
With the same method, a dimensionless relation (11) can be presented:
In the present study, considering that the sill is located in the flume’s center, the flow’s areas on both sides of the sill are equal to each other, so the combined area of the flow will be Atotal = 2A1 + A2. Therefore, the parameters studied in the present study were presented as relation (12):
According to Equation (13), for the condition without a sill, hydrodynamic force applied to the sluice gate can be calculated by writing the momentum equation between sections 0 and A.
Here, the symbol q represents the discharge per unit width of the channel, γ is the specific water weight, and R is the reaction force from the gate on the water, which is equal to the hydrodynamic force. The force on the gate is calculated by measuring the fluid depth in sections 0 and A, calculating the average velocity in these sections, and placing the values of γ and ρ in Equation (13).
2.3. Statistical Indicators
In the present study, equations are presented to estimate the ratio of energy dissipation upstream and downstream of the hydraulic jump and the Cd of the gate with and without a sill. For this purpose, the dependent parameters were considered a function of the independent parameters. The statistical indicators of absolute error (AE), percent relative error (RE %), root mean square error (RMSE), and coefficient of determination (R2) were used to evaluate the equations:
In the above equations, exp and cal represent the experimental and calculated values, and n is the total data. SSregression and SStotal represent the sum squared regression error and total squared error, respectively. The values of Equations (14)–(16) when close to the number zero and the values of the relation (17) when close to the number one indicate the high accuracy of the presented relations.
3. Results and Discussion
3.1. Energy Dissipation of Gate without Sill
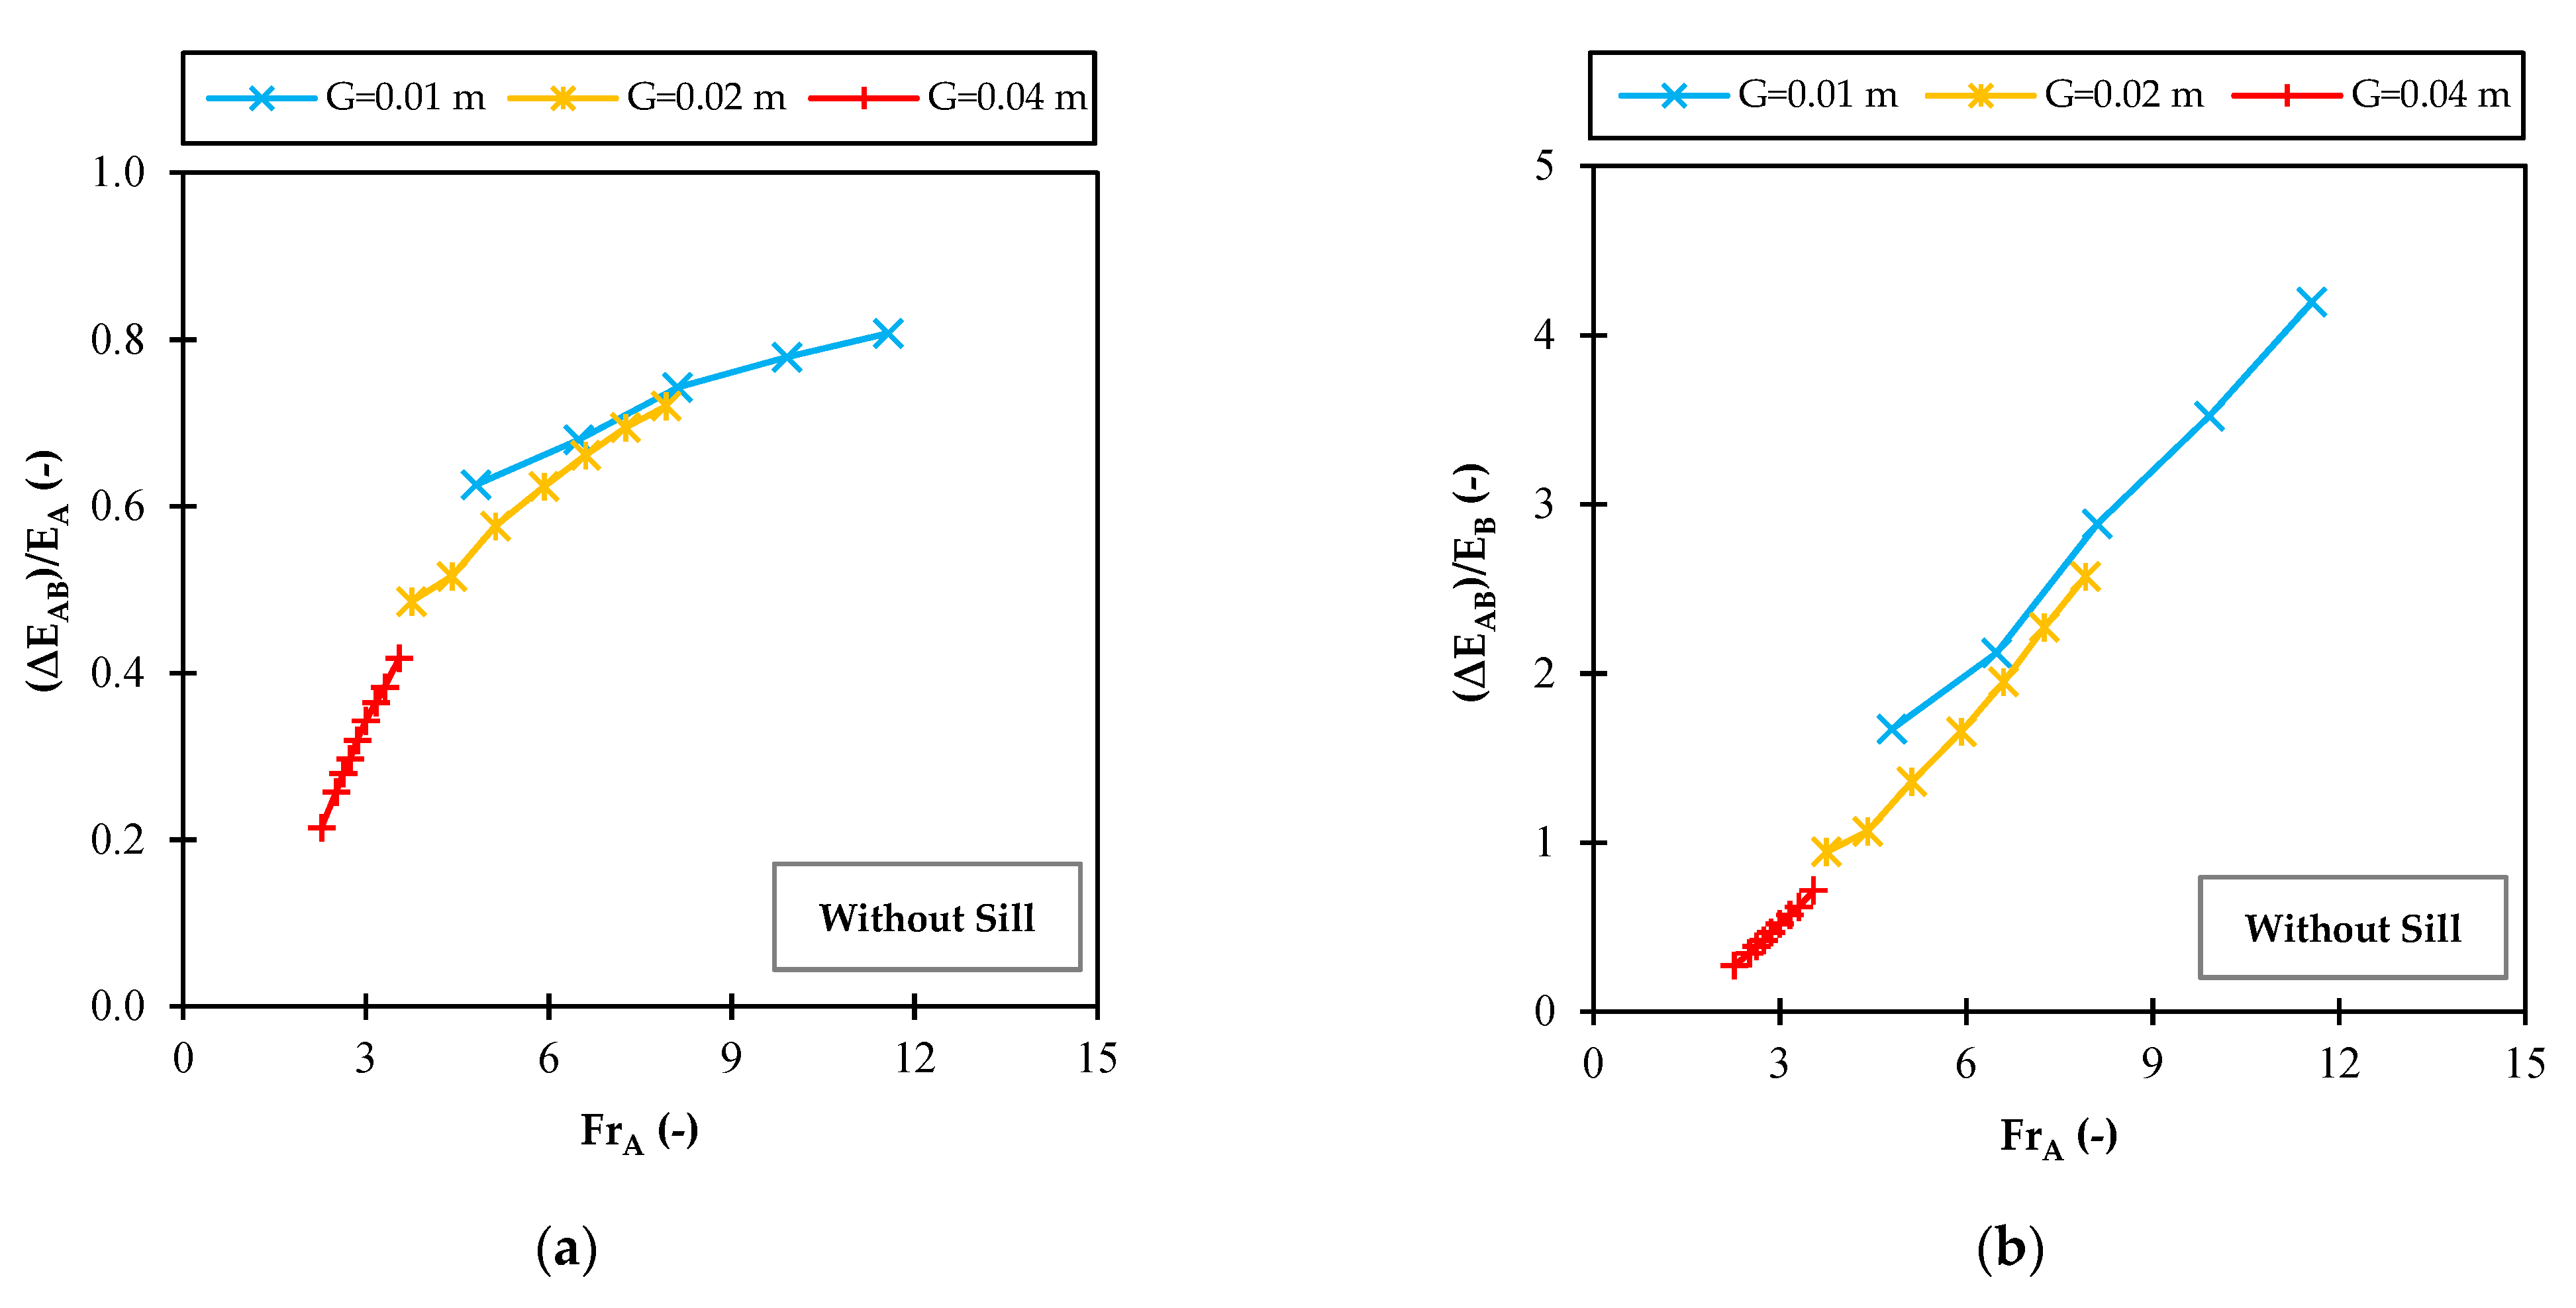
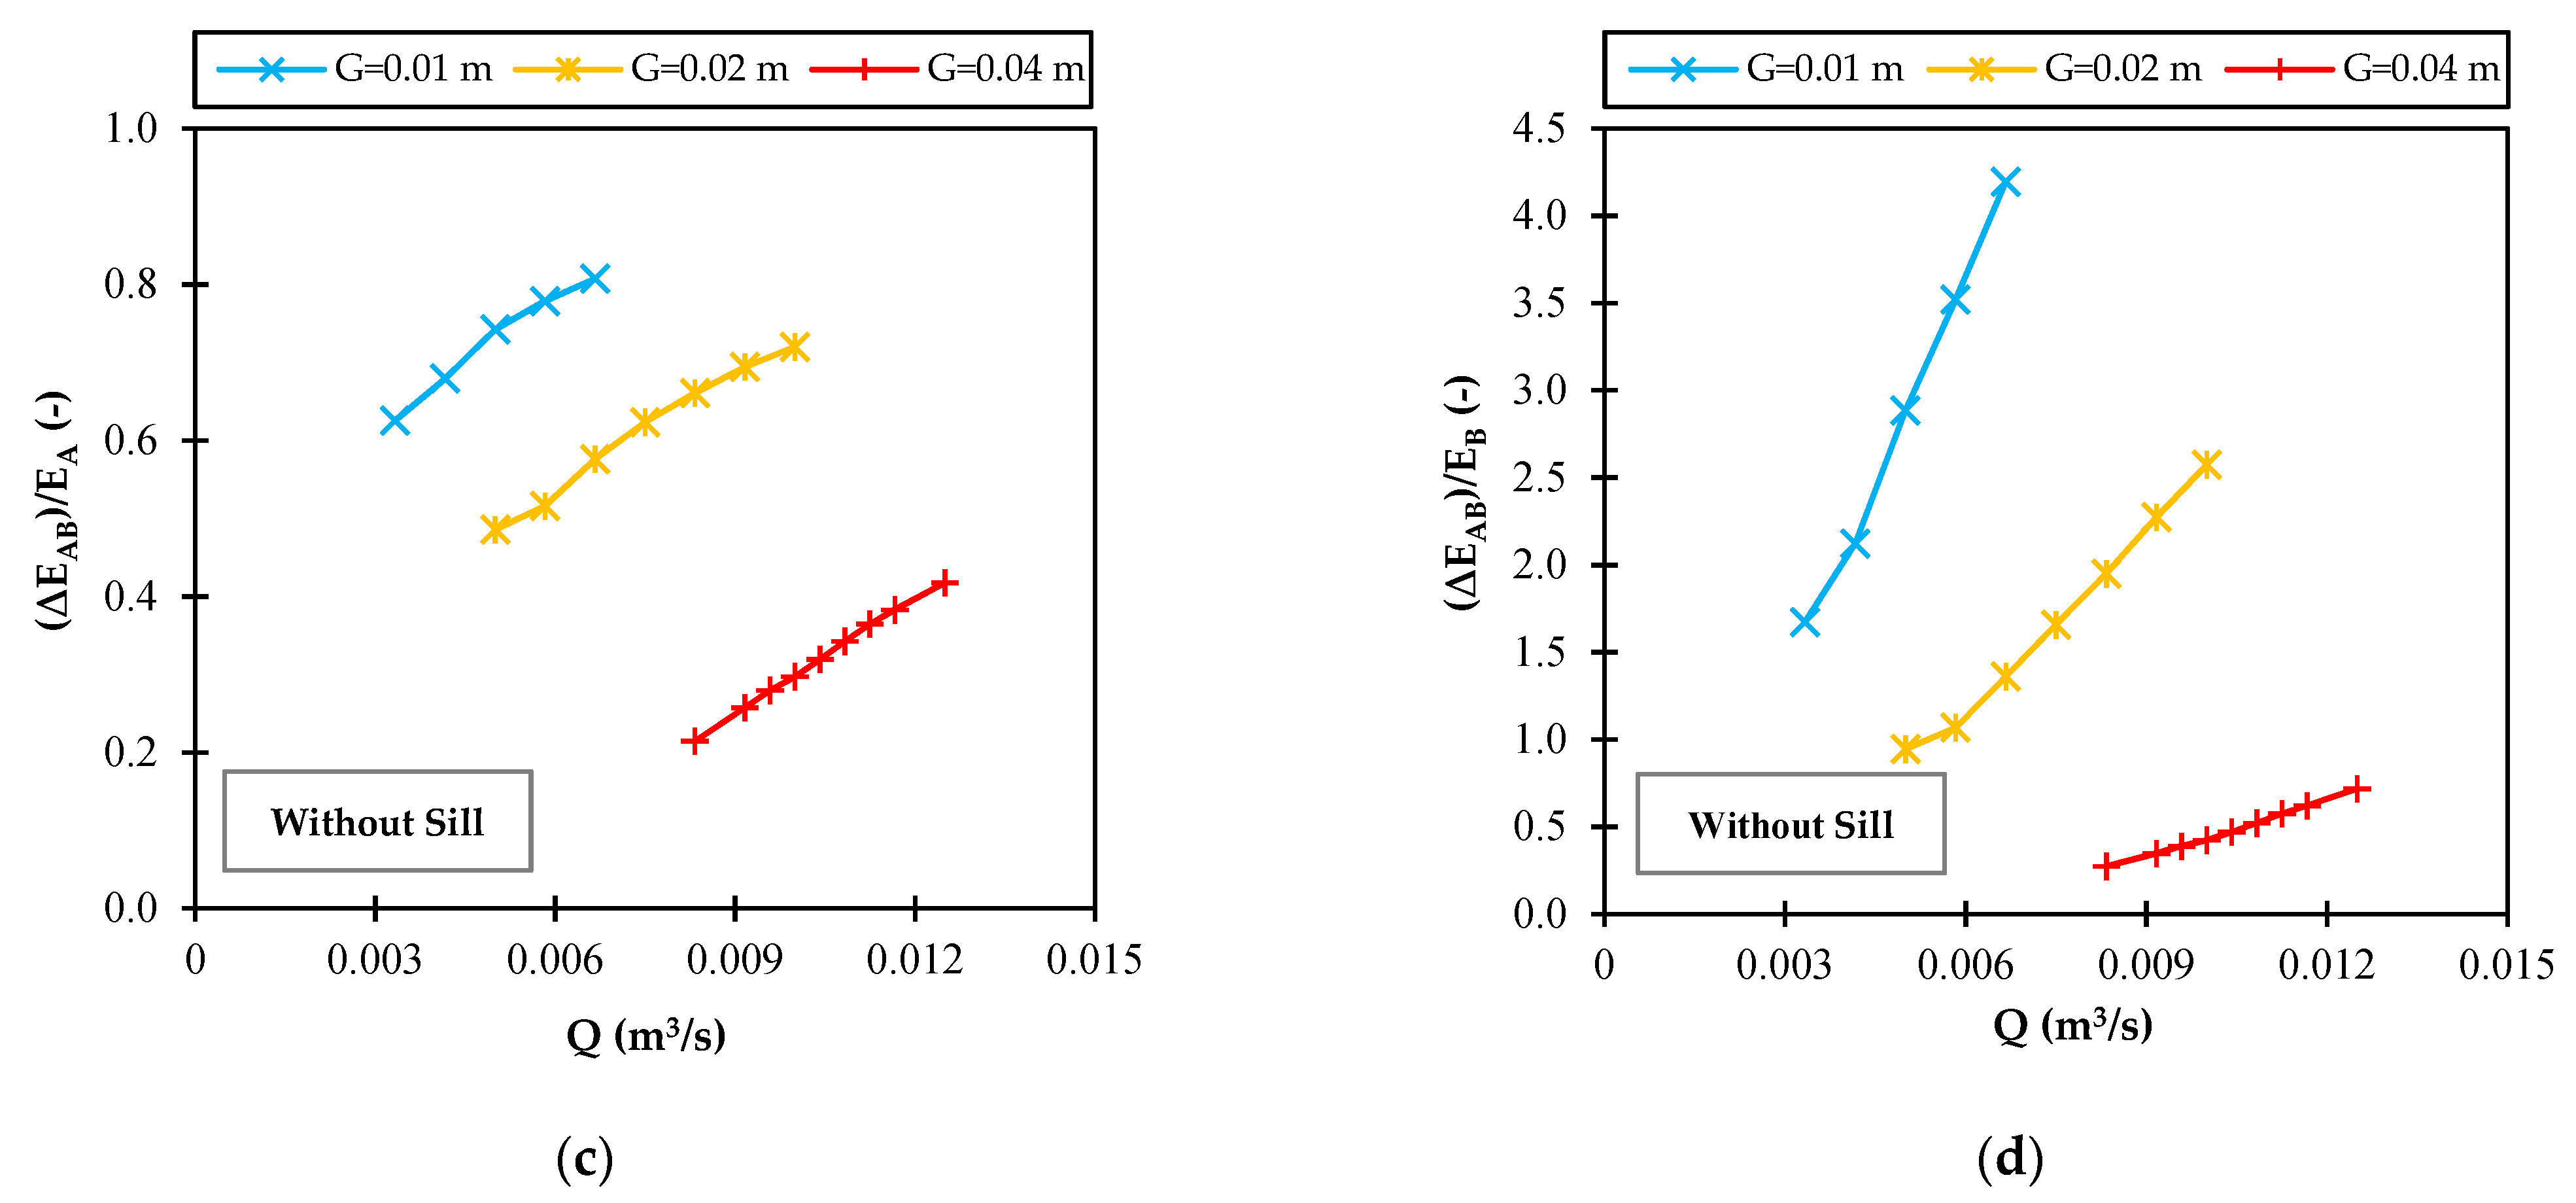
Based on the dimensional analysis, the experimental results were evaluated by two dimensionless parameters of the energy dissipation ratio to the upstream and downstream (∆EAB/EA and ∆EAB/EB). One of the properties of the flow that is very important for understanding the flow behavior is the Froude number. Figure 3a,b shows the rate of change of these parameters at different apertures, where the horizontal axis is the dimensionless parameter FrA and the vertical axis is the energy dissipation ratio between sections A and B to the flow-specific energy in sections A and B. According to Figure 3a,b, it can be observed that as the Froude number increases, the ratio of energy dissipation upstream and downstream of the hydraulic jump increases. The depth of the hydraulic jump increases due to the reduction of the gate opening compared to large gate openings at different discharges, resulting in increased energy dissipation. To illustrate the results and provide better agreement with the data, the energy dissipations at different discharges and openings are shown in Figure 3c,d, respectively. The relative energy dissipation is lowest when the aperture is 0.04 m; decreasing the gate opening rate increases the relative energy dissipation. As the opening rate increases, the velocity of the flow that passes under the gate decreases, and, as a result, the initial depth of the flow increases, which decreases the specific energy in section A. The increase in depth results in a decrease in the following depth compared to the smaller openings, resulting in a decrease in specific energy in section B as in section A. As can be seen in Figure 3c,d, the relative energy dissipation at a constant flow is greater for an orifice of 0.01 m than for the orifices of 0.02 and 0.04 m, respectively. Thus, the average ratio of energy dissipation to upstream energy is 15.93% and 56% higher for an orifice of 0.01 m than for orifices of 0.02 and 0.04 m, respectively. For the downstream opening, this value is 41.32% and 83.27%, respectively.
3.2. Cd without Sill
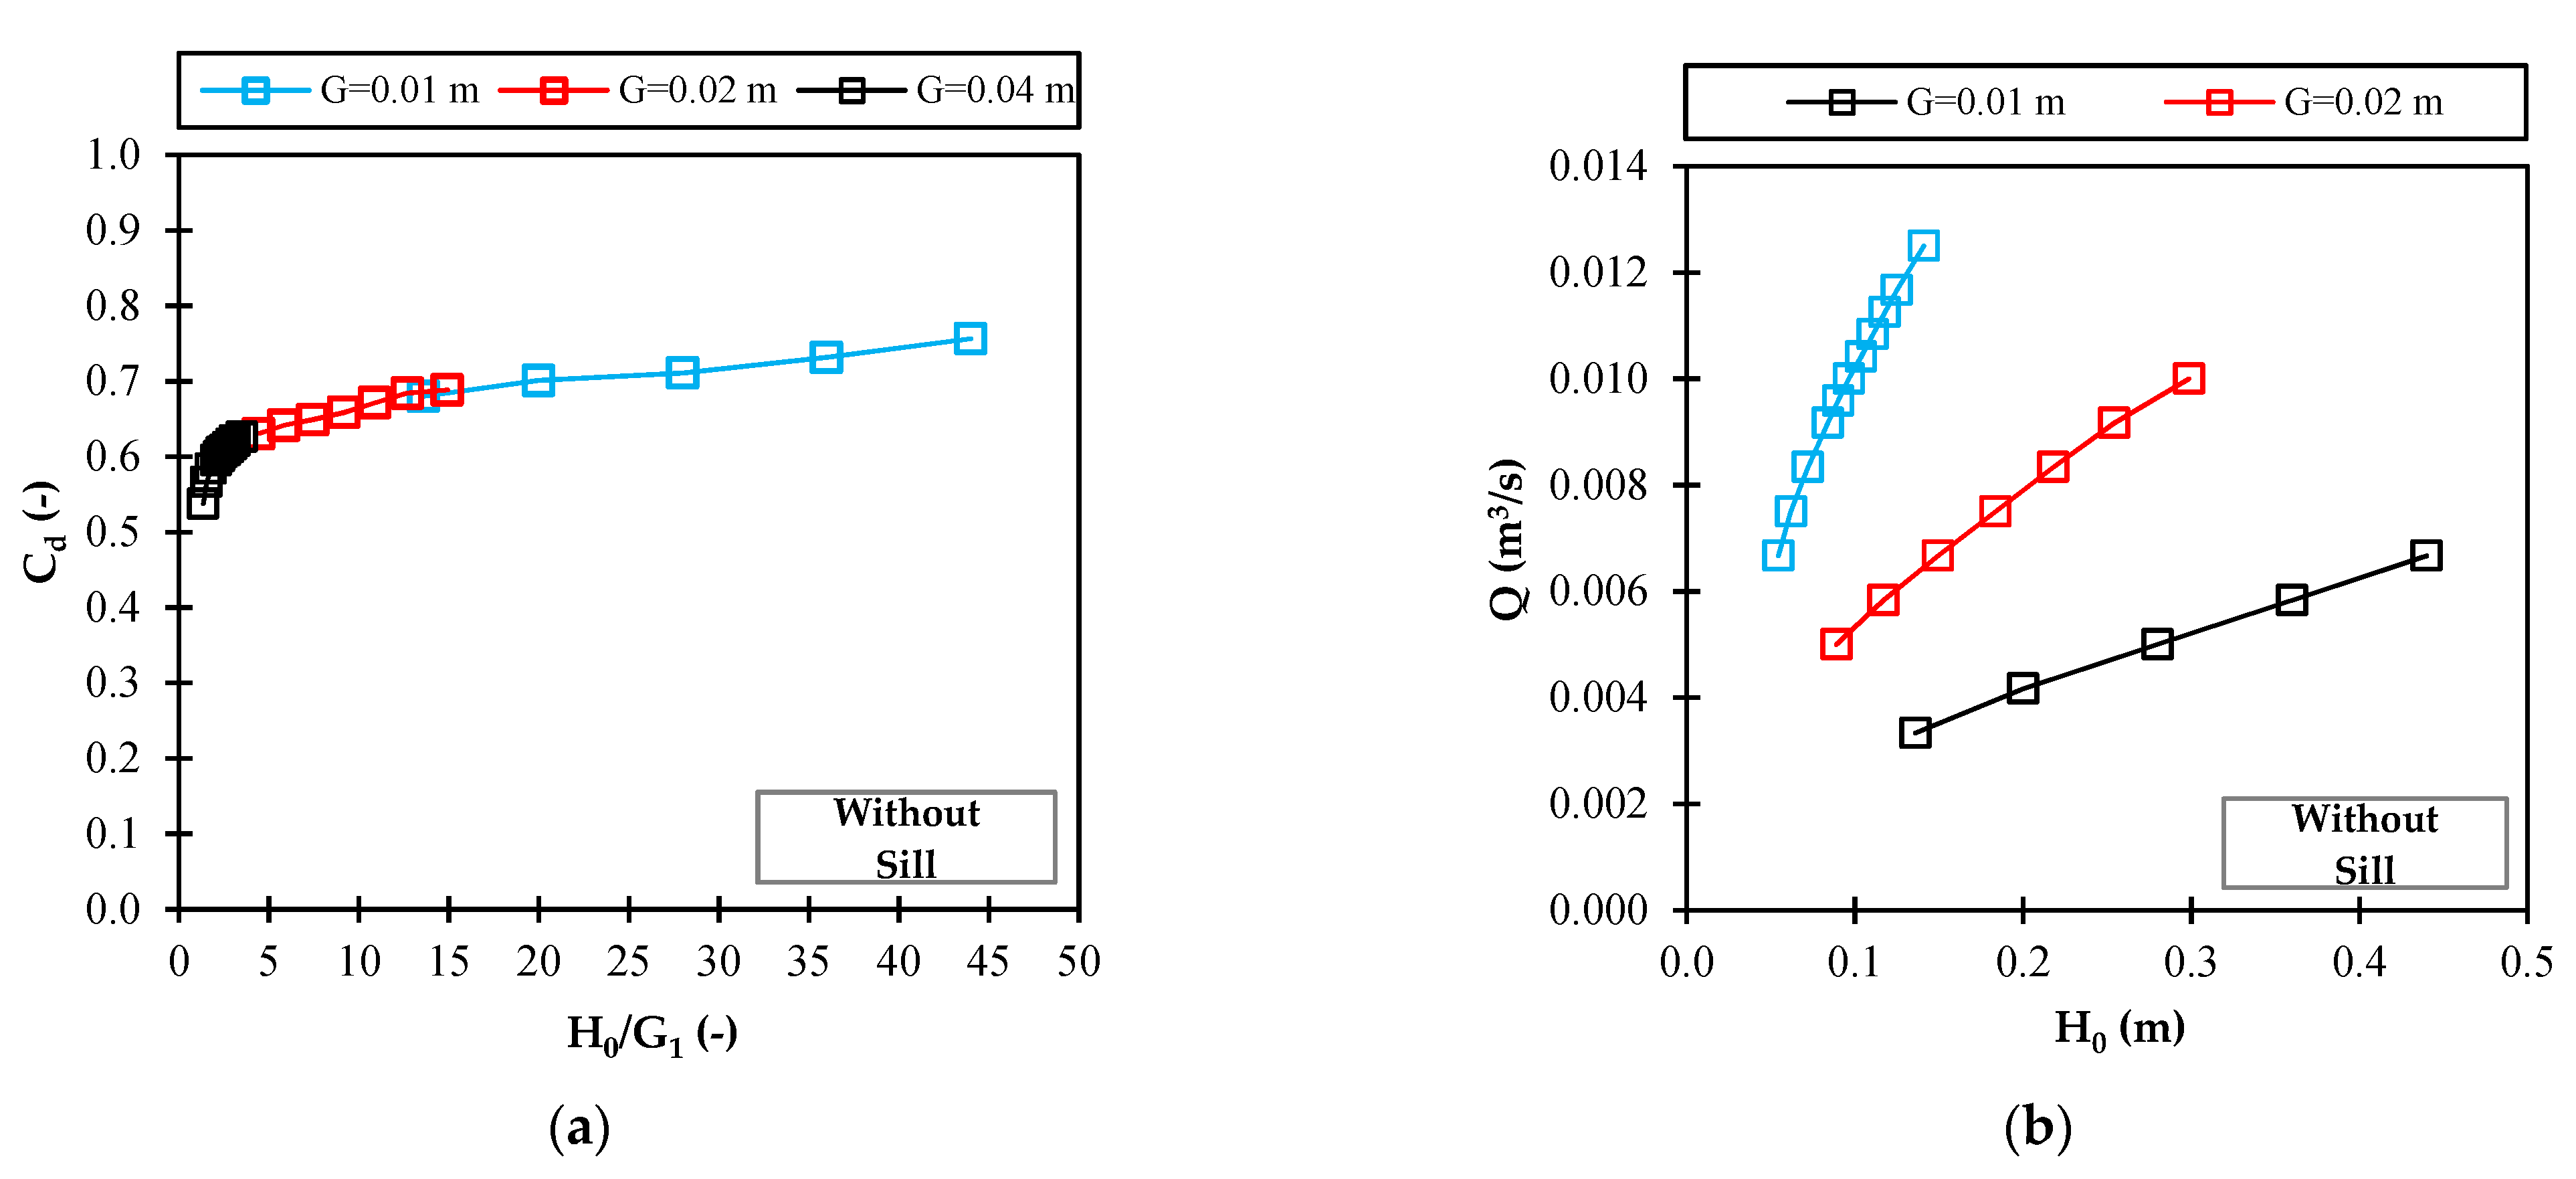
Figure 4a shows that the vertical sluice Cd increases as the ratio of upstream water depth to the sluice opening (H0/G1) is increased. Moreover, the Cd decreases as the gate opening increases. In other words, the Cd is inversely related to the opening rate. A parameter that affects the Cd is the upstream water depth. If the sluice gate opening increases, the upstream water depth upstream decreases, and this factor will reduce the Cd at larger openings. If you decrease the gate opening, the flow converges, and the area below the gate decreases, increasing the Cd. As shown in Figure 4a, the maximum Cd value for the specific (H0/G1) is at an opening of 0.01 m and the lowest value at 0.04 m. Figure 4b shows the diagram of stage discharges for the different sluice openings. For a given discharge, the size of the gate opening is inversely related to the upstream water depth and decreases as the opening increases. Here, the Cd for an opening of 0.01 m is, on average, higher than that for the 0.02 and 0.04 m openings, namely, 7.75% and 16.51%, respectively, and a maximum of 16.62% and 28.9%, respectively.
Table 1 shows the magnitude of the hydrodynamic force acting on the lock at the various discharges and openings. The magnitude of the hydrodynamic force is calculated using Equation (12). Due to the rectangular cross-section, this amount is calculated for one meter of width, shown in Table 1. From Table 1, the hydrodynamic force on the gate increases as the discharge rate increases. Furthermore, the hydrodynamic force on the gate is inversely proportional to the opening for the same Q rate. This is due to increased water depth upstream, increasing the pressure and force on the sluice gate. For example, for an outflow of 600 L/min at an opening of 0.02 m, the water depth upstream is about 0.30 m, while the same outflow at an opening of 0.04 m can provide a water depth of 0.096 m upstream of the gate. This means that 35.61 and 0.93 kg/m act on the gate, respectively.
3.3. Energy Dissipation of the Gate with Sill
Correction factors for kinetic energy were calculated. Table 2 shows the α-values in sections A and B. In addition, the values of specific energy in sections A and B are given in Table 3, with and without considering α.
As you can see, the relative percentage error is small; therefore, α can be ignored. For channels with regular and straight cross-sections, the effect of the non-uniform velocity distribution on the composite velocity super elevation and momentum is small, especially compared to other uncertainties involved in the calculation. Therefore, the coefficients for energy and momentum are often assumed to be unity [20]. The value of α is higher in a laminar flow than in a turbulent one. This is due to the more uniform velocity distribution in a turbulent flow. In a turbulent flow in a regular cross-section channel, α rarely exceeds 1.15 (average). Since there is little information on these coefficients, α is assumed to be one when analyzing practical problems in regular cross-section channels. The values of α for typical channel sections [20,21,22] are given in Table 4. For turbulent flow in a straight duct with rectangular, trapezoidal, or circular cross-sections, α is usually less than 1.15 [23]. Therefore, it cannot be included in the calculations because its value is unknown and almost equal to one [24].
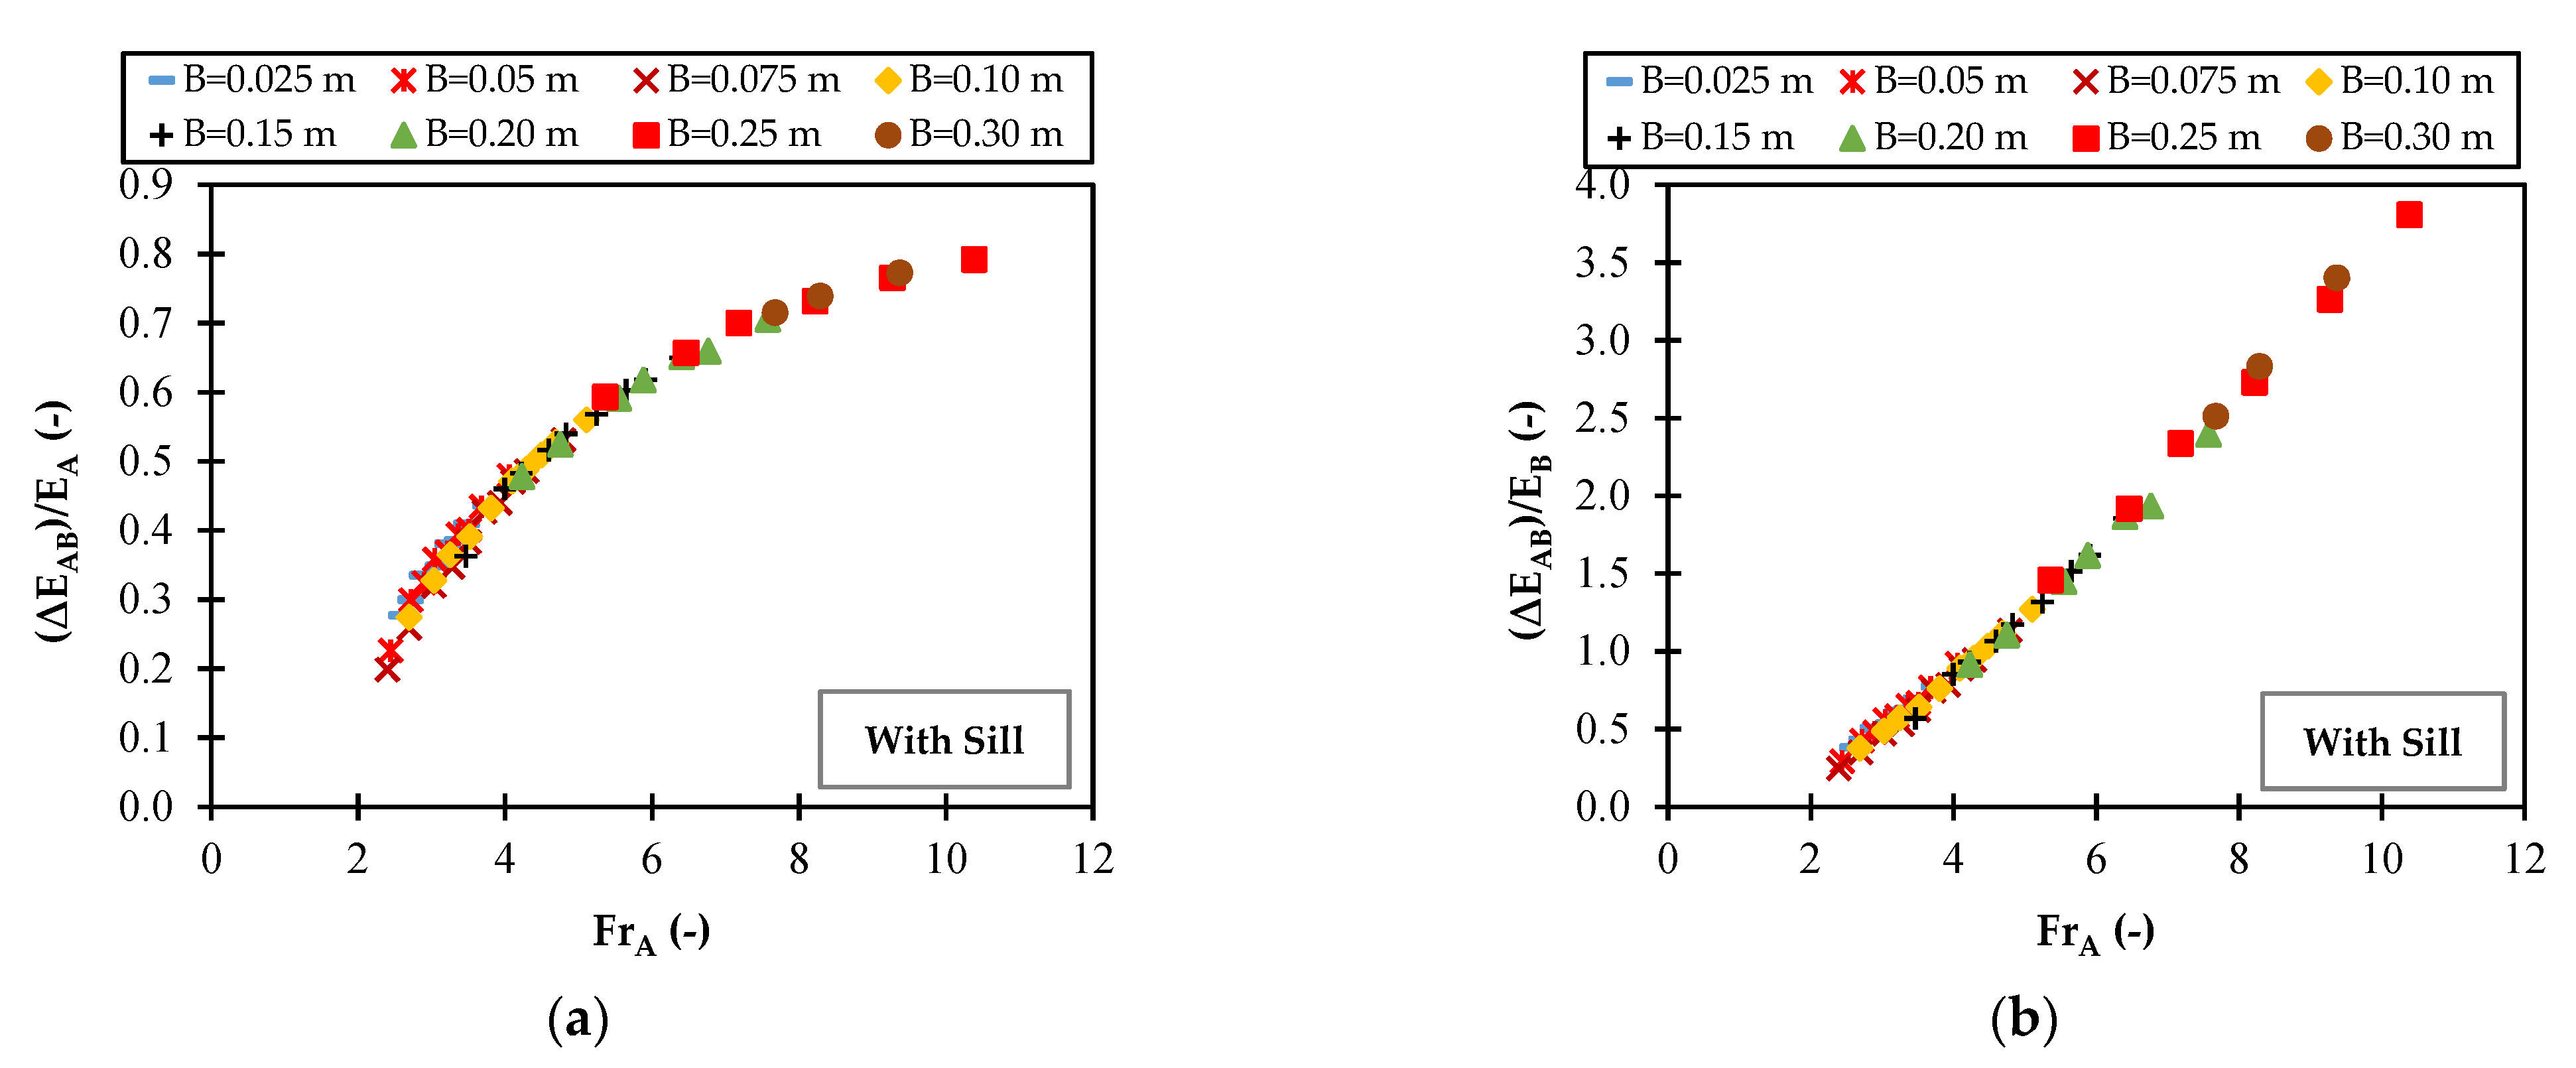
Figure 5a,b shows the relationship between the energy loss using a suppressed and an unsuppressed sill below the lock gate with the Froude number of Section A. Figure 5a,b shows that the relative energy dissipation increases with increasing Froude numbers with some tendency and a high correlation coefficient.
Table 5 gives the sample’s experimental discharges and the corresponding relative energy losses. At constant discharge, the energy decrease in the free classical hydraulic jump without the sill state is, in all cases, less than that of the hydraulic jump due to the use of the sill. In other words, the energy dissipation from a sill under the sluice gate is greater than without a sill. The reason is the change in the flow characteristics in the initial depth, the following depth, and the turbulent flows due to the use of the sill. In the case of a free classical hydraulic jump without a sill state, the energy loss is only due to the hydraulic jump.
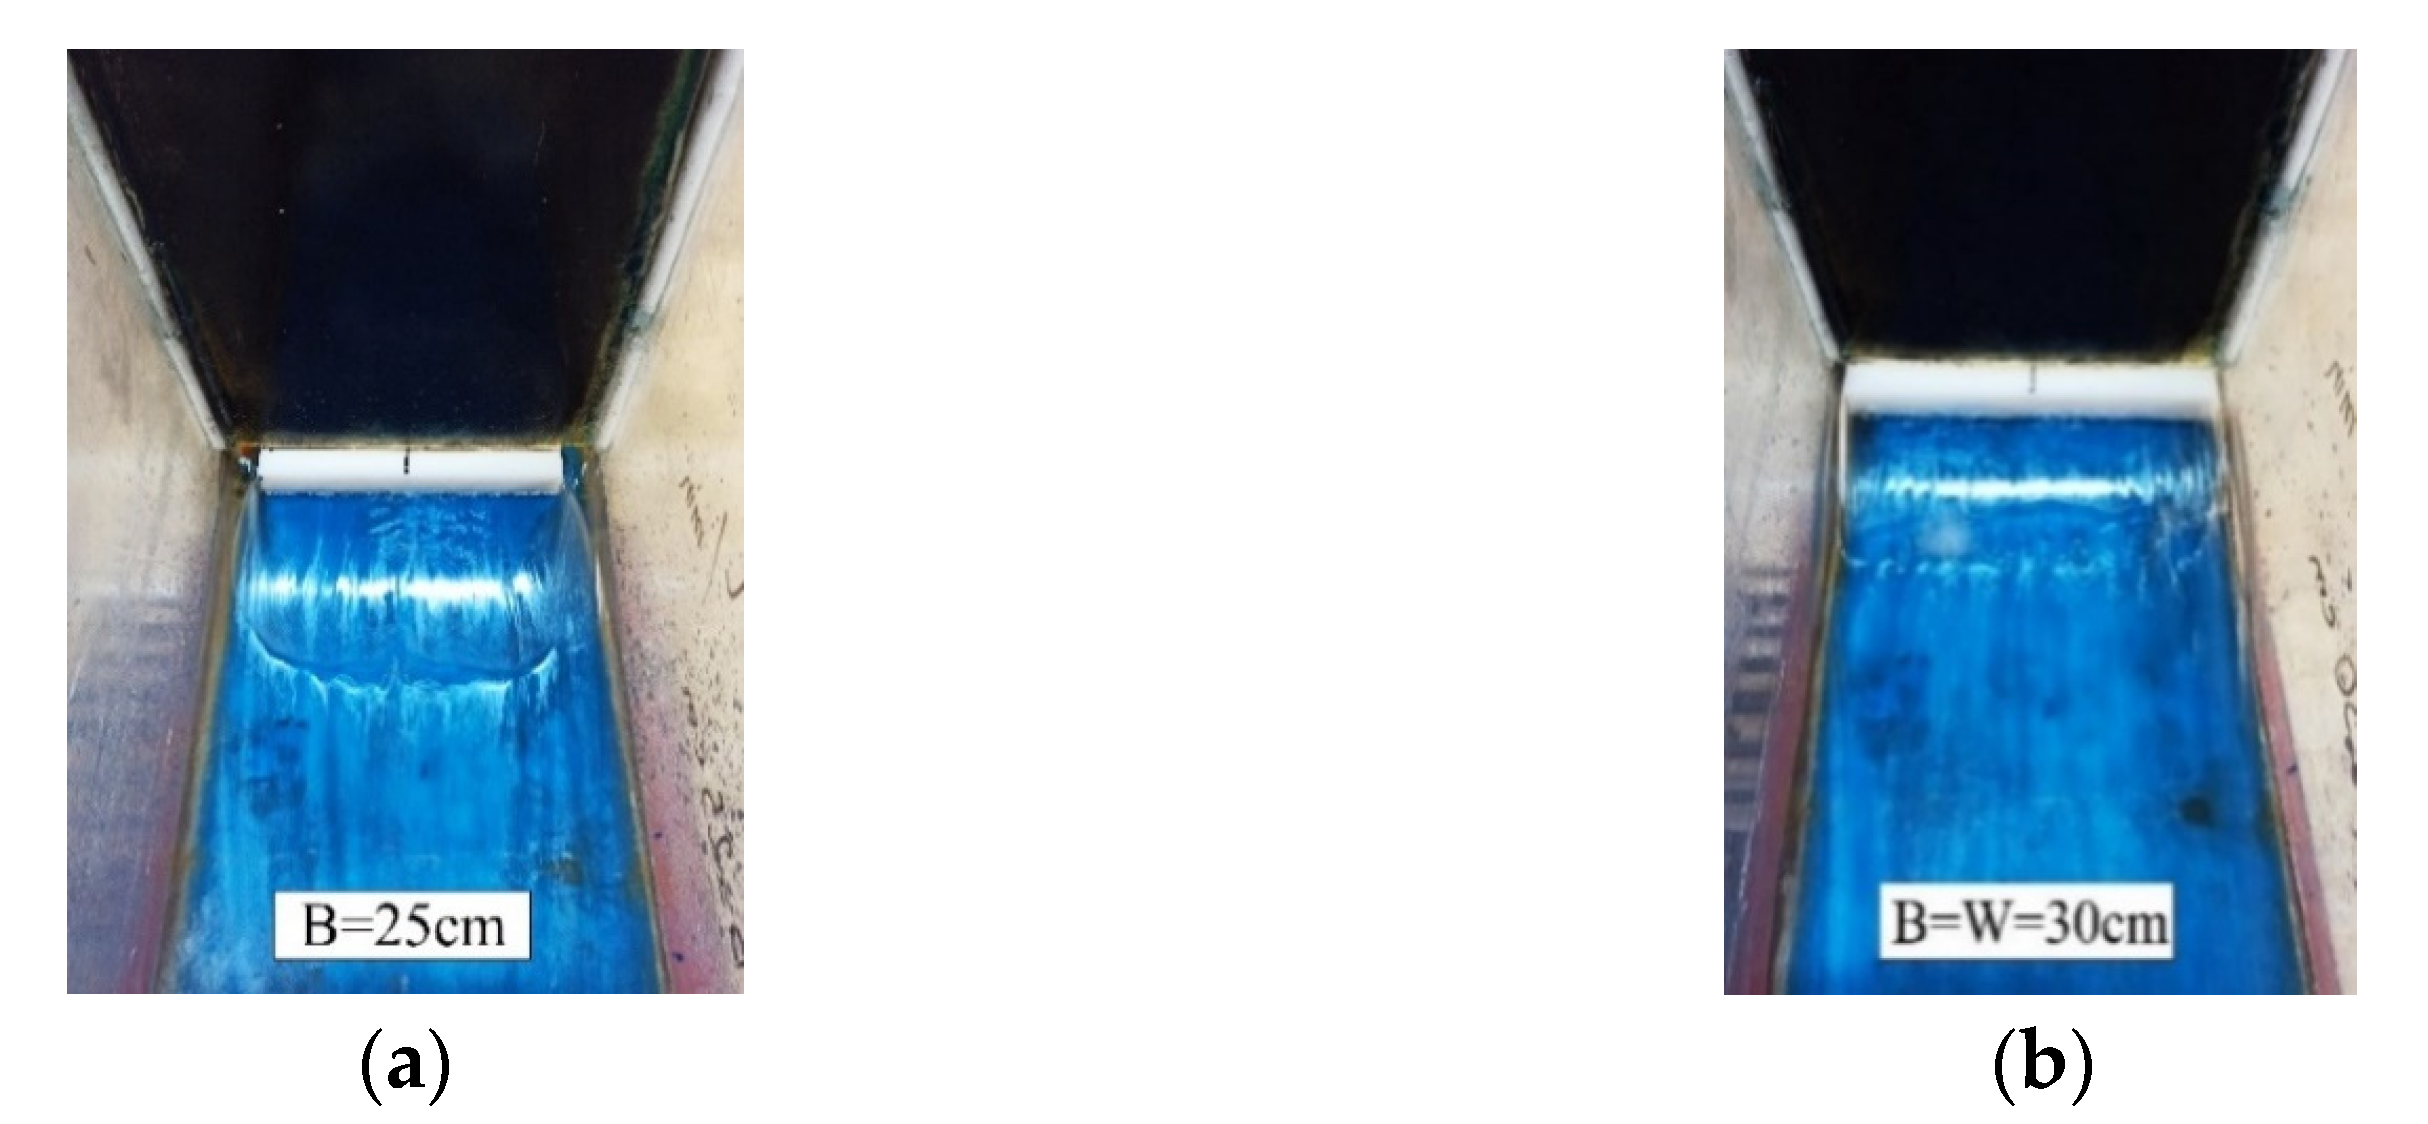
Separating the data for each sill with different discharge rates makes the relative energy dissipation for those with different widths visible. As the sill width increases, relative energy dissipation increases compared to the smaller width sill. In addition, the maximum relative energy dissipation for the same discharge is associated with the sill with a larger width. Therefore, if you increase the width of the sill and consequently decrease the opening of the gate and the total area of the flow passing through it, the flow becomes more directly under the gate, and flow separation occurs. In this mode, a jet of flow passes over the sill, and the wet perimeter of the sill downstream of the gate reaches its minimum. Moreover, by increasing the width of the sill, the initial depth is decreased, and the subsequent depth is increased, which is important for increasing energy dissipation. Figure 6 shows the images related to the jet’s formation and the flow’s release above the sill.
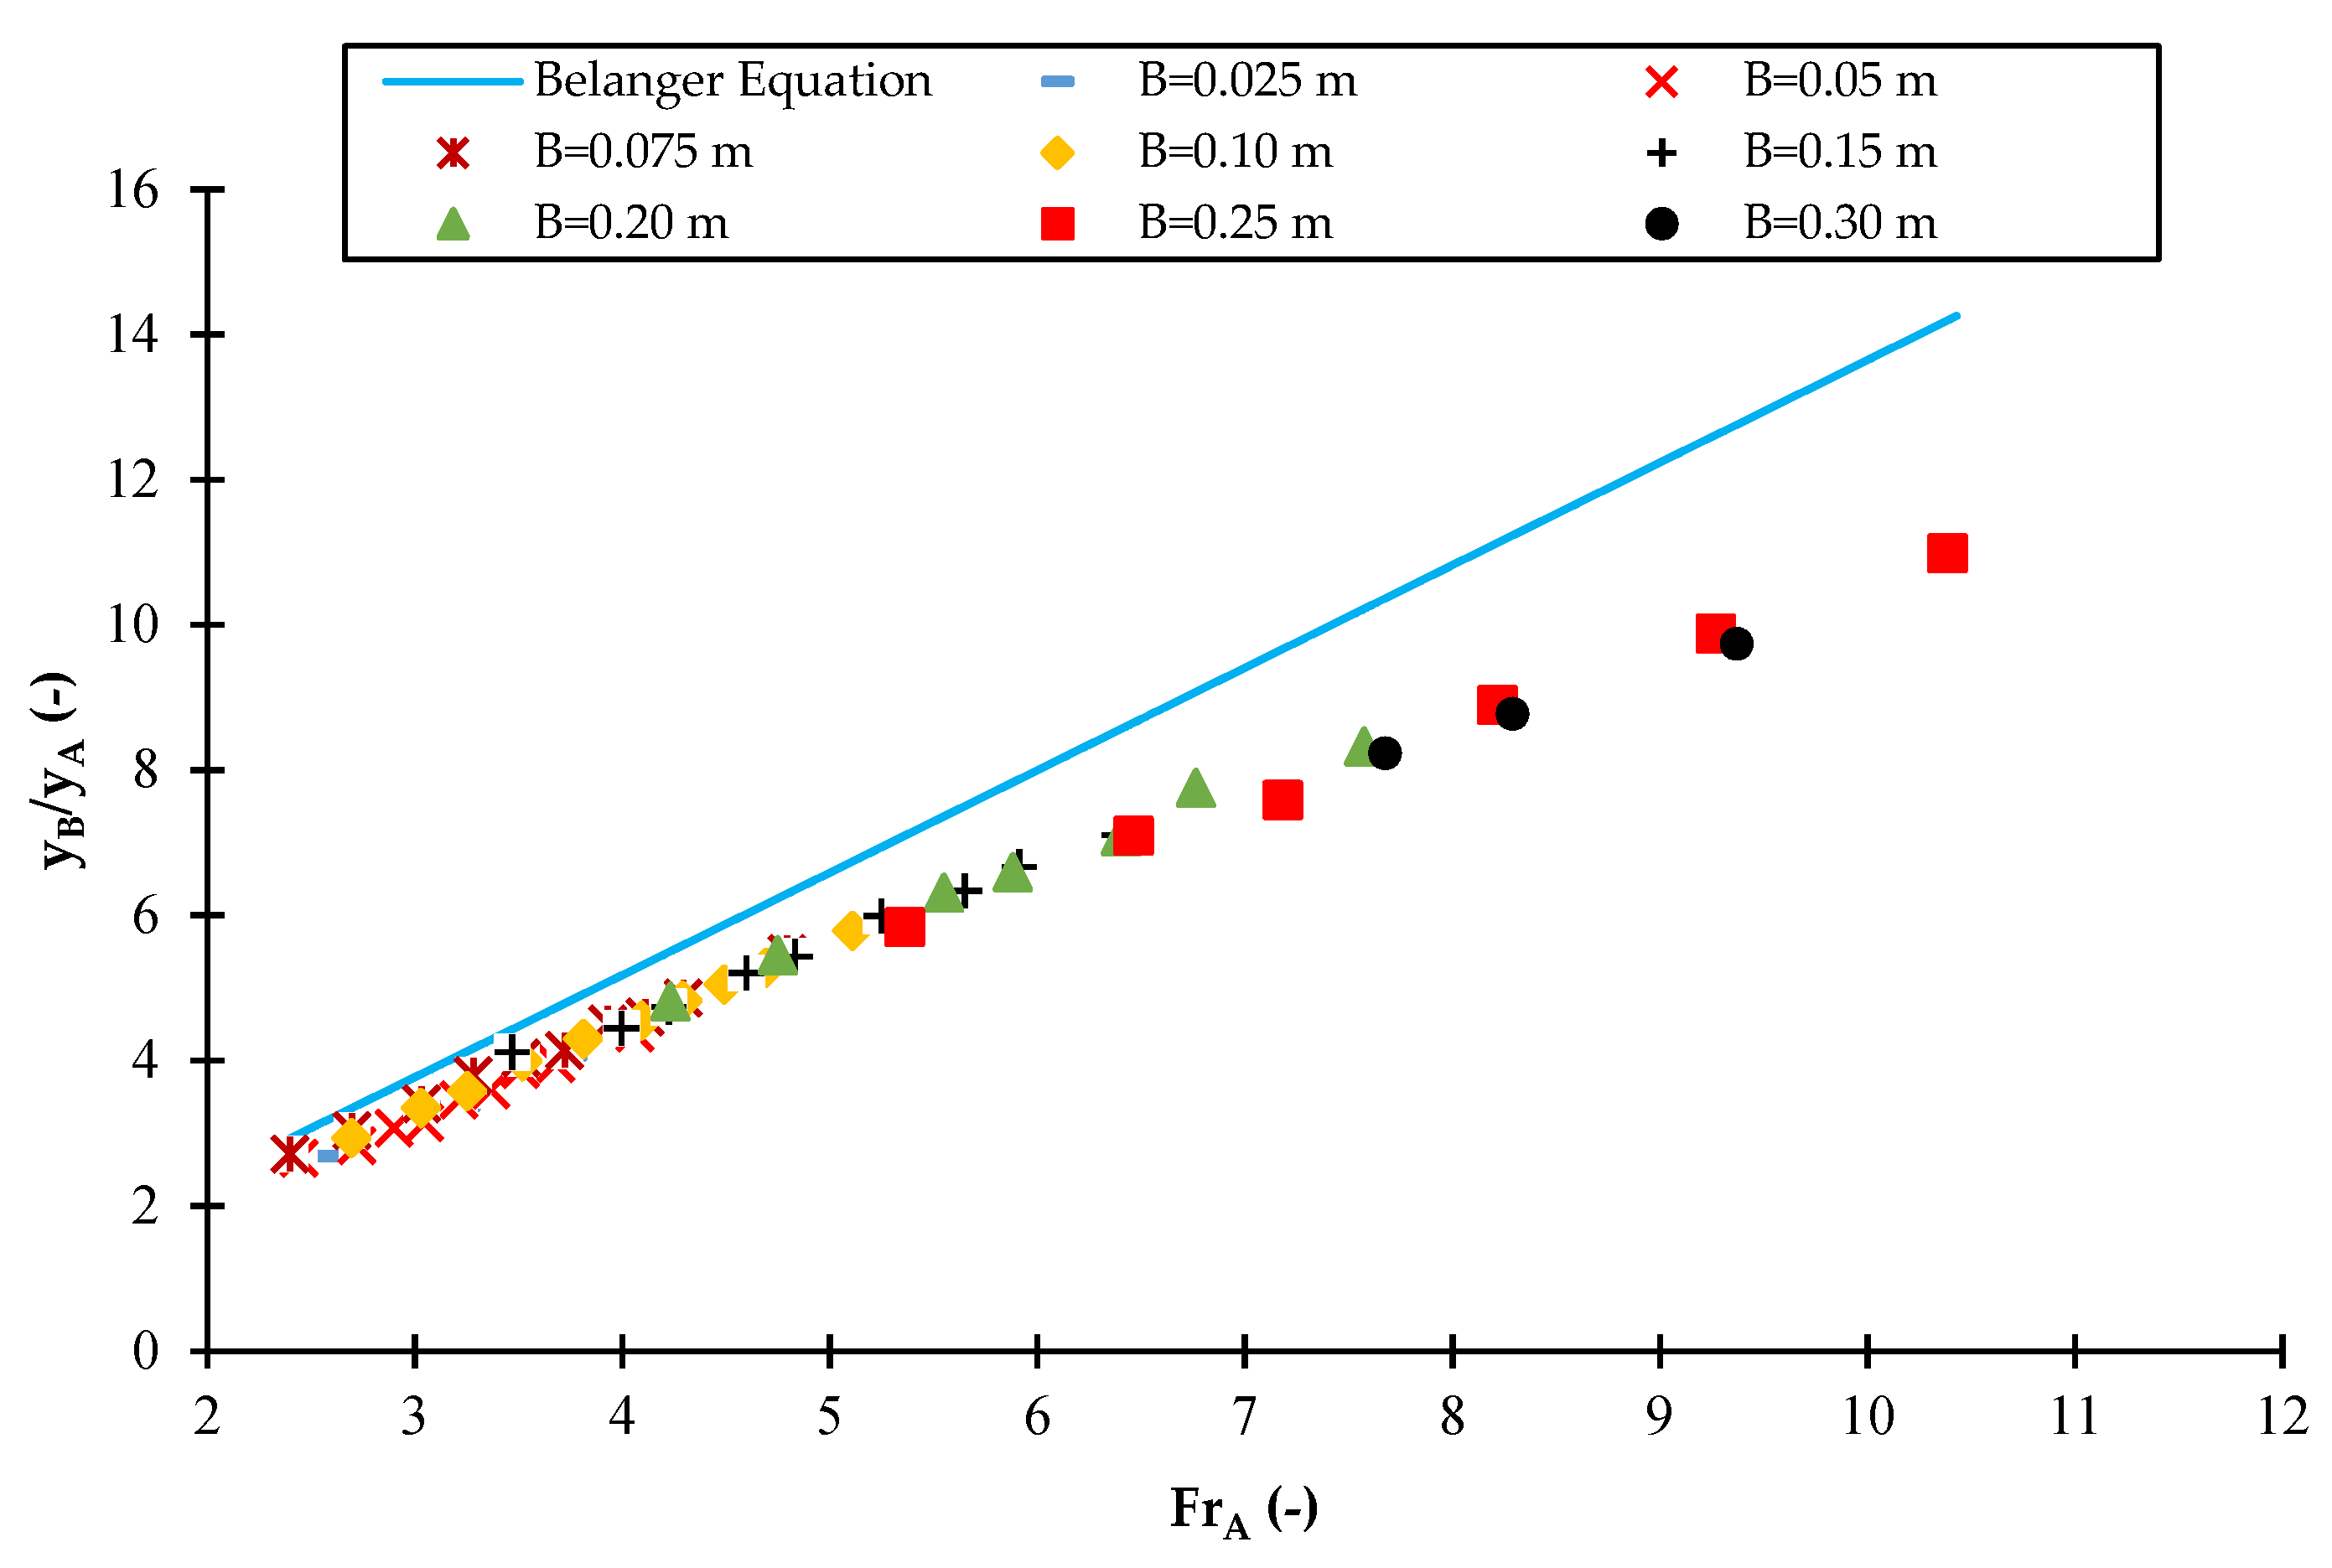
The relative depth of the hydraulic jump (yB/yA) is a function of FrA. To study the effect of the sill below the gate on the subsequent flow depth, the plot of the relative depth of the hydraulic jump is shown in Figure 7. It can be observed that as the Froude number increases, the relative depth of the hydraulic jump linearly increases. The reason for this is the significant effect of the sill on increasing the sequent depth significantly on the jump depth increase. As the sill width increases, the jump depth is greater for the same discharge than for a sill with a smaller width.
Both the magnitude and intensity of the hydraulic jump depend on the Froude number at the hydraulic jump in section A. As the FrA increases, the ratio between the following depth and the initial depth (yB/yA), i.e., the wave height (yB-yA), increases. The direct relationship of the energy output to the third power of the expression (yB-yA) causes the amount of energy output to be very sensitive to the intensity and strength of the jump. A comparison between the present results and those of [25] shows that applying the sill leads to a decrease in the following depth (Figure 7).
3.4. Cd with Sill
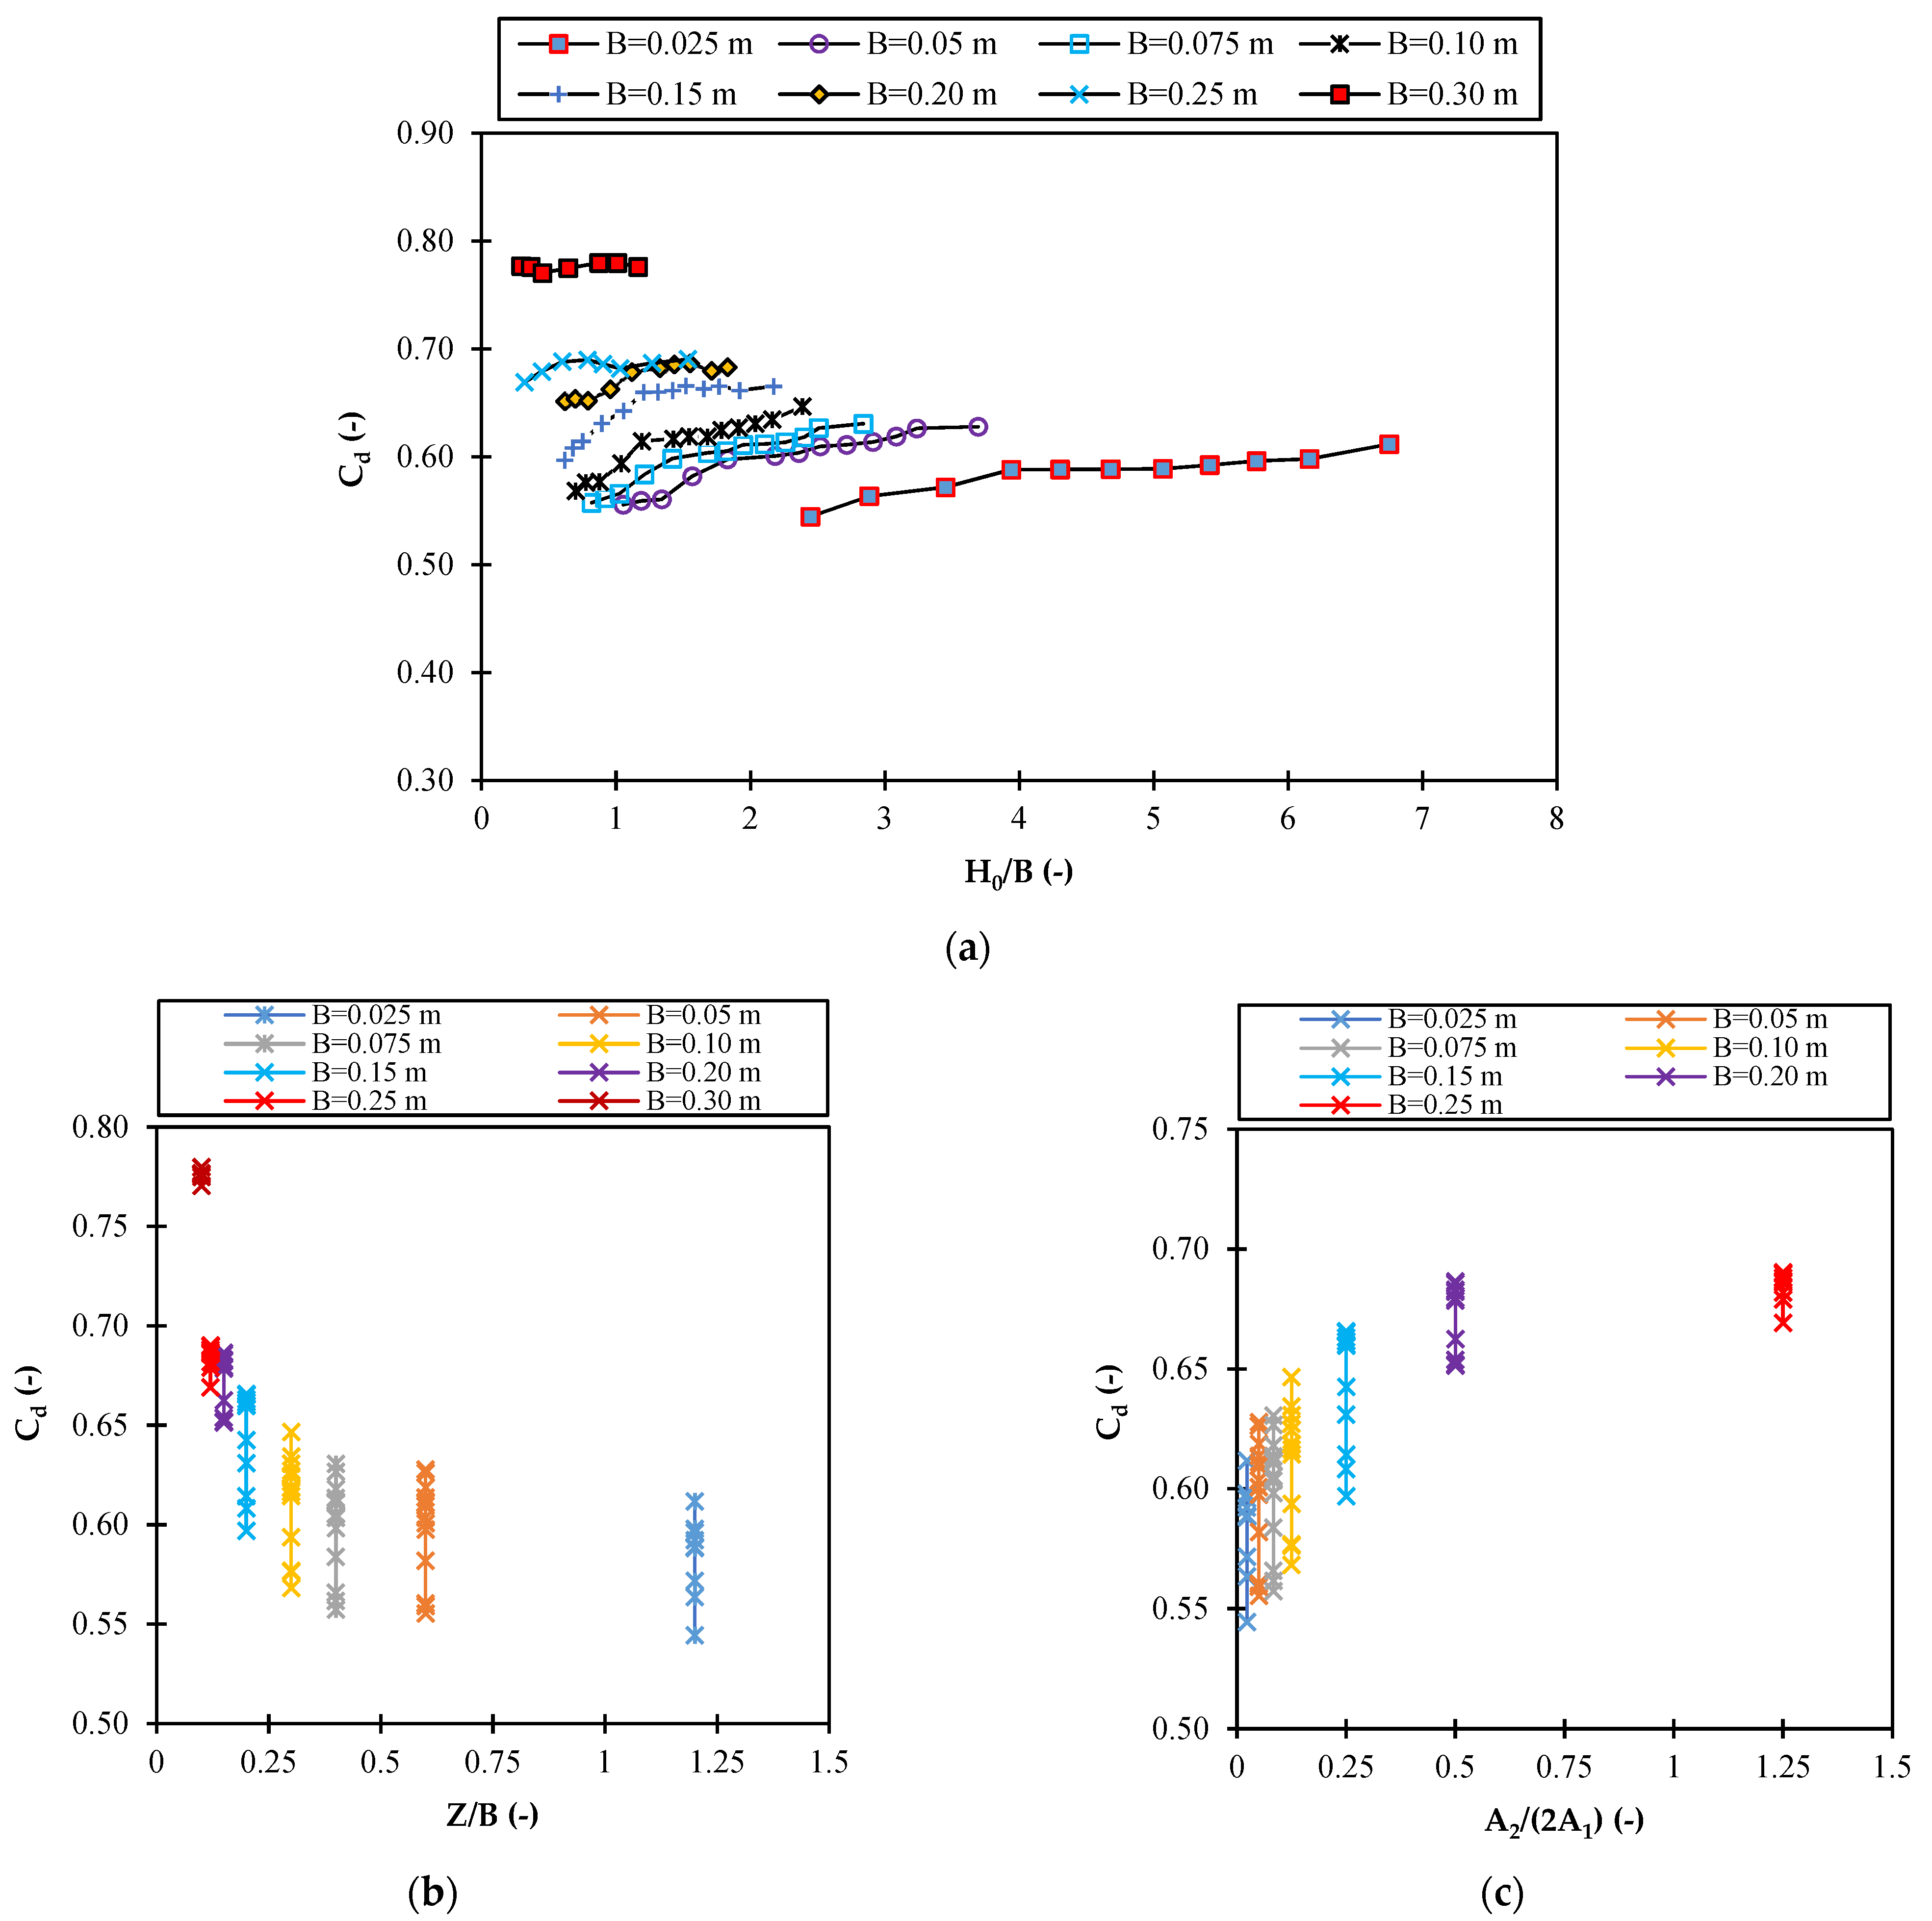
In Figure 8a, the Cd decreases with a decrease in the sill width. Thus, the sill with the smallest width has the smallest Cd. The reason for increasing the Cd is related to the even flow distribution across the gate. When the width of the sill below the gate increases, the sill acts as a barrier; downstream of the sill, the water above the sill is discharged all at once and uniformly. The return flow decreases to a minimum as the width increases, which increases the Cd. In addition, the Cd tends to increase as the ratio between the upstream depth and the width of the sill increases.
The rate of increase of the runoff coefficient decreases with increasing depth when the rate of the runoff coefficient is not affected by the increase in depth. Figure 8b shows the plot of the runoff coefficient as a function of Z/B. According to Figure 8b, the Cd increases with increasing runoff when the sill height is kept constant in all models and the sill width increases. Figure 8c shows the effect of the opening and the flow area under the gate. It is observed that by increasing the ratio of the flow area above the sill to the flow area on both sides of the sill, the Cd increases. Increasing the sill width, the A on both sides of the sill decreases, and, therefore, at the sill with a larger width, the Atotal will be less than at the sill with a smaller width, which leads to an increase in Cd. A sill with a lower size below the gate increases the Cd compared to the mode without a sill. This increase is due to the reduction of the total area underneath the gate.
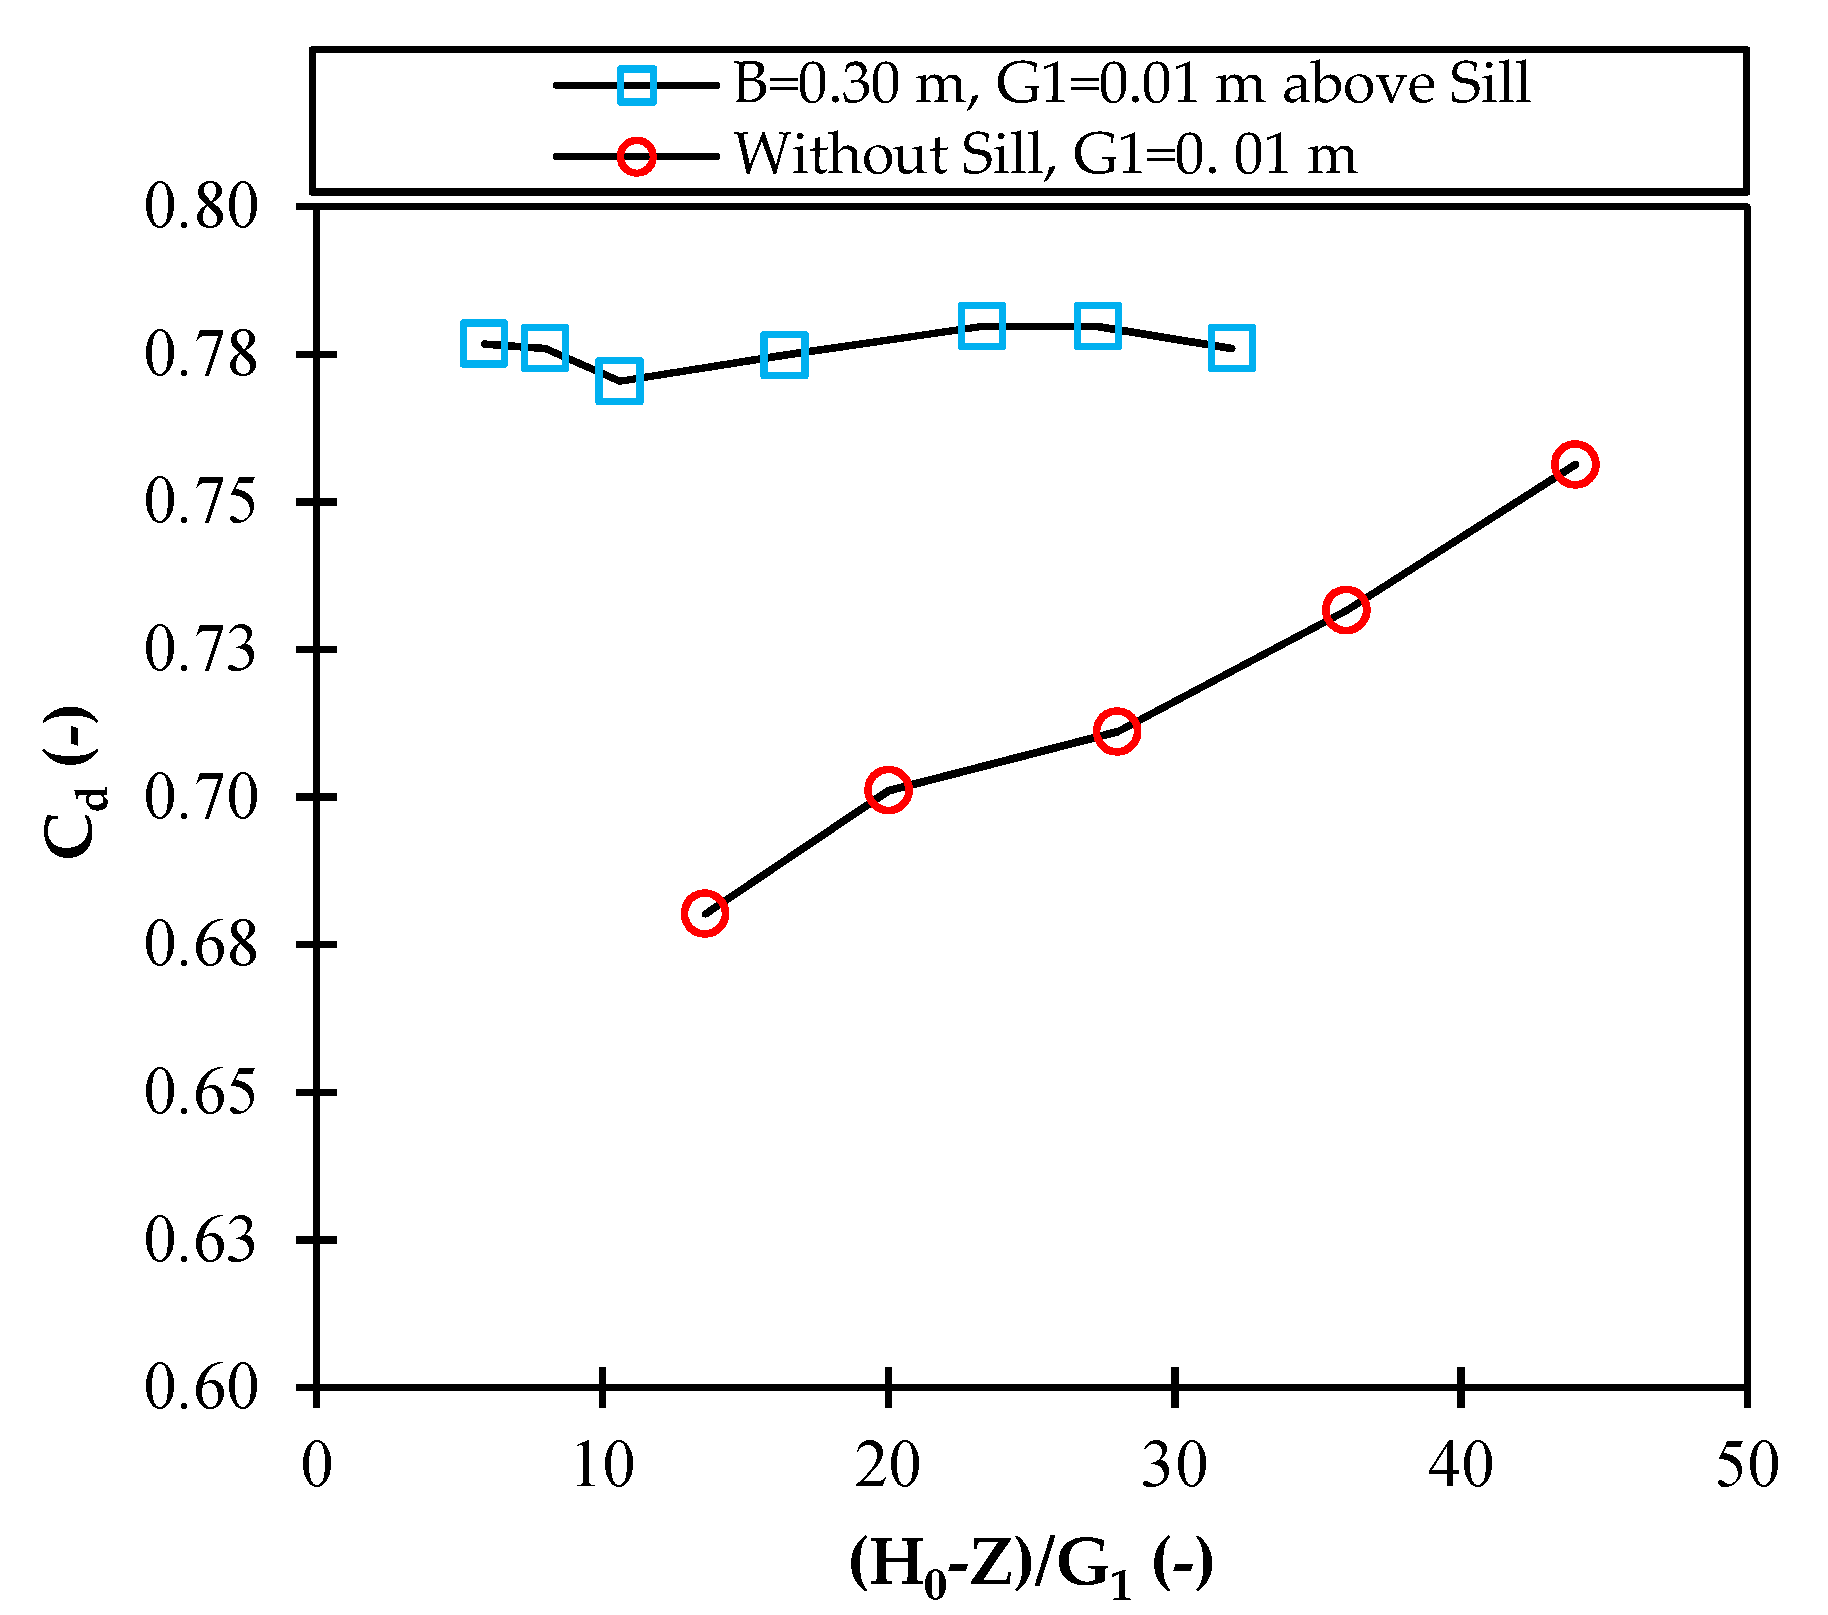
In Figure 9, the Cd was plotted against the H0-Z/G1 to find the best fit and compare the data. A comparison was made between the Cd without a sill and suppressed sills with the same opening (Figure 9). Figure 9 shows that a sill below the sluice gate increases the flow rate and improves the system performance compared to the without sill situation. At constant discharge, the upstream depth with a sill is less than without a sill. The presence of a sill that is the same width as the channel increases the discharge (at an opening of 0.01 m) by an average of 7.75%.
Table 6 lists some of the experimental observations with the corresponding Cd for the sample. For similar discharges, the Cd for the unsuppressed sill is higher than the no-sill condition, and this trend increases with increasing sill width. Therefore, unsuppressed sills can be considered and used because they increase flow efficiency and prevent sediment accumulation behind the gate.
This study established equations to predict the relative energy dissipation and Cd of the gate with and without sill conditions. First, the non-linear form of the proposed equations for relative energy dissipation as a function of the dimensionless parameters was determined. The proposed equations’ general forms were considered Equation (18).
Using Solver in Excel and the regression technique, the equations were presented to obtain an appropriate form with the least error and a high correlation coefficient according to Equations (19) and (20):
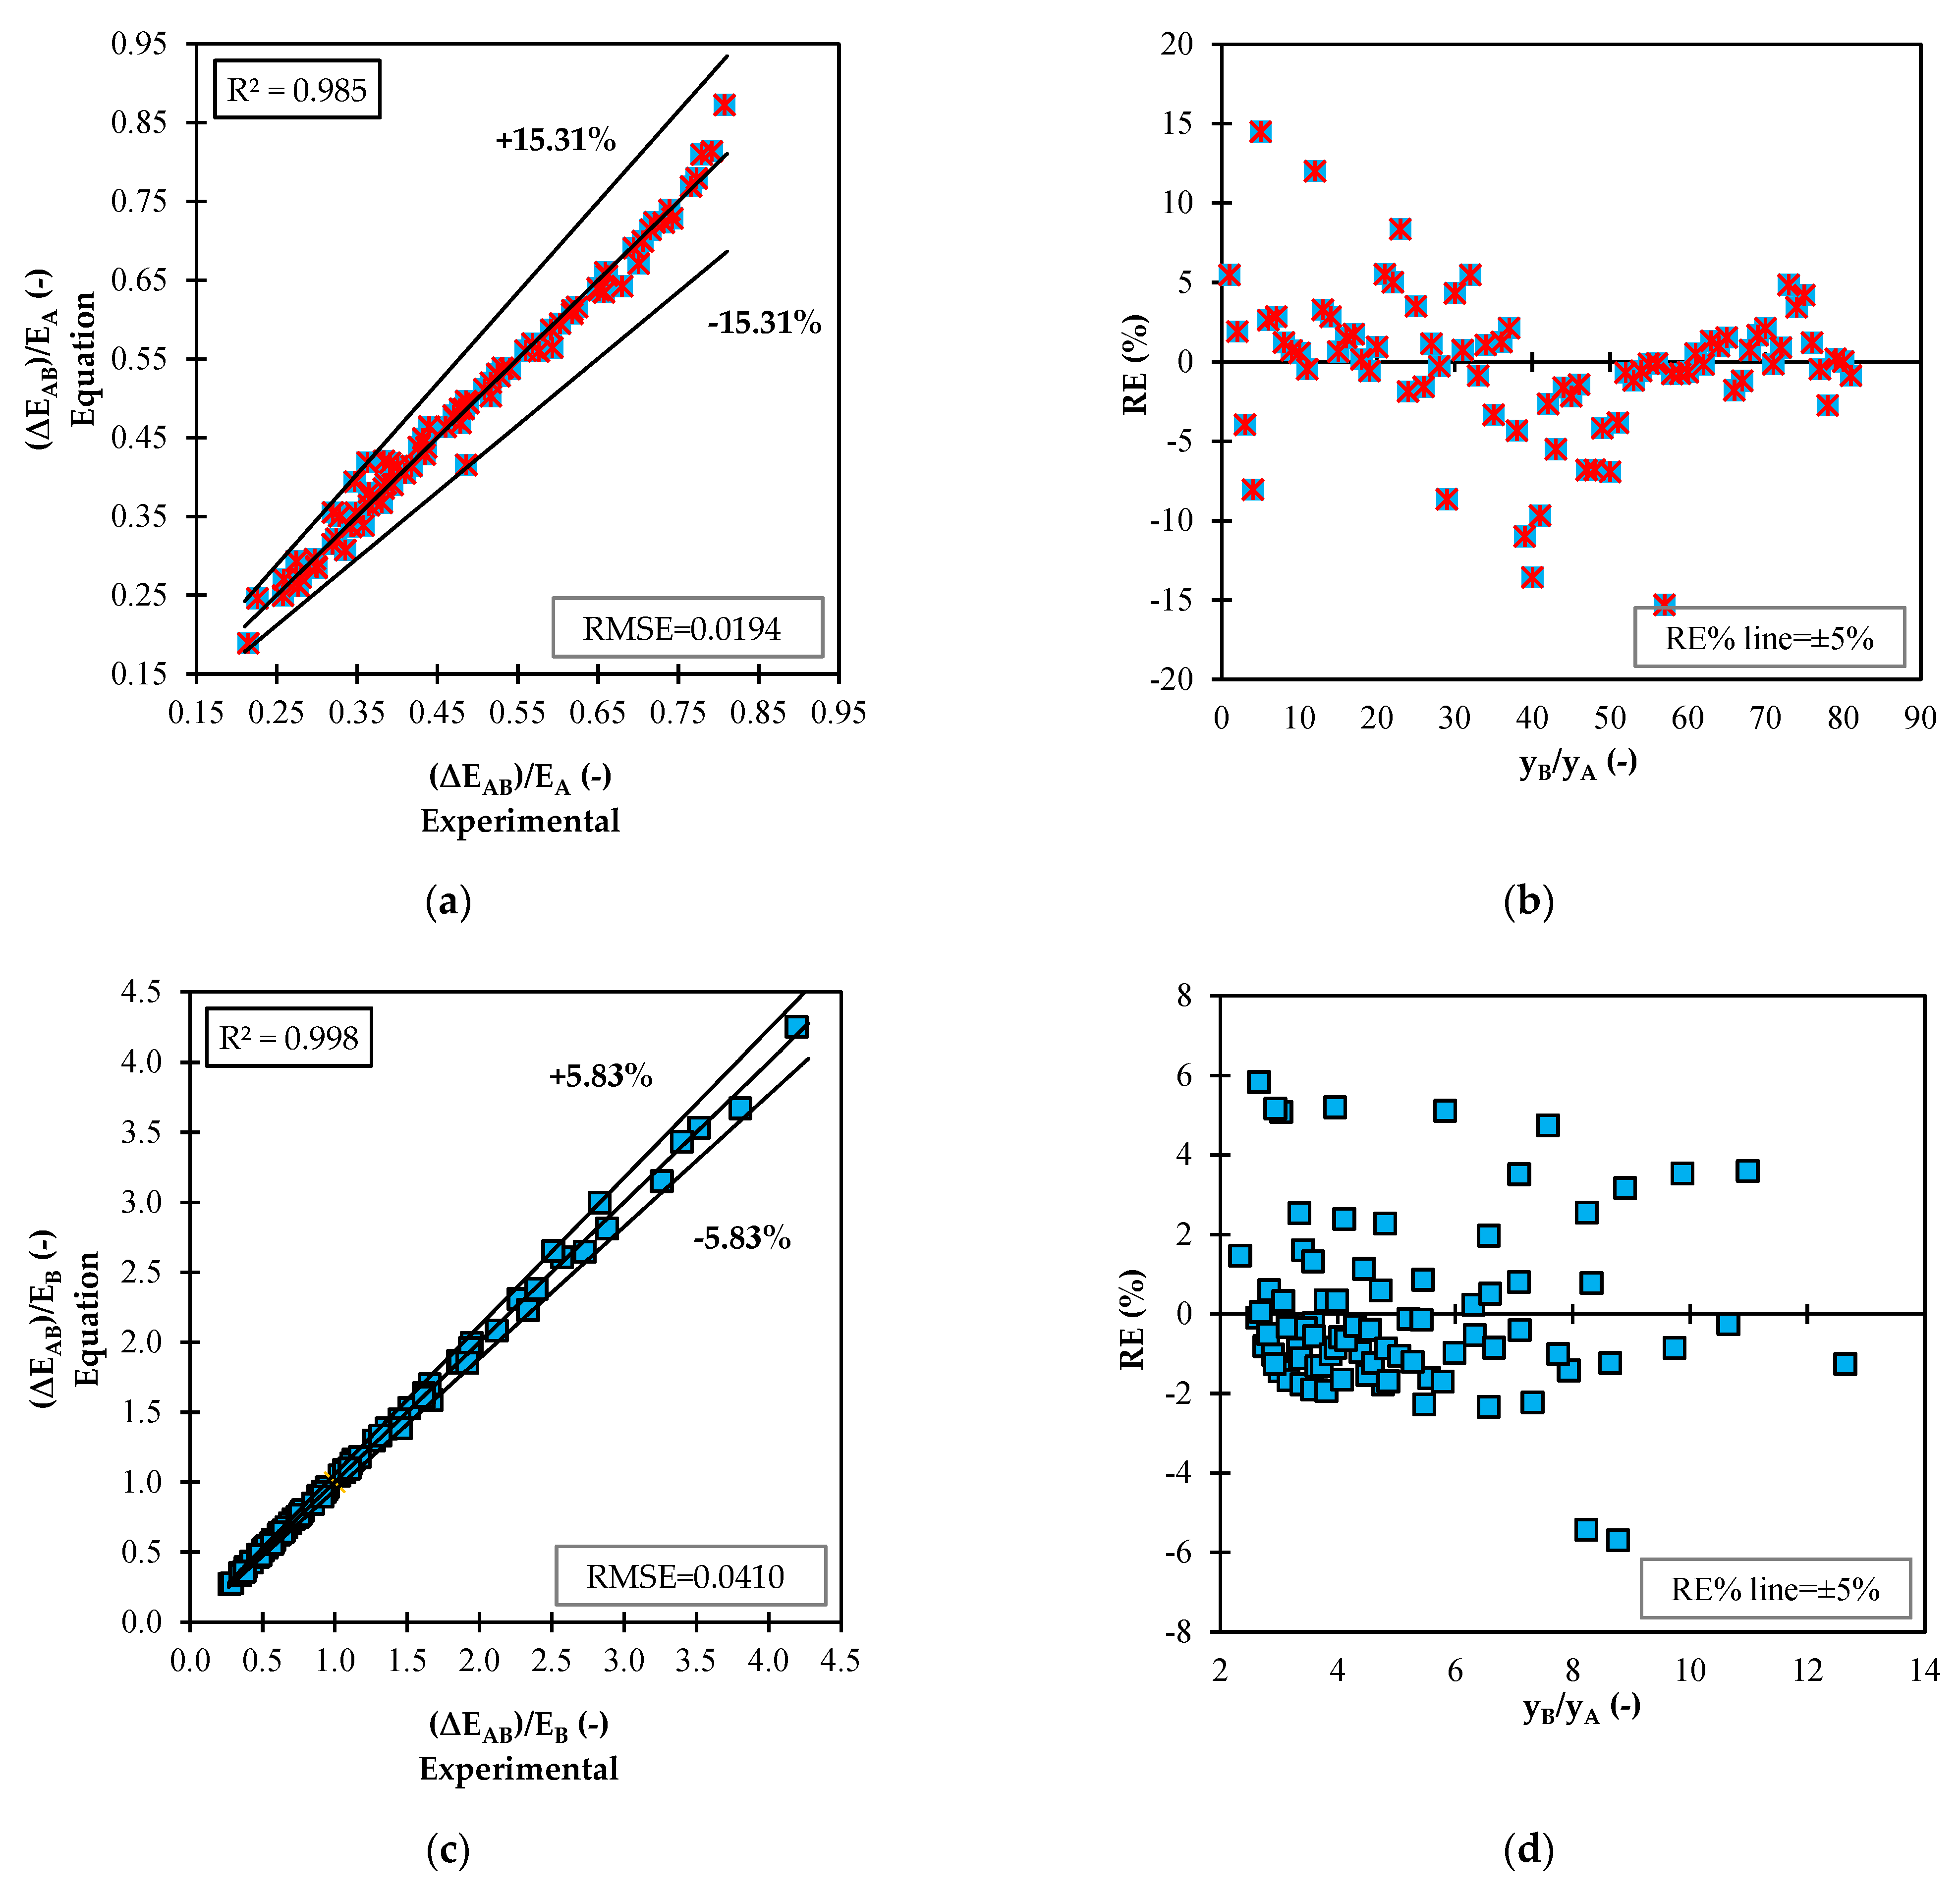
Figure 10a,c shows a comparison diagram of the calculated and experimental values of the relative energy dissipation. The results show that the tendency of changes in the energy dissipation ratio to the upstream and downstream parts of the experimental results agrees with the values obtained from the equations. The results of the statistical indicators are given in Table 7. Figure 10b,d examines the independent parameters yB/yA and the dependent parameters ∆EAB/EA and ∆EAB/EB to verify the accuracy of Equations (19) and (20). Figure 10b,d shows the graphs of the percent relative error against the effective dimensionless parameter yB/yA. In these figures, a large range of data lies within the relative error range of ±5%. This shows that the proposed equations have very good accuracy in predicting the relative energy dissipation.
By combining the data from the different openings of the present study and using the regression technique with Solver in the Excel software, Equation (21) was obtained to estimate the Cd of the gate without the sill condition.
Table 8 compares the Cd of the present study without the sill state with the results of the previous studies.
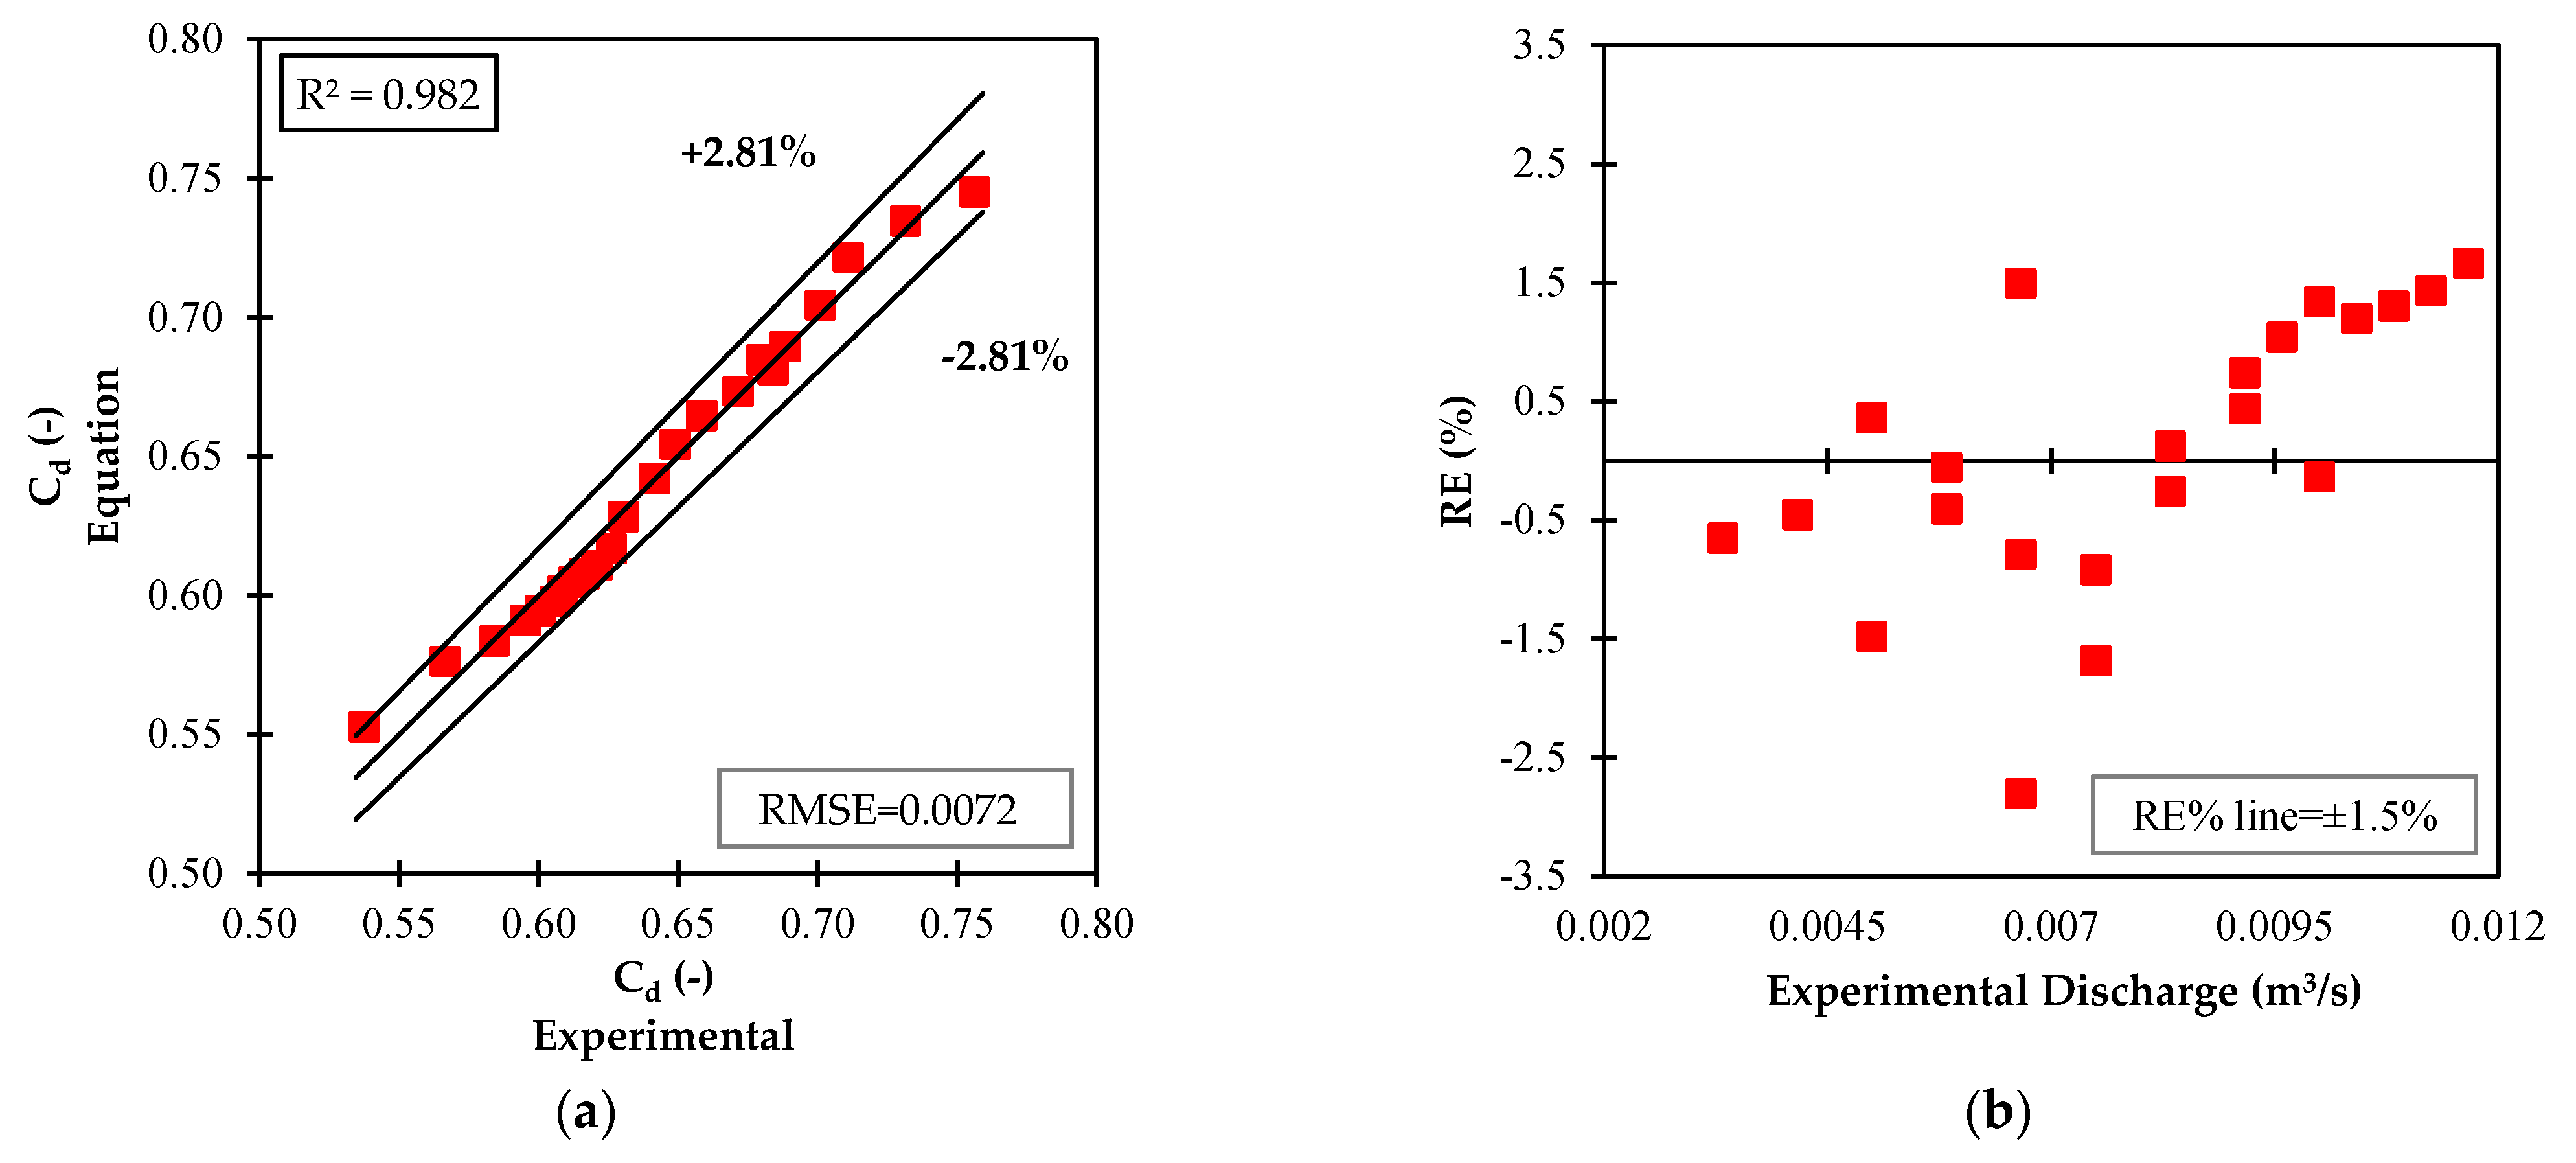
Figure 11a shows that Equation (21) reasonably predicts the values of the runoff coefficient with a maximum percent relative error, a mean percent relative error, a mean absolute error, and a mean squared error of 2.81%, 0.97%, 0.0061, and 0.0072, respectively. In Figure 11b, by substituting the Cd obtained from the proposed Equation (21) into Equation (5), a comparison was made between the discharge rate obtained from the experimental results and Equation (5). In Figure 11b, it can be seen that a large area of the data is within the error range of ±1.5%. This shows that the formula is very accurate, such that more than 82% of the data have an error of less than ±1.5%.
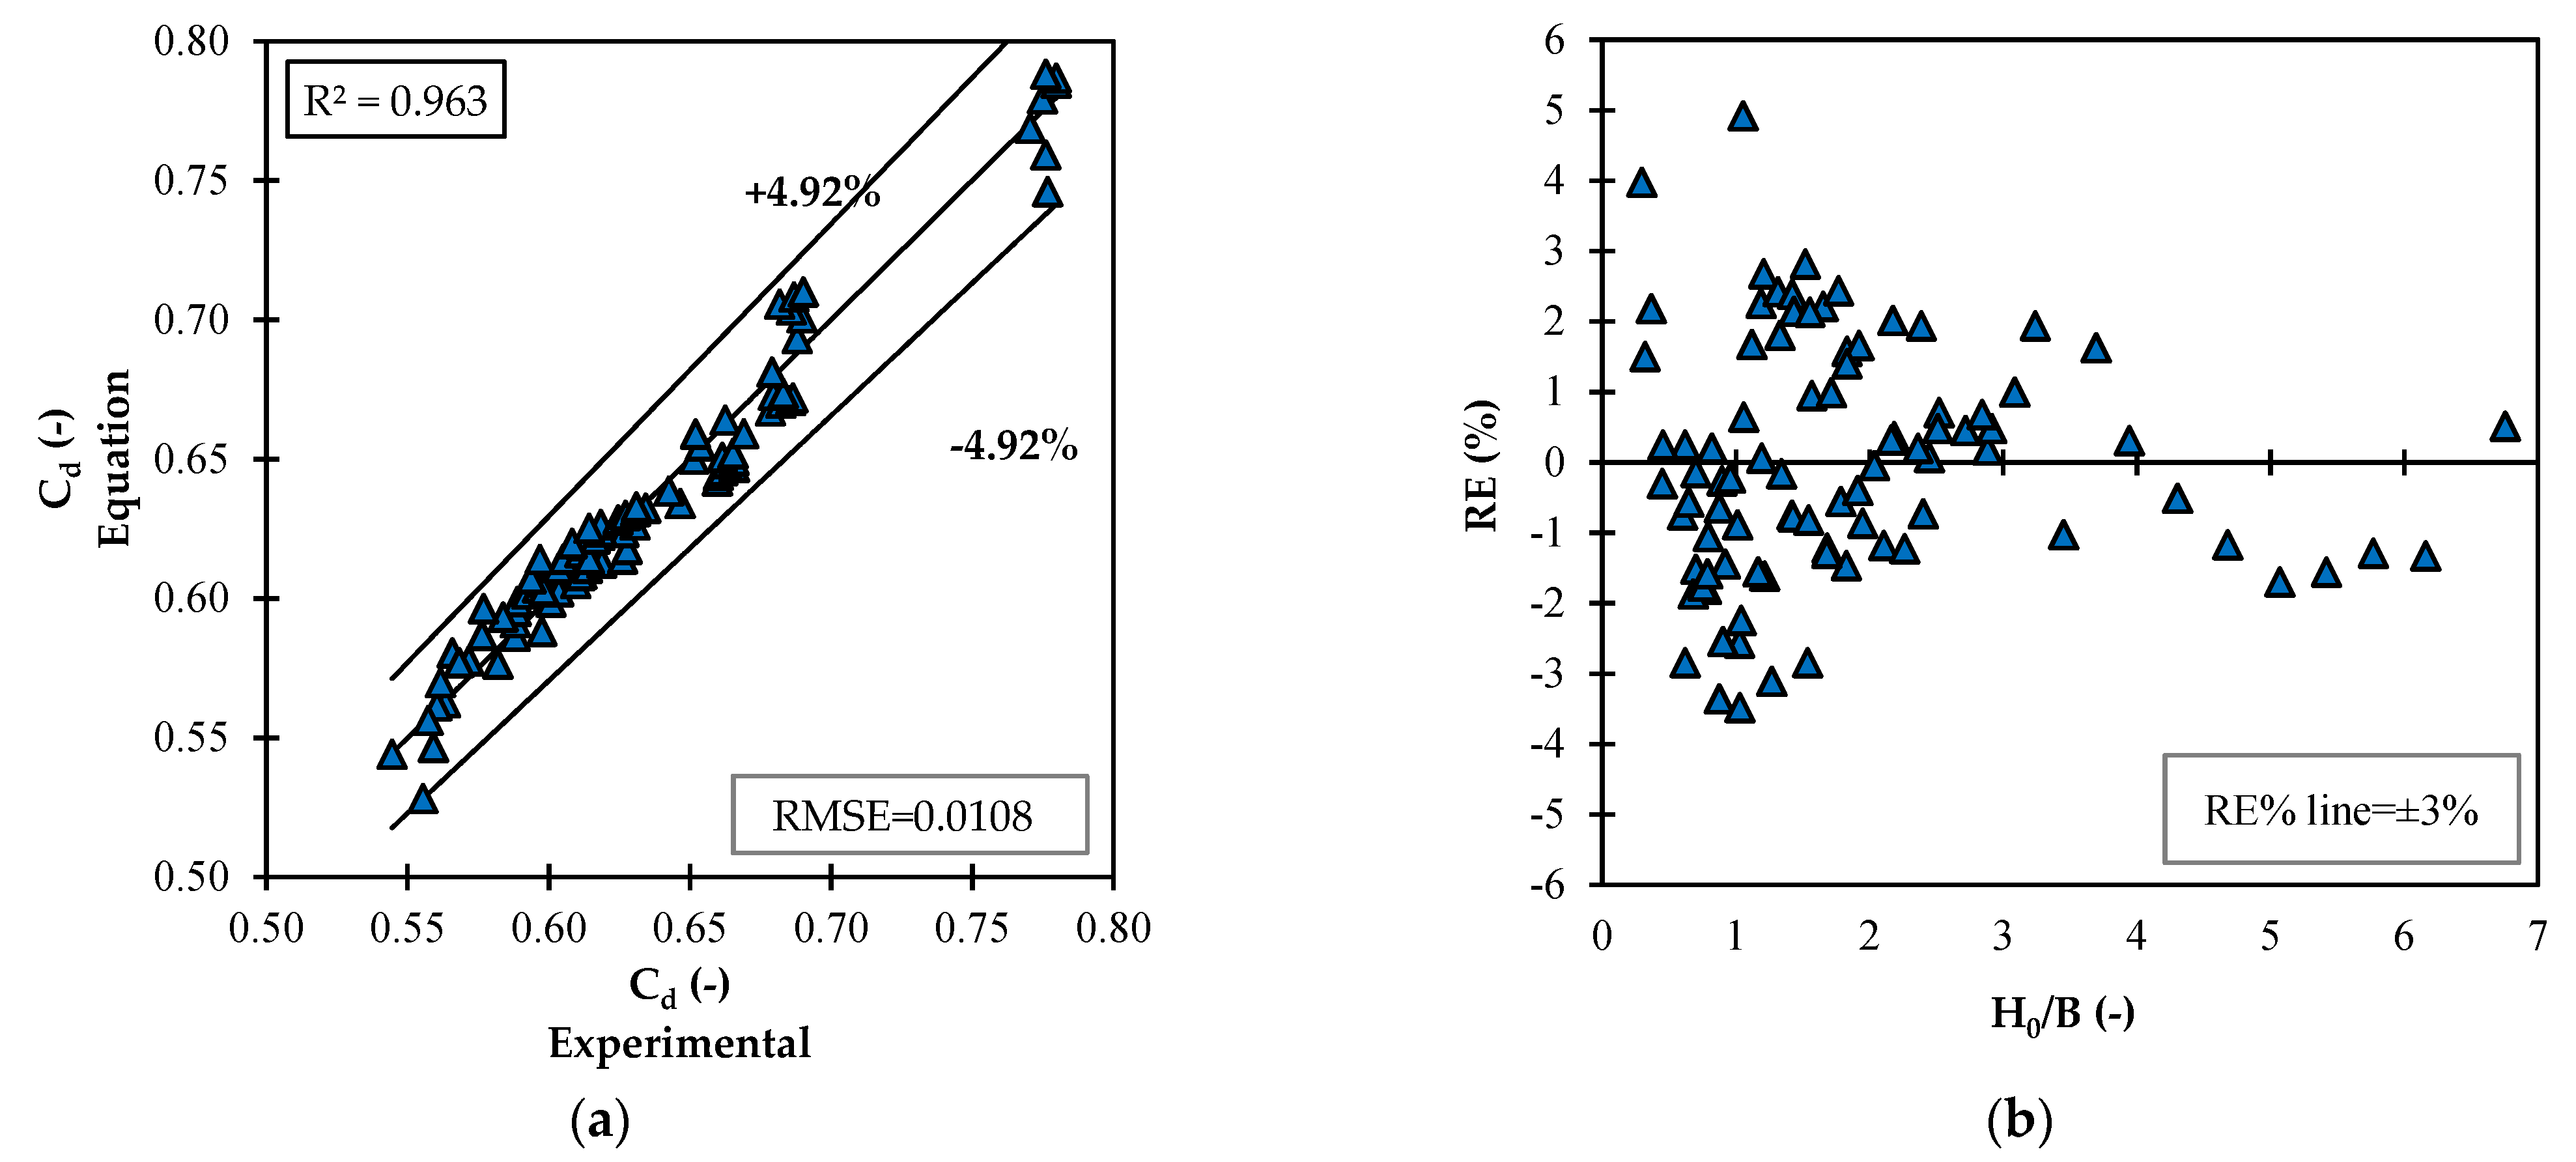
Equation (22) can be used for suppressed and unsuppressed sill below the sluice gate. For the suppressed sill, Atotal = A2. One way to compare the experimental results with Equation (22) to determine its accuracy is to examine the magnitude of the difference between the Cd obtained from the experimental results and the Cd calculated using the predicted equation.
Figure 12a shows the optimal trend of results between calculated and experimental values. According to Figure 12a, the maximum percent relative error is 4.92%. The mean percent relative error, mean absolute error, and root mean square error are 1.36%, 0.0087, and 0.0108, respectively. From Figure 12b, 94% of the data are within the error range of ±3%, indicating the high accuracy of the proposed equation.
4. Conclusions
The present study investigated energy dissipation and the Cd with and without sills below the lock gate. The results show that the relative energy dissipation without a sill and at different openings is inversely related to the gate openings. As the opening of the sluice gate increases, the relative energy dissipation decreases due to the increase in initial depth. As a result, a decrease in specific energy in section A and a decrease in exit depth and specific energy in section B can be observed. The flow of the gate without a sill decreases as the opening increases. The Cd of the sluice gate without a sill is most affected by the upstream flow depth and the opening. At constant discharge, as the opening increases, the upstream water depth of the sluice gate decreases, and the Cd tends to decrease in proportion to the lower opening of the sluice gate. The comparison of the sluice gates with different openings shows that the hydrodynamic force on the gate increases with a decrease in the number of openings for the same discharge rate. According to the results, in all cases where the sill is used under the sluice gate and at all discharge rates, the relative energy dissipation is greater than for the free classical hydraulic jump without a sill. The energy dissipation increases as the FrA increases. A comparison of the results for the Cd with sill and without sill shows that a sill under the sluice gate increases the Cd. In the present study, the general equation for discharge calculation was developed for an unsuppressed sill, and the calculations were performed based on the new equation of the present study, which can be used for unsuppressed symmetrical sills. The presence of a sill the same width as the channel below the sluice gate increases the Cd compared to the condition without a sill at a fixed opening. From the comparison of the rate of increase of the Cd, it can be concluded that the sill width parameter has the greatest influence on the Cd. Finally, non-linear polynomial regression relationships were determined to calculate the energy dissipation related to the upstream and downstream hydraulic jump. Non-linear regression equations were also established to predict the Cd.
Author Contributions
Conceptualization, H.A., R.N. and R.D.; methodology, H.A., R.N. and R.D.; formal analysis, H.A., R.N. and R.D.; investigation, H.A., R.N., V.S., A.K., R.D. and J.A.; data curation, H.A.; writing—original draft preparation, H.A.; writing—review and editing, H.A., R.N., V.S., A.K., R.D. and J.A.; supervision, R.D.; project administration, H.A. All authors have read and agreed to the published version of the manuscript.
Funding
This research did not receive external funding.
Data Availability Statement
Data are contained within the article.
Conflicts of Interest
The authors declare no conflict of interest.
References
- Negm, A.M.; Alhamid, A.A.; El-Saiad, A.A. Submerged flow below sluice gate with sill. In Proceedings of the International Conference on Hydro-Science and Engineering Hydro-Science and Engineering ICHE98, Berlin, Germany, 31 August–3 September 1998; University of Mississippi: Oxford, MS, USA, 1998. Advances in Hydro-Science and Engineering. Volume 3. [Google Scholar]
- Henry, H.R. Discussion on Diffusion of submerged jets, by Albertson, M.L. et al. Trans. Am. Soc. Civ. Eng. 1950, 115, 687. [Google Scholar]
- Rajaratnam, N.; Subramanya, K. Flow Equation for the Sluice Gate. J. Irrig. Drain. Div. 1967, 93, 167–186. [Google Scholar] [CrossRef]
- Rajaratnam, N. Free Flow Immediately Below Sluice Gates. J. Hydraul. Div. 1977, 103, 345–351. [Google Scholar] [CrossRef]
- Swamee, P.K. Sluice Gate Discharge Equations. J. Irrig. Drain. Eng. 1992, 118, 56–60. [Google Scholar] [CrossRef]
- Shivapur, A.V.; Shesha Prakash, M.N. Inclined Sluice Gate for Flow Measurement. ISH J. Hydraul. Eng. 2005, 11, 46–56. [Google Scholar] [CrossRef]
- Nasehi Oskuyi, N.; Salmasi, F. Vertical Sluice Gate Discharge Coefficient. J. Civ. Eng. Urban. 2012, 2, 108–114. [Google Scholar]
- Daneshfaraz, R.; Ghahramanzadeh, A.; Ghaderi, A.; Joudi, A.R.; Abraham, J. Investigation of the Effect of Edge Shape on Characteristics of Flow Under Vertical Gates. J. Am. Water Work. Assoc. 2016, 108, E425–E432. [Google Scholar] [CrossRef]
- Salmasi, F.; Nouri, M.; Sihag, P.; Abraham, J. Application of SVM, ANN, GRNN, RF, GP and RT Models for Predicting Discharge Coefficients of Oblique Sluice Gates Using Experimental Data. Water Supply 2021, 21, 232–248. [Google Scholar] [CrossRef]
- Salmasi, F.; Abraham, J. Expert System for Determining Discharge Coefficients for Inclined Slide Gates Using Genetic Programming. J. Irrig. Drain. Eng. 2020, 146, 06020013. [Google Scholar] [CrossRef]
- Alhamid, A.A. Coefficient of Discharge for Free Flow Sluice Gates. J. King Saud Univ.-Eng. Sci. 1999, 11, 33–47. [Google Scholar] [CrossRef]
- Salmasi, F.; Norouzi Sarkarabad, R. Investigation of different geometric shapes of sills on discharge coefficient of vertical sluice gate. Amirkabir J. Civ. Eng. 2018, 52, 2. [Google Scholar]
- Karami, S.; Heidari, M.M.; Adib Rad, M.H. Investigation of Free Flow Under the Sluice Gate with the Sill Using Flow-3D Model. Iran. J. Sci. Technol. Trans. Civ. Eng. 2020, 44, 317–324. [Google Scholar] [CrossRef]
- Salmasi, F.; Abraham, J. Prediction of discharge coefficients for sluice gates equipped with different geometric sills under the gate using multiple non-linear regression (MNLR). J. Hydrol. 2020, 597, 125728. [Google Scholar] [CrossRef]
- Ghorbani, M.A.; Salmasi, F.; Saggi, M.K.; Bhatia, A.S.; Kahya, E.; Norouzi, R. Deep learning under H2O framework. A novel approach for quantitative analysis of discharge coefficient in sluice gates. J. Hydroinformatics 2020, 22, 1603–1619. [Google Scholar] [CrossRef]
- Lauria, A.; Calomino, F.; Alfonsi, G.; D’Ippolito, A. Discharge Coefficients for Sluice Gates Set in Weirs at Different Upstream Wall Inclinations. Water 2020, 12, 245. [Google Scholar] [CrossRef]
- Abbaspour, A.; Hosseinzadeh Dalir, A.; Farsadizadeh, D.; Sadraddini, A.A. Effect of Sinusoidal Corrugated Bed on Hydraulic Jump Characteristics. J. Hydro-Environ. Res. 2009, 3, 109–117. [Google Scholar] [CrossRef]
- Murzyn, F.; Chanson, H. Experimental assessment of scale effects affecting two-phase flow properties in hydraulic jumps. Exp. Fluids 2008, 45, 513–521. [Google Scholar] [CrossRef]
- Nasrabadi, M.; Mehri, Y.; Ghassemi, A.; Omid, M.H. Predicting Submerged Hydraulic Jump Characteristics Using Machine Learning Methods. Water Supply 2021, 21, 4180–4194. [Google Scholar] [CrossRef]
- Chow, V.T. Open-Channel Hydraulics; McGraw-Hill Book Co.: New York, NY, USA, 1959. [Google Scholar]
- Watts, F.J.; Simons, D.B.; Richardson, E.V. Variation of α and β values in Lined Open Channels. J. Hydraul. Div. Am. Soc. Civ. Eng. 1967, 93, 217–234, (see also Discussions: Vol. 94, 1968, HY3, pp. 834–837; HY6, pp. 1560–1564; and vol. 95, 1969, HY3, p. 1059). [Google Scholar] [CrossRef]
- Temple, D.M. Velocity Distribution Coefficients for Grass-lined Channels. J. Hydraul. Eng. Am. Soc. Civ. Eng. 1986, 12, 193–205. [Google Scholar] [CrossRef]
- Henderson, F.M. Open Channel Flow; MacMillan Publishing Co.: New York, NY, USA, 1966. [Google Scholar]
- Chaudhry, M.H. Open Channel Flow, 2nd ed.; Springer: Berlin/Heidelberg, Germany, 2008. [Google Scholar]
- Belanger, J.B.C.J. Essai sur la solution numerique de quelques problemes relatifs au movement permanent des eaux courantes. In Test on the Numerical Solution of Some Problems Relating to the Permanent Movement of Running Waters; Kessinger Publishing: Whitefish, MT, USA, 1828. (In French) [Google Scholar]
- Hager, W.H. Underflow of Standard Sluice Gate. Exp. Fluids 1999, 27, 339–350. [Google Scholar] [CrossRef]
Figure 1.
The experimental flume and hydraulic characteristics of flow.

Figure 2.
An example of the model.

Figure 3.
(a,b) Changes in the relative energy dissipation against Froude number/ (c,d) Changes in the relative energy dissipation in different discharges.
Figure 3.
(a,b) Changes in the relative energy dissipation against Froude number/ (c,d) Changes in the relative energy dissipation in different discharges.


Figure 4.
(a) Variation of Cd versus H0/G1; (b) stage-discharge diagram at various openings.

Figure 5.
(a,b) Changes in the relative energy dissipation against Froude number.

Figure 6.
Separation of the flow passing above the sill with width (a) 0.25 m; (b) 0.30 m.

Figure 7.
Changes in the relative depth of the hydraulic jump versus the initial FrA.

Figure 8.
The Cd changes against the (a) upstream depth to sill width; (b) height to sill width; (c) flow area above the sill to flow area at the sill sides.
Figure 8.
The Cd changes against the (a) upstream depth to sill width; (b) height to sill width; (c) flow area above the sill to flow area at the sill sides.

Figure 9.
Comparison of Cd between without and with suppressed sill at the same opening.

Figure 10.
(a,c) Comparison of calculated and experimental values of the relative energy dissipation; (b,d) the percentage relative error dispersion.
Figure 10.
(a,c) Comparison of calculated and experimental values of the relative energy dissipation; (b,d) the percentage relative error dispersion.

Figure 11.
(a) Comparison diagram of calculated and experimental values of Cd; (b) percentage relative error versus experimental discharge.
Figure 11.
(a) Comparison diagram of calculated and experimental values of Cd; (b) percentage relative error versus experimental discharge.

Figure 12.
(a) Comparison diagram of calculated and experimental Cd values with sill in different widths; (b) dispersion of the percentage relative error.
Figure 12.
(a) Comparison diagram of calculated and experimental Cd values with sill in different widths; (b) dispersion of the percentage relative error.


Table 1.
The hydrodynamic force is applied to the sluice gate at different openings.
| Gate Openings (m) | |||||
|---|---|---|---|---|---|
| 0.01 | 0.02 | 0.04 | |||
| q (m3/s·m) | R (kg/m) | q (m3/s·m) | R (kg/m) | q (m3/s·m) | R (kg/m) |
| 0.0111 | 7.77 | 0.0167 | 1.96 | 0.0278 | 0.21 |
| 0.0139 | 17.53 | 0.0194 | 4.02 | 0.0306 | 0.49 |
| 0.0167 | 35.52 | 0.0222 | 7.36 | 0.0319 | 0.69 |
| 0.0194 | 59.62 | 0.025 | 11.90 | 0.0333 | 0.93 |
| 0.0222 | 89.92 | 0.0278 | 17.58 | 0.0347 | 1.27 |
| - | - | 0.0306 | 24.78 | 0.0361 | 1.61 |
| - | - | 0.0333 | 35.61 | 0.0375 | 1.96 |
| - | - | - | - | 0.0389 | 2.36 |
| - | - | - | - | 0.0417 | 3.58 |
Table 2.
Values of α in sections A and B.
| Q (L/min) | Sill widths (m) | |||||||
| 0.025 | 0.05 | 0.075 | 0.10 | |||||
| αA | αB | αA | αB | αA | αB | αA | αB | |
| 450 | - | - | - | - | 1.024 | 1.002 | 1.045 | 1.003 |
| 500 | - | - | 1.021 | 1.001 | 1.018 | 1.005 | 1.040 | 1.006 |
| 550 | 1.022 | 1.001 | 1.013 | 1.002 | 1.015 | 1.008 | 1.030 | 1.009 |
| 575 | 1.019 | 1.002 | 1.009 | 1.009 | 1.007 | 1.025 | 1.015 | 1.018 |
| 600 | 1.010 | 1.008 | 1.003 | 1.030 | 1.005 | 1.038 | 1.005 | 1.038 |
| 625 | 1.008 | 1.020 | 1.002 | 1.065 | 1.002 | 1.065 | 1.001 | 1.062 |
| 650 | 1.006 | 1.050 | 1.001 | 1.075 | 1.001 | 1.080 | 1.001 | 1.095 |
| 675 | 1.001 | 1.075 | 1.000 | 1.095 | 1.001 | 1.098 | 1.001 | 1.100 |
| 700 | 1.001 | 1.090 | 1.000 | 1.100 | 1.000 | 1.105 | 1.001 | 1.108 |
| 750 | 1.001 | 1.100 | 1.000 | 1.105 | 1.000 | 1.130 | 1.000 | 1.119 |
| Q (L/min) | Sill widths (m) | |||||||
| 0.15 | 0.20 | 0.25 | 0.30 | |||||
| αA | αB | αA | αB | αA | αB | αA | αB | |
| 300 | - | - | - | - | 1.009 | 1.004 | - | - |
| 325 | - | - | - | - | - | - | 1.001 | 1.050 |
| 350 | - | - | - | - | 1.007 | 1.009 | 1.001 | 1.084 |
| 375 | - | - | - | 1.005 | 1.030 | 1.000 | 1.100 | |
| 400 | - | - | - | - | 1.001 | 1.075 | - | - |
| 450 | - | - | 1.020 | 1.002 | 1.000 | 1.098 | - | - |
| 500 | 1.030 | 1.002 | 1.015 | 1.005 | 1.000 | 1.107 | - | - |
| 550 | 1.028 | 1.004 | 1.012 | 1.009 | - | - | - | - |
| 575 | 1.028 | 1.006 | 1.007 | 1.020 | - | - | - | - |
| 600 | 1.015 | 1.008 | 1.003 | 1.055 | - | - | - | - |
| 625 | 1.010 | 1.010 | 1.001 | 1.085 | - | - | - | - |
| 650 | 1.008 | 1.020 | 1.000 | 1.140 | - | - | - | - |
| 675 | 1.001 | 1.055 | - | - | - | - | - | - |
| 700 | 1.001 | 1.085 | - | - | - | - | - | - |
| 750 | 1.000 | 1.130 | - | - | - | - | - | - |
Table 3.
Values of EA and EB with and without considering α.
| Q (L/min) | Sill Widths (m) | |||||||||||
| 0.025 | 0.05 | |||||||||||
| with α EA (m) | without α EA (m) | RE (%) | with α EB (m) | without α EB (m) | RE (%) | with α EA (m) | without α EA (m) | RE (%) | with α EB (m) | without α EB (m) | RE (%) | |
| 500 | - | - | - | - | - | - | 0.096 | 0.094 | 1.56 | 0.073 | 0.073 | 0.01 |
| 550 | 0.107 | 0.105 | 1.63 | 0.086 | 0.086 | 0.01 | 0.111 | 0.110 | 1.04 | 0.077 | 0.077 | 0.03 |
| 575 | 0.115 | 0.113 | 1.43 | 0.079 | 0.079 | 0.03 | 0.121 | 0.120 | 0.71 | 0.081 | 0.081 | 0.11 |
| 600 | 0.124 | 0.123 | 0.80 | 0.082 | 0.082 | 0.11 | 0.130 | 0.130 | 0.21 | 0.084 | 0.083 | 0.39 |
| 625 | 0.136 | 0.135 | 0.66 | 0.088 | 0.088 | 0.23 | 0.141 | 0.141 | 0.13 | 0.089 | 0.089 | 0.72 |
| 650 | 0.146 | 0.145 | 0.50 | 0.090 | 0.090 | 0.59 | 0.151 | 0.151 | 0.07 | 0.092 | 0.092 | 0.81 |
| 675 | 0.155 | 0.155 | 0.08 | 0.096 | 0.095 | 0.78 | 0.162 | 0.162 | 0.01 | 0.098 | 0.097 | 0.90 |
| 700 | 0.165 | 0.165 | 0.07 | 0.098 | 0.097 | 0.93 | 0.175 | 0.175 | 0.01 | 0.100 | 0.099 | 0.97 |
| 750 | 0.186 | 0.186 | 0.04 | 0.106 | 0.105 | 0.93 | 0.204 | 0.204 | 0.01 | 0.107 | 0.106 | 0.93 |
| Q (L/min) | Sill widths (m) | |||||||||||
| 0.075 | 0.10 | |||||||||||
| with α EA (m) | without α EA (m) | RE (%) | with α EB (m) | without α EB (m) | RE (%) | with α EA (m) | without α EA (m) | RE (%) | with α EB (m) | without α EB (m) | RE (%) | |
| 450 | 0.088 | 0.086 | 1.75 | 0.069 | 0.069 | 0.07 | 0.099 | 0.095 | 3.41 | 0.069 | 0.069 | 0.04 |
| 500 | 0.104 | 0.102 | 1.39 | 0.076 | 0.076 | 0.08 | 0.118 | 0.114 | 3.18 | 0.077 | 0.077 | 0.07 |
| 550 | 0.123 | 0.122 | 1.22 | 0.083 | 0.083 | 0.08 | 0.134 | 0.131 | 2.46 | 0.083 | 0.083 | 0.09 |
| 575 | 0.137 | 0.136 | 0.59 | 0.089 | 0.089 | 0.09 | 0.148 | 0.146 | 1.27 | 0.089 | 0.089 | 0.16 |
| 600 | 0.151 | 0.150 | 0.39 | 0.093 | 0.092 | 0.09 | 0.165 | 0.164 | 0.44 | 0.093 | 0.093 | 0.32 |
| 625 | 0.164 | 0.164 | 0.13 | 0.095 | 0.094 | 0.09 | 0.182 | 0.182 | 0.09 | 0.097 | 0.096 | 0.50 |
| 650 | 0.179 | 0.179 | 0.09 | 0.101 | 0.100 | 0.10 | 0.197 | 0.197 | 0.07 | 0.102 | 0.101 | 0.72 |
| 675 | 0.193 | 0.193 | 0.07 | 0.103 | 0.102 | 0.10 | 0.213 | 0.213 | 0.07 | 0.105 | 0.105 | 0.72 |
| 700 | 0.207 | 0.207 | 0.01 | 0.107 | 0.107 | 0.11 | 0.230 | 0.230 | 0.05 | 0.109 | 0.109 | 0.75 |
| 750 | 0.247 | 0.247 | 0.01 | 0.117 | 0.116 | 0.12 | 0.266 | 0.266 | 0.01 | 0.118 | 0.117 | 0.74 |
| Q (L/min) | Sill widths (m) | |||||||||||
| 0.15 | 0.20 | |||||||||||
| with α EA (m) | without α EA (m) | RE (%) | with α EB (m) | without α EB (m) | RE (%) | with α EA (m) | without α EA (m) | RE (%) | with α EB (m) | without α EB (m) | RE (%) | |
| 450 | - | - | - | - | - | - | 0.155 | 0.152 | 1.77 | 0.079 | 0.079 | 0.01 |
| 500 | 0.135 | 0.131 | 2.51 | 0.084 | 0.084 | 0.02 | 0.189 | 0.186 | 1.36 | 0.088 | 0.088 | 0.03 |
| 550 | 0.167 | 0.163 | 2.43 | 0.088 | 0.088 | 0.03 | 0.242 | 0.239 | 1.11 | 0.098 | 0.098 | 0.05 |
| 575 | 0.183 | 0.179 | 2.46 | 0.092 | 0.092 | 0.05 | 0.266 | 0.264 | 0.66 | 0.101 | 0.101 | 0.11 |
| 600 | 0.205 | 0.202 | 1.35 | 0.098 | 0.098 | 0.07 | 0.302 | 0.302 | 0.29 | 0.105 | 0.105 | 0.30 |
| 625 | 0.222 | 0.220 | 0.91 | 0.101 | 0.101 | 0.07 | 0.332 | 0.332 | 0.05 | 0.114 | 0.113 | 0.40 |
| 650 | 0.251 | 0.250 | 0.74 | 0.108 | 0.108 | 0.12 | 0.393 | 0.393 | 0.01 | 0.116 | 0.116 | 0.66 |
| 675 | 0.280 | 0.280 | 0.09 | 0.111 | 0.111 | 0.32 | - | - | - | - | - | - |
| 700 | 0.303 | 0.303 | 0.08 | 0.116 | 0.116 | 0.47 | - | - | - | - | - | - |
| 750 | 0.349 | 0.349 | 0.03 | 0.123 | 0.122 | 0.70 | - | - | - | - | - | - |
| Q (L/min) | Sill widths (m) | |||||||||||
| 0.25 | 0.30 | |||||||||||
| with α EA (m) | without α EA (m) | RE (%) | with α EB (m) | without α EB (m) | RE (%) | with α EA (m) | without α EA (m) | RE (%) | with α EB (m) | without α EB (m) | RE (%) | |
| 300 | 0154 | 0.153 | 0.83 | 0.062 | 0.062 | 0.03 | 0.375 | 0.375 | 0.08 | 0.068 | 0.068 | 0.25 |
| 325 | - | - | - | - | - | - | 0.425 | 0.425 | 0.06 | 0.073 | 0.072 | 0.40 |
| 350 | 0.214 | 0.213 | 0.62 | 0.073 | 0.073 | 0.05 | 0.492 | 0.492 | 0.04 | 0.078 | 0.078 | 0.45 |
| 375 | 0.256 | 0.255 | 0.48 | 0.076 | 0.076 | 0.17 | - | - | - | - | - | - |
| 400 | 0.315 | 0.315 | 0.08 | 0.085 | 0.084 | 0.34 | - | - | - | - | - | - |
| 450 | 0.398 | 0.398 | 0.01 | 0.094 | 0.094 | 0.42 | - | - | - | - | - | - |
| 500 | 0.495 | 0.495 | 0.01 | 0.103 | 0.103 | 0.42 | - | - | - | - | - | - |
| Types of Channel | α Values | ||
|---|---|---|---|
| Min | Mean | Max | |
| Regular channels, flumes, Spillways | 1.10 | 1.15 | 1.20 |
| Natural channels | 1.15 | 1.30 | 1.50 |
| Rivers with ice cover | 1.20 | 1.50 | 2.00 |
| River valleys, over flooded | 1.50 | 1.75 | 2.00 |
Table 5.
Comparison of the relative energy dissipation without and with sills in different widths.
| B (m) | Without Sill G = 0.04 | 0.025 | 0.05 | 0.075 | 0.10 | 0.15 | 0.20 | 0.25 | 0.30 | ||
|---|---|---|---|---|---|---|---|---|---|---|---|
| Q (L/min) | 300 | ∆EAB/EA (%) | - | - | - | - | - | - | - | 59.3 | 71.5 |
| 350 | - | - | - | - | - | - | - | 65.7 | 77.3 | ||
| 400 | - | - | - | - | - | - | - | 73.2 | - | ||
| 450 | - | - | - | 19.9 | 27.4 | - | 47.8 | 76.5 | - | ||
| 500 | 21.5 | - | 22.6 | 25.9 | 32.8 | 36.3 | 52.5 | 79.2 | - | ||
| 550 | 25.8 | 27.7 | 29.9 | 32 | 36.5 | 46 | 59.2 | - | - | ||
| 600 | 29.7 | 33.5 | 35.8 | 38.3 | 43.2 | 51.6 | 65.1 | - | - | ||
| 650 | 34.3 | 38.1 | 39.4 | 44 | 48.9 | 56.9 | 70.6 | - | - | ||
| 300 | ∆EAB/EB (%) | - | - | - | - | - | - | - | 145.9 | 251.3 | |
| 350 | - | - | - | - | - | - | - | 191.8 | 340.2 | ||
| 400 | - | - | - | - | - | - | - | 273.1 | - | ||
| 450 | - | - | - | 24.8 | 38.8 | - | 91.6 | 326.4 | - | ||
| 500 | 27.3 | - | 29.2 | 34.9 | 48.8 | 57 | 110.4 | 380.7 | - | ||
| 550 | 34.7 | 38.3 | 42.7 | 47 | 57.5 | 85.3 | 144.9 | - | - | ||
| 600 | 42.3 | 50.4 | 55.8 | 62.2 | 76.2 | 106.8 | 186.8 | - | - | ||
| 650 | 52.2 | 61.5 | 65 | 78.5 | 95.5 | 131.8 | 239.7 | - | - | ||
Table 6.
Comparison of Cd without and with sill state in various sizes (width).
| B (m) | Without Sill | 0.025 | 0.025 | 0.075 | 0.10 | 0.15 | 0.20 | 0.25 | 0.30 | ||
|---|---|---|---|---|---|---|---|---|---|---|---|
| Q (L/min) | 350 | Cd (-) | - | - | 0.5554 | 0.5573 | 0.5683 | 0.5969 | 0.6515 | 0.6897 | 0.7797 |
| 375 | - | - | 0.5592 | 0.5617 | 0.5763 | 0.6083 | 0.6538 | 0.6860 | 0.7760 | ||
| 400 | 0.5377 | 0.5445 | 0.5604 | 0.5658 | 0.5769 | 0.6143 | 0.6520 | 0.6818 | - | ||
| 450 | 0.5667 | 0.5675 | 0.5820 | 0.5838 | 0.5938 | 0.6310 | 0.6625 | 0.6868 | - | ||
Table 7.
Results of statistical indicators comparing experimental results with Equations (18) and (19).
Table 7.
Results of statistical indicators comparing experimental results with Equations (18) and (19).
| Mode | Mean AE (-) | Mean RE (%) | Max Relative Error (%) | Min Relative Error (%) | RMSE (-) | R2 |
|---|---|---|---|---|---|---|
| 0.0134 | 3.12 | 14.49 | −15.31 | 0.0194 | 0.985 | |
| 0.0233 | 1.62 | 5.83 | −5.7 | 0.0410 | 0.998 |
Disclaimer/Publisher’s Note: The statements, opinions and data contained in all publications are solely those of the individual author(s) and contributor(s) and not of MDPI and/or the editor(s). MDPI and/or the editor(s) disclaim responsibility for any injury to people or property resulting from any ideas, methods, instructions or products referred to in the content. |
© 2023 by the authors. Licensee MDPI, Basel, Switzerland. This article is an open access article distributed under the terms and conditions of the Creative Commons Attribution (CC BY) license (https://creativecommons.org/licenses/by/4.0/).
Share and Cite
MDPI and ACS Style
Abbaszadeh, H.; Norouzi, R.; Sume, V.; Kuriqi, A.; Daneshfaraz, R.; Abraham, J. Sill Role Effect on the Flow Characteristics (Experimental and Regression Model Analytical). Fluids 2023, 8, 235. https://doi.org/10.3390/fluids8080235
AMA Style
Abbaszadeh H, Norouzi R, Sume V, Kuriqi A, Daneshfaraz R, Abraham J. Sill Role Effect on the Flow Characteristics (Experimental and Regression Model Analytical). Fluids. 2023; 8(8):235. https://doi.org/10.3390/fluids8080235
Chicago/Turabian StyleAbbaszadeh, Hamidreza, Reza Norouzi, Veli Sume, Alban Kuriqi, Rasoul Daneshfaraz, and John Abraham. 2023. "Sill Role Effect on the Flow Characteristics (Experimental and Regression Model Analytical)" Fluids 8, no. 8: 235. https://doi.org/10.3390/fluids8080235