
CFD Simulation of a Hybrid Solar/Electric Reactor for Hydrogen and Carbon Production from Methane Cracking

Processes, Materials and Solar Energy Laboratory, PROMES-CNRS, 7 Rue du Four Solaire, 66120 Font Romeu, France
*
Author to whom correspondence should be addressed.
Fluids 2023, 8(1), 18; https://doi.org/10.3390/fluids8010018
Submission received: 26 October 2022
/
Revised: 23 December 2022
/
Accepted: 26 December 2022
/
Published: 2 January 2023
(This article belongs to the Special Issue Recent Advances in Fluid Mechanics: Feature Papers, 2022)
Abstract
:Methane pyrolysis is a transitional technology for environmentally benign hydrogen production with zero greenhouse gas emissions, especially when concentrated solar energy is the heating source for supplying high-temperature process heat. This study is focused on solar methane pyrolysis as an attractive decarbonization process to produce both hydrogen gas and solid carbon with zero CO2 emissions. Direct normal irradiance (DNI) variations arising from inherent solar resource variability (clouds, fog, day-night cycle, etc.) generally hinder continuity and stability of the solar process. Therefore, a novel hybrid solar/electric reactor was designed at PROMES-CNRS laboratory to cope with DNI variations. Such a design features electric heating when the DNI is low and can potentially boost the thermochemical performance of the process when coupled solar/electric heating is applied thanks to an enlarged heated zone. Computational fluid dynamics (CFD) simulations through ANSYS Fluent were performed to investigate the performance of this reactor under different operating conditions. More particularly, the influence of various process parameters including temperature, gas residence time, methane dilution, and hybridization on the methane conversion was assessed. The model combined fluid flow hydrodynamics and heat and mass transfer coupled with gas-phase pyrolysis reactions. Increasing the heating temperature was found to boost methane conversion (91% at 1473 K against ~100% at 1573 K for a coupled solar-electric heating). The increase of inlet gas flow rate Q0 lowered methane conversion since it affected the gas space-time (91% at Q0 = 0.42 NL/min vs. 67% at Q0 = 0.84 NL/min). A coupled heating also resulted in significantly better performance than with only electric heating, because it broadened the hot zone (91% vs. 75% methane conversion for coupled heating and only electric heating, respectively). The model was further validated with experimental results of methane pyrolysis. This study demonstrates the potential of the hybrid reactor for solar-driven methane pyrolysis as a promising route toward clean hydrogen and carbon production and further highlights the role of key parameters to improve the process performance.
1. Introduction
Most of the hydrogen demand worldwide is mainly produced by steam methane reforming (SMR) [1]. Although this route is still the most economical, the derived greenhouse gas emissions represent a significant concern [2]. Environmental norms involve capture and sequestration of the produced CO2 (CCS) in underground depositories located in unpopulated areas. Such sequestration techniques are still not efficient enough for safe and long-term storage [3]. Moreover, this obligation implies additional cost to the process [4]. On the other hand, water splitting (electro/thermo/photo-chemical) for hydrogen production has also been investigated because of its green asset. Such a process does not generate any CO2. Although it could be promising in the future thanks to relative water abundance on earth, the hydrogen production cost is higher than in common routes (1.81 $/kg H2 and 1.98 $/kg H2 from SMR without and with CO2 sequestration, respectively, against 3.38 $/kg H2 from water electrolysis using wind energy) [5,6].
Among the other interesting pathways for potentially clean hydrogen production, methane cracking is especially suitable because it is an endothermic reaction yielding both solid carbon and hydrogen gas (Equation (1)) [7,8,9,10]. Therefore, methane pyrolysis is clean if the heating source is derived from a renewable energy such as concentrated solar energy [11,12,13]. Regardless of the heating means, there are two possibilities to dissociate methane: conventional gas-phase (or solid/gas-phase in case there is a solid catalyst) or molten media methane pyrolysis [6]. Both routes can involve either catalytic or non-catalytic reactions. Pyrolysis in molten media (e.g., liquid metals) is mainly suggested to enhance heat transfer in the reactor and carbon separation at the liquid surface. In conventional pyrolysis, some limitations hinder process stability. A gas phase has generally weaker heat transfer rates than liquids. Moreover, reactor clogging and catalyst coking (if used) are possible locks in conventional pyrolysis [14,15,16]. Such issues might be overcome by pyrolysis in molten metals/salts. Herein, methane is bubbled, and thus decomposes while rising in a hot liquid bath. The molten medium can be either a molten metal (such as tin [17,18,19], magnesium [20], tellurium [21], or metallic alloys [22,23]), a molten salt (KCl, KBr, NaCl, NaBr, etc.) [24,25,26], or a molten metal phase overlaid by a molten salt [27]. Others used catalytic solid metals dispersed in molten media [28]. Thus, heat transfer may be improved, hydrogen is released with outlet gases, and carbon floats on the surface of the bath due to the difference of density [29]. This pathway is still new, quite challenging, and not thoroughly investigated to date [6].
Both cracking routes allow operation at high temperatures in a wide range with no CO2 emissions thanks to solar heating [8,30,31]. High operating temperatures eliminate the need for catalysts, since methane molecules dissociate entirely above 1673 K for long-enough residence time. This phenomenon is known as the thermal decomposition of methane (decomposition under only the effect of temperature) [32]. Alternatively, the use of metal- [33,34] or carbon-based catalysts [35,36,37,38] appears as an option to reduce the operation temperature to around 1273 K. However, solar direct normal irradiance (DNI) variations caused by weather changes may hinder the process continuity. A hybrid solar/electric reactor appears as a possible solution for continuous and stable processing under fluctuating solar irradiation conditions [39,40]. Methane pyrolysis in a novel hybrid solar/electric reactor was considered in this work. The reactor was modeled by computational fluids dynamics (CFD) in the case of gas-phase pyrolysis to assess the influence of various process parameters including temperature, gas residence time, methane dilution, and hybridization on the methane conversion. Consequently, the main influencing factors affecting methane pyrolysis were considered in CFD simulations. The model combines fluid flow hydrodynamics and heat and mass transfer coupled with gas-phase pyrolysis reaction. Experimental validation was further considered by comparing simulation results with experimentally measured methane conversions under different conditions. The objective of this study was to demonstrate the potential of the hybrid reactor for solar-driven methane pyrolysis as a promising route toward clean hydrogen and carbon production, and to assess the impact of key operating parameters affecting the process performance.
2. Design of the Hybrid Reactor
Coupling electric and solar heating in the same reactor design allows operation with a variable DNI by compensating solar energy fluctuations with electric heating. In addition, for a non-solar operation, methane pyrolysis should still be possible thanks to electric heating, thus enabling round-the-clock operation. On the other hand, in the case of sufficient DNI, both solar and electric heating can be activated simultaneously. Therefore, the heating is more efficient throughout a larger part of the reactor. Then, the reaction zone (heated zone) also becomes enlarged, thus increasing the effective gas residence time inside the reaction zone, which may improve the methane conversion. This unique design is applicable for both conventional and molten media methane pyrolysis.
Figure 1a,b shows the hybrid reactor configuration. Two coaxial tubes, the outermost being closed at one end, are centered in an insulated circular layer to reduce conductive heat losses to the environment. The tubes are made of alumina (Al2O3) to allow operation at high temperatures (1273–1673 K). Heating is possible using either a solar cavity receiver or an electric heater located a few centimeters below the cavity, or even using both heating modes when DNI is not high enough for a fully on-sun operation. The height of the electric heater set at the bottom of the reactor is 115 mm. The maximal power of the heater is 400 W, which is high enough to reach temperatures in the range of 1273–1673 K. Then, a 25 mm-thick insulation layer is set between the electric heater and the solar cavity. The height of this cavity is 50 mm, with an aperture of 15 mm (Figure 1) for concentrated solar radiation entrance. The cavity absorbs the concentrated solar flux received from a 1.5 kW (thermal) heliostat-parabola solar system (2 m diameter parabolic dish with a peak concentration ratio of about 10,000).
For experimental processing, solar and electric heating are both achieved progressively and slowly enough to avoid thermal shocks in the reactor. The average time of reactor heating is almost 30–40 min to reach the operating temperature (1273–1473 K). Solar and electric heating are controlled through an adjustable shutter (input solar power) and a command box with variable current and voltage (input electric power), respectively. It should be noticed that, for the experimental validation part of this work, only electric heating was applied. The reactive gas flows downward in the inner tube and then upward in the annular space between both tubes.
For the reactor design, simulations were performed using computational fluid dynamics (CFD) simulations (using ANSYS Fluent, Canonsburg, WA, USA). Numerical simulation results of the hybrid reactor achieved in the case of gas-phase pyrolysis revealed promising thermochemical performance.
3. Modeling and Simulation Methods
3.1. System Geometry
The model geometry of the hybrid reactor described in Figure 1 was developed and designed to provide a fast-enough convergence of the Fluent solver. Only the tubular reaction zone was simulated. In particular, the solar cavity receiver and the electric heater were not implemented. In place, the wall temperature was set as a boundary condition. Constant wall temperature was chosen as a first approach because homogeneous temperatures are expected when reaching thermal equilibrium, both in the solar cavity (black-body behavior, heated length corresponding to the cavity height: 50 mm) and in the electric heater (uniform heating along the coil, the effective heated length of the electric resistance was assumed to be 85 mm).
Figure 2 represents the 2D axisymmetric geometry of the reactor designed through Design Modeler software. The inner tube has a thickness of 1.5 mm, an inner diameter of 3 mm, and a length of 310 mm. The outer tube has a thickness of 2.5 mm, an inner diameter of 25 mm, and a length of 320 mm. All faces (solid walls + interior of the tubes) were meshed as quadrilaterals of 0.6 mm size (reference case), as shown in Figure 3. In addition, other finer and coarser quadrilateral meshing of 0.2 mm, 1 mm, 2 mm, 3 mm, and 4 mm mesh sizes were tested to check the independence of the results on the grid, more particularly regarding the chemical conversion of methane (Figure 3). The results of grid independence study are provided in the Results and Discussion section. Insulation layers are perfectly insulated walls with the heat flux boundary condition set to zero in the Fluent solver. In parallel, the top parts of both tubes are water-cooled, and thus a fixed boundary temperature condition of 300 K is assigned to each. The walls standing for the electric heater (85 mm height) and the solar cavity (50 mm height) are defined with a fixed temperature (equal to the desired heating temperature for pyrolysis).
3.2. Modelling Methods
3.2.1. Species, Models, and Boundary Conditions
Methane, argon, hydrogen, and solid carbon were selected from the FLUENT database. Intermediate products such as acetylene, ethylene, etc., were not considered.
The simulation was converged in steady state and in axisymmetric 2D space. The gravity was enabled and set to 9.81 m/s2. Reynolds number of the flow varies with the medium temperature because the latter affects the dynamic viscosity of the gas (μ = 1.1 × 10⁻⁵ Pa.s at T = 300 K and μ = 2.53 × 10⁻⁵ Pa.s at T = 1473 K). Reynolds number calculations for the gas flow mixture in both coaxial tubes reveal a laminar flow, thus the laminar model was chosen (Re = 311–135 in the inner tube vs. Re = 2–4 in the outer tube annular space). Concerning the radiation model, discrete ordinates (DO) was adapted to allow for radiative heat transfer between the fluid zone and the inner solid parts of the reactor. Species transport was enabled, and a mixture template was set for the reaction. The methane cracking reaction was considered as a first order reaction, and a finite rate (Arrhenius type) was set with an activation energy of 281 kJ/mol and a pre-exponential factor of 2 × 10¹⁰ s−1 [32,41]. Behind these models, there are mainly three transport conservation equations solved in CFD: (i) conservation of mass, also known as continuity equation, (ii) conservation of momentum, and (iii) conservation of energy. These equations are expressed as follows [42]:
Continuity equation:
where is the density of the fluid mixture (kg/m3) and is the flow velocity vector field (m/s). The latter can be calculated through Equation (3):
where n is the total number of existing species, k is the index for species k, is its volumetric fraction, is its relevant density, and is its velocity vector field.
The density of the mixture is defined by:
Conservation of momentum:
where is an eventual external force (N), p is the static pressure (Pa), is the gravitational acceleration vector (m/s2), is the fluid mixture viscosity (kg/m/s), and is the derivative velocity of species i (m/s). The mixture viscosity is written in Equation (6):
Energy conservation equation:
where represents the conductive heat transfer, while represents every other heating source. is the effective conductivity (W/m/K) and can be defined as follows:
where is the turbulent conductivity, which is actually equal to zero in this study, since the flow is laminar (Re < 2000).
For the ideal incompressible gas model, pressure loss in the reactor is negligible, therefore where the latter is the sensible enthalpy of species k (J/kg).
The radiative heat transfer was computed based on the discrete ordinates model, whose equation is:
where is the position vector, is the direction vector, is the diffusion direction vector, is the path length (m), is the absorption coefficient (1/m), n is the refraction index, is the diffusion coefficient (1/m), is the Stefan–Boltzmann constant (5.672 × 10⁻⁸ W/m2·K4), is the total luminescence (W/m2/sr), T is the local temperature (K), is the phase function, and is the solid angle (steradian).
The reaction rate was computed using an Arrhenius expression given in Equation (10) coupled with the conservation equations. The chemistry was thus coupled with the heat and mass transfer via the net rate of production/consumption of each species by chemical reaction [42].
where r is the reaction rate, k is the kinetic constant, A is the pre-exponential factor (s−1), Ea is the activation energy (J/mol), R is the universal gas constant (8.314 J/mol·K), and T is the operating temperature (K).
Assuming a plug flow reactor (PFR), k can be calculated as follows:
where α is the chemical expansion factor and τ is the gas (methane + argon) space-time.
The boundary conditions of the model are detailed in Figure 2. Heating wall temperature was set to the desired operating temperature. For the base case, a 1 m/s inlet velocity in the inner tube was defined (equivalent to 0.42 NL/min flow rate). In the species, inlet methane mole fraction was set to 0.5, the rest being argon. The outlet was simulated as an outflow. A value of 10−6 was chosen for residuals to warrant satisfactory convergence.
3.2.2. Parametric Study
The effect of reactor hybridization via coupled solar-electric heating, residence time, methane dilution, and temperature was studied. In order to provide insights into the associated trends in the conversion of methane, a reference case was first simulated (Table 1). In this case, referred to as case 1, both heating sources (electric and solar) were enabled with a fixed wall temperature of 1473 K. The initial total inlet volumetric flow rate was 0.42 NL/min (CH4 + Ar), while the molar fraction of methane was 0.5. Other cases were simulated as described in the following paragraph.
To illustrate the effect of hybridization (case 2), solar heating was turned off (the solar cavity was assumed as an insulated wall), while the total inlet flow rate and the species mole fraction in the reacting flow were kept constant. This approach was used to clearly identify the difference between a reactor with only one heating source and a hybrid one with both solar and electric heating. To investigate the gas residence time effect (case 3), the total inlet flow rate was varied. A different flow rate indeed modifies the gas velocity in the reactor tubes, which implies a different gas residence time (the total flow rate was doubled in case 3). The dilution effect can be examined by changing the inlet methane molar fraction while keeping the inlet total flow rate constant (inlet methane mole fraction was reduced to 0.3 in case 4). Finally, the temperature effect can be readily studied by increasing the heating temperature of both the electric and solar heating zone (this temperature was set to 1573 K in case 5). The effect of meshing quality on methane conversion in the reactor was checked separately in Section 4.1 (grid independence study).
4. Results and Discussion
The first section focuses on the mesh independence study. Once the quality of the mesh was successfully checked, a study on the model sensitivity to the activation energy was achieved in order to confirm the suitability of the considered kinetic rate law of methane decomposition. Then, the numerical model was validated based on a comparison with the results of an experimental work to demonstrate its ability to predict relevant results. Once validated, different operating conditions were simulated to investigate the effect of various parameters. Table 2 recaps the results of the numerical simulations. Telectric and Tsolar are the temperatures of heating in the electric and the solar section, respectively. Q0 is the total inlet volumetric flow rate, and y0,CH4 is the methane mole fraction in the inlet gas mixture. The mesh size is also reported. The effective residence time is the time spent in the reaction zone where operating conditions allow chemical reaction.
The total residence time in a reactor is given by:
where Vr is the total tubular reactor volume (150 × 10−6 m3), QT,P is the volumetric flow rate at the actual operating conditions (m3/s), Q0 is the total inlet flow rate at normal conditions (m3/s), P0 is the atmospheric pressure (101,325 Pa), T0 is the normal temperature (273 K), P is the operating pressure (Pa), and T is the operating temperature (K). The effective residence time corresponding to electric (τe) and solar (τs) heating zones can be calculated with the same expression as in Equation (12) by replacing Vr with the relevant heated volume only (the heated volume is relevant to the heated height: Vr-electric = 42 × 10−6 m3, Vr-solar = 25 × 10−6 m3). The summation of τe and τs is the total effective residence time, entitled τtotal. It is important to notice that these residence times were only calculated based on physical expansion of the gas (effect of both temperature and pressure). Chemical expansion due to the formation of H2 was not considered. XCH4 and YH2 are methane chemical conversion and hydrogen yield at the outlet, respectively. They can be calculated as follows:
where FCH4-in and FCH4-out are methane molar flow rates in the inlet and the outlet stream, respectively (mol/s). FH2-out is the hydrogen molar flow rate in the outlet stream (mol/s).
4.1. Effect of Mesh Size (Grid Independence Study)
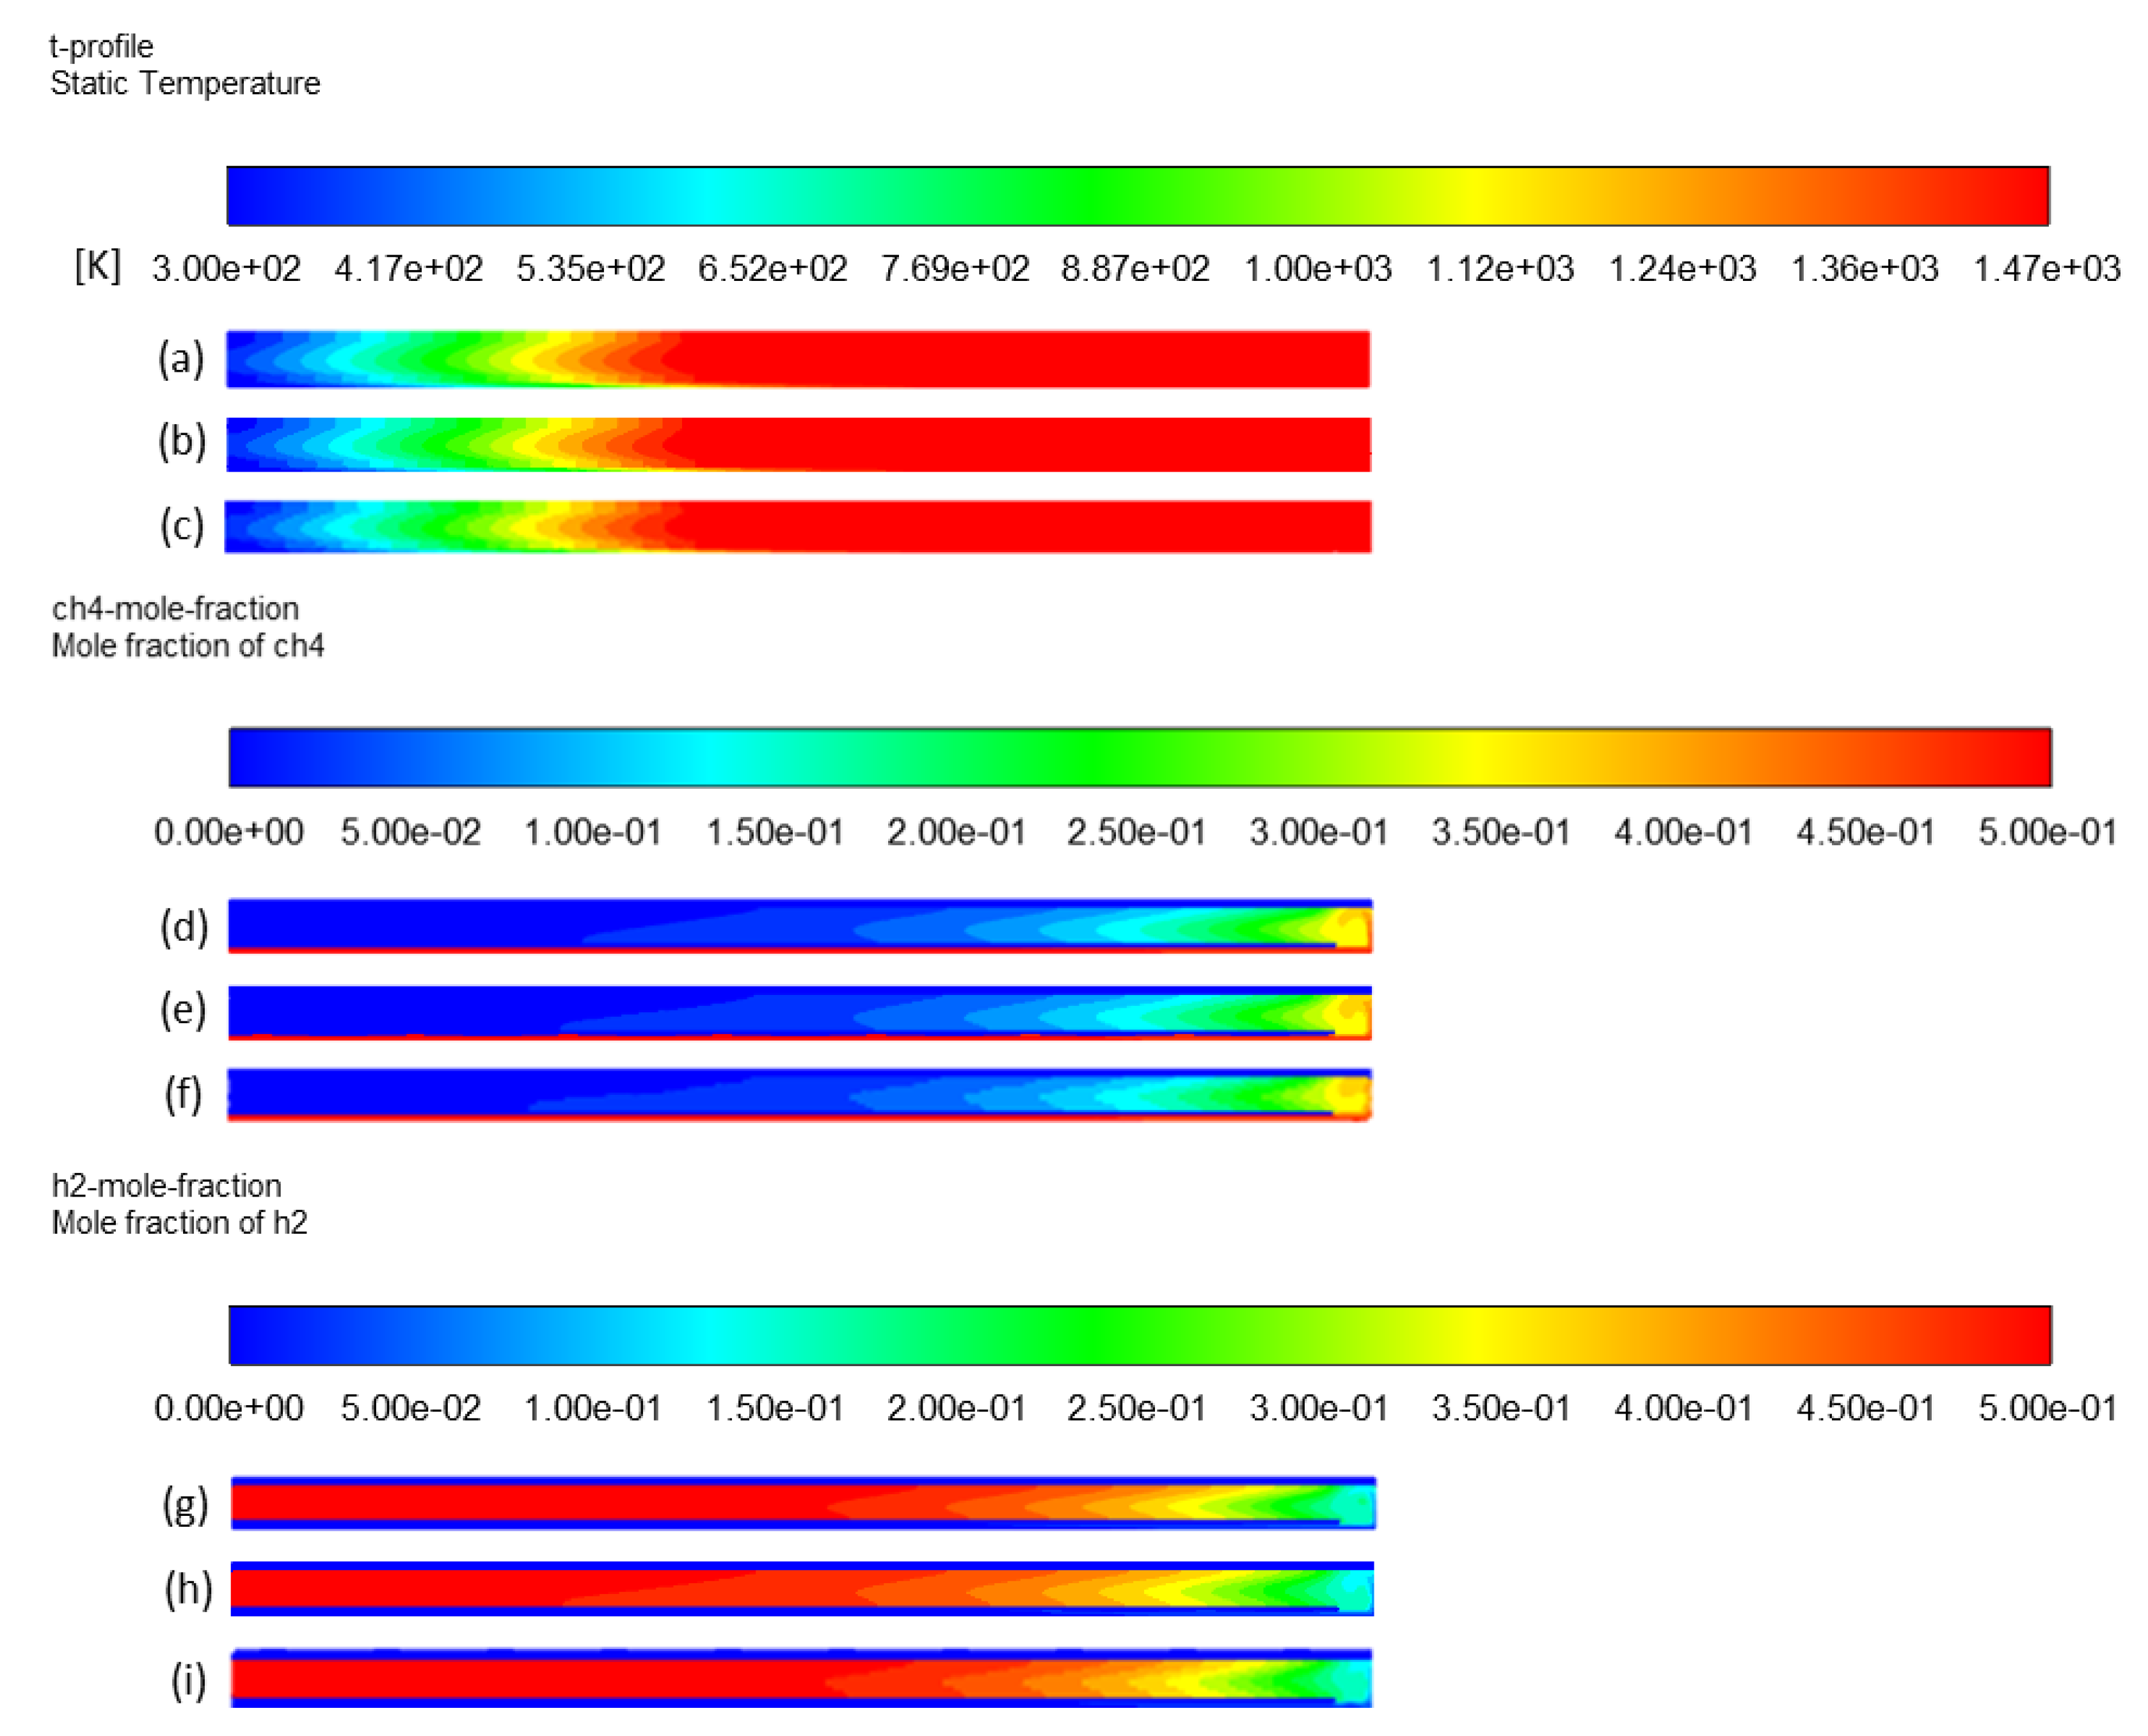
The independence of results (especially temperature, CH4 conversion, and H2 yield) on the meshing was checked using different sizes of quadrilateral meshes for both interior and solid walls. Reference mesh was of 0.6 mm size, and the finer one was 0.2 mm, whereas the larger ones were 1 mm, 2 mm, 3 mm, and 4 mm (Table 3). The convergence through Fluent was longer when decreasing the mesh size, as expected. For the largest meshing (with mesh size = 4 mm), the solver diverged, indicating that meshing was not fine enough nor appropriate for a physical convergence (Figure 4). In contrast, meshes of 0.2 mm, 0.6 mm, and 1 mm led to very similar results in terms of output species mole fractions (Table 3). However, coarser meshing was associated with higher errors. Results such as CH4 and H2 mole fractions, methane conversion, and temperature profile revealed no noticeable difference between 0.2 mm, 0.6 mm, and 1 mm meshes (Figure 5). For H2 yield in the outlet stream, calculations showed a slight decrease from 92% to 90% with the finer meshing, which is also insignificant. Consequently, one can say that the selected reference mesh (0.6 mm size) was a fair compromise between fast convergence and reliable results, as it was of good quality and fine enough to let the solver converge with minimal errors.
4.2. Model Sensitivity to Activation Energy
The kinetic model of methane pyrolysis may have a high impact on the simulation results. The activation energy Ea and the pre-exponential factor A used in Arrhenius law (Equation (10)) could indeed change results drastically. However, for simplification, the A value was fixed [32] while Ea was varied in order to get an accurate kinetic model for methane pyrolysis. Different values of Ea were reported (for uncatalyzed methane pyrolysis) in a very broad range (for example, Ea = 281 kJ/mol in [32], while Ea = 422 kJ/mol in [43]). The model sensitivity against Ea was studied to show the importance of choosing a proper kinetic model.
Four different values of Ea were studied (200–281–310–350 kJ/mol) at a fixed temperature (1473.15 K), gas inlet flow rate (0.5 NL/min), and methane inlet mole fraction (0.5). Only electric heating was activated. Results are shown in Figure 6.
Based on Arrhenius law, Ea is inversely proportional to the reaction rate of methane decomposition. Increasing Ea decreases the reaction rate and results in lower methane conversion and hydrogen yield. CFD simulation confirmed such a tendency and showed complete methane conversion and hydrogen yield with Ea = 200 kJ/mol and decreasing performance as Ea was increasing. With Ea value of 350 kJ/mol, there was almost no methane decomposition (XCH4 = 2% and YH2 = 1%).
The aim of this sensitivity analysis was to validate the value of the activation energy chosen in the kinetic model based on experimental data. Thus, an experimental run was conducted with electric heating under the same operating conditions (i.e., temperature = 1473 K, gas inlet flow rate = 0.5 NL/min, and methane inlet mole fraction = 0.5) and resulted in 71% methane conversion and 65% hydrogen yield. Such a result was obviously very close to the numerical one when Ea was 281 kJ/mol [28] (XCH4 = 68% and YH2 = 68%). Therefore, one can consider that the selected kinetic model (with Ea = 281 kJ/mol [28]) is relevant to simulate methane cracking in the reactor.
4.3. Experimental Validation of the Model
The reliability of the model simulations was addressed and validated with an experimental study. The aim was to compare the simulation with experimental results regarding both the effect of heating temperature (1273–1573 K) and inlet gas flow rate (0.5–1 L/min) on methane conversion and hydrogen yield. Methane pyrolysis was experimentally studied in the reactor with an electric heating, as shown in the geometry in Figure 2. No solar heating was applied. Instead, insulation rings (polycrystalline mullite/alumina wool (PCW) and special inorganic fibers and binders) replaced the solar heating zone. For both studies (numerical and experimental), there was only electric heating (case 2 in Table 1) with a fixed methane inlet fraction (y0,CH4 = 0.5). Two different parameters were studied: (i) the temperature (T = 1273–1373–1473–1573 K) at a fixed methane inlet fraction (y0,CH4 = 0.5) and gas inlet flow rate (Q0 = 0.5 NL/min), and (ii) the gas inlet flow rate (Q0 = 0.5–0.75–1 NL/min) at a fixed temperature (T = 1573 K) and a fixed methane inlet fraction (y0,CH4 = 0.3).
Figure 7 shows the comparison of the numerical model with the experimental performance of the reactor. In Figure 7a, a high degree of coherence can be observed between numerical and experimental results in terms of both methane conversion and hydrogen yield at all temperatures. For instance, at 1373 K, numerical and experimental values of methane conversion and hydrogen yield were very close (XCH4 = 31% vs. 30% and YH2 = 30% vs. 27%). At the other temperatures, the results were also consistent (for example, at 1573 K: XCH4 = 96% vs. 91% and YH2 = 96% vs. 89%). The small gap between simulation and experiments might arise from several factors. In particular, the simulation does not consider partial decomposition of methane, which, in fact, results in some secondary intermediate hydrocarbons (C2H2, C2H4, and C2H6).
In Figure 7b, the numerical model still fits the experimental data with higher differences in terms of hydrogen yield, because the simulation does not consider secondary byproducts (such as secondary hydrocarbons C2Hm). It is thus normal that the experimentally measured values are lower than the simulation values, especially at higher kinetic rates (i.e., at lower flow rates). Thus, the highest difference between numerical and experimental values corresponds to Q0 = 0.5 NL/min (XCH4 = 99% vs. 93% and YH2 = 99% vs. 89%, respectively), while a more accurate fit between numerical and experimental performance is observed at Q0 = 1 NL/min (XCH4 = 86% vs. 85% and YH2 = 86% vs. 82%, respectively).
In summary, the experimental study shows very close results to those predicted by the numerical model. This experimental validation confirmed the suitability of the model to simulate the methane pyrolysis process in the hybrid reactor. Thus, the considered approach can be considered reliable to investigate methane cracking under specific operating conditions. Moreover, this model could be further developed to simulate methane cracking in molten media, which is a novel technology that has not been numerically modelled yet.
4.4. Effect of Hybridization
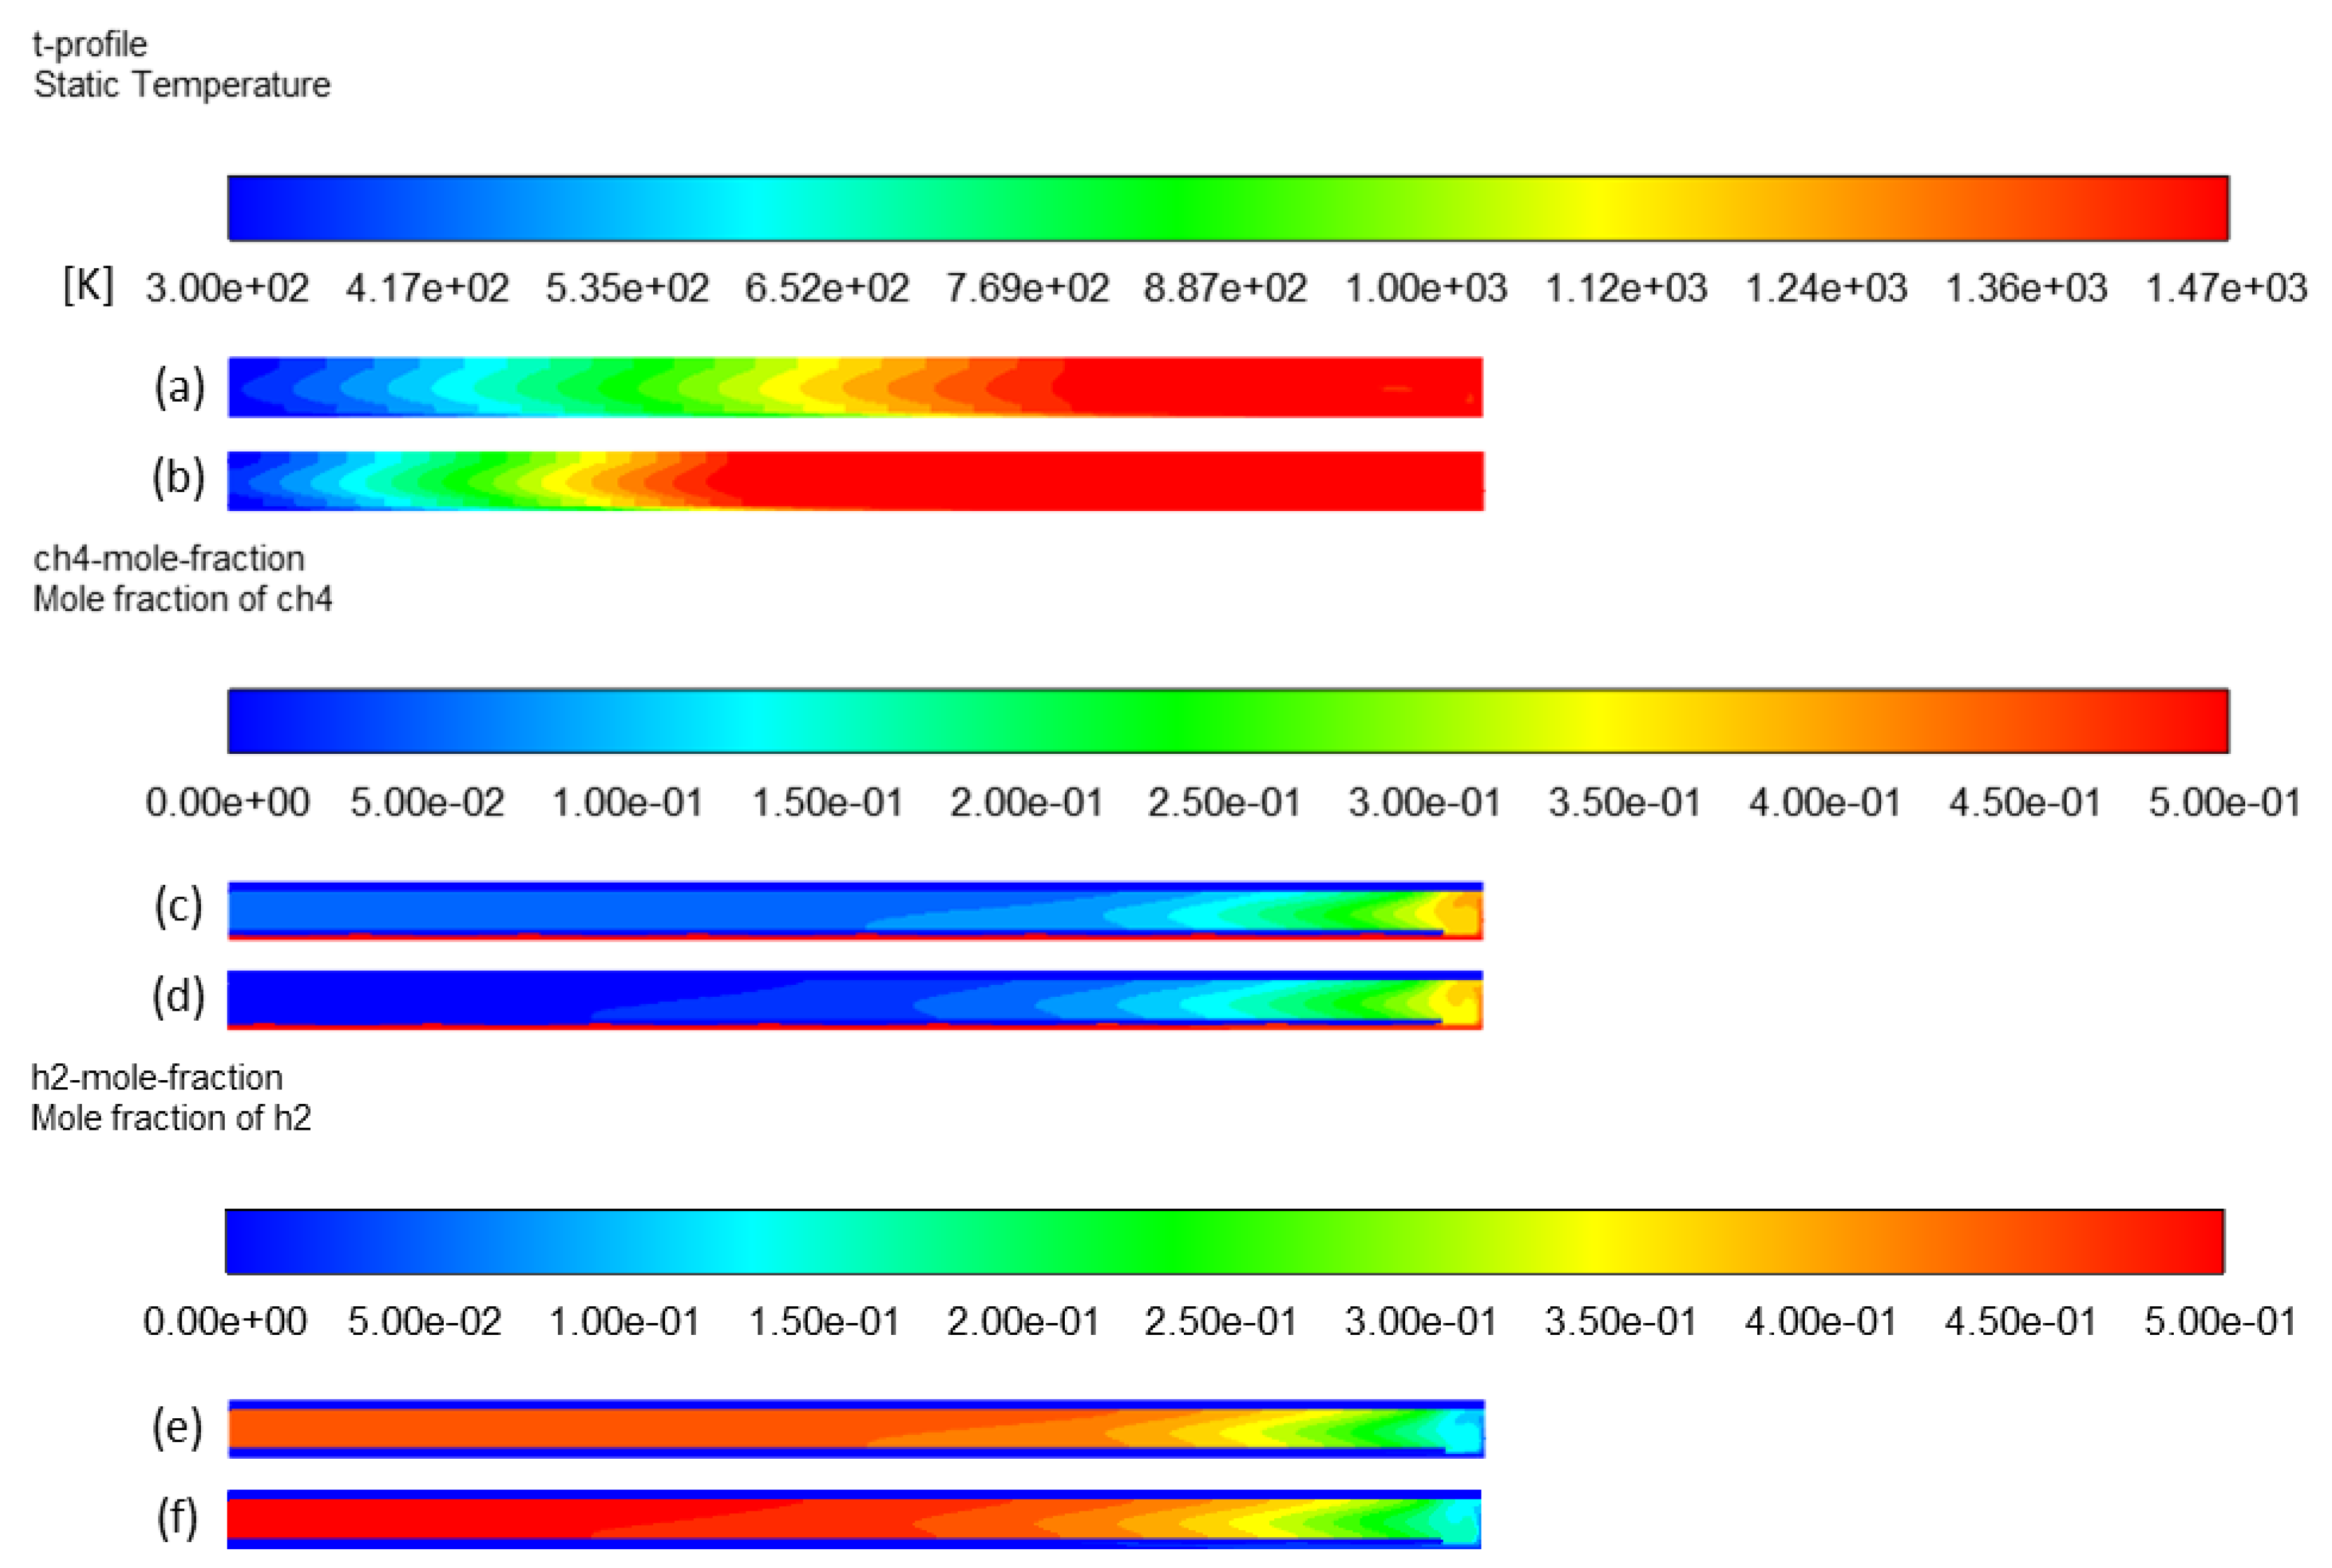
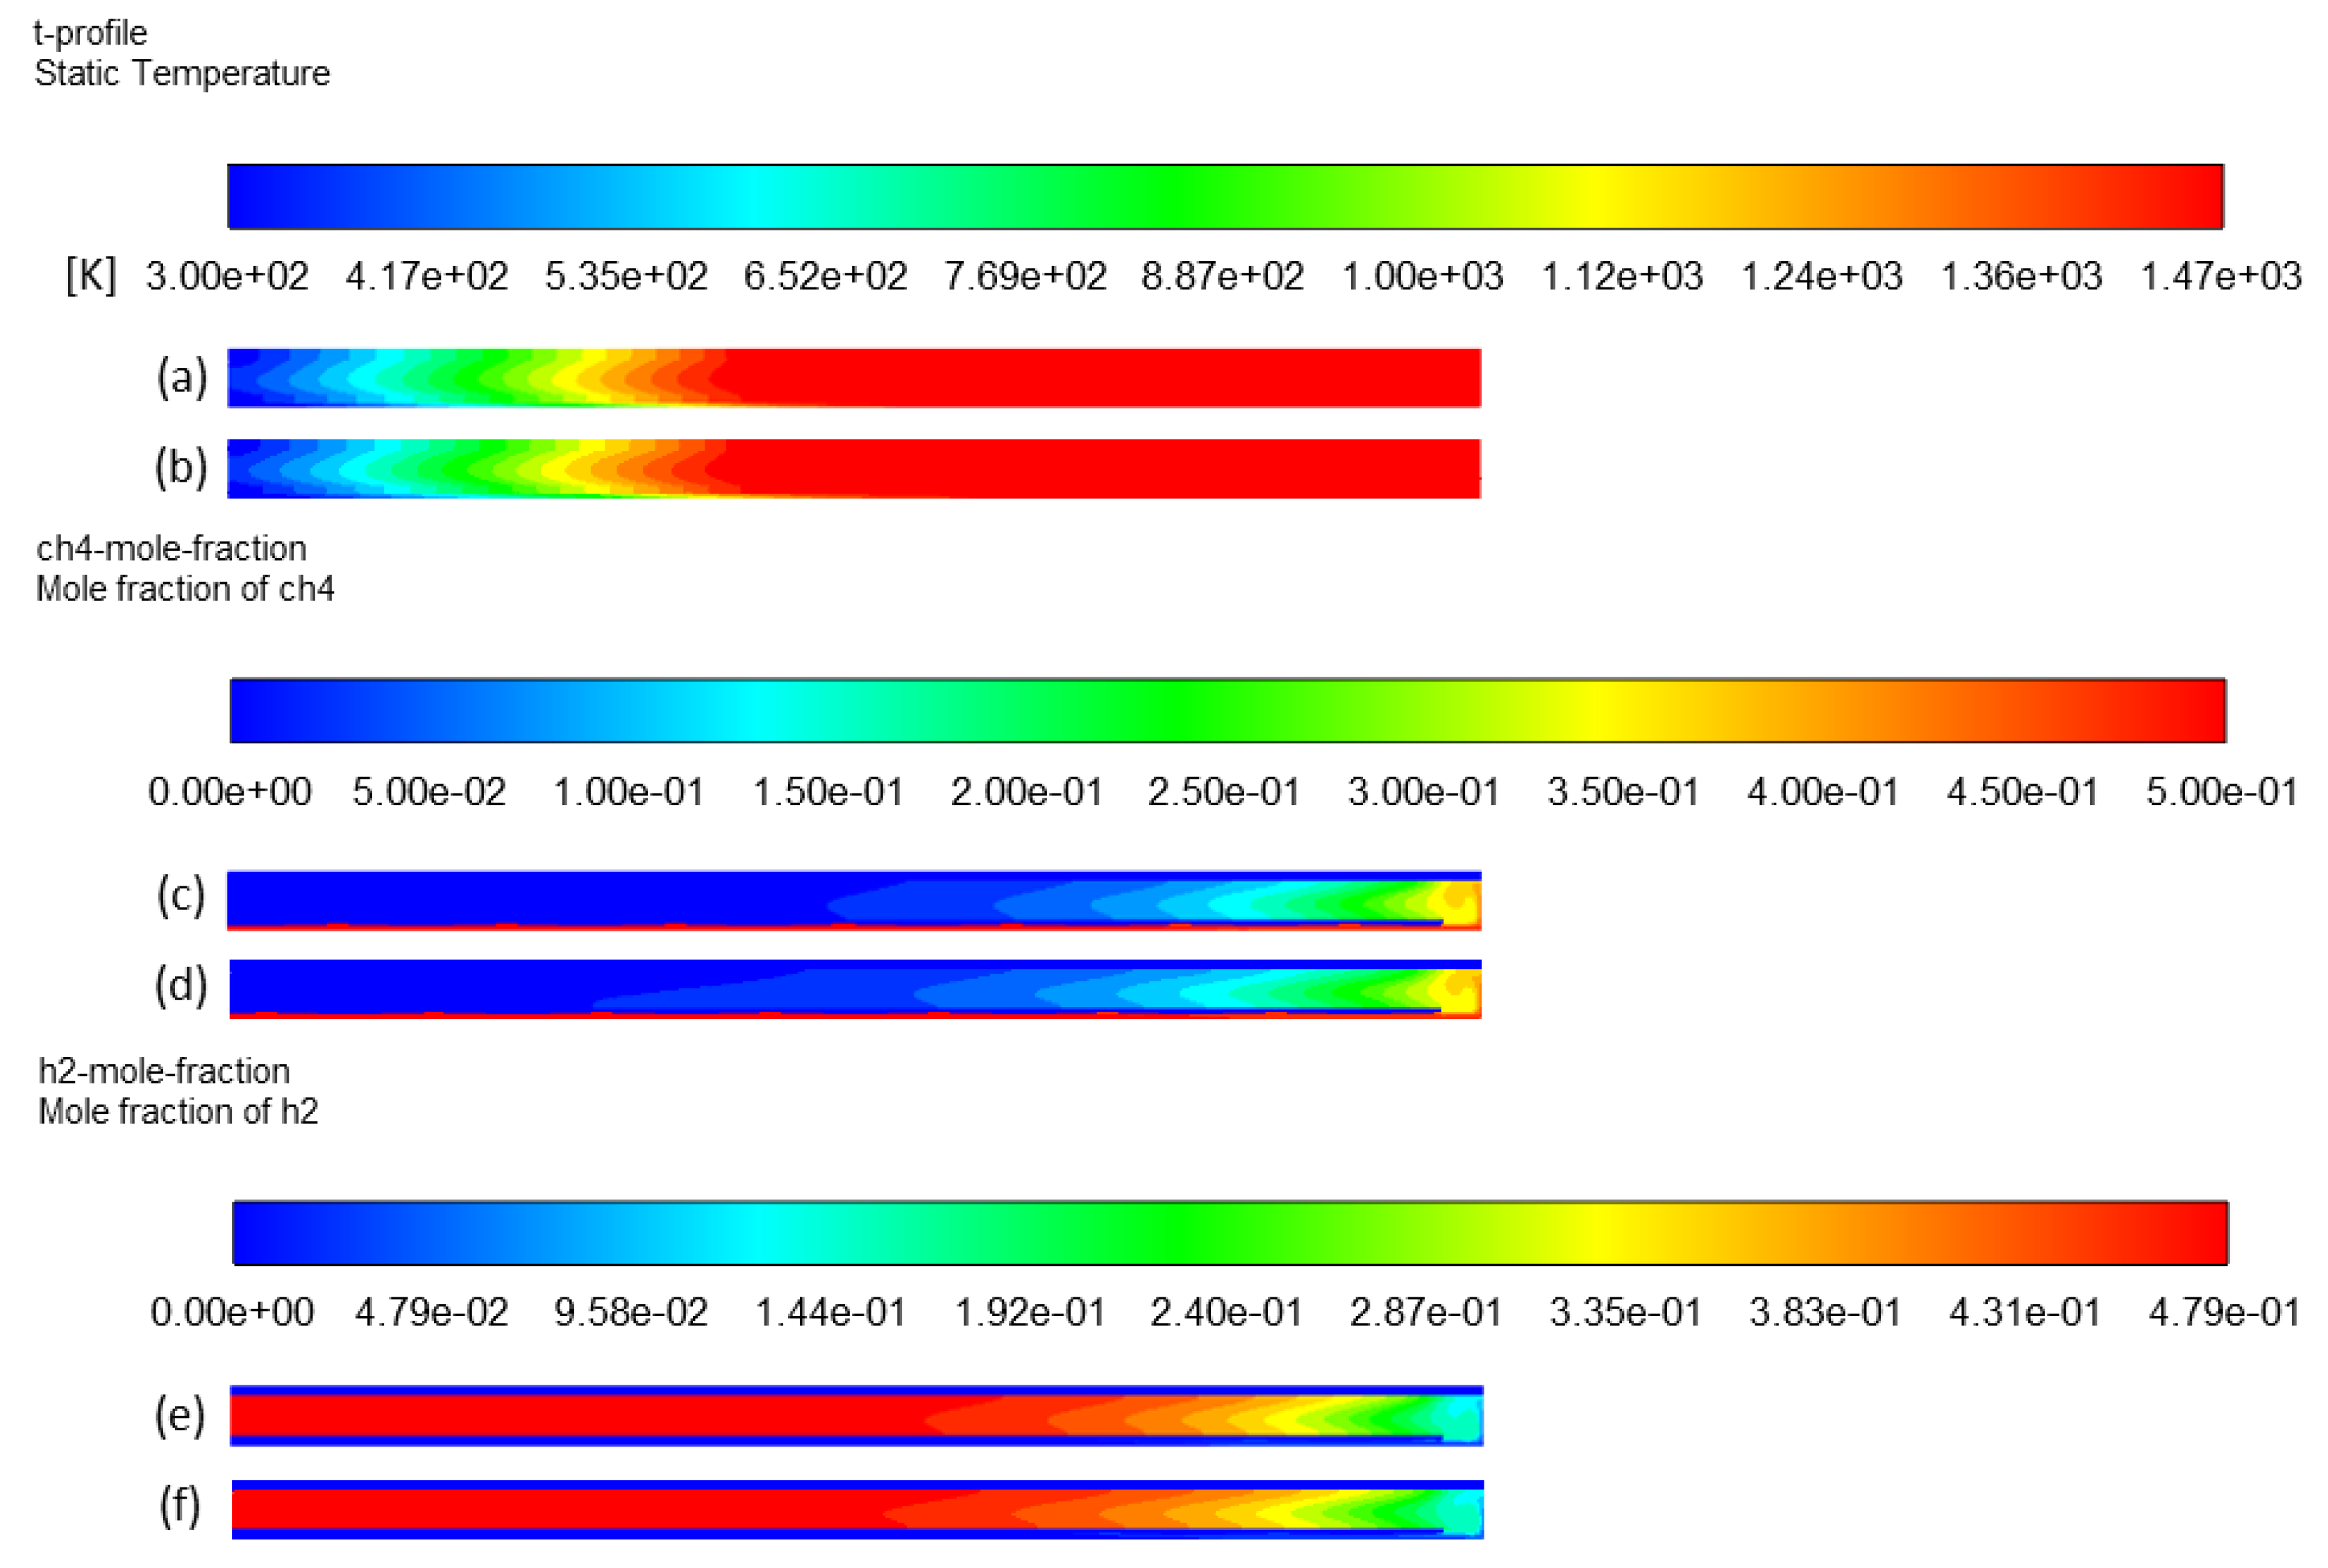
Figure 8a,b provides the temperature distribution throughout the entire reactor volume (fluid zone) when only electric heating is activated (case 2) compared to the case in which both heating sources are implemented (case 1). The heated length is longer in the latter case, as expected, because the additional heating zone extends the heated part. The reactional zone thus becomes larger, which increases the total effective residence time of methane molecules from 0.94 s (τe) to 1.5 s (τe + τs). Figure 8c–f shows higher methane conversion and hydrogen production in case 1 than in case 2. Methane conversion significantly increases from 75% (case 2) to 91% (case 1), while hydrogen yield increases from 74% to 92%, as shown in Table 2.
The plots of temperature and outlet mole fractions of methane and hydrogen in the annular region of the tube along the x-axis are shown in Figure 9. The x-axis of the curves is actually the red line shown in Figure 9a. In Figure 9b, temperature plots were overlaid up to x = 0.1 m, which almost represents the end of the electric heating zone. Further from x = 0.1 m, toward the reactor outlet (x = 0.32 m), the temperature in the hybrid heating case (case 1) was much higher than in case 2. For instance, at x = 0.2 m, the temperature was still 1473 K in case 1, while T was lower than 1000 K in case 2. This was clearly caused by the solar heating in case 1 that enlarged the hot zone throughout the reactor. Such an effect improved the decomposition of methane. Therefore, a clear difference in methane and hydrogen outlet mole fractions is observed after x = 0.1 m (Figure 9c). Methane mole fraction continued to decrease down to 0.025 in case 1 (hybrid heating) vs. 0.075 in case 2 (electric heating only). In parallel, hydrogen mole fraction reached almost 0.47 in case 1 vs. only 0.42 in case 2.
4.5. Effect of Residence Time
The residence time effect was evidenced in the previous section by increasing the heated length, and thus the heated volume . Another approach to study this parameter consists of modifying the total inlet flow rate while fixing the methane mole fraction. Thus, a modification of the total flow rate Q0 changes the residence time. In case 3, Q0 was doubled (0.84 NL/min) in comparison to case 1. Thus, based on Equation (12), the resulting effective residence time was divided by two (0.75 s). CH4 and H2 mole fraction profiles (Figure 10c–f, respectively) confirm this effect on methane conversion. At a high inlet gas flow rate (0.84 NL/min), CH4 conversion and H2 yield drop from 91% to 67% and from 92% to 73%, respectively.
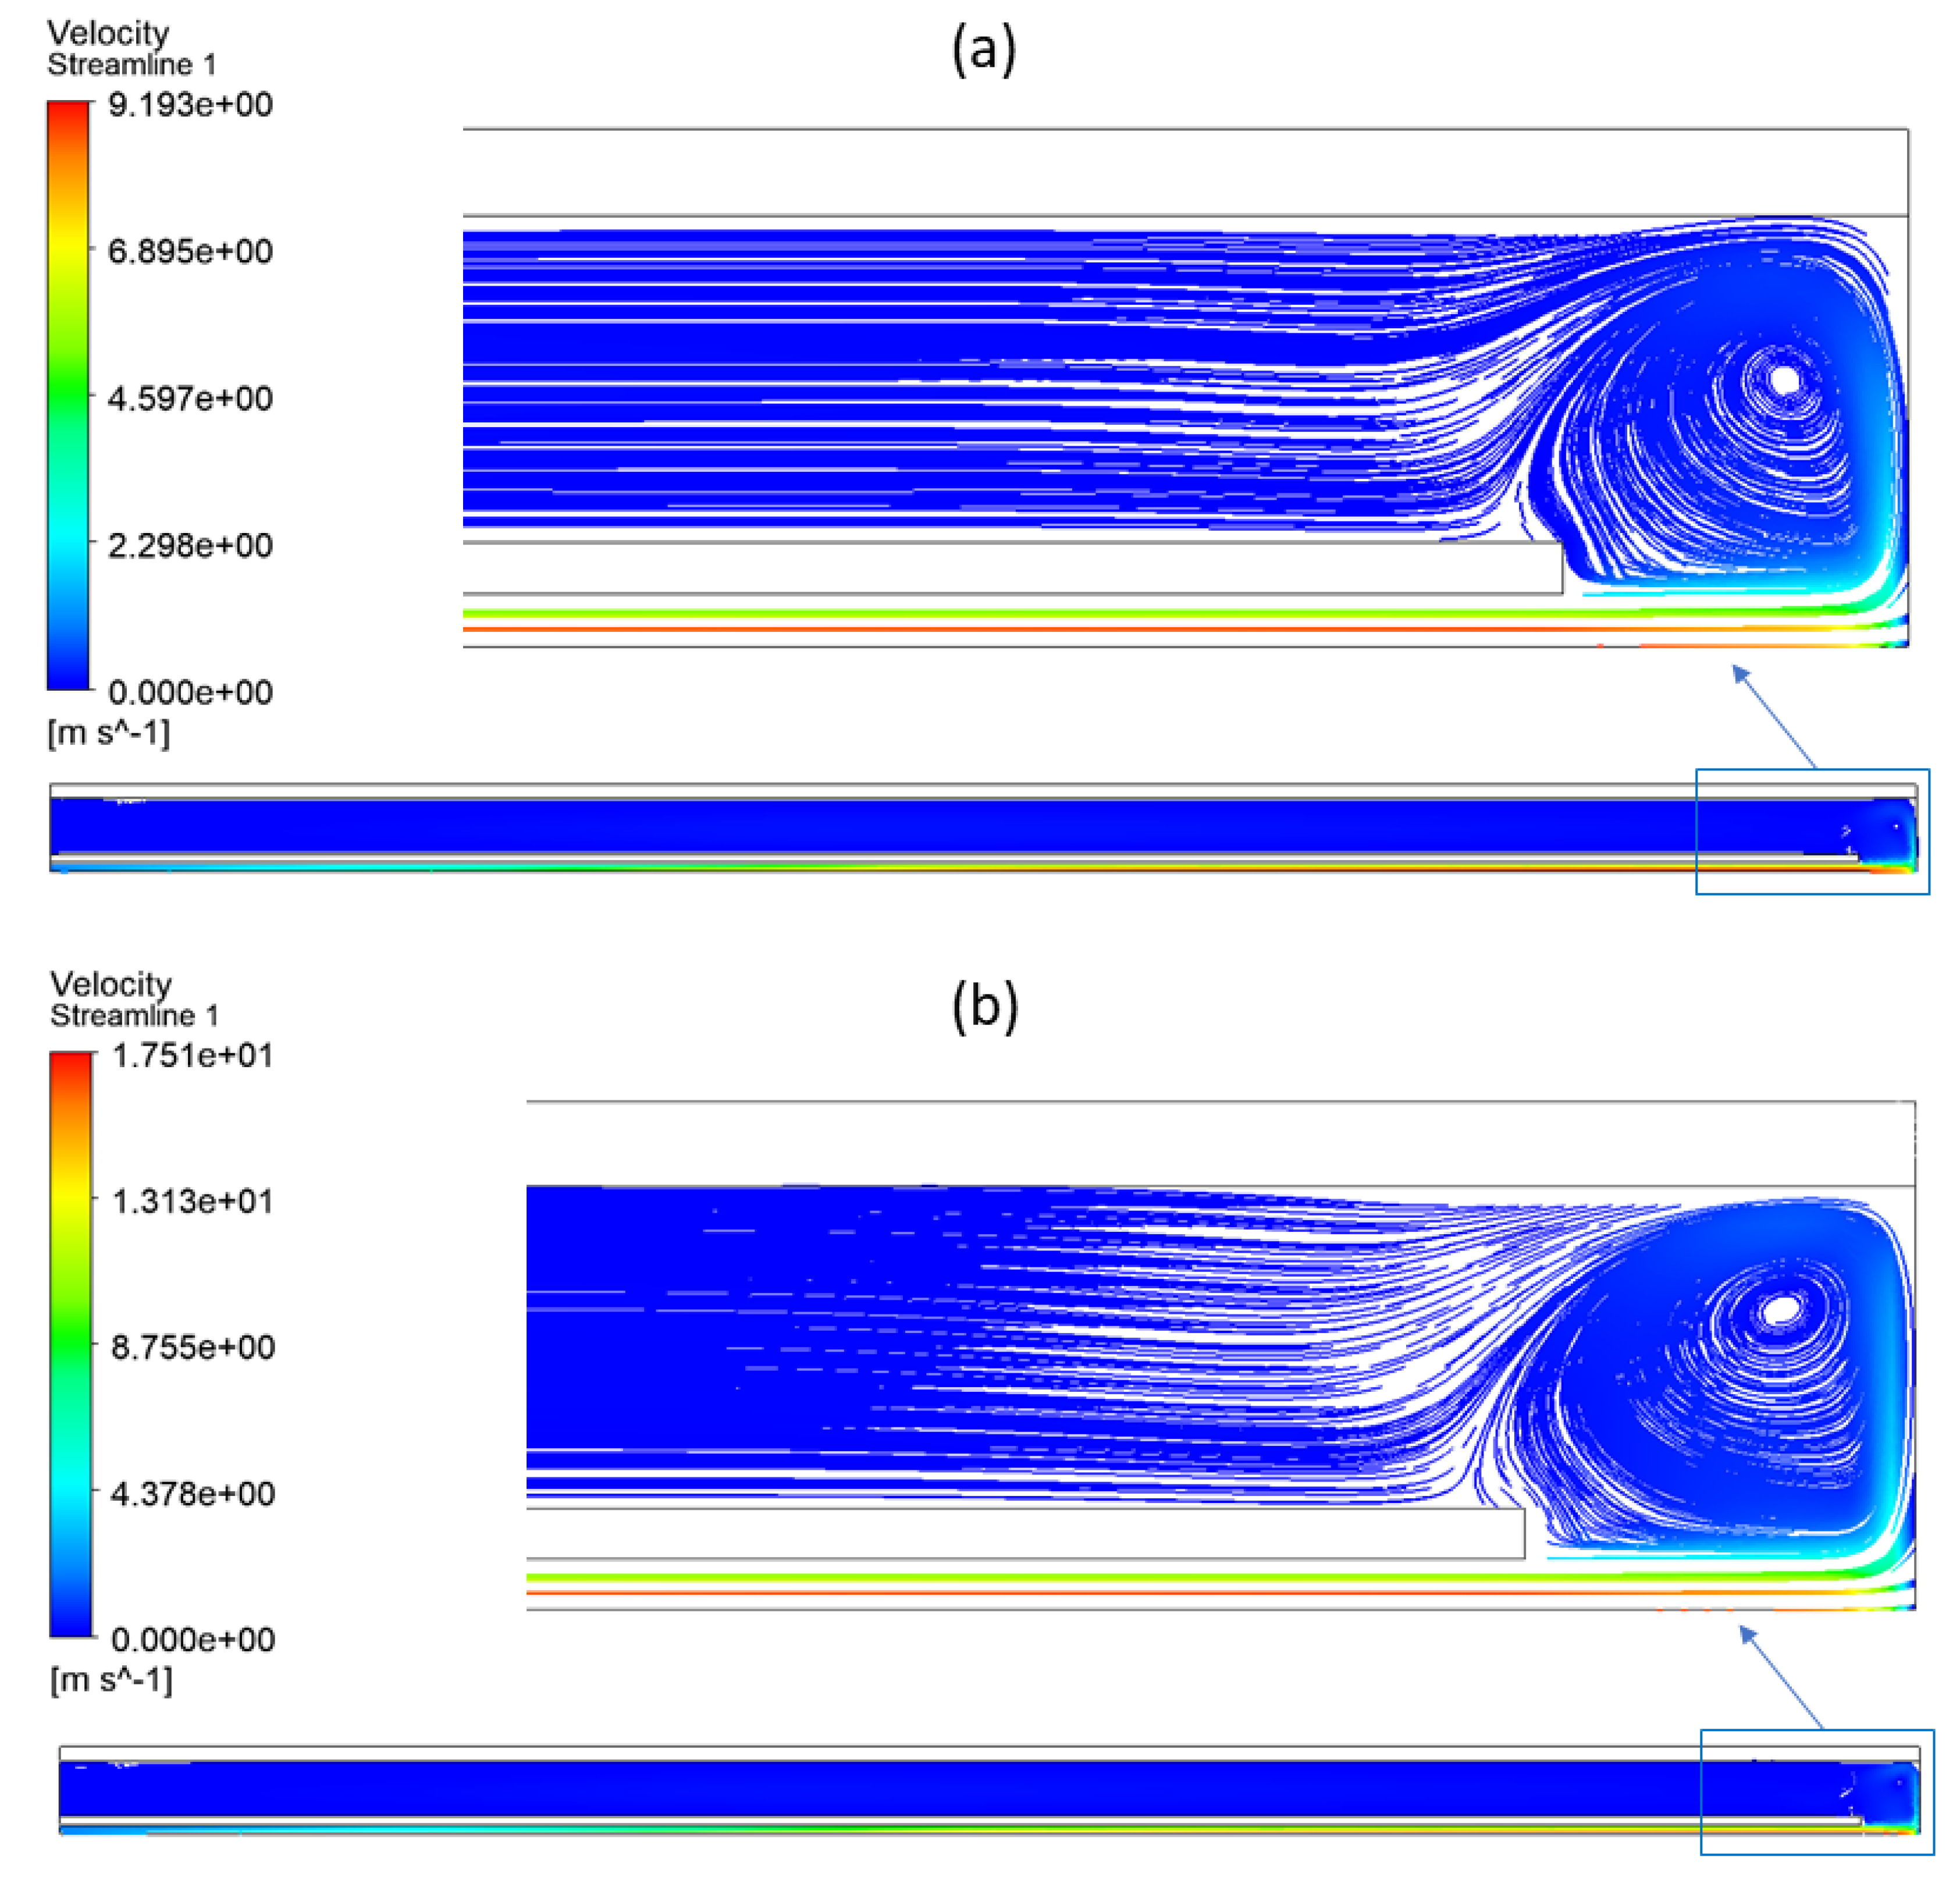
In fact, a higher gas velocity in the reactor decreased the residence time. Figure 11 represents the gas velocity (velocity streamlines) inside the reactor in both cases to emphasize the impact of Q0 on methane conversion. Regardless of the inlet flow rate (Q0), the velocity is higher in the inner tube since the cross section is smaller, and the velocity is maximal in the center and null near the walls.
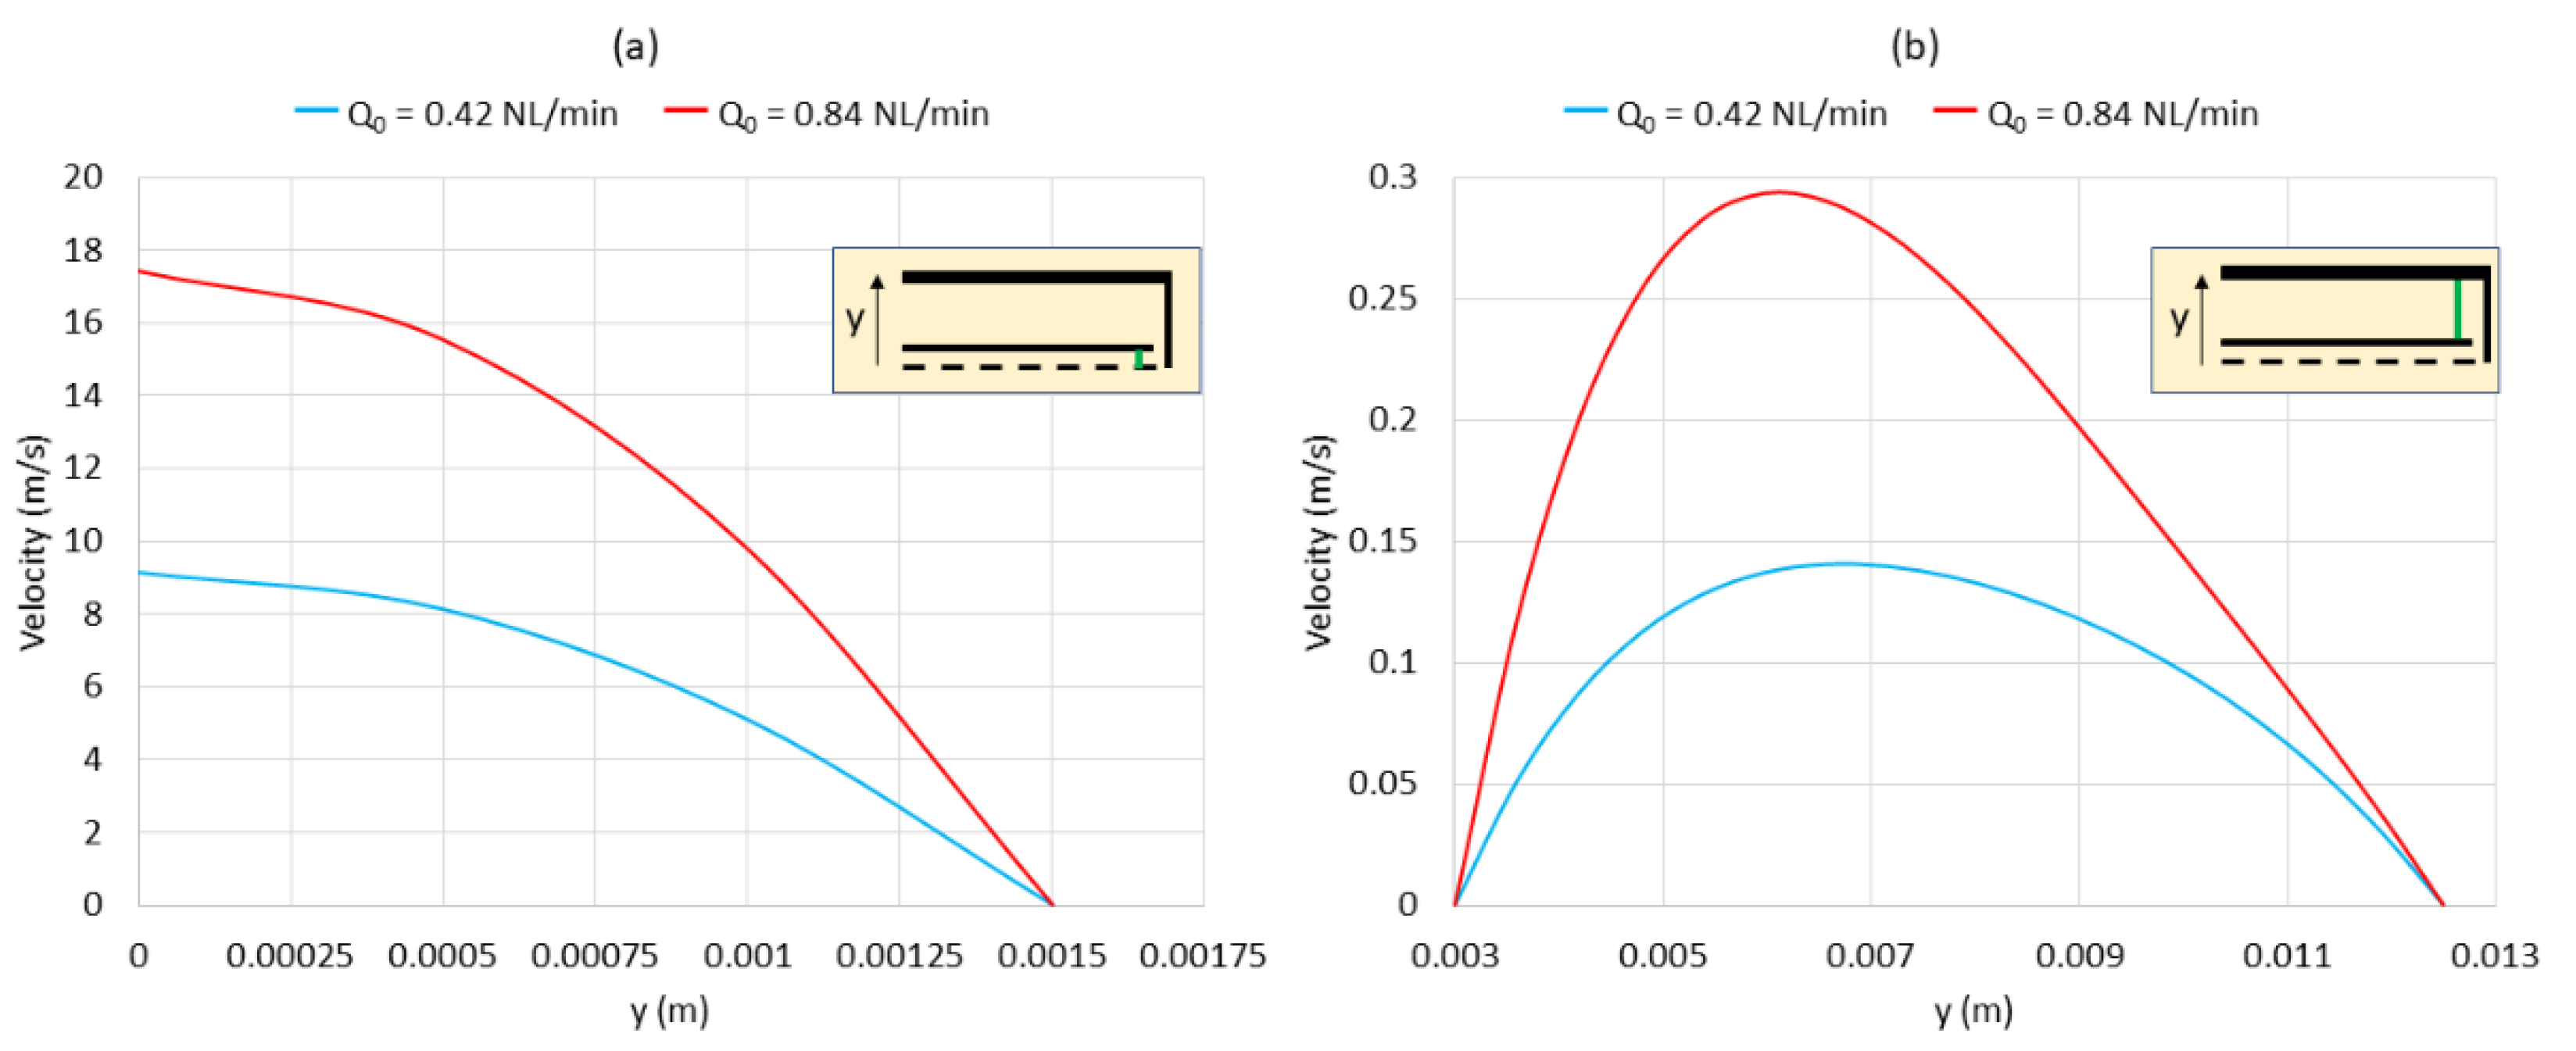
Figure 12 plots the velocity for case 1 and case 3 according to the direction of the y-axis (vertical direction) 20 mm above the bottom of the reactor (i.e., along the green line in the small reactor scheme in Figure 12 that indicates the location where the velocity was plotted). In case 1 (blue curve in Figure 12a), when Q0 was 0.42 NL/min, the maximal velocity in the inner tube was almost 9 m/s at the axis (in the center of the inner tube). This velocity decreased progressively to zero near the walls (at x = 0.0015 m). In the annular space (blue curve in Figure 12b), the same aspect was observed: the maximal velocity was almost 0.14 m/s (at x = 0.0065 m), and it progressively decreased to zero when approaching the walls (x = 0.003 m and x = 0.0125 m). The velocity in the annular space was much smaller than in the inner tube due to the higher cross section.
In case 3 (red curve in Figure 12a), when Q0 was 0.84 NL/min, the maximal velocity in the inner tube was almost 17.5 m/s at the axis (x = 0 m). This velocity decreased progressively to zero near the walls (at x = 0.0015 m). In the annular space (red curve in Figure 12b), the maximal velocity was almost 0.29 m/s (at x = 0.0065 m) and decreased to zero near the walls (x = 0.003 m and x = 0.0125 m). As a comparison, the maximal velocities were higher in case 3 than in case 1 (17.5 m/s vs. 9 m/s in the inner tube and 0.29 m/s vs. 0.14 m/s in the annular space). Such results confirm the high impact of Q0 on the gas residence time, which is a key parameter in gas-phase methane cracking.
4.6. Effect of Methane Molar Fraction
To study the dilution effect, all parameters were kept constant as the reference case while reducing inlet methane molar fraction from 0.5 to 0.3 (case 1 versus case 4). Temperature and species mole fraction contours are shown in Figure 13. Differences in contours are not noticeable. Some previous works concerning methane cracking reported a slight increase in conversion when the inlet methane mole fraction was increased [13,44]. However, simulation results show that the methane conversion increased from 91% to 95%, accompanied by a hydrogen yield increase from 92% to 94% when the methane mole fraction was reduced from 0.5 to 0.3. Theoretically, methane conversion should rather decrease when dilution increases because the reaction rate is directly proportional to methane concentration (first order reaction). On the other hand, the diluted gas could allow more efficient heating of methane to achieve a higher decomposition extent. In addition, the real residence time of methane is affected by chemical expansion, which is increased when more methane dissociates (2 moles of H2 formed per mole of CH4). Thus, a lower methane mole fraction could slightly increase the residence time, and thus the conversion according to the effect of residence time. Thus, there is a subtle balance between residence time and methane molar fraction effects. This aspect should be further analyzed thanks to real residence time distribution extracted from Fluent.
4.7. Effect of Heating Temperature
Methane cracking is an endothermic reaction that requires external energy as a process heat source [6]. Thus, an increase in the heating temperature improves the conversion. When the temperature was increased from 1473 K to 1573 K, for both heating sources, the methane concentration in the reactor was reduced (Figure 14c compared to Figure 14d), hence resulting in higher methane decomposition. Hydrogen concentration profiles also reflect a higher hydrogen yield in Figure 14e than in Figure 14f. Simulation results (Table 2) confirm this effect with a complete conversion at 1573 K (case 5). Experimental studies on methane cracking also confirm that complete conversion is reachable above 1673 K [44,45,46,47]. However, the residence time is also an important parameter to be considered for explaining this result. In all those experimental works, the gas residence time was in the order of a few milliseconds (<100 ms). In this study, the effective residence time was significantly higher (about 1.4 s), which explains the complete conversion reached at the outlet for a lower temperature.
5. Conclusions
Solar methane cracking is worth investigating to develop a sustainable process for clean hydrogen production. Indeed, the methane cracking process is advantageous compared with conventional methane reforming since it produces hydrogen without greenhouse gas emissions, while solid carbon material is formed as a high-value marketable co-product with various potential applications. A hybrid solar/electric reactor was designed and simulated at PROMES-CNRS to overcome solar radiation variability. Such a reactor is proposed for continuous and stable operation when the DNI is low or unstable, thanks to the possibility of additional heating by electric means. Thus, the process continuity is made possible. When the DNI is not high enough for stable on-sun operation, the process can still be maintained by enabling the two heating sources (both electric and solar). The benefits of coupled hybrid heating were illustrated through numerical CFD simulation for methane cracking in gas-phase using ANSYS Fluent. The kinetic model was assessed beforehand to confirm its reliability for the numerical study. A good agreement was shown between experimental and CFD results with an activation energy of 281 kJ/mol. Consequently, the numerical study was achieved and showed that activating both heating sources enlarged the reaction zone inside the reactor. Consequently, the effective residence time increased, improving the methane conversion significantly. However, when solar heating is not possible, reactor operation under only electric heating results in a reasonable methane conversion (75%). The effects of operating parameters on the reactor performance were also numerically studied via simulation. The inlet volumetric flow rate modifies the gas residence time of the reactant molecules in the reactor. A higher inlet volumetric flow rate decreases the residence time and, consequently, the methane conversion. Increasing dilution slightly favors methane conversion. Finally, the temperature is also a key parameter in methane cracking, since the endothermic reaction requires external energy. Increasing the temperature increased the rate of the reaction and enhanced the methane conversion. In addition, the model was further validated by methane pyrolysis experiments. A good agreement between numerical and experimental results was demonstrated, confirming the reliability of the numerical model. These CFD simulations validated the proposed design of the solar hybrid reactor for efficient methane decomposition performance. Moreover, this numerical model could be extended to simulate methane cracking in molten media as a novel technology that has not been modelled yet.
Author Contributions
Methodology, validation, formal analysis, investigation, and data curation, M.M., S.R. and S.A.; writing—original draft preparation, M.M.; writing—review and editing, M.M., S.R. and S.A.; supervision, S.R. and S.A.; project administration, S.R. and S.A.; funding acquisition, S.R. and S.A. All authors have read and agreed to the published version of the manuscript.
Funding
This work was supported by the French “Investments for the Future” program. managed by the National Agency for Research, under contract ANR-10-LABX-22-01 (Labex SOLSTICE).
Data Availability Statement
Simulation data files are available upon request.
Acknowledgments
The authors thank Roger Garcia (PROMES-CNRS) for his support in the design and installation of the solar reactor, and Régis Rodriguez (PROMES-CNRS) and Emmanuel Guillot (PROMES-CNRS) for their support to set the data acquisition system.
Conflicts of Interest
The authors declare no conflict of interest.
References
- Kothari, R.; Buddhi, D.; Sawhney, R.L. Comparison of Environmental and Economic Aspects of Various Hydrogen Production Methods. Renew. Sustain. Energy Rev. 2008, 12, 553–563. [Google Scholar] [CrossRef]
- Abánades, A. The Challenge of Hydrogen Production for the Transition to a CO2-Free Economy. Agron. Res. 2012, 10, 11–16. [Google Scholar]
- Abbas, H.F.; Wan Daud, W.M.A. Hydrogen Production by Methane Decomposition: A Review. Int. J. Hydrogen Energy 2010, 35, 1160–1190. [Google Scholar] [CrossRef]
- Abánades, A.; Ruiz, E.; Ferruelo, E.M.; Hernández, F.; Cabanillas, A.; Martínez-Val, J.M.; Rubio, J.A.; López, C.; Gavela, R.; Barrera, G.; et al. Experimental Analysis of Direct Thermal Methane Cracking. Int. J. Hydrogen Energy 2011, 36, 12877–12886. [Google Scholar] [CrossRef] [Green Version]
- Lemus, R.G.; Martínez Duart, J.M. Updated Hydrogen Production Costs and Parities for Conventional and Renewable Technologies. Int. J. Hydrogen Energy 2010, 35, 3929–3936. [Google Scholar] [CrossRef]
- Msheik, M.; Rodat, S.; Abanades, S. Methane Cracking for Hydrogen Production: A Review of Catalytic and Molten Media Pyrolysis. Energies 2021, 14, 3107. [Google Scholar] [CrossRef]
- Dahl, J. Intrinsic Kinetics for Rapid Decomposition of Methane in an Aerosol Flow Reactor. Int. J. Hydrogen Energy 2002, 27, 377–386. [Google Scholar] [CrossRef]
- Dahl, J.K.; Buechler, K.J.; Weimer, A.W.; Lewandowski, A.; Bingham, C. Solar-Thermal Dissociation of Methane in a Fluid-Wall Aerosol Flow Reactor. Int. J. Hydrogen Energy 2004, 29, 725–736. [Google Scholar] [CrossRef]
- Dahl, J.K.; Buechler, K.J.; Finley, R.; Stanislaus, T.; Weimer, A.W.; Lewandowski, A.; Bingham, C.; Smeets, A.; Schneider, A. Rapid Solar-Thermal Dissociation of Natural Gas in an Aerosol Flow Reactor. Energy 2004, 29, 715–725. [Google Scholar] [CrossRef]
- Dahl, J.K.; Tamburini, J.; Weimer, A.W.; Lewandowski, A.; Pitts, R.; Bingham, C. Solar-Thermal Processing of Methane to Produce Hydrogen and Syngas. Energy Fuels 2001, 15, 1227–1232. [Google Scholar] [CrossRef]
- Rodat, S.; Abanades, S.; Grivei, E.; Patrianakos, G.; Zygogianni, A.; Konstandopoulos, A.G.; Flamant, G. Characterisation of Carbon Blacks Produced by Solar Thermal Dissociation of Methane. Carbon N. Y. 2011, 49, 3084–3091. [Google Scholar] [CrossRef]
- Abanades, S.; Kimura, H.; Otsuka, H. A Drop-Tube Particle-Entrained Flow Solar Reactor Applied to Thermal Methane Splitting for Hydrogen Production. Fuel 2015, 153, 56–66. [Google Scholar] [CrossRef]
- Rodat, S.; Abanades, S.; Flamant, G. Experimental Evaluation of Indirect Heating Tubular Reactors for Solar Methane Pyrolysis. Int. J. Chem. React. Eng. 2010, 8, A25. [Google Scholar] [CrossRef]
- Berndt, F.M.; Perez-Lopez, O.W. Catalytic Decomposition of Methane over Ni/SiO2: Influence of Cu Addition. React. Kinet. Mech. Catal. 2017, 120, 181–193. [Google Scholar] [CrossRef]
- Rahman, M.S.; Croiset, E.; Hudgins, R.R. Catalytic Decomposition of Methane for Hydrogen Production. Top. Catal. 2006, 37, 137–145. [Google Scholar] [CrossRef]
- Lázaro, M.J.; Pinilla, J.L.; Suelves, I.; Moliner, R. Study of the Deactivation Mechanism of Carbon Blacks Used in Methane Decomposition. Int. J. Hydrogen Energy 2008, 33, 4104–4111. [Google Scholar] [CrossRef]
- Msheik, M.; Rodat, S.; Abanades, S. Experimental Comparison of Solar Methane Pyrolysis in Gas-Phase and Molten-Tin Bubbling Tubular Reactors. Energy 2022, 260, 124943. [Google Scholar] [CrossRef]
- Zaghloul, N.; Kodama, S.; Sekiguchi, H. Hydrogen Production by Methane Pyrolysis in a Molten-Metal Bubble Column. Chem. Eng. Technol. 2021, 44, 1986–1993. [Google Scholar] [CrossRef]
- Geißler, T.; Abánades, A.; Heinzel, A.; Mehravaran, K.; Müller, G.; Rathnam, R.K.; Rubbia, C.; Salmieri, D.; Stoppel, L.; Stückrad, S.; et al. Hydrogen Production via Methane Pyrolysis in a Liquid Metal Bubble Column Reactor with a Packed Bed. Chem. Eng. J. 2016, 299, 192–200. [Google Scholar] [CrossRef] [Green Version]
- Wang, K.; Li, W.S.; Zhou, X.P. Hydrogen Generation by Direct Decomposition of Hydrocarbons over Molten Magnesium. J. Mol. Catal. A Chem. 2008, 283, 153–157. [Google Scholar] [CrossRef]
- Zeng, J.; Tarazkar, M.; Pennebaker, T.; Gordon, M.J.; Metiu, H.; McFarland, E.W. Catalytic Methane Pyrolysis with Liquid and Vapor Phase Tellurium. ACS Catal. 2020, 10, 8223–8230. [Google Scholar] [CrossRef]
- Palmer, C.; Tarazkar, M.; Kristoffersen, H.H.; Gelinas, J.; Gordon, M.J.; McFarland, E.W.; Metiu, H. Methane Pyrolysis with a Molten Cu-Bi Alloy Catalyst. ACS Catal. 2019, 9, 8337–8345. [Google Scholar] [CrossRef]
- Upham, D.C.; Agarwal, V.; Khechfe, A.; Snodgrass, Z.R.; Gordon, M.J.; Metiu, H.; McFarland, E.W. Catalytic Molten Metals for the Direct Conversion of Methane to Hydrogen and Separable Carbon. Science 2017, 358, 917–921. [Google Scholar] [CrossRef] [PubMed] [Green Version]
- Kang, D.; Rahimi, N.; Gordon, M.J.; Metiu, H.; McFarland, E.W. Catalytic Methane Pyrolysis in Molten MnCl2-KCl. Appl. Catal. B Environ. 2019, 254, 659–666. [Google Scholar] [CrossRef]
- Kang, D.; Palmer, C.; Mannini, D.; Rahimi, N.; Gordon, M.J.; Metiu, H.; McFarland, E.W. Catalytic Methane Pyrolysis in Molten Alkali Chloride Salts Containing Iron. ACS Catal. 2020, 10, 7032–7042. [Google Scholar] [CrossRef]
- Parkinson, B.; Patzschke, C.F.; Nikolis, D.; Raman, S.; Dankworth, D.C.; Hellgardt, K. Methane Pyrolysis in Monovalent Alkali Halide Salts: Kinetics and Pyrolytic Carbon Properties. Int. J. Hydrogen Energy 2021, 46, 6225–6238. [Google Scholar] [CrossRef]
- Rahimi, N.; Kang, D.; Gelinas, J.; Menon, A.; Gordon, M.J.; Metiu, H.; McFarland, E.W. Solid Carbon Production and Recovery from High Temperature Methane Pyrolysis in Bubble Columns Containing Molten Metals and Molten Salts. Carbon N. Y. 2019, 151, 181–191. [Google Scholar] [CrossRef]
- Patzschke, C.F.; Parkinson, B.; Willis, J.J.; Nandi, P.; Love, A.M.; Raman, S.; Hellgardt, K. Co-Mn Catalysts for H2 Production via Methane Pyrolysis in Molten Salts. Chem. Eng. J. 2021, 414, 128730. [Google Scholar] [CrossRef]
- Sánchez-Bastardo, N.; Schlögl, R.; Ruland, H. Methane Pyrolysis for CO2-Free H2 Production: A Green Process to Overcome Renewable Energies Unsteadiness. Chem.-Ing.-Tech. 2020, 92, 1596–1609. [Google Scholar] [CrossRef]
- Rodat, S.; Abanades, S.; Sans, J.-L.; Flamant, G. A Pilot-Scale Solar Reactor for the Production of Hydrogen and Carbon Black from Methane Splitting. Int. J. Hydrogen Energy 2010, 35, 7748–7758. [Google Scholar] [CrossRef]
- Maag, G.; Zanganeh, G.; Steinfeld, A. Solar Thermal Cracking of Methane in a Particle-Flow Reactor for the Co-Production of Hydrogen and Carbon. Int. J. Hydrogen Energy 2009, 34, 7676–7685. [Google Scholar] [CrossRef]
- Rodat, S.; Abanades, S.; Sans, J.-L.; Flamant, G. Hydrogen Production from Solar Thermal Dissociation of Natural Gas: Development of a 10 kW Solar Chemical Reactor Prototype. Sol. Energy 2009, 83, 1599–1610. [Google Scholar] [CrossRef]
- Guil-Lopez, R.; Botas, J.A.; Fierro, J.L.G.; Serrano, D.P. Comparison of Metal and Carbon Catalysts for Hydrogen Production by Methane Decomposition. Appl. Catal. A Gen. 2011, 396, 40–51. [Google Scholar] [CrossRef]
- Utrilla, R.; Pinilla, J.L.; Suelves, I.; Lázaro, M.J.; Moliner, R. Catalytic Decomposition of Methane for the Simultaneous Co-Production of CO2-Free Hydrogen and Carbon Nanofibre Based Polymers. Fuel 2011, 90, 430–432. [Google Scholar] [CrossRef]
- Muradov, N.; Smith, F.; T-Raissi, A. Catalytic Activity of Carbons for Methane Decomposition Reaction. Catal. Today 2005, 102–103, 225–233. [Google Scholar] [CrossRef]
- Botas, J.A.; Serrano, D.P.; Guil-López, R.; Pizarro, P.; Gómez, G. Methane Catalytic Decomposition over Ordered Mesoporous Carbons: A Promising Route for Hydrogen Production. Int. J. Hydrogen Energy 2010, 35, 9788–9794. [Google Scholar] [CrossRef]
- Serrano, D.P.; Botas, J.A.; Guil-Lopez, R. H2 Production from Methane Pyrolysis over Commercial Carbon Catalysts: Kinetic and Deactivation Study. Int. J. Hydrogen Energy 2009, 34, 4488–4494. [Google Scholar] [CrossRef]
- Pinilla, J.L.; Torres, D.; Lázaro, M.J.; Suelves, I.; Moliner, R.; Cañadas, I.; Rodríguez, J.; Vidal, A.; Martínez, D. Metallic and Carbonaceous-Based Catalysts Performance in the Solar Catalytic Decomposition of Methane for Hydrogen and Carbon Production. Int. J. Hydrogen Energy 2012, 37, 9645–9655. [Google Scholar] [CrossRef]
- Rodat, S.; Abanades, S. A Hybrid Windowless Dual Tube Solar Reactor for Continuous Volumetric Natural Gas Dissociation. Front. Energy Res. 2020, 8, 206. [Google Scholar] [CrossRef]
- Rodat, S.; Abanades, S.; Boujjat, H.; Chuayboon, S. On the Path toward Day and Night Continuous Solar High Temperature Thermochemical Processes: A Review. Renew. Sustain. Energy Rev. 2020, 132, 110061. [Google Scholar] [CrossRef]
- Abanades, S.; Flamant, G. Experimental Study and Modeling of a High-Temperature Solar Chemical Reactor for Hydrogen Production from Methane Cracking. Int. J. Hydrogen Energy 2007, 32, 1508–1515. [Google Scholar] [CrossRef]
- ANSYS, Inc. ANSYS Fluent Theory Guide; ANSYS Inc.: Canonsburg, PA, USA, 2013. [Google Scholar]
- Keipi, T.; Tolvanen, K.E.S.; Tolvanen, H.; Konttinen, J. Thermo-Catalytic Decomposition of Methane: The Effect of Reaction Parameters on Process Design and the Utilization Possibilities of the Produced Carbon. Energy Convers. Manag. 2016, 126, 923–934. [Google Scholar] [CrossRef]
- Abanades, S.; Flamant, G. Hydrogen Production from Solar Thermal Dissociation of Methane in a High-Temperature Fluid-Wall Chemical Reactor. Chem. Eng. Process. Process Intensif. 2008, 47, 490–498. [Google Scholar] [CrossRef]
- Rodat, S.; Abanades, S.; Flamant, G. Co-Production of Hydrogen and Carbon Black from Solar Thermal Methane Splitting in a Tubular Reactor Prototype. Sol. Energy 2011, 85, 645–652. [Google Scholar] [CrossRef]
- Yeheskel, J.; Epstein, M. Thermolysis of Methane in a Solar Reactor for Mass-Production of Hydrogen and Carbon Nano-Materials. Carbon N. Y. 2011, 49, 4695–4703. [Google Scholar] [CrossRef]
- Abanades, S.; Tescari, S.; Rodat, S.; Flamant, G. Natural Gas Pyrolysis in Double-Walled Reactor Tubes Using Thermal Plasma or Concentrated Solar Radiation as External Heating Source. J. Nat. Gas Chem. 2009, 18, 1–8. [Google Scholar] [CrossRef]
Figure 1.
Hybrid solar/electric reactor installed at PROMES-CNRS (Odeillo, France): (a) real picture of the implemented reactor, (b) representative scheme of the reactor configuration, (c) photo of the hot cavity just after a solar run.
Figure 1.
Hybrid solar/electric reactor installed at PROMES-CNRS (Odeillo, France): (a) real picture of the implemented reactor, (b) representative scheme of the reactor configuration, (c) photo of the hot cavity just after a solar run.

Figure 2.
Simplified representative scheme of the 2D hybrid reactor geometry along with boundary conditions.
Figure 2.
Simplified representative scheme of the 2D hybrid reactor geometry along with boundary conditions.

Figure 3.
Quadrilateral meshing sizes for the study of independency on meshing: (a) mesh size = 0.2 mm; (b) mesh size = 0.6 mm; (c) mesh size = 1 mm; (d) mesh size = 2 mm; (e) mesh size = 3 mm; (f) mesh size = 4 mm.
Figure 3.
Quadrilateral meshing sizes for the study of independency on meshing: (a) mesh size = 0.2 mm; (b) mesh size = 0.6 mm; (c) mesh size = 1 mm; (d) mesh size = 2 mm; (e) mesh size = 3 mm; (f) mesh size = 4 mm.

Figure 4.
Residuals of the Fluent solver for different meshing sizes. (white: continuity, red: x-velocity, green: y-velocity, dark blue: energy, light blue: density, pink: CH4 mass balance, yellow: H2 mass balance, orange: C mass balance).
Figure 4.
Residuals of the Fluent solver for different meshing sizes. (white: continuity, red: x-velocity, green: y-velocity, dark blue: energy, light blue: density, pink: CH4 mass balance, yellow: H2 mass balance, orange: C mass balance).

Figure 5.
Effect of meshing on temperature profile: (a) mesh 1, (b) mesh 2, and (c) mesh 3; CH4 mole fraction profile: (d) mesh 1, (e) mesh 2, and (f) mesh 3; H2 mole fraction profile: (g) mesh 1, (h) mesh 2, and (i) mesh 3.
Figure 5.
Effect of meshing on temperature profile: (a) mesh 1, (b) mesh 2, and (c) mesh 3; CH4 mole fraction profile: (d) mesh 1, (e) mesh 2, and (f) mesh 3; H2 mole fraction profile: (g) mesh 1, (h) mesh 2, and (i) mesh 3.

Figure 6.
CFD results sensitivity to different values of activation energy.

Figure 7.
Comparison of numerical and experimental results in terms of methane conversion and hydrogen yield as a function of (a) operating temperature and (b) gas inlet flow rate.
Figure 7.
Comparison of numerical and experimental results in terms of methane conversion and hydrogen yield as a function of (a) operating temperature and (b) gas inlet flow rate.

Figure 8.
Effect of hybridization on temperature profile: (a) case 2 and (b) case 1; CH4 mole fraction profile: (c) case 2 and (d) case 1; H2 mole fraction profile: (e) case 2 and (f) case 1.
Figure 8.
Effect of hybridization on temperature profile: (a) case 2 and (b) case 1; CH4 mole fraction profile: (c) case 2 and (d) case 1; H2 mole fraction profile: (e) case 2 and (f) case 1.

Figure 9.
Effect of heating on temperature and outlet mole fractions of methane and hydrogen. (a) Scheme of the reactor annular region including the x-axis of the curves, (b) temperature plot, (c) outlet mole fractions plot.
Figure 9.
Effect of heating on temperature and outlet mole fractions of methane and hydrogen. (a) Scheme of the reactor annular region including the x-axis of the curves, (b) temperature plot, (c) outlet mole fractions plot.

Figure 10.
Effect of residence time on temperature profile: (a) case 3 and (b) case 1; CH4 mole fraction profile: (c) case 3 and (d) case 1; H2 mole fraction profile: (e) case 3 and (f) case 1.
Figure 10.
Effect of residence time on temperature profile: (a) case 3 and (b) case 1; CH4 mole fraction profile: (c) case 3 and (d) case 1; H2 mole fraction profile: (e) case 3 and (f) case 1.

Figure 11.
Velocity streamlines in the reactor with a zoom at the bottom part: (a) case 1 and (b) case 3.
Figure 11.
Velocity streamlines in the reactor with a zoom at the bottom part: (a) case 1 and (b) case 3.

Figure 12.
Velocity plots according to the direction of the y-axis 20 mm above the bottom (along the green line): (a) velocity in the inner tube and (b) velocity in the annular space. Blue curves: case 1; red curves: case 3.
Figure 12.
Velocity plots according to the direction of the y-axis 20 mm above the bottom (along the green line): (a) velocity in the inner tube and (b) velocity in the annular space. Blue curves: case 1; red curves: case 3.

Figure 13.
Effect of methane inlet mole fraction on temperature profile: (a) case 4 and (b) case 1; CH4 mole fraction profile: (c) case 4 and (d) case 1; H2 mole fraction profile: (e) case 4 and (f) case 1.
Figure 13.
Effect of methane inlet mole fraction on temperature profile: (a) case 4 and (b) case 1; CH4 mole fraction profile: (c) case 4 and (d) case 1; H2 mole fraction profile: (e) case 4 and (f) case 1.

Figure 14.
Effect of heating temperature on temperature profile: (a) case 5 and (b) case 1; CH4 mole fraction profile: (c) case 5 and (d) case 1; H2 mole fraction profile: (e) case 5 and (f) case 1.
Figure 14.
Effect of heating temperature on temperature profile: (a) case 5 and (b) case 1; CH4 mole fraction profile: (c) case 5 and (d) case 1; H2 mole fraction profile: (e) case 5 and (f) case 1.


Table 1.
Operating conditions simulated through ANSYS Fluent.
| Telectric (K) | Tsolar (K) | Q0 (NL/min) | y0,CH4 | Mesh Size (mm) | Parameter Effect | |
|---|---|---|---|---|---|---|
| Case 1 (ref) | 1473 | 1473 | 0.42 | 0.5 | 0.6 | Reference case: hybridization (coupled heating) |
| Case 2 | 1473 | Insulated | 0.42 | 0.5 | 0.6 | Electric heating only |
| Case 3 | 1473 | 1473 | 0.84 | 0.5 | 0.6 | Residence time |
| Case 4 | 1473 | 1473 | 0.42 | 0.3 | 0.6 | Methane dilution |
| Case 5 | 1573 | 1573 | 0.42 | 0.5 | 0.6 | Heating temperature |
Table 2.
Results of parameter effects on performance metrics of gas-phase methane pyrolysis.
| Telectric (K) | Tsolar (K) | Q0 (NL/min) | y0,CH4 | Mesh Size (mm) | τe (s) | τs (s) | τtotal (s) | CH4 conversion, XCH4 (%) | H2 yield, YH2 (%) | |
|---|---|---|---|---|---|---|---|---|---|---|
| Case 1 (ref) | 1473 | 1473 | 0.42 | 0.5 | 0.6 | 0.94 | 0.56 | 1.5 | 91 | 92 |
| Case 2 | 1473 | Insulated | 0.42 | 0.5 | 0.6 | 0.94 | 0 | 0.94 | 75 | 74 |
| Case 3 | 1473 | 1473 | 0.84 | 0.5 | 0.6 | 0.47 | 0.28 | 0.75 | 67 | 73 |
| Case 4 | 1473 | 1473 | 0.42 | 0.3 | 0.6 | 0.94 | 0.56 | 1.5 | 95 | 94 |
| Case 5 | 1573 | 1573 | 0.42 | 0.5 | 0.6 | 0.88 | 0.52 | 1.4 | 100 | 100 |
Table 3.
Study of the meshing influence on the CFD numerical results.
| Telectric (K) | Tsolar (K) | Q0 (NL/min) | y0,CH4 | Mesh Size (mm) | τe (s) | τs (s) | τtotal (s) | XCH4 (%) | YH2 (%) | |
|---|---|---|---|---|---|---|---|---|---|---|
| Mesh 1 | 1473 | 1473 | 0.42 | 0.5 | 0.2 | 0.94 | 0.56 | 1.5 | 91 | 90 |
| Mesh 2 | 1473 | 1473 | 0.42 | 0.5 | 0.6 | 0.94 | 0.56 | 1.5 | 91 | 92 |
| Mesh 3 | 1473 | 1473 | 0.42 | 0.5 | 1 | 0.94 | 0.56 | 1.5 | 91 | 90 |
| Mesh 4 | 1473 | 1473 | 0.42 | 0.5 | 2 | 0.94 | 0.56 | 1.5 | 90 | 88 |
| Mesh 5 | 1473 | 1473 | 0.42 | 0.5 | 3 | 0.94 | 0.56 | 1.5 | 90 | 86 |
| Mesh 6 | 1473 | 1473 | 0.42 | 0.5 | 4 | 0.94 | 0.56 | 1.5 | Divergence | |
Disclaimer/Publisher’s Note: The statements, opinions and data contained in all publications are solely those of the individual author(s) and contributor(s) and not of MDPI and/or the editor(s). MDPI and/or the editor(s) disclaim responsibility for any injury to people or property resulting from any ideas, methods, instructions or products referred to in the content. |
© 2023 by the authors. Licensee MDPI, Basel, Switzerland. This article is an open access article distributed under the terms and conditions of the Creative Commons Attribution (CC BY) license (https://creativecommons.org/licenses/by/4.0/).
Share and Cite
MDPI and ACS Style
Msheik, M.; Rodat, S.; Abanades, S. CFD Simulation of a Hybrid Solar/Electric Reactor for Hydrogen and Carbon Production from Methane Cracking. Fluids 2023, 8, 18. https://doi.org/10.3390/fluids8010018
AMA Style
Msheik M, Rodat S, Abanades S. CFD Simulation of a Hybrid Solar/Electric Reactor for Hydrogen and Carbon Production from Methane Cracking. Fluids. 2023; 8(1):18. https://doi.org/10.3390/fluids8010018
Chicago/Turabian StyleMsheik, Malek, Sylvain Rodat, and Stéphane Abanades. 2023. "CFD Simulation of a Hybrid Solar/Electric Reactor for Hydrogen and Carbon Production from Methane Cracking" Fluids 8, no. 1: 18. https://doi.org/10.3390/fluids8010018