Effect of Micropolar Fluid Properties on the Blood Flow in a Human Carotid Model


1
Department of Mechanical Engineering, University of West Attica, Thivon 250, 12241 Aigaleo, Greece
2
Department of Mechanical Engineering, University of Thessaly, Pedion Areos, 38221 Volos, Greece
*
Author to whom correspondence should be addressed.
Fluids 2020, 5(3), 125; https://doi.org/10.3390/fluids5030125
Submission received: 24 June 2020
/
Revised: 22 July 2020
/
Accepted: 27 July 2020
/
Published: 29 July 2020
(This article belongs to the Special Issue Classical and Modern Topics in Fluid Dynamics and Transport Phenomena)
Abstract
:Blood is a non-homogeneous fluid that flows inside the human artery system and provides the cells with nutrients. In this study the auto rotation effect of blood’s microstructure on its flow inside a human carotid model is studied by using a micropolar fluid model. The study aims to investigate the flow differences that occur due to its microstructure as compared to a Newtonian fluid. We focus on the vortex viscosity effect, i.e., the ratio of microrotation viscosity to the total one, because this is the only parameter that affects directly the fluid flow. Simulations in a range of vortex viscosities, are carried out in a human carotid model that is computationally reconstructed. All of the simulations are conducted at the diastolic Reynolds number that occurs in the human carotid. Results indicate that micropolarity affects blood velocity in the range of parameters studied by . As micropolarity is increased, higher velocities in the center of vessels and lower near the boundaries are found as compared to a Newtonian fluid consideration. This is an indication that the increase of the fluid’s micropolarity leads to an increase of the boundary layer thickness. More importantly, an increase in vortex viscosity and the resulting increase in microrotation result in decreased shear stress in the carotid’s walls; this finding can be significant in regards to the onset and the development of atherosclerosis. Finally, the flow distribution at the carotid seems to heavily be affected by the geometry and the micropolarity of the fluid.
1. Introduction
A few parts of human arterial system can be used in representative models for hemodynamics: the heart, the proximal and abdominal aorta, the left coronary artery and the carotid bifurcation [1]. The above mentioned human vessels exhibit flow characteristics that can be detected in most of the vascular system. Blood flow inside these vessels is of great importance since it is frequently related to disease and affected by many parameters [2,3,4]. Blood vessels are divided into five categories: capillaries which are in intimate contact with the tissues, arteries, arterioles, veins and venules [5]. The arteries are under various flow and pressure conditions in order to be conformed with the changing hemodynamic demands.
Blood is connected to oxygen and nutrients delivery to the body tissues as well as with the removal of tissue waste products [6]. Blood is approximately four times more viscous than water and consists of a complex mixture of ions, proteins, lipoproteins and cells [5]. In addition, it is constantly deformed under the effect of shear stress. Red blood cells (RBCs) are major components of blood due to their significant effect on hemodynamics and the performing biological functions. Remarkable deformability is exhibited by the RBCs partly due to their circular biconcave shapes while 35%– of the blood volume in the human circulatory system is occupied [7]. Moreover, the assumption of constant viscosity cannot be made of blood, which is typically considered as a non-Newtonian fluid. An indication of the non-Newtonian behavior of blood is demonstated at very low shear rates when aggregations of red blood cells are formed [8]. In addition, the non-Newtonian behavior of blood is also exhibited in small branches and capillaries. This is caused due to the reduction of the effective viscosity through the tube, as a cell-free skimming layer is formed at the walls due to the squeeze of cells. Since RBCs are small semi-rigid particles, they increase the blood viscosity and affect its rheology [9]. Therefore, the fluid inside the human vessels contains semi-rigid particles and their microrotation cannot be neglected [10]. As a result, blood rheological properties cannot be described by the classical Newtonian theory or simple viscoelastic models.
In order to interpret the behaviour of blood inside the human vascular system, the micropolar fluids theory is adopted in this study [11,12]. In this theory, micromorphic geometrical characteristics, deformation phenomena and the intrinsic movement of the material particles are taken into account. Micropolar theory involves fluids that are containing microelements and possessing internal microstructure. Micropolar fluids represent a category of fluids showing micro-rotational phenomena and micro-rotational inertia. In addition, they can support couple stresses, surface and body couples [13]. Moreover, they possess a microstructure, as they contain non-deformable solid particles, randomly oriented, suspended in a viscous medium [14]. The aforementioned microstructure gives rise to a certain degree of polarity [15]. The microstructure within the fluid acts as an additional factor affecting the fluid behavior in various flows. The internal particles may possess varying size and shape, shrink, change or expand of their geometry. Additionally, they can move independently of bulk flow and rotate individually, apart from the rotation of the fluid [15].
The rheology of blood is constantly changing since the diameter of the arteries are continuously changing. Consequently, microelements that are carried by the blood are compressed as the diameter of the arteries is minimized. This gives rise to collision effects as well as enhanced friction among the microelements [16]. Furthermore, as the diameter of the arteries changes the viscosity of the blood is also changes due to its microelements, such as RBCs, that are carried by the blood [17]. Changes in the viscosity of the blood lead to changes in its velocity profiles [18].
Over decades, cholesterol plaque may be accumulated in the walls of the carotid. Consequently, carotid’s flow path may eventually narrow by the growing plaque. Therefore, increased possibility for a sudden blood clot in the carotid artery can cause a stroke due to the interruption of blood flow. Furthermore, cholesterol plaque fragments may also navigated by the carotid artery into the brain. The latter can cause temporary blindness by blocking blood flow in an artery supplying the eye. It is well known that the deposition of the cholesterol plaque on the arteries is affected by the fluid flow conditions [19,20,21]. For this reason the blood flow inside the human carotid artery is analyzed using a micropolar fluid model.
Blood flow under normal and disease conditions is an important field of study. Better understanding of the rheology of the human vascular system can be provided by simulations of blood flow in the arterial network system. Consequently, innovative methods in biomedicine could be used with enhanced efficiency [22,23]. The blood flow in the human arterial system can be considered as a biofluid dynamics problem. It should be noticed that remarkable differences under a specific fluid flow can be occurred when different numerical models (Newtonian, Non-Newtonian) are taken into consideration [24]. In this study, the hemodynamics of a representative artery model, namely the carotid artery, is investigated. This artery is very a significant blood vessel since it supplies the brain, the neck and the face with the sufficient quantity of blood in order to maintain their fundamental functions [25,26]. Carotid artery is located along the sides of the neck and divided into the internal and the external carotid artery. Brain blood is supplied by the internal carotid artery, while the face and neck are supplied through the external carotid artery.
In the present study, the effect of the vortex viscosity, that directly affect the micropolarity of the blood flow inside a humans’ carotid model is investigated. In addition, the results are compared with the Newtonian fluid model. The governing equations of micropolar fluid flow as well as the simulation details are presented in Section 2. Results for different values of the micropolar parameters are presented in Section 3 and compared to the Newtonian fluid model case. Finally, discussion of findings and most important conclusions from the study are presented in Section 4 and Section 5, respectively.
2. Materials and Methods
2.1. Numerical Model
The general purpose numerical library OpenFOAM [27] is used for the investigation of micropolar blood flow in a three dimensional model of a human carotid geometry. In this study, a similar solution procedure as in Ref. [16] is considered. The laminar governing flow equations of the micropolar fluid phase are given by Ref. [28].
where, is the fluid velocity vector , is the molecular viscosity , the micropolar viscosity , the rotational velocity vector , is a material coefficient and j is the microinertia . Equation (1) is the continuity equation for an incompressible fluid, while Equations (2) and (3) describe momentum and microrotation conservation, respectively.
In this study, the non-dimensional form of the equations is used, as it better illustrates the effects of the pertinent parameters . The non-dimensional forms of momentum and microrotation conservation equations are:
where, and are the angular and linear velocity vectors, respectively, scaled by the cross sectional average velocity . The micro inertia constant , the pressure and the angular and linear velocities are made non-dimensional as:
where, is the micropolar fluid’s density and R is the radius of the tube at the entrance , as it is shown in Figure 1. The non-dimensional parameters appearing in Equations (4) and (5) are defined as:
where N is the spin-gradient viscosity, is the Reynolds number ans m is the vortex viscosity.
The solution method implemented in OpenFOAM relies on the finite volume method and uses the PISO variant of the pressure correction method to obtain the flow solution. As the fluid flow is laminar and steady-state, the equations were solved using an Eulerian frame of reference. In addition, Gauss integration with linear interpolation which is a second order method is used for gradient, divergence and laplacian schemes.
A uniform linear velocity equal to m/s is applied at the inlet. In addition, zero pressure gradient and angular velocity are set at the inlet. The pressure in both the outlet boundary 1 (i.e., in the outlet of the internal carotid as it is shown in Figure 1) and 2 (i.e., in the outlet of the external carotid as it is shown in Figure 1) is set as 0, while zero gradient is set for the velocity and microrotation. At walls, no-slip condition for both velocity and microrotation and zero pressure gradient were used.
2.2. Simulation Details
In this study, the flow of blood in a three dimensional carotid model (Figure 1) is investigated for different types of the micropolar blood and for that occurs in the diastolic phase of the cardiac cycle in a human carotid [29]. Simulations with vortex viscosity , to vary from 0 (Newtonian) to (mostly micropolar) are conducted since is the only micropolar parameter that is directly connected to the linear momentum. The spin gradient viscosity, N, and the microinertia, J, are kept constant and close to blood values, i.e., and , respectively. The selection of these particular values is based in the analysis of Ref. [30].
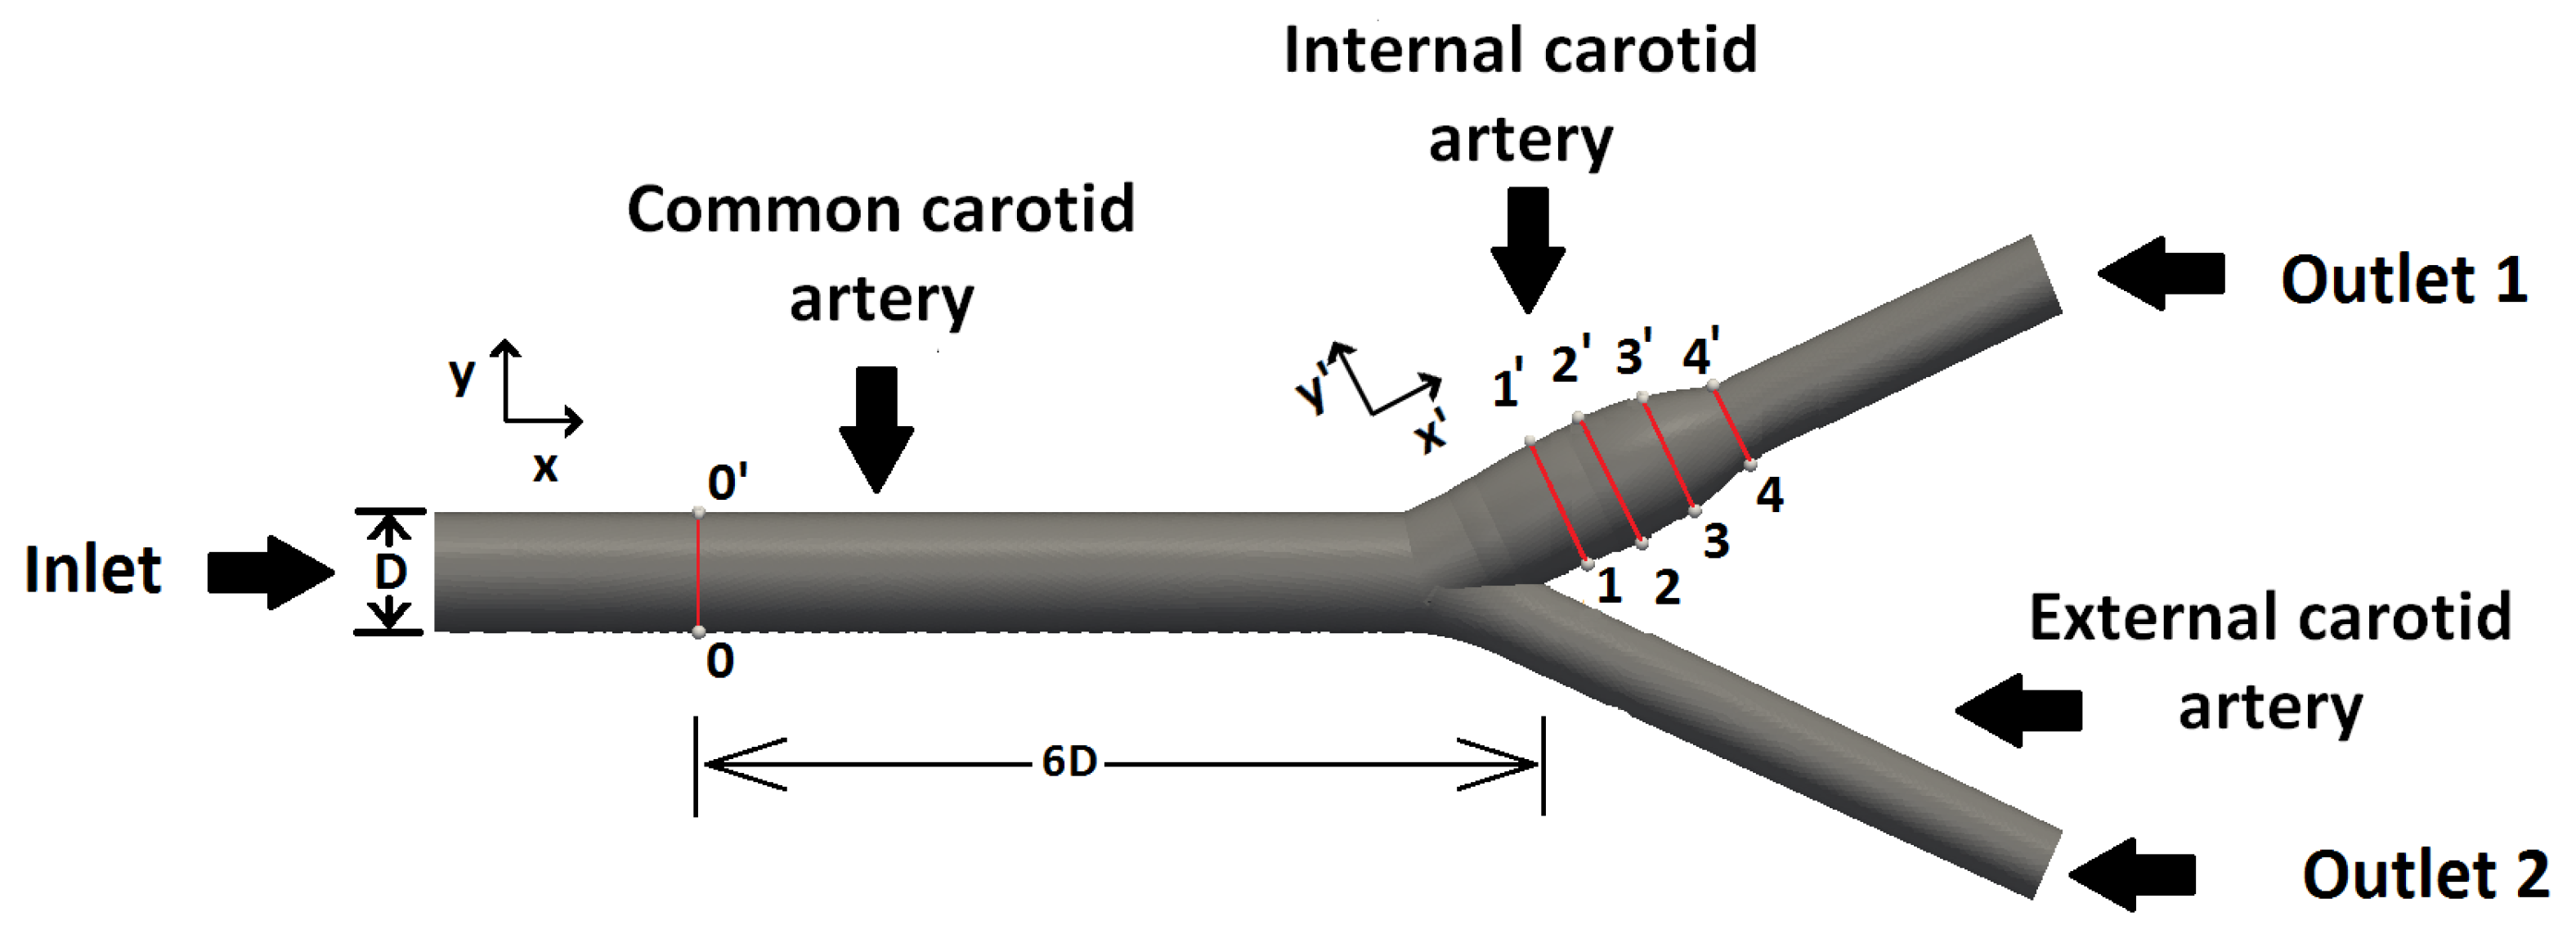
The dimensions of a human carotid model are analytically described in Ref. [31]. It should be noted that the computational geometry are suitably expanded at the inlet and outlets in order numerical issues connected to the boundary conditions to diminish and fully developed velocities profiles before the bifurcation to be established. Briefly, the overall length of the simulated carotid geometry is set equal to m, the diameter of the common carotid artery is kept equal to mm and the angle between the internal and external carotid artery is set equal to . The diameter and other geometric characteristics for both the external and internal carotid are analytically described in Ref. [31]. The results from the micropolar fluid model are compared with the Newtonian fluid model along five monitoring locations of the carotid. The first monitoring location (i.e., ) is located six diameters () upstream from the apex of the bifurcation, as is depicted in Figure 1. The rest four measurement areas are located in the internal common carotid artery, the velocity and microrotation distribution was mapped at , , , , each location separated by a distance of m along the direction.
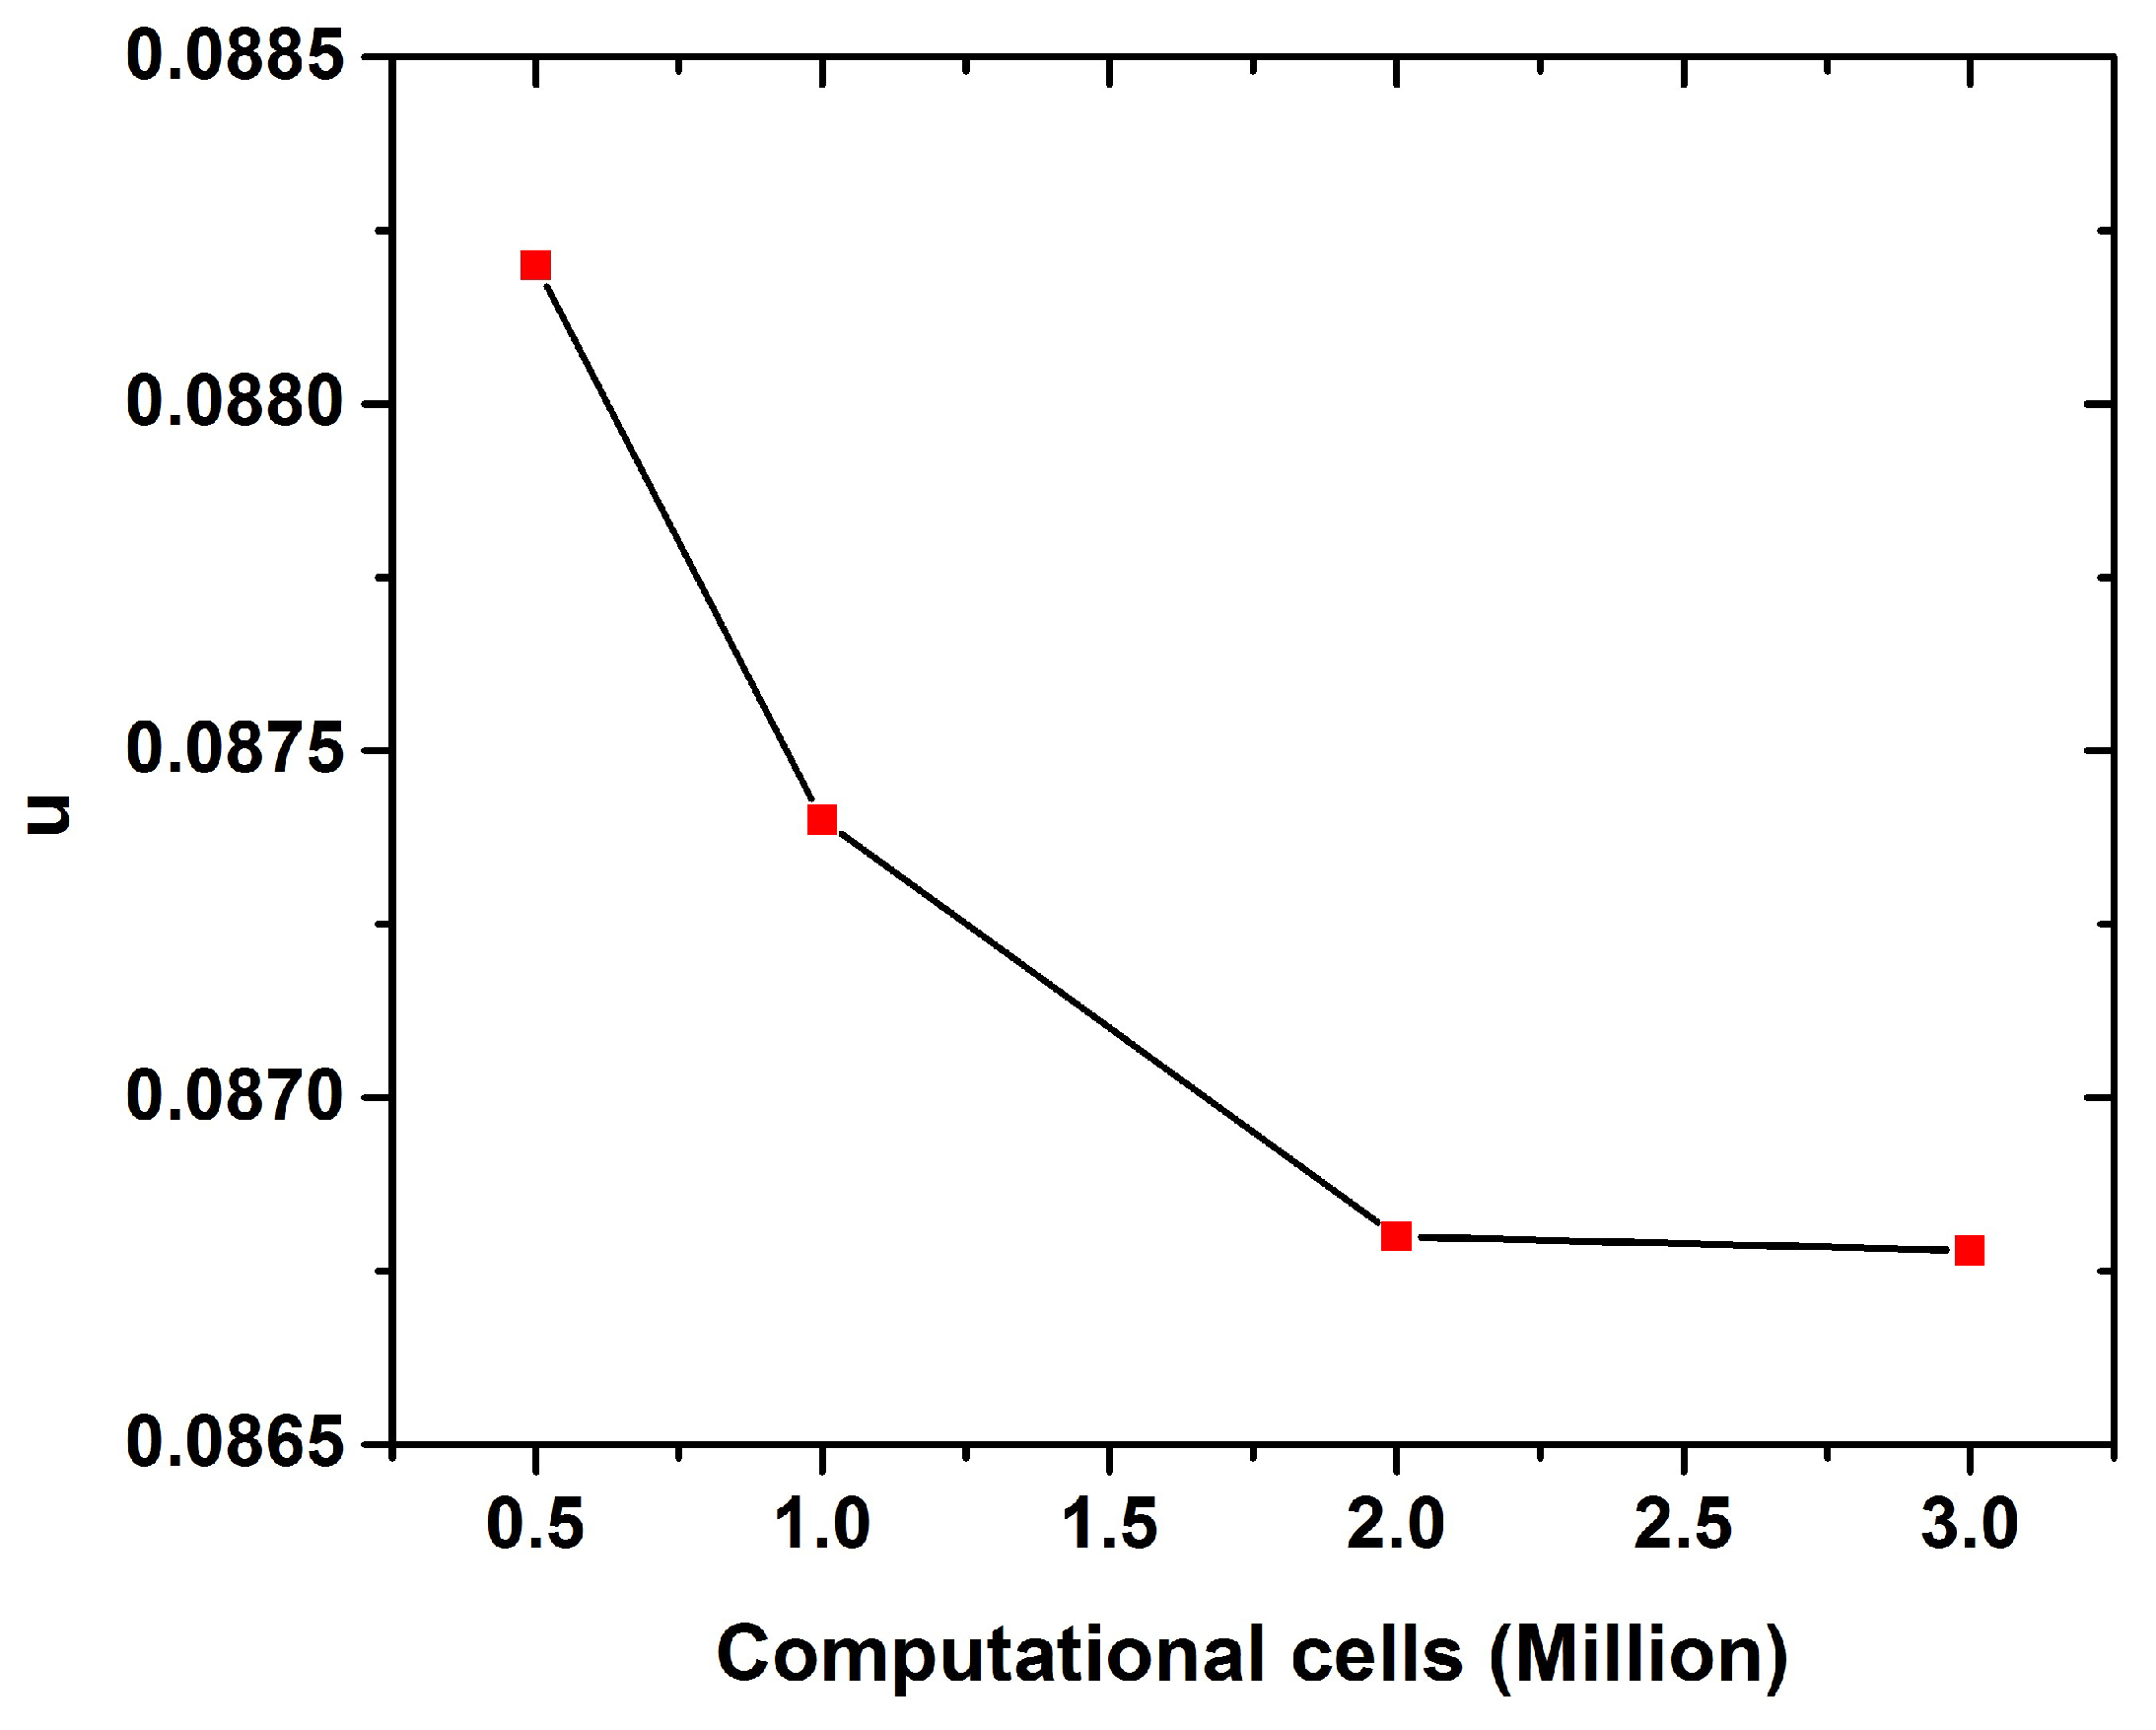
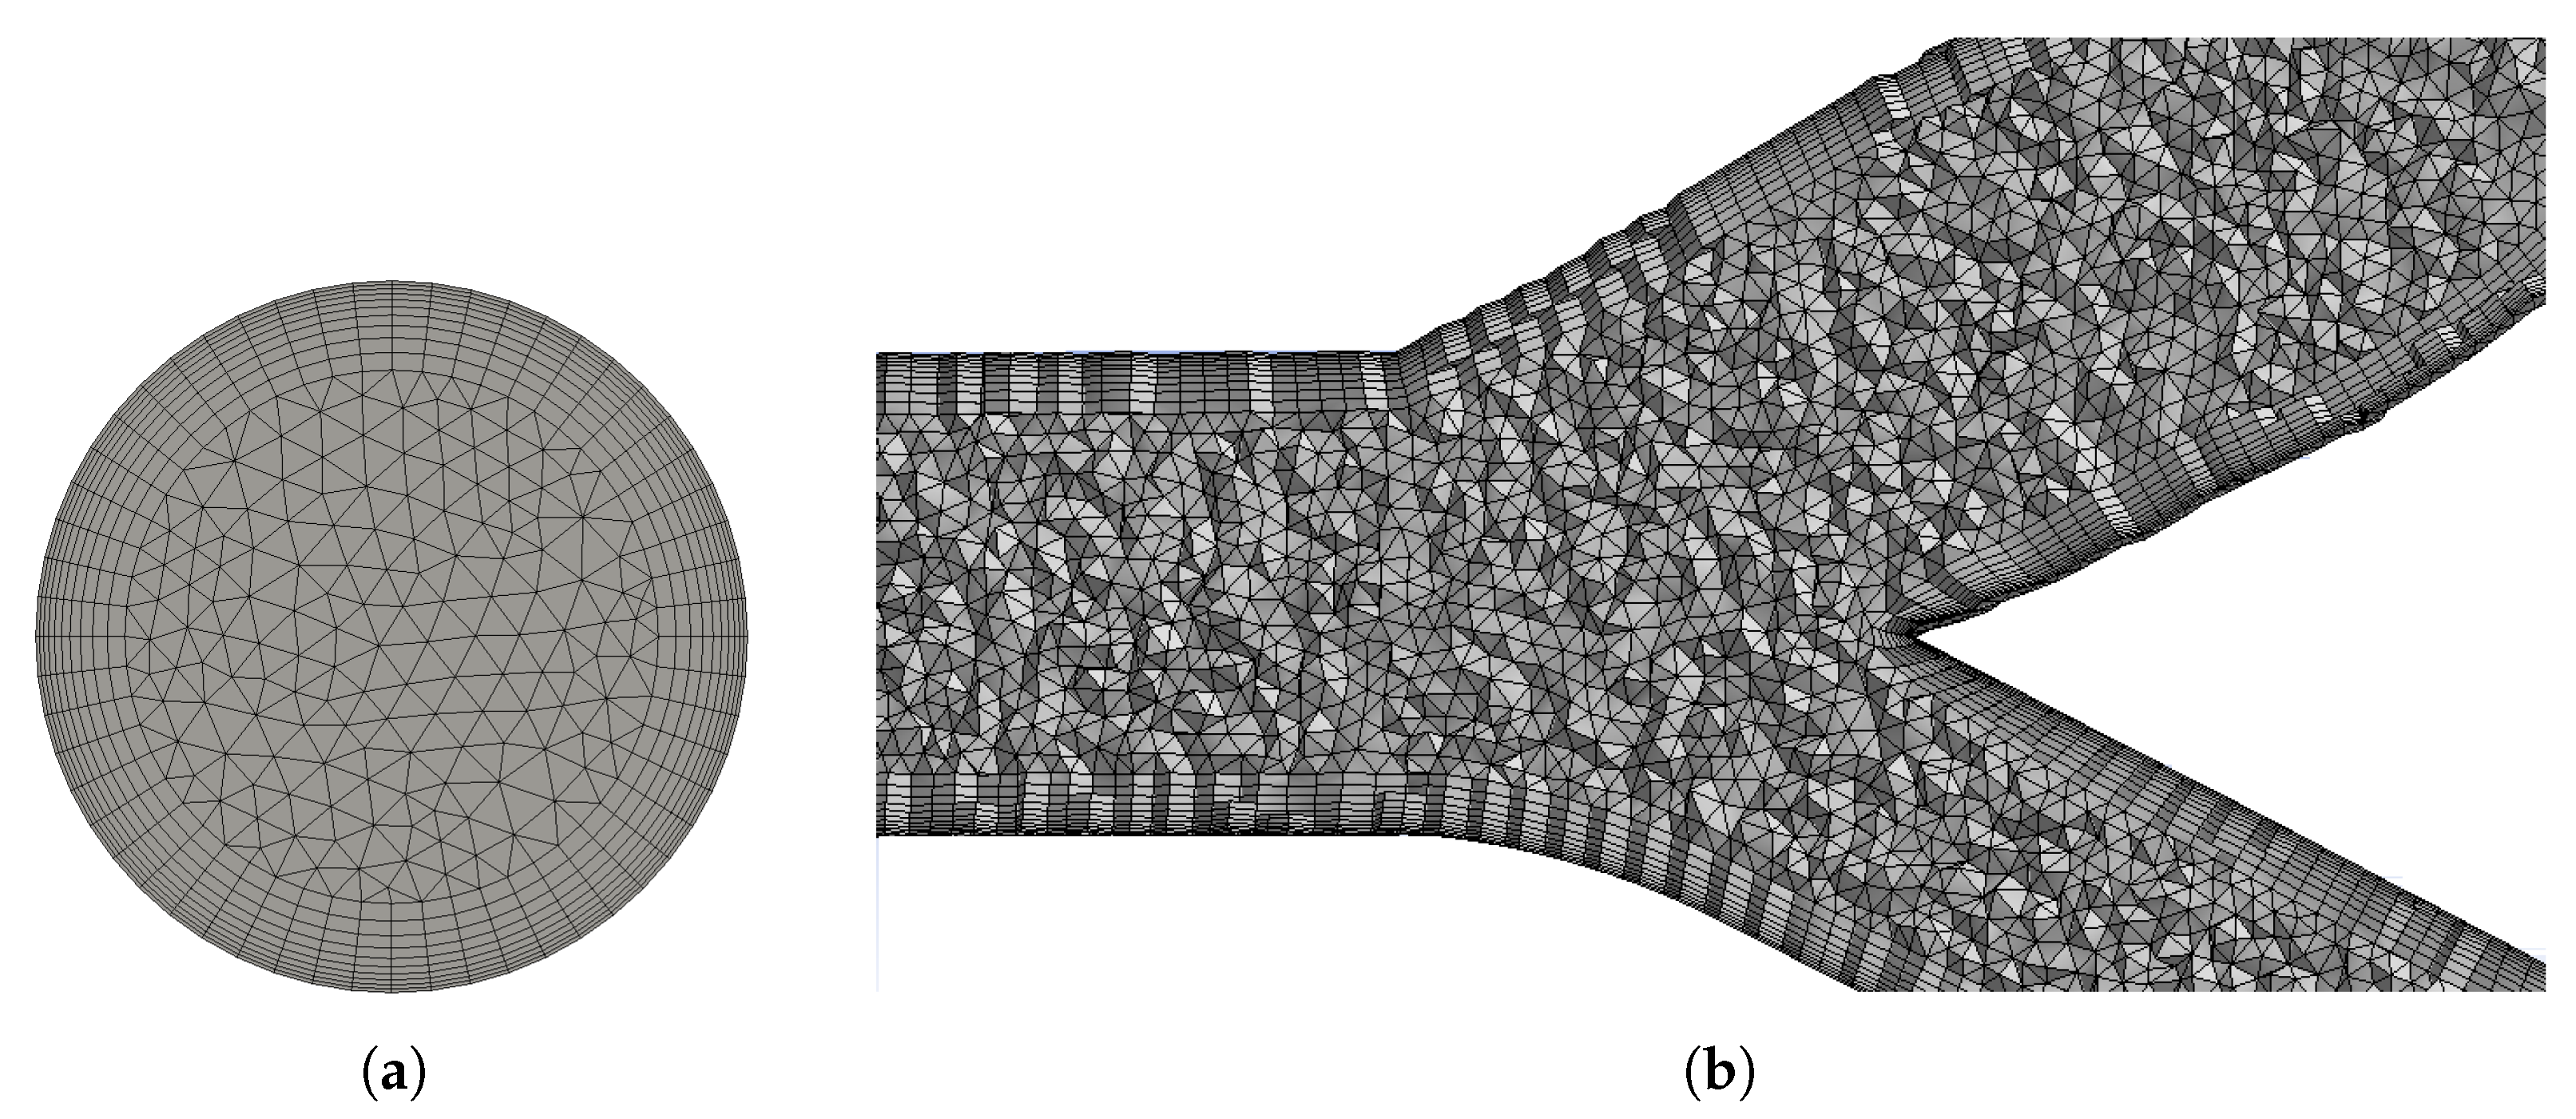
A mesh dependency test is conducted in the carotid model for the representative case of , with , 1, 2 and 3 million cells. Results indicate that the difference in the computed velocity of outlet 1 between the cases of 2 and 3 million cells become practically zero, as is shown in Figure 2. Therefore, all simulations in this study are conducted in a carotid model with 2 million cells. Representative views of the computational unstructured mesh, at the inlet and the bifurcation of the carotids, are presented in Figure 3. The computational mesh is developed using the Gmsh mesh generator and is consisted of approximately 2 million tetrahedra and wedge elements. The latter are used at the vicinity of the walls to resolve the viscous boundary layers. At each iteration, the numerical solution was iterated until the normalized residuals for pressure and velocities were less than . The computing time per case was approximately 12 h, executing the software in parallel into 24 cores of a multiprocessor distributed memory computing system using MPI. To enable this, in each case the computational mesh was appropriately divided into 24 subdomains (by means of an OpenFOAM built-in tool [27]). Finally, the Paraview multi-platform data analysis and visualization application is used for the graphical representation of the data.
2.3. Model Validation
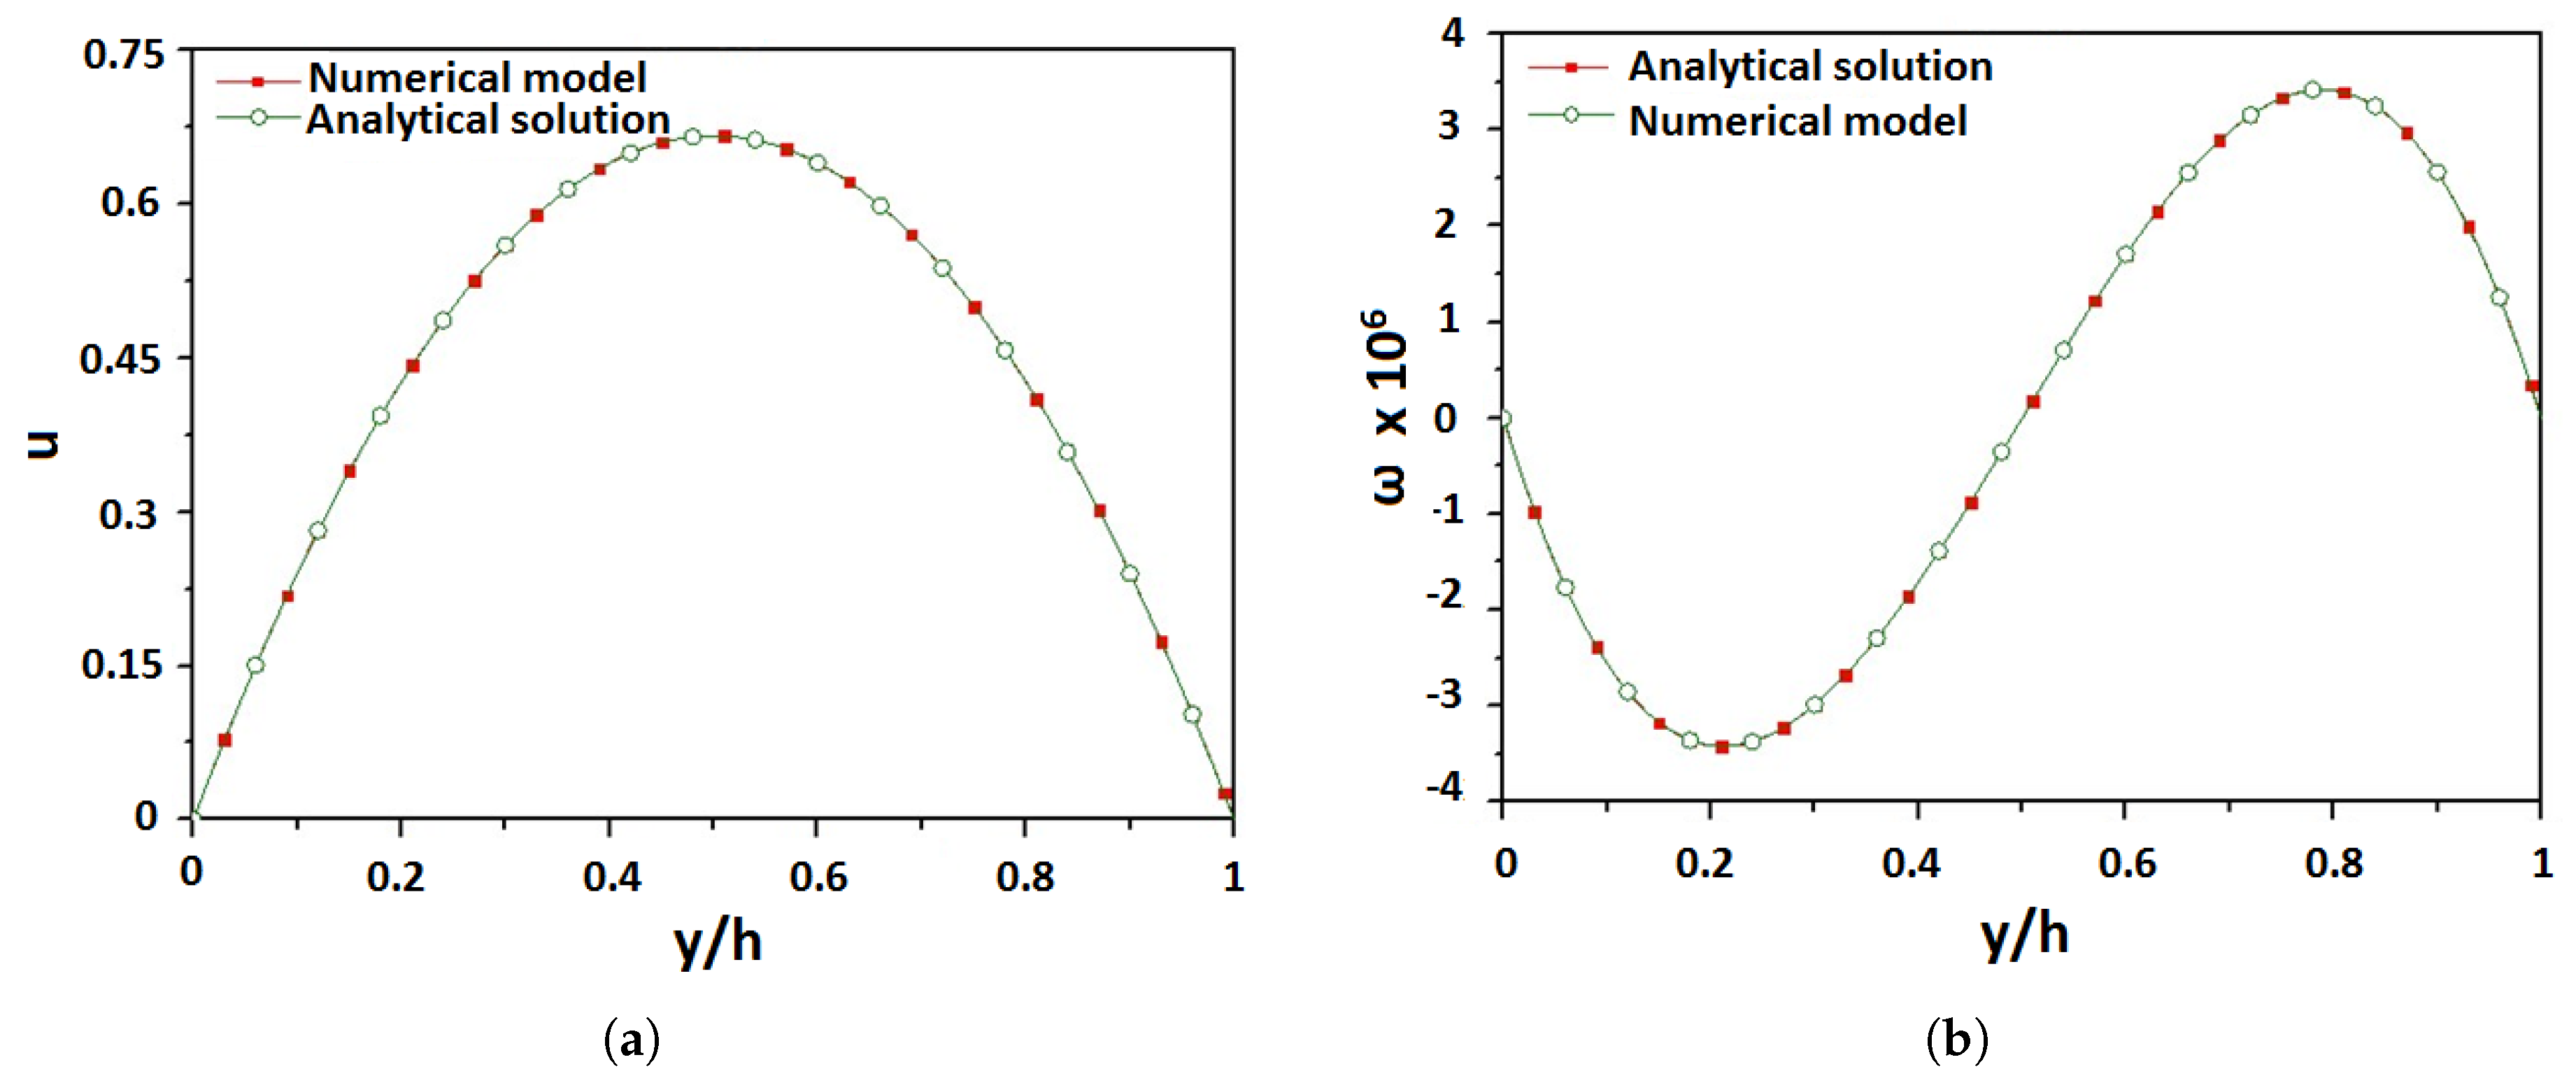
The present numerical model is validated against the laminar planar Poiseuille flow as it is discussed extensively in Ref. [32]. For this flow, an analytic solution for the velocity and microrotation profiles exists [12]:
where, y is the wall-normal direction of the channel with width h moreover, G, A, and a are defined as:
where, is the streamwise pressure gradient that drives the flow.
The geometry, the flow as well as the micropolar parameters used in the simulation for the validation of the numerical model are analytically described in Ref. [32]. A very good agreement for both velocity and microrotation between the analytical solution and the results of the numerical model is observed, as is depicted in Figure 4.
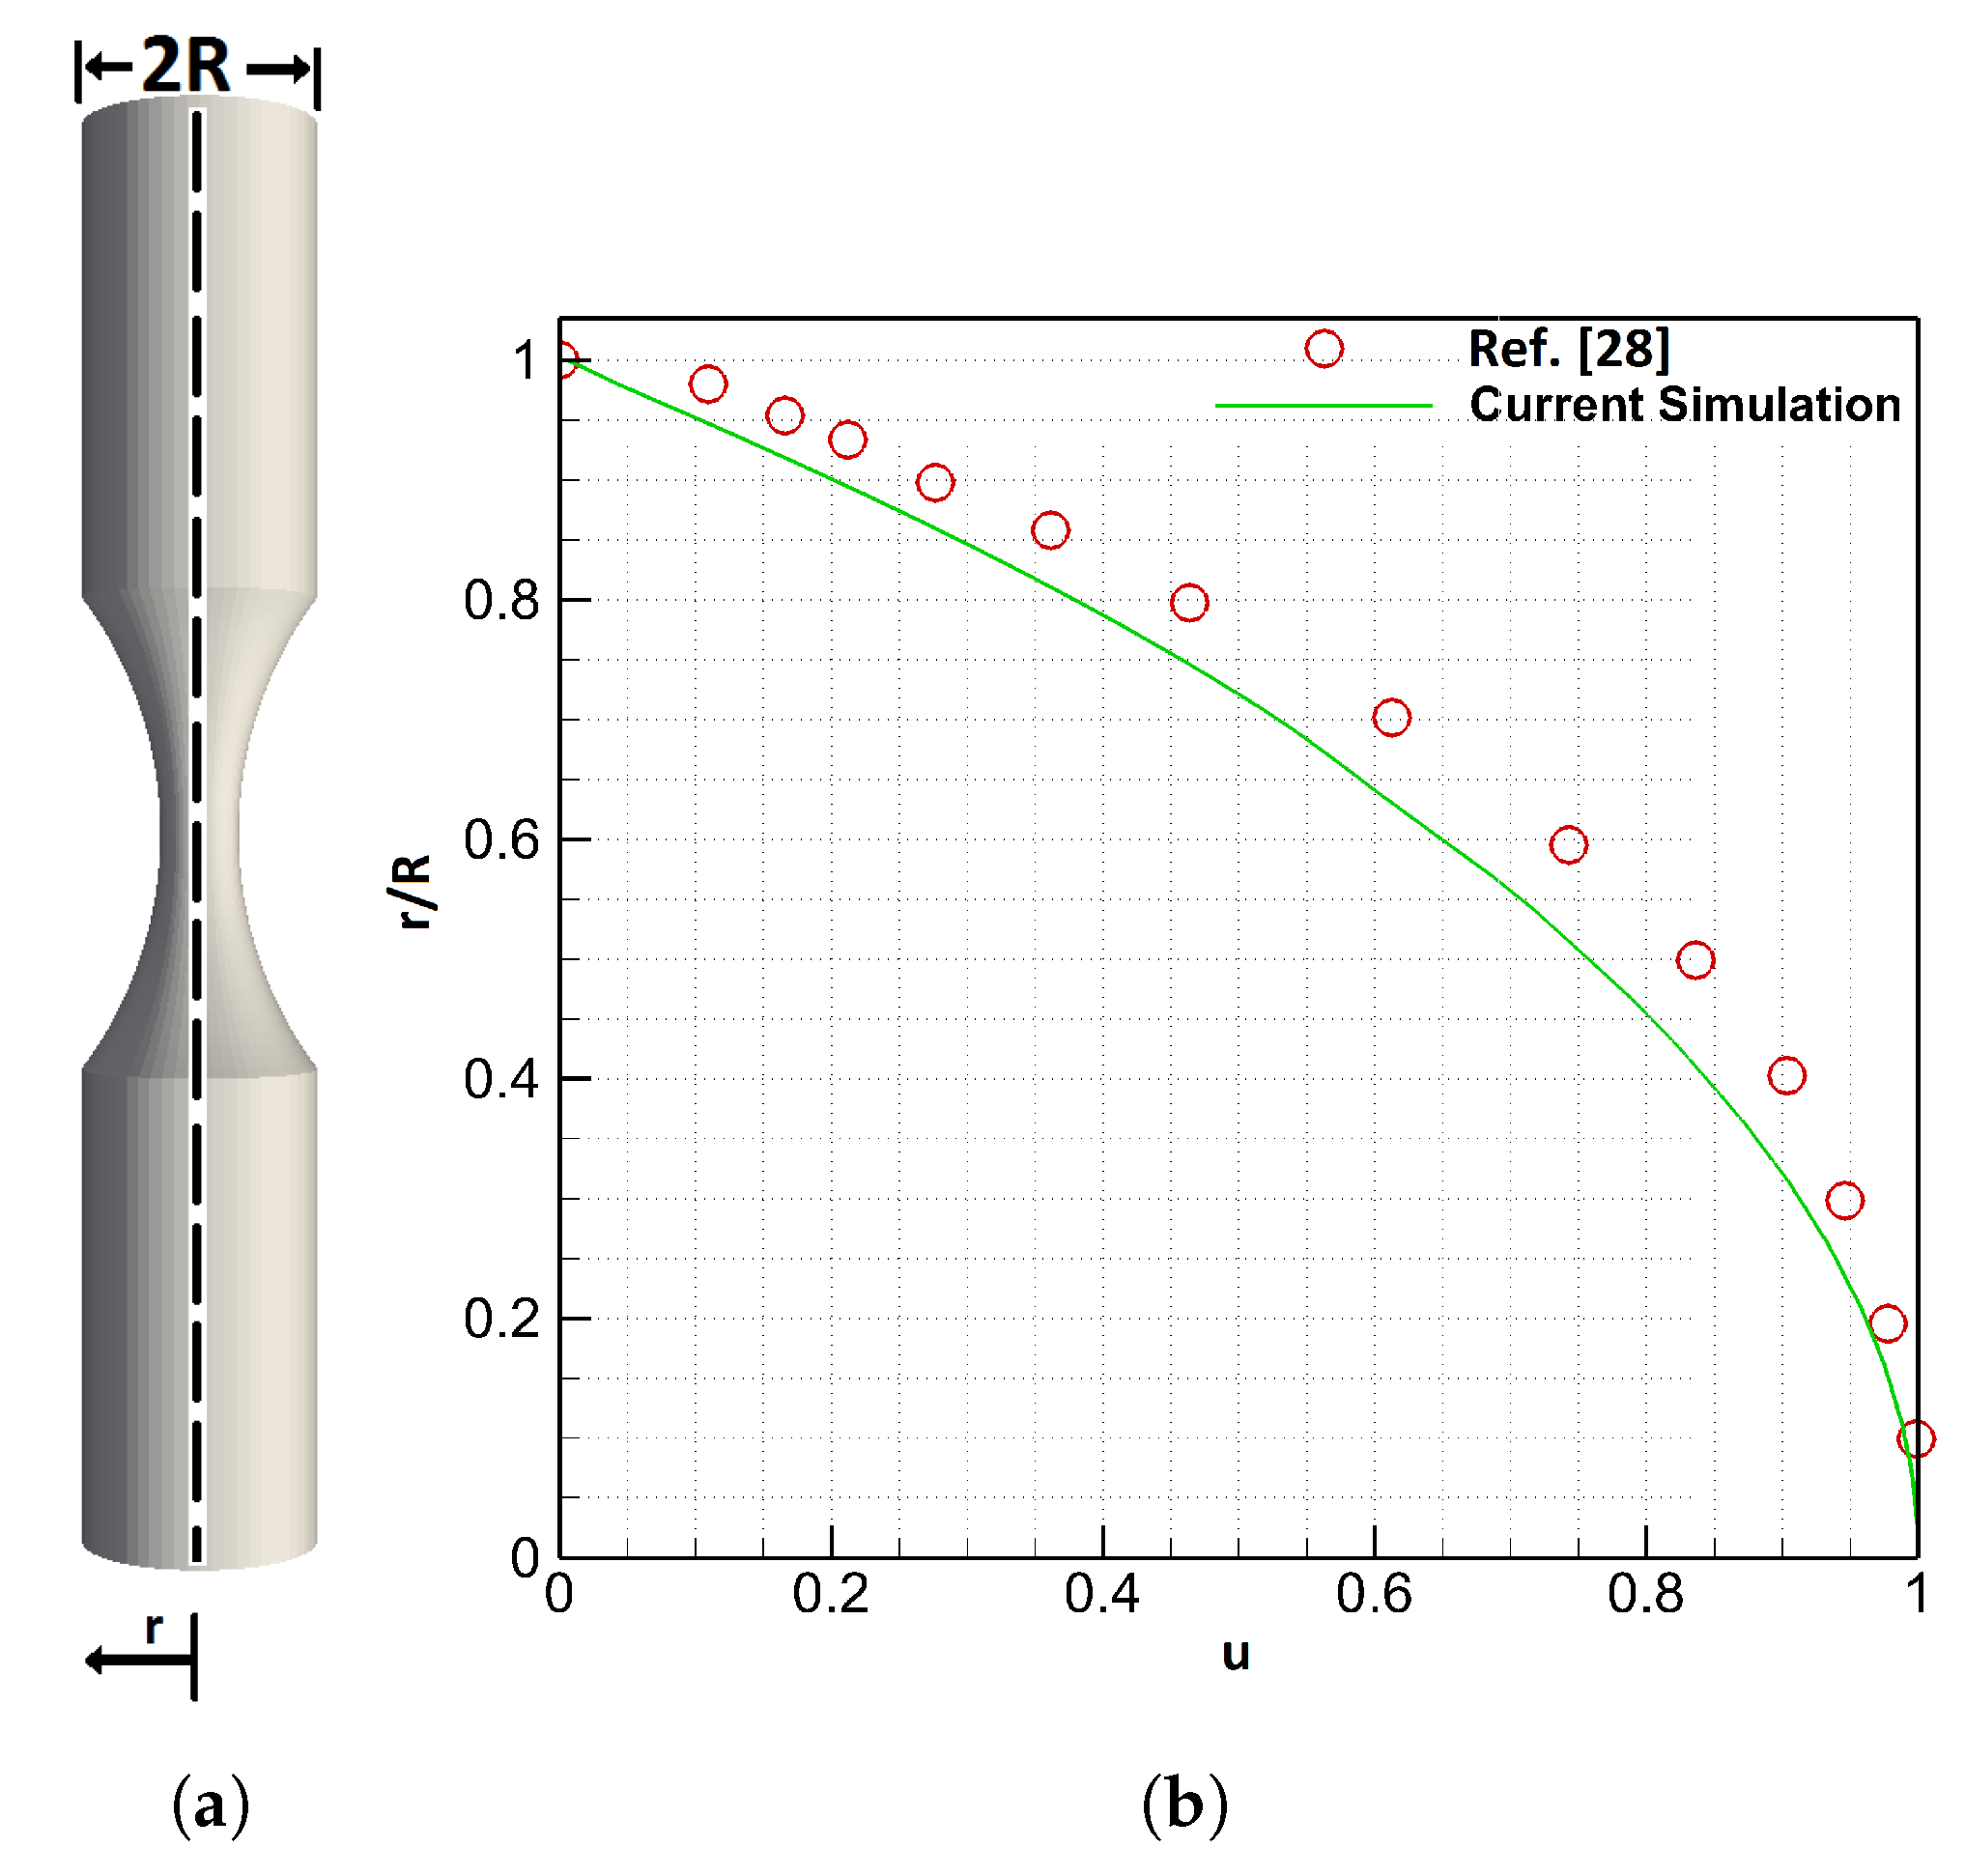
In addition, the present numerical model is compared against an idelized stenosis geometry model that is also based on micropolar continuum theory [33] as it is shown in Figure 5a. The characteristics of the geometry as well as the fluid flow are extensively analyzed in Ref. [33]. A good agreement is observed between the present numerical model and the model of Ref. [33] with a difference of approximately in the range of %–, as it is depicted in Figure 5b.
3. Results
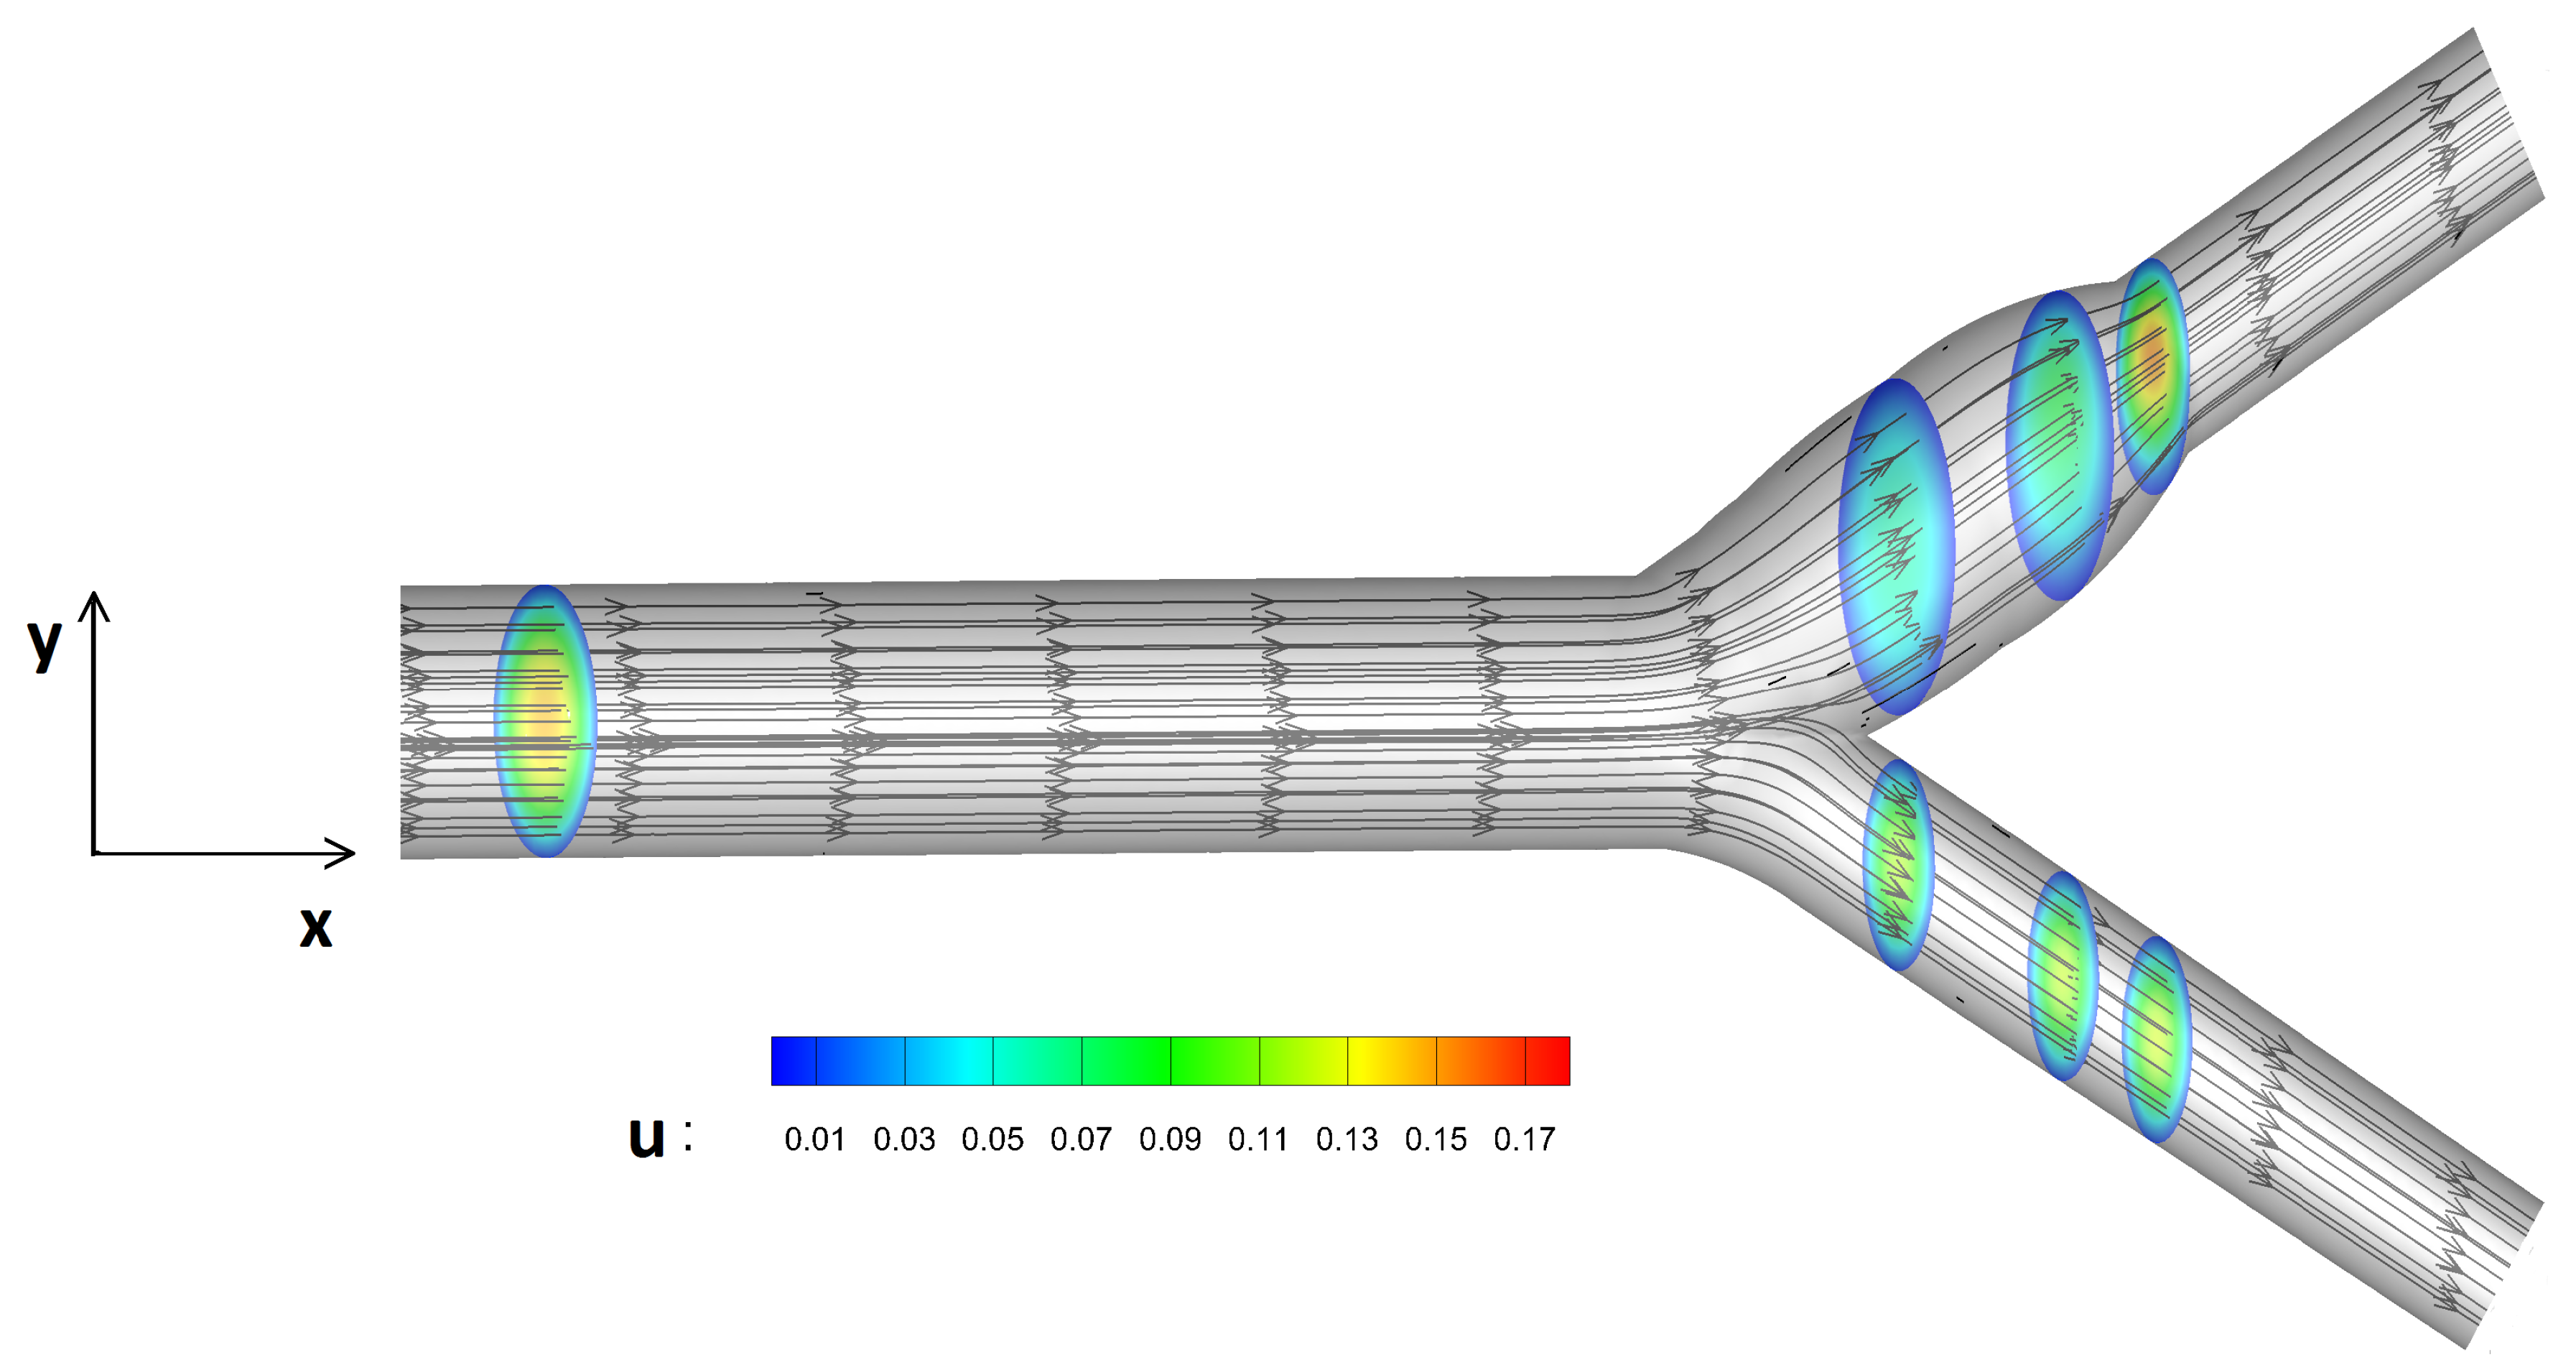
In this study, blood flow under different levels of micropolarity is compared against the Newtonian fluid model. Streamlines as well as velocity contours are presented in Figure 6. The blood flow is moved towards the common artery and its velocity is divided into two streams after the bifurcation.
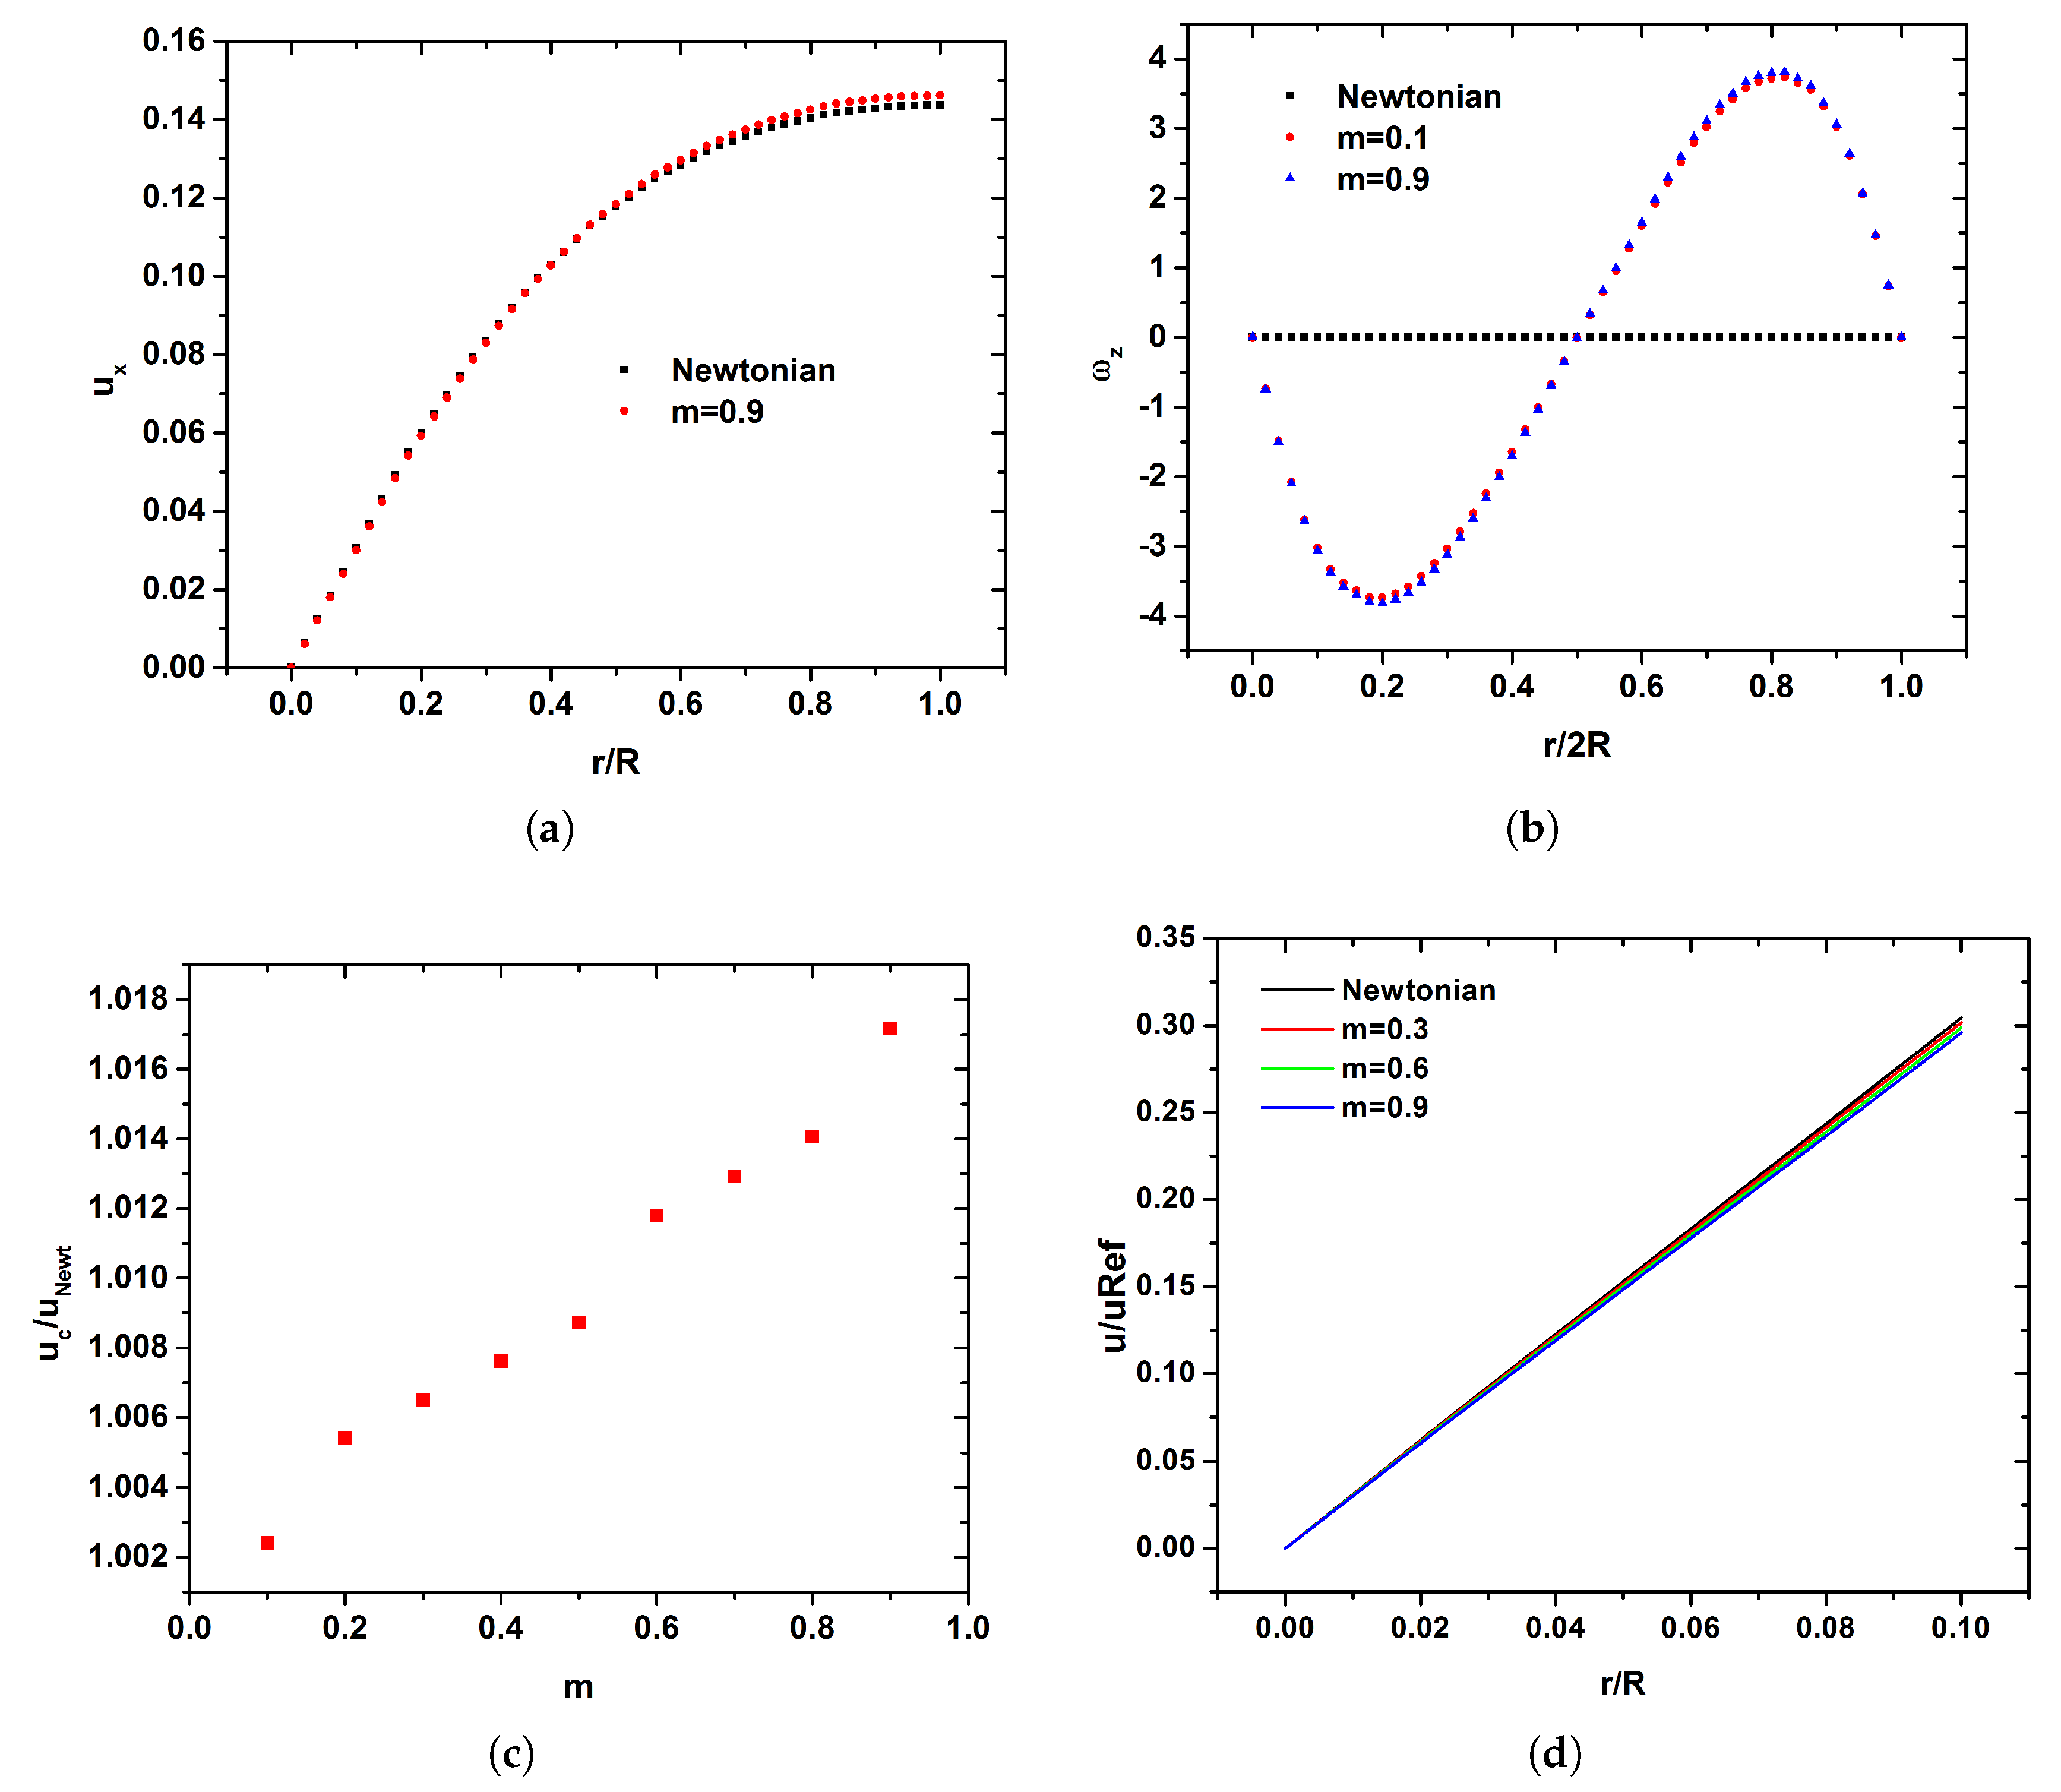
The profiles of streamwise and angular velocities for the Newtonian and the micropolar representative case of are presented in Figure 7a,b along the location . As the fluid flow is fully developed the streamwise velocity profile is parabolic for both Newtonian and micropolar fluid (Figure 7a). Although the micropolar fluids belongs to a class of non-Newtonian fluids, no flattening in the velocity profile due to the shear thinning effect is observed. Differences of angular velocity between the Newtonian and two representative micropolar cases (i.e., and ) are presented in Figure 7b. It should be noticed that in the case of the Newtonian fluid, no angular velocity is observed. On the other hand, as the vortex viscosity increases, the angular velocity is increased (Figure 7b). The velocity in the center of the carotid is higher in the case of micropolarity (i.e., ) than in the Newtonian one. The velocity at the center of the tube for each micropolar case scaled by the Newtonian one is presented in Figure 7c. As m increases, higher centerline velocities compared to the Newtonian case are observed (Figure 7c). On the other hand, the velocity of the fluid near the walls of the carotid is decreased (Figure 7d) in all of the simulated cases as compared to the Newtonian case. Furthermore, as the vortex viscosity increases, the velocity of the fluid near the walls is decreased, as is depicted in Figure 7d.
In this study, the velocity difference between the micropolar cases as m increases and the Newtonian fluid is investigated in order to examine its variability between the two kind of fluid models. This difference is defined as:
where, is the velocity of the corresponding micropolar case and is the velocity of the Newtonian case. The percentage difference of the shear stress between the micropolar cases and the Newtonian fluid in the carotid wall is defined as:
where, is the shear stress in the carotid walls of the corresponding micropolar case and is the shear stress in the carotid’s walls of the Newtonian case. The angular velocity as a consequence of micropolarity are studied in terms of percentage difference between the base micropolar case of and the cases with higher m. This difference is defined as:
where, is the angular velocity of the corresponding micropolar case and is the angular velocity of the micropolar case where .
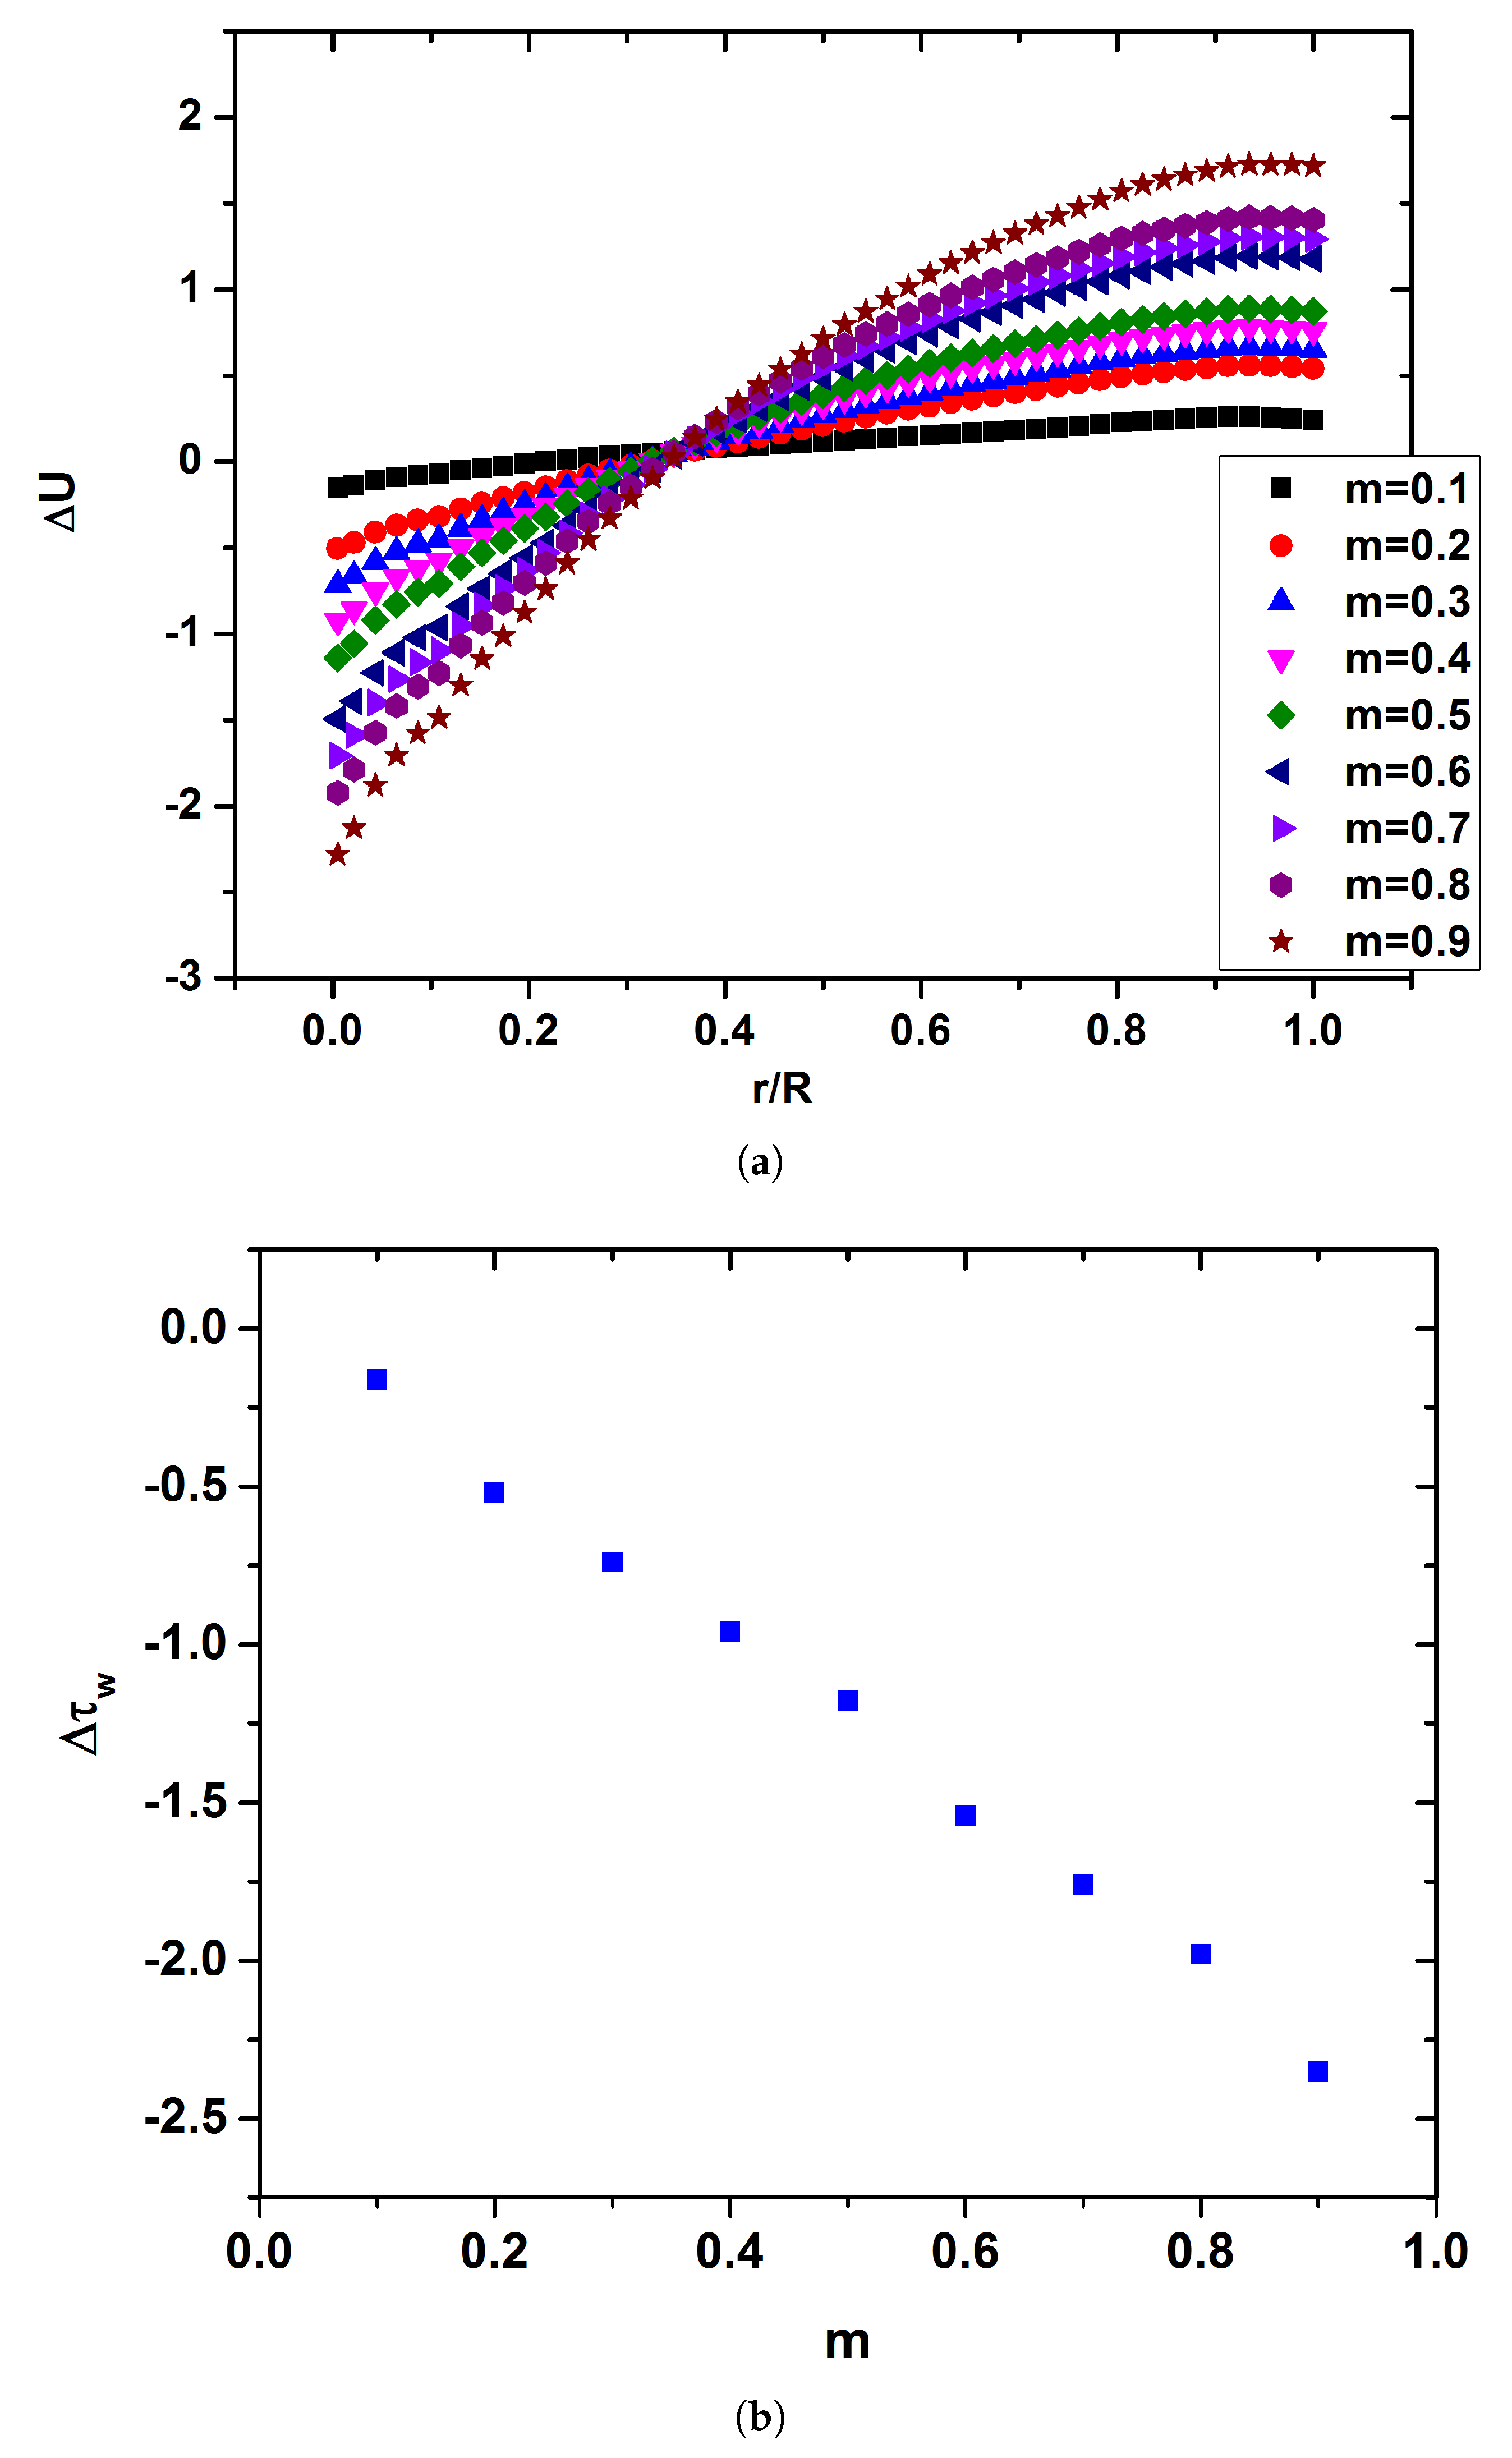
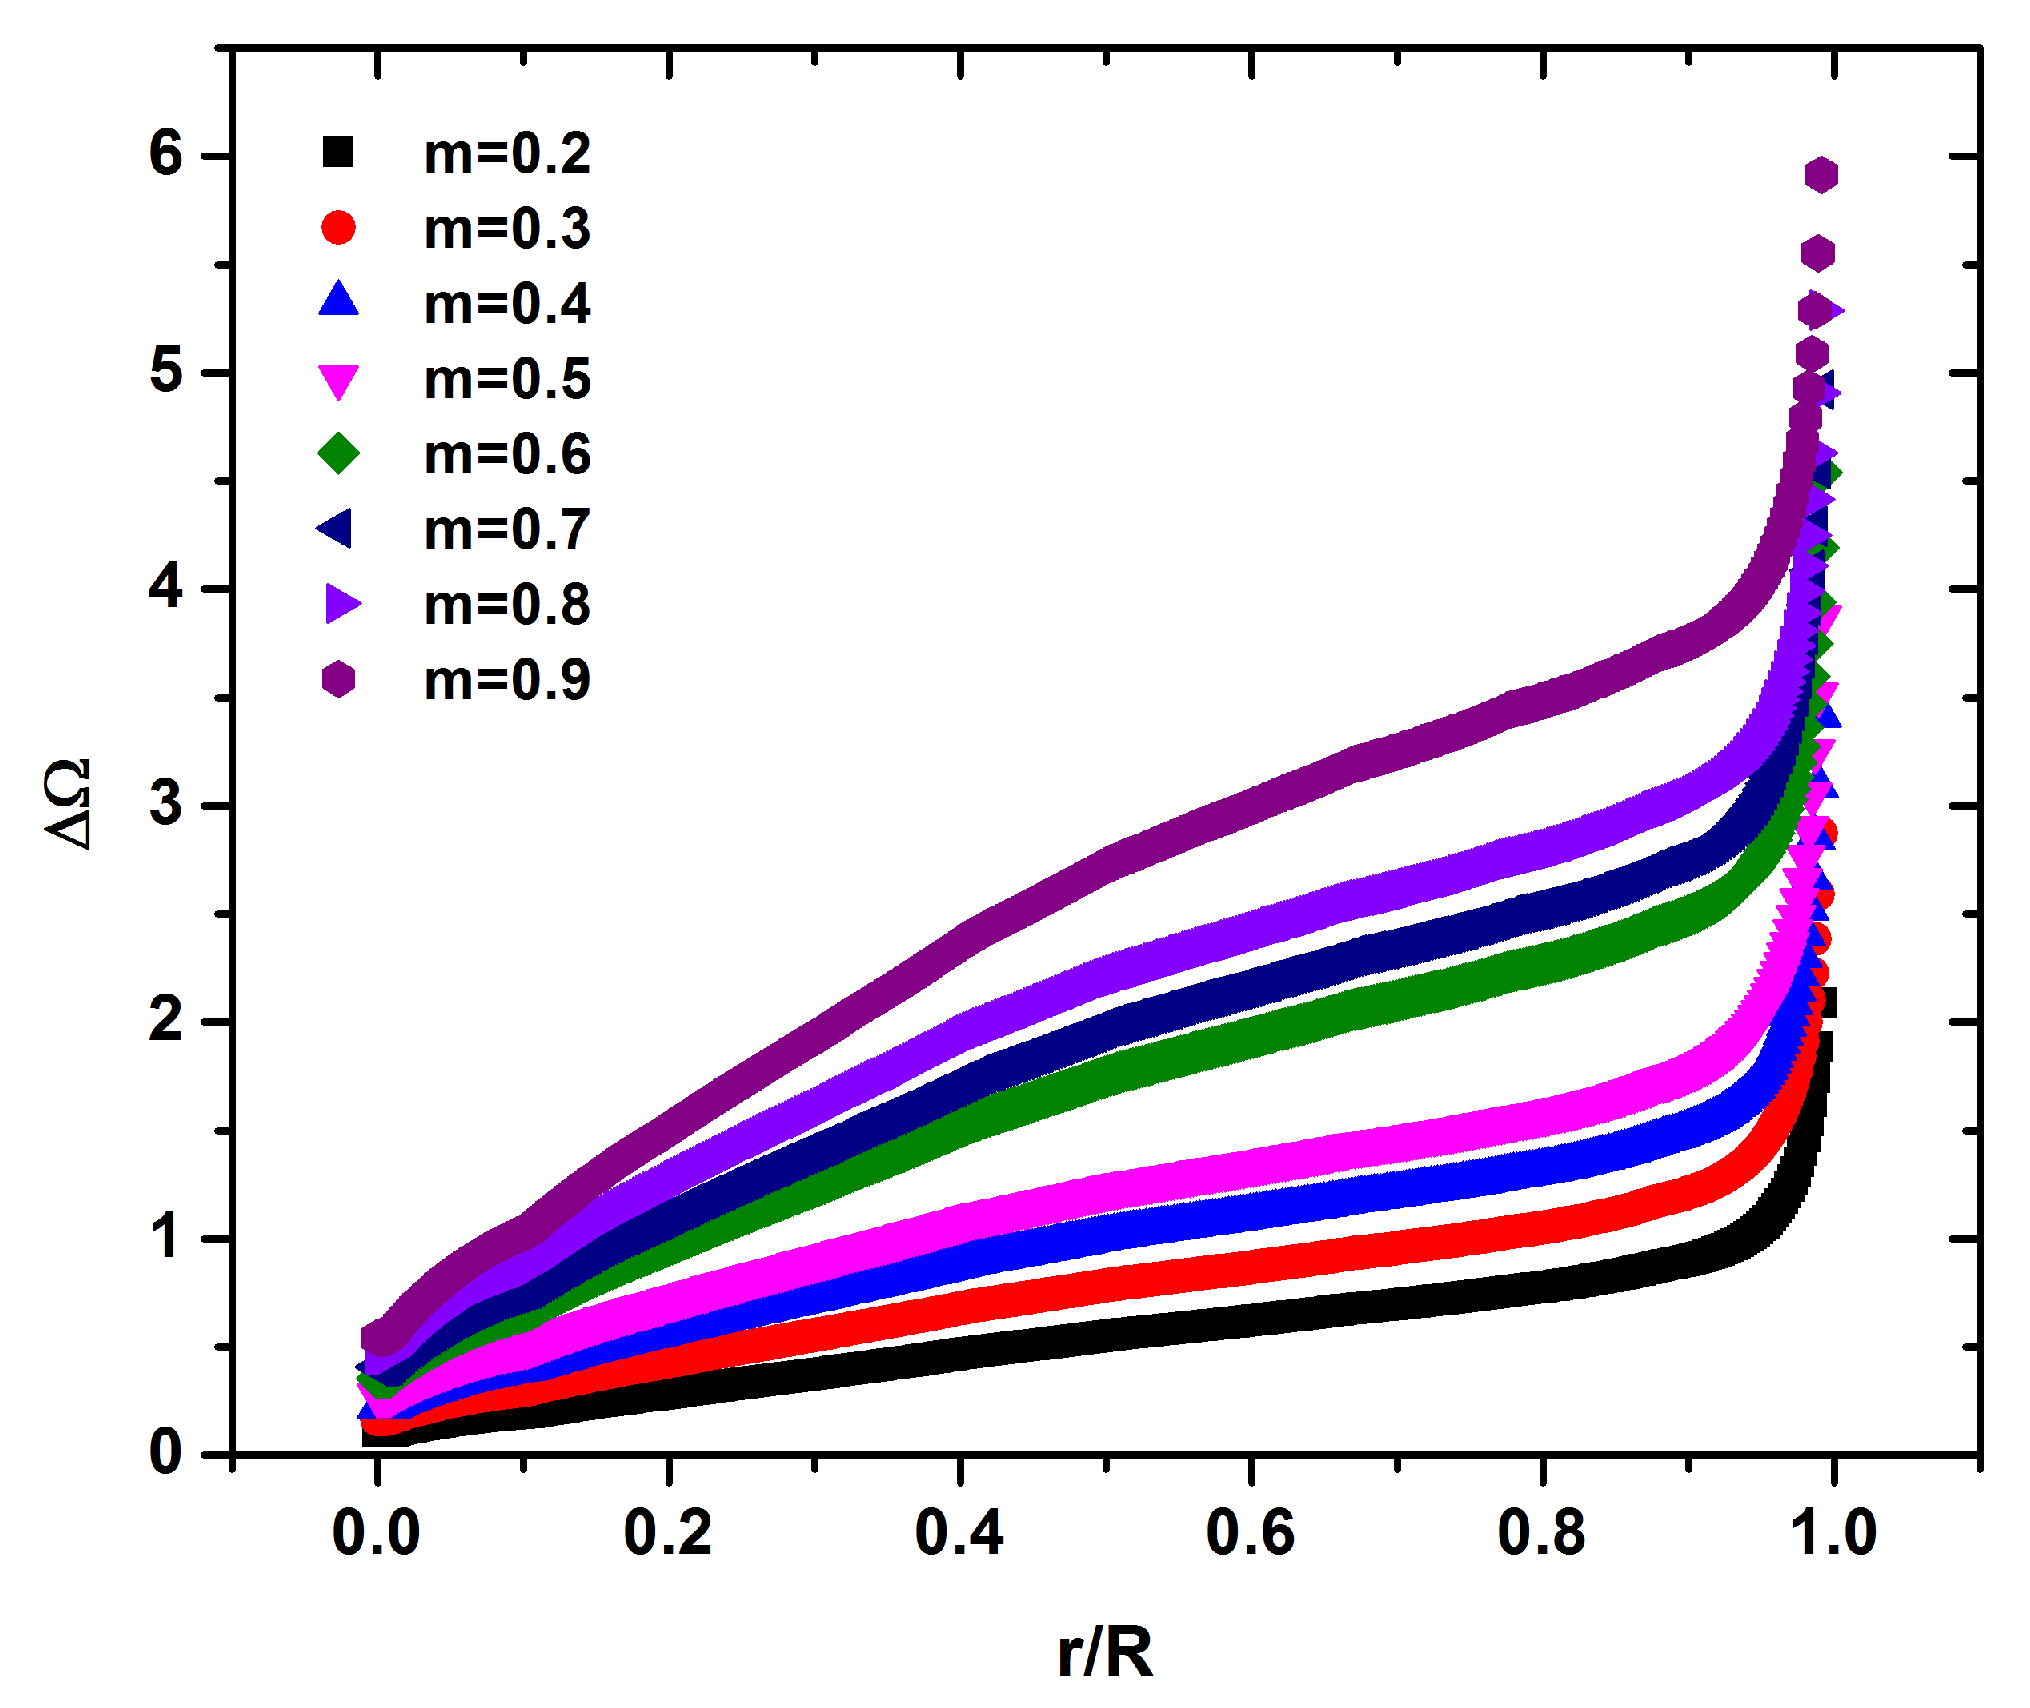
The among the different values of the vortex viscosity and the Newtonian fluid is presented in Figure 8a. As the micropolar parameter is increased the velocity of blood in the center of the carotid’s tube is also increased compared to the Newtonian fluid, as is depicted in Figure 8. On the other hand, blood velocity is decreased in the walls of the artery with the increase of m. Consequently, it is novelty found that the increased micropolarity of the blood leads to an acceleration of the flow in the middle of the carotid and a deceleration of the flow near the boundaries. It should be noticed also that this different m trend is reversed at as it is compiled for the profiles of Figure 8a. This mark the thickness of micropolar boundary layer and corresponds to the maximum value as it is shown in Figure 7b.
The deceleration of the flow near the walls leads to a decrease in the shear stress. The rate in which is decreased as the vortex viscosity is increased it is depicted in Figure 8b. As the vortex viscosity increased, a linear decrease of is observed. Although the decrease of in the micropolar case of is marginally, in the case of micropolarity reaches ≈2.5%. It should be noticed that this is a very significant results since low shear stress values in the walls of the vessels may be connected with the accumulation of plaque.
At the center of the carotid tube the flow is increased approximately by for the case of , while the flow is decelerated approximately by near the boundaries as compared to the Newtonian case. Thus, an overall difference of about may be recorded for the higher m. This effect is caused due to the enhanced contribution by the angular velocity that is occurred with the increase of the vortex viscosity in the middle of carotid tube, as is depicted in Figure 9. In the representative case of , is increased about near the in the center of carotid tube while this increase is about near the carotid walls compared to the case of (Figure 9).
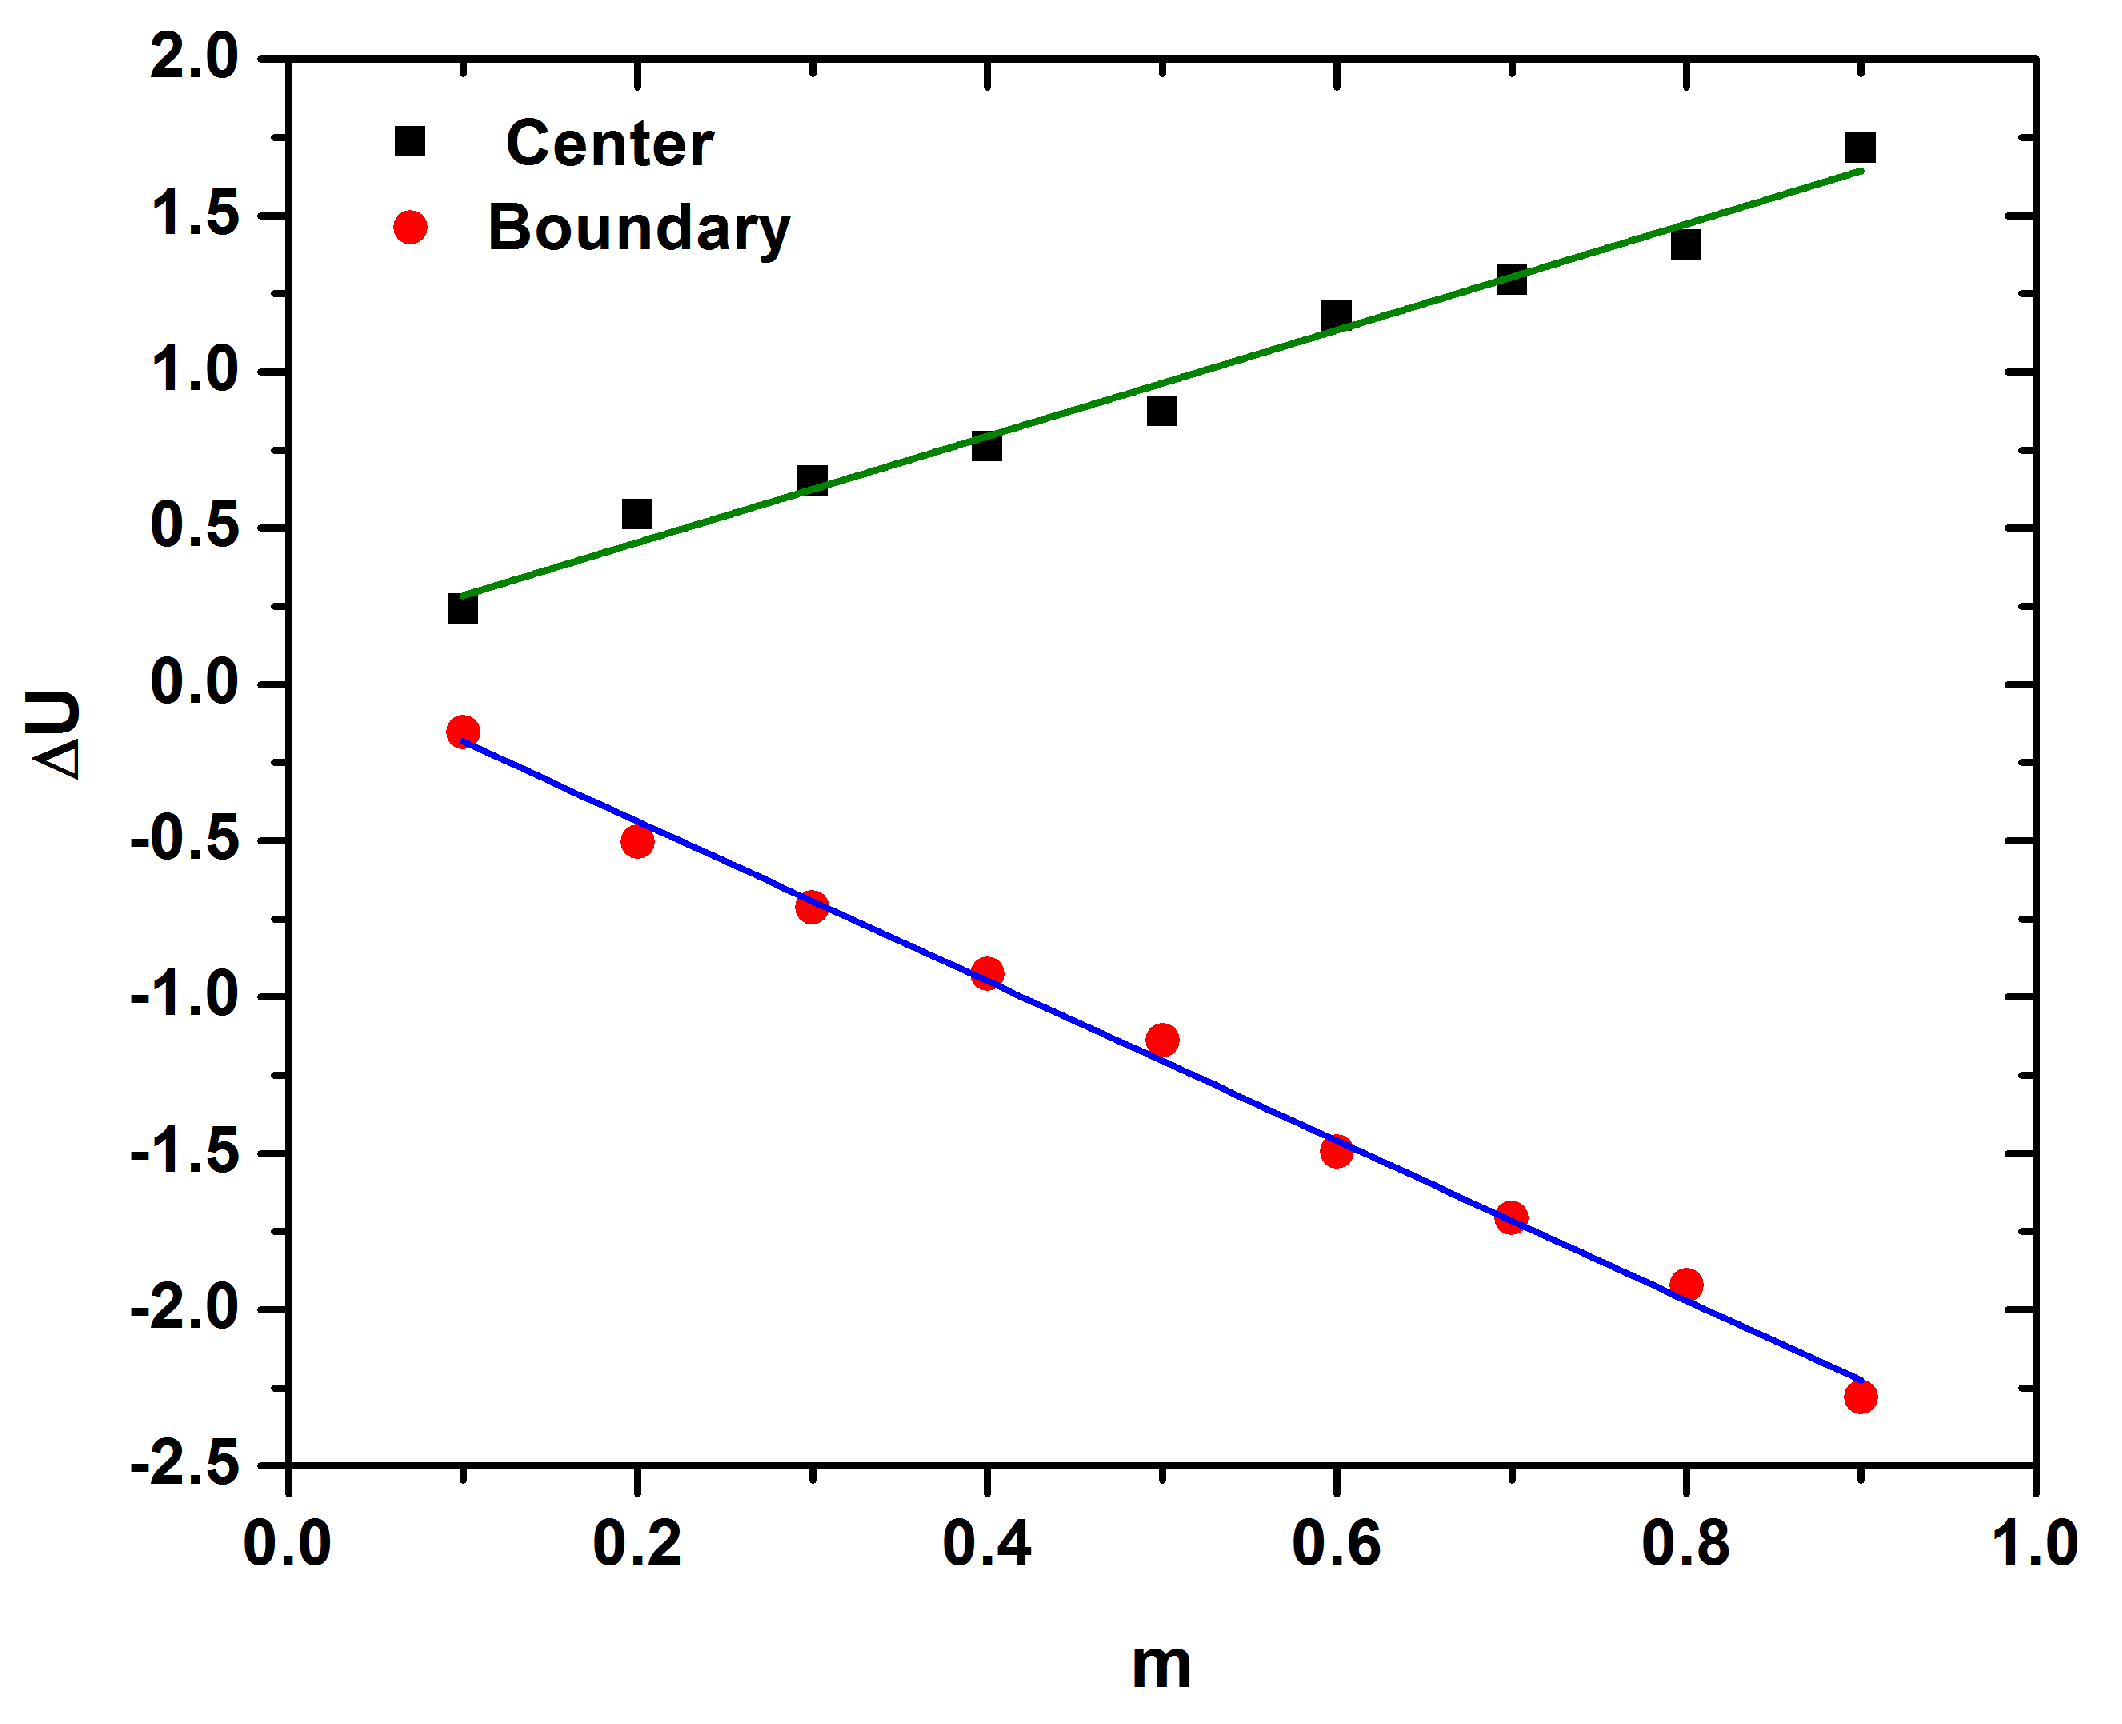
is increased at the center while is decreased in the boundary of the carotid as is presented in Figure 8a. The differerence of in the center and the boundary of the tube is almost a linear function of m, as described by the following equations:
It should be noticed that the decrease of in the boundary is steeper compared to the increase of the in the carotid’s center, as is depicted in Figure 10.
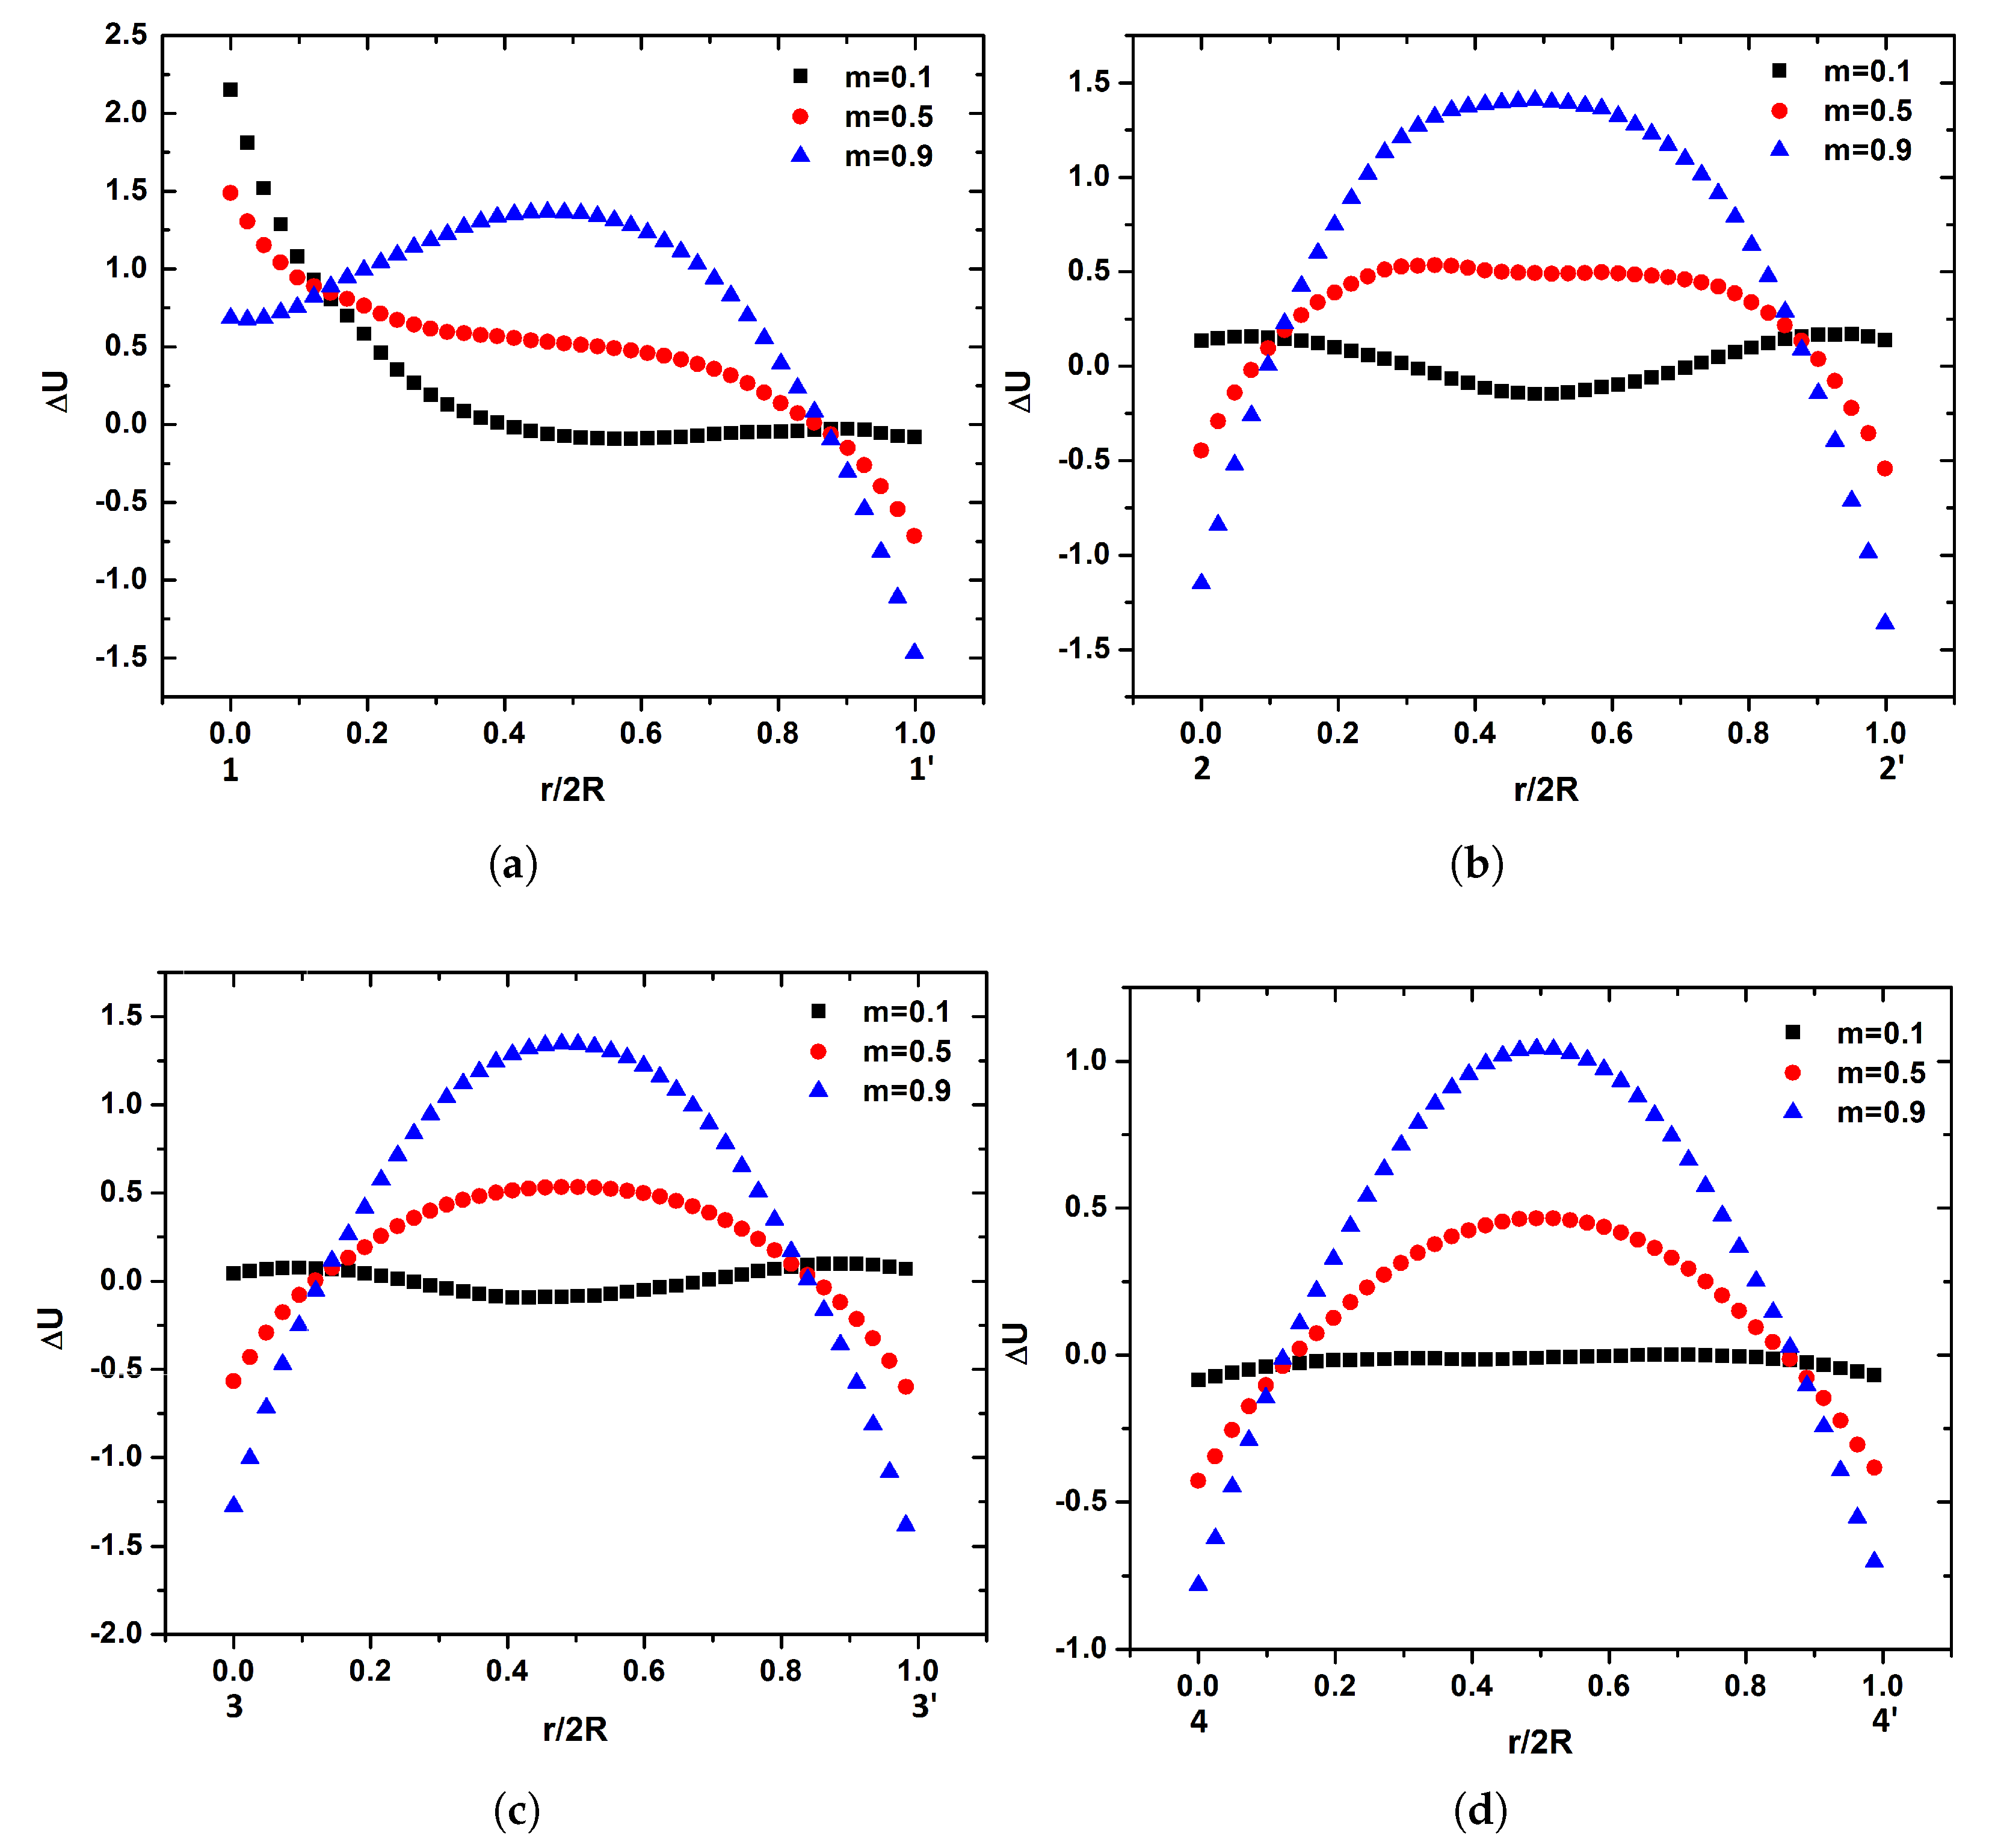
The x component of distribution of along the specified locations of the internal carotid artery ( see Figure 1) for the representative micropolar cases of and is presented in Figure 11. Many differences in the fluid flow compared to the Newtonian one due to the geometry and the micropolarity of the fluid are found as the flow moves towards to the internal carotid. In the monitoring position , increased fluid flow in the side of the divider wall in all micropolar cases compared to the Newtonian one is observed (Figure 11a). As the vortex viscosity is increased, is decreased in the side of the divider wall. Significant changes in the fluid flow profile among the representative cases of Figure 11a are observed. A difference in the range of % to is found as m changes from to that occurs in different sides of the vessel depending on m. In the case of , increased fluid flow compared to the Newtonian one from the side of the divider wall till is observed. On the other hand, marginally decreased of the fluid flow compared to the Newtonian one for is observed. As the vortex viscosity increased, the fluid flow difference is increased by and approximately by in the center of the tube for and , respectively. It should be noticed that as the vortex viscosity is increased , the fluid flow difference is significantly decreased compared to the Newtonian one for till the outer wall of the internal carotid. This reduction is approximately with micropolar fluid.
As the fluid moves towards the internal carotid, the profile of the flow presents significant changes as it is depicted in Figure 11b for the location . In the case of , is increased in the carotid boundaries while is decreased in the center of the tube. As the vortex viscosity is increased, a parabolic is established. It should be noticed that the increase of m have a significant effect in the parabolic profile of . An increase of m leads to minimization in the flattening of the parabolic flow. Although is increased in the center of the tube, it is decreased in the same way close to both divider and outer walls of the carotid internal artery (Figure 11b).
When flow reaches the monitoring location , only small changes are observed from location (Figure 1). In the case of , the decrease of the flow in the center of the tube is minimized while in the cases of and the flattening of the parabolic flow difference is eliminated (Figure 11c). is increased in the center of the tube by and while is decreased in the boundaries by and in the cases of and (Figure 11c), respectively.
At the last monitoring location of the internal carotid, negative values of width wise of the carotid tube are observed in the case of . Higher values of m, leads to increased compared to the Newtonian one in the center of the tube (Figure 11d). On the other hand, the flow is decreased by and at both the divider and outer walls for the case of and , respectively. It should be noticed that the decrease in the flow for the cases of and in the measurement location is smaller as compared along the measurement location . From the above it is obvious that as the diameter of the artery is decreased, the differences due to m are reduced from about 4% to .
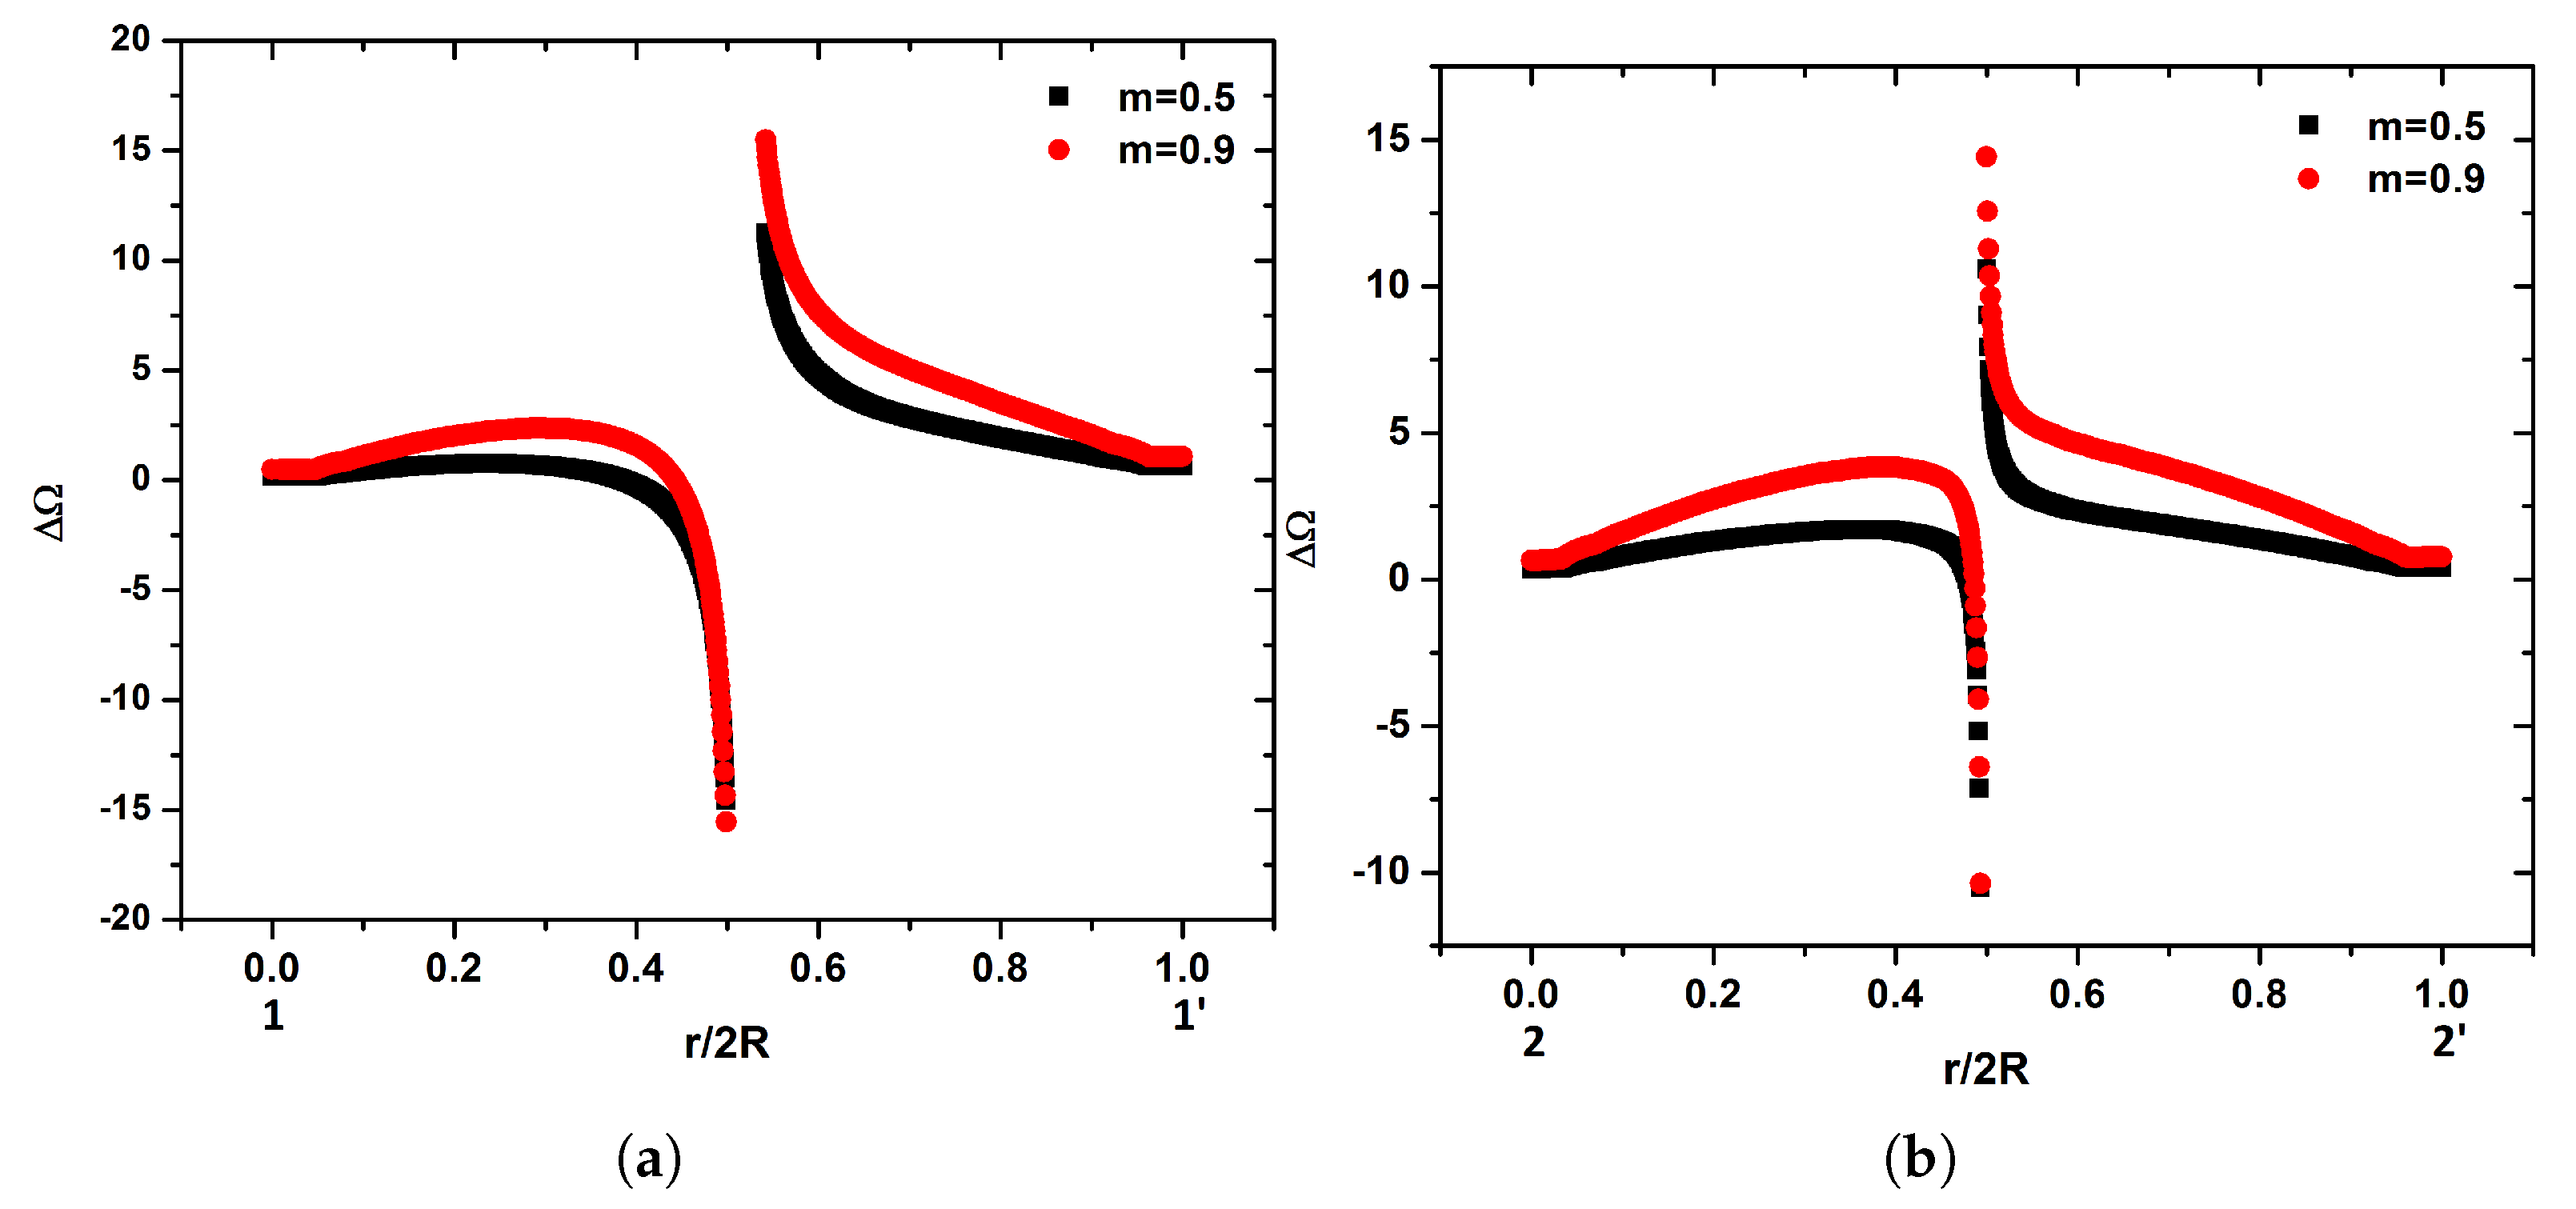
Since no angular velocity is presented in the Newtonian fluid, all the cases are compared to the base case of . In the measurement position the angular velocity of the micropolar fluid presents significant changes in the center of the tube as the vortex viscosity increases as it is depicted in Figure 12a. Due to its definition at r = 0. The maximum value of reaches near the center of the tube for both cases. On the other hand, in the case of a steeper increase in is observed compared to the case of .
In the monitoring position , a completely different evolution of the angular velocity compared to the position is observed. A steeper difference of between the cases of and is found, as it is depicted in Figure 12b. It should be noticed that the differences are more pronounced compared to the location . In addition, differences in the maximum are observed in the center of the tube.
As the flow moves and reaches the position , no significant changes compared to the measurement position are observed, as it is depicted in Figure 12c. In the final monitoring position (i.e., position 44’), no significant change in the profile of for both cases compared with the positions 22 and is observed. On the other hand, the values of are decreased, as it is shown in Figure 12d. The maximum values for are and for the cases of and , respectively. Based on the results from Figure 12, it is clear that the profile of the angular velocity is affected by the geometry.
4. Discussion
In the past, non-Newtonian effects have only been considered in small arteries with diameter smaller than 100 m [34]. On the other hand, the behavior of blood presents significant differences as flows through the vascular system of the human. This is caused by the substances that are carried by it, such as red blood cells. These substances are highly deformable [35], especially when the diameter of the capillaries change [36]. Furthermore, red blood cells can create aggregations [37]. In this study, several simulations are performed in order to investigate the microrotation effect of the carried elements in the micropolar blood flow inside a human carotid model [15]. The comparison between different kind of fluids indicate the variations in the fluid flow that can occur.
An increase in the vortex viscosity of the micropolar fluid is found to lead to an increase in blood velocity in the center of the carotid tube while the velocity is decreased near its boundaries as compared to the Newtonian fluid, as it is depicted in Figure 8. Consequently, the boundary layer thickness is increase as the vortex viscosity is increased. In addition, the shear stress on the carotid wall is decreased as the vortex viscosity increases compared to a Newtonian flow. Therefore, the micropolarity of the fluid plays an important role in the distribution of the flow inside human vessels. In addition, accumulation of particles on the surface of the vessels is connected to low values of the shear stress on the vessel walls [38]. This is very significant result since smaller shear stress near the boundaries of the vessels compared to a Newtonian fluid will enhance the deposition of those elements potentially reducing the vessel area available to blood flow, as well as affecting the mechanical properties of the artery walls.
A significant effect is induced by the interaction among the carried elements. Given the fact that blood velocity is increased in the center of the carotid tube and it is decelerated near the walls, as compared to a Newtonian fluid, with the increase of the vortex viscosity, it seems that the angular motion of those microelements has decreased the collisions among them in the center of the tube. On the other hand, increased collisions among the microelements and the walls of the carotid are occurring [16].
in the center of the carotid tube is linearly increased with the increase of the vortex viscosity m and linearly decreased in the boundaries, as is depicted in Figure 10. The slope of decrease is steeper compared the one of increase. Consequently, as the vortex viscosity increases, the difference between and will increase.
The geometry is a crucial parameter for the development of the flow. Based on the results in the internal carotid artery (Figure 11), under small values of m, the is decreased. The same result is presented in recent studies [16,24] where the fluid flow inside ligament tissues was investigated. Consequently, in small arteries and especially in arterioles the micropolarity of the fluid is a parameter that decreases the . This is caused due to the small diameter of arteries and arterioles, as the blood cannot sustain the angular motion of the micro-elements.
Micropolarity of the fluid seems to play significant role in the distribution of the flow. As the flow advances through the arteries, the flattening of the parabolic profile of is affected by the vortex viscosity and geometry. Based on Figure 11, flattening of the parabolic profile of may be occurred inside the arteries under small values of the vortex viscosity.
The magnitude of the angular velocity is affected by the micropolarity of the fluid. As the vortex viscosity increases, the angular velocity is increased. It should be noticed that the profile of is affected by the geometry. Differences in may occur in different radial directions of the carotid, as is depicted in Figure 12. These differences may be increased in complex geometries such as the human vascular system.
5. Conclusions
Although there is a large number of studies that investigates the blood flow inside human artery system, only a few of them takes into consideration the rotation of the blood elements in the fluid flow.
In this study, a micropolar model is used in order to investigate the blood flow by taking into consideration the rotation effect of blood elements in a representative artery model namely, the carotid artery. This model is found suitable to predict the blood flow inside the human arterial system since it is successfully validated against analytic solution and numerical measurement [12,33], respectively.
Based on the results from the numerical model we conclude that the increase of the blood micropolarity leads to an increase of the blood velocity in the center of the vessels while it is decreased in the boundaries compared to a Newtonian fluid. This is an indication that the increase of the fluid micropolarity leads to an increase of the boundary layer thickness. In addition, the shear stress on the walls of the carotid is decreased with the increase of m compared to a Newtonian flow. Furthermore, the angular velocity increases as the vortex viscosity is increased. Moreover, the magnitude and the profile of the microrotation of the fluid is affected by the vortex viscosity and geometry.
The results from the present study could be further investigated in order to connect the effect of the angular velocity and the deposition of plaque in human arterial system. The latter would have serious consequences since it would help patients’ social life as well as minimize the economic burden due to the health care expenditures.
Author Contributions
Conceptualization, E.K.; Data curation, G.S.; Formal analysis, E.K. and G.S.; Funding acquisition, E.K.; Investigation, E.K.; Methodology, G.S. and T.P.; Project administration, I.S.; Resources, I.S. and T.P.; Software, I.S. and T.P.; Visualization, G.S.; Writing—original draft, E.K.; Writing—review and editing, I.S. All authors have read and agreed to the published version of the manuscript.
Funding
This research is partially co-financed by Greece and the European Union (European Social Fund-ESF) through the Operational Program ≪ Human Resources Development, Education and Lifelong Learning ≫ in the context of the project ”Reinforcement of Postdoctoral Researchers—2nd Cycle” (MIS-5033021), implemented by the State Scholarships Foundation (IKY).
Conflicts of Interest
The authors declare no conflict of interest.
Nomenclature
| Fluid velocity | m/s | |
| dynamic viscosity | kg m/s | |
| Rotational viscosity | m2/s | |
| angular velocity | 1/s | |
| Material coefficient | g cm/s | |
| j | Micro inertia | m2 |
| m | Vortex viscosity | - |
| N | Spin-gradient viscosity | - |
| Re | Reynolds number | - |
| Density of micropolar fluid | kg/m3 | |
| Cross sectional average velocity | m/s | |
| D | Diameter | m |
| r | Radius | m |
| Non dimensional linear velocity | - | |
| Non dimensional angular velocity | - | |
| J | Non dimensional micro inertia | - |
| p | Non dimensional pressure | - |
| Percentage difference between micropolar and Newtonian velocities | - | |
| Percentage difference between micropolar and Newtonian shear stresses | - | |
| Percentage difference between the base micropolar case and the cases with higher | - | |
| h | width | m |
References
- Ku, D.N. Blood flow in arteries. Annu. Rev. Fluid Mech. 1997, 29, 399–434. [Google Scholar] [CrossRef]
- Abdelsalam, I.S.; Vafai, K. Particulate suspension effect on peristaltically induced unsteady pulsatile flow in a narrow artery: Blood flow model. Math. Biosci. 2017, 283, 91–105. [Google Scholar] [CrossRef]
- Abdelsalam, I.S.; Bhatti, M.M. The impact of impinging TiO 2 nanoparticles in Prandtl nanofluid along with endoscopic and variable magnetic field effects on peristaltic blood flow. Multidiscip. Model. Mater. Struct. 2018, 14, 530–548. [Google Scholar] [CrossRef]
- Bhatti, M.M.; Marin, M.; Zeeshan, A.; Ellahi, R.; Abdelsalam, S.I. Swimming of Motile Gyrotactic Microorganisms and Nanoparticles in Blood Flow Through Anisotropically Tapered Arteries. Front. Phys. 2020, 8, 95. [Google Scholar] [CrossRef] [Green Version]
- Waite, L. Biofluid Mechanics in Cardiovascular Systems; Biomedical Engineering; McGraw-Hill: New York, NY, USA, 2006. [Google Scholar]
- Hamerman, D.; Rosenberg, L.C.; Schubert, M. Diarthroidal joints resisted. J. Bone Jt. Surg. 1970, 52, 725. [Google Scholar] [CrossRef]
- Ju, M.; Ye, S.S.; Namgung, B.; Cho, S.; Low, H.T.; Leo, H.L.; Kim, S. A review of numerical methods for red blood cell flow simulation. Comput. Methods Biomech. Biomed. Eng. 2015, 18, 130–140. [Google Scholar] [CrossRef]
- Farina, A.; Mikelić, A.; Saccomandi, G.; Sequeira, A.; Toro, E.F. Non-Newtonian Fluid Mechanics and Complex Flows; Lecture Notes in Mathematics, CIME Foundation Subseries; Springer: Levico Terme, Italy, 2016. [Google Scholar]
- Mehri, R. Red Blood Cell Aggregates and Their Effect on non-Newtonian Blood Viscosity at Low Hematocrit in a Two-Fluid Low Shear Rate Microfluidic System. PLoS ONE 1998, 13, e0199911. [Google Scholar] [CrossRef] [PubMed]
- Tandon, P.N.; Misra, J.K.; Gupta, R.S. Role of ultrafiltration of synovial fluid in lubrication of human joints. Int. J. Mech. Sci. 1985, 27, 29–37. [Google Scholar] [CrossRef]
- Verma, P.; Sehgal, M. Couette flow of micropolar fluids. Int. J. Eng. Sci. 1968, 6, 233–238. [Google Scholar] [CrossRef]
- Eringen, A.C. Theory of micropolar fluids. Theory Appl. J. Math. Mech. 1966, 16, 1–18. [Google Scholar] [CrossRef]
- Calmelet-Eluhu, C.; Majumdar, D.R. Flow of a Micropolar Fluid through a Circular Cylinder Subject to Longitudinal and Torsional Oscillations. Math. Comput. Model. 1998, 27, 69–78. [Google Scholar] [CrossRef]
- Ashmawy, E. Unsteady Couette flow of a micropolar fluid with slip. Meccanica 2012, 47, 85–94. [Google Scholar] [CrossRef]
- Lukaszewicz, G. Micropolar Fluids-Theory and Applications; Springer: New York, NY, USA, 1999. [Google Scholar]
- Karvelas, E.; Tsiantis, A.; Papathanasiou, T. Effect of micropolar fluid properties on the hydraulic permeability of fibrous biomaterials. Comput. Methods Programs Biomed. 2020, 185, 105135. [Google Scholar] [CrossRef] [PubMed]
- Secomb, T.W.; Pries, A.R. Blood viscosity in microvessels: Experiment and theory. C. R. Phys. 2013, 14, 470–478. [Google Scholar] [CrossRef] [PubMed] [Green Version]
- Yeom, E.; Kang, Y.J.; Lee, S.J. Changes in velocity profile according to blood viscosity in a microchannel. Biomicrofluidics 2014, 8, 034110. [Google Scholar] [CrossRef] [PubMed] [Green Version]
- McDonald, D.A. Blood Flow in Arteries; Williams & Wilkins: Baltimore, MD, USA, 1960. [Google Scholar]
- Fox, J.A.; Hugh, A.F. Localization of atheroma: A theory based on boundary layer separation. Br. Heart J. 1966, 28, 388–399. [Google Scholar] [CrossRef] [PubMed] [Green Version]
- Fry, D.L. Certain histological and chemical responses of the vascular interface to acutely induced mechanical stress in the aorta of the dog. Circ. Res. 1969, 24, 93–108. [Google Scholar] [CrossRef] [PubMed] [Green Version]
- Karvelas, E.; Lampropoulos, N.; Sarris, I. A numerical model for aggregations formation and magnetic driving of spherical particles based on OpenFOAM®. Comput. Methods Programs Biomed. 2017, 42, 21–30. [Google Scholar] [CrossRef]
- Karvelas, E.; Karakasidis, T.; Sarris, I. Computational analysis of paramagnetic spherical Fe3O4 nanoparticles under permanent magnetic fields. Comput. Mater. Sci. 2018, 154, 464–471. [Google Scholar] [CrossRef]
- Erisken, C.; Tsiantis, A.; Papathanasiou, T.; Karvelas, E. Collagen Fibril Diameter Distribution Affects Permeability of Ligament Tissue: A Computational Study on Healthy and Injured Tissues. Comput. Methods Programs Biomed. 2020, 196, 105554. [Google Scholar] [CrossRef]
- Ashrafian, H. Anatomically specific clinical examination of the carotid arterial tree. Anat. Sci. Int. 2007, 82, 16–23. [Google Scholar] [CrossRef] [PubMed]
- Manbachi, A.; Hoi, Y.; Wasserman, B.A.; Lakatta, E.G.; Steinman, D.A. On the shape of the common carotid artery with implications for blood velocity profiles. Physiol. Meas. 2011, 32, 1885–1897. [Google Scholar] [CrossRef] [PubMed] [Green Version]
- Weller, H.; Tabor, G.; Jasak, H.; Fureby, C. A tensorial approach to computational continuum mechanics using object-oriented techniques. Comput. Phys. 2010, 12, 620–631. [Google Scholar] [CrossRef]
- Chakravarty, S.; Mandal, P.K. Heat transfer to micropolar fluid flowing through an irregular arterial constriction. Int. J. Heat Mass Transf. 2013, 56, 538–551. [Google Scholar]
- Gijsen, F.J.H.; Palmen, D.E.M.; Van der Beek, M.H.E.; Van de Vosse, F.N.; Van Dongen, M.E.H.; Janssen, J.D. Analysis of the flow field in stenosed carotid artery bifurcation models-LDA experiments. J. Biomech. 1996, 29, 1483–1489. [Google Scholar] [CrossRef]
- Ariman, T.; Turk, M.A.; Sylvester, N.D. On steady and Pulsatile Flow of Blood. J. Appl. Mech. 1974, 41, 1–7. [Google Scholar] [CrossRef]
- Bharadvaj, B.K.; Mabon, R.F.; Giddens, D.P. Steady flow in a model of a human carotid bifurcation. Part 1-Flow visualization. J. Biomech. 1982, 15, 349–362. [Google Scholar] [CrossRef]
- Koutsoukos, T.; Manolis, T. Simulation of Micropolar Fluid Flows: Validation of Numerical Results with Analytical Solutions. Bachelor Thesis, University of Thessaly, Volos, Greece, 2018. Available online: http://ir.lib.uth.gr//handle/11615/49165 (accessed on 28 July 2020).
- Hogan, H.A.; Henriksen, M. An evaluation of a micropolar model for blood flow through an idealized stenosis. J. Biomech. 1989, 22, 211–218. [Google Scholar] [CrossRef]
- Sankar, S.A.; Hemalatha, K. A non-Newtonian fluid flow model for blood flow through a catheterized artery—Steady flow. Appl. Math. Model. 2007, 31, 1847–1864. [Google Scholar] [CrossRef] [Green Version]
- Gregersen, M.I.; Bryant, C.A.; Hamerle, W.E.; Usami, S.; Chien, S. Flow Characteristics of Human Erythrocytes through Polycarbonate Sieves. Science 1967, 157, 825–827. [Google Scholar] [CrossRef]
- Branemark, P.I. Intravascular Anatomy of Blood Cells in Man; S. Karger: New York, NY, USA, 1971. [Google Scholar]
- Tripette, J. Red blood cell aggregation, aggregate strength and oxygen transport potential of blood are abnormal in both homozygous sickle cell anemia and sickle-hemoglobin C disease. Haematologica 2009, 94, 1060–1065. [Google Scholar] [CrossRef] [PubMed]
- White, R. Atherosclerosis and Arteriosclerosis; CRC Press: Boca Raton, FL, USA; Taylor & Francis Group: New York, NY, USA, 1989. [Google Scholar]
Figure 1.
Side view of the computational geometry of carotid and indication of measurement locations (red lines).
Figure 1.
Side view of the computational geometry of carotid and indication of measurement locations (red lines).

Figure 2.
Velocity in the outlet 1 of the carotid model under different number of computational cells for the representative case of .
Figure 2.
Velocity in the outlet 1 of the carotid model under different number of computational cells for the representative case of .

Figure 3.
Computational mesh at the (a) inlet, and (b) inside of the carotid bifurcation.

Figure 4.
Numerical and analytical results for (a) velocity, and (b) microrotation for the case G = 2.70, A = 6.53, a = 1.96, h = 0.01 [32].
Figure 4.
Numerical and analytical results for (a) velocity, and (b) microrotation for the case G = 2.70, A = 6.53, a = 1.96, h = 0.01 [32].

Figure 5.
(a) Idealized stenosis geometry and (b) Comparison of the velocity profiles between the present study and Ref. [33].
Figure 5.
(a) Idealized stenosis geometry and (b) Comparison of the velocity profiles between the present study and Ref. [33].

Figure 6.
Streamlines and velocity contours in selected normal planes for .

Figure 7.
Blood (a) velocity, (b) microrotation, (c) velocity in the center of the tube, and (d) velocity near common carotid’s walls.
Figure 7.
Blood (a) velocity, (b) microrotation, (c) velocity in the center of the tube, and (d) velocity near common carotid’s walls.

Figure 8.
Difference among the Newtonian fluid and the micropolar cases, for (a) velocity (the first data point from each graph correspond to ), and (b) shear stress.
Figure 8.
Difference among the Newtonian fluid and the micropolar cases, for (a) velocity (the first data point from each graph correspond to ), and (b) shear stress.

Figure 9.
Microrotation percentage difference from the micropolar case .

Figure 10.
in the center of the tube (black squares) and near the boundaries (red dots). Green and blue lines indicates fitting of data.
Figure 10.
in the center of the tube (black squares) and near the boundaries (red dots). Green and blue lines indicates fitting of data.

Figure 11.
along different locations in the internal carotid artery: (a) , (b) , (c) , and (d) .

Figure 12.
along the monitoring locations in the internal carotid artery: (a) , (b) , (c) 33, and (d) .
Figure 12.
along the monitoring locations in the internal carotid artery: (a) , (b) , (c) 33, and (d) .


© 2020 by the authors. Licensee MDPI, Basel, Switzerland. This article is an open access article distributed under the terms and conditions of the Creative Commons Attribution (CC BY) license (http://creativecommons.org/licenses/by/4.0/).
Share and Cite
MDPI and ACS Style
Karvelas, E.; Sofiadis, G.; Papathanasiou, T.; Sarris, I. Effect of Micropolar Fluid Properties on the Blood Flow in a Human Carotid Model. Fluids 2020, 5, 125. https://doi.org/10.3390/fluids5030125
AMA Style
Karvelas E, Sofiadis G, Papathanasiou T, Sarris I. Effect of Micropolar Fluid Properties on the Blood Flow in a Human Carotid Model. Fluids. 2020; 5(3):125. https://doi.org/10.3390/fluids5030125
Chicago/Turabian StyleKarvelas, Evangelos, Giorgos Sofiadis, Thanasis Papathanasiou, and Ioannis Sarris. 2020. "Effect of Micropolar Fluid Properties on the Blood Flow in a Human Carotid Model" Fluids 5, no. 3: 125. https://doi.org/10.3390/fluids5030125