

Spatial Density, Biomass, and Composition of Crustacean Zooplankton on Lake Michigan Beaches

1
School of Natural Resources, Lake Superior State University, Sault Sainte Marie, MI 49783, USA
2
Center for Freshwater Research and Education, Lake Superior State University, Sault Sainte Marie, MI 49783, USA
3
Sault Ste. Marie Tribe of Chippewa Indians, Sault Sainte Marie, MI 49783, USA
*
Author to whom correspondence should be addressed.
†
Current address: Oklahoma Department of Wildlife Conservation, Porter, OK 74014, USA.
Fishes 2023, 8(12), 599; https://doi.org/10.3390/fishes8120599
Submission received: 28 October 2023
/
Revised: 20 November 2023
/
Accepted: 4 December 2023
/
Published: 6 December 2023
Abstract
:Ecosystem alterations to Lake Michigan (LM), such as the invasion of dreissenid mussels, have decreased the abundance of phytoplankton and, subsequently, zooplankton, which has implications for Great Lake fisheries. The community composition of zooplankton has also been altered over the past 20 years in LM, shifting the summer dominance from cladoceran to calanoid taxa. However, most of our information on zooplankton community dynamics is from deeper pelagic zones. The nearshore beach (≤1 m) habitat, which serves as a critical nursery for some larvae and juvenile fish, is composed of different zooplankton taxa than deeper zones, but limited data are available for comparison. We conducted a standardized summer sampling campaign to characterize the zooplankton community across 32 beaches in LM. We found the lowest crustacean zooplankton density and biomass on northern LM beaches and a higher zooplankton density and biomass on Greater Green Bay and central LM beaches, which had warmer water temperatures. Smaller-bodied cladocera (mainly Bosmina) and cyclopoid taxa were the most abundant groups on beaches. Our results provide the first comprehensive characterization of zooplankton on beaches in the Great Lakes, with applications for other lake systems. These results may help identify potential “hot spots” of fish recruitment for management.
Key Contribution: Limited information exists regarding zooplankton density, biomass, and community composition on shallow beach (≤1 m water depth) habitats in lakes, which serve as an important nursery habitat for many fish. We found these habitats to consist of mainly small-bodied cladocera and cyclopoid taxa, which is a much different community than the zooplankton typically found in deeper pelagic zones.
1. Introduction
Phytoplankton, and subsequently zooplankton density, [1,2] have decreased in Lakes Michigan (LM) and Huron (LH) since the 1990s because of ecosystem alterations such as the dreissenid mussel invasion (Dreissena spp.). Cyanobacterial dominance can also increase in certain lake regions because of the selective feeding of Dreissena on non-cyanobacterial taxa, further resulting in food web issues [3,4]. In addition to declines in density, the composition of the pelagic zooplankton community has also changed in LM and LH. Historically, cladocera dominated the summer crustacean zooplankton community in LM and LH, whereas calanoid copepods have been substantially more abundant in contemporary times [1,5]. In particular, Limnocalanus macrurus, a large, glacial-relict calanoid copepod primarily observed in pelagic areas, has increased in dominance in LM and LH. Limnocalanus now comprises about 50–75% of the large zooplankton summer biomass in LM [6] and 30–40% in LH [7]. Subsequently, the lower food web of LM and LH converged to that of Lake Superior [1], which resulted in other ecosystem alterations in LM and LH, such as a reduction in the density and condition of some fishes [8,9].
Much of our information and knowledge on lake ecosystems are from data collected in pelagic, open-water areas [10,11,12]. Similarly, most existing data on zooplankton density, biomass, and community composition, documenting the recent changes in these variables in both LM and LH, are from offshore zones, in waters >10 m, and often >45 m deep, e.g., [2,13,14,15]. Less attention has been directed toward zooplankton density, biomass, and composition in shallow shoreline areas (≤1 m depth, hereafter referred to as the “beach”) [16]. These shoreline areas are critical habitats for many larval and juvenile fish, including coregonines, which occupy beach areas during the first stages of their lives [16,17]. Because of increased light at depth and the risk of predation from visual fish predators in shallower water, the beach zooplankton community may be much different than even the nearshore (e.g., >1–15 m depth) community. This zooplankton beach community may be composed of smaller-bodied zooplankton because of the selective predation pressure [18] or other factors, such as water temperature differences in shallower versus deeper water zones [19]. Further, some of the larger, pelagic calanoid copepods, such as Limnocalanus and Senecella calanoides, are cold water species that are rarely present in the warmer, shallower waters [1,20]. The beach zooplankton community may be similar in some regards to coastal wetland communities in the Great Lakes, containing more littoral and benthic taxa and smaller cladocerans [21,22]. These described changes in the offshore summer crustacean zooplankton community in LM and LH (e.g., a shift to larger-bodied taxa such as Limnocalanus) may not necessarily reflect what many larval fish encounter when they occupy beach habitats that serve as critical nurseries—a finding that has implications for other Great Lakes and inland lake systems.
Many larval and juvenile fish feed primarily on zooplankton during the first few months of their life in shallower waters [23,24] before moving offshore into deeper waters as they reach a larger size, e.g., [8]. Having sufficient zooplankton densities during this period of planktivory is critical for the survival and recruitment of larval fishes such as coregonines and walleye [25,26]. An insufficient or altered zooplankton community could result in lower growth rates and higher mortality of larval fishes due to the additional energy required to capture prey when densities are low or less energy is acquired from some smaller versus larger zooplankton [25,27,28]. Therefore, a lower or altered zooplankton density could result in years of weaker year-class strength for some fishes, potentially affecting adult recruitment. For example, Rellstab et al. [25] found that the mortality rates of larval Coregonus zugensis drastically increase when zooplankton densities are less than 20 individuals L−1. Despite the importance of zooplankton for larval and juvenile fish growth and survival in beach habitats, data that characterize and assess the patterns of zooplankton density, biomass, and community composition on beaches at large spatial scales are scarce.
While some studies have been performed in nearshore waters (e.g., >1–15 m) in the Great Lakes, e.g., [29,30,31], more limited data exist that characterize zooplankton in beach habitats. Existing beach data suggest that the zooplankton community may differ between the beach [16] and deeper locations. For example, [16] found that cyclopoid copepods were the most dominant zooplankton group at one location in LM (in less than 1 m of water). [17] found a variety of zooplankton taxa, such as cladocera and copepods, in coregonine diets seasonally in South Bay in LH (from samples collected in ≤1 m) but did not specifically sample ambient zooplankton. In slightly deeper water (1.8–6 m), [21] found an abundance of cyclopoid copepods, copepod nauplii, and Bosmina in the Green Bay of LM. Therefore, the zooplankton community in the beach and shallower depth locations may substantially differ from pelagic locations, e.g., [6,7]. However, these limited examples and data constrain our understanding of zooplankton density and community composition on beaches in LM and how zooplankton populations differ between beach and pelagic zones.
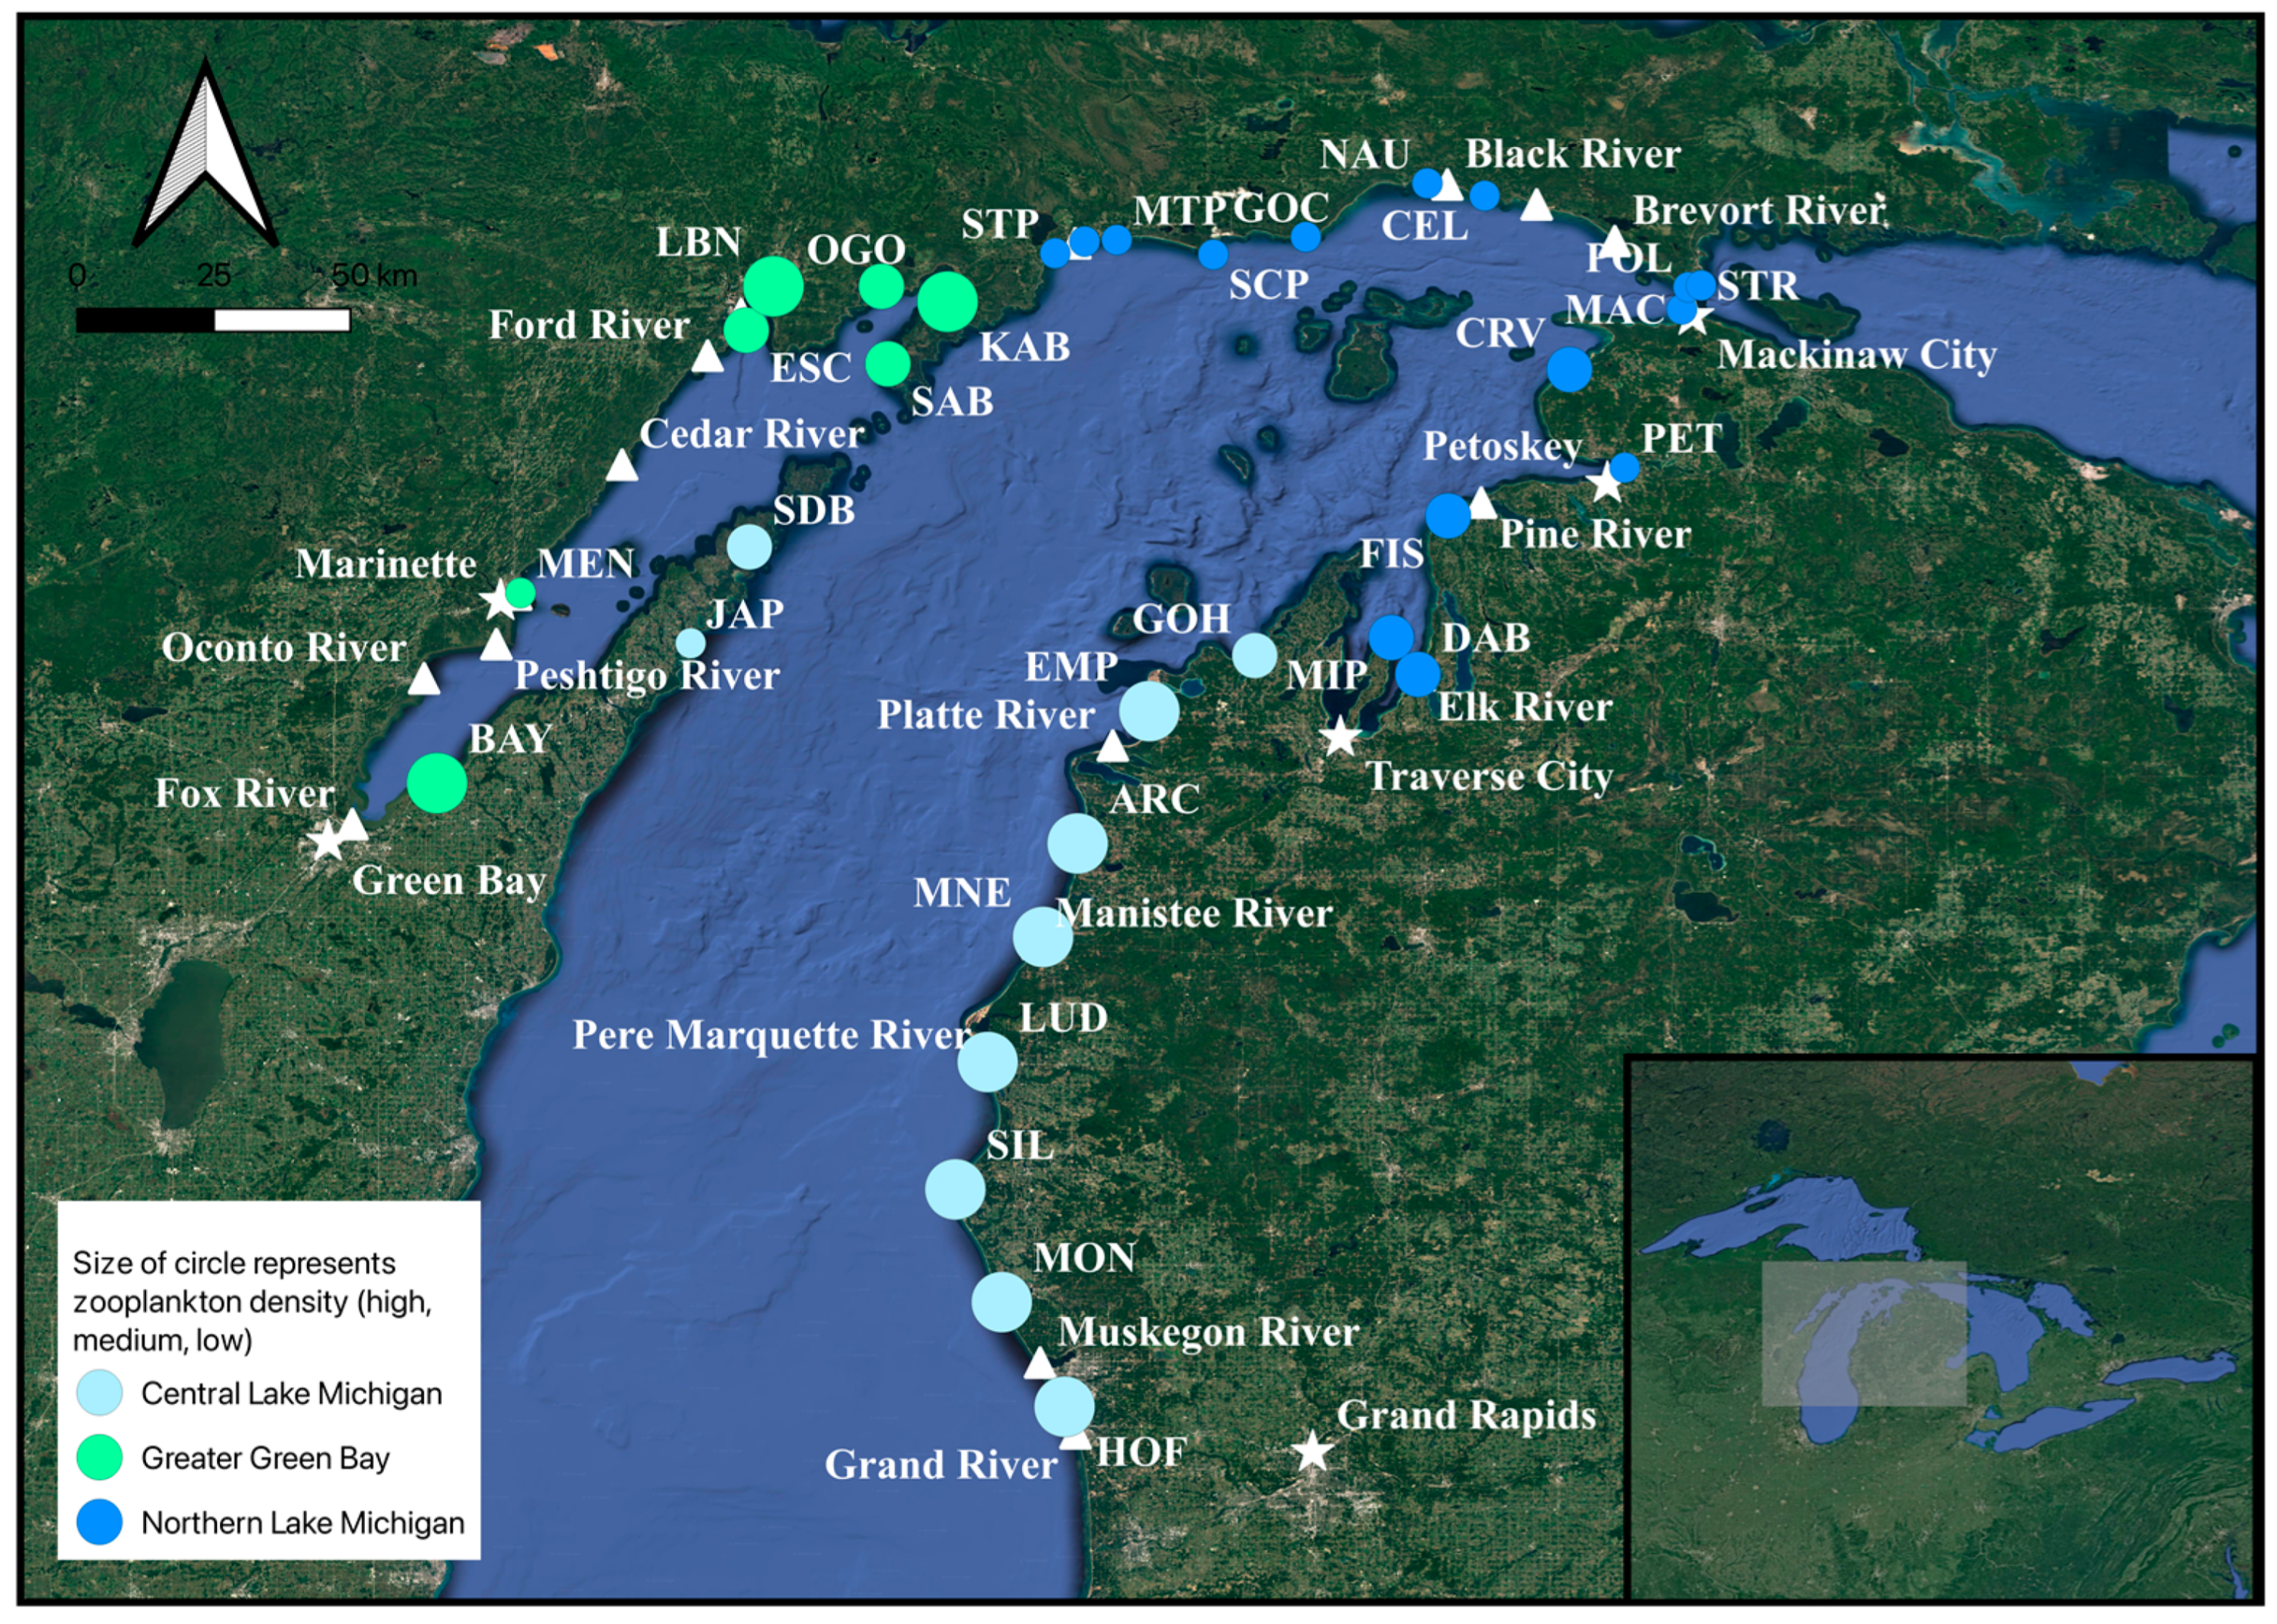
To address some of these knowledge gaps, we examined spatial patterns of density, biomass, and the community composition of the summer crustacean zooplankton across beaches in LM. Thirty-two beaches were sampled from 26 to 29 June 2020 (to constrain zooplankton phenology), quantifying crustacean (total crustacean, cladocera, cyclopoid, calanoid, and nauplii) zooplankton density, biomass, and community composition, and these metrics were compared across beaches and regions. Zooplankton were sampled from the Grand River in south-central LM, to the Straits of Mackinac in northern LM, and the west to Green Bay (Figure 1). We also collected other environmental variables known to be important in shaping zooplankton communities, such as water temperature [32,33], dissolved oxygen (DO) concentrations [34], specific conductivity [35,36], and pH [37,38]. The results from our study have the potential to increase our understanding of factors affecting fish recruitment and fisheries management by characterizing zooplankton prey characteristics on a large spatial scale.
2. Materials and Methods
2.1. Sample Sites and Regions
Sampling was conducted during daytime hours, between 09:00 and 17:00 from 26 to 29 June 2020, on beach locations in the northern, central, and southern basins of LM. The sample sites were distanced as evenly as possible, depending on access to the lake. Thirty-two total sites were sampled from near the mouth of the Grand River in the southern basin of LM to the Straits of Mackinac in the northern basin of LM, from the west to Menominee, MI, from the south to Green Bay, Wisconsin, and finally north up the Door Peninsula (Figure 1 and Figure S1).
We split the beach sites into three broad geographical regions based on different environmental and bathymetric features in the lake from the precedent of previous studies, e.g., [39,40]: Greater Green Bay, Northern LM, and Central LM (Figure 1 and Figure S1). These three regions were chosen because of their distinctive morphometric and surrounding watershed differences. The Greater Green Bay water area is shallower, with higher anthropogenic land use in the watershed and an anthropogenic input to the bay via rivers; Northern LM is also relatively shallow and rocky, with less anthropogenic land use inputs and contains islands and straits; and Central LM has some anthropogenic land use, has more sandy substrates, and becomes deeper more quickly offshore, e.g., [40,41]. We chose these three geographic regions to help describe environmental and zooplankton metrics spatially across Lake Michigan.
At each site, water temperature, DO concentration, specific conductivity, and pH at a 0.1 m depth were collected at a central location for each site using a multiprobe water quality sonde that was calibrated following factory specifications and standards (Hydrolab Quanta, QD03666).
In addition, three zooplankton samples were collected from separate 30 m horizontal tows (all tow nets had a 30 cm diameter mouth opening, a 3:1 net length/mouth diameter ratio, and a 64 μm mesh size) at the subsurface of each site. Sampling was conducted at locations near the shoreline where the depth was ≤1 m and replicate tows were spaced out as evenly as possible within each site to capture within-site variability. All tows were taken by hand, and the volume was calculated by multiplying the net mouth area with the horizontal tow distance. One site (Menominee, MI) only had two replicate tows taken because the size of the beach did not allow enough space for three replicate tows. Zooplankton tows were administered at a routine speed of approximately 0.3 m s−1 [42]. Flow meters were not used on the nets because no net efficiency issues were detected at any site. Therefore, because the nets were fully submerged, we assumed that approximately 2.1 m3 of water (a 30 m tow length * the net area of ~0.07 m2) was filtered for each tow. Zooplankton were immediately narcotized with Alka-Seltzer® and subsequently preserved to 70% ethanol by volume.
2.2. Zooplankton Laboratory Processing
Crustacean zooplankton were typically identified to the genus taxonomic resolution [43], though the focus of our analyses was on broader taxonomic groups (i.e., total crustacean zooplankton, cladocera, calanoids (adults + copepodites), cyclopoids (adults + copepodites), and nauplii). Zooplankton were counted and measured until 200 individuals were enumerated from a sample with a known dilution volume, 5% of the total sample volume was counted, or three subsamples were counted, whichever came first, to detect rarer or uncommon taxa [42]. Because of the 64 µm mesh-sized net, rotifers were not counted because some smaller rotifers were likely not quantitatively captured by the net [44]. Crustacean zooplankton were counted and measured at a 40× magnification under a Nikon 1000 SMZ dissecting scope with a calibrated digital camera attached. Entire samples were searched for larger predatory taxa such as Leptodora, Bythotrephes, and Chaoborus, which were also counted, and the lengths were measured.
2.3. Statistical Analyses
2.3.1. Analysis 1: Environmental Data and Total Crustacean Zooplankton Density and Biomass
Water temperature, DO concentration, specific conductivity, and pH were descriptively compared and described across the sites and regions.
The mean density and biomass of the respective crustacean groups from the replicate tows on each beach site were calculated and used as the value for comparison in zooplankton analyses. We tested for significant differences in total crustacean zooplankton density and biomass (density and biomass were strongly correlated: R2 = 0.80) at sites across these broad regions using one-way ANOVA with post hoc Tukey pairwise comparisons. These total density and biomass values were natural log-transformed prior to analyses to meet the assumptions of equal variance and normality in regard to the statistical models. We also descriptively compared the broader crustacean zooplankton group (cladocera, calanoid, cyclopoid, and nauplii) density and biomass across the sites and regions, as these groups are components of the total crustacean zooplankton density and biomass. All environmental data, total crustacean zooplankton, and more specific zooplankton group density and biomass values are provided in Tables S1–S3.
2.3.2. Analysis 2: Zooplankton Community Composition
The zooplankton community composition was similarly compared across these three regions. A non-metric multidimensional scaling (NMDS) test with a permutational multivariate ANOVA (PERMANOVA) was used to test for differences in the broader zooplankton group community’s composition (cladocera, calanoid, cyclopoid, and nauplii) via density (density and biomass were strongly related) between the three regions. The percentage composition for cladocera, calanoid, cyclopoid, and nauplii (% of the zooplankton community) was also calculated for density and biomass and compared across the three regions (Greater Green Bay, Northern LM, and Central LM).
For all statistical analyses, p-values were considered significant at α = 0.05, and analyses were performed in R v 4.2.3 [49].
3. Results
3.1. Analysis 1: Environmental Data and Total Crustacean Zooplankton Density and Biomass
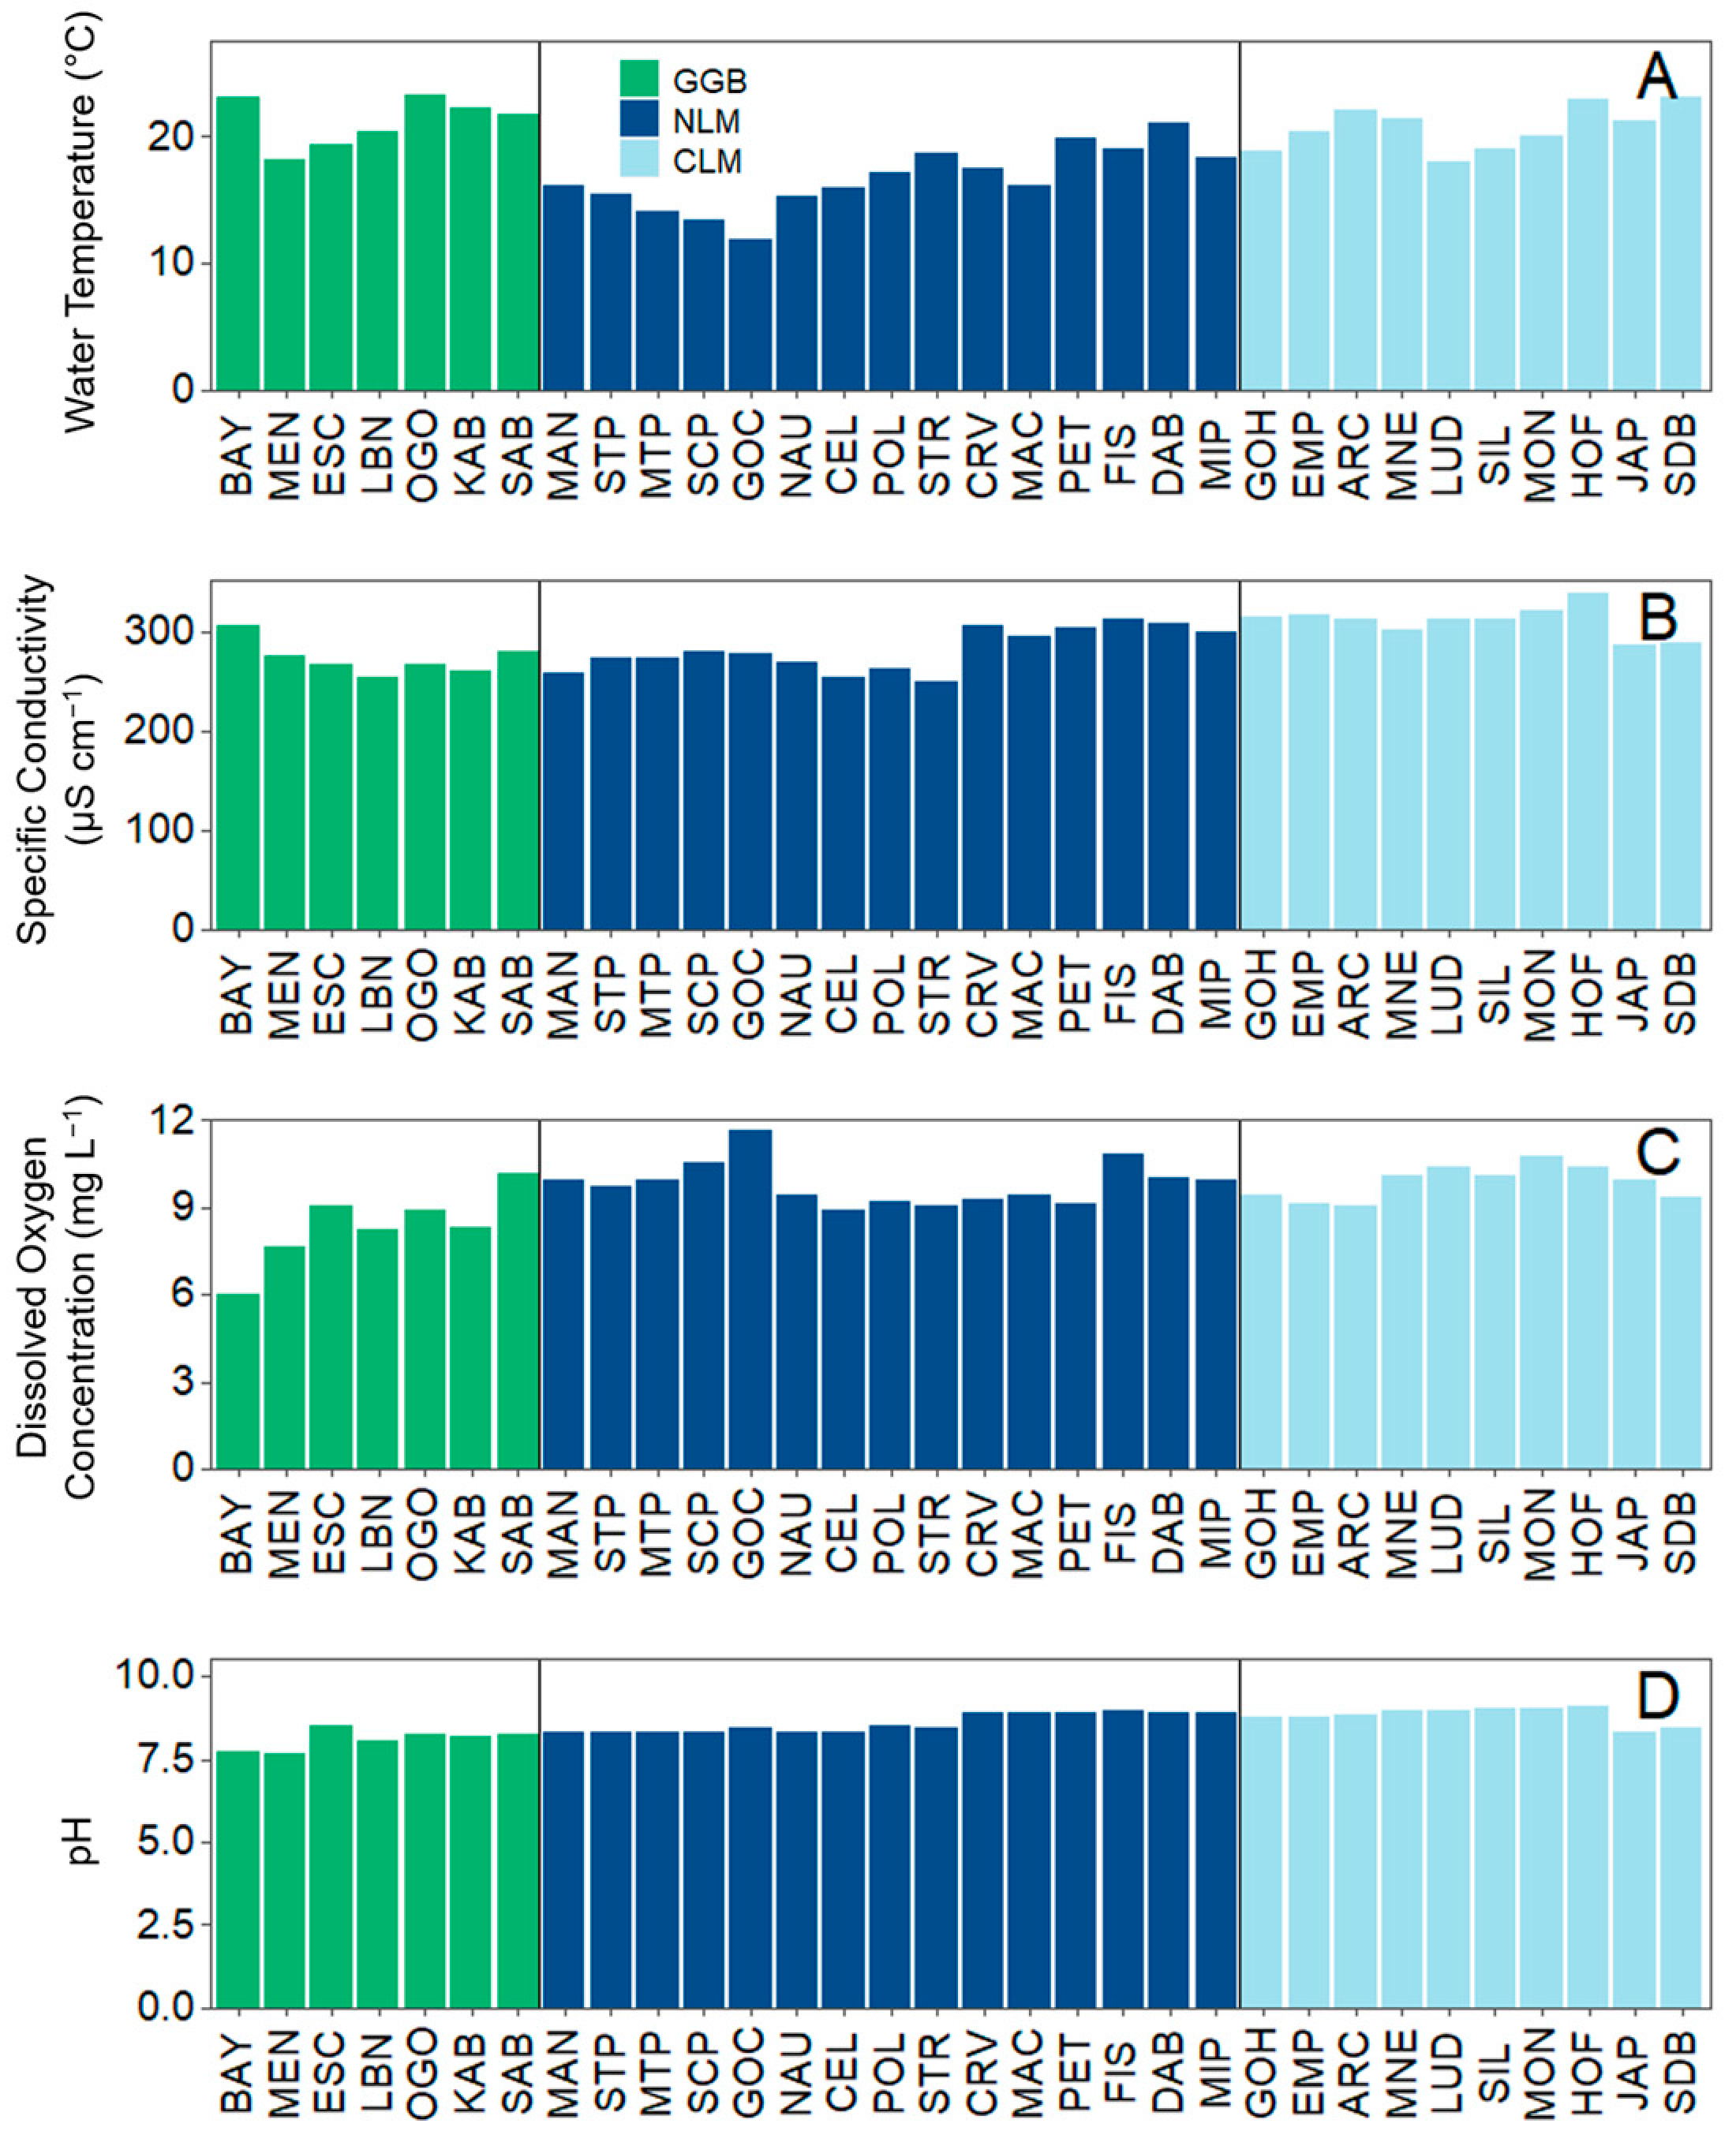
Perhaps the largest environmental difference between these regions was water temperature; water temperature was about 4 °C colder on average in Northern LM compared to Greater Green Bay and Central LM (Figure 2A; Table 1). Specific conductivity was about 30 µs cm−1 higher on average in Central LM compared to Greater Green Bay and Northern LM (Figure 2B). The DO concentration and pH did not differ much by region (Figure 2C,D, Table 1). Bayshore in Greater Green Bay had a DO concentration of 6.0 mg L−1, which was >1.5 mg L−1 lower than the next lowest observation, which was also in Greater Green Bay (Menominee).
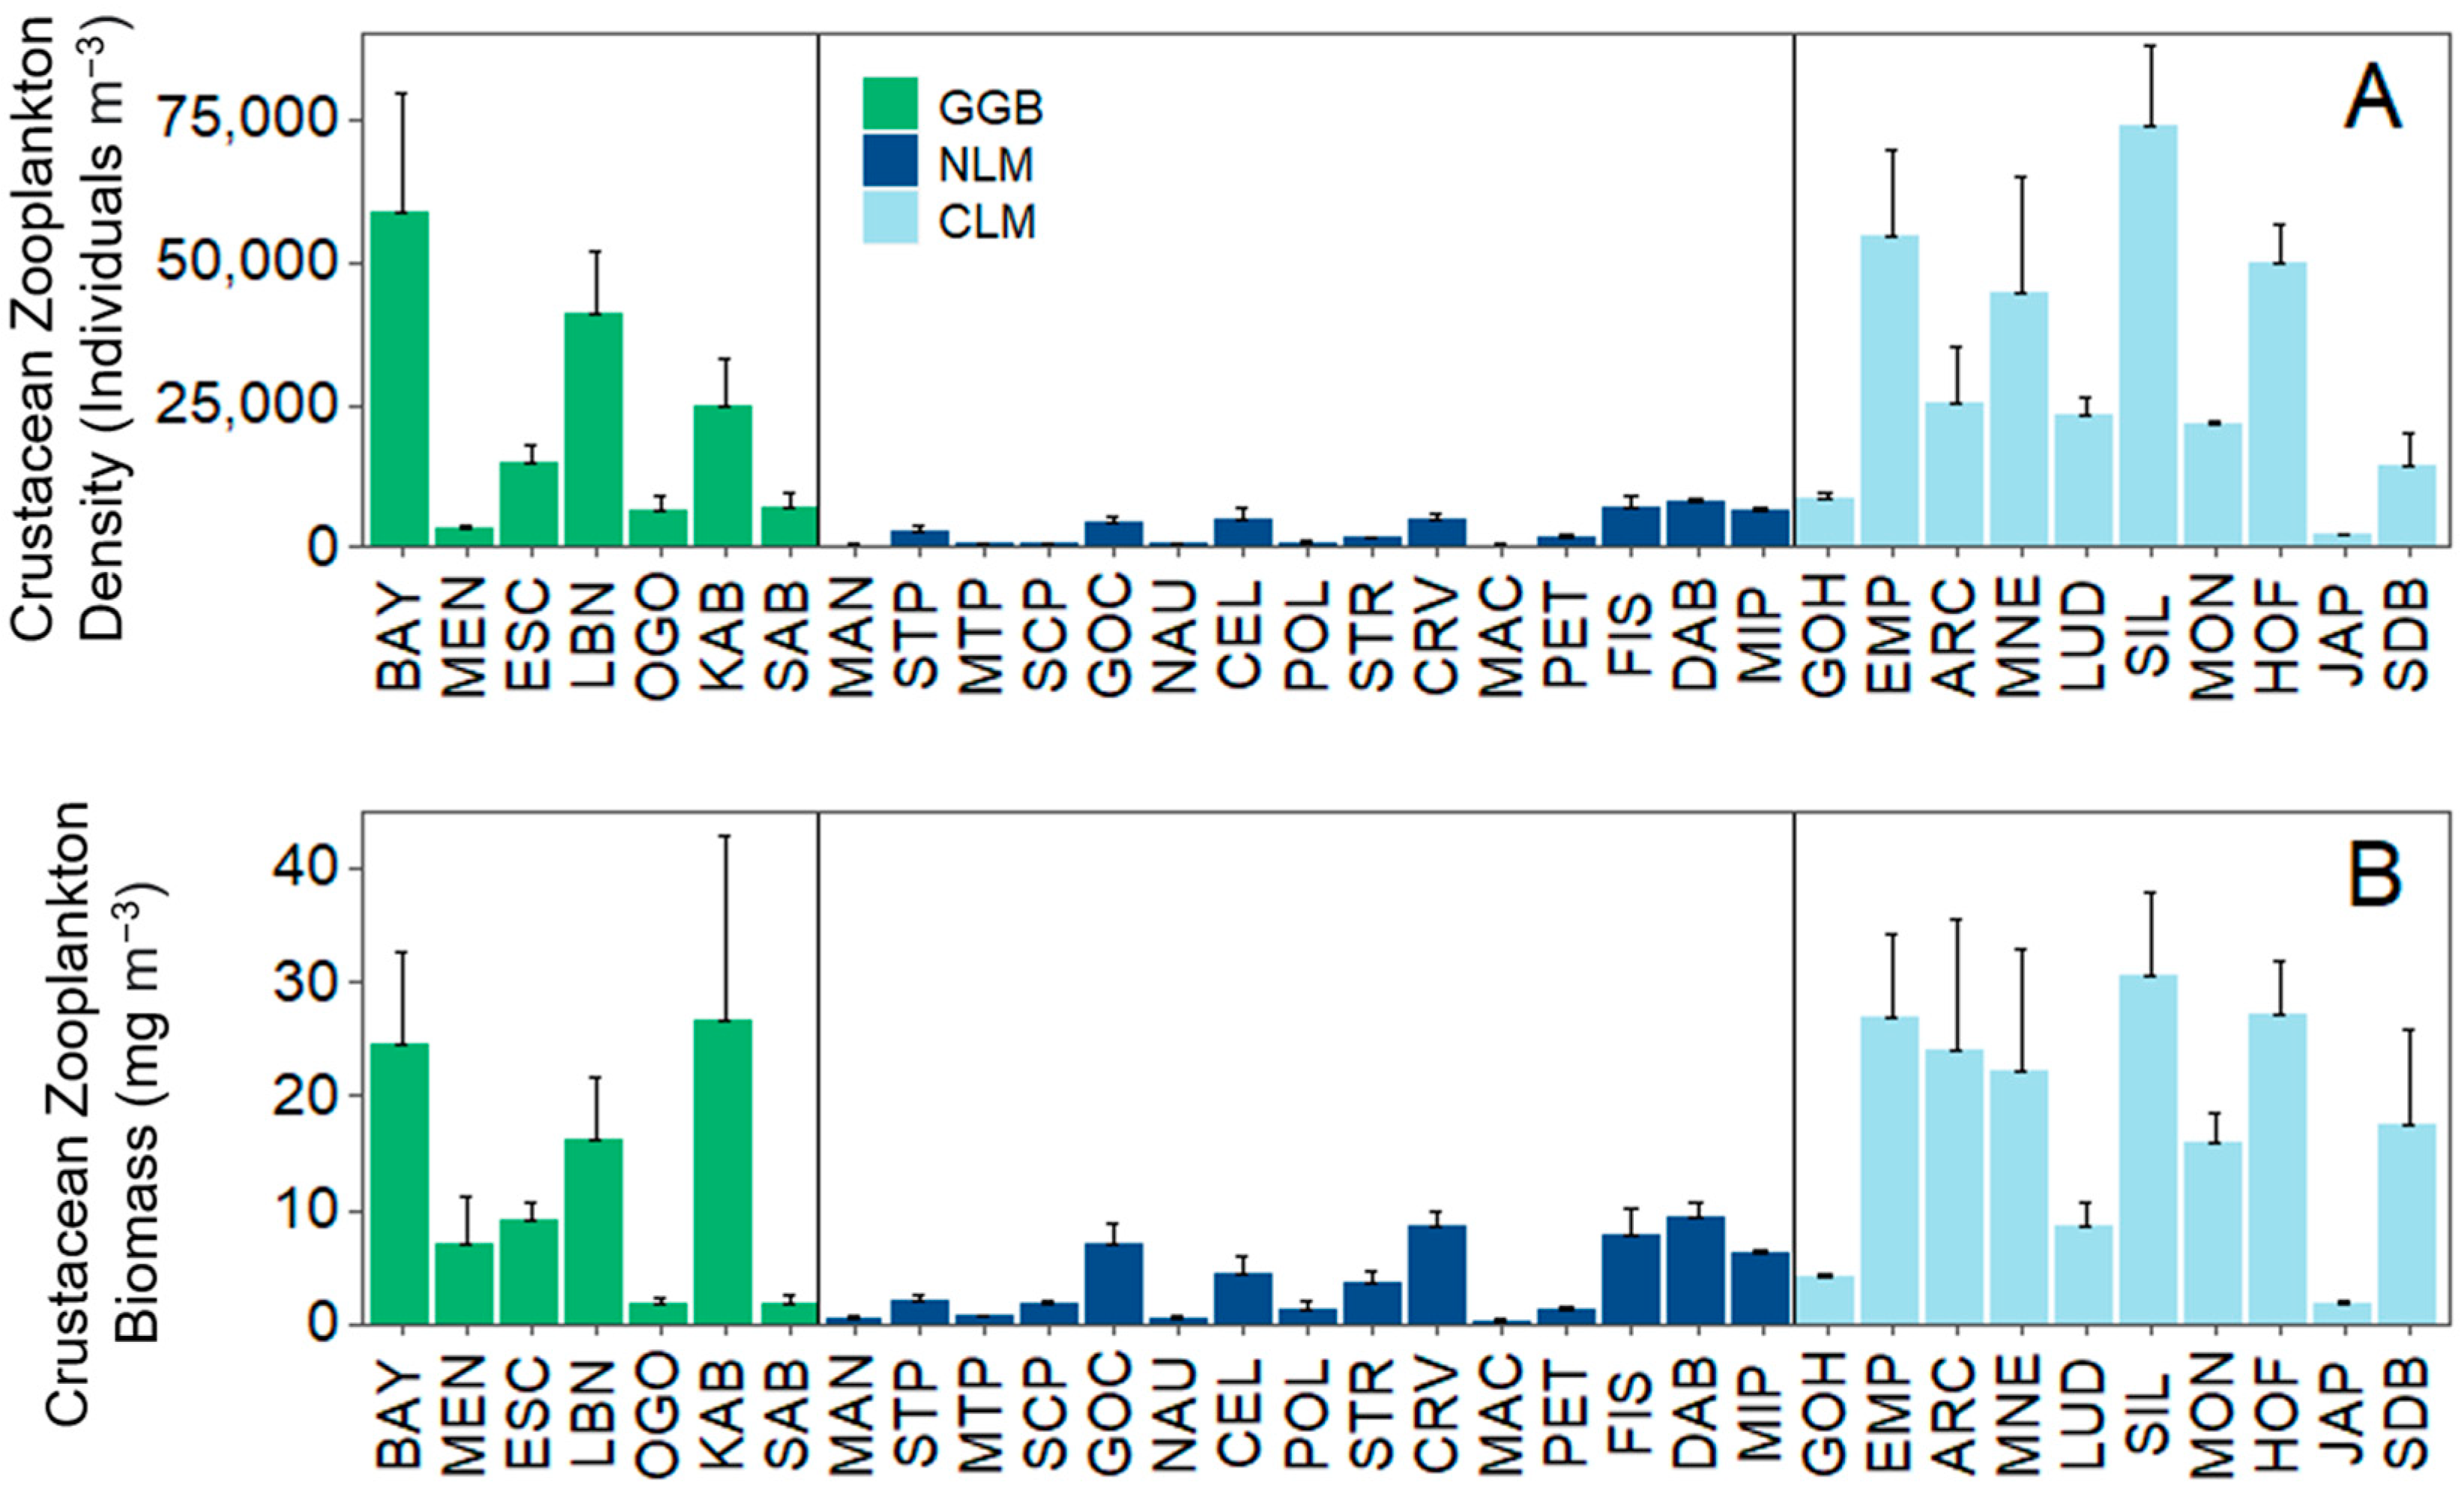
Across the beaches, the overall mean zooplankton density was 16,225 + 20,280 (1 S.D.) individuals m−3 (or ~16 individuals L−1), and mean biomass was 10.1 + 9.8 mg DW m−3 (Table 2). The total crustacean zooplankton density and biomass were about three times more variable when compared across different beach sites versus within a single beach site, indicating greater inter- versus intra-site variability in the measurements. Both crustacean zooplankton maximum density and maximum biomass were observed at Silver Lake (Central LM), and the lowest zooplankton density and biomass were observed in Northern LM in Mackinac City (Figure 1 and Figure S1; Table S1). Crustacean zooplankton density and biomass were significantly different across the three broad geographic regions (one-way ANOVA: F2,29 ≥ 8.51; p ≤ 0.001; Figure 3A,B). The total crustacean zooplankton density was lower in Northern LM compared to Greater Green Bay and Central LM (Tukey: p ≤ 0.0008), but total crustacean density did not differ between Greater Green Bay and Central LM (Tukey: p = 0.63). Crustacean zooplankton density in Central LM and in the Greater Green Bay area were 10× and 7× higher, respectively, than in Northern LM (Figure 3A; Table 2). Northern LM also had lower zooplankton biomass than Greater Green Bay (Tukey: p = 0.05) and Central LM (Tukey: p = 0.001), while the total crustacean zooplankton biomass between Central LM and Greater Green Bay did not differ (Tukey: p = 0.56). Total crustacean zooplankton biomass in Central LM and Greater Green Bay were 5.5× and 3× higher, respectively, than in Northern LM (Figure 3B; Table 2).
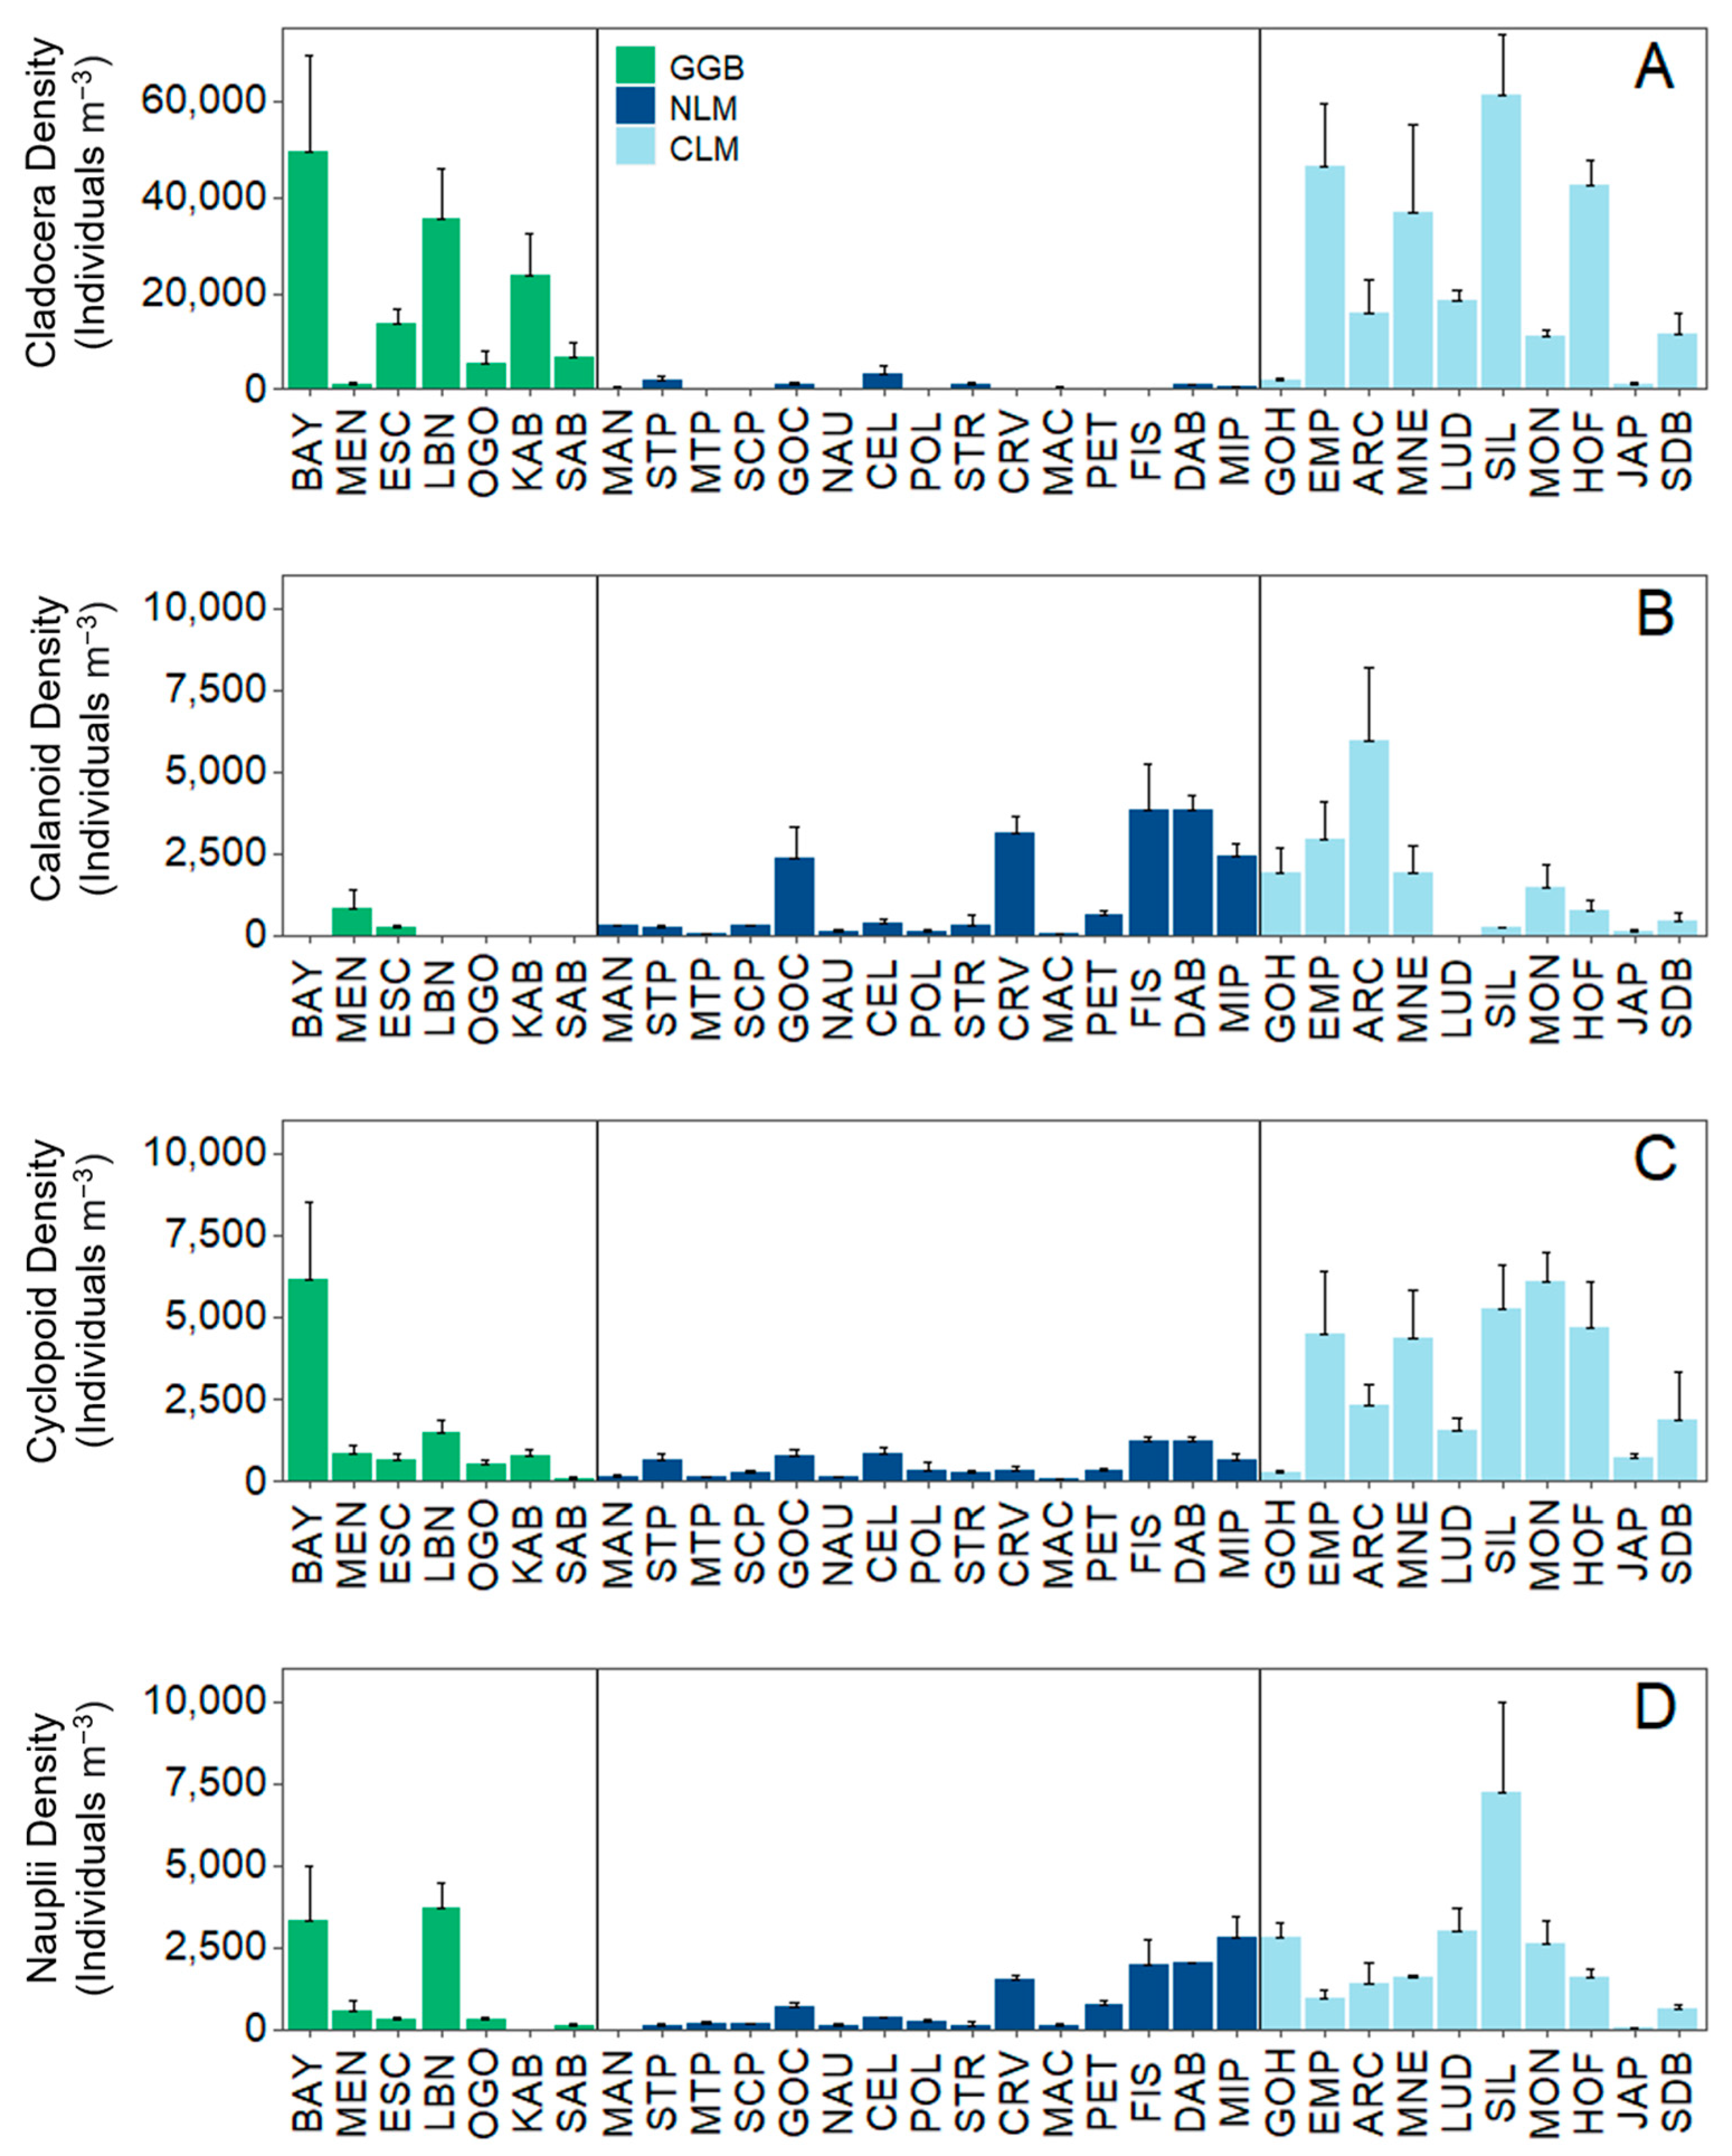
Cladocerans had the highest density and biomass out of the crustacean zooplankton groups across beaches. The mean cladoceran density was about 9× higher than calanoid and nauplii density and about 7× higher than cyclopoid density (Figure 4A; Table 2). The mean cladoceran biomass was about 2× higher than cyclopoid and calanoid biomass and about 26× higher than nauplii biomass. Cladoceran density was lowest in Petoskey, and biomass was lowest at Manistique in Northern LM (Tables S2 and S3). Cladoceran density and cyclopoid biomass were highest at Silver Lake (Central LM; Figure 4; Tables S2 and S3). Calanoid copepods had the highest density and biomass at Arcadia (Central LM; Figure 4B; Tables S2 and S3), and calanoids were not present at five beaches (all in Greater Green Bay sites). The cyclopoid density was highest at Bayshore in Greater Green Bay (Figure 4C; Table S2). Nauplii density and biomass were generally low across the beaches, with some higher-density sites on beaches in Greater Green Bay and Central LM (Figure 4D; Table 2 and Tables S2 and S3).
3.2. Analysis 2: Zooplankton Community Composition
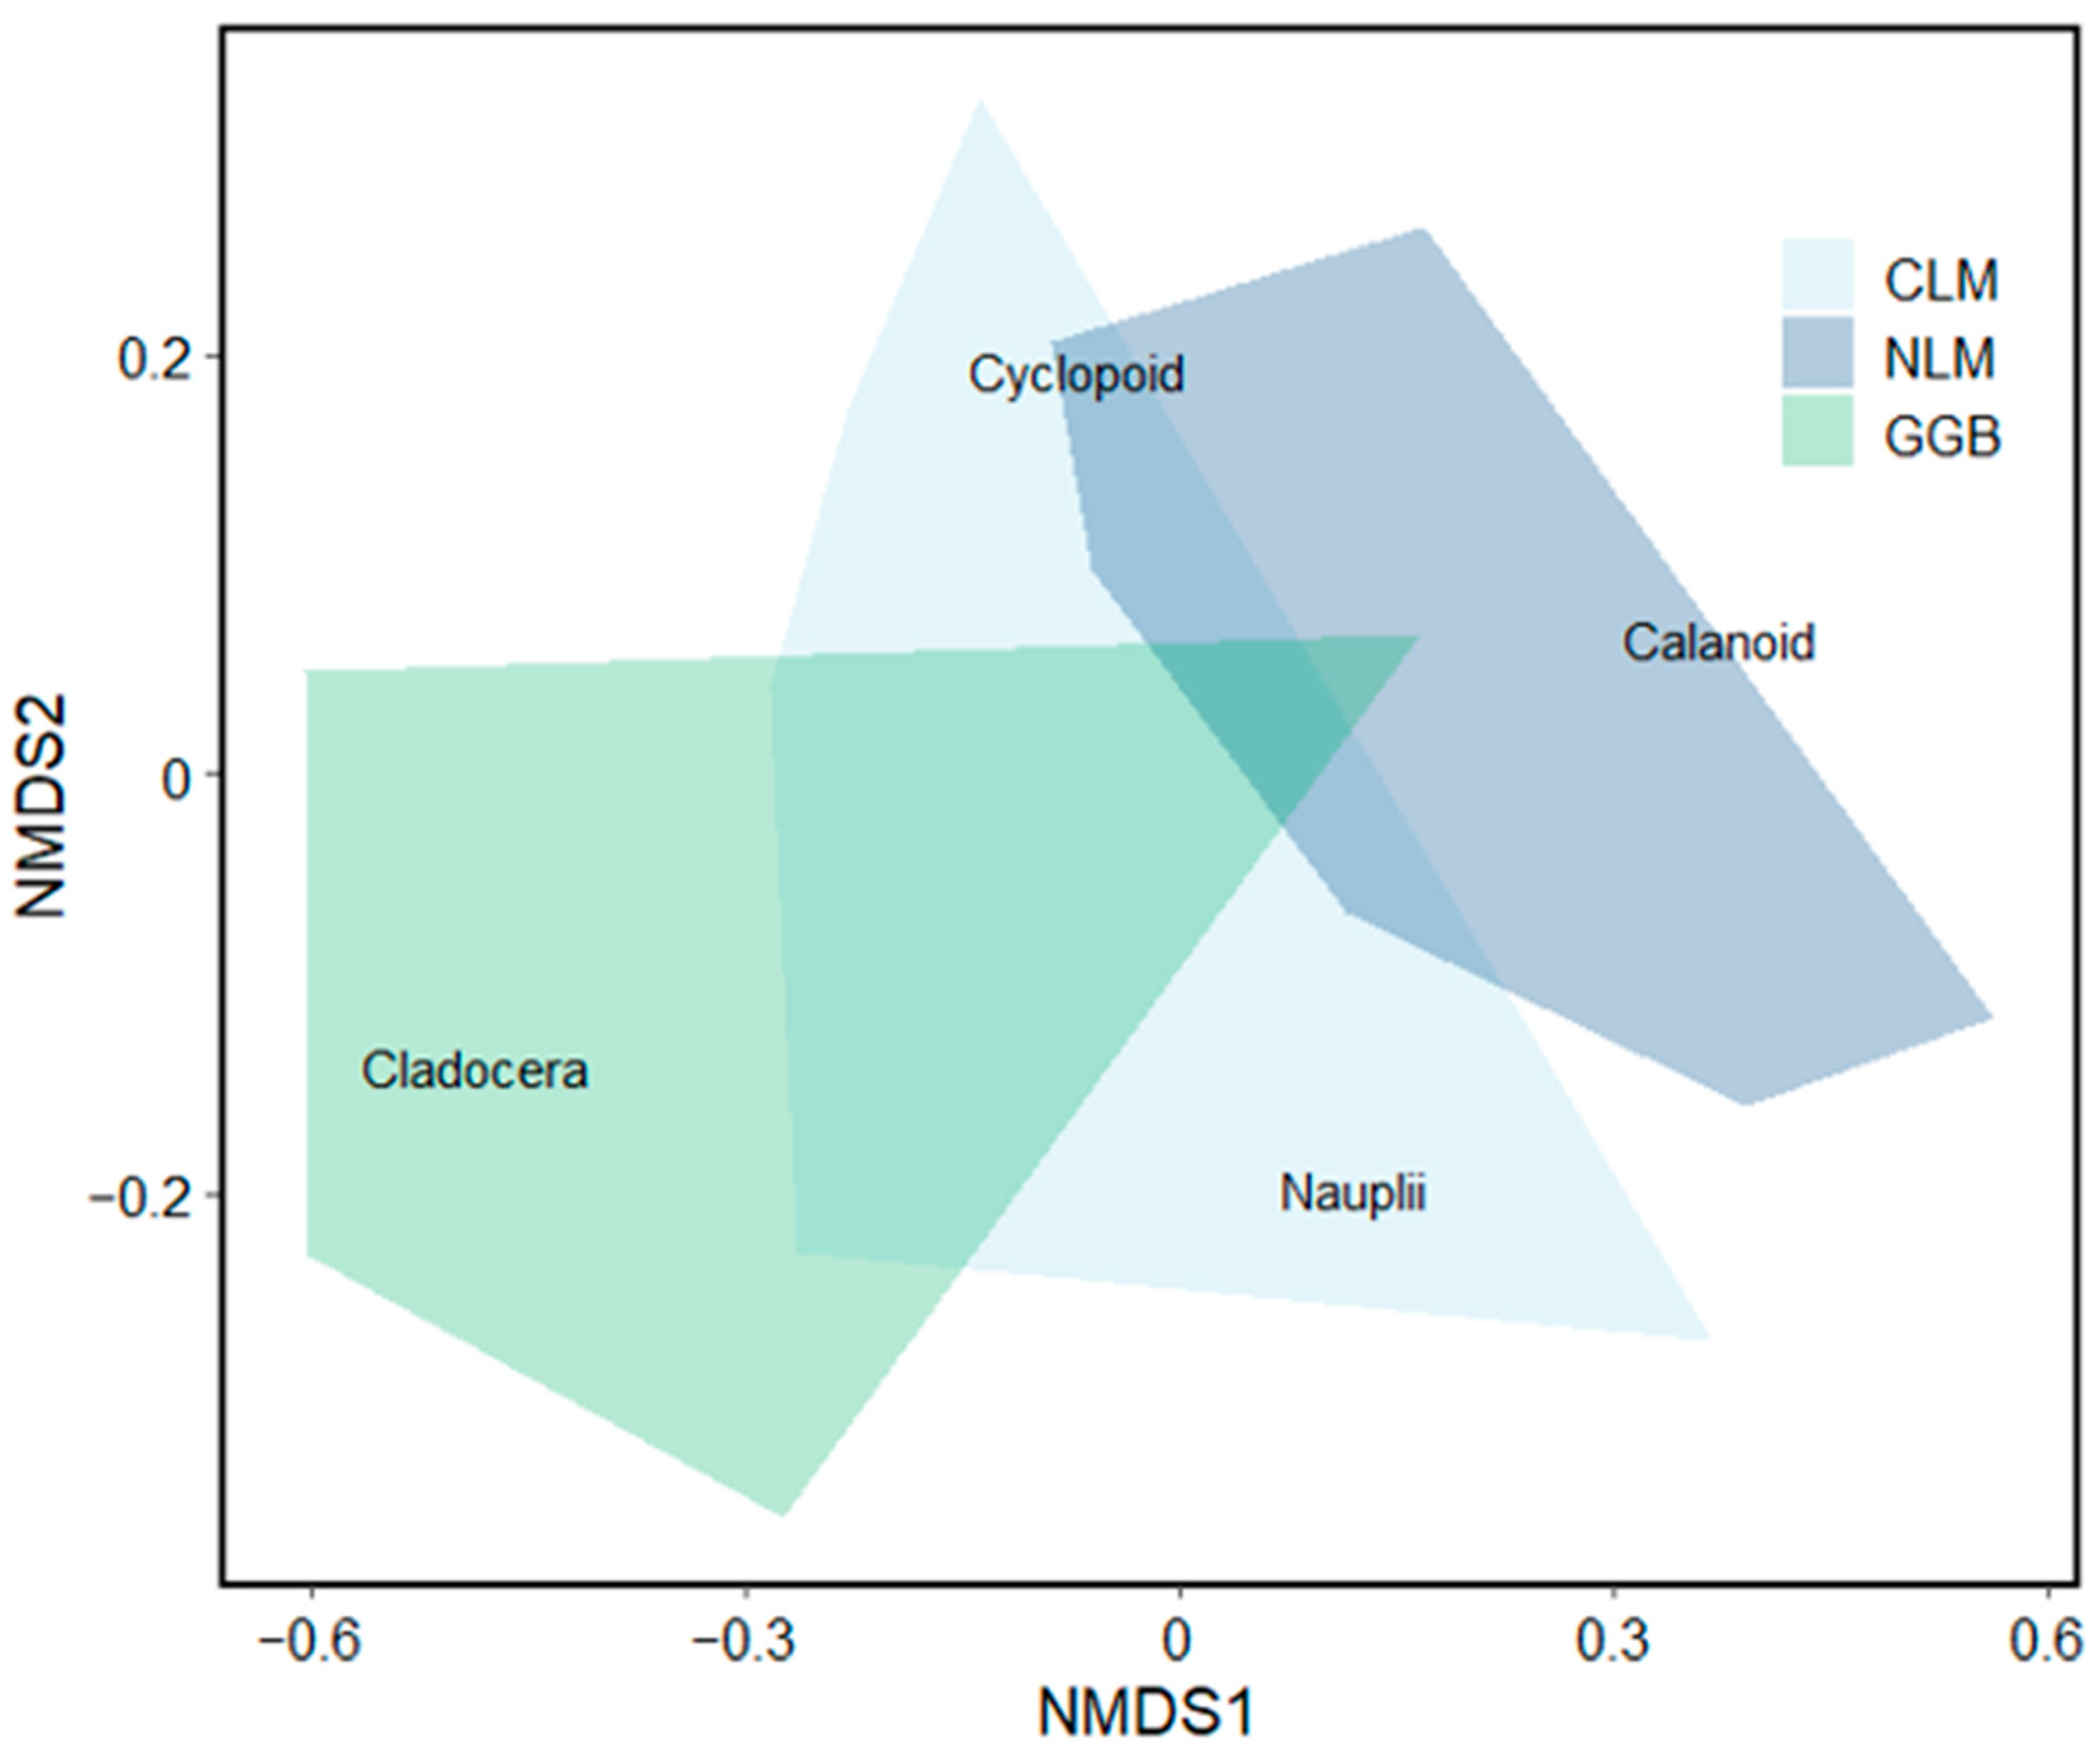
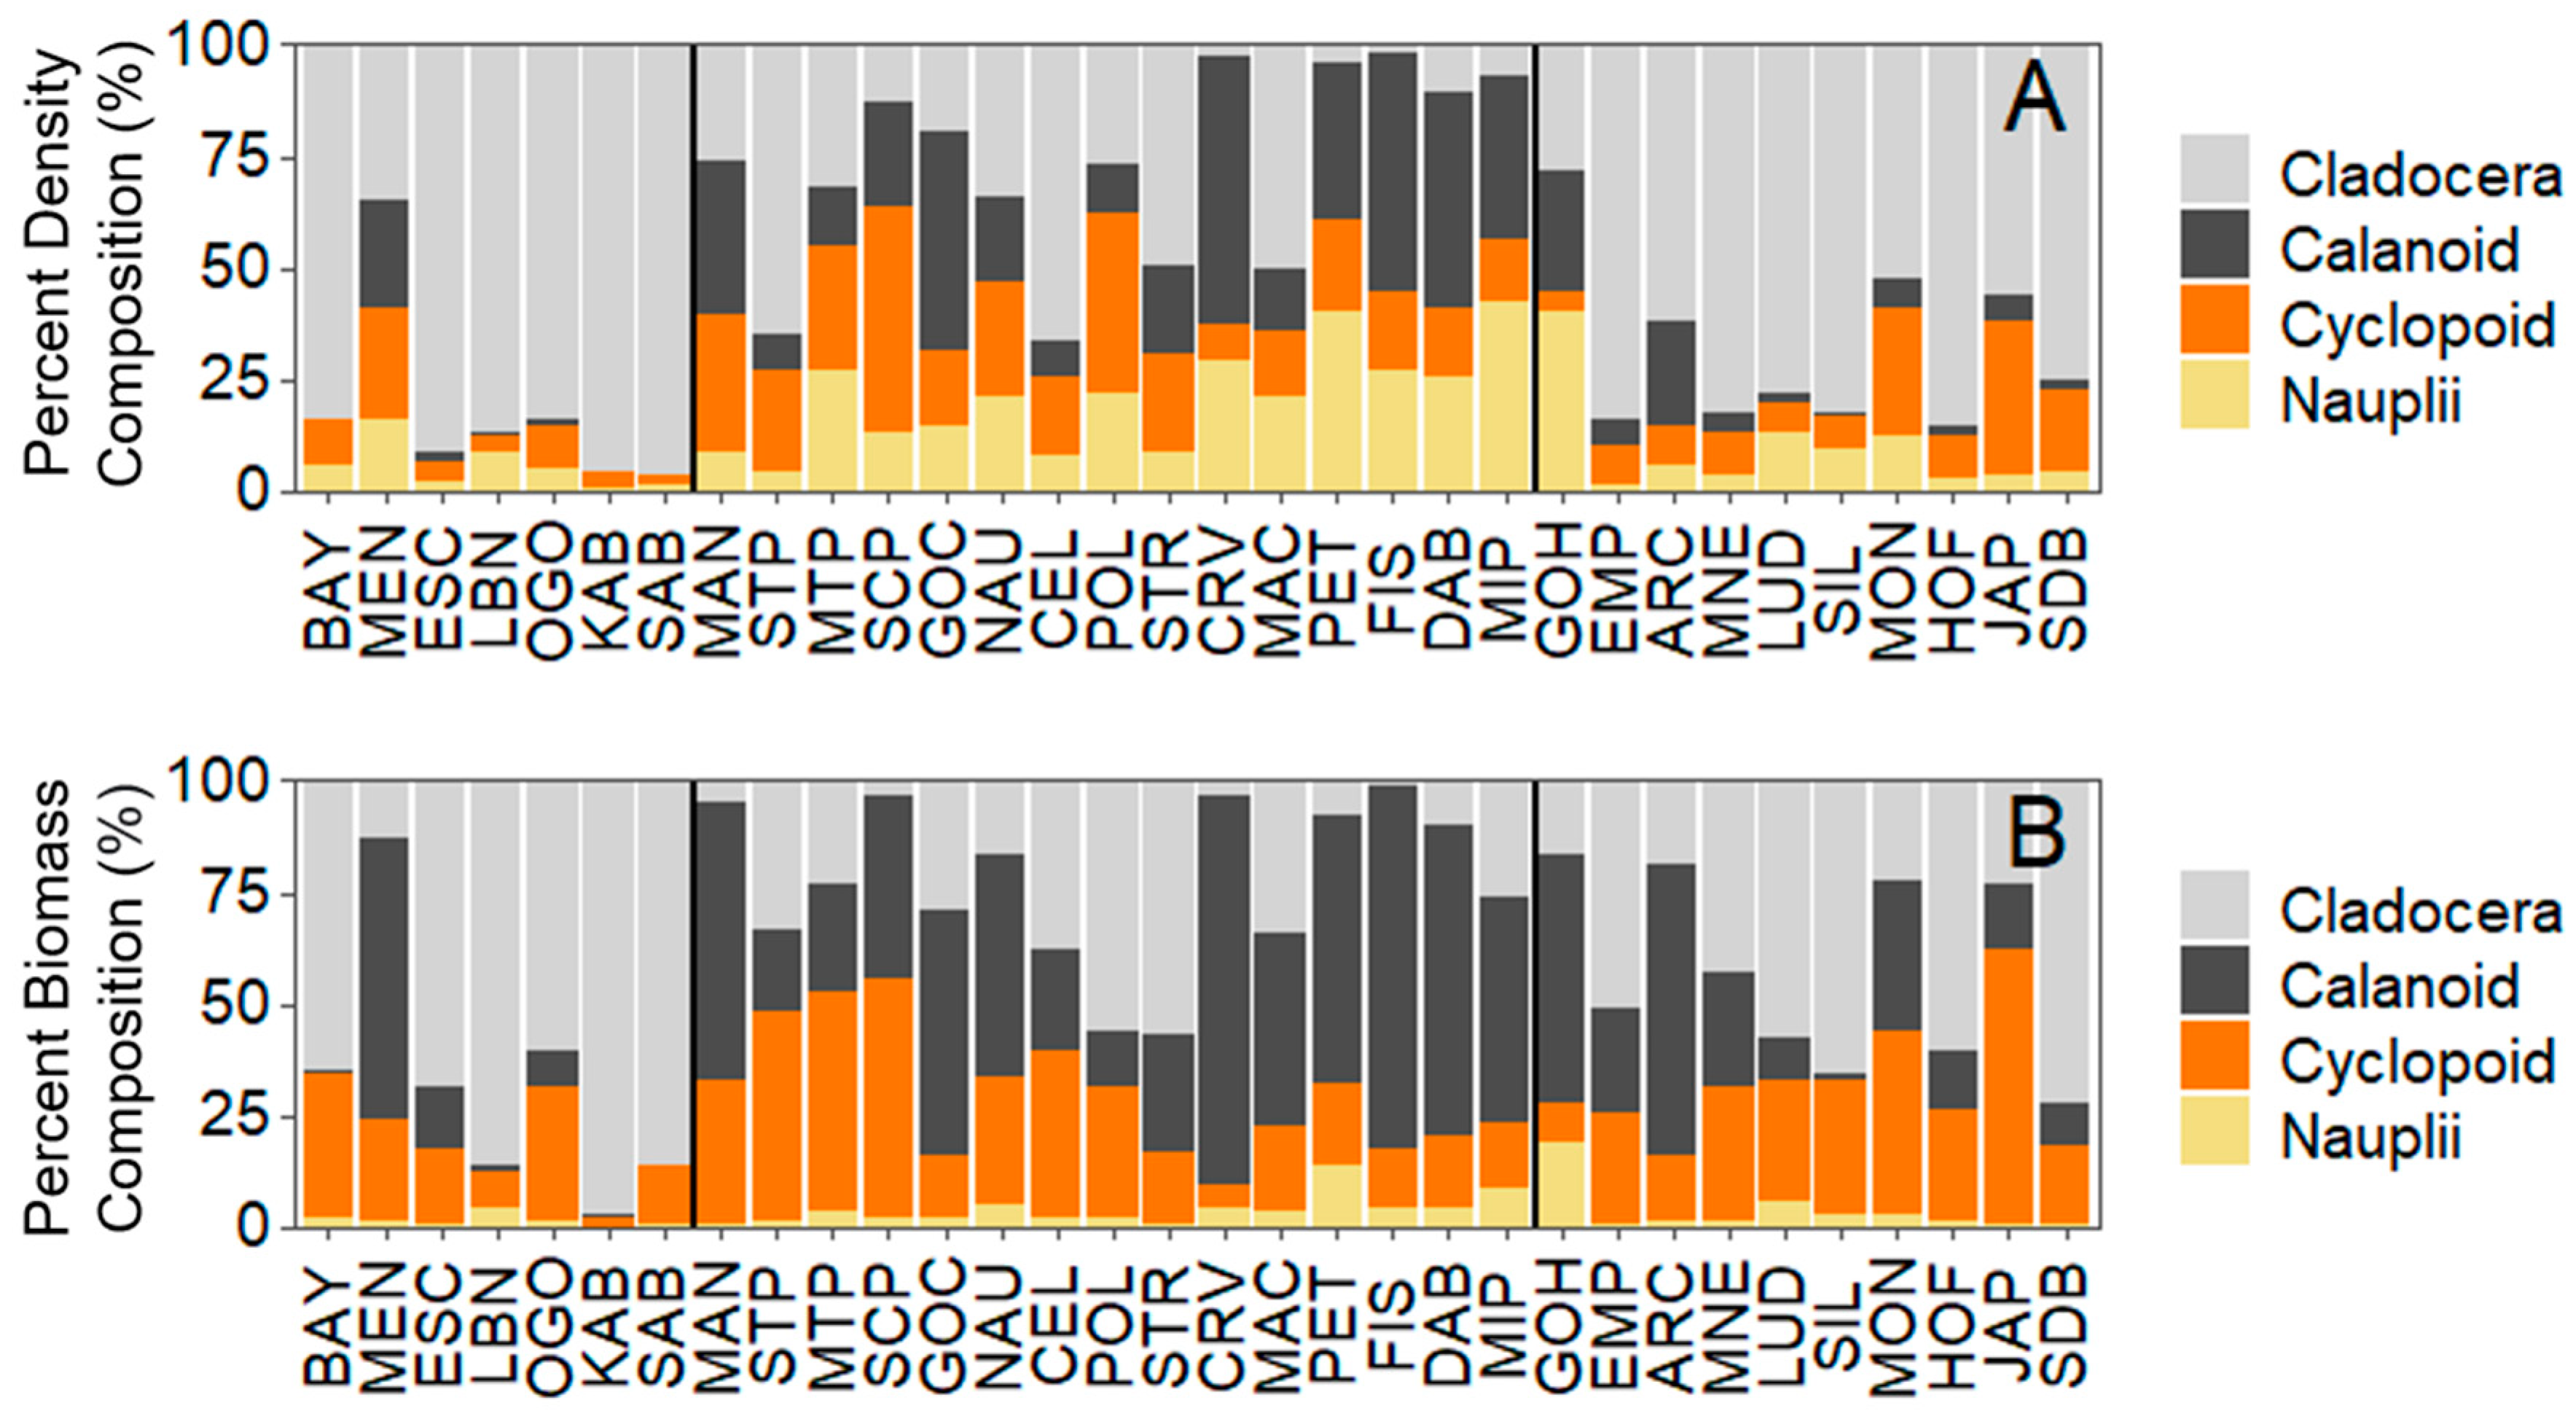
NMDS and PERMANOVA revealed differences in the crustacean zooplankton community composition among regions. Northern LM and Greater Green Bay were significantly different in their community composition, with Central LM being intermediate between them (p < 0.0001; Figure 5). Cladoceran taxa comprised four times more of the crustacean zooplankton community in Greater Green Bay and Central LM compared to Northern LM, with little difference between Greater Green Bay and Central LM (Figure 5 and Figure 6A; Tables S2 and S3). The percentage composition of calanoid taxa was about 38× and 5× higher in Northern LM compared to Greater Green Bay and Central LM, respectively (Figure 6A). The percentage composition of cyclopoids was about two times higher in Northern LM compared to Greater Green Bay and Central LM (Figure 6A; Tables S2 and S3). Patterns for the percentage composition of biomass (Figure 6B) were similar for density.
Bosmina was the most dominant genus, comprising about 50% of the crustacean zooplankton community by density across beaches and regions. Bosmina drove cladocera being more abundant and dominant in the zooplankton community in Greater Green Bay and Central LM compared to Northern LM. Interestingly, Polyphemus was observed in about 44% of the beach samples, mostly in Greater Green Bay and Northern LM. Diacyclops was the most abundant cyclopoid taxon present across sites, whereas Diaptomus and Epischura were the most abundant calanoid taxa. Importantly, the mean size for all zooplankton measured across sites was 0.38 ± 0.50 mm (1 S.D.), with the median slightly smaller at 0.26 mm (Figure S2).
Larger-bodied zooplankton were rare (Table S4); Daphnia composed a small portion of the overall beach crustacean zooplankton community (<2%), while Limnocalanus and Senecella were not observed in our beach samples.
4. Discussion
The total crustacean zooplankton density and biomass varied greatly across beaches from 341 to 74,010 individuals m−3 (or 0.3 to 74 in L−1) and 0.2 to 31 mg DW m−3, respectively. Crustacean zooplankton density and biomass also exhibited variation across broader geographic regions, with Northern LM generally having a lower density and biomass than Greater Green Bay and Central LM. Although deeper pelagic zones in LM are now dominated by larger calanoid copepods during the summer months, we found that beaches in ≤1 m of water were dominated more by smaller-bodied cladoceran and cyclopoid taxa. This finding of a smaller cladoceran presence, such as Bosmina on beach habitats, is similar to studies that have quantified zooplankton communities in coastal Great Lakes wetland environments, perhaps because these environments often share similar morphometric features such as depth, substrate, and aquatic vegetation, that promote smaller cladoceran taxa dominance [20,21]. Although such substrate variables were not measured in this study, a greater vegetation presence could be an important habitat for zooplankton in these beach habitats [50]. Further, the abundance of smaller-bodied taxa in beach habitats complements findings from other studies at smaller spatial scales on beaches or slightly deeper waters [16]. The shift in the dominance of large-bodied calanoid copepods such as Limnocalanus in pelagic zones has not followed on beaches. In fact, Limnocalanus were not observed in any of our samples. Larval and juvenile fish that occupy these beach habitats may largely experience a different zooplankton community than the shift that has occurred offshore in LM and LH. Our results provide the largest spatial study, within a constrained period, to characterize zooplankton density, biomass, and composition on beach habitats in LM, with potential implications on larval fish dynamics in other lake systems.
Northern LM was the only region that had a higher overall percentage composition of calanoids in the zooplankton community, but not for absolute density or biomass. Because Northern LM locations had a lower water temperature (about 4 °C lower) than the other two regions, this difference may favor calanoid taxa, which prefer colder waters compared to many other groups [1,19]. Perhaps Northern LM also lags behind seasonal succession compared to the other two regions because of the colder water temperatures and does not experience cladoceran dominance until later in the summer [51]. Further, some upwelling may exist in this Northern LM region, which could push calanoid copepods closer to shore [52]. However, these calanoids consist of smaller-bodied individuals and taxa [6,7]. Either way, the absolute density and biomass of copepods and total crustacean zooplankton were typically higher in GGB and CLM regions. This finding may indicate particularly lower food supplies for larval fish in Northern LM compared to other regions of the lake.
Another factor, in addition to water temperature, that may be related to some of the zooplankton density and biomass observations is specific conductivity. Specific conductivity can have a positive relationship with nutrient concentrations such as total nitrogen (TN) and total phosphorus (TP) because these variables can be linked with run-off from anthropogenic land uses in the watershed, e.g., [53,54]. Increased TN and TP are subsequently related to increased primary productivity, and, therefore, more food may be available for zooplankton, e.g., [55,56]. Although we did not measure TN, TP, or phytoplankton biomass, we hypothesize that some of the areas that had higher specific conductivity and higher zooplankton densities and biomass may be, at least in part, a result of increased food availability for zooplankton. Further, smaller zooplankton taxa (i.e., Bosmina and smaller copepods) were found in regions with warmer water temperatures. This finding also indicates that warmer temperatures may be selected for smaller zooplankton taxa with higher metabolic requirements [17]. Interestingly, Polyphemus was observed at numerous sites. Perhaps the presence of wetlands where Polyphemus can be commonly observed (i.e., sites in Greater Green Bay and Northern LM) or an increase in food sources such as rotifers, played roles in Polyphemus presence, density, and biomass in these beach habitats [44]. The variability in zooplankton dynamics across beaches is likely related to the multiple environmental factors we collected as well as other factors, which could be important to consider for future zooplankton and fish research on beaches in Lake Michigan and other lake systems.
The majority of the sites (~70%) had crustacean zooplankton densities that could adversely affect the survival rates of coregonine larvae [24]. Further, ~63% of sites had a crustacean zooplankton density < 10 individuals L−1 (10,000 individuals m−3). However, the actual conditions encountered by larval fish in these habitats are much more complicated and can involve food sources other than zooplankton. Once thought to be a hotspot for some types of fish recruitment, such as lake whitefish (Coregonus clupeaformis), the Straits of Mackinac have seen a reduction in lake whitefish recruitment recently [57], which may be a result, at least in part, of reduced zooplankton density in this region as food for larvae and juveniles. Conversely, beaches in the Greater Green Bay and in Central LM had higher zooplankton density and are near known coregonine spawning habitats [58], which may be a factor that increases age-0 coregonine and other fish species’ growth and survival rates in these areas. Perhaps some beach habitats, in general, no longer have sufficient zooplankton prey levels to sustain larval fish populations with ecosystem alterations such as the invasion of dreissenid mussels, e.g., [2,59].
The main goal of our sampling was to obtain a first-cut characterization of summer beach zooplankton communities and how zooplankton density, biomass, and community composition vary spatially in LM. One important consideration for our results and for future studies is that our sampling was performed exclusively during the day with no follow-up at dusk, night, or at dawn. The density and biomass of crustacean zooplankton can be different at nighttime [15,50] versus during daylight hours, affecting beach zooplankton community characterization. For example, if zooplankton exhibit diel horizontal migration in these beach habitats, their density and biomass could increase at night if they come to shallower water at night to feed from offshore [50]. We also assumed that each horizontal tow filtered about 2.1 m3 of water for each sample. We did not notice any net clogging or net efficiency issues, but in the future, using a flow meter could allow for a more comprehensive analysis of any variability of water being filtered for each tow [60]. Additionally, our sampling was conducted in a constrained time period in a single season, so no seasonality of zooplankton patterns was observed. Nevertheless, this “snapshot” sampling is an important space for the time substitution approach, which some agencies adopt to be able to sample and assess patterns at large scales [61]. Our study describes potential food availability on beaches at a time of year and time of day when some age-0 fishes occupy this habitat and consume zooplankton as visual feeders. Therefore, our findings and results have links to the ecology and management of fisheries as the zooplankton communities characterized in our study overlap with the time of day and year when age-0 fishes occupy these beach habitats, e.g., [15,22]. Future studies can expand upon our approach by also sampling at different times of the year, at night versus day, in different Great Lakes or inland lakes, in different years, and in pairing zooplankton with larval and juvenile fish data.
5. Conclusions
Sampling for zooplankton and other limnological variables generally occurs in deeper pelagic zone areas in lakes. More information is needed in shallow water habitats to better understand ecological processes for the whole lake ecosystem. Crustacean zooplankton density and biomass were variable on beaches across LM. The beach zooplankton community was composed largely of smaller-bodied cladoceran, cyclopoid, and calanoid individuals and taxa as opposed to larger calanoid copepods such as Limnocalanus, which currently dominate the deeper, pelagic zooplankton communities. Having a more comprehensive characterization of beach zooplankton communities is critical to better understanding the resources for larval and juvenile fish. As the Great Lakes and inland lakes around the world are ever-changing, it is critically important to better understand zooplankton community dynamics in multiple different zones, such as on beaches, and how these communities change over time.
Supplementary Materials
The following supporting information can be downloaded at: https://www.mdpi.com/article/10.3390/fishes8120599/s1.
Author Contributions
S.J.J., J.B.S. and J.P.D. conceived the study. All authors collected data. S.J.J. counted the zooplankton samples. S.J.J., J.B.S. and J.P.D. conducted analyses. All authors contributed to the interpretation of the data and writing of the manuscript. All authors have read and agreed to the published version of the manuscript.
Funding
The Michigan Sea Grant provided support for this work through an Undergraduate Environmental Internship.
Data Availability Statement
Data are available in the Supplementary Materials document.
Acknowledgments
We thank the School of Natural Resources & Environment and the Center for Freshwater Research and Education at Lake Superior State University for support, travel and equipment use.
Conflicts of Interest
The authors declare no conflict of interest.
References
- Barbiero, R.P.; Lesht, B.M.; Warren, G.J. Convergence of trophic state and the lower food web in Lakes Huron, Michigan, and Superior. J. Great Lakes Res. 2012, 38, 368–380. [Google Scholar] [CrossRef]
- Vanderploeg, H.A.; Pothoven, S.A.; Fahnenstiel, G.L.; Cavaletto, J.F.; Liebig, J.R.; Stow, C.A.; Nalepa, T.F.; Madenjian, C.P.; Bunnell, D.B. Seasonal zooplankton dynamics in Lake Michigan: Disentangling impacts of resource limitation, ecosystem engineering, and predation during a critical ecosystem transition. J. Great Lakes Res. 2012, 38, 336–352. [Google Scholar] [CrossRef]
- De Stasio, B.T.; Schrimpf, M.B.; Cornwell, B.H. Phytoplankton Communities in Green Bay, Lake Michigan after Invasion by Dreissenid Mussels: Increased Dominance by Cyanobacteria. Diversity 2014, 6, 681–704. [Google Scholar] [CrossRef]
- Knoll, L.B.; Sarnelle, O.; Hamilton, S.K.; Kissman, C.E.H.; Wilson, A.E.; Rose, J.B.; Morgan, M.R. Invasive zebra mussels (Dreissena polymorpha) increase cyanobacterial toxin concentrations in low-nutrient lakes. Can. J. Fish. Aquat. Sci. 2008, 65, 448–455. [Google Scholar] [CrossRef]
- Doubek, J.P.; Lehman, J.T. Historical biomass of Limnocalanus in Lake Michigan. J. Great Lakes Res. 2011, 37, 159–164. [Google Scholar] [CrossRef]
- Barbiero, R.P.; Bunnell, D.B.; Rockwell, D.C.; Tuchman, M.L. Recent increases in the large glacial-relict calanoid Limnocalanus macrurus in Lake Michigan. J. Great Lakes Res. 2009, 35, 285–292. [Google Scholar] [CrossRef]
- Barbiero, R.P.; Balcer, M.; Rockwell, D.C.; Tuchman, M.L. Recent shifts in the crustacean zooplankton community of Lake Huron. Can. J. Fish. Aquat. Sci. 2009, 66, 816–828. [Google Scholar] [CrossRef]
- Pothoven, S.A.; Madenjian, C.P. Changes in consumption by alewives and lake whitefish after dreissenid mussel invasions in Lakes Michigan and Huron. N. Am. J. Fish. Manag. 2008, 28, 308–320. [Google Scholar] [CrossRef]
- Vanderploeg, H.A.; Nalepa, T.F.; Jude, D.J.; Mills, E.L.; Holeck, K.T.; Liebig, J.R.; Grigorovich, I.A.; Ojaveer, H. Dispersal and emerging ecological impacts of Ponto-Caspian species in the Laurentian Great Lakes. Can. J. Fish. Aquat. Sci. 2002, 59, 1209–1228. [Google Scholar] [CrossRef]
- Carpenter, S.R.; Kitchell, J.F.; Hodgson, J.R.; Cochran, P.A.; Elser, J.J.; Elser, M.M.; Lodge, D.M.; Kretchmer, D.; He, X. Regulation of lake primary productivity by food web structure. Ecology 1987, 68, 1863–1876. [Google Scholar] [CrossRef]
- Rinke, K.; Huber, A.M.R.; Kempke, S.; Eder, M.; Wolf, T.; Probst, W.N.; Rothhaupta, K.-O. Lake-wide distributions of temperature, phytoplankton, zooplankton, and fish in the pelagic zone of a large lake. Limnol. Oceanogr. 2009, 54, 1306–1322. [Google Scholar] [CrossRef]
- Vanderploeg, H.A.; Ludsin, S.A.; Ruberg, S.A.; Höök, T.O.; Pothoven, S.A.; Brandt, S.B.; Lang, G.A.; Liebig, J.R.; Cavaletto, J.F. Hypoxia affects spatial distributions and overlap of pelagic fish, zooplankton, and phytoplankton in Lake Erie. J. Exp. Mar. Biol. Ecol. 2009, 381, S92–S107. [Google Scholar] [CrossRef]
- Lehman, J.T.; Bowers, J.A.; Gensemer, R.W.; Warren, G.J.; Branstrator, D.K. Mysis relicta in Lake Michigan: Abundances and relationships with their potential prey, Daphnia. Can. J. Fish. Aquat. Sci. 1990, 47, 977–983. [Google Scholar] [CrossRef]
- Pothoven, S.A.; Fahnenstiel, G.L. Spatial and temporal trends in zooplankton assemblages along a nearshore to offshore transect in southeastern Lake Michigan from 2007 to 2012. J. Great Lakes Res. 2015, 41, 95–103. [Google Scholar] [CrossRef]
- Doubek, J.P.; Goldfarb, S.K.; Stockwell, J.D. Should we be sampling zooplankton at night? Limnol. Oceanogr. Lett. 2020, 5, 313–321. [Google Scholar] [CrossRef]
- Pothoven, S.A. The influence of ontogeny and prey abundance on feeding ecology of age-0 lake whitefish (Coregonus clupeaformis) in southeastern Lake Michigan. Ecol. Freshw. Fish. 2020, 29, 103–111. [Google Scholar] [CrossRef]
- Reckahn, J.A. Ecology of young lake whitefish (Coregonus clupeaformis) in South Bay, Manitoulin Island, Lake Huron. In The Biology of Coregonid Fishes; Lindsay, C.C., Woods, C.S., Eds.; University of Manitoba Press: Winnipeg, MN, USA, 1970; pp. 437–459. [Google Scholar]
- Brooks, J.L.; Dodson, S.I. Predation, body size, and composition of plankton. Science 1965, 150, 28–35. [Google Scholar] [CrossRef]
- Carter, J.L.; Schindler, D.E.; Francis, T.B. Effects of climate change on zooplankton community interactions in an Alaskan lake. Clim. Chang. Res. 2017, 4, 1–12. [Google Scholar] [CrossRef]
- Carter, J.C.H.; Goudie, K.A. Diel vertical migrations and horizontal distributions of Limnocalanus macrurus and Senecella calanoides (Copepoda, Calanoida) in Lakes of Southern Ontario in relation to planktivorous fish. Can. J. Fish. Aquat. Sci. 1986, 43, 2508–2514. [Google Scholar] [CrossRef]
- Lougheed, V.L.; Chow-Fraser, P. Development and use of a zooplankton index of wetland quality in the Laurentian Great Lakes basin. Ecol. Appl. 2002, 12, 474–486. [Google Scholar] [CrossRef]
- Lougheed, V.L.; Crosbie, B.; Chow-Fraser, P. Predictions on the effect of common carp (Cyprinus carpio) exclusion on water quality, zooplankton, and submergent macrophytes in a Great Lakes wetland. Can. J. Fish. Aquat. Sci. 1998, 55, 1189–1197. [Google Scholar] [CrossRef]
- Fernandez, R.J.; Rennie, M.D.; Sprules, W.G. Changes in nearshore zooplankton associated with species invasions and potential effects on larval lake whitefish (Coregonus clupeaformis). Int. Rev. Hydrobiol. 2009, 94, 226–243. [Google Scholar] [CrossRef]
- Lucke, V.S.; Stewart, T.R.; Vinson, M.R.; Glase, J.D.; Stockwell, J.D. Larval Coregonus spp. diets and zooplankton community patterns in the Apostle Islands, Lake Superior. J. Great Lakes Res. 2020, 46, 1391–1401. [Google Scholar] [CrossRef]
- Rellstab, C.; Bürgi, H.R.; Müller, R. Population regulation in coregonids: The significance of zooplankton concentration for larval mortality. Ann. Zool. Fennici. 2004, 41, 281–290. [Google Scholar]
- Zorn, T.G.; Hayes, D.B.; McCullough, D.E.; Watson, N.M. Crustacean zooplankton available for larval walleyes in a Lake Michigan embayment. J. Great Lakes Res. 2020, 46, 1491–1499. [Google Scholar] [CrossRef]
- Brown, R.W.; Taylor, W.W. Effects of egg composition and prey density on the larval growth and survival of lake whitefish (Coregonus clupeaformis Mitchill). J. Fish Biol. 1992, 40, 381–394. [Google Scholar] [CrossRef]
- Taylor, W.W.; Freeberg, M.H. Effects of food abundance on larval lake whitefish, Coregonus clupeaformis Mitchill, growth and survival. J. Fish. Biol. 1984, 25, 733–741. [Google Scholar] [CrossRef]
- Keeler, K.M.; Bunnell, D.B.; Diana, J.S.; Adams, J.V.; Mychek-Londer, J.G.; Warner, D.M.; Yule, D.L.; Vinson, M.R. Evaluating the importance of abiotic and biotic drivers on Bythotrephes biomass in Lakes Superior and Michigan. J. Great Lakes Res. 2015, 41, 150–160. [Google Scholar] [CrossRef]
- Pawlowski, M.B.; Sierszen, M.E. A lake-wide approach for large lake zooplankton monitoring: Results from the 2006–2016 Lake Superior Cooperative Science and Monitoring Initiative surveys. J. Great Lakes Res. 2020, 46, 1015–1027. [Google Scholar] [CrossRef]
- Pothoven, S.A.; Höök, T.O.; Nalepa, T.F.; Thomas, M.V.; Dyble, J. Changes in zooplankton community structure associated with the disappearance of invasive alewife in Saginaw Bay, Lake Huron. Aquat. Ecol. 2013, 47, 1–12. [Google Scholar] [CrossRef]
- Beaver, J.R.; Tausz, C.E.; Renicker, T.R.; Holdren, G.C.; Hosler, D.M.; Manis, E.E.; Scotese, K.C.; Teacher, C.E.; Vitanye, B.T.; Davidson, R.M. The late summer crustacean zooplankton in western U.S.A. reservoirs reflects ecoregion, temperature and latitude. Freshw. Biol. 2014, 59, 1173–1186. [Google Scholar] [CrossRef]
- Gillooly, J.F.; Dodson, S.I. Latitudinal patterns in the size distribution and seasonal dynamics of new world, freshwater cladocerans. Limnol Oceanogr. 2000, 45, 22–30. [Google Scholar] [CrossRef]
- Vanderploeg, H.A.; Ludsin, S.A.; Cavaletto, J.F.; Höök, T.O.; Pothoven, S.A.; Brandt, S.B.; Liebig, J.R.; Lang, G.A. Hypoxic zones as habitat for zooplankton in Lake Erie: Refuges from predation or exclusion zones? J. Exp. Mar. Biol. Ecol. 2009, 381, S108–S120. [Google Scholar] [CrossRef]
- Dodson, S.I.; Newman, A.L.; Will-Wolf, S.; Alexander, M.L.; Woodford, M.P.; Van Egeren, S. The relationship between zooplankton community structure and lake characteristics in temperate lakes (Northern Wisconsin, USA). J. Plankton Res. 2009, 31, 93–100. [Google Scholar] [CrossRef]
- Whitman, R.L.; Nevers, M.B.; Goodrich, M.L.; Murphy, P.C.; Davis, B.M. Characterization of Lake Michigan coastal lakes using zooplankton assemblages. Ecol. Indic. 2004, 4, 277–286. [Google Scholar] [CrossRef]
- Confer, J.L.; Kaaret, T.; Likens, G.E. Zooplankton diversity and biomass in recently acidified lakes. Can. J. Fish. Aquat. Sci. 1983, 40, 36–42. [Google Scholar] [CrossRef]
- Jeziorski, A.; Tanentzap, A.J.; Yan, N.D.; Paterson, A.M.; Palmer, M.E.; Korosi, J.B.; Rusak, J.A.; Arts, M.T.; Keller, W.; Ingram, R.; et al. The jellification of north temperate lakes. Proc. Roy. Soc. B. 2015, 282, 20142449. [Google Scholar] [CrossRef] [PubMed]
- Barbiero, R.P.; Rudstam, L.G.; Watkins, J.M.; Lesht, B.M. A cross-lake comparison of crustacean zooplankton communities in the Laurentian Great Lakes, 1997–2016. J. Great Lakes Res. 2019, 45, 672–690. [Google Scholar] [CrossRef]
- Bonina, S.M.C.; Codling, G.; Corcoran, M.B.; Guo, J.; Giesy, J.P.; Li, A.; Sturchio, N.C.; Rockne, K.J. Temporal and spatial differences in deposition of organic matter and black carbon in Lake Michigan sediments over the period 1850–2010. J. Great Lakes Res. 2018, 44, 705–715. [Google Scholar] [CrossRef]
- Rowe, M.D.; Obenour, D.R.; Nalepa, T.F.; Vanderploeg, H.A.; Yousef, F.; Kerfoot, W.C. Mapping the spatial distribution of the biomass and filter-feeding effect of invasive dreissenid mussels on the winter-spring phytoplankton bloom in Lake Michigan. Freshw. Biol. 2015, 60, 2270–2285. [Google Scholar] [CrossRef]
- Downing, J.A.; Rigler, F.H. Manual on Methods for the Assessment of Secondary Productivity in Fresh Waters; Blackwell Scientific Publications: Oxford, UK, 1984. [Google Scholar]
- Balcer, M.; Korda, N.; Dodson, S.I. Zooplankton of the Great Lakes: A Guide to the Identification and Ecology of the Common Crustacean Species; The University of Wisconsin Press: Madison, WI, USA, 1984. [Google Scholar]
- Chick, J.H.; Levchuk, A.P.; Medley, K.A.; Havel, J.H. Underestimation of rotifer abundance a much greater problem than previously appreciated. Limnol. Oceanogr. 2010, 8, 79–87. [Google Scholar] [CrossRef]
- Doubek, J.P.; Campbell, K.L.; Doubek, K.M.; Hamre, K.D.; Lofton, M.E.; McClure, R.P.; Ward, N.K.; Carey, C.C. The effects of hypolimnetic anoxia on the diel vertical migration of freshwater crustacean zooplankton. Ecosphere 2018, 9, e02332. [Google Scholar] [CrossRef]
- Bottrell, H.H.; Duncan, A.; Gliwicz, M.Z.; Grygierek, E.; Herzig, A.; Hillbricht-Ilkowska, A.; Kurasawa, H.; Larsson, P.; Weglenska, T. A review of some problems in zooplankton production studies. Norw. J. Zool. 1976, 24, 419–456. [Google Scholar]
- Dumont, H.J.; Van De Velde, I.; Dumont, S. The dry weight estimate of biomass in a selection of Cladocera, Copepoda and Rotifera from the plankton, periphyton and benthos of continental waters. Oecologia 1975, 19, 75–97. [Google Scholar] [CrossRef] [PubMed]
- Watkins, J.M.; Rudstam, L.G.; Holeck, K.T. Length Weight Regressions for Zooplankton Biomass Calculations—A Review and a Suggestion for Standard Equations. eCommons Cornell. 2011. Available online: http://hdl.handle.net/1813/24566 (accessed on 9 September 2023).
- R Core Team. R: A Language and Environment for Statistical Computing; R Foundation for Statistical Computing: Vienna, Austria, 2021. [Google Scholar]
- Burks, R.L.; Lodge, D.M.; Jeppesen, E.; Lauridsen, T.L. Diel horizontal migration of zooplankton: Costs and benefits of inhabiting the littoral. Freshw. Biol. 2002, 47, 343–365. [Google Scholar] [CrossRef]
- Sommer, U.; Gliwicz, Z.M.; Lampert, W.; Duncan, A. The PEG-model of seasonal succession of planktonic events in fresh waters. Arch. Hydrobiol. 1986, 106, 433–471. [Google Scholar] [CrossRef]
- Haffner, G.D.; Yallop, M.L.; Herbert, P.D.N.; Griffiths, M. Ecological significance of upwelling events in Lake Ontario. J. Great Lakes Res. 1984, 10, 28–37. [Google Scholar] [CrossRef]
- Cumming, B.F.; Laird, K.R.; Gregory-Eaves, I.; Simpson, K.G.; Sokal, M.A.; Nordin, R.N.; Walker, I.R. Tracking past changes in lake-water phosphorus with a 251-lake calibration dataset in British Columbia: Tool development and application in a multiproxy assessment of eutrophication and recovery in Osoyoos Lake, a transboundary lake in Western North America. Front. Ecol. Evol. 2015, 3, 84. [Google Scholar] [CrossRef]
- Hatt, B.E.; Fletcher, T.D.; Walsh, C.J.; Taylor, S.L. The influence of urban density and drainage infrastructure on the concentrations and loads of pollutants in small streams. Environ. Manag. 2004, 34, 112–124. [Google Scholar] [CrossRef]
- Pace, M.L. An empirical analysis of zooplankton community size structure across lake trophic gradients. Limnol. Oceanogr. 1986, 31, 45–55. [Google Scholar] [CrossRef]
- Yuan, L.L.; Pollard, A.I. Changes in the relationship between zooplankton and phytoplankton biomasses across a eutrophication gradient. Limnol. Oceanogr. 2018, 63, 2493–2507. [Google Scholar] [CrossRef] [PubMed]
- Modeling Subcommittee; Technical Fisheries Committee. Technical Fisheries Committee Administrative Report 2020: Status of Lake Trout and Lake Whitefish Populations in the 1836 Treaty-Ceded Waters of Lakes Superior, Huron and Michigan, with Recommended Yield and Effort Levels for 2020. 2020. Available online: https://www.michigan.gov/greatlakesconsentdecree (accessed on 12 October 2023).
- Goodyear, C.S.; Edsall, T.A.; Dempsey, D.M.O.; Moss, G.D.; Polanski, P.E. Atlas of the Spawning and Nursery Areas of Great Lakes Fishes. Reproductive characteristics of Great Lakes Fishes. U.S. Fish and Wildlife Service, 1982. FWS/OBS-82/52. Available online: https://archive.epa.gov/ecopage/web/pdf/atlas-spawning-nursery-areas-great-lakes-fishes-volume-2-lake-superior-198209-124pp.pdf (accessed on 12 October 2023).
- Gobin, J.; Lester, N.P.; Cottrill, A.; Fox, M.G.; Dunlop, E.S. Trends in growth and recruitment of Lake Huron lake whitefish during a period of ecosystem change, 1985 to 2012. J. Great Lakes Ries. 2015, 41, 405–414. [Google Scholar] [CrossRef]
- Evans, M.S.; Sell, D.W. Mesh size and collection characteristics of a 50-cm diameter conical plankton nets. Hydrobiologia 1977, 122, 97–104. [Google Scholar] [CrossRef]
- Mantzouki, E.; Beklioǧlu, M.; Brookes, J.D.; de Senerpont Domis, L.N.; Dugan, H.A.; Doubek, J.P.; Grossart, H.-P.; Nejstgaard, J.C.; Pollard, A.I.; Ptacnik, R.; et al. Snapshot surveys for lake monitoring, more than a shot in the dark. Front. Ecol. Evol. 2018, 6, 201. [Google Scholar] [CrossRef]
Figure 1.
Mean crustacean zooplankton density on 32 beach sites sampled in Lake Michigan from 26 to 29 June 2020. Pentagrams represent cities, while triangles represent major tributaries. ARC = Arcadia, BAY = Bayshore, CEL = Cedar Loft, CRV = Cross Village, DAB = Dam Beach, EMP = Empire, ESC = Escanaba, FIS = Fisherman’s Island State Park, GOH = Good Harbor, GOC = Gould City, HOF = Hoffmaster State Park, JAP = Jackson Port, KAB = Kates Bay, LBN = Little Bay de Noc, LUD = Ludington, MAC = Mackinaw City, MNE = Manistee, MAN = Manistique, MTP = Manistique Township Park, MEN = Menominee, MIP = Mission Point, MON = Montague, NAU = Naubinway, OGO = Ogontz, PET = Petoskey, POL = Point La Barbe, SAB = Sac Bay, SDB = Sand Bay, SCP = Seul Choix Point, SIL = Silver Lake, STP = Stony Point, STR = Straits.

Figure 2.
(A) Water temperature, (B) Specific conductivity, (C) Dissolved oxygen concentration, and (D) pH at each individual site. For the legend caption: GGB (green) = Greater Green Bay, NLM (dark blue) = Northern Lake Michigan, and CLM (light blue) = Central Lake Michigan. Vertical lines separate geographical regions.

Figure 3.
Total crustacean zooplankton (A) density and (B) biomass at each individual site. For the legend caption: GGB (green) = Greater Green Bay, NLM (dark blue) = Northern Lake Michigan, and CLM (light blue) = Central Lake Michigan. Vertical lines separate geographical regions.
Figure 3.
Total crustacean zooplankton (A) density and (B) biomass at each individual site. For the legend caption: GGB (green) = Greater Green Bay, NLM (dark blue) = Northern Lake Michigan, and CLM (light blue) = Central Lake Michigan. Vertical lines separate geographical regions.

Figure 4.
Density of (A) cladocerans, (B) calanoids, (C) cyclopoids, and (D) nauplii at each individual site. For the legend caption: GGB (green) = Greater Green Bay, NLM (dark blue) = Northern Lake Michigan, and CLM (light blue) = Central Lake Michigan. Vertical lines separate geographical regions.

Figure 5.
NMDS ordination of crustacean zooplankton communities at 32 beach sites grouped by region (GGB, NLM, CLM).
Figure 5.
NMDS ordination of crustacean zooplankton communities at 32 beach sites grouped by region (GGB, NLM, CLM).

Figure 6.
Percentage composition of crustacean zooplankton by (A) density and (B) biomass for each individual site. Vertical lines separate geographical regions.
Figure 6.
Percentage composition of crustacean zooplankton by (A) density and (B) biomass for each individual site. Vertical lines separate geographical regions.


Table 1.
Regional (Greater Green Bay, Northern LM, and Central LM) summary statistics of environmental variables from the 32 beach locations sampled in June 2020 in Lake Michigan.
Table 1.
Regional (Greater Green Bay, Northern LM, and Central LM) summary statistics of environmental variables from the 32 beach locations sampled in June 2020 in Lake Michigan.
| Variable | Mean ± 1 S.D. | Median | Minimum | Maximum |
|---|---|---|---|---|
| Greater Green Bay | ||||
| Water temperature, °C | 21.3 ± 1.9 | 21.7 | 18.2 | 23.4 |
| Dissolved oxygen, mg L−1 | 8.4 ± 1.3 | 9.0 | 6.0 | 10.2 |
| Specific conductivity, µS cm−1 | 270 ± 17 | 280 | 250 | 310 |
| pH | 8.1 ± 0.3 | 8.2 | 7.7 | 8.5 |
| Northern Lake Michigan | ||||
| Water temperature, °C | 16.7 ± 2.5 | 16.2 | 11.9 | 21.1 |
| Dissolved oxygen, mg L−1 | 9.8 ± 0.8 | 9.7 | 8.9 | 11.6 |
| Specific conductivity, µS cm−1 | 280 ± 21 | 270 | 250 | 310 |
| pH | 8.6 ± 0.3 | 8.5 | 8.3 | 9.0 |
| Central Lake Michigan | ||||
| Water temperature, °C | 20.7 ± 1.7 | 20.8 | 18.1 | 23.1 |
| Dissolved oxygen, mg L−1 | 9.9 ± 0.6 | 10.0 | 9.0 | 10.8 |
| Specific conductivity, µS cm−1 | 310 ± 16.0 | 310 | 285 | 340 |
| pH | 8.9 ± 0.3 | 8.9 | 8.3 | 9.1 |
Table 2.
Summary statistics for different zooplankton groups across the 32 beaches sampled in June 2020 in Lake Michigan. n = 32 for all groups.
Table 2.
Summary statistics for different zooplankton groups across the 32 beaches sampled in June 2020 in Lake Michigan. n = 32 for all groups.
| Group | Mean ± 1 S.D. | Median | Minimum | Maximum |
|---|---|---|---|---|
| Density (ind. m−3) | ||||
| Total crustacean | 16,398 ± 20,226 | 6707 | 341 | 74,010 |
| Cladocera | 12,302 ± 17,669 | 1965 | 78.6 | 61,435 |
| Cyclopoid | 1563 ± 1877 | 773 | 78.6 | 6170 |
| Calanoid | 1102 ± 1473 | 364 | 0 | 5973 |
| Nauplii | 1296 ± 1558 | 655 | 0 | 7205 |
| Biomass (mg DW m−3) | ||||
| Total crustacean | 10.1 ± 9.8 | 7.2 | 0.2 | 30.6 |
| Cladocera | 5.2 ± 7.0 | 1.7 | 0.06 | 26.2 |
| Cyclopoid | 2.3 ± 2.6 | 1.1 | 0.07 | 9.2 |
| Calanoid | 2.7 ± 3.4 | 1.2 | 0 | 15.8 |
| Nauplii | 0.4 ± 0.3 | 0.3 | 0 | 1.1 |
Disclaimer/Publisher’s Note: The statements, opinions and data contained in all publications are solely those of the individual author(s) and contributor(s) and not of MDPI and/or the editor(s). MDPI and/or the editor(s) disclaim responsibility for any injury to people or property resulting from any ideas, methods, instructions or products referred to in the content. |
© 2023 by the authors. Licensee MDPI, Basel, Switzerland. This article is an open access article distributed under the terms and conditions of the Creative Commons Attribution (CC BY) license (https://creativecommons.org/licenses/by/4.0/).
Share and Cite
MDPI and ACS Style
Johnston, S.J.; Smith, J.B.; Slater, B.D.; Doubek, J.P. Spatial Density, Biomass, and Composition of Crustacean Zooplankton on Lake Michigan Beaches. Fishes 2023, 8, 599. https://doi.org/10.3390/fishes8120599
AMA Style
Johnston SJ, Smith JB, Slater BD, Doubek JP. Spatial Density, Biomass, and Composition of Crustacean Zooplankton on Lake Michigan Beaches. Fishes. 2023; 8(12):599. https://doi.org/10.3390/fishes8120599
Chicago/Turabian StyleJohnston, Samuel J., Jason B. Smith, Brady D. Slater, and Jonathan P. Doubek. 2023. "Spatial Density, Biomass, and Composition of Crustacean Zooplankton on Lake Michigan Beaches" Fishes 8, no. 12: 599. https://doi.org/10.3390/fishes8120599