

Regional Variation in the Trophic Ecology of Wahoo (Acanthocybium solandri) in the Western Atlantic Ocean
by
 , , and
Brendan Gough
1,
Alexandra Prouse
1,*,
Michael A. Dance
2,
R. J. David Wells
1,3 and
Jay R. Rooker
1,3 1
Department of Marine Biology, Texas A&M University at Galveston, Galveston, TX 77553, USA
2
Department of Oceanography and Coastal Sciences, Louisiana State University, Baton Rouge, LA 70803, USA
3
Department of Ecology and Conservation Biology, Texas A&M University, College Station, TX 77843, USA
*
Author to whom correspondence should be addressed.
Fishes 2023, 8(10), 519; https://doi.org/10.3390/fishes8100519
Submission received: 10 August 2023
/
Revised: 9 October 2023
/
Accepted: 18 October 2023
/
Published: 20 October 2023
(This article belongs to the Special Issue Trophic Ecology of Fishes)
Abstract
:Intrinsic tracers, such as stable isotopes of carbon and nitrogen, are common dietary markers that accumulate in the muscle tissue of consumers and can be used to determine the dietary sources and trophic positions of consumers. The aim of this study was to assess regional variation in the trophic ecology of wahoo (Acanthocybium solandri) using bulk stable isotopes. Muscle biopsies of wahoo were collected from four regions in the western Atlantic Ocean: the eastern Gulf of Mexico, western Gulf of Mexico, Northwest Atlantic Ocean, and Caribbean Sea. Muscle tissue δ13C and δ15N values for wahoo ranged from −15.8‰ to −18.8‰ and from 7.2‰ to 12.8‰, respectively. Wahoo collected in the Caribbean Sea displayed the highest mean δ13C value (−16.3‰), and individuals from this region were statistically different from the three other regions sampled. Mean δ15N values were elevated for wahoo collected in the eastern and western Gulf of Mexico (11.4‰ and 11.1‰, respectively), and the values were over 2‰ higher than samples from the Northwest Atlantic Ocean and Caribbean Sea. Trophic position (TP) was estimated using δ15N baselines (zooplankton) and δ15N wahoo values for each region, and mean TP was 0.4 to 0.9 higher in the Caribbean Sea relative to the three other regions, suggesting that wahoo in this region feed on higher-trophic-level prey. The results indicate that δ15N baselines and the trophic positions of wahoo each vary as a function of their geographic location, which supports the hypothesis that this species feeds opportunistically throughout its range.
Key Contribution: This study demonstrates regional variation in the intrinsic dietary tracers of wahoo throughout four regions of their range, showcasing the importance of δ15N baselines in estimating the trophic position of migratory predators.
1. Introduction
Top predators play an important role in the overall health and sustainability of marine ecosystems. Many higher-order predators (e.g., billfishes, swordfish, tunas, wahoo) are capable of regulating populations of lower-level consumers through top-down control [1]. As a result, shifts in their foraging may initiate trophic cascades that affect multiple trophic levels of the food web [1]. Given the importance of top-down regulation on ecosystem productivity and resiliency, scientists are increasingly interested in determining the trophic relationships of higher-order consumers within their respective food webs, which can provide valuable information on the role of these predators in regulating energy transfer and community structure within marine food webs.
An improved understanding of the source(s) of organic matter (i.e., primary producers) supporting top predators and the trophic structure of marine food webs is crucial for resource managers, as it influences the stability and resiliency of marine ecosystems. To date, trophic information for many predatory marine teleosts is limited, and understanding the role of these apex predators in marine ecosystems throughout their range is vital for proper management of those systems. Intrinsic dietary tracers, such as stable isotopes, are increasingly used in trophic ecology studies of marine fishes [2,3,4,5]. Stable isotope ratios of carbon and nitrogen can elucidate source(s) of organic matter that supports a community and the trophic position of consumers in the food web, respectively. δ13C only fractionates 0.5–1.5‰ per trophic level, and this marker is typically used to determine the source(s) of organic matter supporting consumers [5]. In contrast, δ15N is often used as a proxy for trophic position because this marker fractionates approximately 3‰ over each trophic level [5].
Wahoo (Acanthocybium solandri) are members of the family Scombridae that includes tunas and mackerels. Wahoo are predators found in the epipelagic zone throughout tropical and subtropical waters around the globe [6]. Wahoo are assumed to be opportunistic piscivores with occasional contributions to diet composition from other taxa, including cephalopods and crustaceans [7,8]. The aim of this study was to apply stable isotope analysis (SIA) to evaluate the source(s) of organic matter supporting wahoo and their trophic position across four geographic regions in the western Atlantic Ocean. Two common dietary markers (δ13C and δ15N) were used to elucidate broad feeding inferences of wahoo and assess regional variation in trophic relationships.
2. Materials and Methods
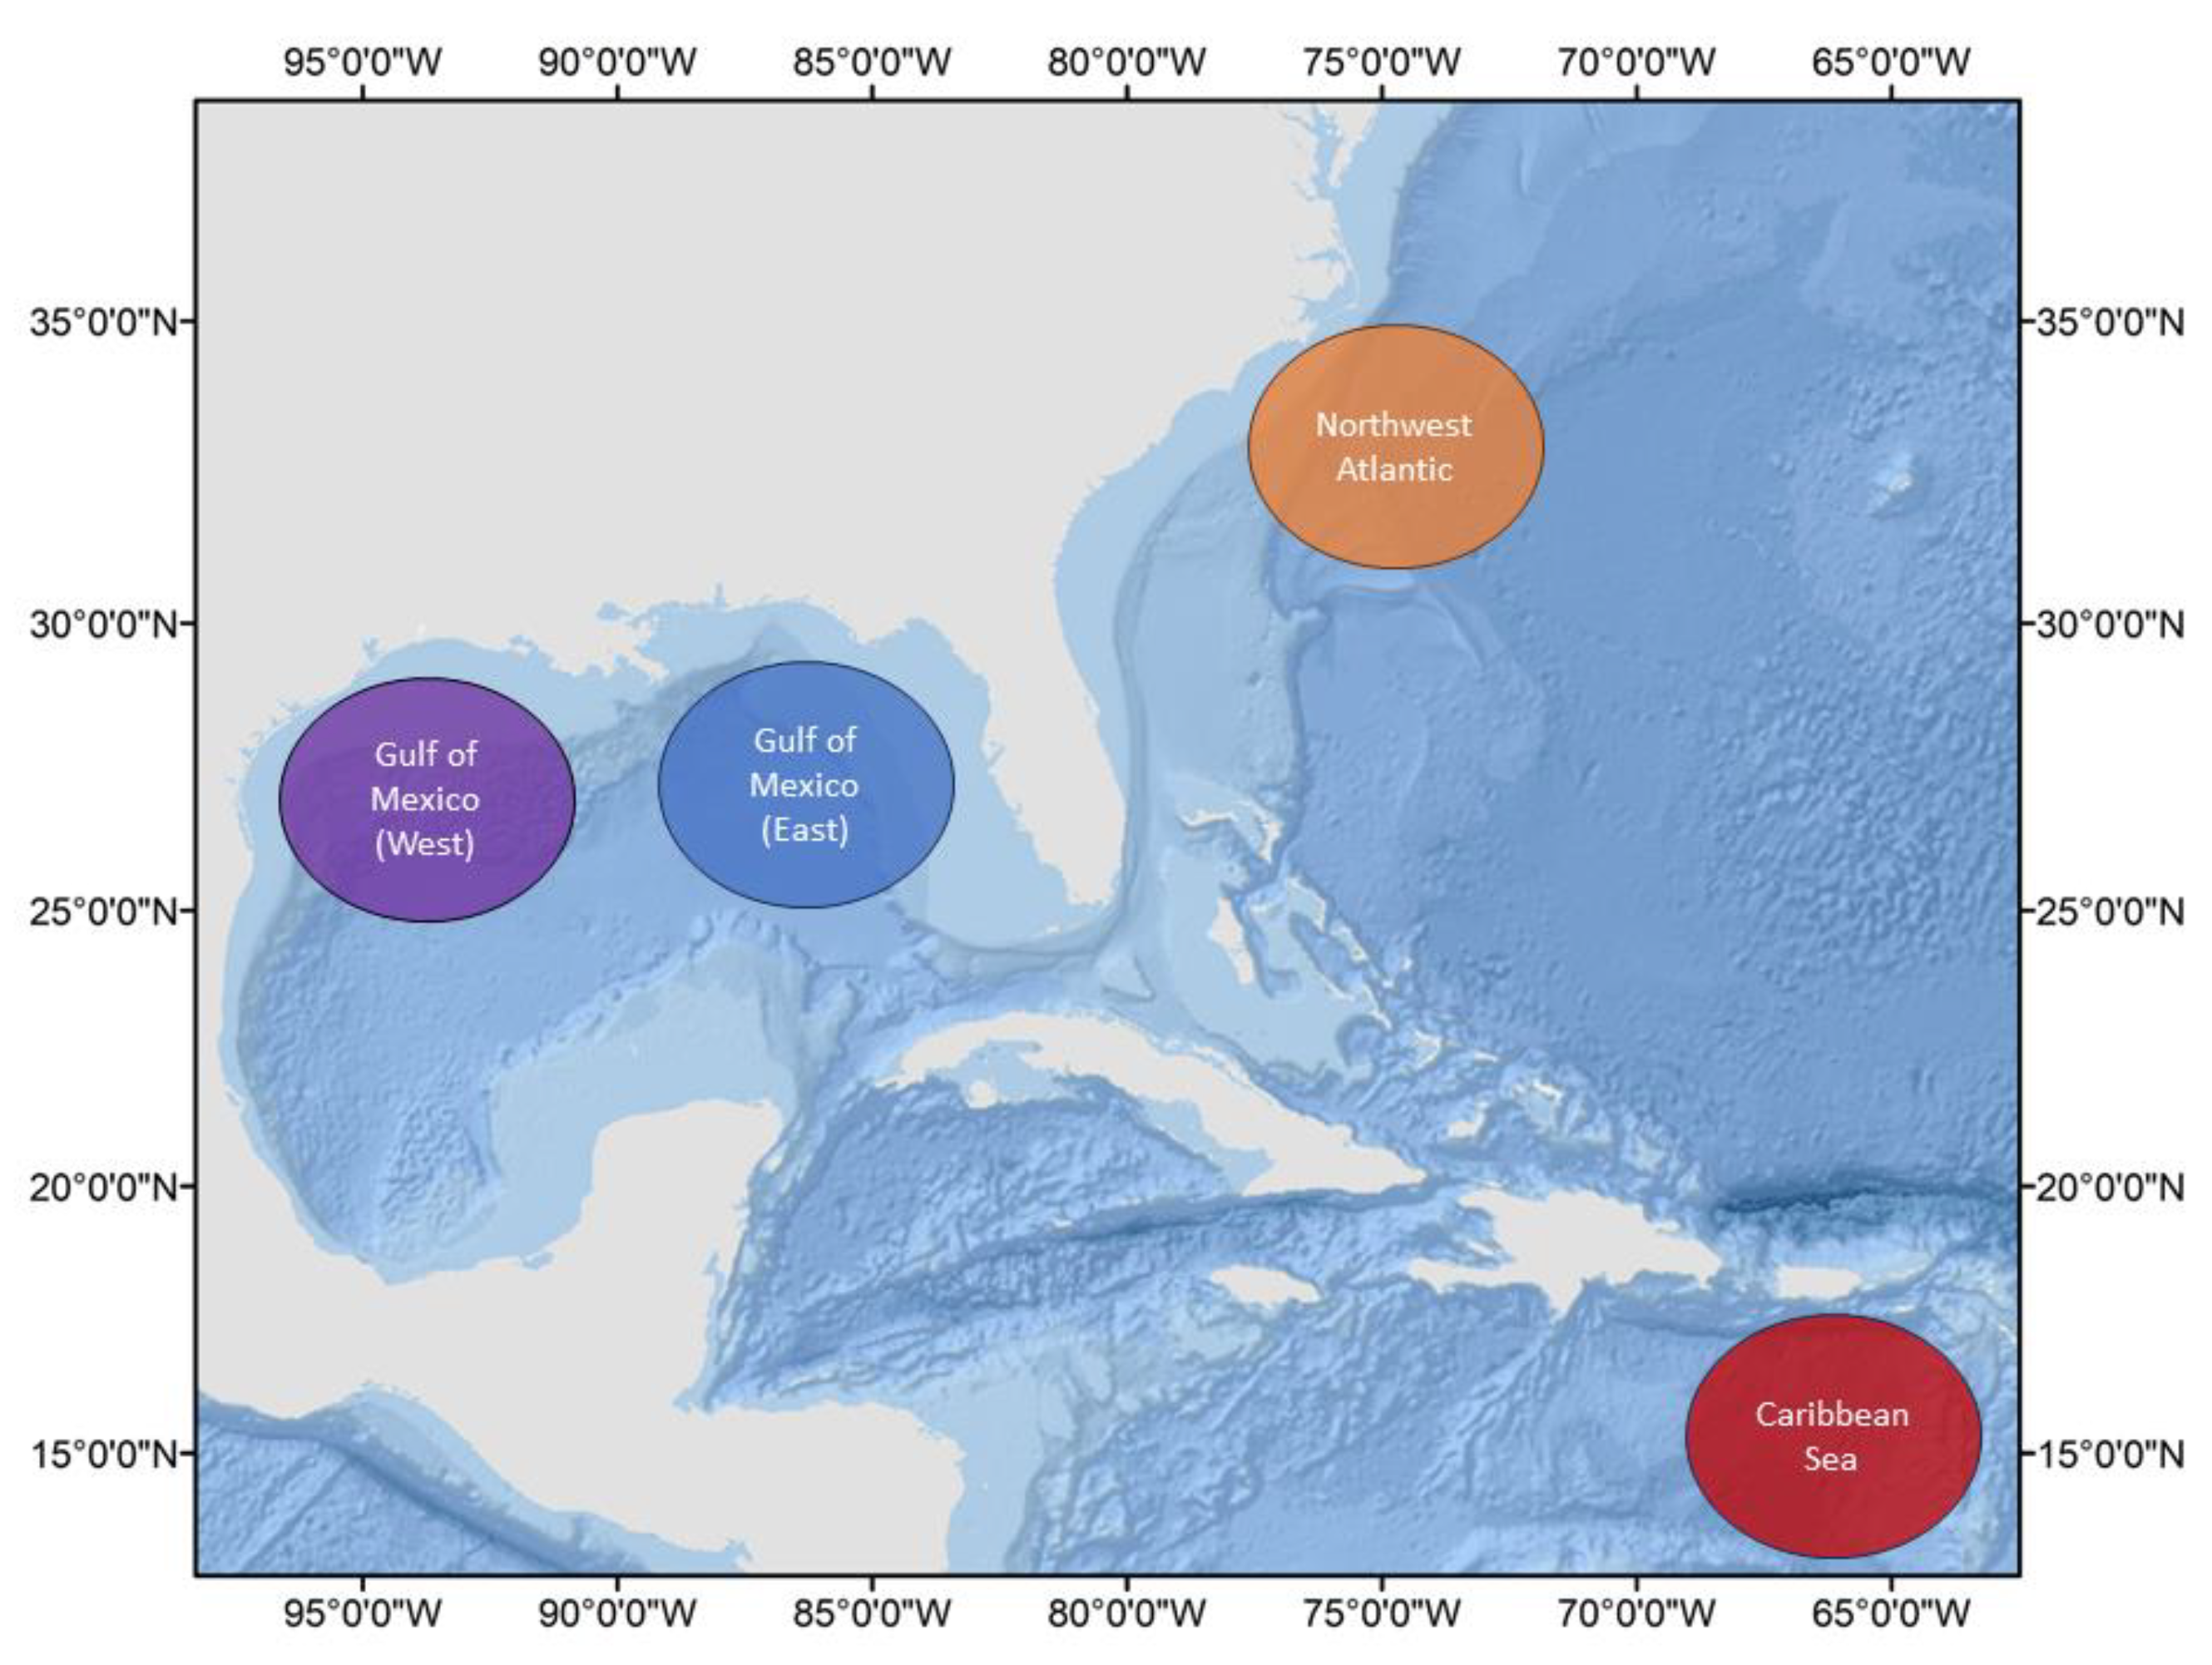
Muscle biopsies of wahoo were collected from four sampling regions in June through October of 2021 (Figure 1): the eastern Gulf of Mexico (n = 11), western Gulf of Mexico (n = 10), Northwest Atlantic Ocean (n = 10), and Caribbean Sea (n = 10). Biopsies were opportunistically collected from individuals caught via recreational and commercial fishing operations once vessels returned to port. All sampled individuals were between 110 cm and 140 cm fork length [9], representing sexually mature adults [10]. Muscle biopsies were collected in the field and stored at −20 °C between collection and processing. Cleaned samples were then lyophilized for 24 h; freezing was completed at −45 °C for 12 h, and drying was completed via vacuum pump at 50 °C for another 12 h. Lyophilized samples were powdered with a mortar and pestle and weighed to 1 mg ± 0.1 mg in 9 × 5 mm tin capsules. Tissue samples were analyzed on an elemental analyzer isotope ratio mass spectrometer (EA-IRMS; Sercon Ltd., Cheshire, UK) at the University of California Davis Stable Isotope Facility. Delta notation (δ) was used to present isotope ratios (13C:12C or 15N:14N) relative to international standards: Vienna PeeDee Belemnite (VPDB) for carbon and air (N2) for nitrogen. The long-term standard deviations of the isotope ratios at this facility are 0.2‰ for δ13C and 0.3‰ for δ15N. C:N ratios of the analyzed samples were below 3.5, indicating that δ13C values were not significantly influenced by lipid content in the muscle and thus did not require lipid extraction [11]. Although smaller sample sizes may affect the power of statistical tests, variation of δ13C and δ15N signatures within regions was lower than among regions and thus the sample size was sufficient to assess regional differences.
Trophic position (TP) was calculated using Equation (1), where 3 represents the average enrichment of δ15N per trophic level [12]. Because baseline δ15N values of the primary producers varies across sampled regions, adjusted TP (TPADJ) estimates were estimated using regional δ15N values reported for the broader Atlantic Ocean and Gulf of Mexico [13,14]; standard TP (TPSTD) estimates based on a single δ15N baseline value that does not account for regional variation were also estimated. The isoscapes used provided δ15N values for zooplankton (δ15NZP), which are indicative of the trophic level above primary producers. Following the average enrichment of δ15N per trophic level stated above, the δ15Nproducer value was determined by (δ15NZP − 3).
TPconsumer = 1 + (δ15Nconsumer − δ15Nproducer)/3
Regional variation in δ13C and δ15N values were investigated with a one-way analysis of variance (ANOVA) and Tukey’s honestly significant difference (HSD) test. Quadratic discriminant function analysis was used to determine classification success for each collection region based on δ13C and δ15N values. All statistical analysis was conducted in RStudio (R version 4.2.2).
3. Results
3.1. Regional δ13C and δ15N Values
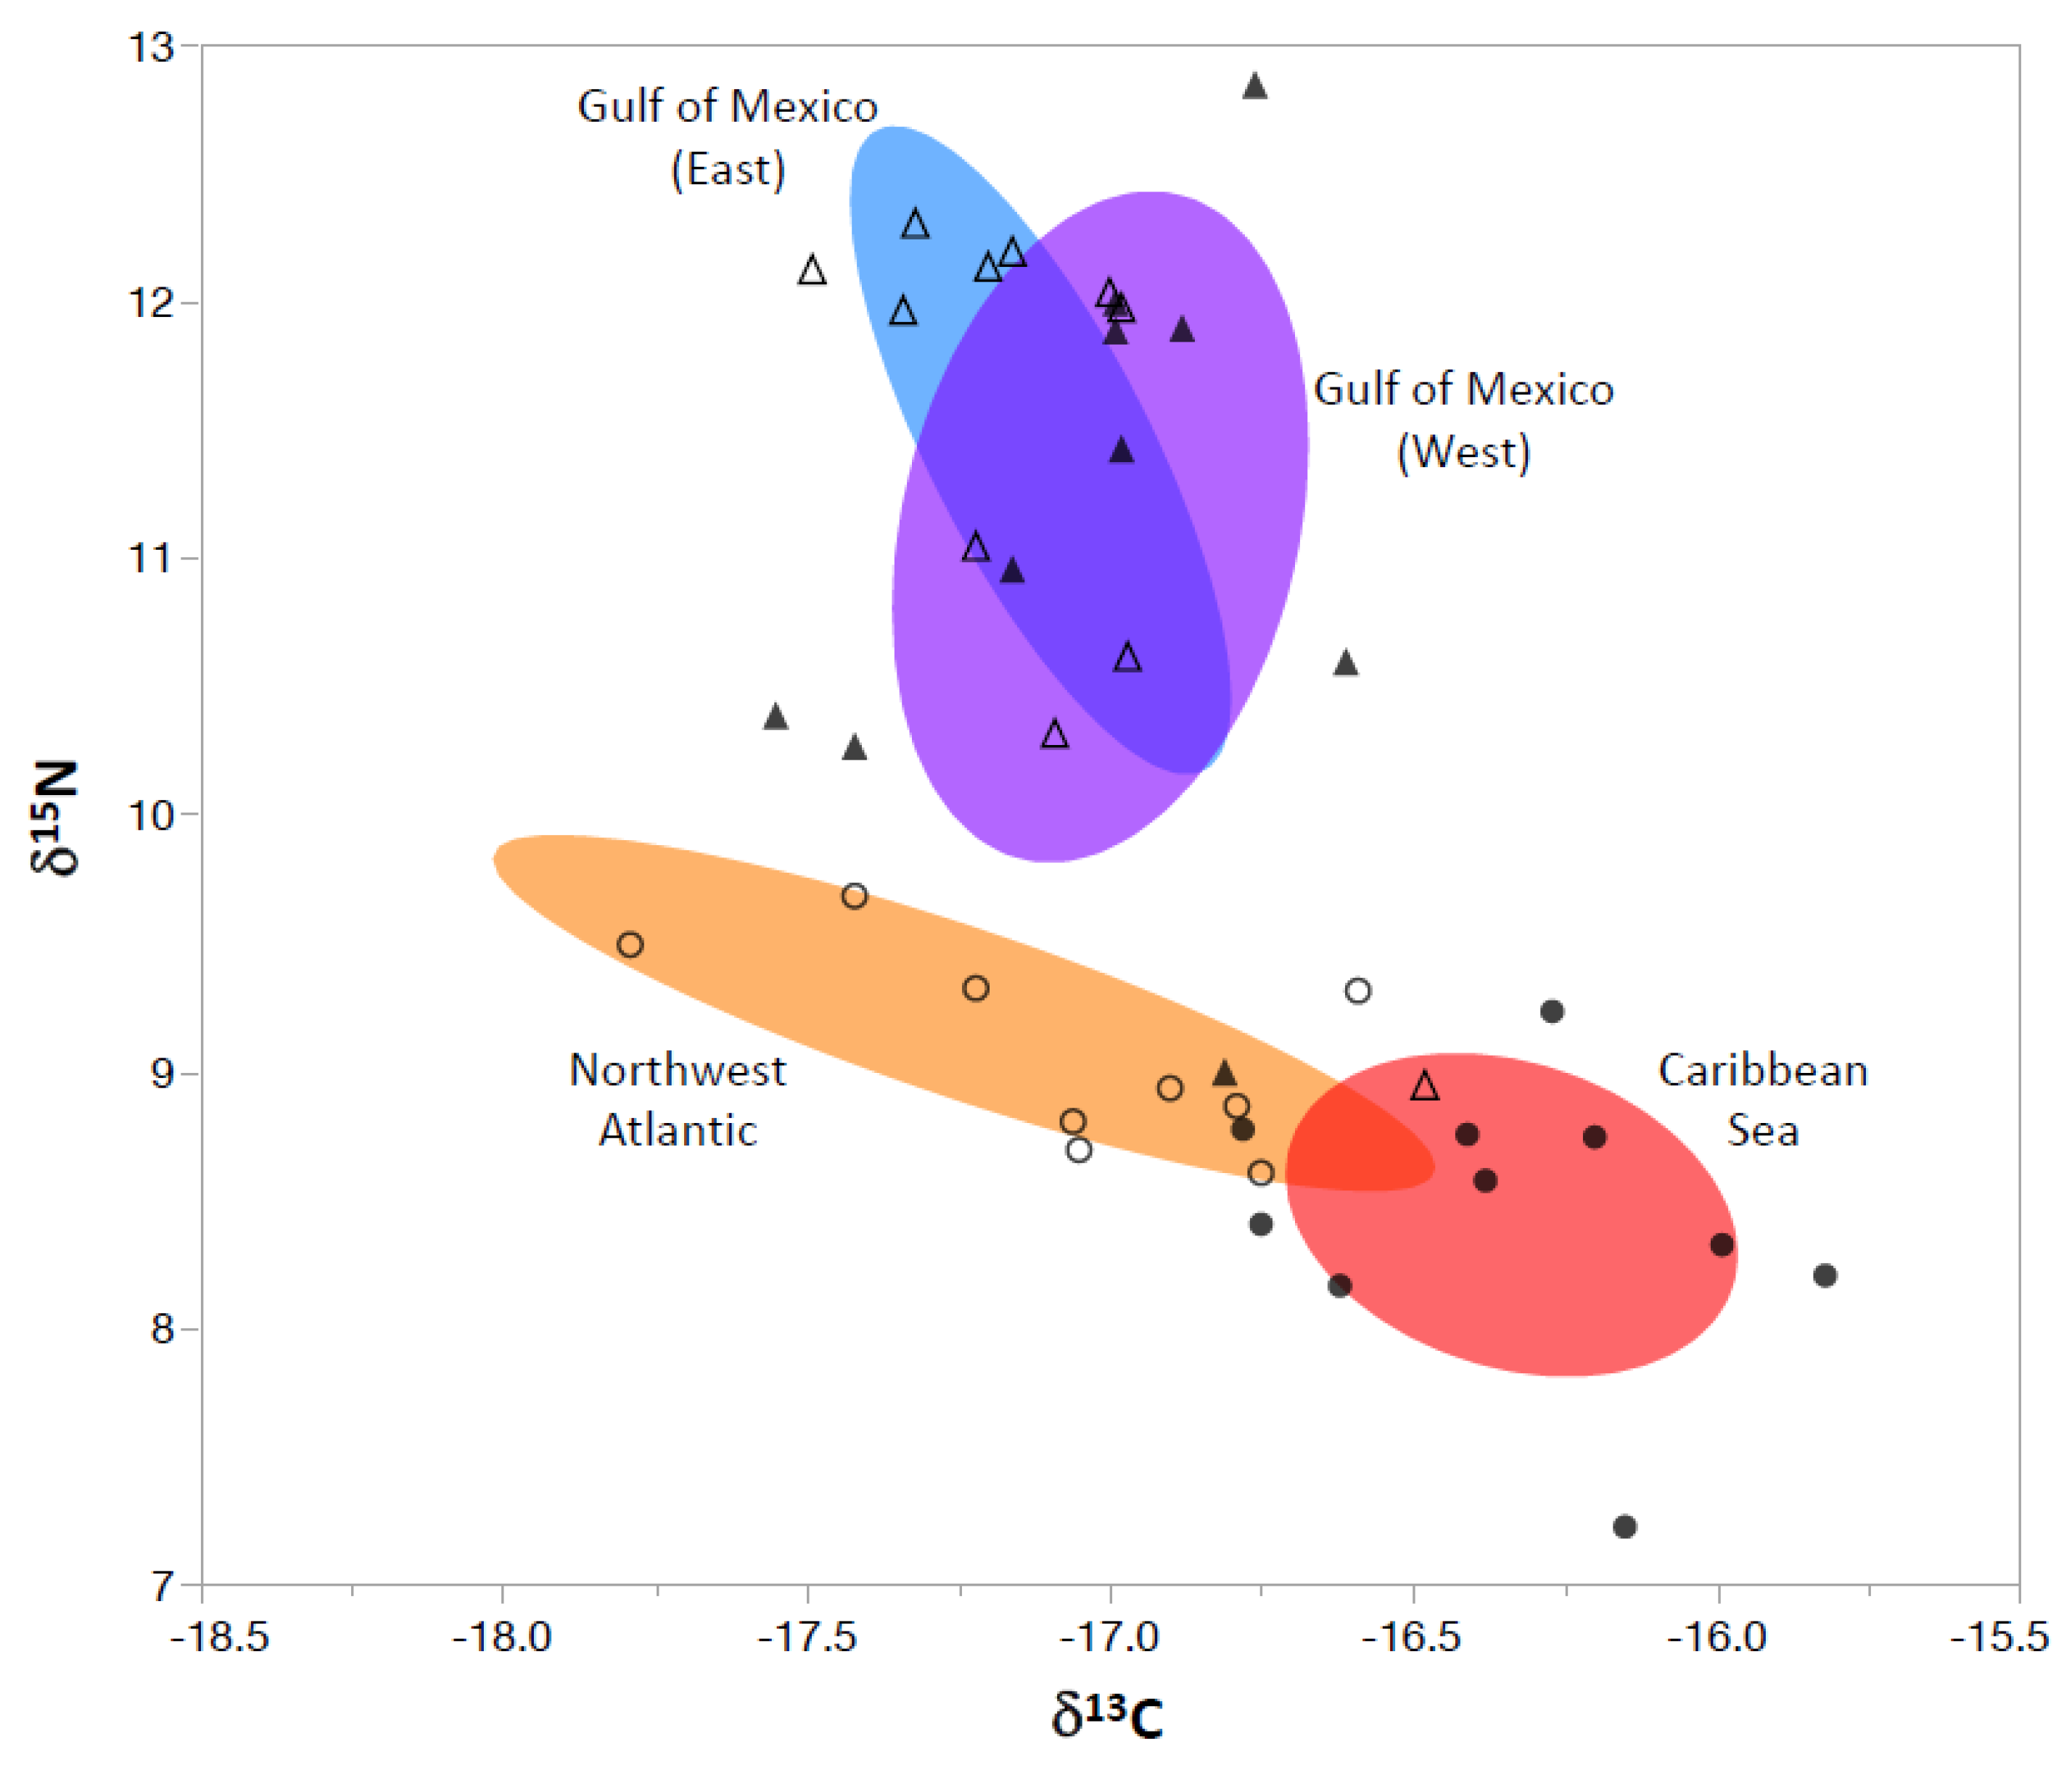
Muscle tissue δ13C and δ15N values of wahoo varied across the four geographic locations sampled. Specifically, δ13C values of wahoo from the Caribbean Sea were significantly different compared to the Northwest Atlantic Ocean and both regions in the Gulf of Mexico (ANOVA, p < 0.01; Figure 2). Wahoo collected from the Caribbean Sea had significantly enriched δ13C values (−16.3‰ ± 0.32; mean ± 1 SD), with relatively similar signatures shown in the other three regions: Northwest Atlantic Ocean (−17.2 ± 0.66), eastern Gulf of Mexico (−17.1 ± 0.26), western Gulf of Mexico (−17.0 ± 0.29) (Table 1). Regional variation was also observed for muscle tissue δ15N values, with samples collected from both regions in the Gulf of Mexico (east = 11.4 ± 1.0, west = 11.1 ± 1.1) displaying significantly higher values relative to samples from the Northwest Atlantic Ocean (9.2 ± 0.59) and Caribbean Sea (8.4 ± 0.53) (ANOVA, p < 0.01; Figure 2); however, no significant differences were detected between the two regions in the Gulf of Mexico or between the two regions in the Atlantic Ocean.
Collection locations in the Gulf of Mexico and Atlantic Ocean were grouped to further evaluate large-scale variation, and δ13C and δ15N signatures from the two larger geographic regions were significantly different (MANOVA, p < 0.01). Quadratic discriminant function analysis (QDFA) parameterized with δ13C and δ15N signatures displayed a relatively high cross-validated classification success (85%) in the two larger regions, indicating that these dietary signatures show promise for retrospectively determining the collection location of wahoo (Gulf of Mexico vs. Atlantic Ocean) for samples of unknown origin.
3.2. Regional TP Estimates
Estimates of standard trophic position (TPSTD) for wahoo were estimated using a standard baseline for all regions. In addition, adjusted TP (TPADJ) estimates were derived using δ15NZP values (baseline) for each region from available isoscapes [13,14]. Standard TP estimates of wahoo were between 2.7 and 3.7, with significantly higher values reported for wahoo collected in the Gulf of Mexico (ANOVA, p < 0.001). Adjusted TP estimates of wahoo derived using regional estimates of δ15NZP markedly increased the position of individuals from the Caribbean Sea by nearly two trophic steps (4.1). While this region was characterized by the lowest TP using a single δ15N baseline value, TP was approximately a half to full trophic step higher when using region-specific baseline values and significantly different from the three other regions (Tukey HSD, p < 0.05). Adjusted TP estimates using region-specific baselines were lowest in the Northwest Atlantic Ocean, and both TP range and means were similar (3.6–3.7) between the two regions in the Gulf of Mexico.
4. Discussion
Regional differences in muscle tissue δ13C values of wahoo collected across the four regions were observed, but similarities were also present for individuals collected from different regions within the Gulf of Mexico and within the Atlantic Ocean. Similar δ13C values for wahoo in both the eastern and western Gulf of Mexico support the premise that source(s) of organic matter supporting the pelagic food web and associated top predators in this region are similar in ecosystems both east and west of the Mississippi River Delta. Recently reported δ13C isoscapes for zooplankton in the outer shelf and slope waters of the northern Gulf of Mexico also reported limited variation in δ13C values [15], which is in accord with our findings for wahoo. Outside the Gulf of Mexico, our finding of comparable δ13C values for wahoo collected in the Northwest Atlantic Ocean and Caribbean Sea was less expected given the distance between the two regions and different latitudinal biomes of each collection area (tropical versus temperate); however, variation in the δ13C values of both phytoplankton and zooplankton in the general areas that wahoo were sampled in the Northwest Atlantic Ocean (Mid-Atlantic Bight) and Caribbean Sea (Lesser Antilles) is generally limited (~1–2‰ range) [16]. This indicates that although these two provinces are separated geographically, primary sources of organic matter and/or δ13C values of major autotrophs in both regions may be comparable.
Muscle tissue δ15N values of wahoo also varied across the four regions, with similarities observed for individuals collected from the two regions in the Gulf of Mexico and from the two regions in the Atlantic Ocean. δ15N values for wahoo from the Gulf of Mexico were significantly higher than individuals from the Atlantic Ocean and generally comparable to previously reported values for wahoo throughout their range [9,17]. A study conducted in the Galapagos Islands reported mean δ15N values for wahoo of 15.3‰, nearly 4.0‰ higher than any region assessed in the present study [18]; however, estimating adjusted TP using mean zooplankton δ15N values from this region of the Pacific Ocean resulted in similar values in our study [19], further confirming the importance of incorporating region-specific baseline δ15N data for estimating TP. Unique baseline δ15N values were present across the sampling locations of this study, with significantly lower δ15N values of zooplankton (δ15NZP) present in the Caribbean Sea [20] compared to the Gulf of Mexico and Northwest Atlantic Ocean. Lower δ15NZP values were shown to be characteristic of oligotrophic waters due to increased nitrogen fixation by diazotrophic cyanobacteria [20,21], whereas waters influenced by anthropogenic nitrogen sources from riverine output such as the Mississippi River delta tend to report higher δ15NZP values [14,22]. Despite significantly higher δ15N values for wahoo in the Gulf of Mexico, incorporating δ15NZP values into TP estimates accounted for regional variation in δ15N baselines and elevated the TP of wahoo from the Caribbean Sea. Nevertheless, adjusted TP estimates of wahoo from all four regions were comparable to previously reported values in different parts of their range and also similar to other higher-order marine teleosts in pelagic ecosystems [10,23,24,25], further supporting the premise that wahoo appear to be opportunistic predators that feed at similar trophic levels throughout their range in tropical and subtropical waters.
It is well understood that baseline δ13C and δ15N values and prey fields vary spatially and temporally, and therefore movements or migrations of predators can lead to shifts in prey selection and TP. As a result, a better understanding of the home range and migrations of wahoo may help explain observed regional trends observed in muscle tissue δ13C and δ15N. For example, similarities in muscle tissue δ13C and δ15N values for wahoo in both the eastern and western Gulf of Mexico may be associated with active movements or migrations between the two regions. Conversely, conspicuous differences in δ13C and δ15N values observed for individuals collected from the two larger geographic (Gulf of Mexico vs. Atlantic Ocean) regions may indicate that long-distance movements between these two regions is less likely. Data on the population connectivity of wahoo coupled with higher quality δ13C and δ15N baselines, including other sources of dietary information, are critically needed to elucidate the drivers of region-specific variation and further clarify trophic relationships for this species.
Author Contributions
Conceptualization, J.R.R. and R.J.D.W.; methodology, J.R.R. and R.J.D.W.; formal analysis, B.G., A.P. and J.R.R.; writing—original draft preparation, B.G., A.P. and J.R.R.; writing—review and editing, B.G., A.P., J.R.R., R.J.D.W. and M.A.D.; visualization, A.P. and J.R.R.; supervision, J.R.R.; funding acquisition, J.R.R. All authors have read and agreed to the published version of the manuscript.
Funding
This research was supported with funding from the Gulf Research Institute for Highly Migratory Species and the Research and Graduate Studies Office at Texas A&M University at Galveston.
Institutional Review Board Statement
All collections were performed in accordance with relevant guidelines and regulations of institutional animal care and use committees (IACUC) at Texas A&M University. No official animal use license was required because biological sampling was performed on harvested (non-living) specimens from commercial and recreational fishing operations.
Informed Consent Statement
Not applicable.
Data Availability Statement
The datasets generated for this study can be made available upon request to the corresponding author.
Acknowledgments
This project was carried out in support and mentorship of one undergraduate student (B.G.) participating in the Undergraduate Research Scholars program at Texas A&M University at Galveston. The authors would like to thank collaborators at Texas A&M University at Galveston, Louisiana State University, North Carolina State University, and PezMar Research L.L.C. for their assistance in sample collection and members of the Fisheries Ecology Lab and Shark Biology and Fisheries Science Lab at Texas A&M University at Galveston for their support.
Conflicts of Interest
The authors declare no conflict of interest.
References
- Shears, N.T.; Babcock, R.C. Marine reserves demonstrate top-down control of community structure on temperate reefs. Oecologia 2002, 132, 131–142. [Google Scholar] [CrossRef] [PubMed]
- Chang, Y.-C.; Chiang, W.-C.; Madigan, D.J.; Tsai, F.-Y.; Chiang, C.-L.; Hsu, H.-H.; Lin, S.-M.; Zhuang, M.-Y.; Sun, C.-T.; Chen, L.-C. Trophic dynamics and feeding ecology of skipjack tuna (Katsuwonus pelamis) off Eastern and Western Taiwan. Molecules 2022, 27, 1073. [Google Scholar] [CrossRef] [PubMed]
- Richards, T.M.; Sutton, T.T.; Wells, R.D. Trophic structure and sources of variation influencing the stable isotope signatures of meso-and bathypelagic micronekton fishes. Front. Mar. Sci. 2020, 7, 507992. [Google Scholar] [CrossRef]
- Speed, C.; Meekan, M.; Field, I.; McMahon, C.; Abrantes, K.; Bradshaw, C. Trophic ecology of reef sharks determined using stable isotopes and telemetry. Coral Reefs 2012, 31, 357–367. [Google Scholar] [CrossRef]
- Wells, R.D.; Cowan Jr, J.H.; Fry, B. Feeding ecology of red snapper Lutjanus campechanus in the northern Gulf of Mexico. Mar. Ecol. Prog. Ser. 2008, 361, 213–225. [Google Scholar] [CrossRef]
- Sepulveda, C.A.; Aalbers, S.A.; Ortega-Garcia, S.; Wegner, N.C.; Bernal, D. Depth distribution and temperature preferences of wahoo (Acanthocybium solandri) off Baja California Sur, Mexico. Mar. Biol. 2011, 158, 917–926. [Google Scholar] [CrossRef]
- Mendoza-Avila, M.; Zavala-Zambrano, G.; Galván-Magaña, F.; Loor-Andrade, P. Feeding habits of wahoo (Acanthocybium solandri) in the eastern Pacific Ocean. J. Mar. Biol. Assoc. United Kingd. 2017, 97, 1505–1510. [Google Scholar] [CrossRef]
- Gao, C.; Tian, S.; Kindong, R.; Dai, X. Biology and environmental preferences of wahoo, Acanthocybium solandri (Cuvier, 1832), in the Western and Central Pacific Ocean (WCPO). J. Mar. Sci. Eng. 2020, 8, 184. [Google Scholar] [CrossRef]
- Martins, K.; Pelage, L.; Justino, A.K.; Frédou, F.L.; Júnior, T.V.; Le Loc’h, F.; Travassos, P. Assessing trophic interactions between pelagic predatory fish by gut content and stable isotopes analysis around Fernando de Noronha Archipelago (Brazil), Equatorial West Atlantic. J. Fish Biol. 2021, 99, 1576–1590. [Google Scholar] [CrossRef] [PubMed]
- Oxenford, H.A.; Murray, P.A.; Luckhurst, B.E. The biology of wahoo (Acanthocybium solandri) in the western central Atlantic. Gulf Caribb. Res. 2003, 15, 33–49. [Google Scholar] [CrossRef]
- Post, D.M.; Layman, C.A.; Arrington, D.A.; Takimoto, G.; Quattrochi, J.; Montana, C.G. Getting to the fat of the matter: Models, methods and assumptions for dealing with lipids in stable isotope analyses. Oecologia 2007, 152, 179–189. [Google Scholar] [CrossRef] [PubMed]
- Vander Zanden, J.M.; Rasmussen, J.B. Variation in δ15N and δ13C trophic fractionation: Implications for aquatic food web studies. Limnol. Oceanogr. 2001, 46, 2061–2066. [Google Scholar] [CrossRef]
- Graham, B.S.; Koch, P.L.; Newsome, S.D.; McMahon, K.W.; Aurioles, D. Using isoscapes to trace the movements and foraging behavior of top predators in oceanic ecosystems. In Isoscapes: Understanding Movement, Pattern, and Process on Earth through Isotope Mapping; Springer: Berlin/Heidelberg, Germany, 2010; pp. 299–318. [Google Scholar]
- McMahon, K.W.; Hamady, L.L.; Thorrold, S.R. A review of ecogeochemistry approaches to estimating movements of marine animals. Limnol. Oceanogr. 2013, 58, 697–714. [Google Scholar] [CrossRef]
- Hernández-Sánchez, O.G.; Camacho-Ibar, V.F.; Barbero, L.; Herguera, J.C.; Herzka, S.Z. A gulf-wide synoptic isoscape of zooplankton isotope ratios reveals the importance of nitrogen fixation in supporting secondary production in the central Gulf of Mexico. Front. Mar. Sci. 2023, 9, 1025387. [Google Scholar] [CrossRef]
- Magozzi, S.; Yool, A.; Vander Zanden, H.; Wunder, M.; Trueman, C. Using ocean models to predict spatial and temporal variation in marine carbon isotopes. Ecosphere 2017, 8, e01763. [Google Scholar] [CrossRef]
- Rooker, J.R.; Turner, J.P.; Holt, S.A. Trophic ecology of Sargassum-associated fishes in the Gulf of Mexico determined from stable isotopes and fatty acids. Mar. Ecol. Prog. Ser. 2006, 313, 249–259. [Google Scholar] [CrossRef]
- Páez-Rosas, D.; Galván-Magaña, F.; Baque-Menoscal, J.; Tripp-Valdez, A.; Fischer, C.; Hearn, A. Trophic preferences of three pelagic fish inhabiting the Galapagos Marine Reserve: Ecological inferences using multiple analyses. Environ. Biol. Fishes 2020, 103, 647–665. [Google Scholar] [CrossRef]
- Páez-Rosas, D.; Aurioles-Gamboa, D.; Alava, J.J.; Palacios, D.M. Stable isotopes indicate differing foraging strategies in two sympatric otariids of the Galapagos Islands. J. Exp. Mar. Biol. Ecol. 2012, 424, 44–52. [Google Scholar] [CrossRef]
- Dorado, S.; Rooker, J.R.; Wissel, B.; Quigg, A. Isotope baseline shifts in pelagic food webs of the Gulf of Mexico. Mar. Ecol. Prog. Ser. 2012, 464, 37–49. [Google Scholar] [CrossRef]
- Montoya, J.P.; Carpenter, E.J.; Capone, D.G. Nitrogen fixation and nitrogen isotope abundances in zooplankton of the oligotrophic North Atlantic. Limnol. Oceanogr. 2002, 47, 1617–1628. [Google Scholar] [CrossRef]
- Saino, T.; Hattori, A. 15N natural abundance in oceanic suspended particulate matter. Nature 1980, 283, 752–754. [Google Scholar] [CrossRef]
- Cai, Y.; Rooker, J.R.; Gill, G. Bioaccumulation of Mercury in Pelagic Fishes from the NW Gulf of Mexico and Its Relationship with Length, Location, Collection Year, and Trophic Level. 2006. Available online: http://hdl.handle.net/1834/29782 (accessed on 12 July 2023).
- Franks, J.S.; Hoffmayer, E.R.; Ballard, J.R.; Garber, N.M.; Garber, A.F. Diet of wahoo, Acanthocybium solandri, from the Northcentral Gulf of Mexico. Proc. 60th Gulf Caribb. Fish. Inst. 2007, 60, 353–362. [Google Scholar]
- Manooch III, C.S.; Hogarth, W.T. Stomach contents and giant trematodes from wahoo, Acanthocybium solanderi, collected along the South Atlantic and Gulf coasts of the United States. Bull. Mar. Sci. 1983, 33, 227–238. [Google Scholar]
Figure 1.
Sampling regions for wahoo in the western Atlantic Ocean: western Gulf of Mexico (Texas), eastern Gulf of Mexico (Mississippi to Florida), Caribbean Sea (Puerto Rico, U.S. Virgin Islands), and Northwest Atlantic Ocean (North Carolina). All samples were opportunistically collected via recreational and commercial fishing operations once vessels returned to port.

Figure 2.
Confidence ellipses (50%) based on δ13C and δ15N values of wahoo from the Gulf of Mexico (East, open triangles; West, filled triangles), Northwest Atlantic Ocean (open circles), and Caribbean Sea (filled circles). Values for individual wahoo shown with symbols.
Figure 2.
Confidence ellipses (50%) based on δ13C and δ15N values of wahoo from the Gulf of Mexico (East, open triangles; West, filled triangles), Northwest Atlantic Ocean (open circles), and Caribbean Sea (filled circles). Values for individual wahoo shown with symbols.


Table 1.
Size (mean FL in cm ±1 SD), baseline zooplankton δ15N (δ15NZP) values [13,14], standard (STD) trophic position (based on same δ15N baseline value for all regions), and adjusted (ADJ) range and mean estimates of trophic position (mean ± standard deviation) for wahoo using region-specific δ15NZP values from the four sampling regions. TPSTD based on standard δ15NZP of 6.2 for all four regions, while TPADJ range and mean estimates based on region-specific δ15NZP values shown in table.
| Region | Size (cm FL) | δ15NZP | TPSTD | TPADJ Range | TPADJ Mean |
|---|---|---|---|---|---|
| Gulf of Mexico | |||||
| East | 130.1 ± 8.0 | 6.2 | 3.7 ± 0.4 | 2.9–4.0 | 3.7 ± 0.4 |
| West | 124.4 ± 10.1 | 6.2 | 3.6 ± 0.4 | 2.9–4.2 | 3.6 ± 0.4 |
| Atlantic Ocean | |||||
| Caribbean Sea | 132.3 ± 6.8 | 2.0 | 2.7 ± 0.2 | 3.7–4.4 | 4.1 ± 0.2 |
| Northwest Atlantic | 123.9 ± 5.1 | 5.5 | 3.0 ± 0.2 | 3.0–3.7 | 3.2 ± 0.2 |
Disclaimer/Publisher’s Note: The statements, opinions and data contained in all publications are solely those of the individual author(s) and contributor(s) and not of MDPI and/or the editor(s). MDPI and/or the editor(s) disclaim responsibility for any injury to people or property resulting from any ideas, methods, instructions or products referred to in the content. |
© 2023 by the authors. Licensee MDPI, Basel, Switzerland. This article is an open access article distributed under the terms and conditions of the Creative Commons Attribution (CC BY) license (https://creativecommons.org/licenses/by/4.0/).
Share and Cite
MDPI and ACS Style
Gough, B.; Prouse, A.; Dance, M.A.; Wells, R.J.D.; Rooker, J.R. Regional Variation in the Trophic Ecology of Wahoo (Acanthocybium solandri) in the Western Atlantic Ocean. Fishes 2023, 8, 519. https://doi.org/10.3390/fishes8100519
AMA Style
Gough B, Prouse A, Dance MA, Wells RJD, Rooker JR. Regional Variation in the Trophic Ecology of Wahoo (Acanthocybium solandri) in the Western Atlantic Ocean. Fishes. 2023; 8(10):519. https://doi.org/10.3390/fishes8100519
Chicago/Turabian StyleGough, Brendan, Alexandra Prouse, Michael A. Dance, R. J. David Wells, and Jay R. Rooker. 2023. "Regional Variation in the Trophic Ecology of Wahoo (Acanthocybium solandri) in the Western Atlantic Ocean" Fishes 8, no. 10: 519. https://doi.org/10.3390/fishes8100519