
Simulation Study of an Abstract Forest Ecosystem with Multi-Species under Lightning-Caused Fires


1
Big Data Academy, Guizhou University, Guiyang 550025, China
2
College of Mathematics and Statistics, Guizhou University, Guiyang 550025, China
*
Author to whom correspondence should be addressed.
Fire 2023, 6(8), 308; https://doi.org/10.3390/fire6080308
Submission received: 28 July 2023
/
Accepted: 9 August 2023
/
Published: 10 August 2023
(This article belongs to the Section Mathematical Modelling and Numerical Simulation of Combustion and Fire)
Abstract
:There is a complex interaction between lightning-caused fire behavior and the flora and fauna of the forest, which involves the influence of a large number of ecological factors. However, more comprehensive simulation studies under multi-system interactions between lightning ignition, forest fire spread, and animal behavior are not well developed. In this paper, we propose a forest ecosystem model based on the Agent-based modelling approach to explore the detailed linkages between different forms of lightning-caused fires and forest biodiversity. The model simulates the lightning ignition, fire spread, vegetation burning and recovery, and multi-species-survival dynamics. The experimental results show the sensitivity between environmental parameters and the magnitude of lightning-caused fires, and the beneficial ecological consequences of lightning-caused fires on forest ecosystems. By exploring detailed linkages between different forms of lightning-caused fires and forest biodiversity, we provide theoretical insights and reference suggestions for forest system governance and biodiversity conservation.
1. Introduction
Forest ecosystems are endowed with abundant resources and are one of the most important reserves on the Earth as the basis of biodiversity. Among various natural disturbances affecting their stability, fire emerges as the prevailing and dominant force [1]. With increasing temperatures and a drier future climate due to global warming, the potential for severe fire weather is increasing, as is the frequency and extent of fires [2]. This has several ecological consequences, including damage to critical habitats and the loss of keystone species [3]. Ultimately, they will compromise the structure and function of forest ecosystems.
Lightning strikes are the main sources of ignition that cause natural fires in forest landscapes [4]. Lightning-caused fires may occur at night or in remote areas and are often accompanied by severe weather conditions and strong winds, posing challenges for fire-fighting endeavors and resulting in extensive fire outbreaks [5,6]. For example, in August 1990, a lightning storm in Yosemite National Park ignited two fires within seconds. Although immediate actions were taken to extinguish the fires, they burned a total of 10,464 ha forests [7]. Lightning-caused fires are often accompanied by rainfall events. However, even during periods of heavy precipitation, there are instances where fires burn incessantly. A wildfire in a dead hemlock forest of Shot Beech started on 13 June 2004 and lasted for 35 days, finally being extinguished after the cumulative rainfall reached approximately 6.5 inches [8]. With the rise in climate change and frequent extreme weather, a thorough understanding of lightning-caused fires may aid in forest fire management in terms of proper resource allocation and effective fire suppression efforts.
Lightning-caused fires can be considered a product of three processes—lightning flash occurrence, fire ignitions triggered by lightning flashes, and fire spread [9]. These processes are complex and influenced by a multitude of ecological factors. Lightning flashes occur continuously during thunderstorms, and there exists a strong correlation between thunderstorm weather and lightning-caused fires [10,11]. The lightning flash density (represented as the number of flashes that occur in the unit area in unit time) is a common indicator used to describe the lightning activity and has been recorded long term in several regions [12,13,14].
The likelihood of lightning triggering a fire largely depends on the vegetation traits of the forest [1,15,16,17]. Previous studies have reported a higher probability of ignition by lightning in certain plants [18]. For example, conifers are particularly flammable due to their high resin and essential oil content [19]. Studies on the process of lightning ignition use the lightning-caused fire efficiency (represented as several fires/number of lightning flashes in the same area) as a metric for an overall consideration of the probability of ignition by lightning in a given area [17,20,21].
The spread of fire resulting from lightning strikes in a forest is influenced not only by the traits and spatial distribution of fuel sources but also by prevailing weather conditions (e.g., wind) and topographic conditions (e.g., slope) [9,22,23,24,25]. Likewise, fire extinction depends on fire behavior and various ecological factors. Heavy rainfall, wet physical environments (e.g., depressions, stream beds), and non-flammable fuel supplies have proven effective in limiting fire spread [8,26].
Previous studies on forest fire spread behavior have often used physical [27] and probability models [28] to describe fire spread. Wang (1992) used wind direction and topographic variables to calculate changes in fire state [29]. Some studies employed the WRF-SFIRE model to stimulate fire spread under complex fuel and weather conditions (see Mandel et al. (2014) [30]). In this study, the agent-based model (ABM) was adopted in the simulation of fire spread. ABM can capture individuals, the interactions among individuals, and the interactions between individuals and their environment through the behavioral rules of various types of discrete agents [31]. This enables the synthesis of factors that influence ecosystem dynamics. To achieve a realistic simulation of forest fire spread, researchers have determined an informative definition of the types of agents. Within the context of agent-based simulation, a fire is described as an agent, and its spread is characterized as the movement of the agent in the simulated environment, accompanied by changes in its attributes. Aside from fire agents, species agents [23] and fire-fighting agents [32] are also represented in the ABM model. Additionally, vegetation dynamics [33], climate [3], and human disturbances [34], which are the drivers of altered fire behavior, are also parameterized and evaluated in the model. ABMs have provided a deeper understanding of the process of fire spread in forests. However, certain complex mechanisms are still insufficiently represented or even ignored in these models, which may lead to erroneous management decisions.
Fire elicits distinct ecological responses from the abundant fauna and flora within forest ecosystems. Plants possess robust adaptive features that enable them to recover and survive in fire-prone forests [35,36]. When confronted with fire, animals may be killed directly or move to a safe place to escape the fire. There are several studies on the ecological reactions of fauna to fire [37,38,39], which point out that environmental differences in fire response can directly or indirectly affect the number of individuals and biodiversity of the fauna. It is possible, for example, for fire to affect the diversity of the arthropod community through its effects on vegetation [40]. Karsai et al. (2016, 2020) considered the dynamics of a forest animal in forest fire modeling and found that trees and animals respond differently to fire [41,42]. However, their model did not account for the differences in ecological responses to fire among multiple animal species. Moreover, variations in fire regimes can also directly influence animal movement and habitat selection [43].
Movement, as one of the essential dynamic characteristics of animals, has an impact not only on the animal itself but also on the populations and ecosystems which the animal interacts with [44]. Several empirical studies and simulations have therefore been conducted on the movement of various animals, including the causes, trajectories, and mechanisms [45,46,47,48]. The process of animal movement often triggers competitive or reproductive behavior, which is closely linked to population dynamics. ABM has been increasingly used to simulate multiple behavioral dynamics of animals, taking into account the behaviors of individuals as well as the variability of their behaviors [31]. For example, Schoon et al. (2014) adopted the ABM framework to simulate a natural system of prey-predator interactions where predation, dispersal, reproduction, and mortality events may occur at each time step with a certain probability [49]. Hidalgo et al. (2017) constructed a simple scenario and studied the competition for resources between two species in coexistence, in which the rate of species adapting to a new settlement site varied with the environment [50]. However, in the existing agent-based modeling of animal behavior and forest fire simulation, the interpretation of the attributes and behaviors of animal agents is inclusive and intentionally broad, and the description of the real environment is cursory and relatively homogeneous. Notably, environmental variability encompasses not only the changes of environmental characteristics but also the cycles of changes, such as the recovery cycles of vegetation and the frequency of lightning-caused fires, etc., which undoubtedly have a profound impact on the activities of animals. Nevertheless, the lack of more detailed studies linking environmental heterogeneity and animal behavior is one of the primary reasons for the current difficulty in integrating animal behavior modeling with forest fire modeling.
Simulation studies in three areas—lightning ignitions, forest fire spread, and animal population dynamics—have been extensively conducted. These investigations have significantly improved the understanding of these processes and provided decision support for relevant management scenarios. However, despite the progress made, there remains a dearth of comprehensive simulation studies that consider the complex and multi-scale interactions among various systems. Given the crucial role played by population dynamics of multiple animal species and lightning-caused fires in forest ecosystems, it is necessary for the analysis on the interactions to aid in better interpretation and management of forest ecosystems.
This study, therefore, proposes a simulation model to examine the impact of long-term episodic lightning-caused fires on forest ecosystem biodiversity, taking into account the presence of various animal species. The framework of ABM is adopted to portray the attributes, behaviors, and interactions of a diversity of species and lightning-caused fire agents with different regimes in the forest environment. This approach builds upon previous research regarding the traits and mechanisms of lightning occurrence, ignition, forest fire spread, and population dynamics of species. Through an analysis of the episodic lightning-caused fires on forest biodiversity measurements for 30 years, the study reveals the intricate connections between different forms of lightning-caused fires and forest biodiversity, thereby providing theoretical insights and reference suggestions for forest system governance and biodiversity conservation.
The organization of the paper is as follows: Section 2 describes the modeling approach and the model parameters; Section 3 introduces the scenario for the simulation experiments; Section 4 discusses the validation of the plausibility of the model measurements and results; Section 5 presents the results and analysis, and, finally, Section 6 comprises the discussion and concluding remarks.
2. Model
2.1. Forest Environment
The variability of a natural disturbance regime to which it is subjected can be significant if a forest covers a very wide range of climate, vegetation types, and terrains [51]. This study primarily focused on forest disturbance caused by lightning-caused fire. The simplified forest environment may reduce both the complexity of the physical problem and the number of variables that need to be considered in the model. Models with fewer variables aid in a clearer understanding of driving factors in the real world [12].
A two-dimensional grid structure was used. The forest landscape was tessellated into 250 × 250 grids to represent a forest with a geographical area of 100 km2. Each grid was set at the smallest scale whose shape was selected as a square, and was divided into two categories—vegetation grid and bare grid, according to the geographical type. It is acknowledged that grids of other shapes, such as hexagons, can accurately describe the fire pattern. However, this is at the expense of significantly increasing the computational complexity of the model [52]. The simulation was conducted in flat terrain without accounting for wind effects [53]. In general, forests exhibit a high tree canopy cover. During initialization, 90% of the forest was represented by the vegetation grids, while the remaining area consisted of bare grids. The two types of spatial grids were randomly distributed in the model. The vegetation types were not specified for the vegetation, but the fuel characteristics (contributing to fire spread) and the recovery ability (regeneration of the post-fire vegetation) that vegetation generally possesses were set. The bare grids represented certain geographic factors that hinder the spread of fire in a real forest, where there is no combustible material. The grids may also be unsuitable for species to inhabit due to the lack of survival resources. The role of bare grids was to additionally create further realistic irregular fire spread shapes [24].
2.2. Lightning-Caused Fire Agents
The model was limited to a single fire source caused by Cloud-to-ground (CG) lightning. Conventionally, the distribution of CG lightning is largely related to the local topography and seasons. In this study, the influence of topographic factors on lightning distribution was not considered since the environment of the model was at the same horizontal level ground. Current studies still lack a sophisticated understanding of the seasonal effects of lightning, although there is considerable interest in exploring it [8,14]. Therefore, the annual average lightning flash density was used as an environmental parameter in the model to avoid discussing this seasonal effect. Based on the ATDnet dataset (including 90% of CG flashes and 25% of cloud lightning flashes), Enno et al. (2020) [14] found that the annual average lightning flash density ranges from 0.5 to 3 per km−2y−1 in most of Europe. Yang et al. (2015) [54] discovered that the CG lightning flash density in most of eastern China was 0.5–2 per km−2y−1. Additionally, Koehler (2020) [55] analyzed CG lightning flash data from the U.S., revealing a density range of 0.25–4 flashes per km−2y−1. Therefore, within the simulated model, lightning strikes could occur anywhere, with an annual average lightning density ranging from 0.5–3 flashes per km−2y−1.
Moreover, in the real world, not every CG lightning strike will spark fires. The process of lightning ignition is complex, and previous studies on lightning-caused fire efficiency have required consideration of a variety of factors, including weather type, fuel state, and lightning characteristics [12,17,56]. Given the focus of this study on the impact of long-term episodic lightning-caused fires on fauna, as opposed to isolated occurrences, we only use lightning-caused fire efficiency as an environmental parameter to stimulate the CG lightning ignition. According to current studies, such as Podur et al. (2003) [20] and Read et al. (2018) [12], the efficiency values of interest are roughly between 0.01–0.07 fires/lightning flash, which is also the range value selected in this study’s model. Consequently, in the study’s lightning ignition models, the events of lightning occurrence and ignition were stochastic in space and episodic in time.
Vegetation is ignited when there are sufficient fuel and fire sources. Lightning strikes as the fire source and fuel (vegetation) jointly cause a fire [57]. However, whether and when such lightning-caused fires occur is a highly probabilistic process. This model set a certain probability of lightning occurring each year, where the location could be in any grid. If the location of the lightning was a bare grid without fuel for the fire, the lightning here would not ignite a fire. If the lightning fell on a vegetation grid with fuel—the vegetation grid had not been burned down or had recovered post-fire—the lightning here would ignite a fire with a certain probability. Each lightning-caused fire has a different combustion intensity because the fire intensity caused by lightning is different in reality in addition to the fire area [8].
The spatial behavior of the fire is a result of two coupled processes—fire persistence and fire diffusion. The process of fire persistence supports the fire remaining in a burning gird during the time and drives the fire diffusion process [53]. Each grid in the model contained parameters describing the combustion state and vegetation state at the particular location. Considering that time step t is the key effect parameter of fire spread, and the function of combustion state is a linear function that varied with its combustion time, with the equation as:
where constant is the state weight during the fire growth stage, and constant is the state weight during the fire extinguishing stage. When t = 1, the initial combustion state is a random number ranging from 0 to 1. Each vegetation grid at different time steps can be characterized by three possible states—unignited grids containing fuel, burning grids containing fuel, and burned grids without consumable fuel. In the absence of other external factors affecting vegetation burning (e.g., rainfall), insufficient heat generated by the burning process led to the depletion of fuel in a burning gird, resulting in the extinguishment of the fire. It was represented in the model by a burned vegetation state and a combustion state of 0.
Whether burning vegetation could spread the fire elsewhere depended on the available vegetation grids around it as well as its burning intensity. The Moore model was selected to define the adjacent neighbors of the central grid [58]. Therefore, one grid had eight neighbors, including four primary adjacent neighbors and four diagonal adjacent neighbors, as presented in Figure 1. If the central vegetation grid was not burning, the cumulative energy of the burning adjacent grids would determine the state of the central grid at the next moment. This study utilized a fire spread model similar to Wang’s (1992) [29] model to calculate the combustion contribution of each Moore adjacent grid to the central grid. The combustion contributions from the eight adjacent grids were then added to obtain the burning probability of the central cell at the next time step. The burning probability can be described as:
where the constant is the combustion weight; constants and are the distance weights, and ; represents the primary adjacent grid; represents the secondary adjacent grid; refers to the geographic type of the Moore neighbors, with a value of 1 representing a vegetation grid and a value of 0 representing a bare grid; is the fuel state contained in a vegetation grid and takes a value of [0, 1]; and is the combustion state ranging [0, 1].
This study does not describe the reproductive behavior of vegetation (such as seed dispersal and seedling survival), but rather its ability to regenerate following a fire, representing the resilience of the ecosystem at the vegetation level. If a fire were to occur in a vegetation grid, the species in the area would die, and the vegetation would burn. Once the vegetation is burned out, it is assumed that it will take three years to return to its pre-fire state [57,59,60]. A vegetation grid in the recovery period would have properties similar to those of a bare grid, with no more fire and no species habitat.
The lightning-caused fire is typically accompanied by heavy rainfall, affecting the moisture content of the fuel, thereby increasing the likelihood of fire self-extinguishing [15]. Although most lightning strikes occur in high rainfall areas, there are certain areas with no significant rainfall [61]. Therefore, rainfall was treated in the model as a stochastic event, which could diminish the combustion state of certain grids to reflect the existence and the uncertain nature of rainfall.
2.3. Species Agents
The analysis was restricted to a well-mixed forest system where species aggregation was not considered. The forest was considered to be inhabited by 10 species, each with its unique survival properties (birth rate, mortality, competition rate) and initial number. The behaviors of each species agent include breeding, competition, death, and movement, which were depicted by a series of rules. Each habitat grid allowed only one species agent to occupy, which could live, breed, and therein compete and move between habitat grids. Breeding, death, competition, and movement events occurred with a certain probability at each time step. All species agents of the same type were identical except their position and individual moving direction. Species agents of the same type were added to form a population, and their number changes were continuously observed. The activities of each species agent in the forest are presented in Figure 2.
Species movement represents a complex spatio-temporal phenomenon in which the interaction between behavioral patterns and processes is driven by a suite of interacting factors [47]. Here, species movement in the simulated forest was affected by interactions among fire and topography in space and time. Each species agent moved through the forest with its properties and interacted with other individuals in the environment. The species agent can sense the current status within the Moore neighbors, such as the presence of vegetation and fire, which limits its choice of movement direction. As the principal behavioral trait, the species agent avoided danger as far as possible and made choices conducive to its survival during its movements. All species agents in the model moved independently, irrespective of a consanguineous relationship (e.g., mother and cubs).
The case of species jumping was not depicted in this model, where the species agent moves over one grid in a one-time step. The unlit vegetation grids were considered the best habitat for species during movement. Specifically, if grids were burning, burned, or bare within the Moore neighborhood of the species agent, the species agent avoided these “dangerous” spaces and chose to move to a vegetation habitat (Figure 3) (e.g., a cub can perceive the harm that an intense fire will cause but does not know that it will die without resources for survival). Hence, a newborn species agent would not move to a grid that was burning or burned but may move to a bare grid, resulting in its death.
A species agent “knows” its states and can also interact with other species agents, but it leads to conflict that comes from the competition for the same living space [41]. To elaborate, a species agent can perceive whether another species agent wants to occupy its “habitat” at the next time step, potentially causing a competitive event. The competitive events in this study refer to the interspecies competition, which can only occur when the “resident” species agent and the “migrating” species agent are of different types. They were compared based on the size of their competition rate, the winner occupying the grid upon the death of the loser. If the resident species agent was of the same type as the migrating species agent, no change would be observed at the next time step. The competition rate can be described as:
where represents the species category and takes integer values from [1–10], i.e., a total of 10 species, and where constant is a competition factor. Then, Species 10 (i.e., ) is the most competitive and Species 1 (i.e., ) is the least competitive.
Breeding in the model was considered asexual [41] and depended on the reproductive level of the species. With a certain probability at each time step, a species agent would breed an “offspring” by its birth rate, having the same survival properties (birth rate, mortality rate, competition rate) as its “mother” and would randomly choose its direction of movement after birth. Since the reproductive capacity of biological populations was considered in excess, the population would grow exponentially if there was no competition between individuals and it was not limited by environmental resources [62]. The initial numbers and birth rate are, therefore, both exponential functions. The equations for them, respectively, are:
where constant is the total number of species in the environment at initialization; constant is the proportion of grids with species at initialization; and constant is the reproductive weight.
However, in the real situation, the population size does not grow indefinitely [63]. This restrictiveness is regulated in the model by the mortality rate. In addition to competitive failure and fire damage, species mortality events occur with a varying probability at each time step. The equations for mortality rate are:
where the constant is used to regulate the initial mortality of each species, constant is used to regulate the change in mortality of each species, and is the number of the species at the time step .
3. Simulation Experiments
The study carried out computer simulations of the agent-based model. The model was coded using C++ in Visual Studio 2019, which is considered a mature and flexible programming platform with a high number of users and favorable development support. Seven scenarios were simulated, combining different lightning densities and lightning- caused fire efficiencies. To ensure the unbiased spreading of agents in the context of the model and to reduce the possibility of results being driven by the stochasticity of the model, parallel experiments were conducted for each scenario using 30 different random seeds, and their average results were considered for the analysis (except for Scenario 6 where results from only one random seed were considered). Experiments for each scenario were run for 30 years, i.e., 30,000-time steps (except for Scenario 6, whose experiment was run for 120 years). Fire area and species information were outputs that captured the variation in fire and species at the end of each year.
This study focuses on how different lightning-caused fire regimes impact forest ecosystems. Changes in two environmental parameters, namely lightning density and lightning-caused fire efficiency, correspond to alterations of the combustion scenario. The study adopts the control variable method, changing one environmental parameter at a scenario within a selected range of parameters. The specific parameters are presented in Table 1. In the simulation, the values of all constants are listed in Table 2.
There was no fire occurrence observed in Scenario 0, which served as a control to show the changes in forest ecological diversity due to lightning-caused fires. Scenarios 1–3 were designed to compare the combustion of lightning-caused fires between scenarios with different lightning susceptibilities under equal flammability conditions. Similarly, Scenarios 4 and 5 (with Scenario 2) were designed to compare the combustion of lightning-caused fires between scenarios with different flammability under equal lightning susceptibility conditions. Scenario 6, on the other hand, had the highest lightning susceptibility and the highest flammability to check whether the previous findings still stand in this relatively extreme lightning-caused fire scenario and whether certain special phenomena emerge.
The mean of species abundance [64] and the Gini diversity [64] are used as the species diversity indices to demonstrate changes in species, using the formula as follows:
where the Gini diversity (Gini_Diversity) measures the uniformity in the distribution of species population in a forest environment and where the mean of species abundance (Abundance_Mean) varies depending on population size fluctuations.
4. Model Validation
The plausibility of the model results was validated. Since the model contained two sub-models with empirical findings, these sub-models were validated separately based on their findings. The effects of reproduction, competition, death, and movement events of species in the model were ultimately reflected in the population size. The theoretical verification of the validity of the species agents was therefore carried out by taking into account the changes in the population size of each species during the simulation. The scenarios were simulated without fire interference for thirty random numbers, and the average population size of each species was calculated. The resulting average number of each species is presented in Figure 4. The graph indicates that the population fluctuations of all the 10 species followed a stable distribution during the simulation. Lan et al. (2011) have previously justified the fluctuation in population size [65]. Based on the theory of biological equilibrium [66], the phenomenon of the fluctuation in population size suggests that natural organisms are in dynamic equilibrium in the ecosystem, indicating that the species agents in the model reach a natural biological equilibrium. Thus, based on the experimental results, it may be concluded that the model is a reasonable simulation of the animals.
The reasonableness of the fire agents was then verified. In the lightning initiation phase, the model directly used lightning parameters from previous empirical studies [12,14,54,55]. Based on lightning density and lightning ignition efficiency, fires can potentially occur across the entire landscape. Once a fire was ignited, it follows a course of propagation and extinguishment according to the specified settings in the model. For the fire spread phase, the spread of lightning-caused fires in the forest environment was presented (Figure 5). It was observed that the shape of the combustion area caused by lightning-caused fire spread was similar to elliptical, and the spreading boundary was irregular. Green et al. (1983) have demonstrated an elliptical or bielliptic fire shape in a similar forest environment [24]. The fire shape is also similar to the burned area in Ramos-Neto and Pivello (2000) [67]. Therefore, from the perspective of the fire shape, the model fits the real process of forest fire spread.
For the lightning, the study used different levels of average annual lightning density and lightning-caused fire efficiency in the model to represent lightning susceptibility as proxies. When simulating the occurrence of lightning in the forest, the values of lightning-caused fire efficiency were randomly selected from the range of 0.03–0.05. The lightning densities were made to obey uniform distributions as U(0,1), U(0,2) and U(0,3), corresponding to forest environments with low, medium, and high lightning susceptibility, respectively. The environmental parameters of these three scenarios were contrasted, as presented in Figure 6a. The graph indicates that the three scenarios were perennially at the medium level of lightning-caused fire efficiency and that occasional “anomalous” environmental parameters reflected the presence of unexpected discrete events during lightning occurrences. The mean values of lightning density for the three scenarios (0.5 per km−2 yr−1, 1 per km−2 yr−1, and 1.5 per km−2 yr−1) were also in the valid range.
When simulating the occurrence of lightning in the forest, the mean of lightning density was made to obey uniform distributions as U(0,2), and the values of lightning-caused fire efficiency were selected from the range of 0.01–0.03, 0.03–0.05, and 0.05–0.07, respectively, corresponding to non-flammable, moderately flammable, and flammable forest environments. As can be seen in Figure 6b, the measures are within the valid range in these three scenarios. Meanwhile, there were certain outliers, reflecting the other stochastic factors of lightning-caused fire events.
Although lightning was not considered as an agent, the reasonableness of the lightning parameters was last verified. As our focus is on examining the effects of long-term intermittent lightning-caused fires on fauna, we use long-term lightning data for model verification. Taking Scenario 2 as an example, the average number of CG lightning flashes and fires were presented in Figure 7a. The fluctuating trend observed in the average number of CG lightning flashes aligned with the lightning density identified in Granström (1993) [68], which was found based on the distribution of lightning-caused fire ignition data from Sweden over the years 1944–1976. Moreover, the average number of fires exhibited lower volatility within a narrow range due to multiple random experiments that smooth the trend. Particularly, we present the number of fires in the first seed experiment in Figure 7b. It showed a high occurrence of lightning-caused fires during specific critical periods, consistent with findings of Wotton and Martell (2005) [69] and Wierzchowski et al. (2002) [70]. Overall, long-term lightning simulation in the model is deemed acceptable.
5. Simulation Results
5.1. Insights into the Effect of Lightning-Caused Fires on the Forest Ecosystem under Different Lightning Flash Densities
5.1.1. Burned Area
The ignition and spread of lightning-caused fires were simulated in forest environments with low, medium, and high lightning susceptibility, respectively. There are several realistic factors in a true forest, such as elevation and climate, which have an impact on the lightning susceptibility of the forest. Here, the analysis focused on the impact of the lightning density parameter on lightning-caused fires and forest ecosystems.
The study first explored the combustion situation of the three scenarios. Figure 8a–c reveals the annual lightning-caused fire behaviors of these scenarios. Despite the different lightning densities, there were insignificant disparities in the annual burned area. However, Figure 8d clearly illustrated a positive correlation between the lightning density and the cumulative burned area.
5.1.2. Species Diversity
A dynamic simulation of the forest system was conducted in the absence of lightning-caused fires as a control experiment. When there was no lightning-caused fire, both Abundance_Mean and Gini_Diversity demonstrated a horizontal trend (Figure 9). Therefore, the forest ecosystem may be maintained in a stable state without lightning-caused fire disturbances.
Firstly, the change in the indicator of Abundance_Mean was analyzed. The cumulative burned area of lightning-caused fires in the forest with low lightning density reached 25% of the entire simulated forest area over the 30-year simulation period, with an overall decrease in Abundance_Mean compared to Scenario 0 without lightning-caused fires (Figure 10a). In the high lightning density forest, where the cumulative burned area at the end of the simulation time was approximately 70%, the curve of Abundance_Mean was significantly different from the control curve with a larger discrepancy (Figure 10c). Abundance_Mean also showed a fluctuating change over a prolonged period throughout the simulation. Since the value of Abundance_Mean reflected the population size in the forest ecosystem, the trend in Abundance_Mean indicated a decline in the number of species in the simulated forest. The findings suggested a positive association between the lightning density and the extent of burned area caused by lightning-caused fires. Consequently, there was a heightened risk of reduced species diversity resulting from fire damage. Nonetheless, this decreasing trend of species population did not persist for a long time. Although the forest was subjected to varying degrees of lightning strikes each year, the number of species in the forest may not fluctuate too much from an overall perspective due to the continued recovery and reproduction of vegetation and species in the forest.
Secondly, the Gini_Diversity of the forest was analyzed. In the forest with low lightning density, the change curve of Gini_Diversity was slightly different from that of the non-lightning-caused fire forest during partial simulation years (Figure 10d). The gap between the two curves became more pronounced as the lightning density increased (Figure 10e,f). Moreover, it was observed that lightning-caused fires seem to have led to the increase in Gini_Diversity. The numerical variation in Gini_Diversity was largely influenced by the species with high initial individual numbers. The changes in Gini_Diversity thus illustrated that the species with high initial numbers were lessened further by lightning-caused fires as compared to species with low initial numbers, which shortened the quantity gap between species and thereby increased the value of Gini_Diversity. However, the overall trend of changes in Gini_Diversity remained horizontal, suggesting that, even in forests with high lightning density, lightning-caused fires could have a limited impact on species diversity in forest ecosystems.
Combining the values of Gini_Diversity and Abundance_Mean in the four types of forests, it was clear that forests with higher lightning density were likely to suffer more lightning-caused fire damage. While lightning-caused fires led to a reduction in species populations, the primary reduction appeared in species with large initial individual numbers, which also reduced the disparity in the number of each species in the forest. Considering species that are subject to larger population decreases originally have a high reproductive capacity, lightning-caused fires do not lead to large fluctuations in forest ecosystems in the long run. In the case of natural forest fires caused by lightning, the forest ecosystem is capable of self-recovery.
5.2. Insights into the Effect of Lightning-Caused Fires on the Forest Ecosystem under Different Lightning-Caused Fire Efficiencies
5.2.1. Burned Area
Three different scenarios were simulated for the occurrence and spread of lightning-caused fires in non-flammable forests, moderately flammable forests, and flammable forests, where lightning-caused fire efficiency represents the flammability of vegetation in the forest environment. There are various influencing factors of lightning-caused fire efficiency, such as weather conditions and vegetation type, among which the moisture of fuel in the forest is important for fire ignition. Although the setting of the simulated forest environment was relatively unitary, the difference in the flammability of the forest can also be reflected by the indicator of lightning-caused fire efficiency. A higher value of lightning-caused fire efficiency means that a lightning occurrence in the simulated forest is more likely to ignite a fire.
Whether from the annual burned area or the cumulative burned area, scenarios with different lightning-caused fire efficiencies experienced significantly different levels of fire damage. Among these three scenarios (Figure 11a–c), Scenario 5 had the largest lightning-caused fire efficiency value, and its annual burned area was generally larger than that of the other two scenarios, indicating that the fires occurring in Scenario 5 were more intense. While it remains possible for intense lightning-caused fires to occur in Scenario 4 with the minimal lightning-caused fire efficiency value, their likelihood was considerably reduced. In terms of the cumulative burned area (Figure 11d), overall, lightning-caused fire efficiency was positively proportional to the cumulative fire damage area of the forest.
5.2.2. Species Diversity
Scenario 0 was used as the control group. In the simulated forest with low flammability, the cumulative burned area by lightning-caused fires over 30 years covered approximately 25% of the entire forest area, with the overall numerical level of Abundance_Mean being roughly the same as in the case of no lightning-caused fire (Figure 12a). However, the Abundance_Mean decreased significantly in flammable forests whose cumulative burned area was about 75% compared to the control group (Figure 12c). An inverse correlation between the magnitude of lightning-caused fire damage and the number of species can therefore be concluded.
The Gini_Diversity of the non-flammable forest scenario was similar to that in the case of no lightning-caused fire disturbance (Figure 12d). The value of Gini_Diversity in flammable forests became apparently different from that of the control group (Figure 12f). Given the indicator characteristics of Gini_Diversity, it was thus possible to show that lightning-caused fires in more flammable forests are more detrimental to species with a high initial number of individuals. Nevertheless, the Gini_Diversity demonstrated an overall trend of horizontal variation, which indicated that the lightning-caused fires do not largely lead to an ecological imbalance in the forest, even in inflammable simulated forests.
From the above analysis, it can be seen that a fire that burns vigorously has a high probability of shrinking the number of species living in the forest. The degree of damage varies among species, but species that have large numbers of primitive individuals are more likely to be decimated by fire. However, the reduction of the species population is not a continuous phenomenon. Due to the systemic regulation capacity of the forest system, these indicators also show roughly fluctuating and oscillating trends.
5.3. Insights into the Overall Impact of Lightning-Caused Fires on the Forest Ecosystem
To investigate how lightning-caused fires affect forest ecosystems, the above six scenarios were simulated with different combinations of parameters for lightning density and lightning-caused fire efficiency. By analyzing these scenarios, it was found that the results obtained from lightning-caused fires in forests with different lightning densities were essentially the same as those obtained from lightning-caused fires in forests with different lightning-caused fire efficiencies. The similarity may be because higher environmental parameters (lightning density or lightning-caused fire efficiency) are more likely to trigger severe forest fires and make the forest ecosystem more vulnerable. The primary impact of lightning-caused fires on forests is the reduction in the species population, especially those with a high number of initial individuals, which leads to changes in the structure of the species population in the forest. Overall, there is a high probability that lightning-caused fires that occur and spread under either different lightning densities or different lightning-caused fire efficiency scenarios will not prevent forest ecosystems from self-regulating back to stable levels.
The mechanism of lightning-caused fires of mild severity that may affect forest ecosystems was then explored. Both Figure 9 and Figure 12 show that when the severity of lightning-caused fires in the forest was low, the indicators tended to remain at a normal individual population level. Meanwhile, in the analysis conducted in Section 5.1 and Section 5.2, a significant difference in species diversity indicators was observed between other forests that were more likely to have high-severity lightning-caused fires (Scenario 3 and Scenario 5) and forest without fire (Scenario 0), while the forest with low lightning density (Scenario 1), the low flammability forest (Scenario 4), and the forest without fire did not differ much in species diversity indicators. For this reason, there was no visible impact of natural disturbances, such as slight lightning-caused fires, on forest ecosystems.
Another phenomenon that was observed was the probability of lightning-caused fires of high severity leading to steep declines in overall species populations in the simulated forests. It may be hypothesized that an extreme scenario where the forest is subjected to annual heavy lightning-caused fires would inevitably result in such catastrophic consequences as forest ecological imbalance. Lightning-caused fires, nonetheless, do not readily cause forest ecological imbalances. One plausible explanation may be the episodic characteristic of lightning-caused fires (i.e., large lightning-caused fires do not occur continuously for prolonged periods). The presence of light lightning-caused fires gives the forest respite. The species and the vegetation can recuperate and repair the damage caused by large lightning-caused fires that have occurred previously, facilitating the recovery of the forest ecosystem.
When the simulation was extended to 120 years, it was likewise found that the forests’ resilience was also long-lasting under long-term natural disturbances such as lightning-caused fires. A separate experiment was conducted to see how the lightning-prone and fire-prone forests (Scenario 6) would change over a prolonged period of time, such as 120 years. The results, as presented in Figure 13, show that after 120 years of simulation time, the cumulative burned area of lightning-caused fires was equivalent to quadruple the entire forest area. During the simulation period, the Abundance_Mean and Gini_Diversity showed limited amplitude, with no significant increase or decrease in the overall trend. When both lightning-caused fire efficiency and lightning density were at the maximum of the selected ranges, it took at least several decades for lightning-caused fires to do much cumulative damage, but, as a whole, they had no significant impact on the species diversity in forest ecosystems. In natural forest ecosystems, the continuous reproduction of vegetation and species made it possible for natural wildfires caused by lightning to not easily inflict irreparable damage to the forest ecosystem, where there was a long-term trend in forest homeostasis.
5.4. Local Insight into the Influence of Lightning-Caused Fires on Ecological Diversity
To further explore the impact of lightning-caused fires on the forest ecological system, the changes in the simulated forest were separately analyzed during these six years between the 95th and 101st years. As presented in Figure 14, a violent fire had occurred in the 98th year, and the fire damage covered approximately 4% of the entire forest area. The Abundance_Mean values of the forest ecosystem decreased significantly in this year, indicating a drastic drop in the number of species. The values of Gini_Diversity increased slightly in the 98th year, demonstrating a relatively homogeneous population structure of the species.
The changes in the distribution of the species populations over these six years were then considered in the study. The ten species in the model were divided into three categories according to their initial population levels (see Table 3). At the initialization of the simulated environment, the number of Class A species (including species 1–3) accounted for 87.6%, Class B species (including species 4–6) accounted for 11%, and the rest were Class C species (including species 7–10). A notable decrease was observed in the number of Class A and C species in years 96 and 98, when serious lightning-caused fires occurred in the extensive burned area (Figure 15). Given the substantial disparity between the extent of lightning-caused fires that occurred in the two years (years 96 and 98) and previous years, it may be assumed that the dramatic reduction in the number of species that occurred in these two years was largely due to the heavy lightning-caused fire injuries during the year.
As Class A species have a high reproductive capacity and make up the majority of individuals in the simulated forest, extinction is unlikely for such species, even if intense lightning-caused fires occur in the forest that these species inhabit. However, the number of Class A species has an absolute influence on the overall species population level. Combining the magnitude of lightning-caused fires with changes in the populations of Class A species, it may be speculated that intense lightning-caused fires in the forests may lead to a reduction in the population level of species for a limited period. In addition, the low number of individuals of Class C species has a slight impact on the overall species population level, thus rendering them more vulnerable to strong lightning-caused fire attacks and more likely to suffer adverse consequences such as extinction. As a result, it may be deduced that lightning-caused fires may cause a decline in the species diversity in forest ecosystems for a short period when forests are subjected to serious lightning-caused fire damage.
In contrast to the overall declining population trend observed in Class A and C species, the number of Class B species showed a particular variation. As presented in Figure 16, the population of Class B species showed a sudden increase in the 96th and 98th years of the high intensity lightning-caused fires. Since the number of Class B species was not abundant (about 15% of all species), it had an insignificant influence on the overall species population and species diversity. However, Class B species showed a tendency to increase when there were heavy lightning-caused fires in the forest. Thus, Class B species appeared to be the ones adapted to the naturally occurring lightning-caused fire environment, and its population instead increased. In certain situations, fire may have increased the food for Class B species in the environment (e.g., feeding on charred animals) or reduced the number of species competing with Class B species for the same survival resources, all of which could cause an increase in the number of individuals of Class B species.
6. Discussion and Conclusions
To explore the detailed linkages between different forms of lightning-caused fires and forest biodiversity, a simple forest ecosystem model was constructed following the agent-based modeling approach, where the lightning initiation and ignition, the spread of forest fires, and the survival dynamics of multi-species were simulated. The model constituted a generic framework in which the variability of the environment of lightning occurrence was mapped into the different parameters of the environmental variables. A total of seven scenarios were simulated, combining different lightning densities and different lightning-caused fire efficiencies. The forest dynamics in this model were a multi-stage process incorporating lightning ignition, fire spread, vegetation dynamics (burning and recovery), and animal dynamics (movement, competition, reproduction, mortality). We validated the plausibility of the model’s animal and fire spread simulations to ensure the validity of the results. By simplifying the complex constituents of the forest ecosystem through some assumptions and definitions, albeit a relatively crude model, its behavioral results bore a strong resemblance to known patterns of forest dynamics.
Firstly, long-term epidemic lightning-caused fires can be viewed as neutral disturbances which are an integral part of ecological systems. This means these fires are not entirely harmful to forest ecology. On the one hand, the results of the simulations clearly presented that the decline in species numbers was directly related to the rise in the fire. The magnitude of the reduction depended on the intensity of the fire, with the number of species steadily decreasing in severe fire scenarios. However, this phenomenon of species population decline was not continuous over the long run. Due to the persistent reproduction of species in the forest system, the number of species showed roughly fluctuating and oscillating trends. On the other hand, as shown by the Gini diversity for each scenario, species diversity increased when a fire occurred in the forest. Such results have been verified in reality. In the Sierra Nevada, the mixed-conifer forests subjected to fire have demonstrated slightly increased arthropod diversity by favoring previously rare species, despite a decrease in the number of common species [71]. Further, the beneficial ecological consequences of fire were not limited to the increase in species diversity. As discussed in Section 5.3, lightning-caused fires were always present, but not all lightning ignitions triggered large fires. Mild lightning-caused fires had no significant impact on forest ecosystems. Therefore, it can be considered that minor lightning-caused fires offer some respite for forests, facilitating their recovery. Additionally, irrespective of the fire scenario, there is a high probability that lightning-caused fires will not prevent forest ecosystems from self-regulating back to stable levels in the long term, even when such fires occur frequently and with high intensity. This demonstrates that forest homeostasis is sustained over extended periods.
Fire is well known to be an intrinsic natural process in many ecosystems [72]. The resilience of forest ecosystems comes into function when they are damaged or even unbalanced. Typically, ecosystem resilience is viewed by ecologists as the maintenance of native species, communities, ecosystem processes, and disturbance regimes at certain ranges [3]. Natural disturbances, such as lightning-caused fires, are recognized as “near-natural” ecosystem management, and it is considered that ecosystems and their components tend to be resilient to disturbances that closely resemble natural dynamics [73]. Therefore, lightning-caused fires can be regarded as an inherent component of the forest ecosystem, demonstrating its resilience against these natural disturbances and its ability to sustain homeostasis over time. In terms of such a fire-forest relationship, it has been verified through simulation results of various scenarios that lightning-caused fires seldom lead to the imbalance of forest ecosystems. In fact, minor lightning-caused fires can actually contribute to the ecological recovery of forests. The recovery of the forest, however, depends not only on the intensity of a natural disturbance, such as a lightning-caused fire and the time interval between the occurrence of that disturbance event, but also on the characteristics of the plants [51]. Meanwhile, the characteristics of the plants affect the recovery cycle of the forest as well as the frequency or intensity of disturbance [1]. Thus, the effects of lightning-caused fires and vegetation types may be mutually reinforcing in forest restoration. This knowledge gap has a ripple effect on how forest ecosystems are viewed and managed.
Secondly, it revealed that not all species experienced equal levels of fire damage, highlighting the presence of species that have developed adaptations to withstand and thrive in fire-prone environments. On the one hand, the results showed that in lightning-prone and flammable fire scenarios (Scenario 6), species with a high number of primitive individuals (Class A) and species with a low number of primitive individuals (Class C) tended to show a decreasing trend when exposed to intense fires. When the fire scale was small, there was a consistent increase in their population. The results are similar to Chesson’s storage effect, which is a by-product of different responses to the environment based on the abundance of species [74]. Intuitively, it means that under unfavorable conditions, species with numerous individuals are highly destroyed, while when the environment becomes favorable, small populations suffer less damage and grow rapidly. In the model setting, severe fires were equivalent to the unfavorable conditions in Chesson’s storage effect, and in this case, as stated earlier, species with many individuals suffer more damage, yet not extinction. Such species are widely distributed in the forest, with many individuals being killed naturally when fires spread. However, due to the strong reproductive capacity of these species, their population does not continuously decrease. The favorable environment can be analogous to a no-fire or small-fire scenario. In this case, the number of small populations presents an increasing trend, which is the same as Chesson’s storage effect [74]. Small populations are more likely to be extinct when faced with intense fire attacks, but also because of the small numbers of individuals, such species suffer less fire damage when exposed to mild fires, and therefore have a better chance to recuperate.
On the other hand, in the lightning-prone and flammable fire scenario (Scenario 6), some populations (Class B) had increased numbers of individuals instead, which means that they were adapted to the fire-prone environment. The results are in general agreement with that of Pausas and Parr (2018) [72], who suggest that several animals benefit from a diversity of new habits generated by frequent fires. In some situations, they are adapted to the biomes of the habitat and require fire to create suitable conditions for their survival. Pausas and Parr (2018) [72] did not reveal whether these animals have the adaptive ability to survive or avoid fire. The population decreases when lightning-caused fires are frequent, except for Class B. Therefore, it can be deduced that the environment is favorable for Class B because of the lesser competitive pressure and more resources for survival, causing the number to naturally increase. Apart from variations at the quantitative level, the model was unable to characterize or further investigate the detailed behavioral traits of animals on fire adaptation, but it was possible to speculate on fire-animal relationships based on the results.
Finally, the lightning density and the lightning-caused fire efficiency are expected to be substitutes in terms of the size of fires. The study was restricted to ignition points caused by lightning, and different scenarios of lightning-caused fires were generated by two environmental parameters—lightning density and lightning-caused fire efficiency. By comparing the combustion situation of different scenarios, it was observed that higher lightning density or lightning-caused fire efficiency led to an increased probability of large-scale fires in the forest. Although the lightning-caused fires in the model occurred on the windless and single vegetation type, these environmental parameters were used to represent the influence on lightning-caused fire behavior caused by topographic factors and vegetation factors. Lightning density can reflect the lightning susceptibility influenced by topographic factors, and, similarly, lightning-caused fire efficiency can reflect the flammability affected by vegetation factors. Therefore, the flammability of vegetation appeared to influence the magnitude of lightning-caused fires similar to topographic factors.
Additionally, it was also found that the disturbance of lightning-caused fires reduces the vegetation cover of the forest and is positively proportional to the largeness of the burnt area in the forest. There were also rainfall events in the model that impeded the occurrence and spread of fires. Nevertheless, in the absence of any other fire suppression measures, it can be deduced that lightning strikes commonly cause fires and may result in large areas of burned vegetation. The size and intensity of fires vary with the meteorological conditions, including wind speed, temperature, solar radiation, and so on [75,76]. With the current rapidly changing global environment, it is vital to develop our understanding of forest fire events.
Fire behavior depends on a variety of natural factors, including weather, topography, and fuel type. A combination of weather factors, such as high temperatures, prolonged drought, and strong winds, are the most common determinants of fire growth [77]. Topographic variables, including slope and elevation, are also key factors in determining lightning activity and fire intensity [78,79]. For example, lightning strikes are more frequent at higher elevations [80]. Furthermore, the flammability of fuels has a direct correlation not only to fire initiation but also fire spread [81]. Large-scale landscape fragmentation caused by anthropogenic disruptions of fuel continuity, such as logging and road building, can also create boundaries that allow fires to naturally extinguish. These boundaries combined with heavy precipitation and wet geography have proven to be effective in impeding fire growth [26]. Continuing to study fire behavior in terms of these natural factors will deepen the existing knowledge of the role of fire in forests.
The Agent-Based framework employed in this study has certain limitations stemming from several simplifying assumptions made regarding lightning, fire agents, and species agents. For example, the description of individual lightning fire events and their ecological impacts was not adequately addressed. Some studies, such as Couto et al. [61] and Dowdy et al. [82], present the characterization of meteorological environment and cloud microphysics of forest fire events with empirical modelling and simulation. As our focus is on understanding the effects of long-term intermittent lightning-caused fires on multi-species survival, our model primarily relies on lightning density and lightning- caused fire efficiency, incorporating randomness to simplify fire generation. This framework is suitable for theoretical analysis but difficult to apply to empirical estimation. Future research could consider incorporating simulation studies that explore the process of lightning ignition leading to fire, although this would necessitate a more comprehensive discussion of additional parameters related to lightning-caused fires.
Further research is necessary to unravel the adaptability of animals to fire. It is important to understand how forest and fire interact to influence species survival dynamics and how this coupling is represented on the simulation model before emulating ecological processes in a real forest. When encountered with fire, animal behavior is not limited to fleeing the fire; some animals significantly change their diet and behavior [83]. Karsai et al. (2020) demonstrated that animals and trees respond differently to different types of fire [42]. They found that frequent small fires were more destructive to animals than to trees, while the opposite was true for infrequent large fires. However, their model also contains a crude representation of reality, with only one type of tree and one type of animal model. The diversity of species is therefore not taken into consideration. Currently, there is limited research on the detailed behavioral traits of animals in the framework of fire, but these may disentangle the underlying causes of animal adaptation to the fire environment. This lack of knowledge also limits the ability to apply computer simulations for adequate exploration. Existing studies on animal behavior often make simple but strong model assumptions about animals based on their behavioral characteristics and levels of competence. For example, based on the frequency of population reproduction, Huertos (2020) assumed in his study an exponential increase in population size over time and set different orders of magnitude of fecundity depending on the age and size of the species [62]. This study is no exception. While this study takes into account the existence of multiple animals and distinguishes the behavior of different species, there is inevitably a rough representation of animal movement, competition, reproduction, and death, even overlooking many animal attributes and behaviors, such as animal age, sex, and predation behavior. Although difficult to believe that realistic ecosystems meet these settings, this study provides an analytical perspective on various results of population dynamics and biodiversity in terms of animal behavior and has provided a detailed understanding of the complex dynamics of forest ecosystems based on the findings.
Therefore, various factors need to be added to the model in this paper for further research, such as setting diverse topography and vegetation, considering the influence of weather on lightning-caused fire behavior and describing the behavioral dynamics of animals in more detail. Retaining more essential details and realities of real forests in the model can furnish evidence for analyzing the effects of lightning-caused fires on biodiversity mechanisms. This may uncover or validate the beneficial aspects of lightning-caused fires on forest ecology, which is the key to better managing forest ecosystems.
Author Contributions
Conceptualization, N.D.; methodology, N.D. and Z.O.; software, S.W.; validation, S.W. and N.D.; formal analysis, Z.O. and S.W.; investigation, S.W. and N.D.; resources, Z.O.; data curation, N.D.; writing—original draft preparation, Z.O. and S.W.; writing—review and editing, Z.O.; visualization, S.W.; supervision, Z.O.; project administration, Z.O.; funding acquisition, Z.O. All authors have read and agreed to the published version of the manuscript.
Funding
This research was funded by National Natural Science Foundation of China (No. 72261004) and Cultivation Project of Guizhou University (No. [2020]-41).
Institutional Review Board Statement
Not applicable.
Informed Consent Statement
Not applicable.
Data Availability Statement
The datasets used and analyzed are generated by simulation experiments. They are available from the corresponding author on reasonable request.
Conflicts of Interest
The authors declare no conflict of interest.
References
- Fahey, T.J. Forest Ecology. In Encyclopedia of Biodiversity; Elsevier Inc.: Amsterdam, The Netherlands, 2013; pp. 528–536. [Google Scholar]
- Oris, F.; Asselin, H.; Ali, A.A.; Finsinger, W.; Bergeron, Y. Effect of increased fire activity on global warming in the boreal forest. Environ. Rev. 2014, 22, 206–219. [Google Scholar] [CrossRef] [Green Version]
- Spies, T.A.; White, E.M.; Kline, J.D.; Fischer, A.P.; Ager, A.; Bailey, J.; Bolte, J.; Koch, J.; Platt, E.; Olsen, C.S. Examining fire-prone forest landscapes as coupled human and natural systems. Ecol. Soc. 2014, 19, 3. [Google Scholar] [CrossRef] [Green Version]
- Ganteaume, A.; Syphard, A.D. Ignition Sources. In Encyclopedia of Wildfires and Wildland-Urban Interface (WUI) Fires; Springer: Berlin/Heidelberg, Germany, 2018. [Google Scholar]
- Flannigan, M.D.; Wotton, B.M. Lightning-ignited forest fires in northwestern Ontario. Can. J. For. Res. 1991, 21, 277–287. [Google Scholar] [CrossRef]
- Stocks, B.J.; Mason, J.A.; Todd, J.B.; Bosch, E.M.; Wotton, B.M.; Amiro, B.D.; Flannigan, M.D.; Hirsch, K.G.; Logan, K.A.; Martell, D.L. Large forest fires in Canada, 1959–1997. J. Geophys. Res. Atmos. 2002, 107, 5. [Google Scholar] [CrossRef]
- Van Wagtendonk, J.W. The history and evolution of wildland fire use. Fire Ecol. 2007, 3, 3–17. [Google Scholar] [CrossRef]
- Cohen, D.; Dellinger, B.; Klein, R.; Buchanan, B. Patterns in lightning-caused fires at Great Smoky Mountains National Park. Fire Ecol. 2007, 3, 68–82. [Google Scholar] [CrossRef]
- Anderson, K. A model to predict lightning-caused fire occurrences. Int. J. Wildland Fire 2002, 11, 163–172. [Google Scholar] [CrossRef]
- Soler, A.; Pineda, N.; San Segundo, H.; Bech, J.; Montanyà, J. Characterisation of thunderstorms that caused lightning-ignited wildfires. Int. J. Wildland Fire 2021, 30, 954–970. [Google Scholar] [CrossRef]
- Pineda, N.; Altube, P.; Alcasena, F.J.; Casellas, E.; San Segundo, H.; Montanyà, J. Characterising the holdover phase of lightning-ignited wildfires in Catalonia. Agric. For. Meteorol. 2022, 324, 109–111. [Google Scholar] [CrossRef]
- Read, N.; Duff, T.J.; Taylor, P.G. A lightning-caused wildfire ignition forecasting model for operational use. Agric. For. Meteorol. 2018, 253, 233–246. [Google Scholar] [CrossRef]
- Dissing, D.; Verbyla, D.L. Spatial patterns of lightning strikes in interior Alaska and their relations to elevation and vegetation. Can. J. For. Res. 2003, 33, 770–782. [Google Scholar] [CrossRef]
- Enno, S.; Sugier, J.; Alber, R.; Seltzer, M. Lightning flash density in Europe based on 10 years of ATDnet data. Atmos. Res. 2020, 235, 104769. [Google Scholar] [CrossRef]
- Pineda, N.; Rigo, T. The rainfall factor in lightning-ignited wildfires in Catalonia. Agric. For. Meteorol. 2017, 239, 249–263. [Google Scholar] [CrossRef]
- Duff, T.J.; Keane, R.E.; Penman, T.D.; Tolhurst, K.G. Revisiting wildland fire fuel quantification methods: The challenge of understanding a dynamic, biotic entity. Forest 2017, 8, 351. [Google Scholar]
- Johnson, E.A.; Miyanishi, K. Forest Fires: Behavior and Ecological Effects; Academic Press: San Diego, CA, USA, 2001. [Google Scholar]
- Latham, D.; Williams, E. Lightning and Forest Fires; Elsevier: Amsterdam, The Netherlands, 2001; pp. 375–418. [Google Scholar]
- Núñez-Regueira, L.; Rodríguez-Añón, J.A.; Proupín-Castiñeiras, J. Design of risk index maps as a tool to prevent forest fires in the humid Atlantic zone of Galicia (NW Spain). Thermochim. Acta 2000, 349, 103–119. [Google Scholar] [CrossRef]
- Podur, J.; Martell, D.L.; Csillag, F. Spatial patterns of lightning-caused forest fires in Ontario, 1976–1998. Ecol. Model. 2003, 164, 1–20. [Google Scholar] [CrossRef]
- Pineda, N.; Montanyà, J.; Van der Velde, O.A. Characteristics of lightning related to wildfire ignitions in Catalonia. Atmos. Res. 2014, 135, 380–387. [Google Scholar] [CrossRef]
- Seidl, R.; Fernandes, P.M.; Fonseca, T.F.; Gillet, F.; Jönsson, A.M.; Merganičová, K.; Netherer, S.; Arpaci, A.; Bontemps, J.; Bugmann, H. Modelling natural disturbances in forest ecosystems: A review. Ecol. Model. 2011, 222, 903–924. [Google Scholar]
- Hulse, D.; Branscomb, A.; Enright, C.; Johnson, B.; Evers, C.; Bolte, J.; Ager, A. Anticipating surprise: Using agent-based alternative futures simulation modeling to identify and map surprising fires in the Willamette Valley, Oregon USA. Landsc. Urban Plann. 2016, 156, 26–43. [Google Scholar]
- Green, D.G.; Gill, A.M.; Noble, I.R. Fire shapes and the adequacy of fire-spread models. Ecol. Model. 1983, 20, 33–45. [Google Scholar] [CrossRef]
- Dong, L.; Leung, L.R.; Qian, Y.; Zou, Y.; Song, F.; Chen, X. Meteorological environments associated with California wildfires and their potential roles in wildfire changes during 1984–2017. J. Geophys. Res. Atmos. 2021, 126, e2020JD033180. [Google Scholar] [CrossRef]
- Abrams, M.D. Ecological and ecophysiological attributes and responses to fire in eastern oak forests. In Fire in Eastern Oak Forests: Delivering Science to Land Managers Conference, Columbus, OH, USA, 15–17 November 2005; The Ohio State University: Columbus, OH, USA, 2005; pp. 74–89. [Google Scholar]
- Rothermel, R.C. A Mathematical Model for Predicting Fire Spread in Wildland Fuels; Intermountain Forest & Range Experiment Station, Forest Service, US: Ogden, UT, USA, 1972; Volume 115. [Google Scholar]
- McArthur, A.G. Fire Behaviour in Eucalypt Forests; Commonwealth of Australia Forestry and Timber Bureau: Canberra, Australia, 1967. [Google Scholar]
- Wang, Z. Current forest fire danger rating system. J. Nat. Disasters 1992, 3, 39–44. [Google Scholar]
- Mandel, J.; Amram, S.; Beezley, J.D.; Kelman, G.; Kochanski, A.K.; Kondratenko, V.Y.; Lynn, B.H.; Regev, B.; Vejmelka, M. Recent advances and applications of WRF&SFIRE. Nat. Hazards Earth Syst. Sci. 2014, 14, 2829–2845. [Google Scholar]
- Tang, W.; Bennett, D.A. Agent-based modeling of animal movement: A review. Geogr. Compass 2010, 4, 682–700. [Google Scholar]
- Hu, X.; Sun, Y. Agent-Based Modeling and Simulation of Wildland Fire Suppression. In Proceedings of the 2007 Winter Simulation Conference, Washington, DC, USA, 9–12 December 2007; IEEE: Piscataway, NJ, USA, 2007; pp. 1275–1283. [Google Scholar]
- Bone, C.; Johnson, B.; Nielsen-Pincus, M.; Sproles, E.; Bolte, J. A Temporal Variant-invariant Validation Approach for Agent-based Models of Landscape Dynamics. Trans. GIS 2014, 18, 161–182. [Google Scholar]
- Ager, A.A.; Barros, A.M.; Day, M.A.; Preisler, H.K.; Spies, T.A.; Bolte, J. Analyzing fine-scale spatiotemporal drivers of wildfire in a forest landscape model. Ecol. Model. 2018, 384, 87–102. [Google Scholar]
- Céspedes, B.; Luna, B.; Pérez, B.; Urbieta, I.R.; Moreno, J.M. Burning season effects on the short-term post-fire vegetation dynamics of a Mediterranean heathland. Appl. Veg. Sci. 2014, 17, 86–96. [Google Scholar] [CrossRef]
- Luo, C.; Shen, Z.; Li, Y.; Han, J.; Pausas, J.G.; Xu, Q.; Zhang, Z.; Jiang, Y. Determinants of post–fire regeneration demography in a subtropical monsoon–climate forest in Southwest China. Sci. Total Environ. 2021, 766, 142605. [Google Scholar] [CrossRef]
- Ganey, J.L.; Wan, H.Y.; Cushman, S.A.; Vojta, C.D. Conflicting perspectives on spotted owls, wildfire, and forest restoration. Fire Ecol. 2017, 13, 146–165. [Google Scholar]
- Hutchen, J.; Hodges, K.E. Impact of wildfire size on snowshoe hare relative abundance in southern British Columbia, Canada. Fire Ecol. 2019, 15, 37. [Google Scholar]
- Morales, A.M.; Politi, N.; Rivera, L.O.; Vivanco, C.G.; Defossé, G.E. Fire and distance from unburned forest influence bird assemblages in Southern Andean Yungas of Northwest Argentina: A case study. Fire Ecol. 2020, 16, 10. [Google Scholar]
- Ferrenberg, S.M.; Schwilk, D.W.; Knapp, E.E.; Groth, E.; Keeley, J.E. Fire decreases arthropod abundance but increases diversity: Early and late season prescribed fire effects in a Sierra Nevada mixed-conifer forest. Fire Ecol. 2006, 2, 79–102. [Google Scholar]
- Karsai, I.; Roland, B.; Kampis, G. The effect of fire on an abstract forest ecosystem: An agent based study. Ecol. Complex 2016, 28, 12–23. [Google Scholar]
- Karsai, I.; Schmickl, T.; Kampis, G.; Karsai, I.; Schmickl, T.; Kampis, G. Forest Fires: Fire Management and the Power Law. In Resilience and Stability of Ecological and Social Systems; Springer: Cham, Switzerland, 2020; pp. 63–77. [Google Scholar]
- Foster, C.N.; Banks, S.C.; Cary, G.J.; Johnson, C.N.; Lindenmayer, D.B.; Valentine, L.E. Animals as agents in fire regimes. Trends Ecol. Evol. 2020, 35, 346–356. [Google Scholar] [PubMed]
- Tesson, S.V.; Edelaar, P. Dispersal in a changing world: Opportunities, insights and challenges. Mov. Ecol. 2013, 1, 10. [Google Scholar]
- Okubo, A.; Levin, S.A. Diffusion and Ecological Problems: Modern Perspectives; Springer: New York, NY, USA, 2001. [Google Scholar]
- Bennett, D.A.; Tang, W. Modelling adaptive, spatially aware, and mobile agents: Elk migration in Yellowstone. Int. J. Geogr. Inform. Sci 2006, 20, 1039–1066. [Google Scholar]
- Nathan, R.; Getz, W.M.; Revilla, E.; Holyoak, M.; Kadmon, R.; Saltz, D.; Smouse, P.E. A movement ecology paradigm for unifying organismal movement research. Proc. Natl. Acad. Sci. USA 2008, 105, 19052–19059. [Google Scholar]
- Dennhardt, A.J.; Duerr, A.E.; Brandes, D.; Katzner, T.E. Modeling autumn migration of a rare soaring raptor identifies new movement corridors in central Appalachia. Ecol. Model. 2015, 303, 19–29. [Google Scholar] [CrossRef] [Green Version]
- Schoon, M.; Baggio, J.A.; Salau, K.R.; Janssen, M. Insights for managers from modeling species interactions across multiple scales in an idealized landscape. Environ. Model. Softw. 2014, 54, 53–59. [Google Scholar] [CrossRef]
- Hidalgo, J.; Suweis, S.; Maritan, A. Species coexistence in a neutral dynamics with environmental noise. J. Theor. Biol. 2017, 413, 1–10. [Google Scholar] [CrossRef] [Green Version]
- Haugo, R.; Zanger, C.; DeMeo, T.; Ringo, C.; Shlisky, A.; Blankenship, K.; Simpson, M.; Mellen-McLean, K.; Kertis, J.; Stern, M. A new approach to evaluate forest structure restoration needs across Oregon and Washington, USA. For. Ecol. Manag. 2015, 335, 37–50. [Google Scholar]
- Trunfio, G.A. Predicting Wildfire Spreading through a Hexagonal Cellular Automata Model. In Proceedings of the 6th International Conference on Cellular Automata for Research and Industry, ACRI 2004, Amsterdam, The Netherlands, 25–28 October 2004; Springer: Berlin/Heidelberg, Germany, 2004; pp. 385–394. [Google Scholar]
- Almeida, R.M.; Macau, E.E. Stochastic Cellular Automata Model for Wildland fire SPREAD Dynamics. J. Phys. Conf. Ser. 2011, 285, 12038. [Google Scholar] [CrossRef]
- Yang, X.; Sun, J.; Li, W. An analysis of cloud-to-ground lightning in China during 2010–13. Weather Forecast 2015, 30, 1537–1550. [Google Scholar] [CrossRef]
- Koehler, T.L. Cloud-to-ground lightning flash density and thunderstorm day distributions over the contiguous United States derived from NLDN measurements: 1993–2018. Mon. Weather Rev. 2020, 148, 313–332. [Google Scholar]
- Hessilt, T.D.; Abatzoglou, J.T.; Chen, Y.; Randerson, J.T.; Scholten, R.C.; Van Der Werf, G.; Veraverbeke, S. Future increases in lightning ignition efficiency and wildfire occurrence expected from drier fuels in boreal forest ecosystems of western North America. Environ. Res. Lett. 2022, 17, 54008. [Google Scholar]
- Green, D.G.; House, A.; House, S.M. Simulating spatial patterns in forest ecosystems. Math. Comput. Simulat. 1985, 27, 191–198. [Google Scholar] [CrossRef]
- Wang, X.; Liu, C.; Liu, J.; Qin, X.; Wang, N.; Zhou, W. A Cellular Automata Model for Forest Fire Spreading Simulation. In Proceedings of the 2016 IEEE Symposium Series on Computational Intelligence (SSCI), Athens, Greece, 6–9 December 2016; IEEE: Piscataway, NJ, USA, 2016; pp. 1–6. [Google Scholar]
- Ramsay, P.M.; Oxley, E. Fire temperatures and postfire plant community dynamics in Ecuadorian grass páramo. Vegetatio 1996, 124, 129–144. [Google Scholar] [CrossRef]
- Konstantinidis, P.; Tsiourlis, G.; Xofis, P. Effect of fire season, aspect and pre-fire plant size on the growth of Arbutus unedo L. (strawberry tree) resprouts. For. Ecol. Manag. 2006, 225, 359–367. [Google Scholar] [CrossRef]
- Couto, F.T.; Iakunin, M.; Salgado, R.; Pinto, P.; Viegas, T.; Pinty, J. Lightning modelling for the research of forest fire ignition in Portugal. Atmos. Res. 2020, 242, 104993. [Google Scholar] [CrossRef]
- Los Huertos, M. Ecology and Management of Inland Waters: A Californian Perspective with Global Applications; Elsevier: Amsterdam, The Netherlands, 2020. [Google Scholar]
- Bampoh, D.; Earl, J.E.; Zollner, P.A. Examining the relative influence of animal movement patterns and mortality models on the distribution of animal transported subsidies. Ecol. Model. 2019, 412, 108824. [Google Scholar]
- Peet, R.K. The measurement of species diversity. Annu. Rev. Ecol. Syst. 1974, 5, 285–307. [Google Scholar] [CrossRef]
- Lan, B.L.; Yeoh, E.V.; Ng, J.A. Distribution of detrended stock market data. Fluct. Noise Lett. 2010, 9, 245–257. [Google Scholar] [CrossRef]
- Looman, J. Biological equilibrium in ecosystems 1. A theory of biological equilibrium. Folia Geobot. Phytotaxon. 1976, 11, 1–21. [Google Scholar] [CrossRef]
- Ramos-Neto, M.B.; Pivello, V.R. Lightning fires in a Brazilian savanna national park: Rethinking management strategies. Environ. Manag. 2000, 26, 675–684. [Google Scholar]
- Granström, A. Spatial and temporal variation in lightning ignitions in Sweden. J. Veg. Sci. 1993, 4, 737–744. [Google Scholar] [CrossRef]
- Wotton, B.M.; Martell, D.L. A lightning fire occurrence model for Ontario. Can. J. For. Res. 2005, 35, 1389–1401. [Google Scholar] [CrossRef]
- Wierzchowski, J.; Heathcott, M.; Flannigan, M.D. Lightning and lightning fire, central cordillera, Canada. Int. J. Wildland Fire 2002, 11, 41–51. [Google Scholar] [CrossRef]
- Apigian, K.O.; Dahlsten, D.L.; Stephens, S.L. Fire and fire surrogate treatment effects on leaf litter arthropods in a western Sierra Nevada mixed-conifer forest. For. Ecol. Manag. 2006, 221, 110–122. [Google Scholar] [CrossRef]
- Pausas, J.G.; Parr, C.L. Towards an understanding of the evolutionary role of fire in animals. Evol. Ecol. 2018, 32, 113–125. [Google Scholar] [CrossRef]
- Bouchard, M.; Kneeshaw, D.; Bergeron, Y. Ecosystem management based on large-scale disturbance pulses: A case study from sub-boreal forests of western Quebec (Canada). For. Ecol. Manag. 2008, 256, 1734–1742. [Google Scholar]
- Chesson, P. Mechanisms of maintenance of species diversity. Annu. Rev. Ecol. Syst. 2000, 31, 343–366. [Google Scholar]
- Guo, F.; Su, Z.; Wang, G.; Sun, L.; Lin, F.; Liu, A. Wildfire ignition in the forests of southeast China: Identifying drivers and spatial distribution to predict wildfire likelihood. Appl. Geogr. 2016, 66, 12–21. [Google Scholar]
- Baranovskiy, N. Deterministic-Probabilistic Approach to Predict Lightning-Caused Forest Fires in Mounting Areas. Forecasting 2021, 3, 695–715. [Google Scholar] [CrossRef]
- Ganteaume, A.; Camia, A.; Jappiot, M.; San-Miguel-Ayanz, J.; Long-Fournel, M.; Lampin, C. A review of the main driving factors of forest fire ignition over Europe. Env. Manag. 2013, 51, 651–662. [Google Scholar]
- Díaz-Avalos, C.; Peterson, D.L.; Alvarado, E.; Ferguson, S.A.; Besag, J.E. Space time modelling of lightning-caused ignitions in the Blue Mountains, Oregon. Can. J. For. Res. 2001, 31, 1579–1593. [Google Scholar]
- Knapp, E.E.; Keeley, J.E. Heterogeneity in fire severity within early season and late season prescribed burns in a mixed-conifer forest. Int. J. Wildland Fire 2006, 15, 37–45. [Google Scholar] [CrossRef] [Green Version]
- Müller, M.M.; Vacik, H. Characteristics of lightnings igniting forest fires in Austria. Agric. For. Meteorol. 2017, 240, 26–34. [Google Scholar] [CrossRef]
- Vecín-Arias, D.; Castedo-Dorado, F.; Ordóñez, C.; Rodríguez-Pérez, J.R. Biophysical and lightning characteristics drive lightning-induced fire occurrence in the central plateau of the Iberian Peninsula. Agric. For. Meteorol. 2016, 225, 36–47. [Google Scholar]
- Dowdy, A.J.; Fromm, M.D.; McCarthy, N. Pyrocumulonimbus lightning and fire ignition on Black Saturday in southeast Australia. J. Geophys. Res. Atmos. 2017, 122, 7342–7354. [Google Scholar] [CrossRef]
- Stawski, C.; Körtner, G.; Nowack, J.; Geiser, F. The importance of mammalian torpor for survival in a post-fire landscape. Biol. Lett. 2015, 11, 20150134. [Google Scholar] [CrossRef]
Figure 1.
The division of the Moore model.

Figure 2.
The behaviors of species in the model.

Figure 3.
Selection of the moving direction of the species agent.

Figure 4.
The population size of each species.

Figure 5.
The shapes of lightning-caused fire spread in the simulated environment.

Figure 6.
Comparison of environmental parameters: (a) different lightning densities range; (b) different lightning-caused fire efficiencies range.
Figure 6.
Comparison of environmental parameters: (a) different lightning densities range; (b) different lightning-caused fire efficiencies range.

Figure 7.
The average number of CG lightning flashes and fires: (a) the average number of CG lightning flashes and fires in Scenario 2; (b) the number of fires in the first seed experiment of Scenario 2.
Figure 7.
The average number of CG lightning flashes and fires: (a) the average number of CG lightning flashes and fires in Scenario 2; (b) the number of fires in the first seed experiment of Scenario 2.

Figure 8.
The annual burned area and cumulative burned area of lightning-caused fires in forest scenarios with different lightning densities: (a) the annual burned area in Scenario 1; (b) the annual burned area in scenario 2; (c) the annual burned area in scenario 3; (d) the cumulative burned area of lightning-caused fires in Scenarios 1,2, and 3.

Figure 9.
Changes in species diversity indexes for Scenario 0 (without lightning-caused fires): (a) changes of the mean of species abundance in Scenario 0; (b) changes of Gini diversity in Scenario 0.
Figure 9.
Changes in species diversity indexes for Scenario 0 (without lightning-caused fires): (a) changes of the mean of species abundance in Scenario 0; (b) changes of Gini diversity in Scenario 0.

Figure 10.
Comparison of species diversity indexes and cumulative burned areas for four scenarios with different lightning densities. (a) Comparison of the mean of species abundance between Scenario 0 and 1. (b) Comparison of the mean of species abundance between Scenario 0 and 2. (c) Comparison of the mean of species abundance between Scenario 0 and 3. (d) Comparison of Gini diversity between scenario 0 and 1. (e) Comparison of Gini diversity between Scenario 0 and 2. (f) Comparison of Gini diversity between Scenario 0 and 3.

Figure 11.
The annual burned area and cumulative burned area of lightning-caused fires in forest scenarios with different lightning-caused fire efficiencies. (a) The annual burned area in Scenario 4. (b) The annual burned area in Scenario 2. (c) The annual burned area in Scenario 6. (d) The cumulative burned area of lightning-caused fires in Scenarios 4, 2, and 6.

Figure 12.
Comparison of species diversity indexes and cumulative burned areas for four scenarios with different lightning-caused fire efficiencies. (a) Comparison of the mean of species abundance between Scenario 0 and 4. (b) Comparison of the mean of species abundance between Scenario 0 and 2. (c) Comparison of the mean of species abundance between Scenario 0 and 5. (d) Comparison of Gini diversity between Scenario 0 and 4. (e) Comparison of Gini diversity between Scenario 0 and 2. (f) Comparison of Gini diversity between Scenario 0 and 5.

Figure 13.
Comparison of species diversity indexes and cumulative fire areas for Scenario 6 and Scenario 0. (a) Comparison of the mean of species abundance between Scenario 0 and 6. (b) Comparison of Gini diversity between Scenario 0 and 6.
Figure 13.
Comparison of species diversity indexes and cumulative fire areas for Scenario 6 and Scenario 0. (a) Comparison of the mean of species abundance between Scenario 0 and 6. (b) Comparison of Gini diversity between Scenario 0 and 6.

Figure 14.
Annual burned areas and species diversity indexes from year 95 to year 101 of Scenario 6. (a) Annual burned areas and the mean of species abundance in Scenario 6. (b) Annual burned areas and Gini diversity in Scenario 6.
Figure 14.
Annual burned areas and species diversity indexes from year 95 to year 101 of Scenario 6. (a) Annual burned areas and the mean of species abundance in Scenario 6. (b) Annual burned areas and Gini diversity in Scenario 6.

Figure 15.
Annual burned areas and percentage of Class A and Class C species from year 95 to year 101 of Scenario 6. (a) Annual burned areas and percentage of Class A in Scenario 6. (b) Annual burned areas and percentage of Class C in Scenario 6.
Figure 15.
Annual burned areas and percentage of Class A and Class C species from year 95 to year 101 of Scenario 6. (a) Annual burned areas and percentage of Class A in Scenario 6. (b) Annual burned areas and percentage of Class C in Scenario 6.

Figure 16.
Annual burned areas and percentage of Class B species from year 95 to year 101 of Scenario 6.
Figure 16.
Annual burned areas and percentage of Class B species from year 95 to year 101 of Scenario 6.


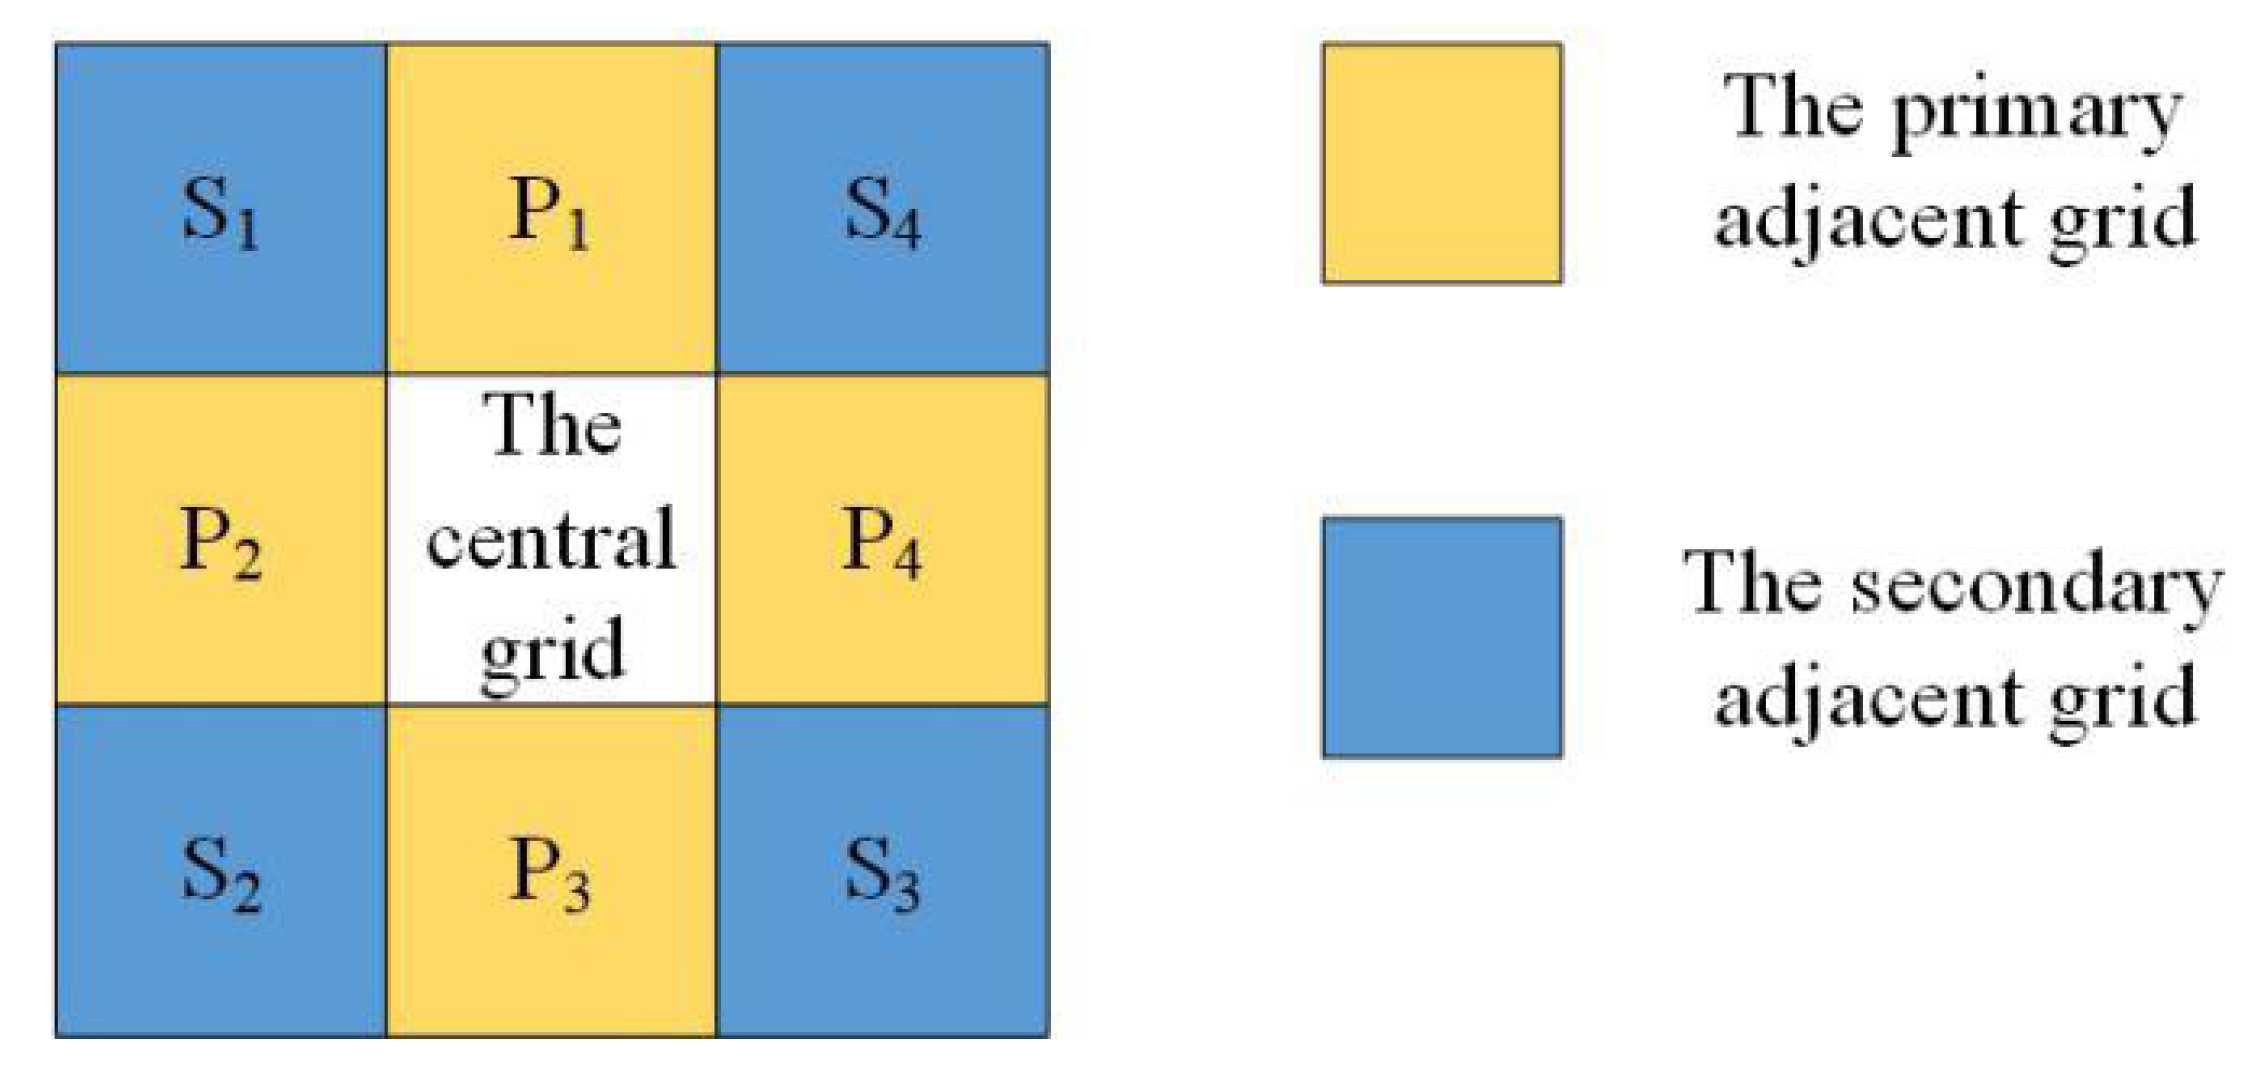
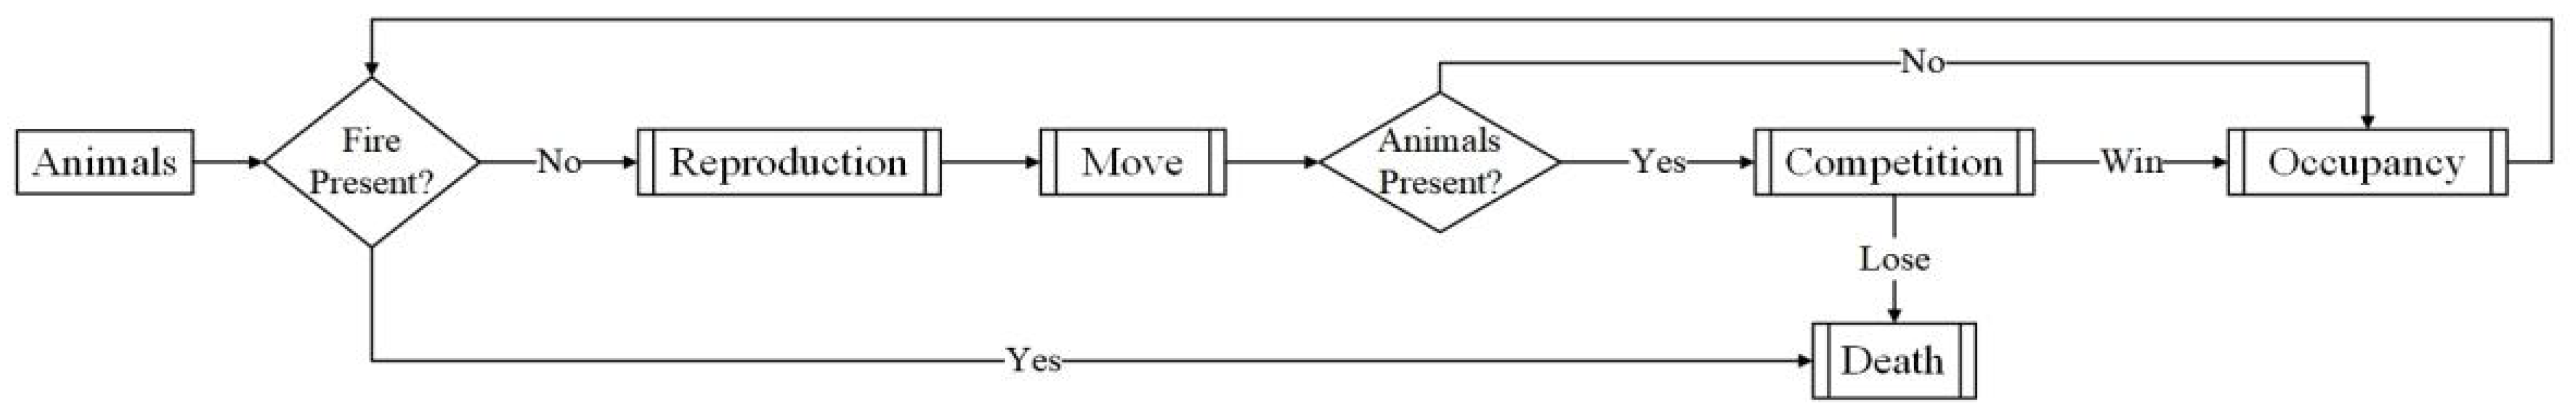
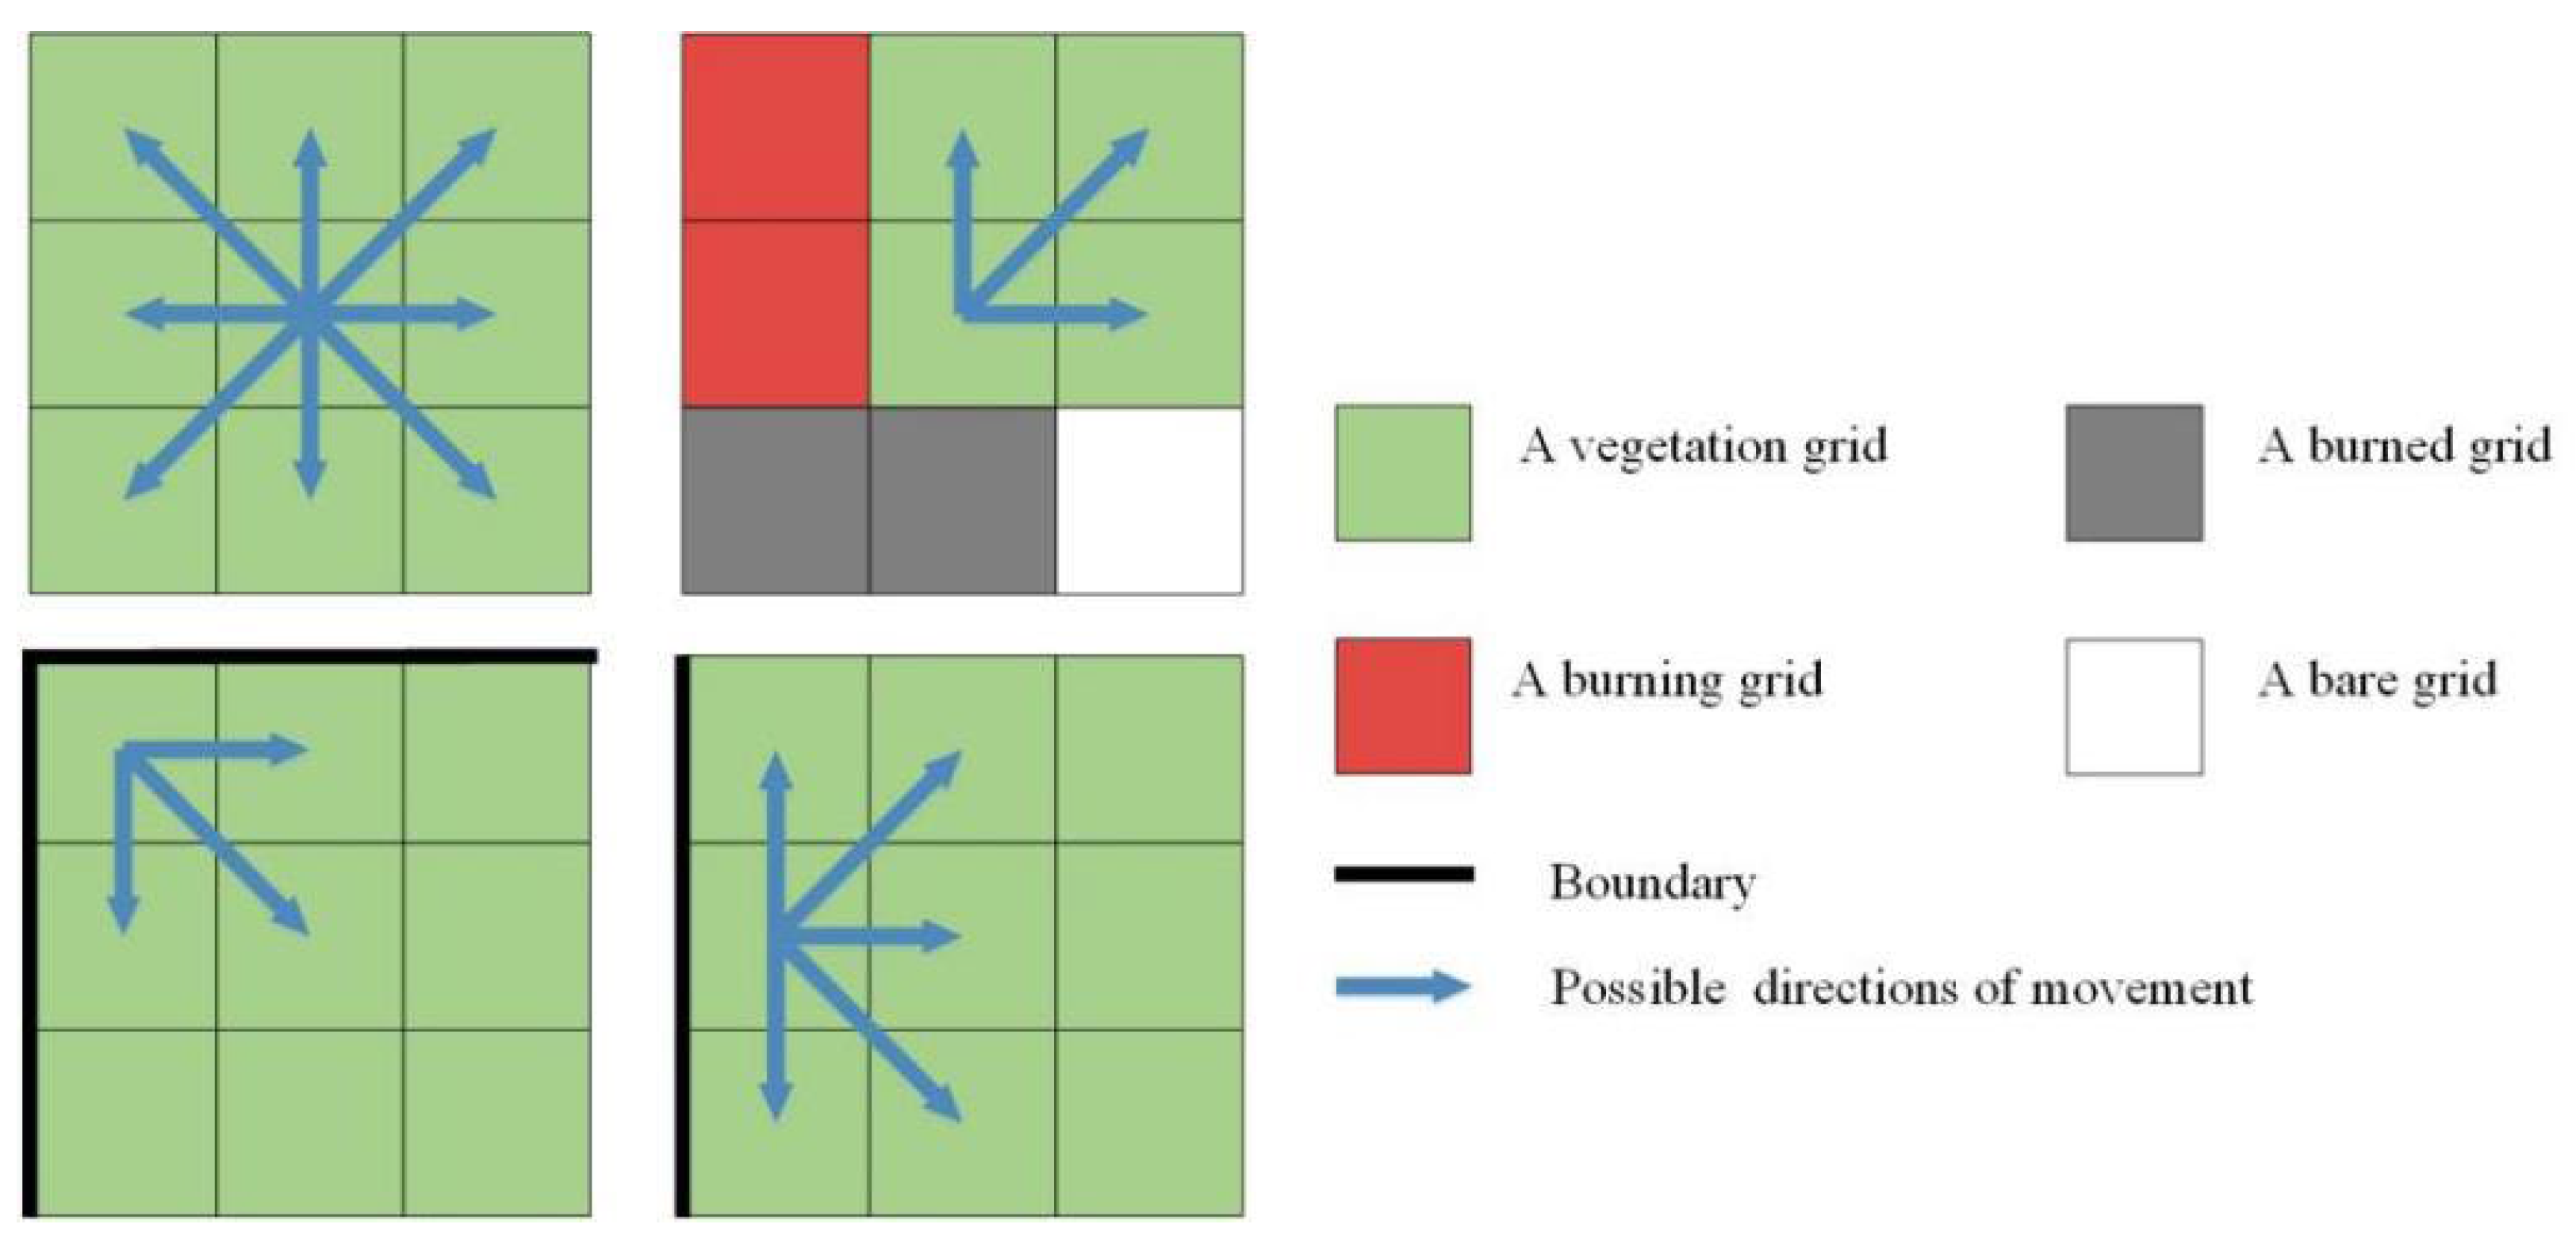
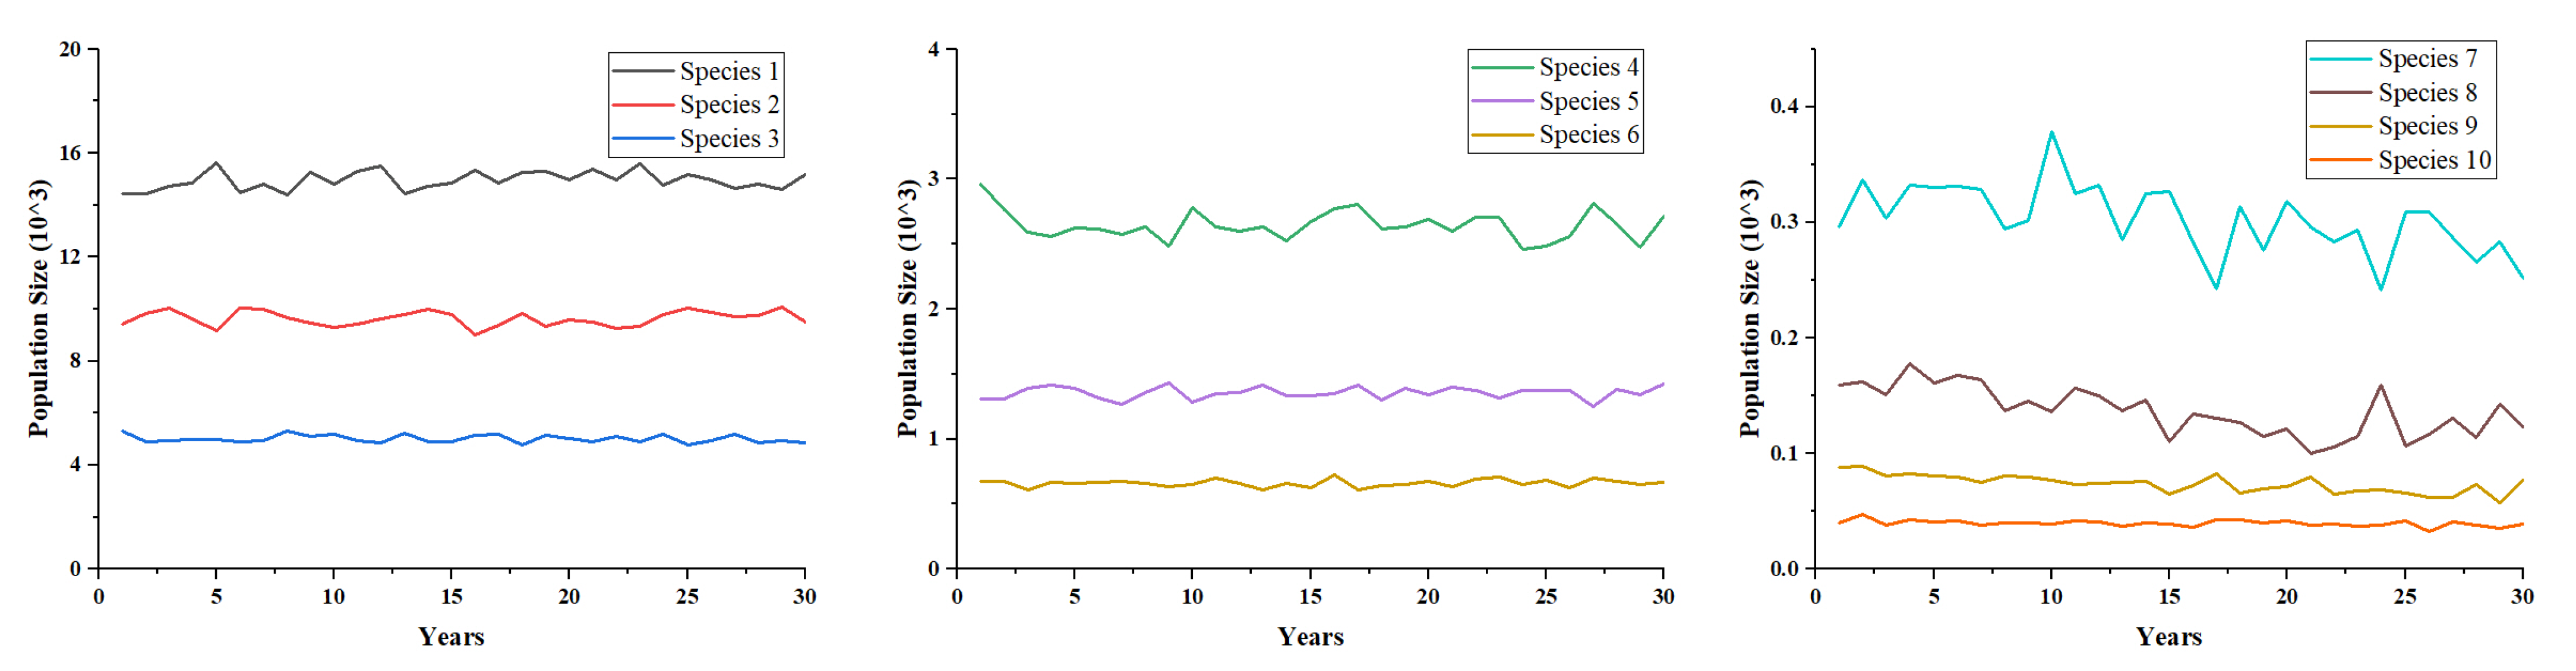
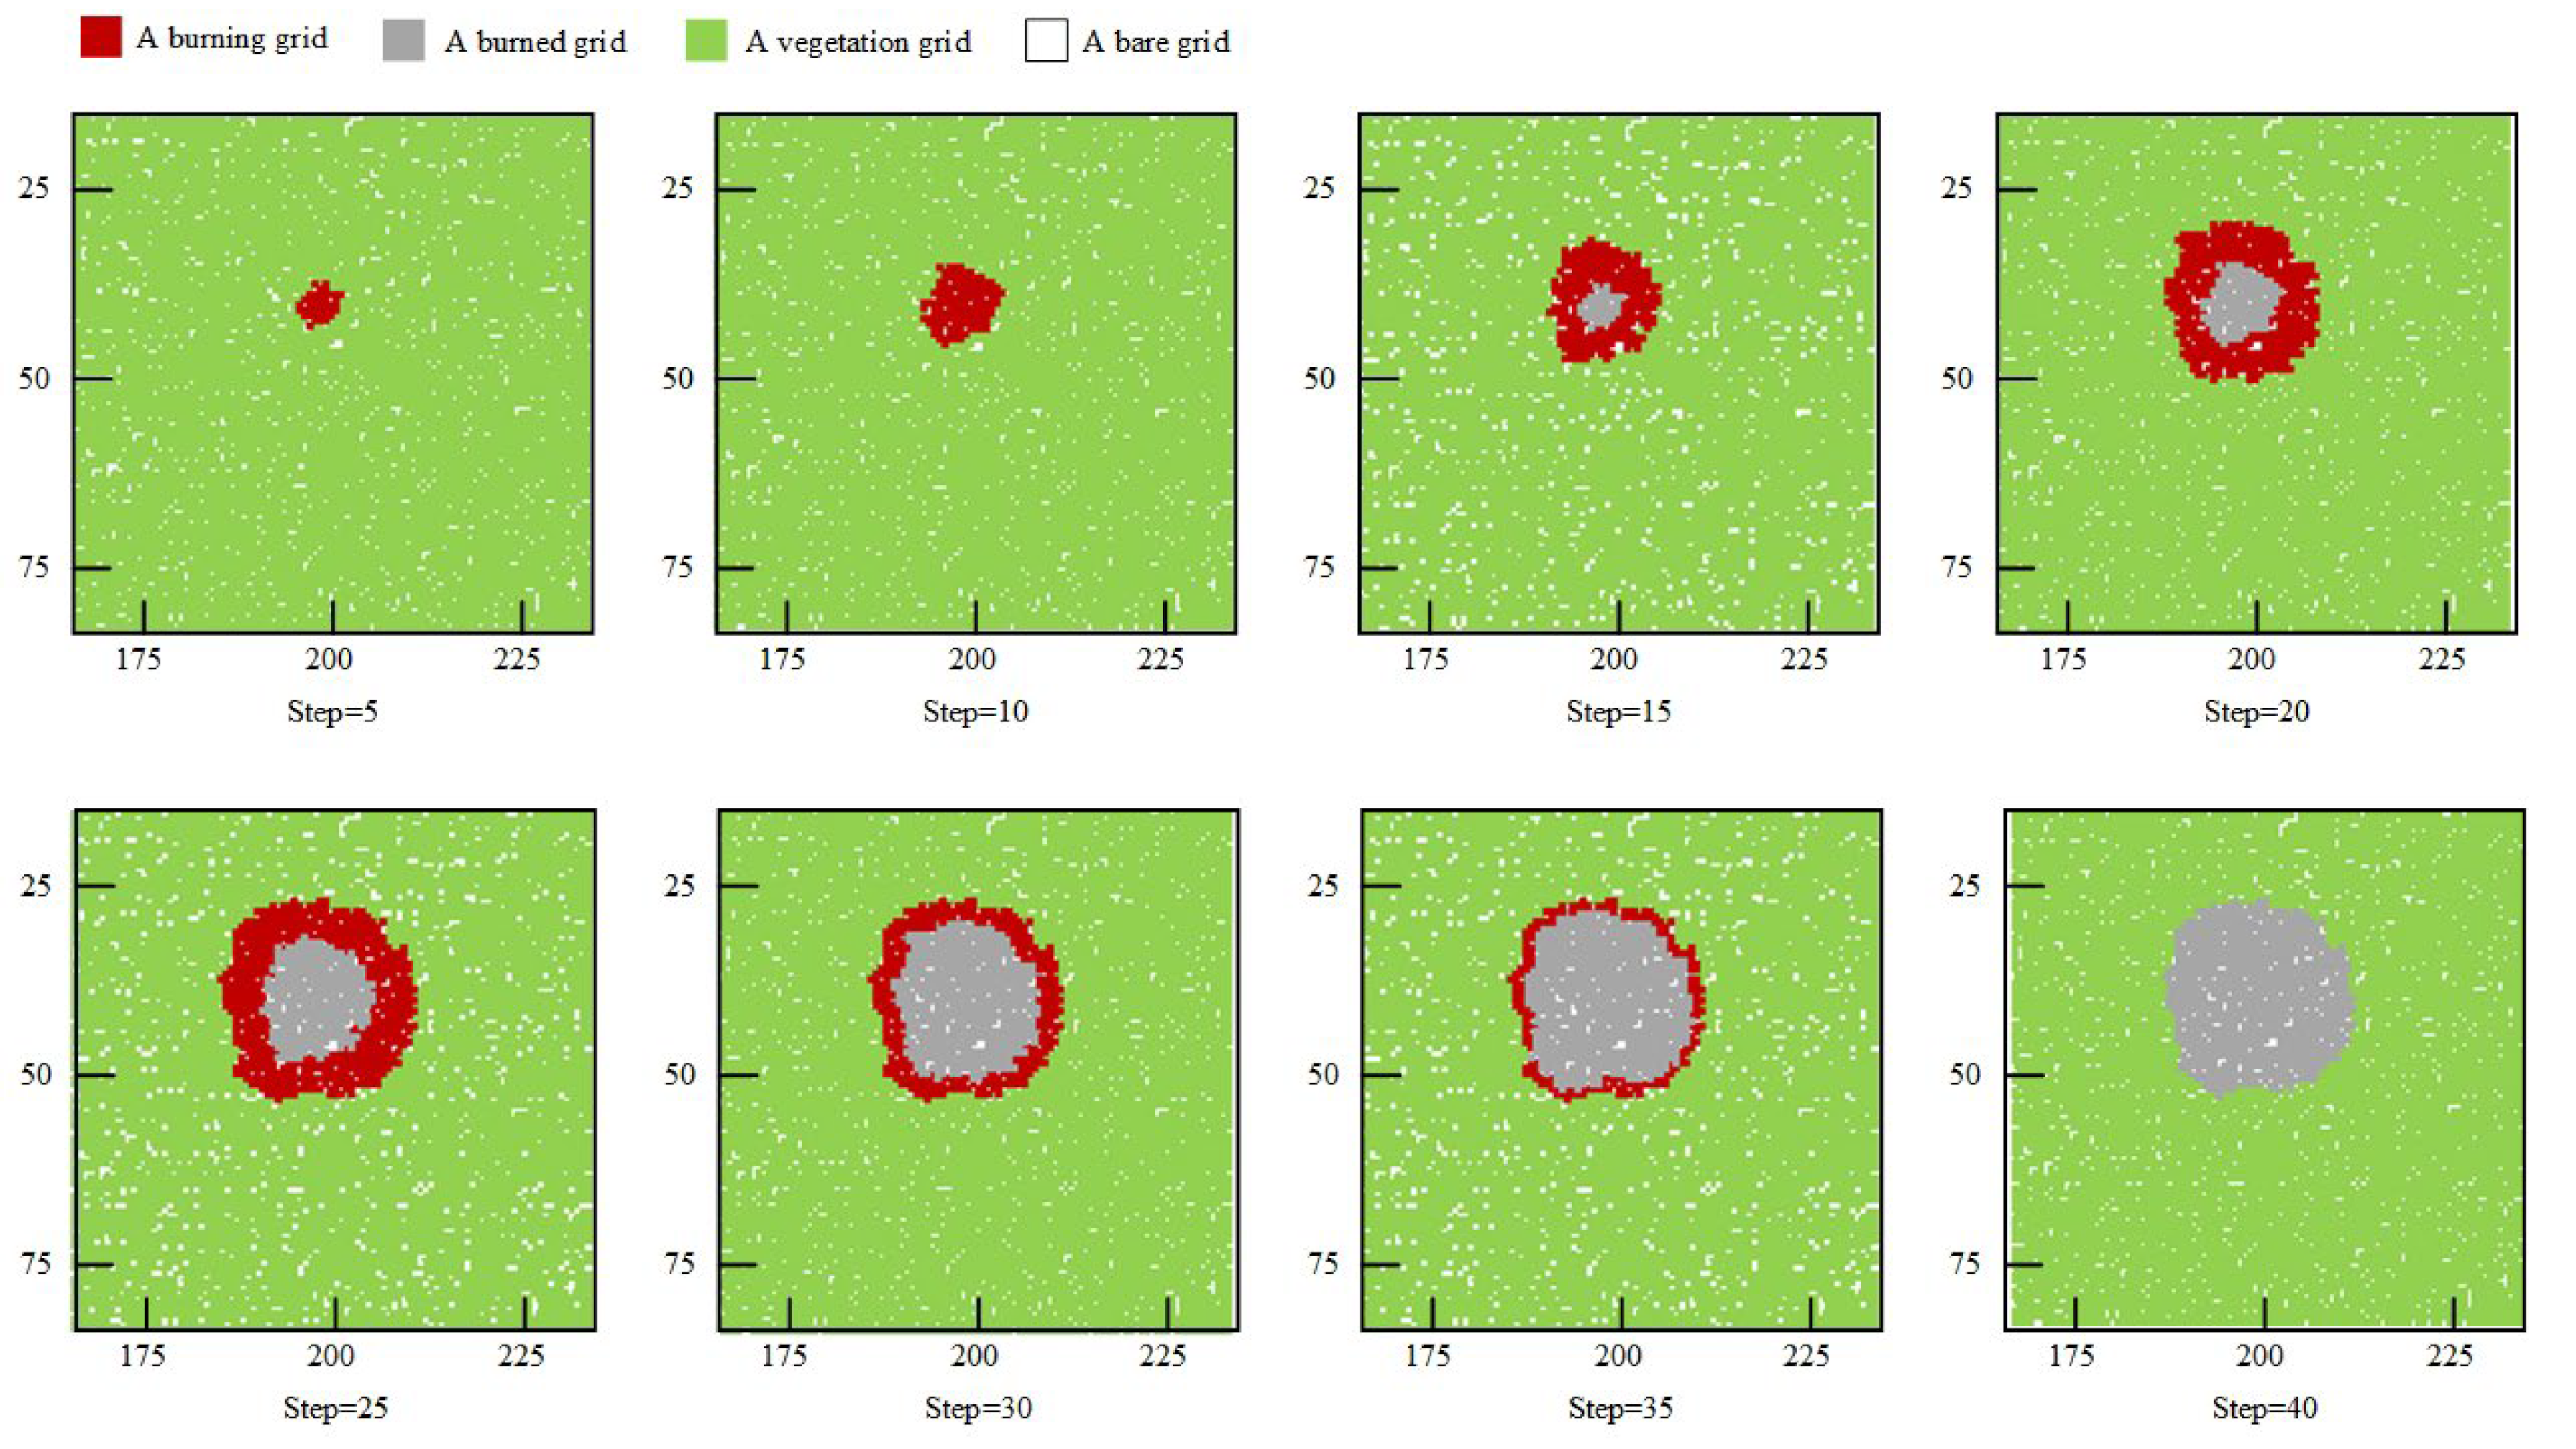
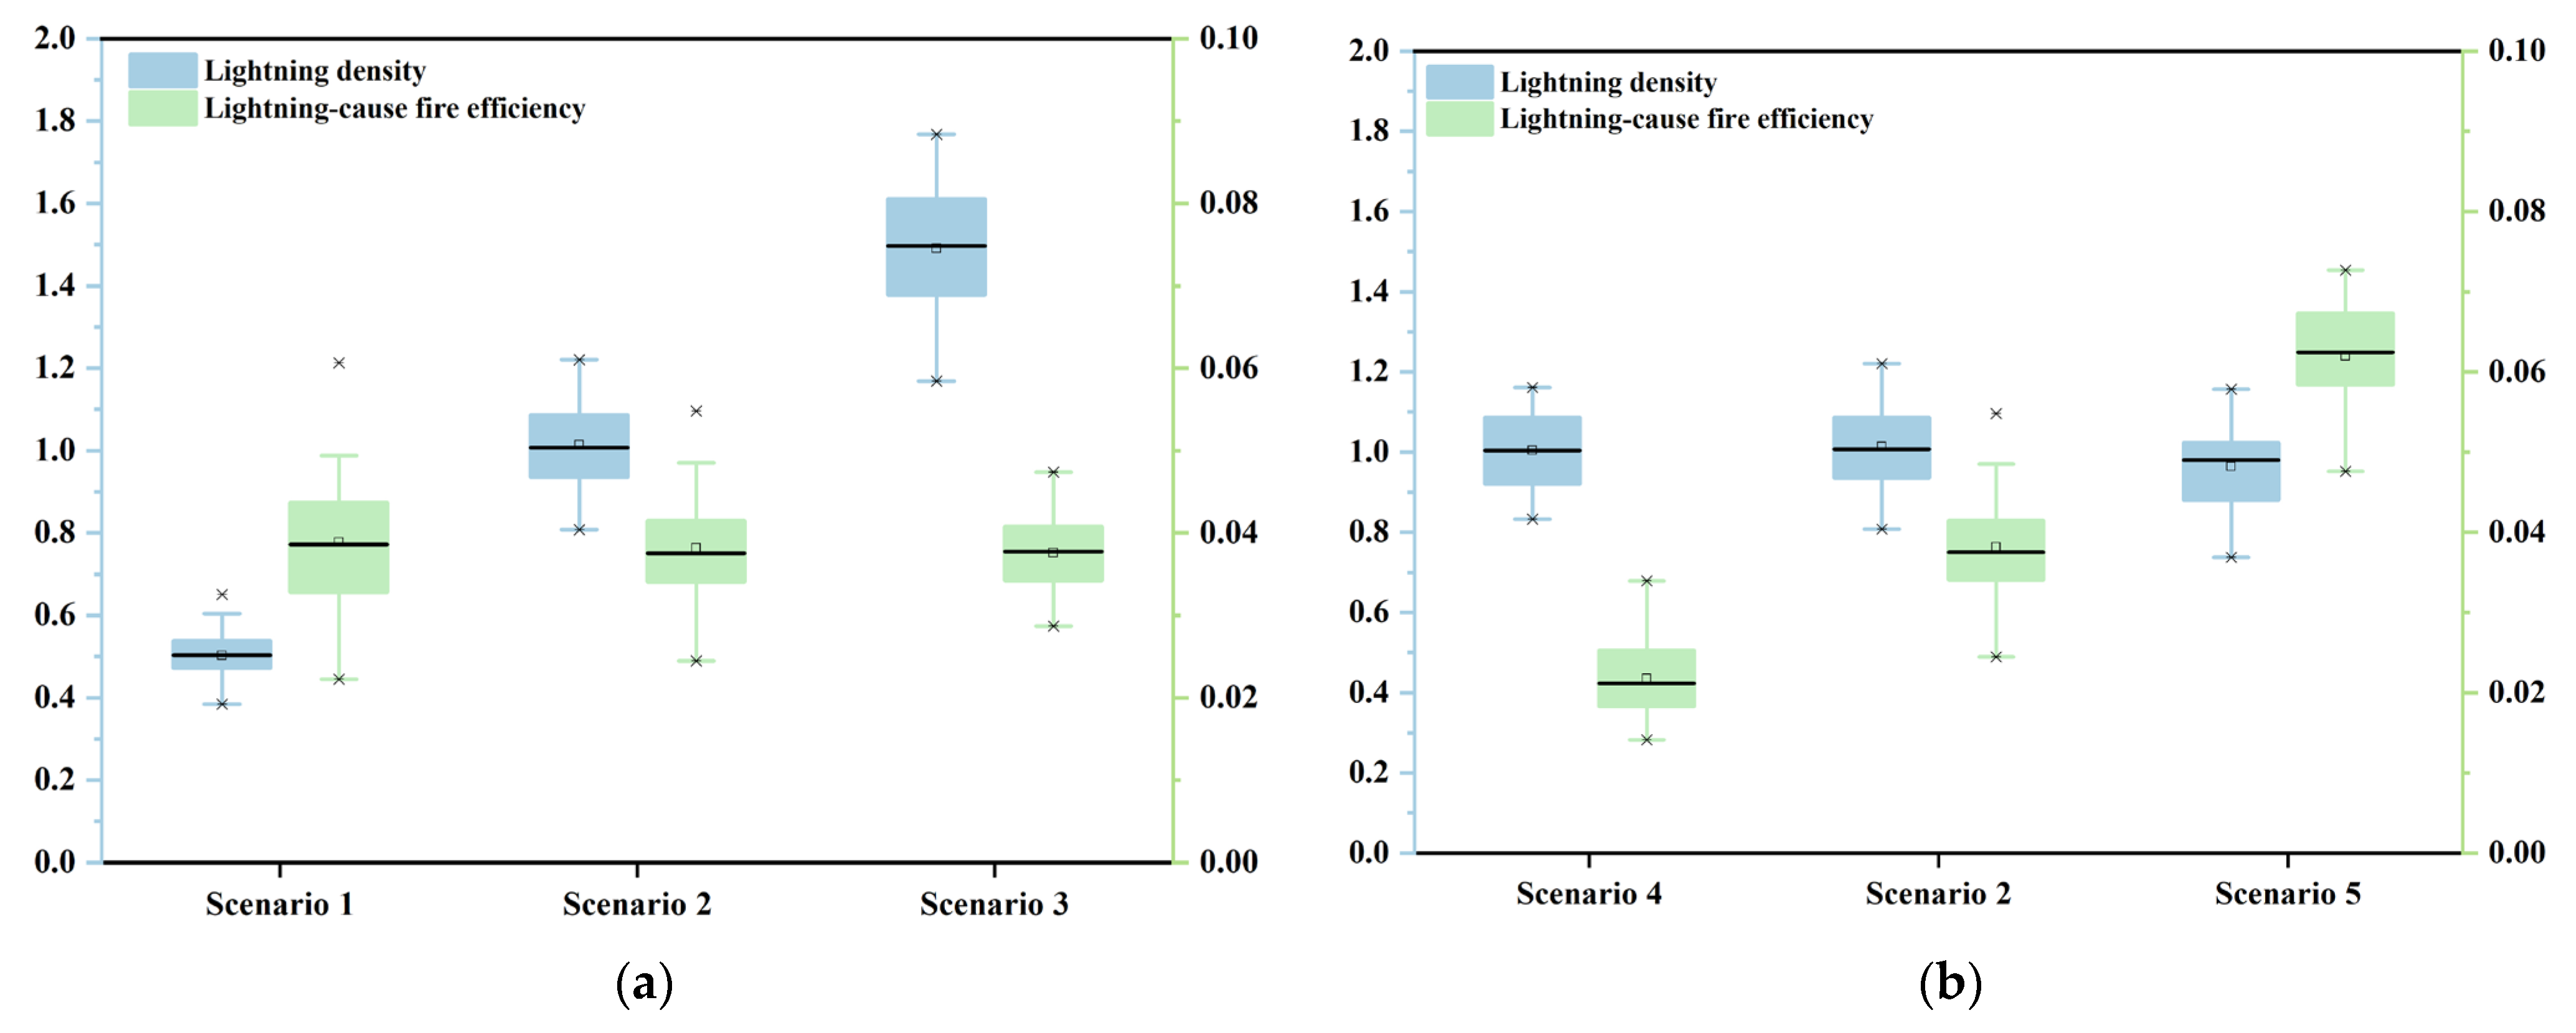
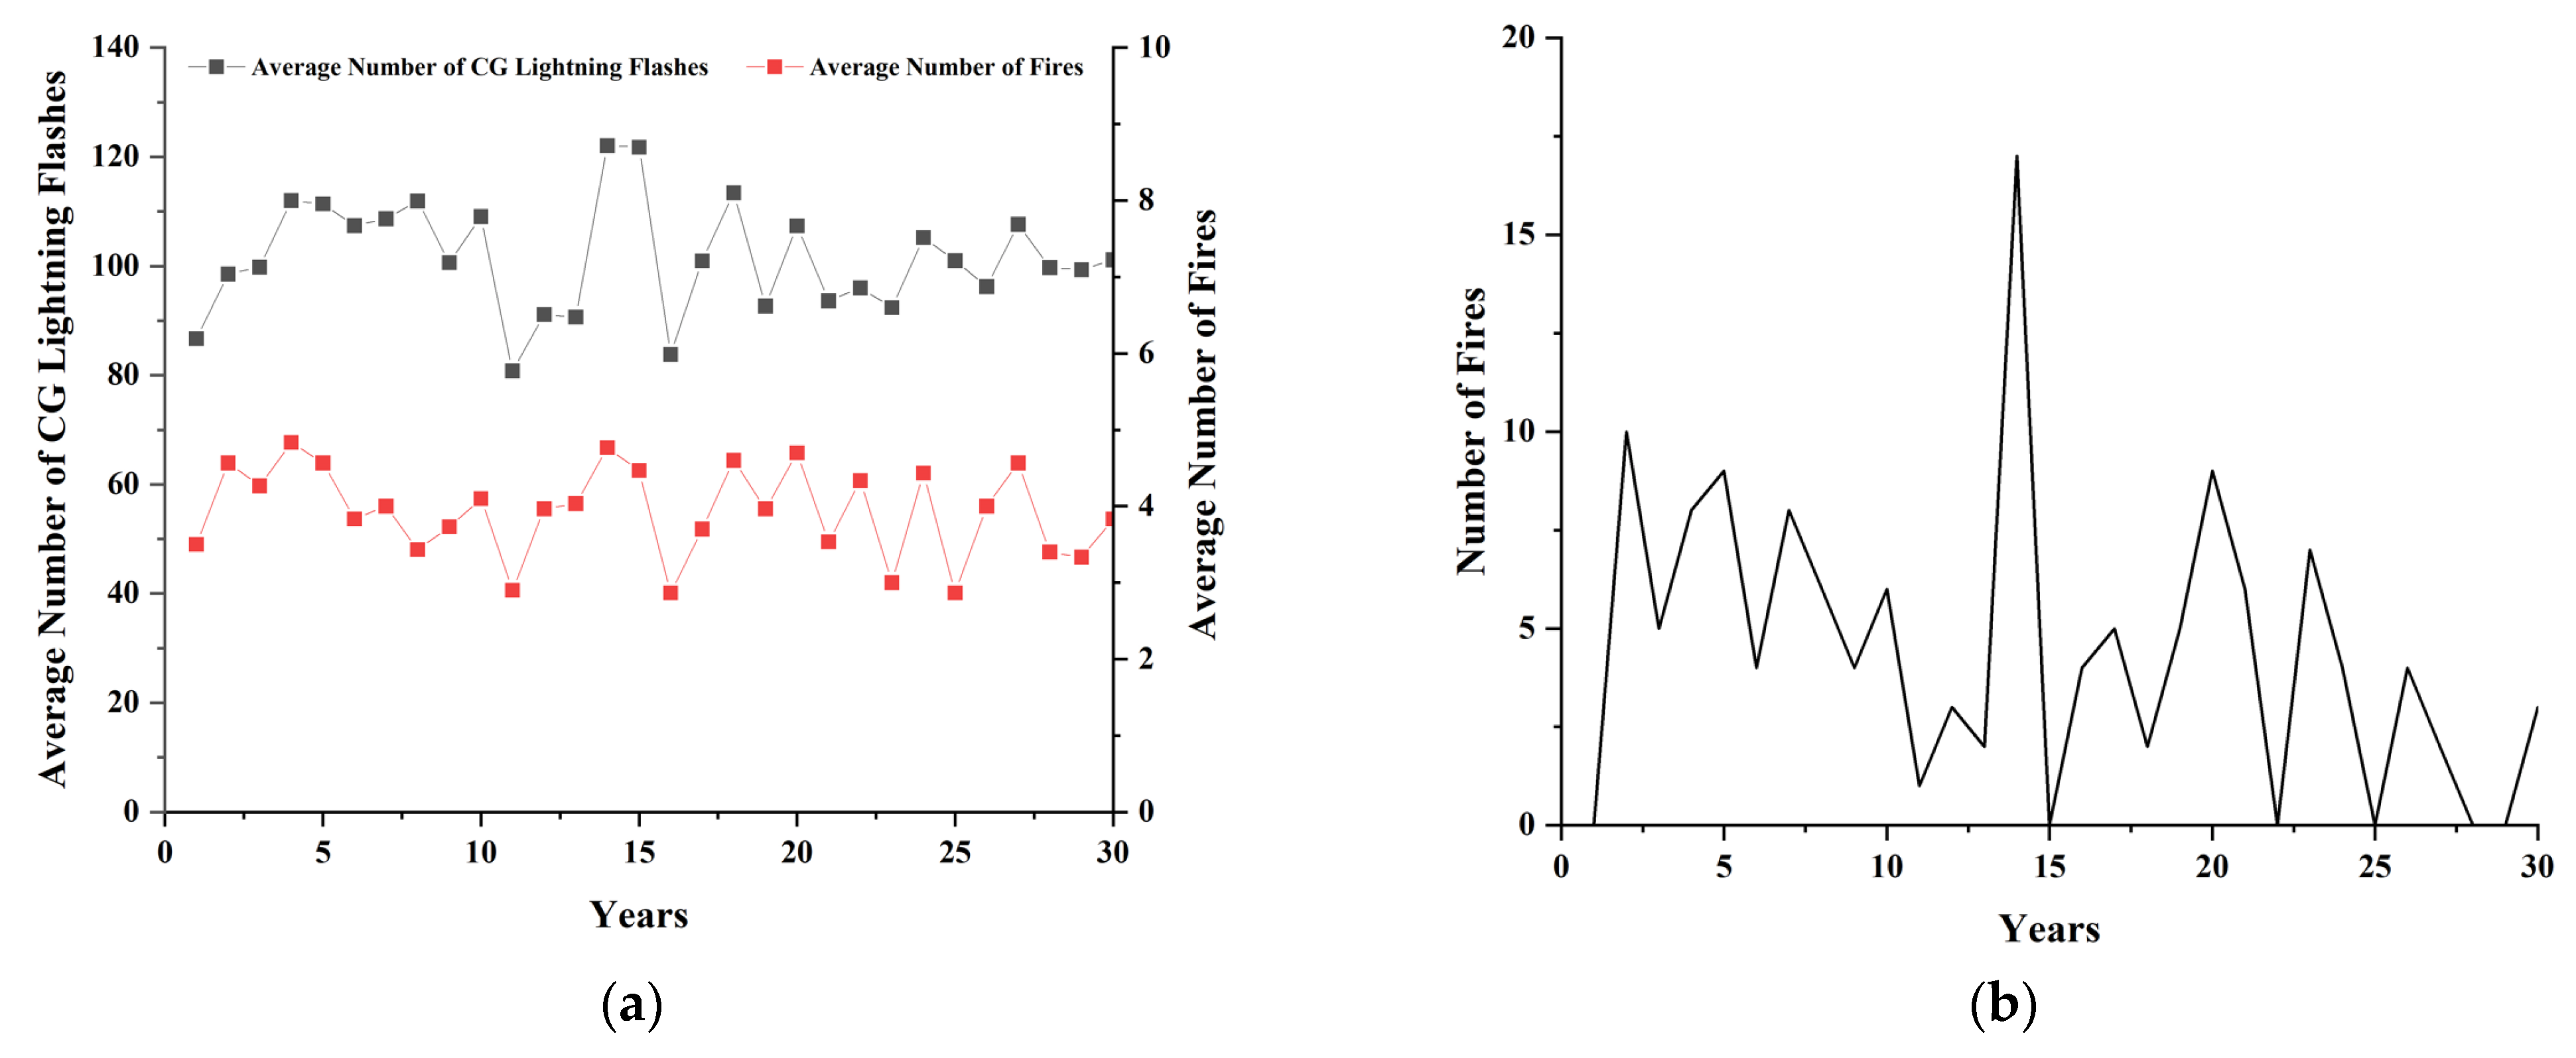
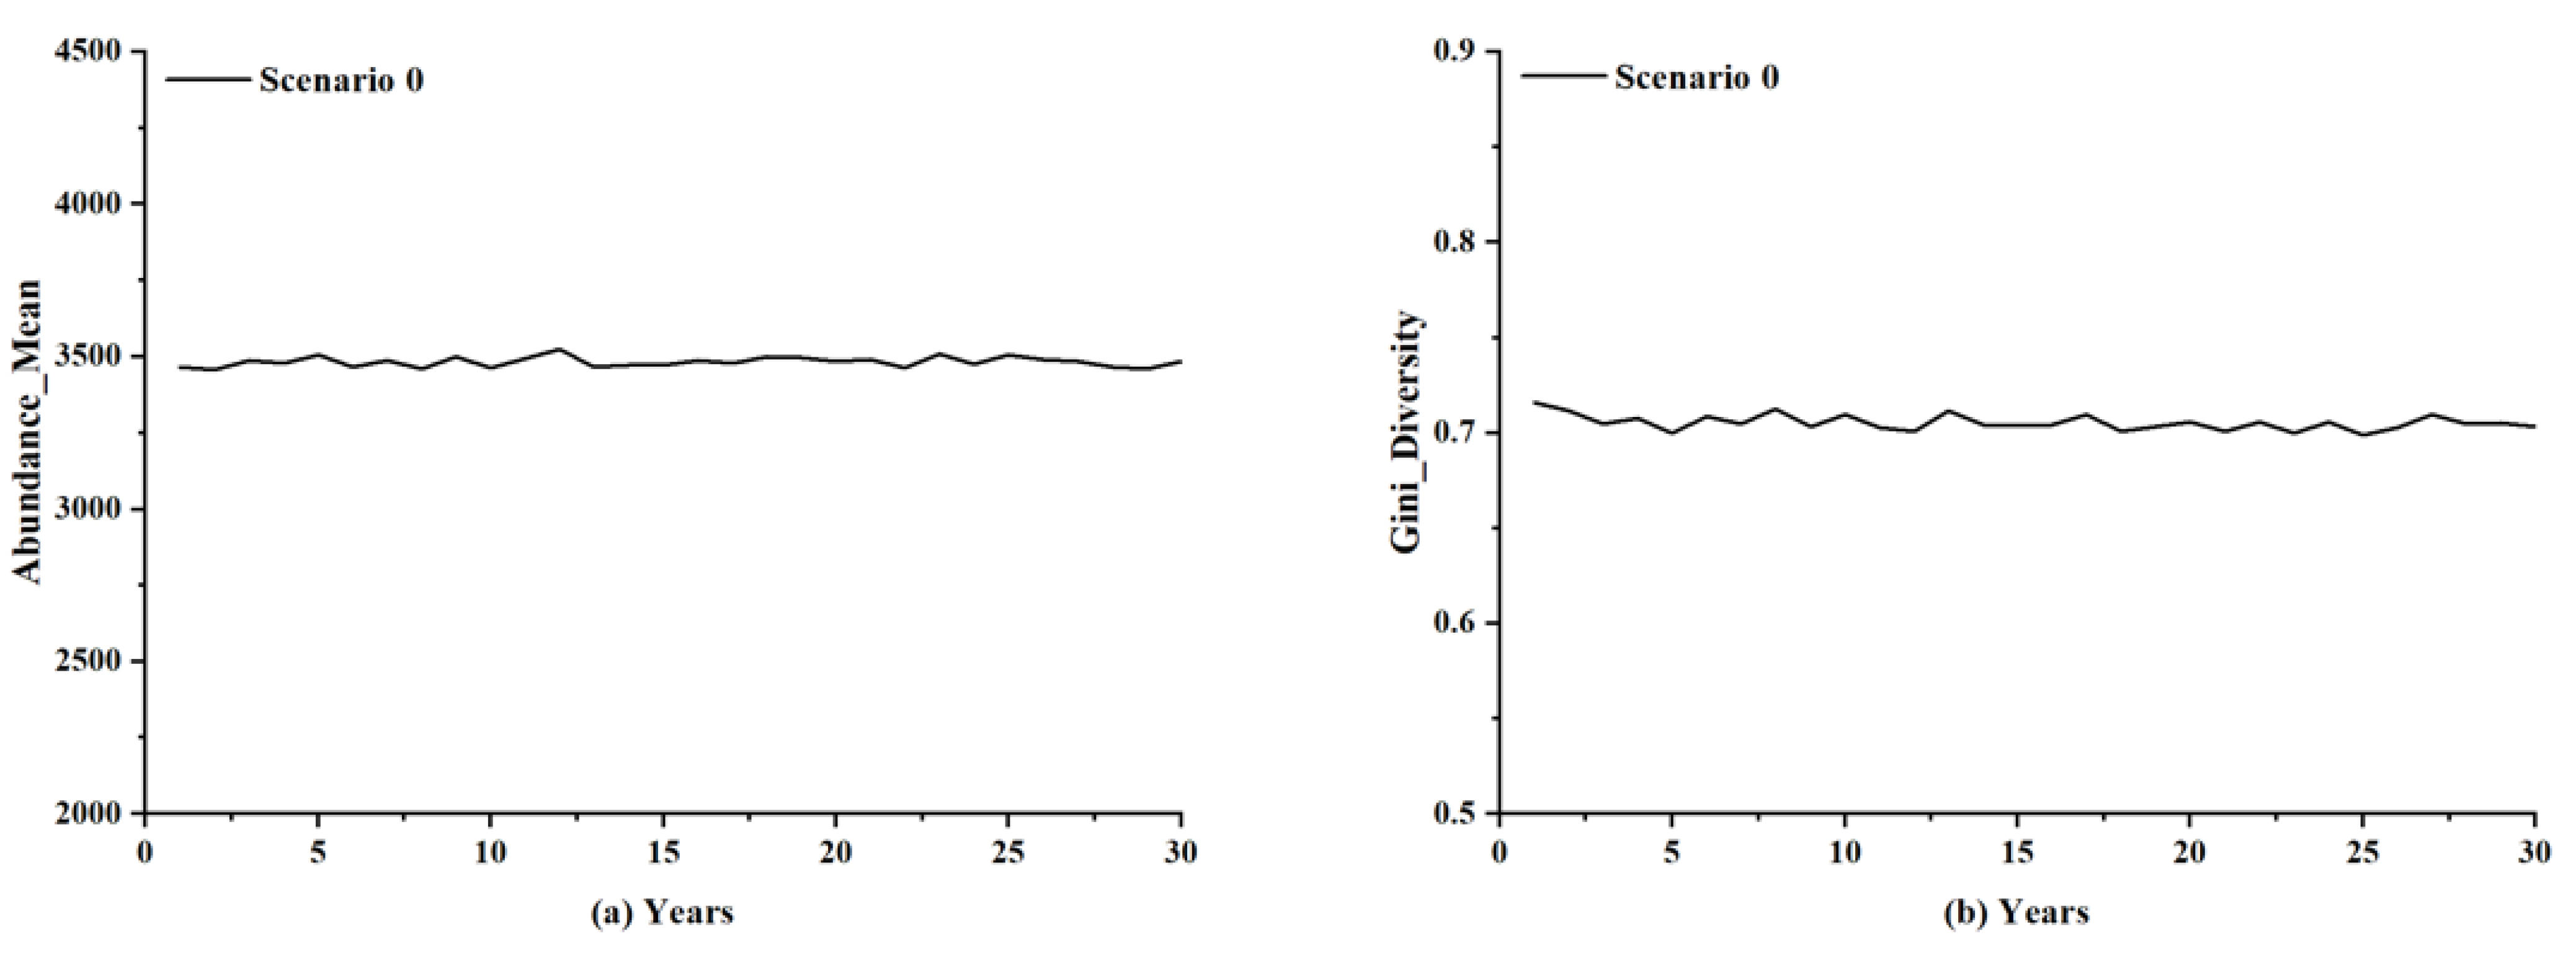
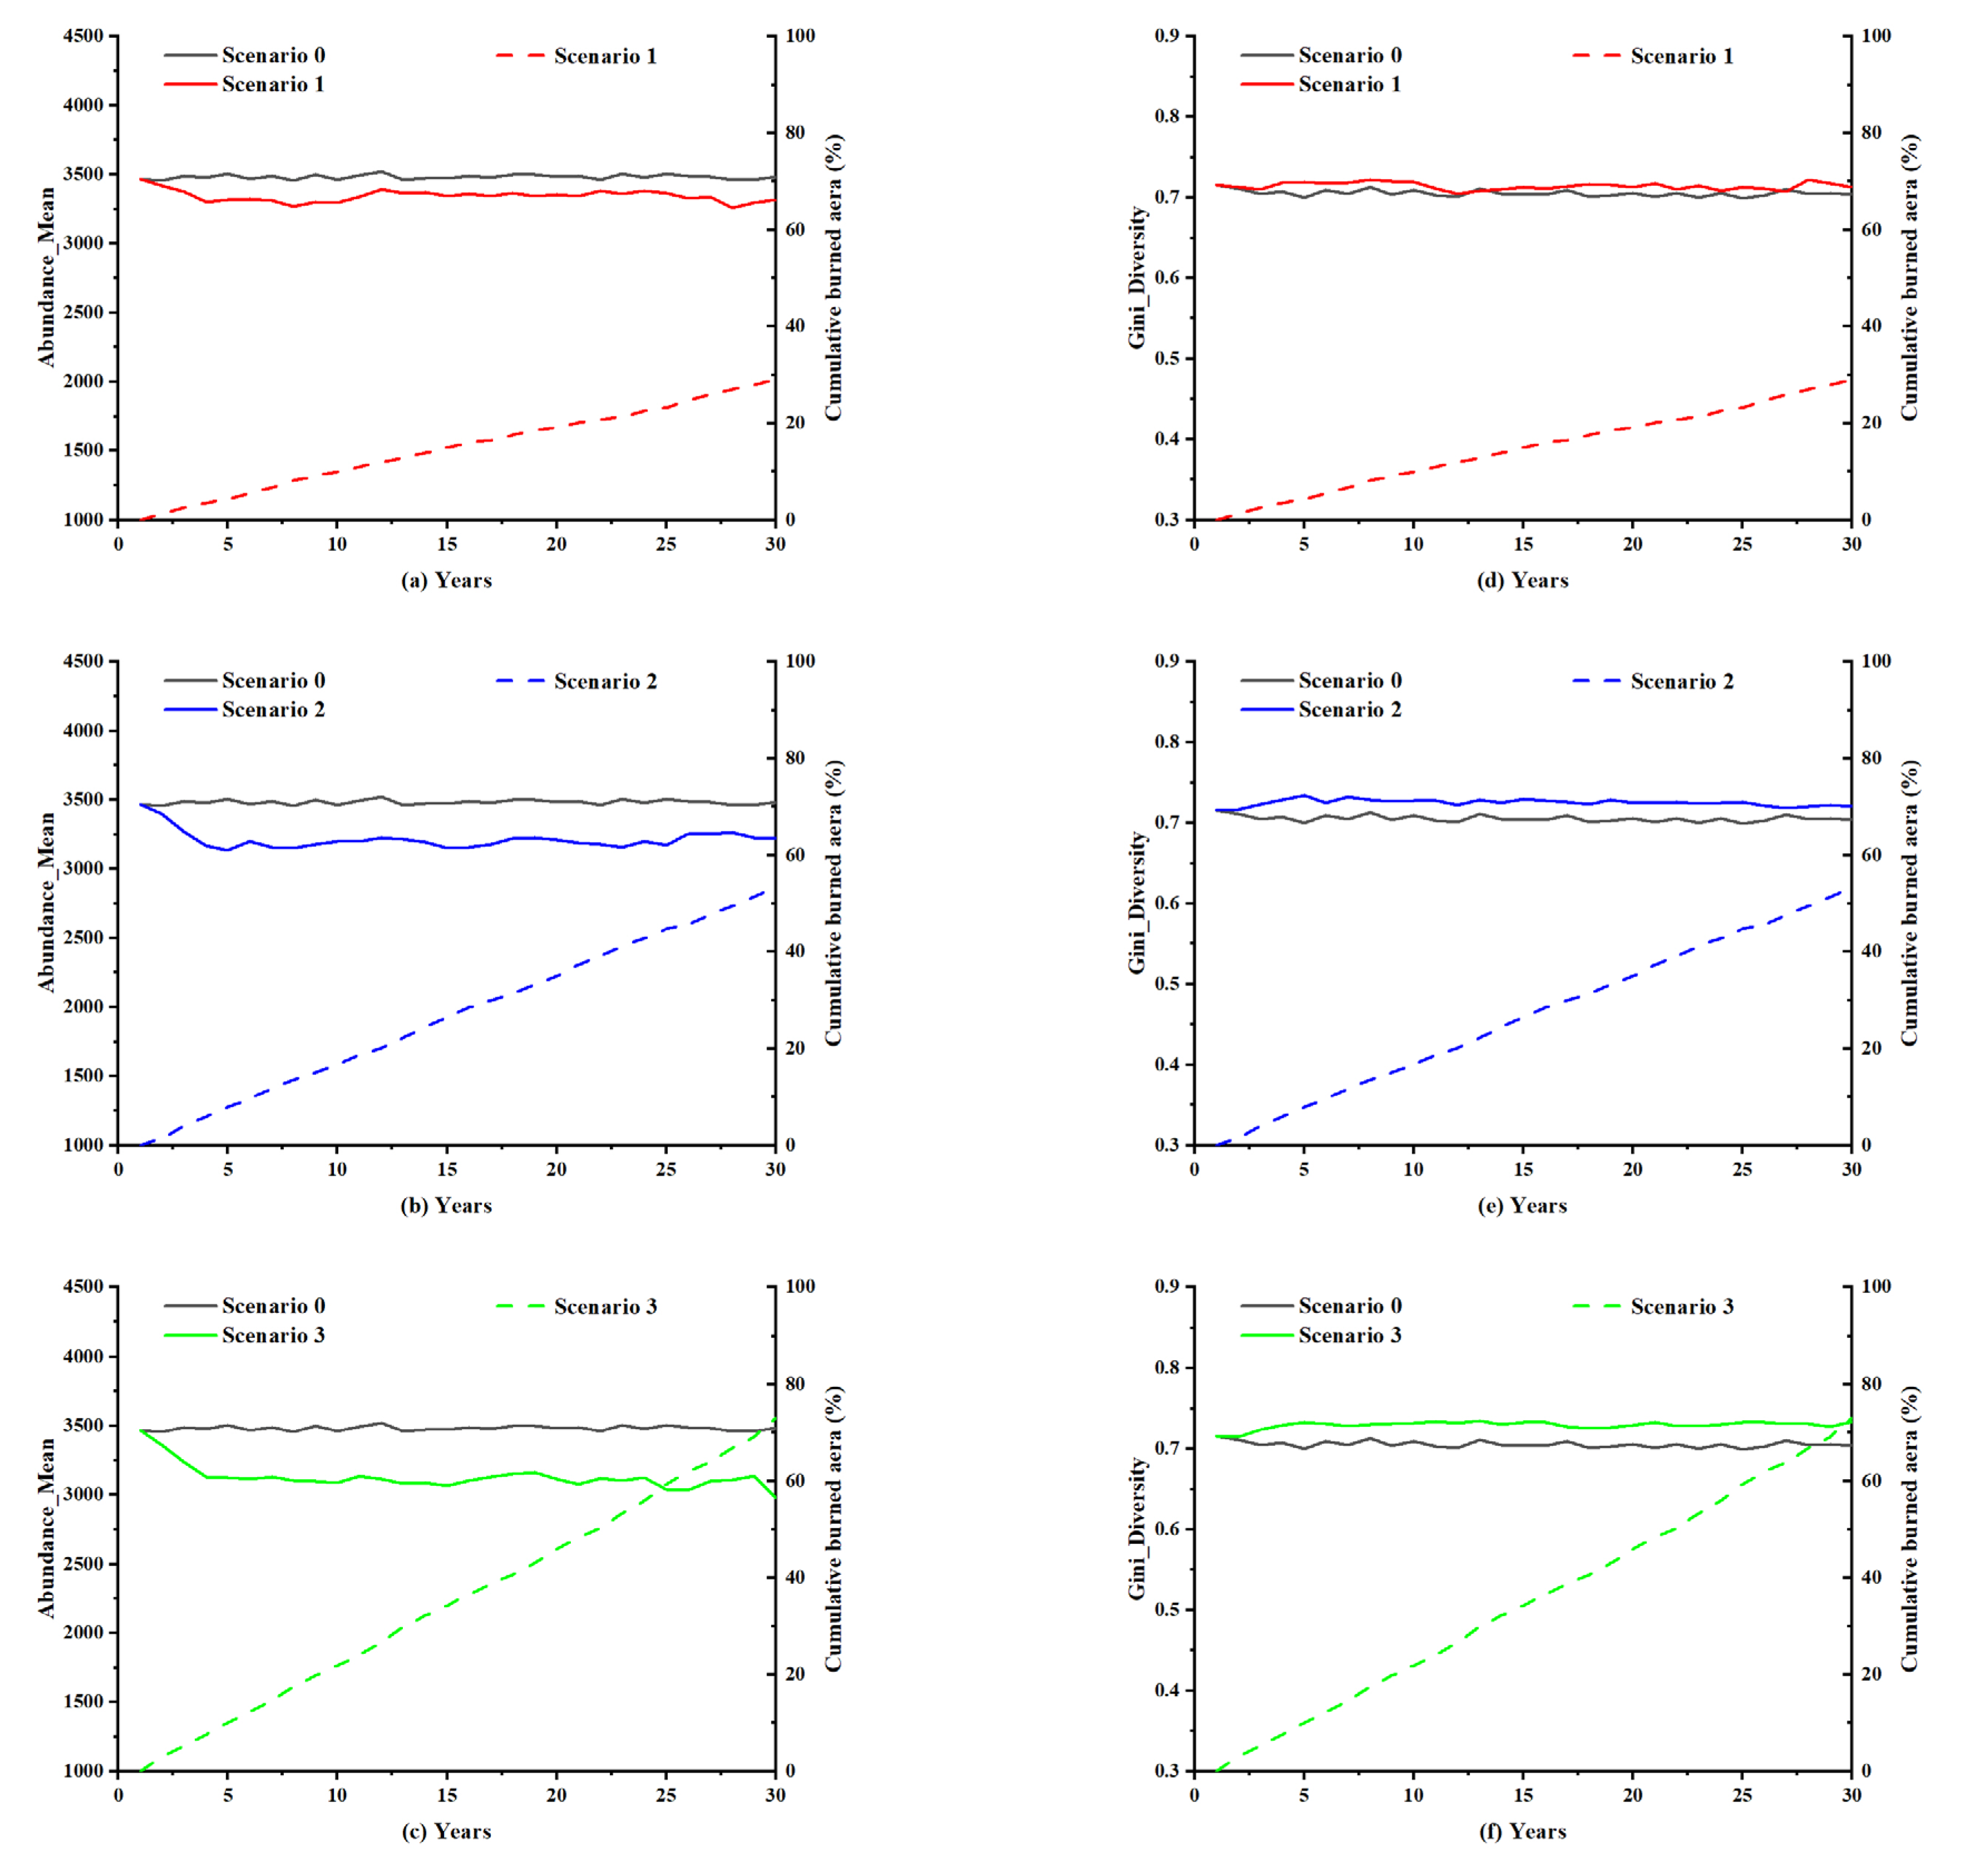
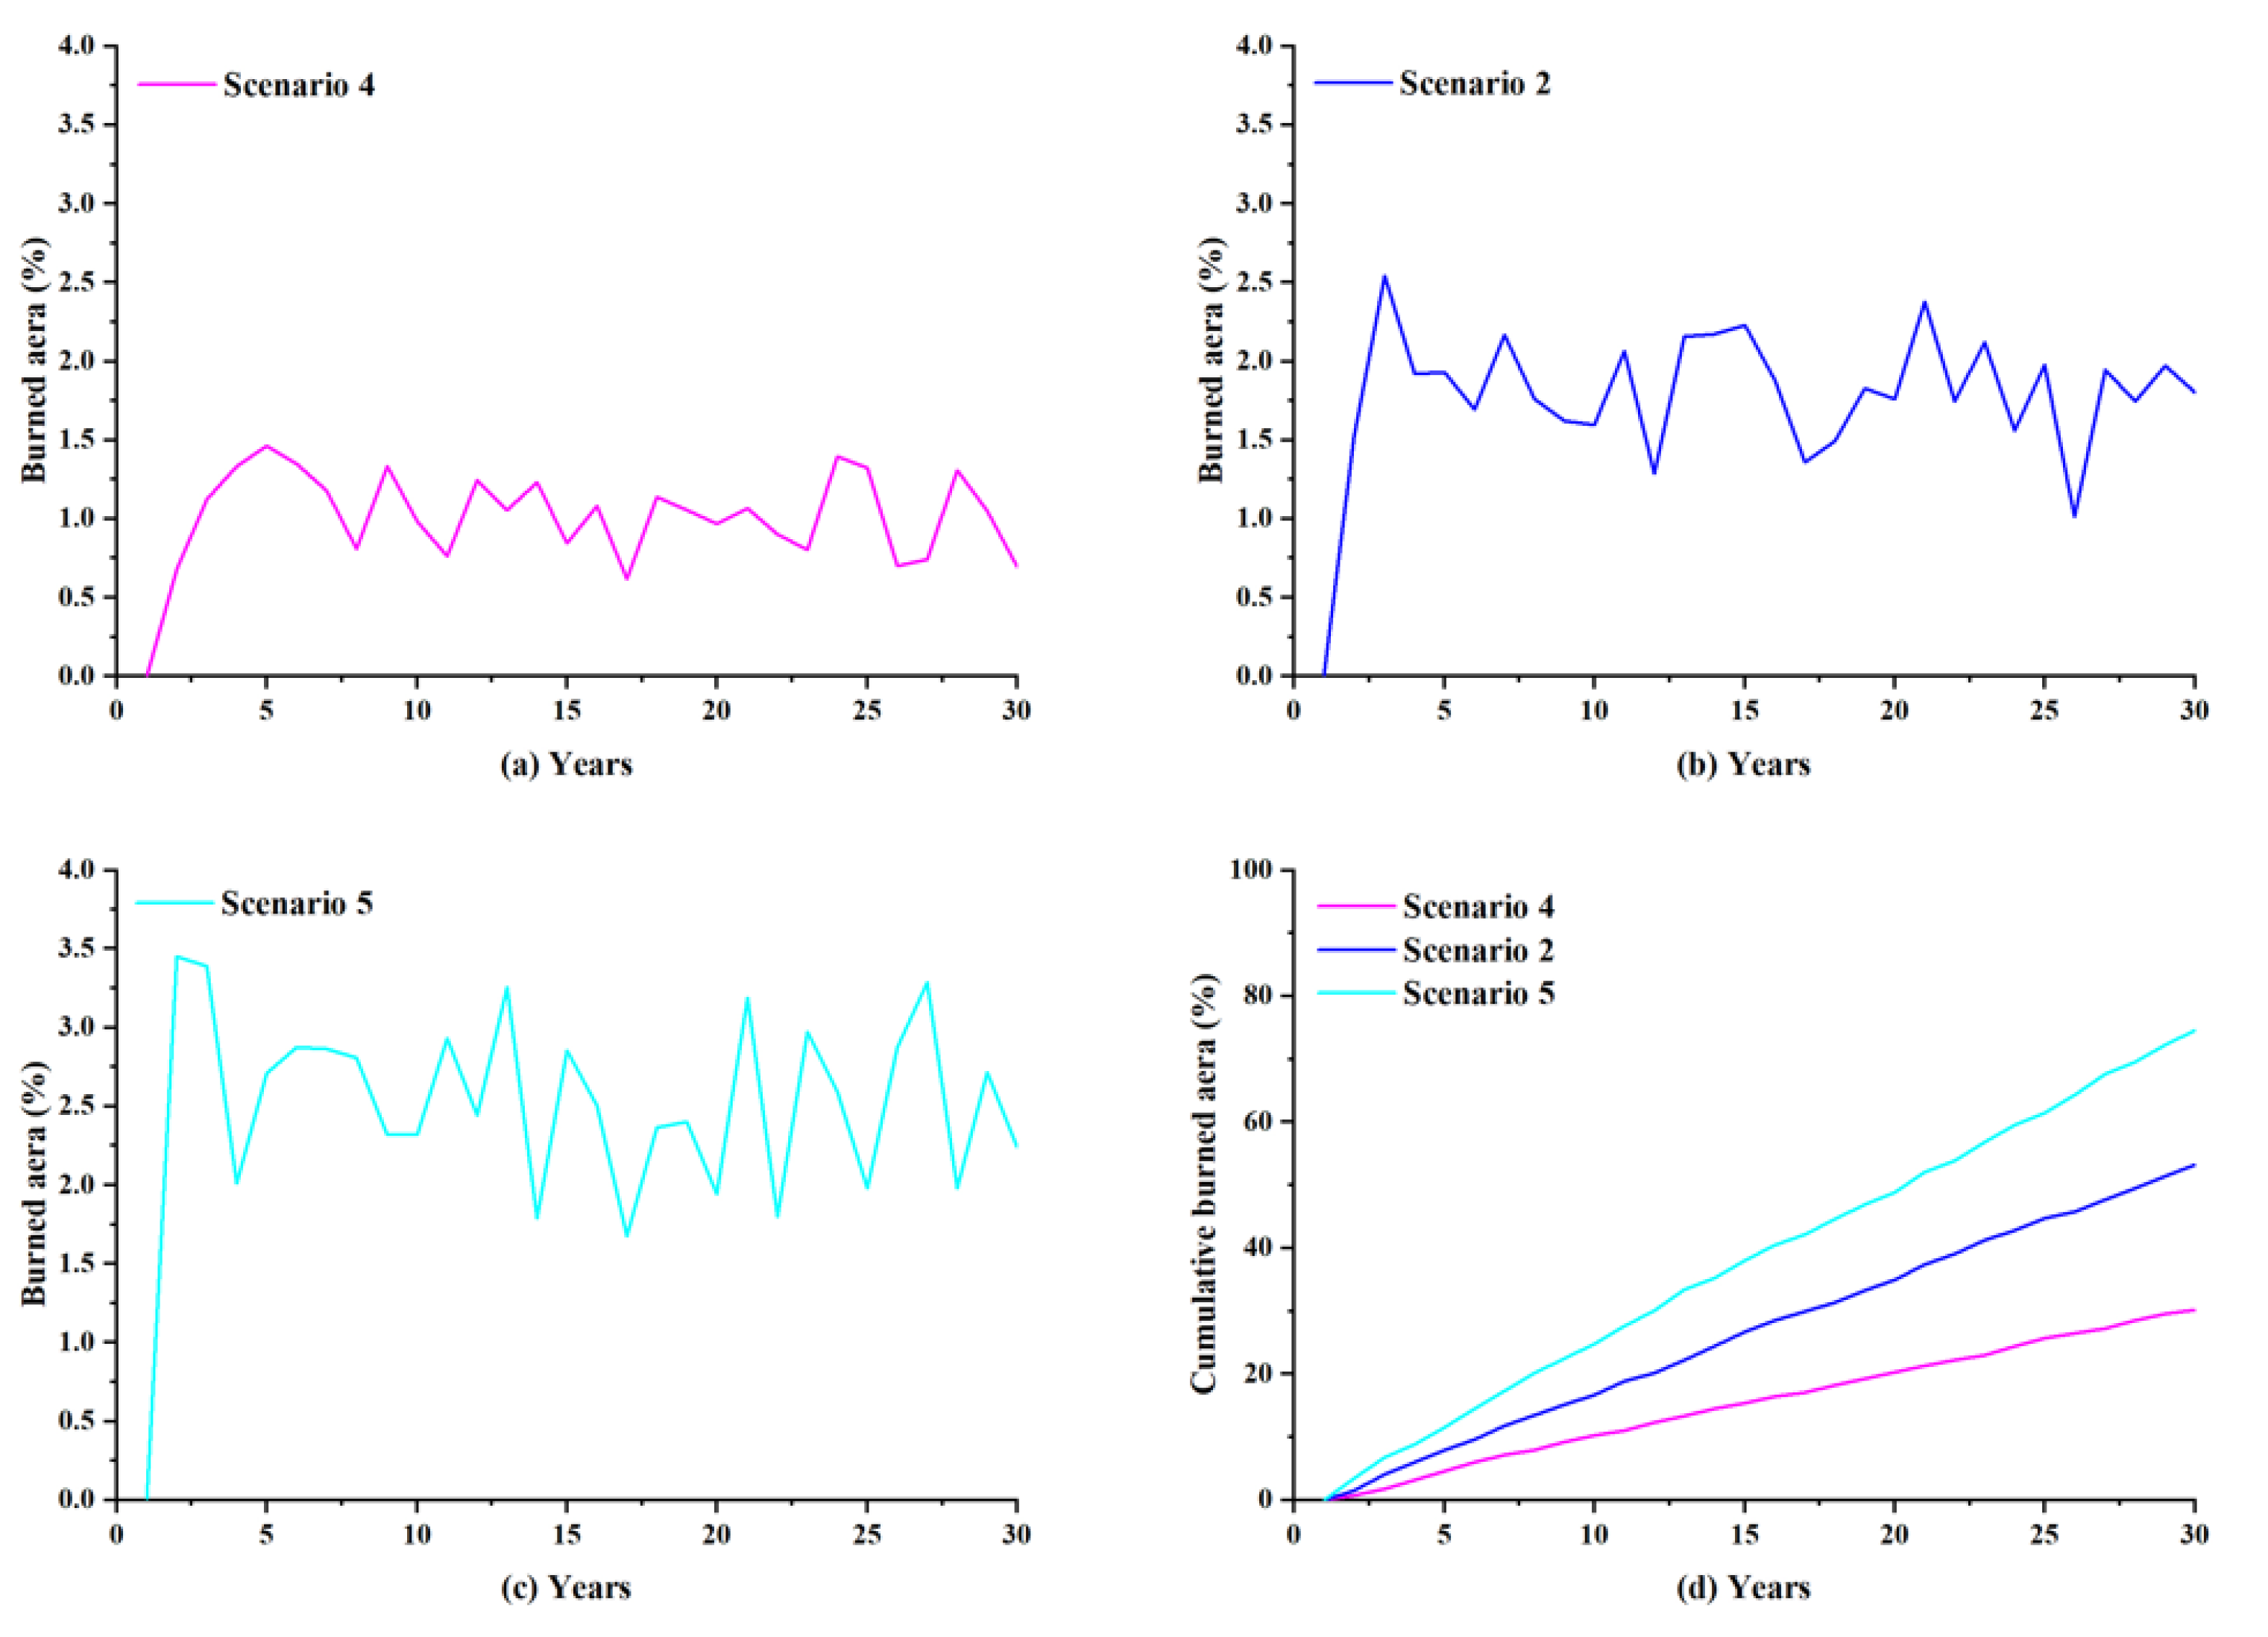
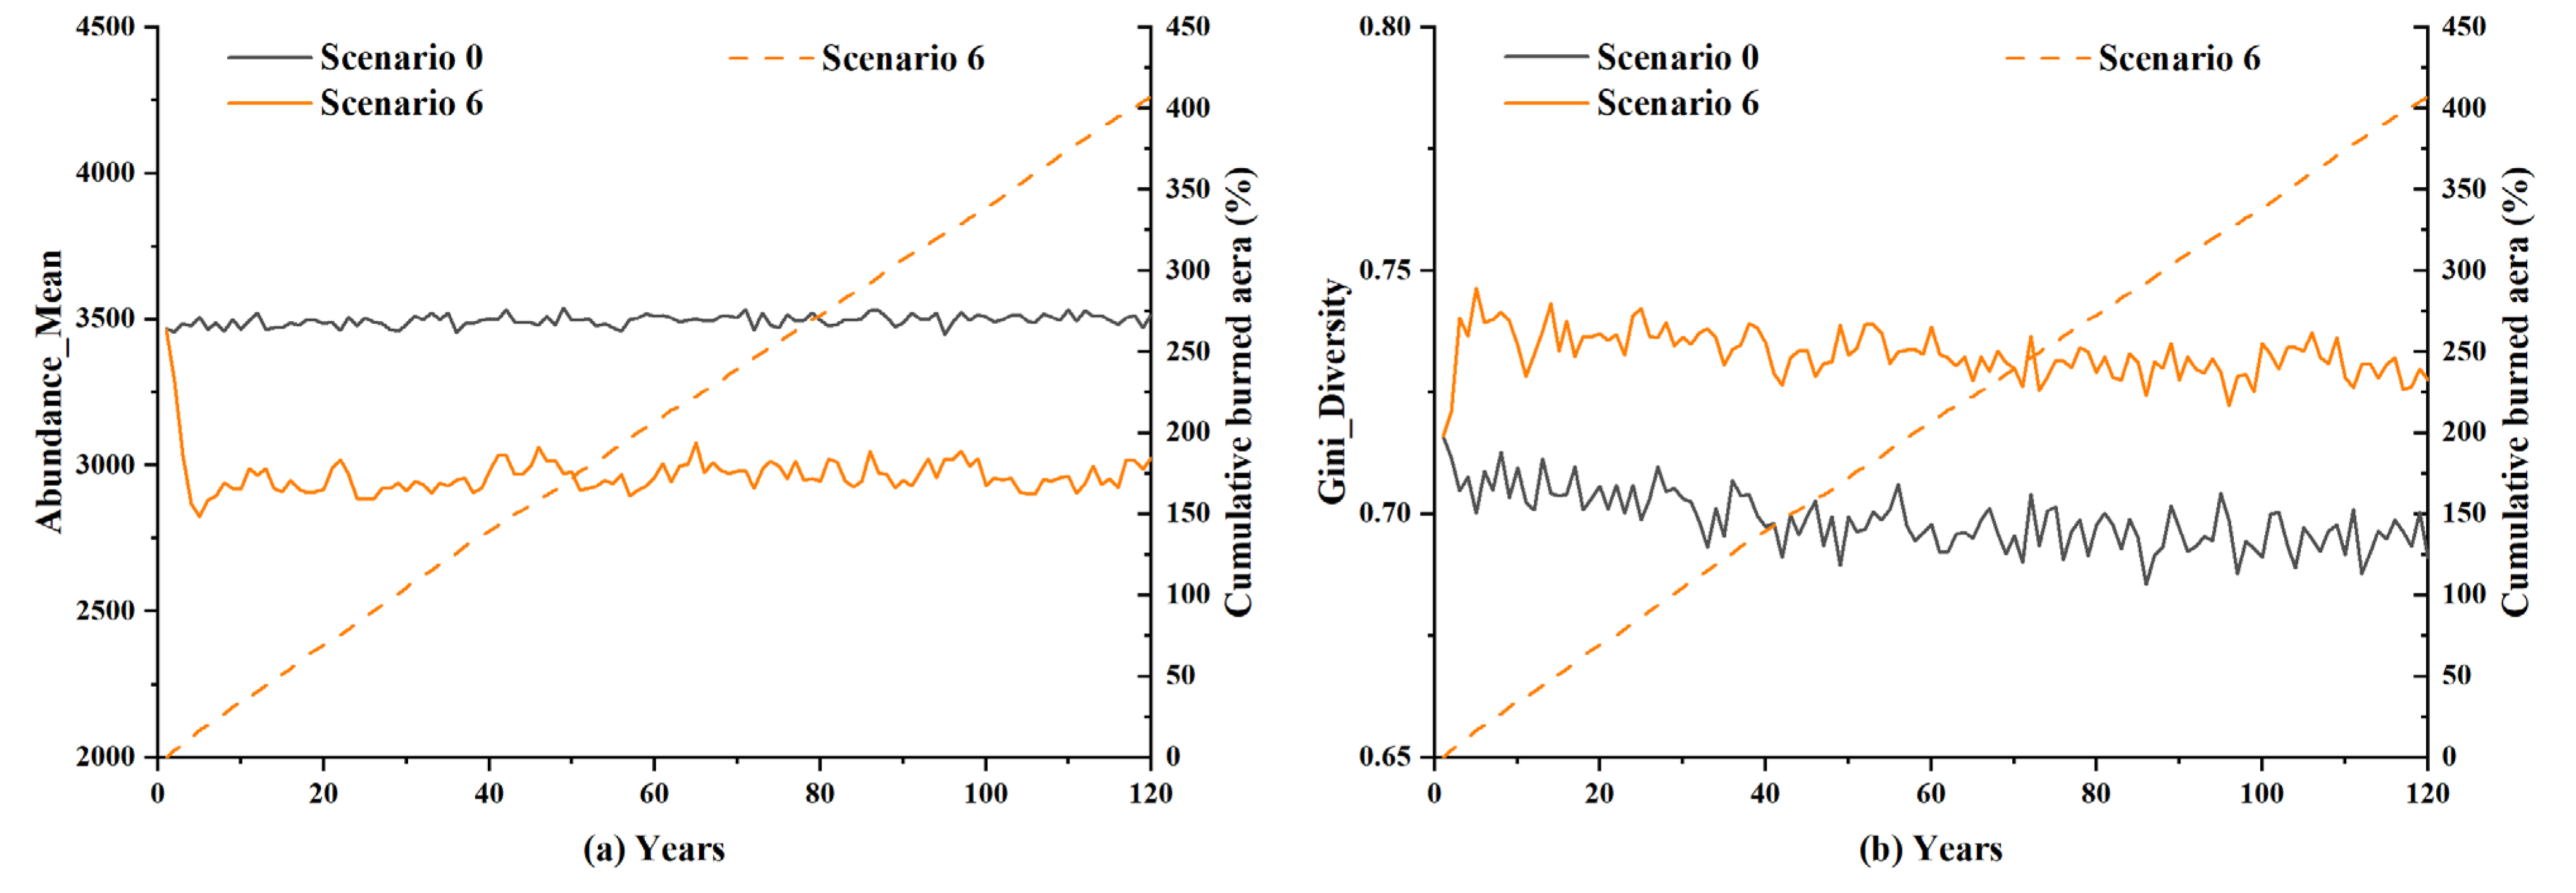
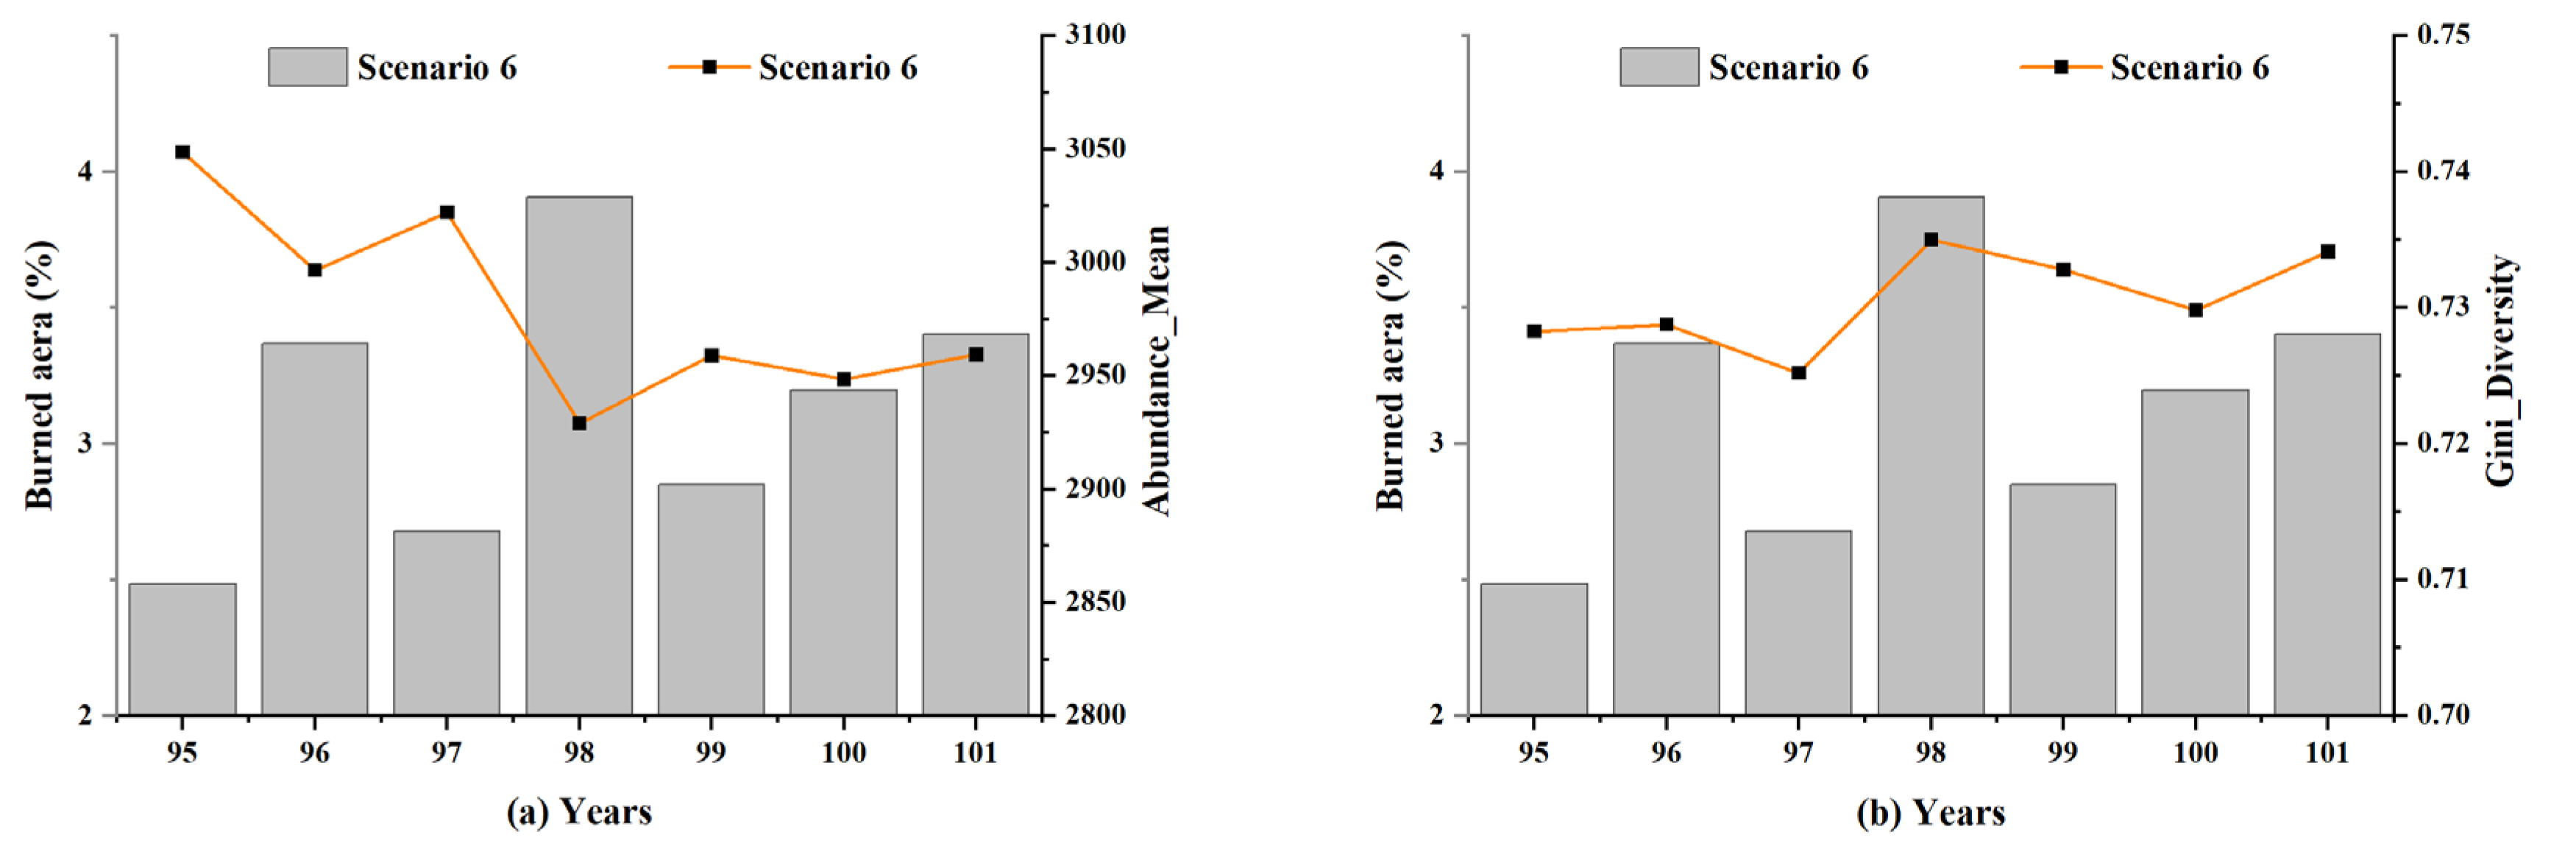
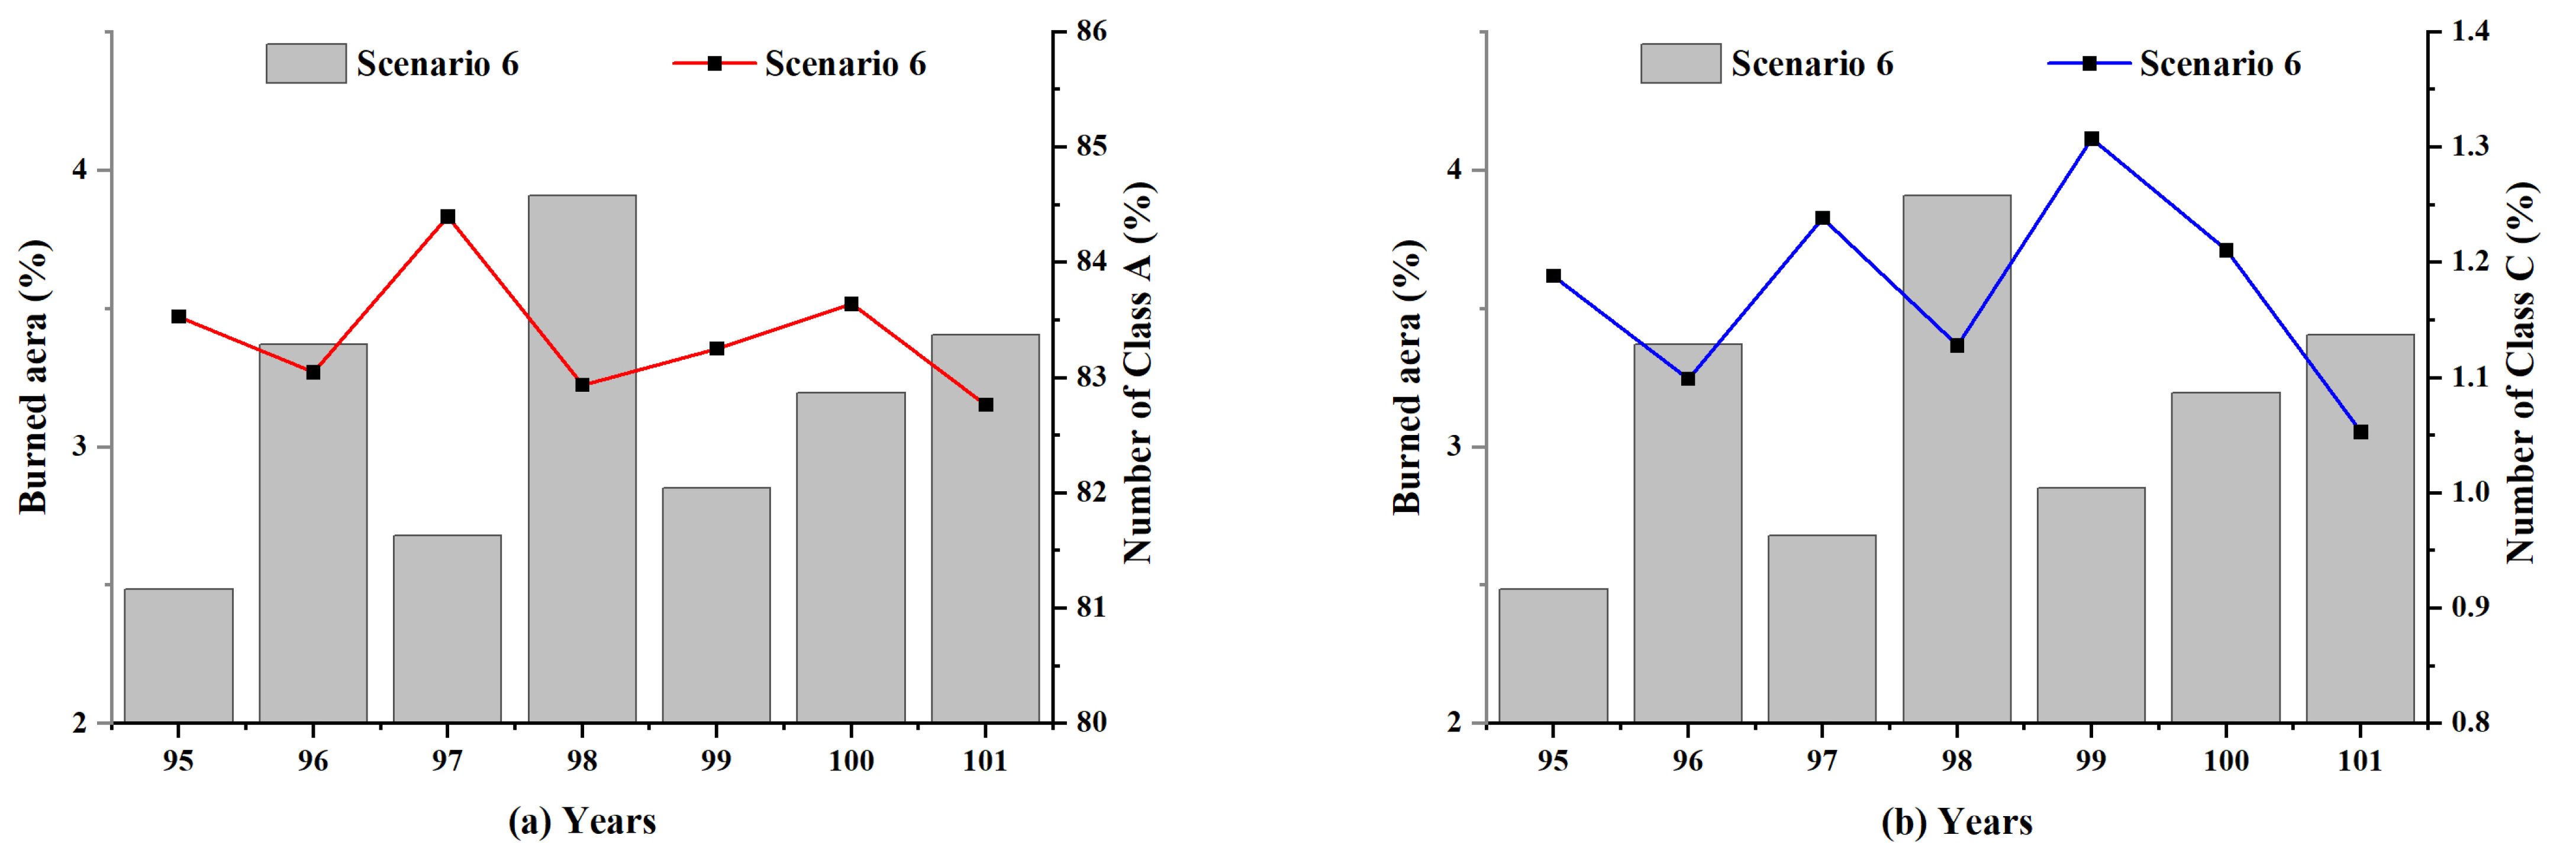
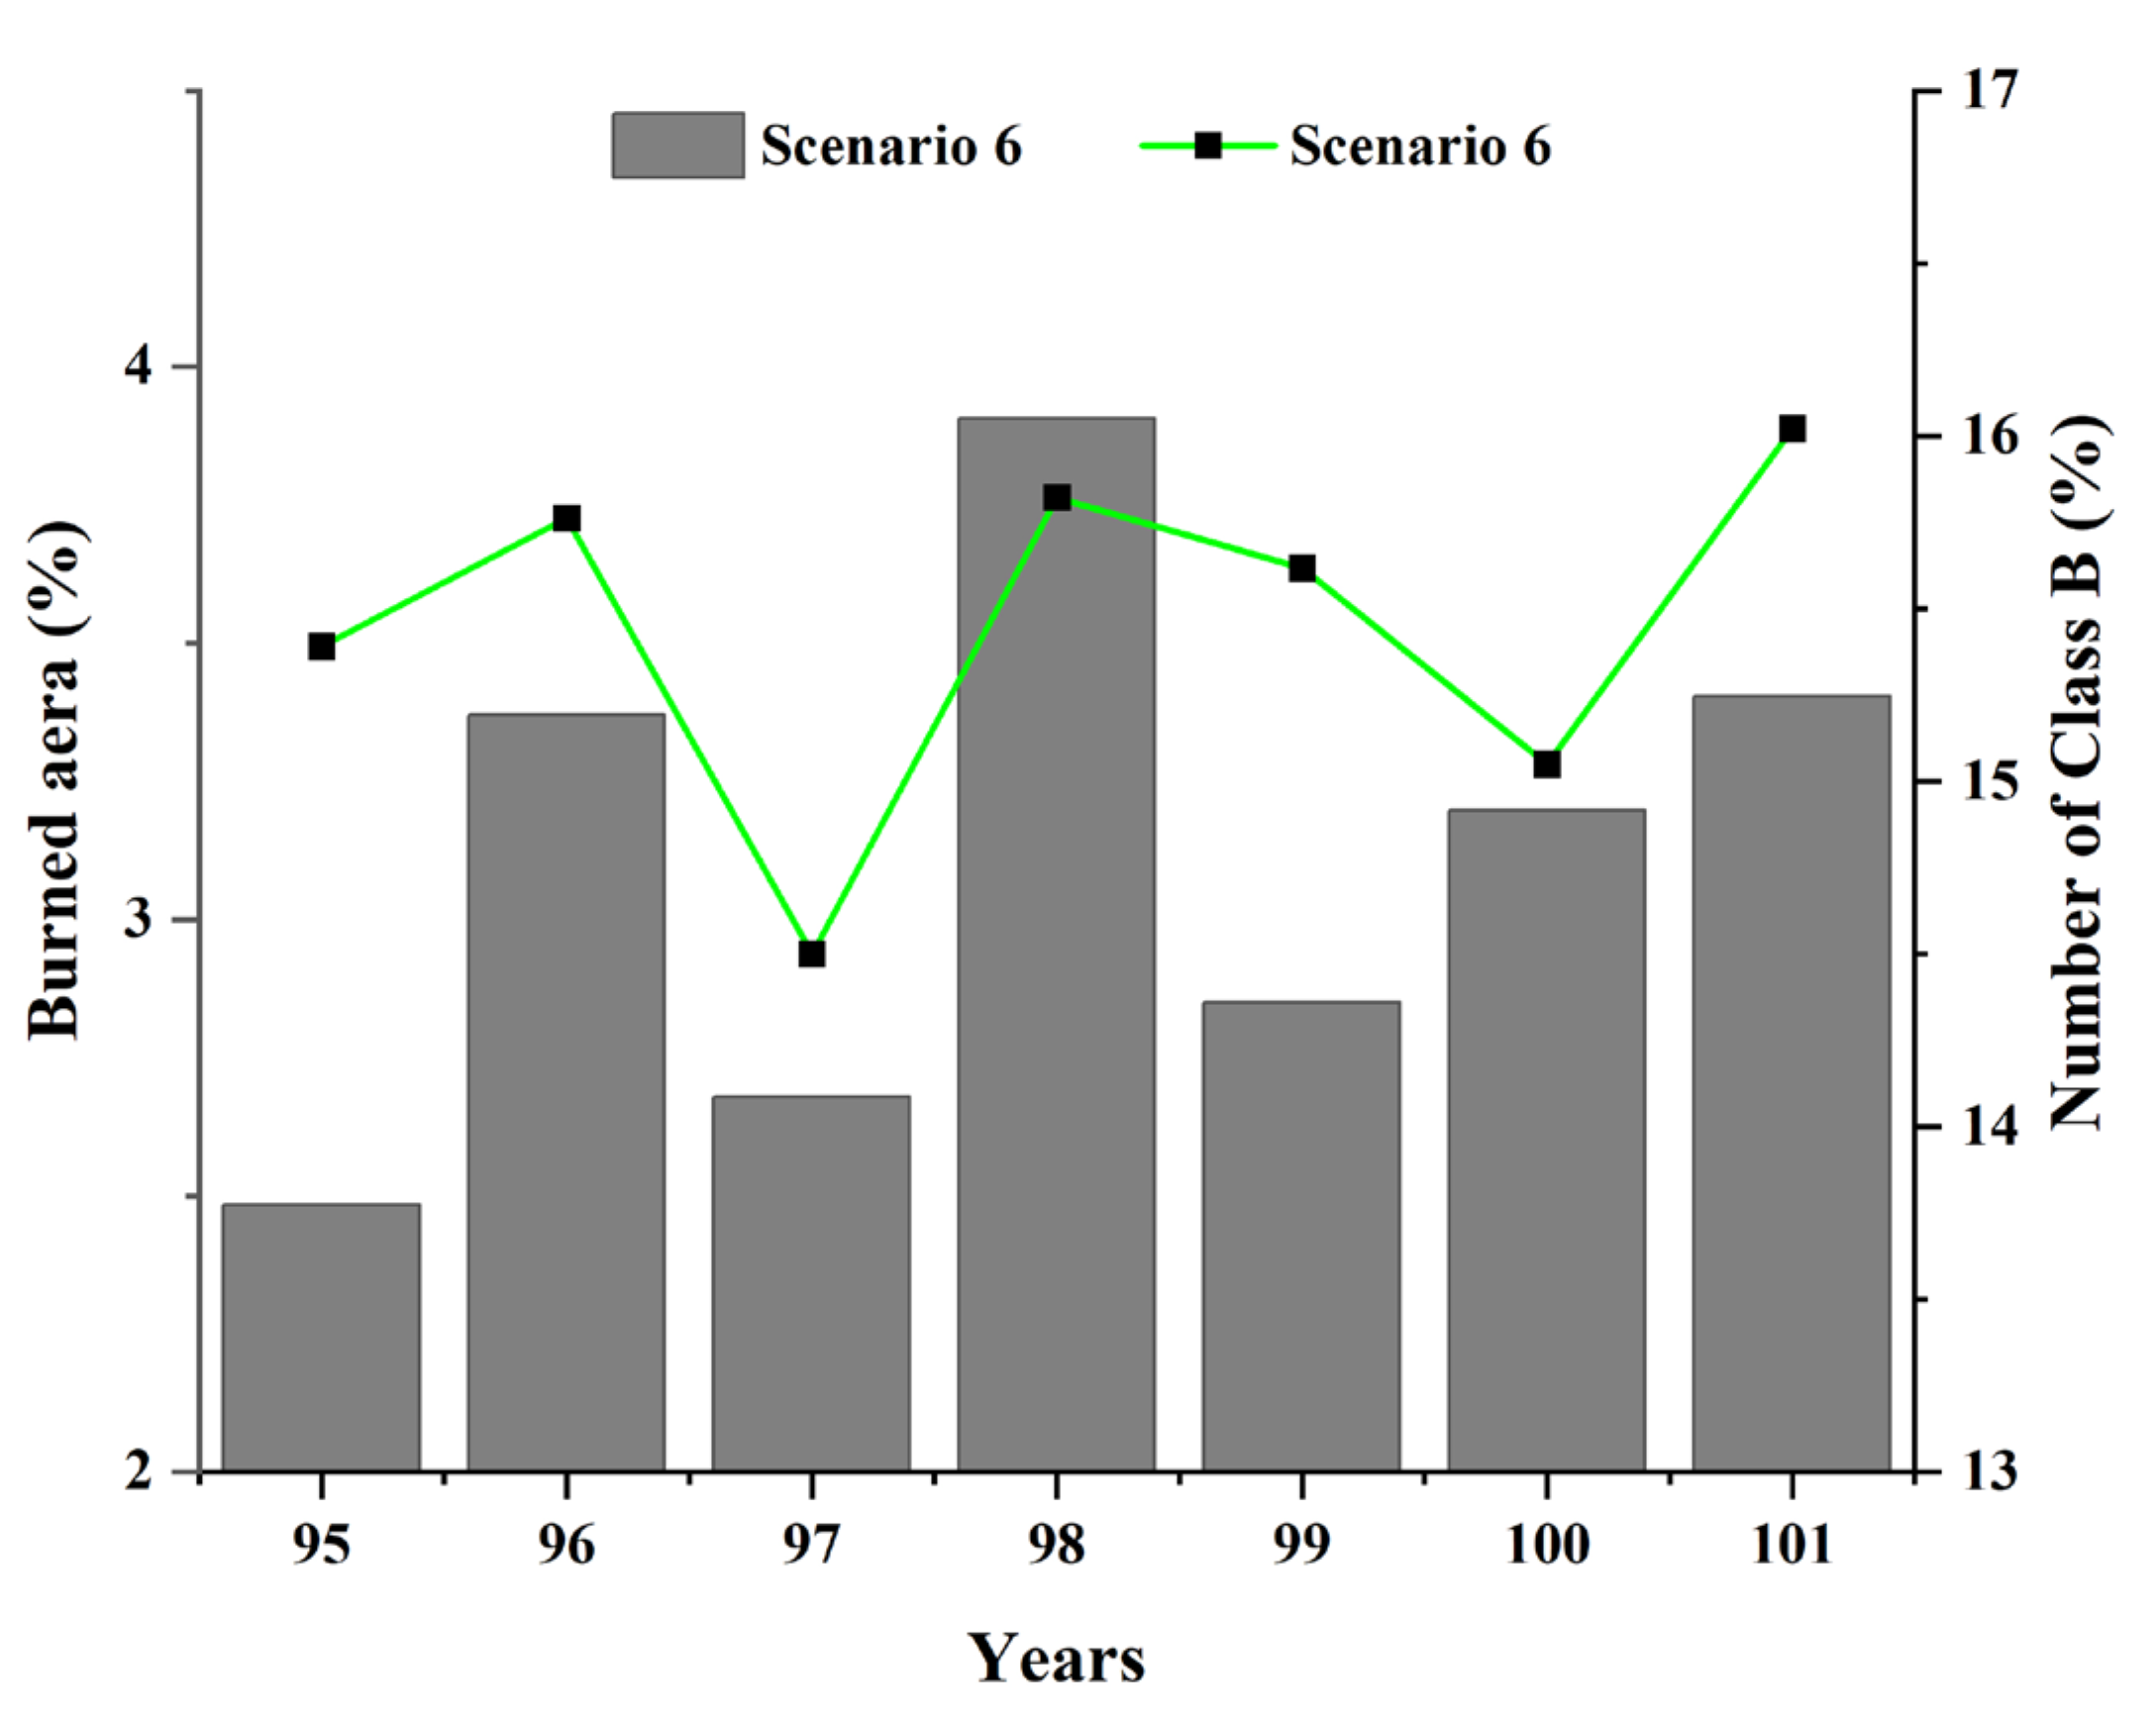
Table 1.
Environmental parameters settings related to lightning.
| Scenario | Explanation | Forest Scenario Represented |
|---|---|---|
| Scenario 0 | Lightning density = 0, lightning-caused fire efficiency = 0 | No fire |
| Scenario 1 | Lightning density U(0,1), lightning-caused fire efficiency U(0.03, 0.05) | Low lightning susceptibility, Medium flammability; |
| Scenario 2 | Lightning density U(0,2), lightning-caused fire efficiency U(0.03, 0.05) | Medium lightning susceptibility, Medium flammability; |
| Scenario 3 | Lightning density U(0,3), lightning-caused fire efficiency U(0.03, 0.05) | High lightning susceptibility, Medium flammability; |
| Scenario 4 | Lightning density U(0,2), lightning-caused fire efficiency U(0.01, 0.03) | Medium lightning susceptibility, Low flammability; |
| Scenario 5 | Lightning density U(0,2), lightning-caused fire efficiency U(0.05, 0.07) | Medium lightning susceptibility, High flammability; |
| Scenario 6 | Lightning density U(0,3), lightning-caused fire efficiency U(0.05, 0.07) | Medium lightning susceptibility, High flammability; |
Table 2.
The values of constants in stimulation experiments.
| Contants | Values | Contants | Values |
|---|---|---|---|
| 1.25 | |||
| 0.75 | 0.5 | ||
| 0.7 | 0.4 | ||
| 1 | 1000 | ||
| 0.7 | 1000 | ||
| 0.4 |
Table 3.
Classification of the species.
| Classification | Species | Quantitative Population |
|---|---|---|
| Class A | 1, 2, 3 | 87.6% |
| Class B | 4, 5, 6 | 11% |
| Class C | 7, 8, 9, 10 | 1.4% |
Disclaimer/Publisher’s Note: The statements, opinions and data contained in all publications are solely those of the individual author(s) and contributor(s) and not of MDPI and/or the editor(s). MDPI and/or the editor(s) disclaim responsibility for any injury to people or property resulting from any ideas, methods, instructions or products referred to in the content. |
© 2023 by the authors. Licensee MDPI, Basel, Switzerland. This article is an open access article distributed under the terms and conditions of the Creative Commons Attribution (CC BY) license (https://creativecommons.org/licenses/by/4.0/).
Share and Cite
MDPI and ACS Style
Ouyang, Z.; Wang, S.; Du, N. Simulation Study of an Abstract Forest Ecosystem with Multi-Species under Lightning-Caused Fires. Fire 2023, 6, 308. https://doi.org/10.3390/fire6080308
AMA Style
Ouyang Z, Wang S, Du N. Simulation Study of an Abstract Forest Ecosystem with Multi-Species under Lightning-Caused Fires. Fire. 2023; 6(8):308. https://doi.org/10.3390/fire6080308
Chicago/Turabian StyleOuyang, Zhi, Shiying Wang, and Nisuo Du. 2023. "Simulation Study of an Abstract Forest Ecosystem with Multi-Species under Lightning-Caused Fires" Fire 6, no. 8: 308. https://doi.org/10.3390/fire6080308