
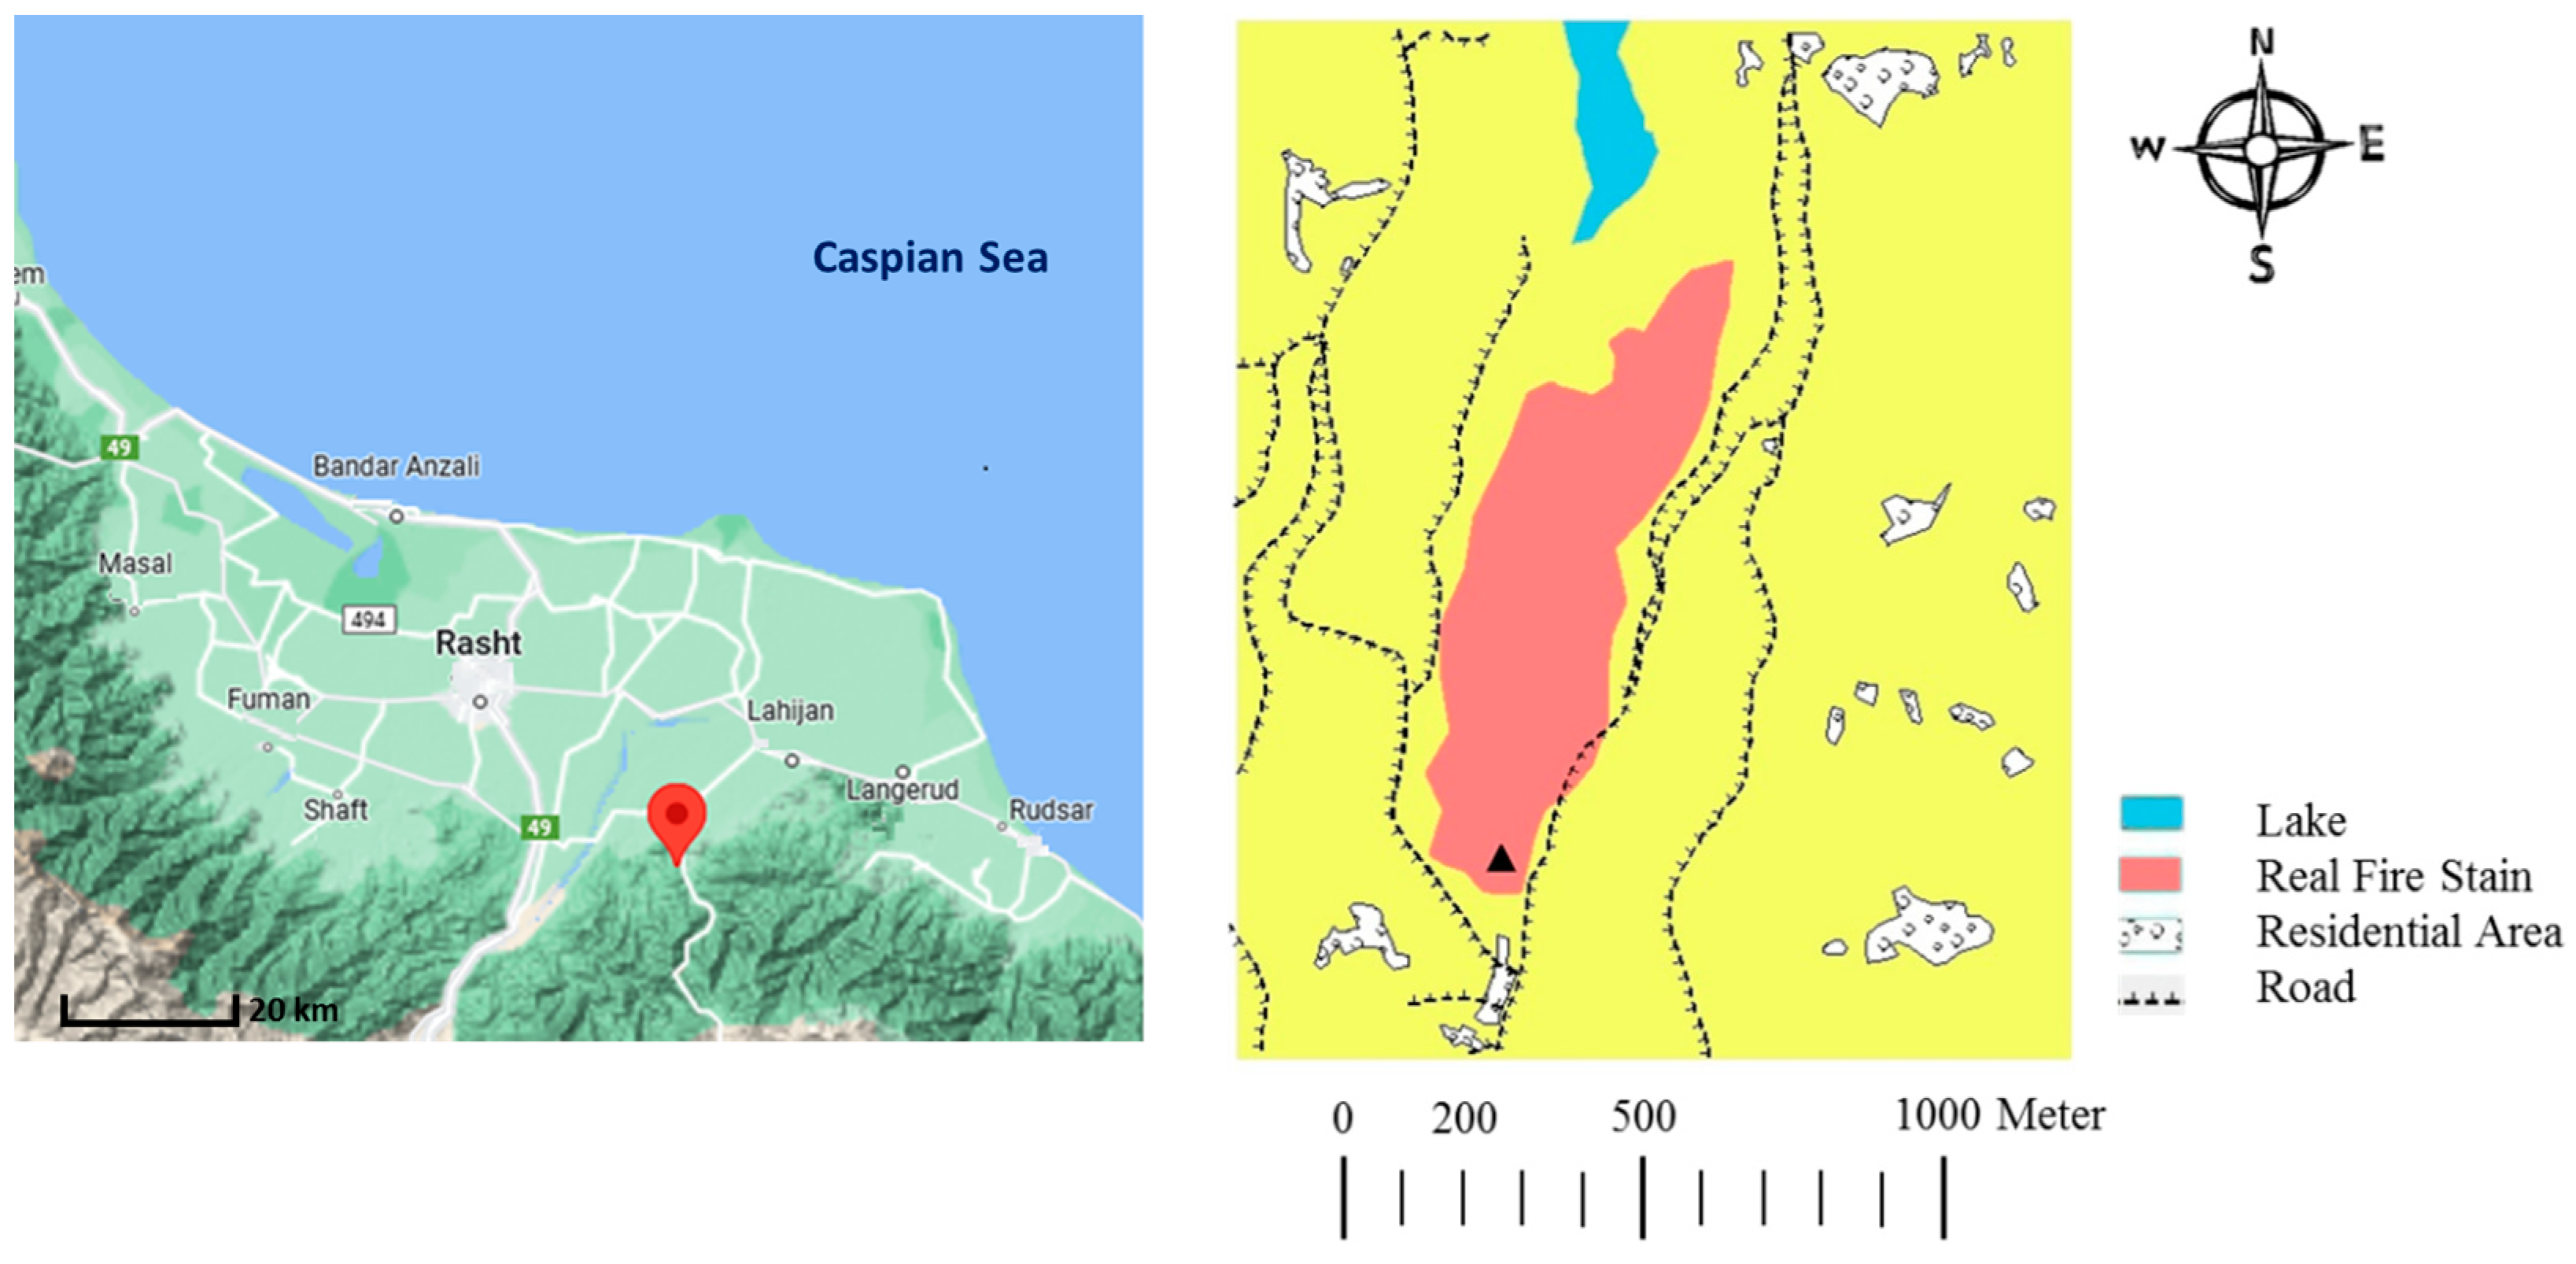
A Case Study on the Effects of Weather Conditions on Forest Fire Propagation Parameters in the Malekroud Forest in Guilan, Iran


Abstract
:1. Introduction
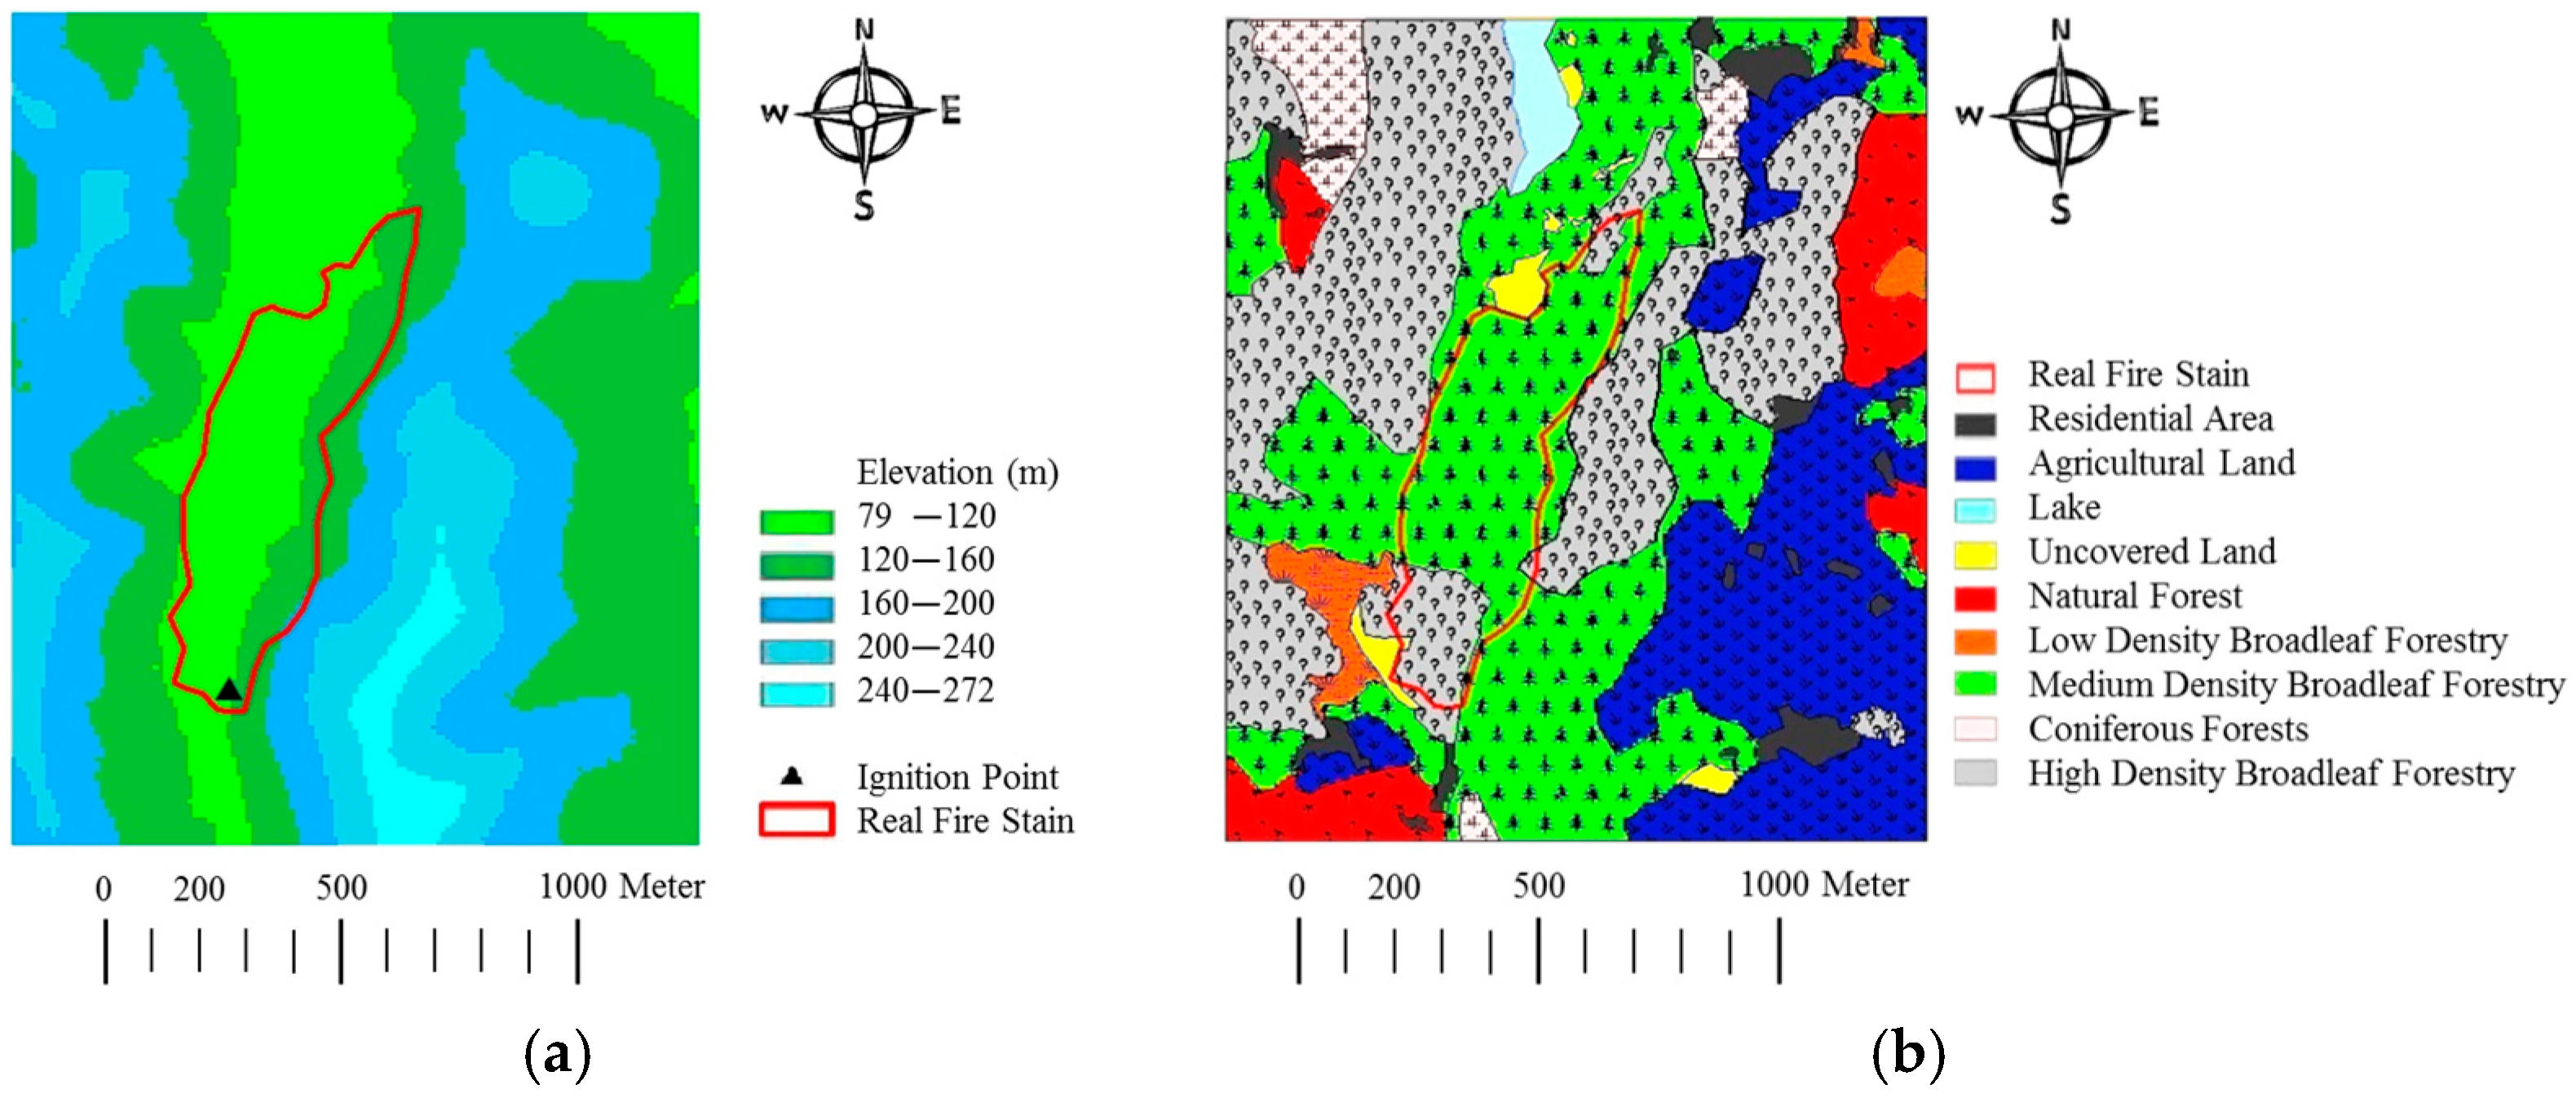
2. Materials and Methods
2.1. Evaluation Indexes
2.2. Metrological Data
3. Results
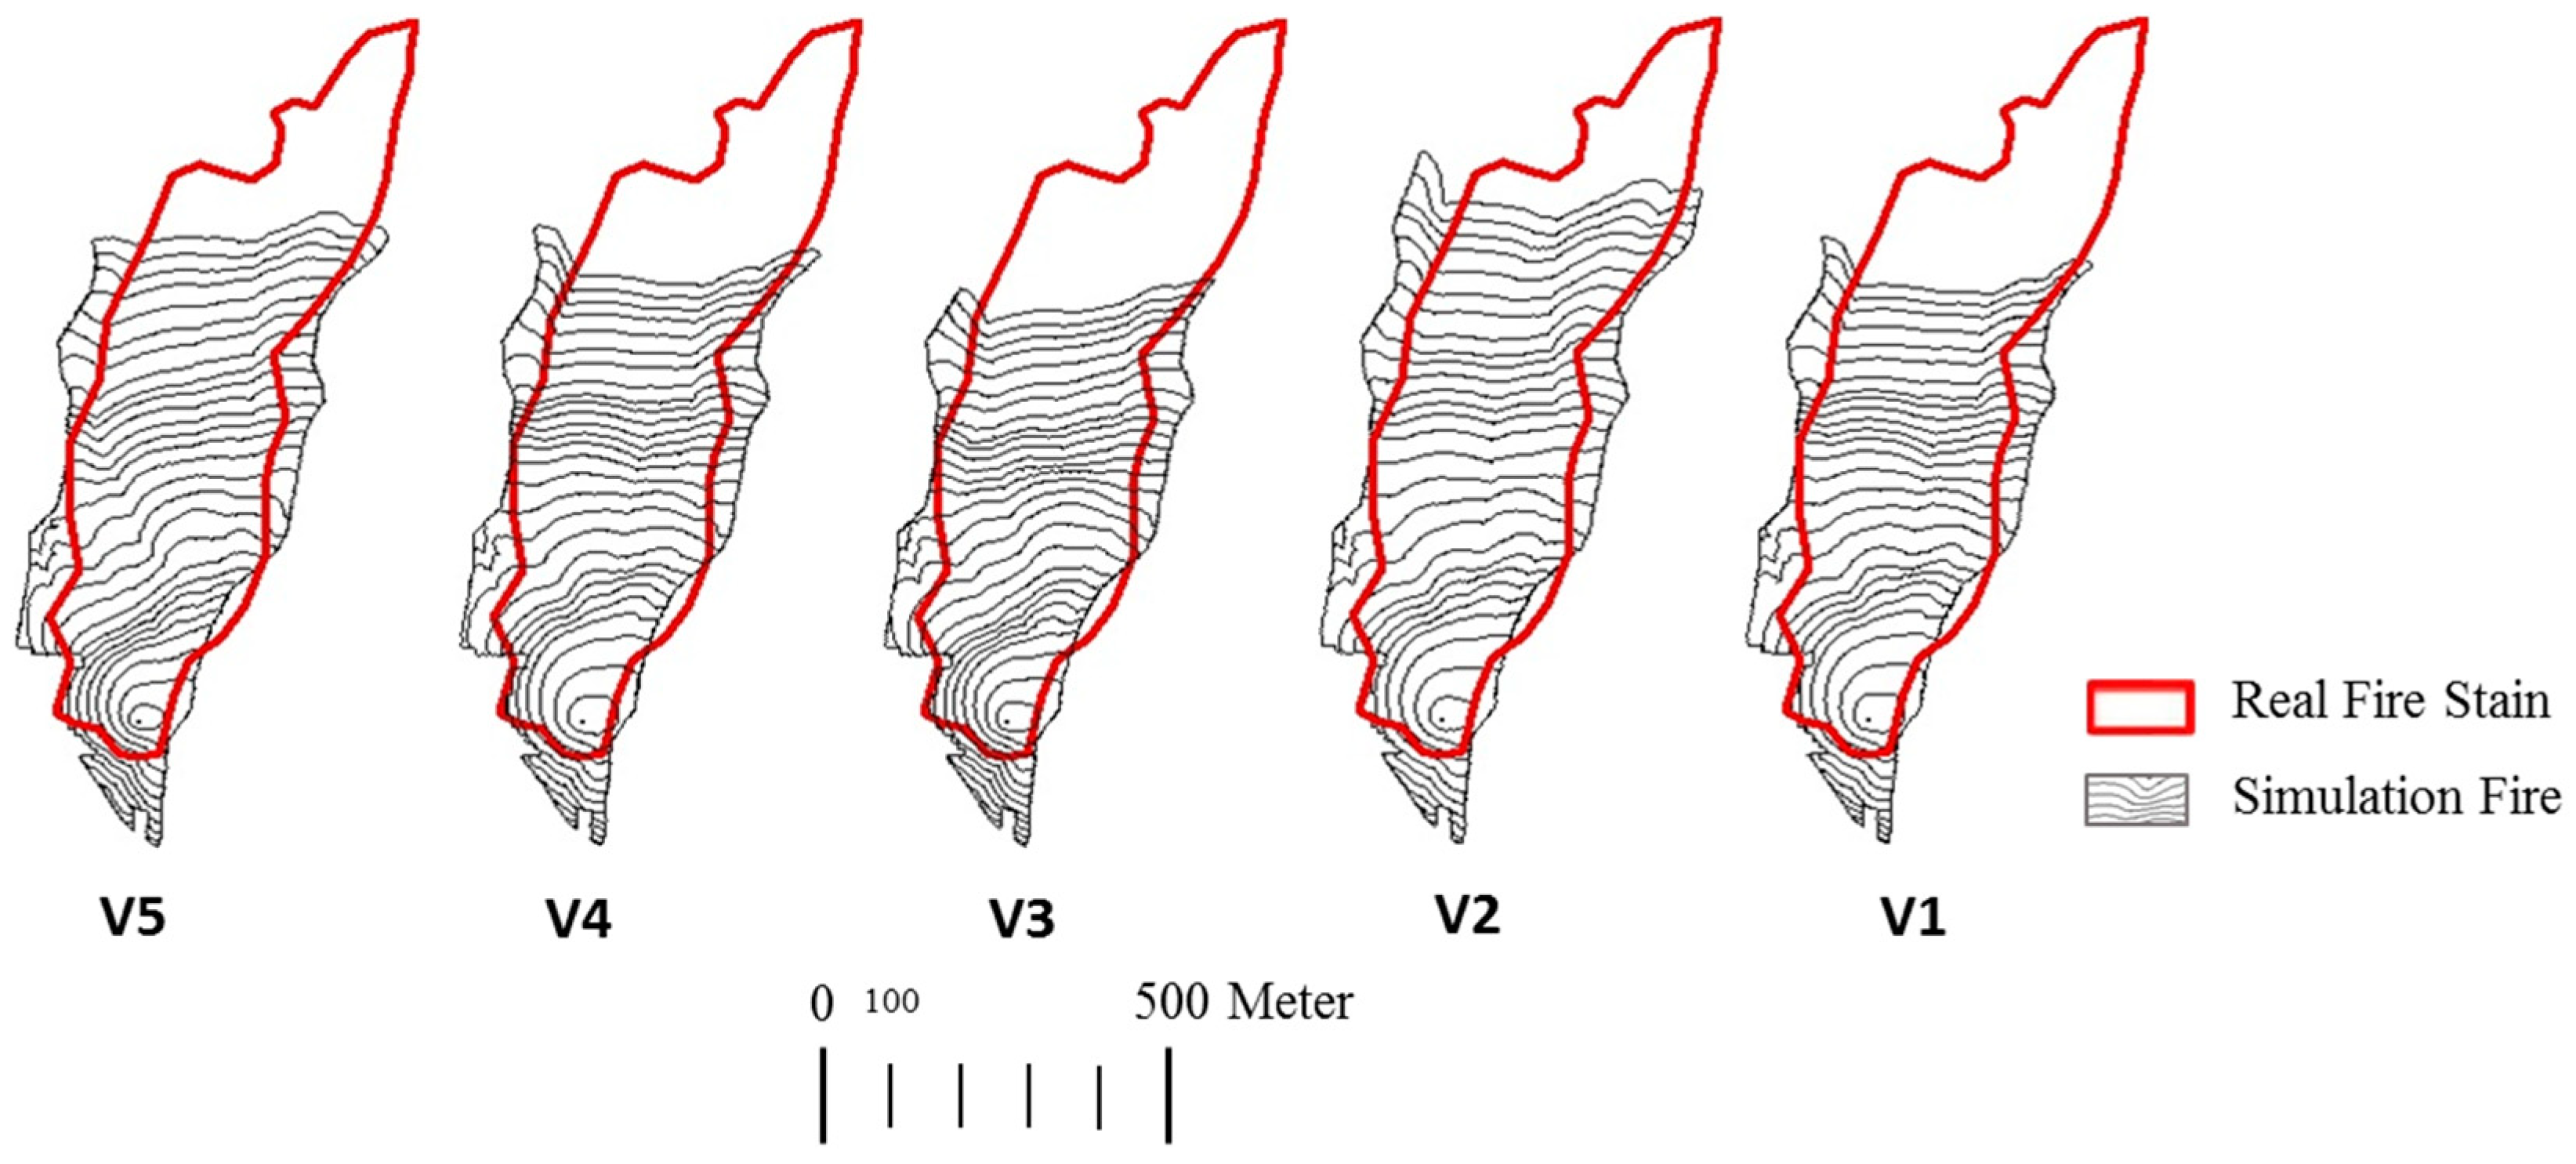
3.1. Validation Data

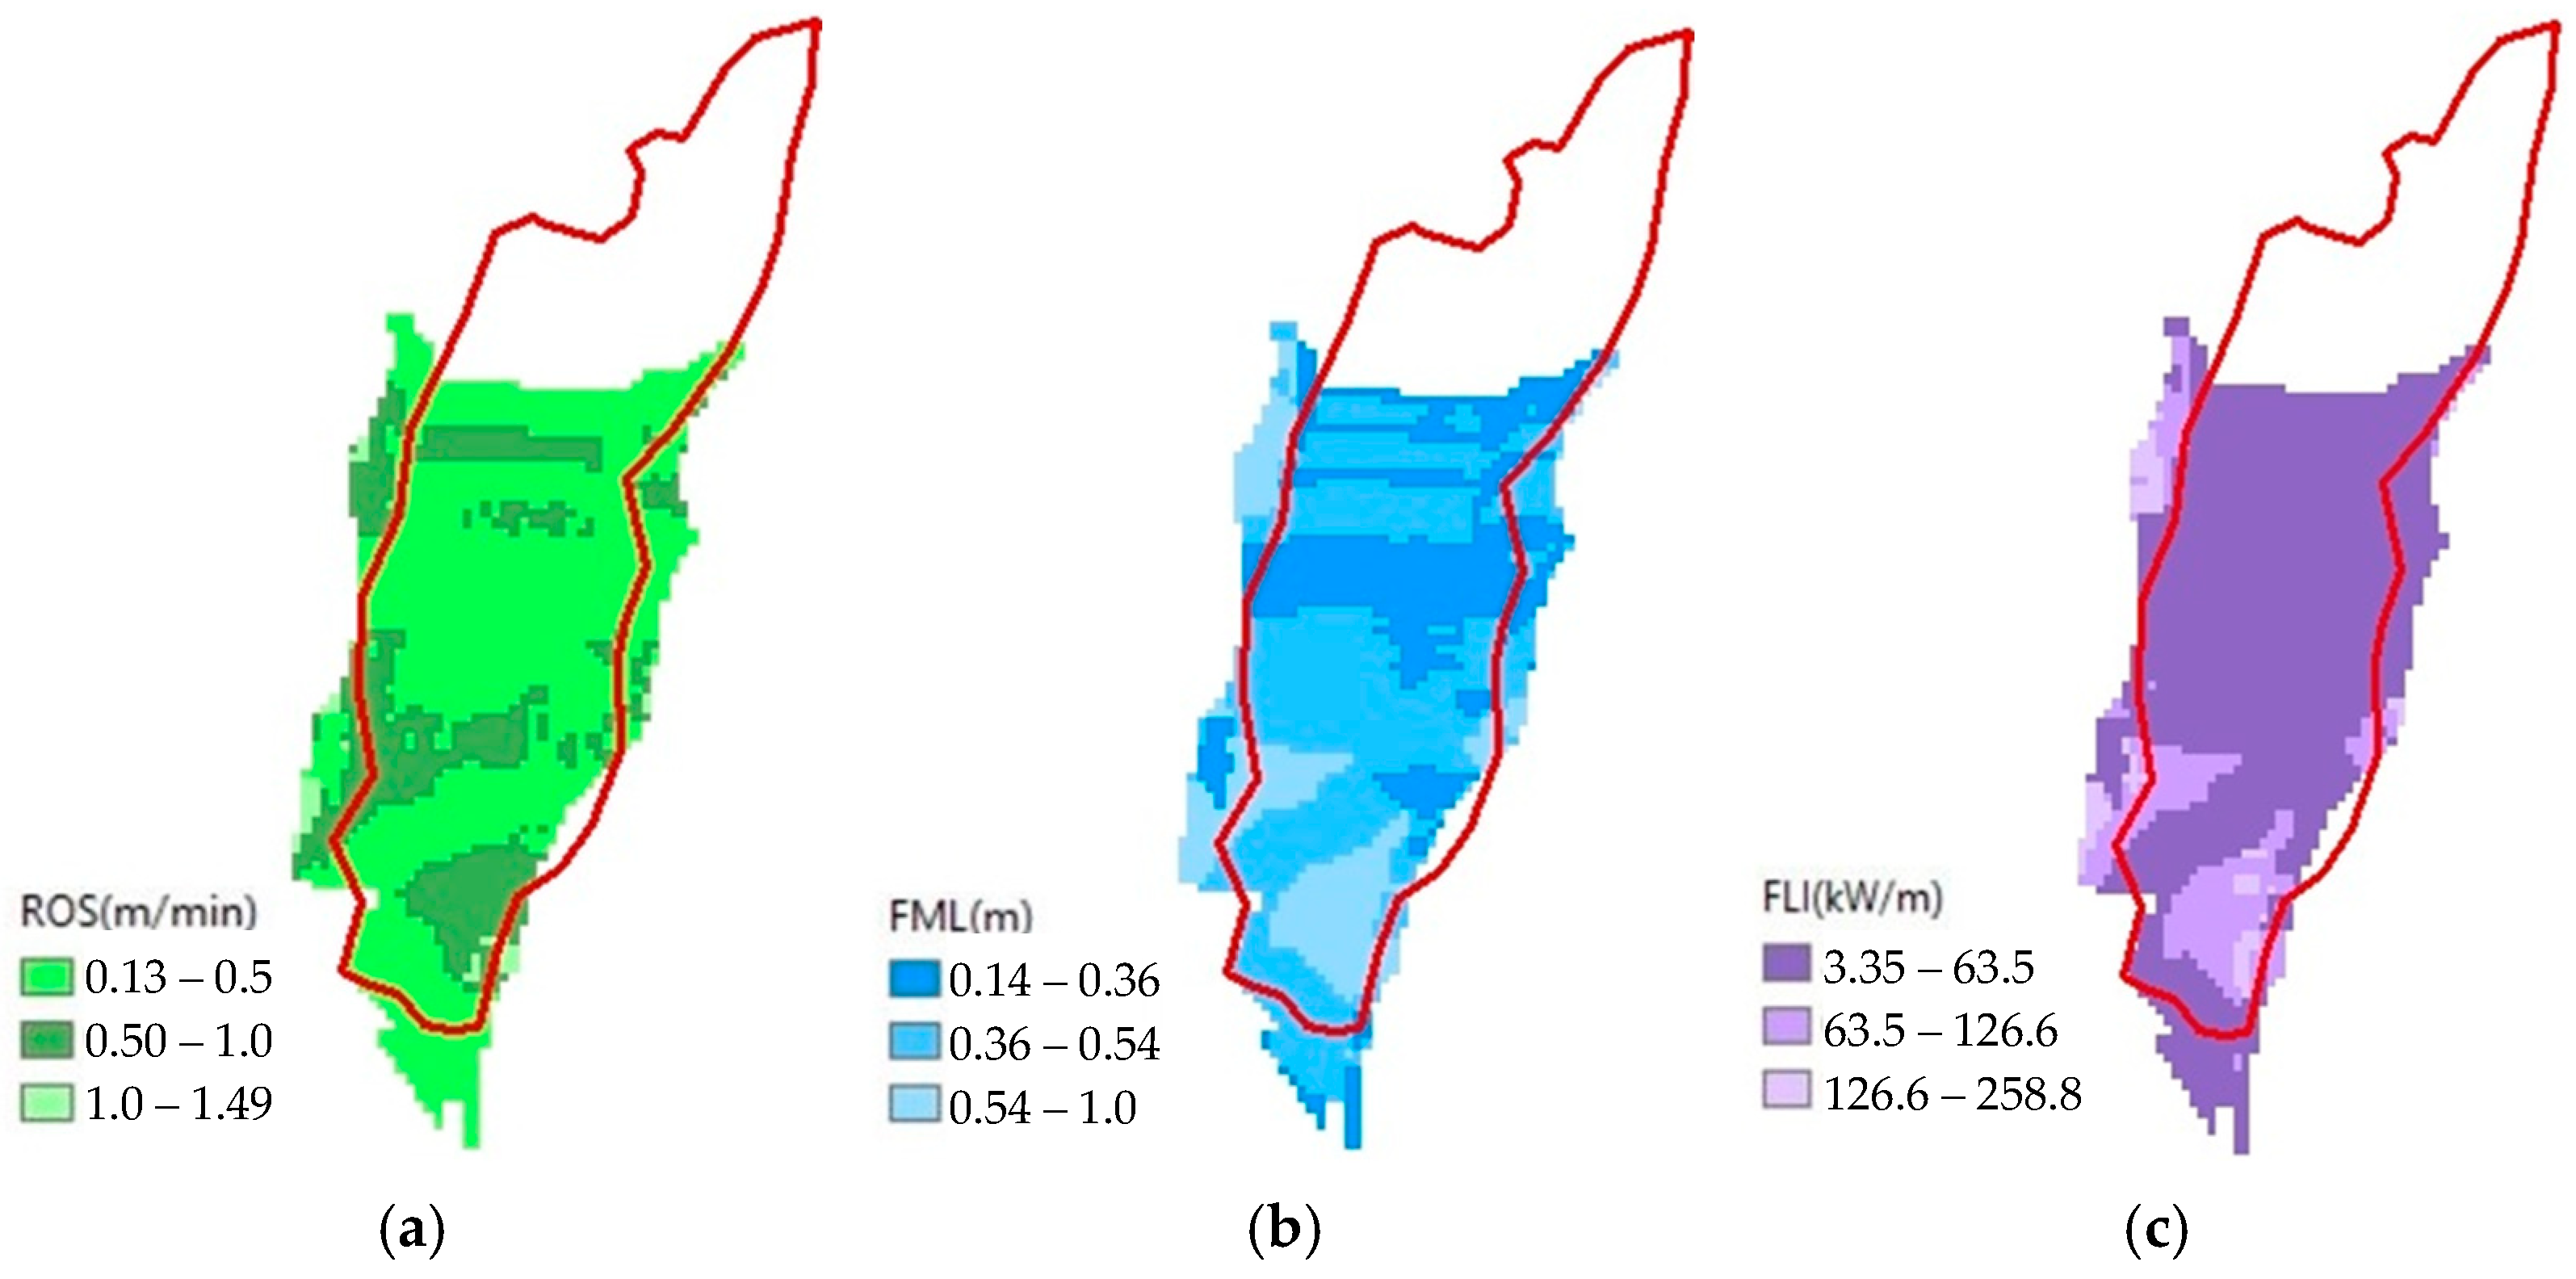
3.2. Simulation Result


4. Discussion
5. Conclusions
Author Contributions
Funding
Institutional Review Board Statement
Informed Consent Statement
Data Availability Statement
Acknowledgments
Conflicts of Interest
Nomenclature
| v | Geographic Information System |
| ROS | Rate of Fire Spread |
| FLI | Fire Line Intensity |
| FML | Flame Length |
| T | Temperature |
| t | Time |
| SC | Sorensen Coefficient |
| Kappa statistical coefficient | |
| OI | Overestimation Index |
| Ir | Reaction Intensity—Rate of energy release per unit area of the fire front |
| tr | Duration of presence |
| a | Common area burned in real and simulated fire (hectares) |
| b | Area burned in simulated fire and unburned in real fire (hectares) |
| c | Area burned in real fire and not burned in simulated fire (hectares) |
Appendix A. Wind Simulations

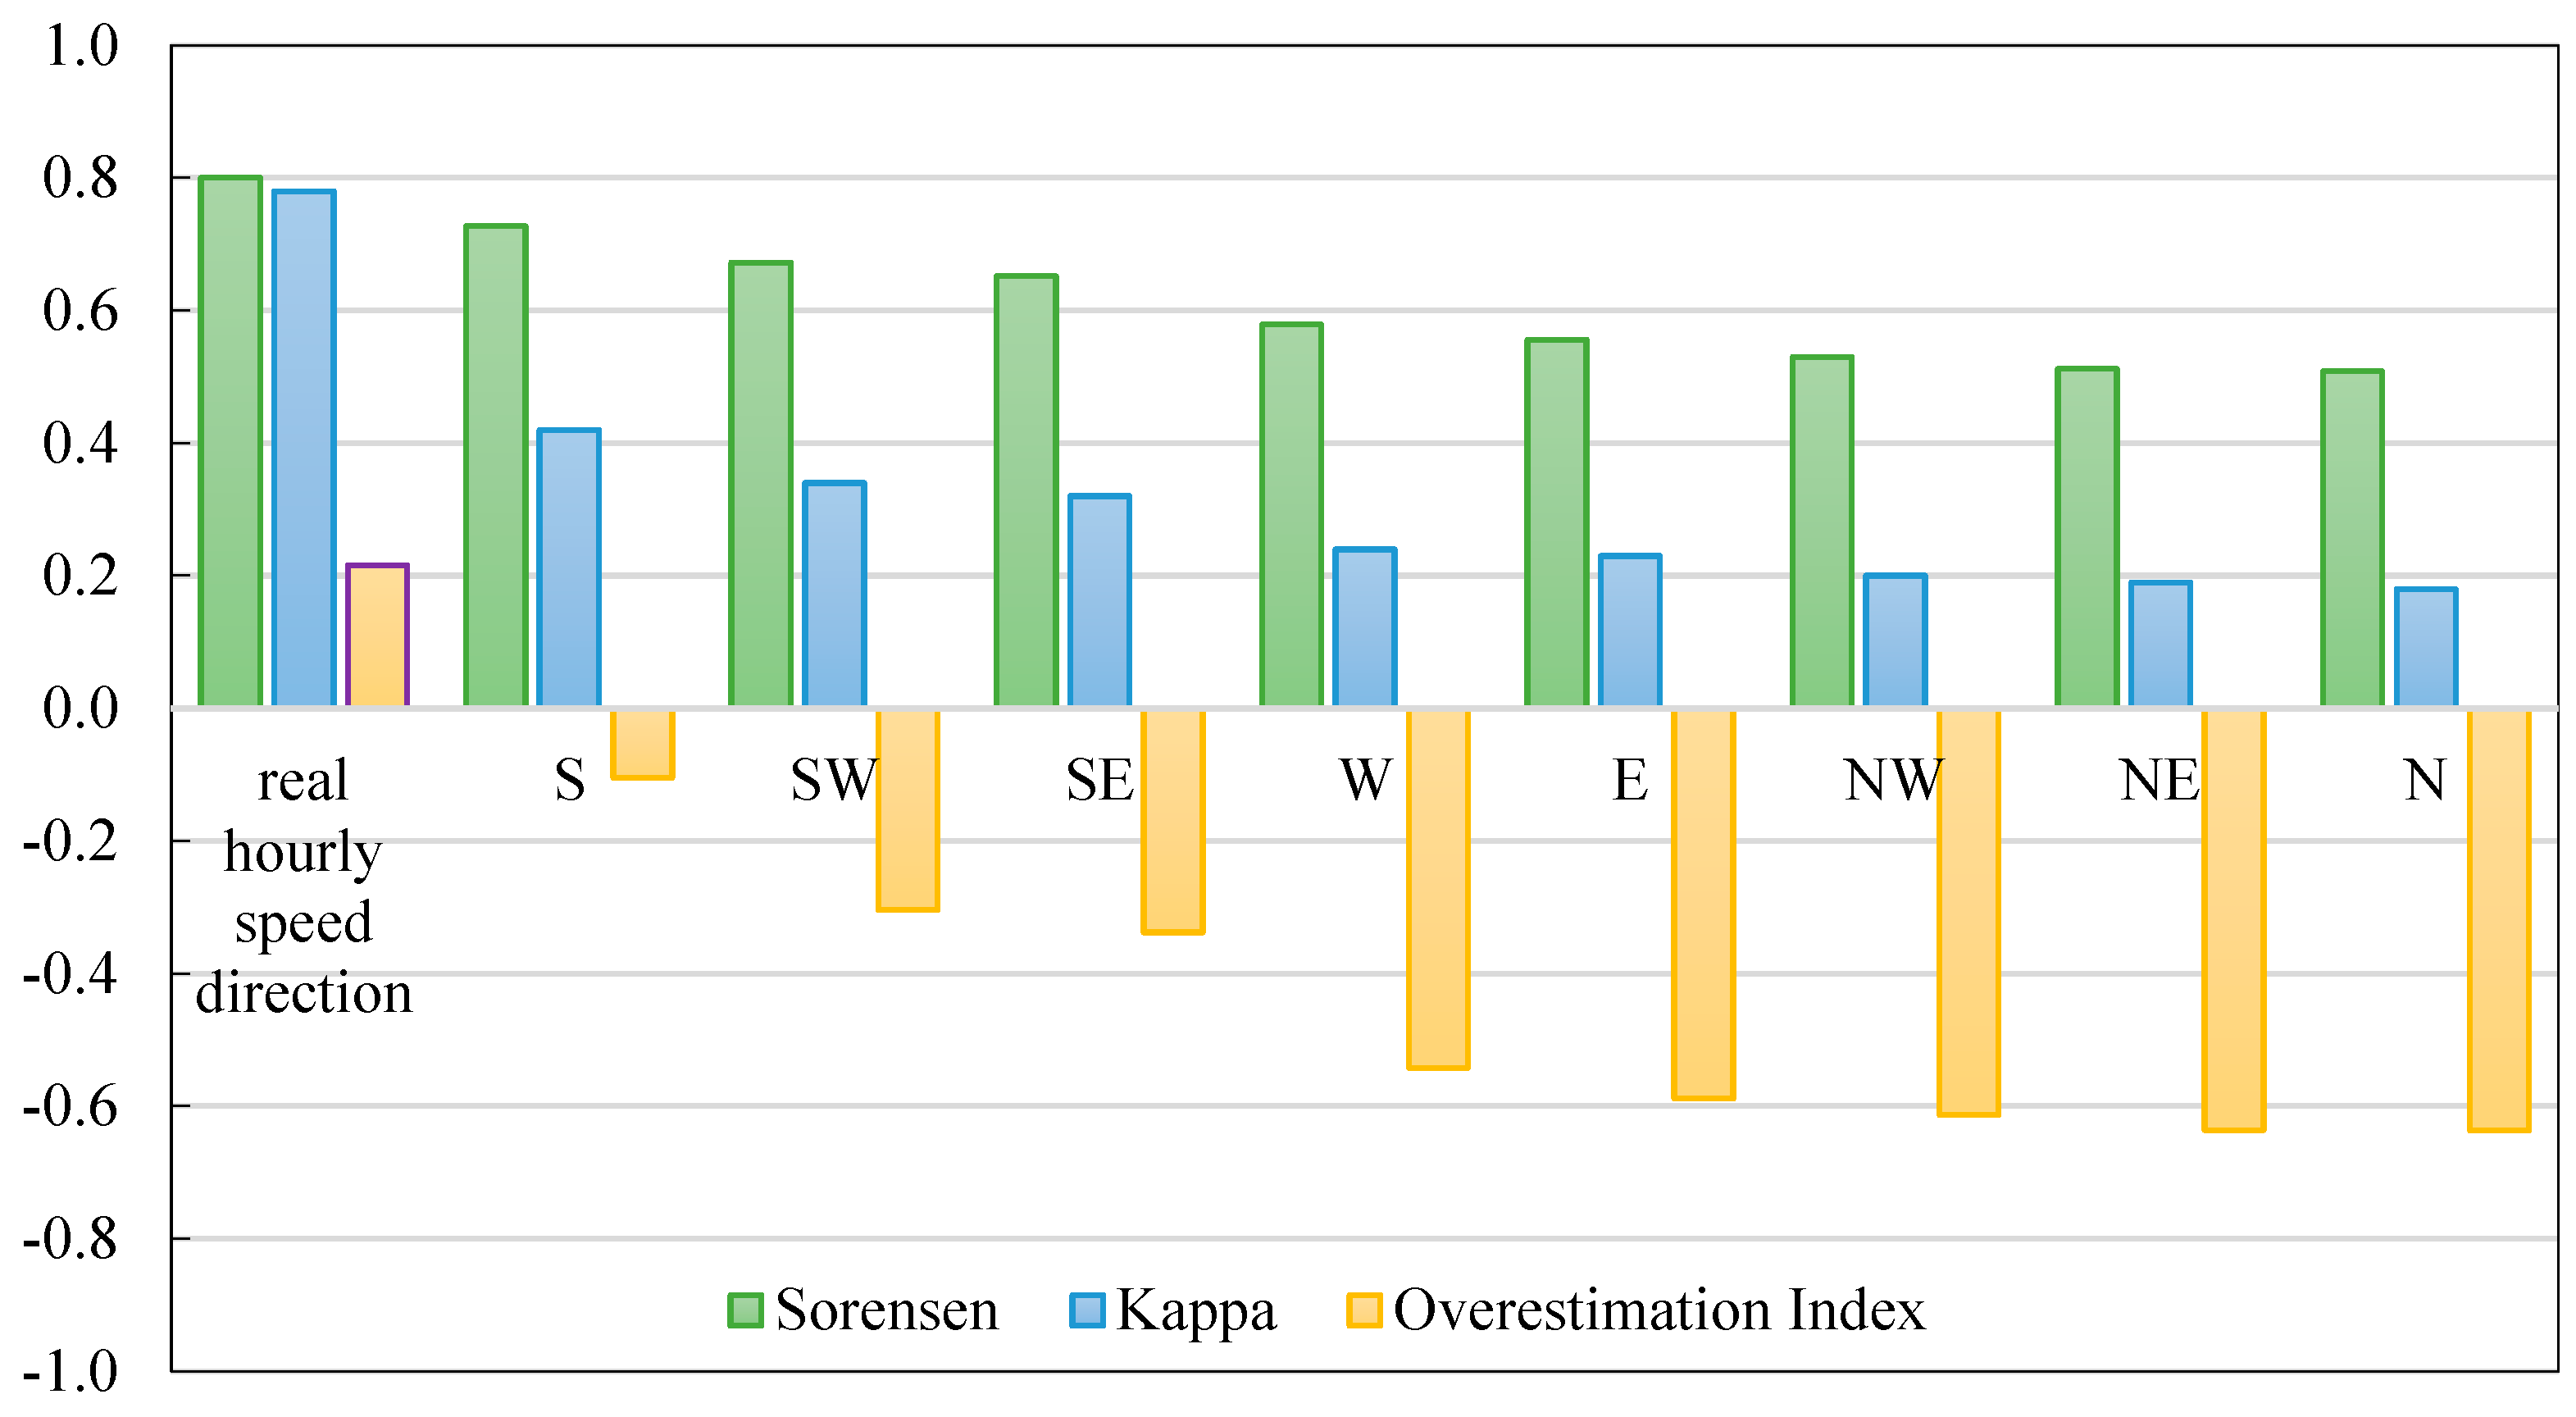
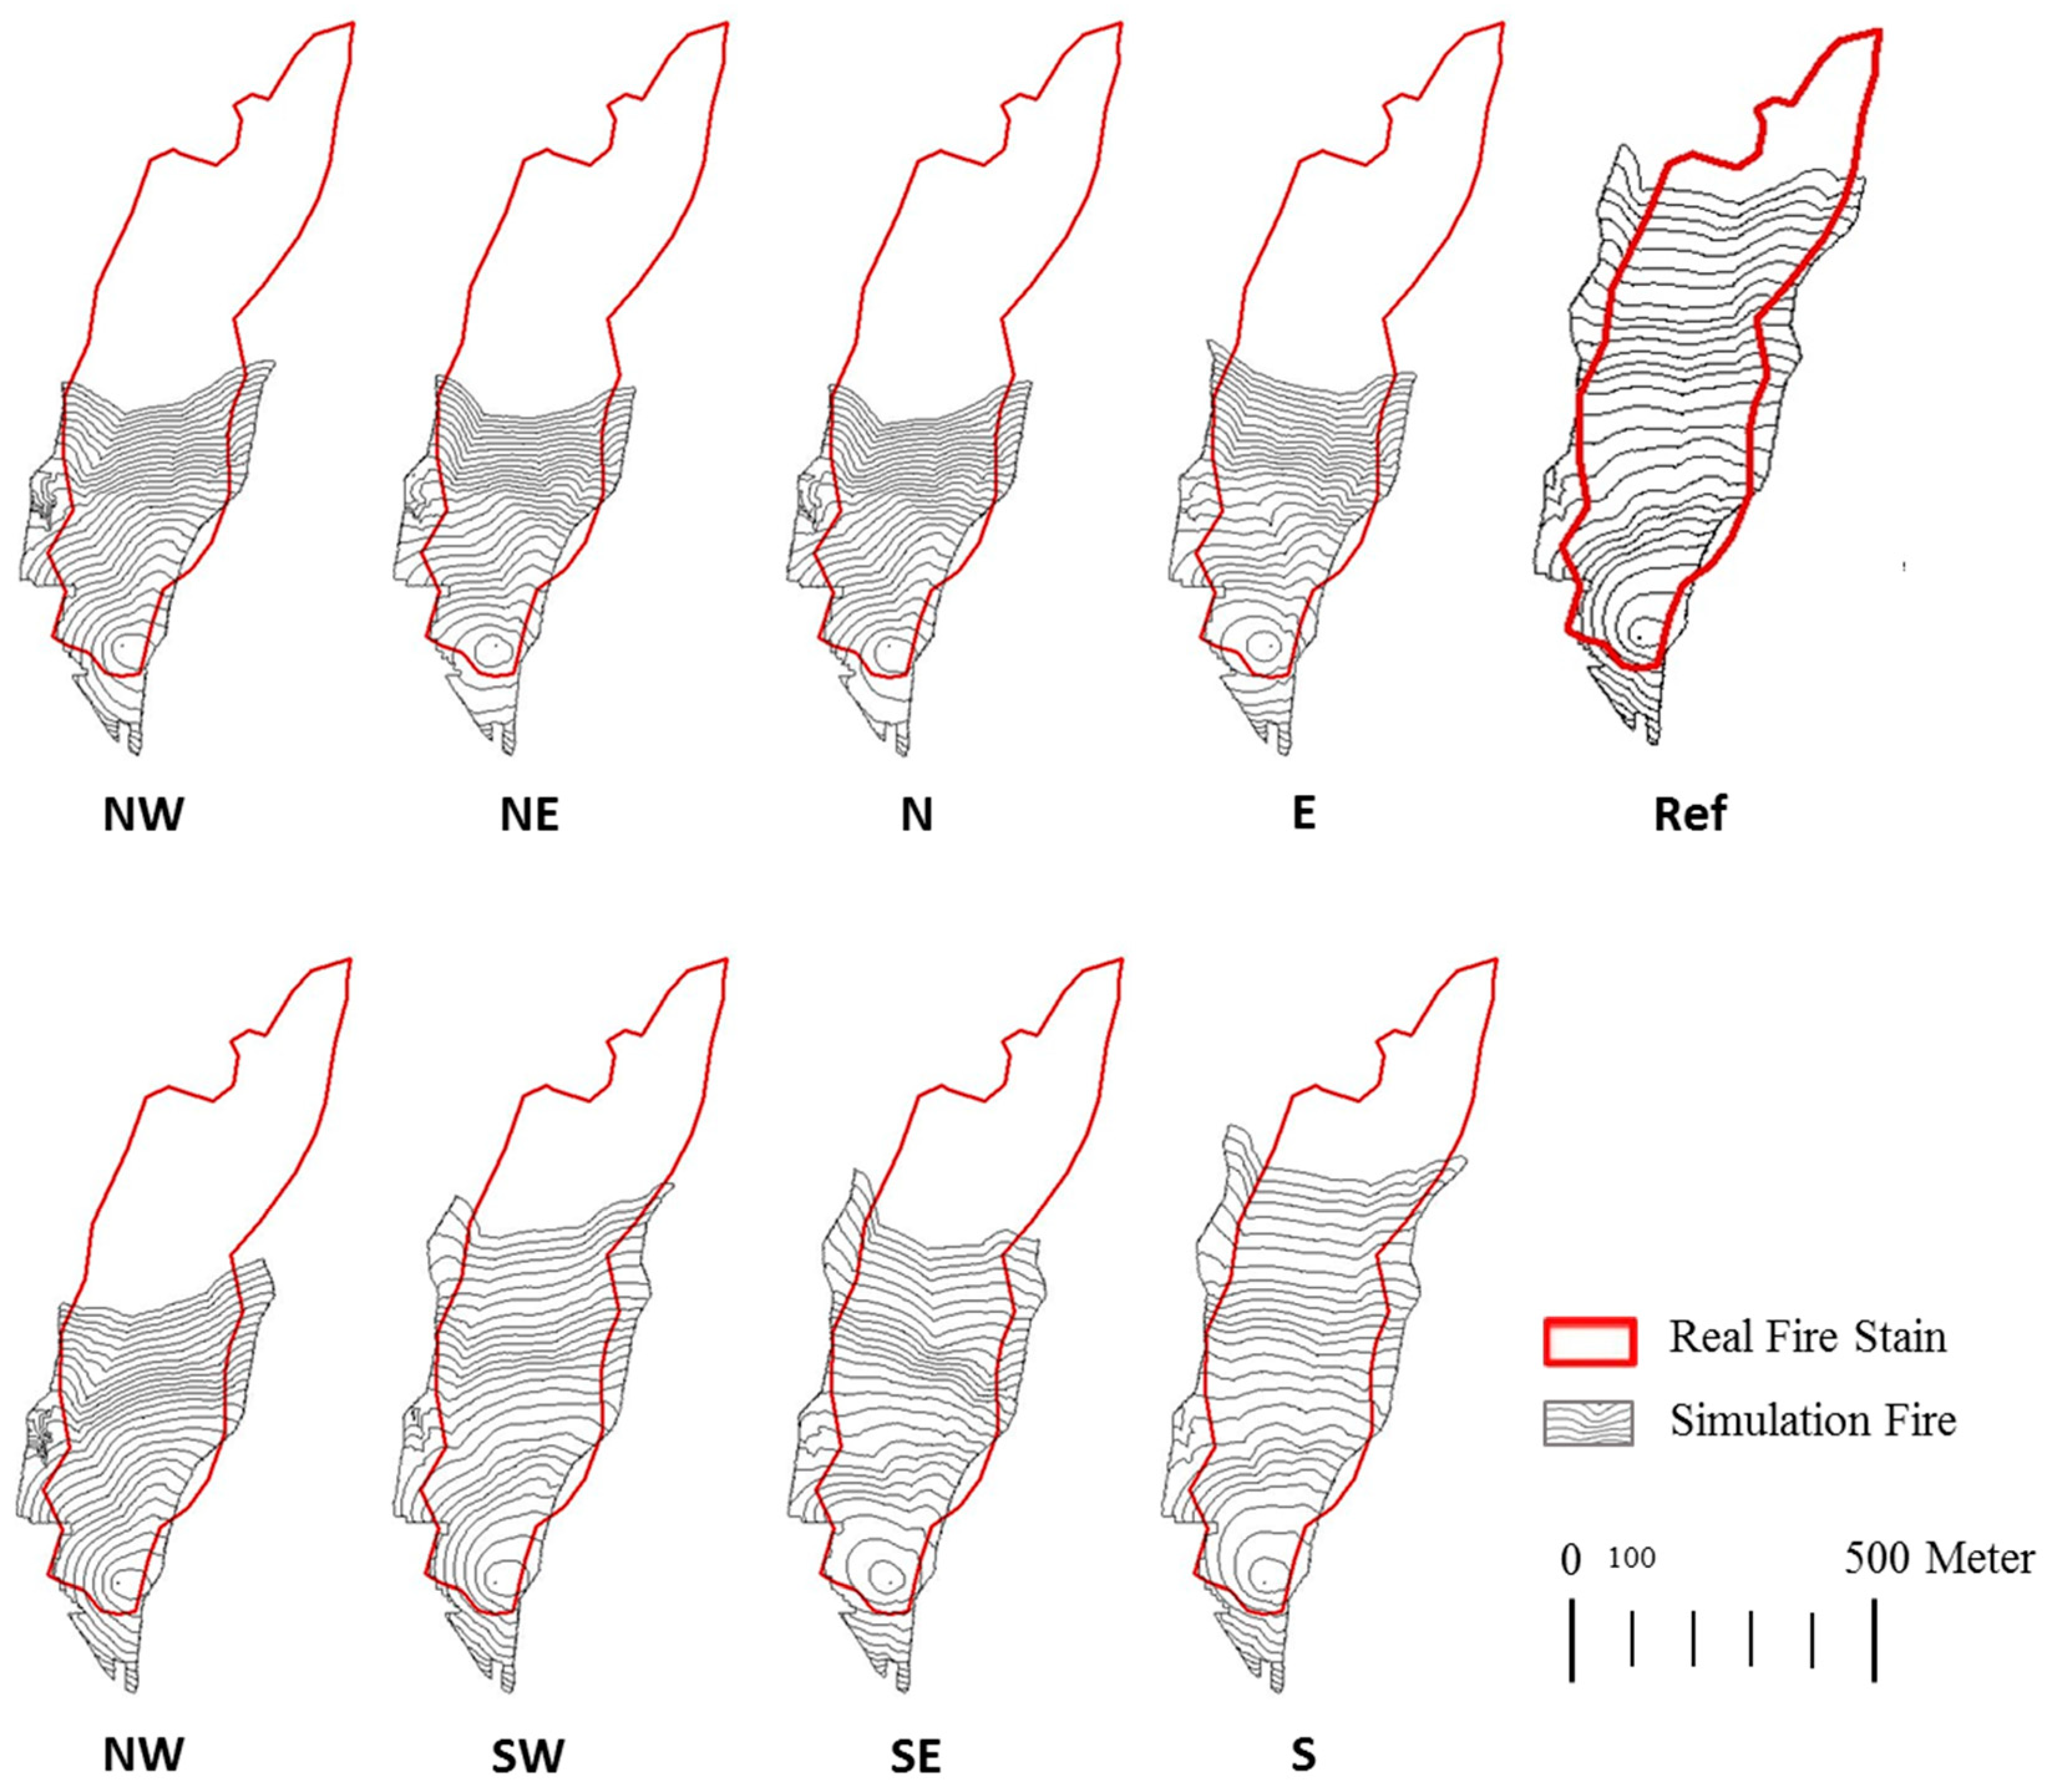
| Wind Direction | a (ha) | b (ha) | c (ha) | SC | OI | |
|---|---|---|---|---|---|---|
| Real hourly speed direction | 20.14 | 6.06 | 3.91 | 0.80 | 0.78 | 0.22 |
| S | 17.016 | 5.702 | 7.034 | 0.727 | 0.42 | −0.10 |
| SW | 14.708 | 4.989 | 9.342 | 0.672 | 0.34 | −0.30 |
| SE | 14.054 | 4.946 | 9.996 | 0.652 | 0.32 | −0.34 |
| W | 11.343 | 3.772 | 12.707 | 0.579 | 0.24 | −0.54 |
| E | 10.616 | 3.483 | 13.434 | 0.556 | 0.23 | −0.59 |
| NW | 9.901 | 3.396 | 14.149 | 0.53 | 0.2 | −0.61 |
| NE | 9.418 | 3.252 | 14.632 | 0.512 | 0.19 | −0.64 |
| N | 9.315 | 3.271 | 14.735 | 0.508 | 0.18 | −0.64 |


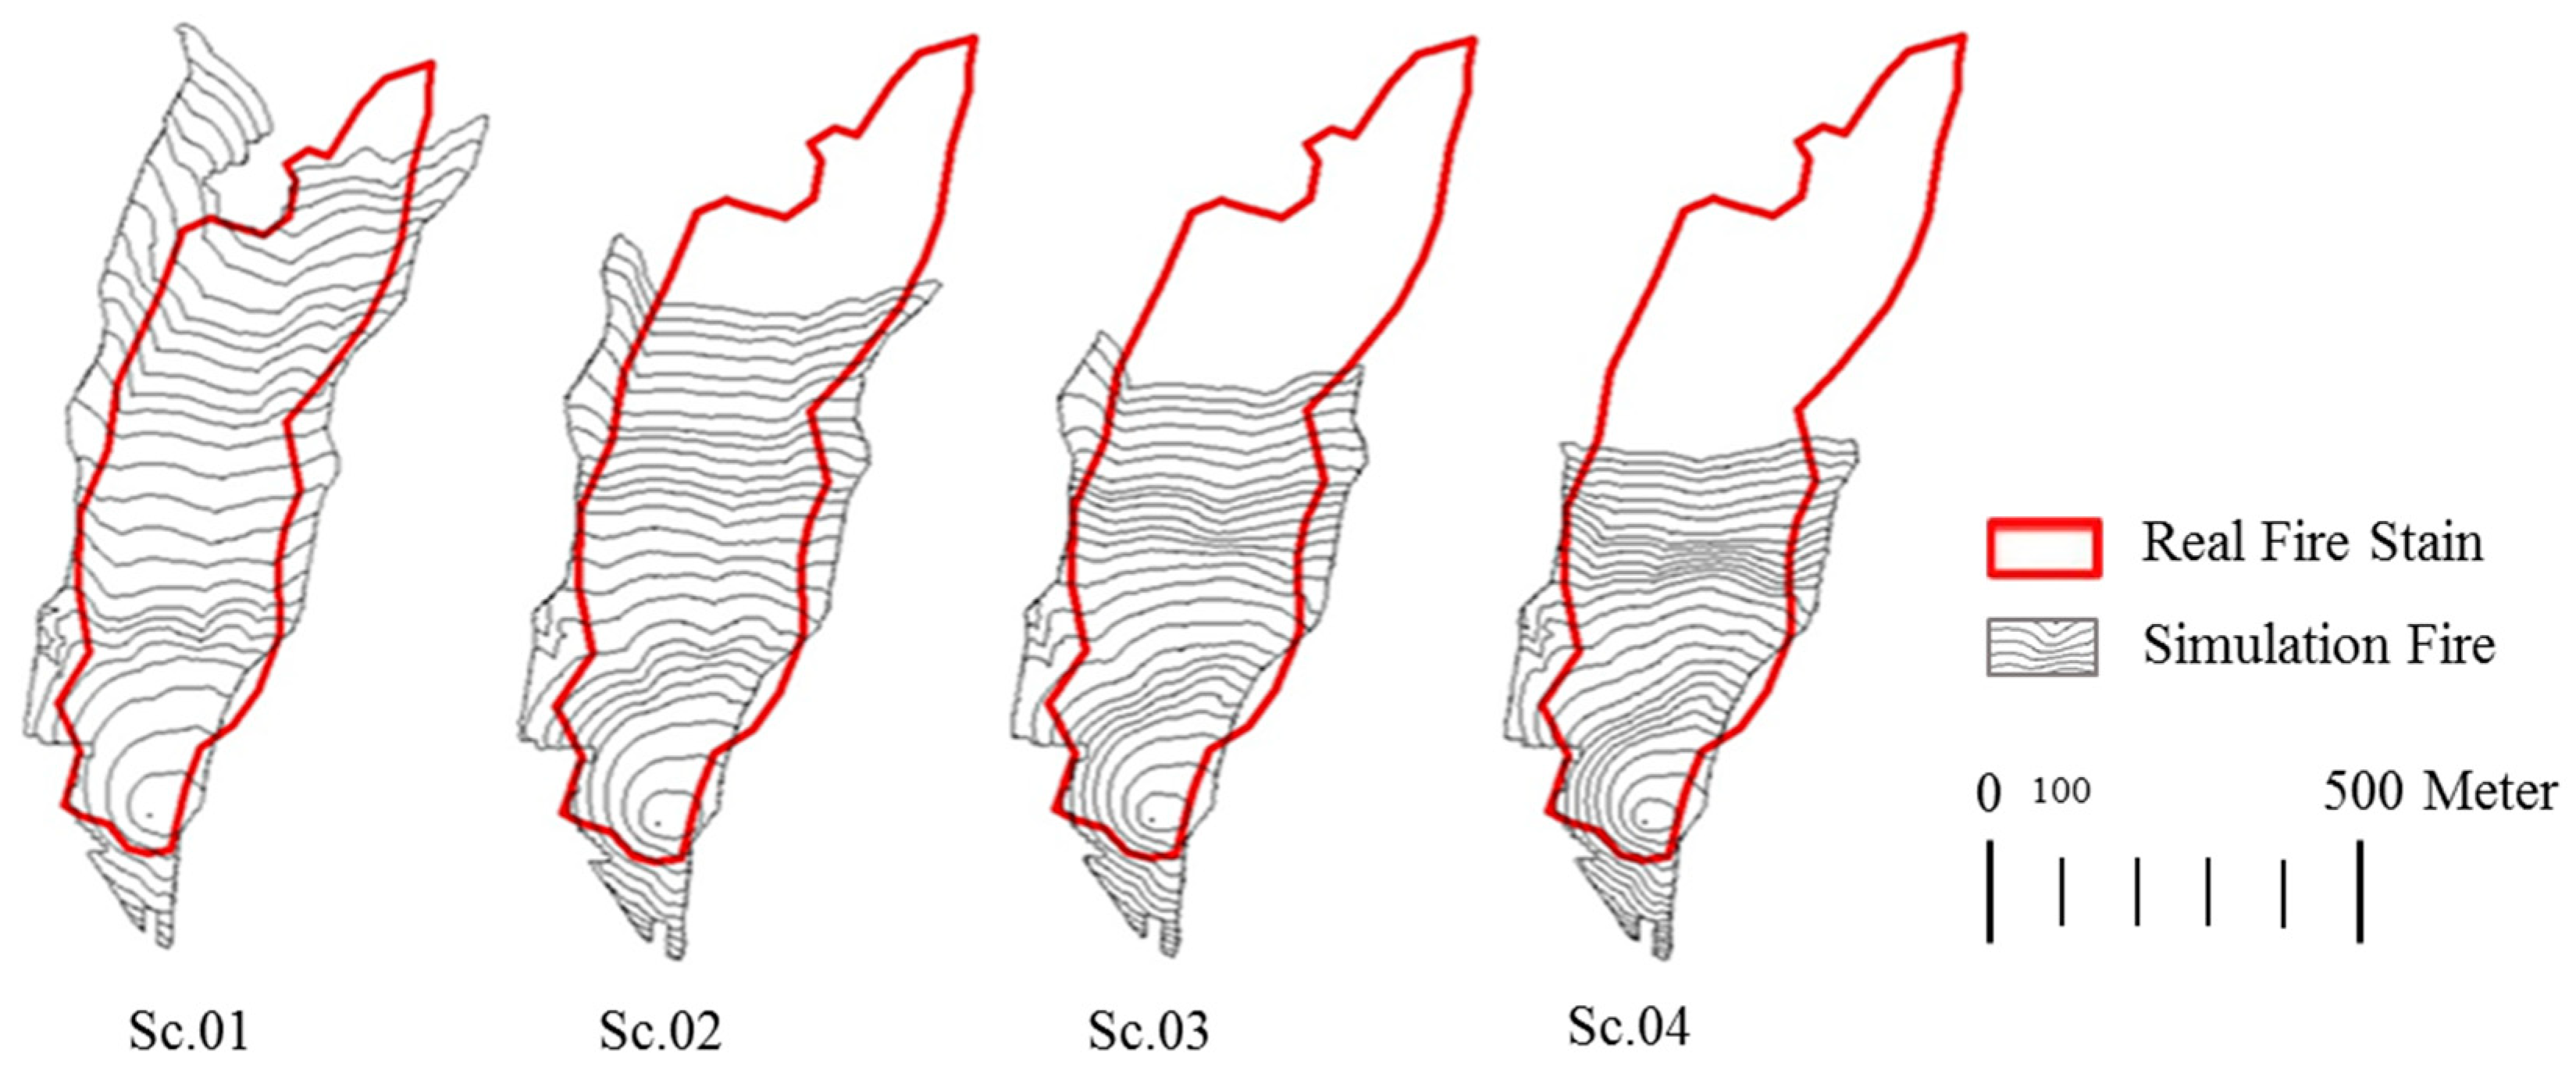
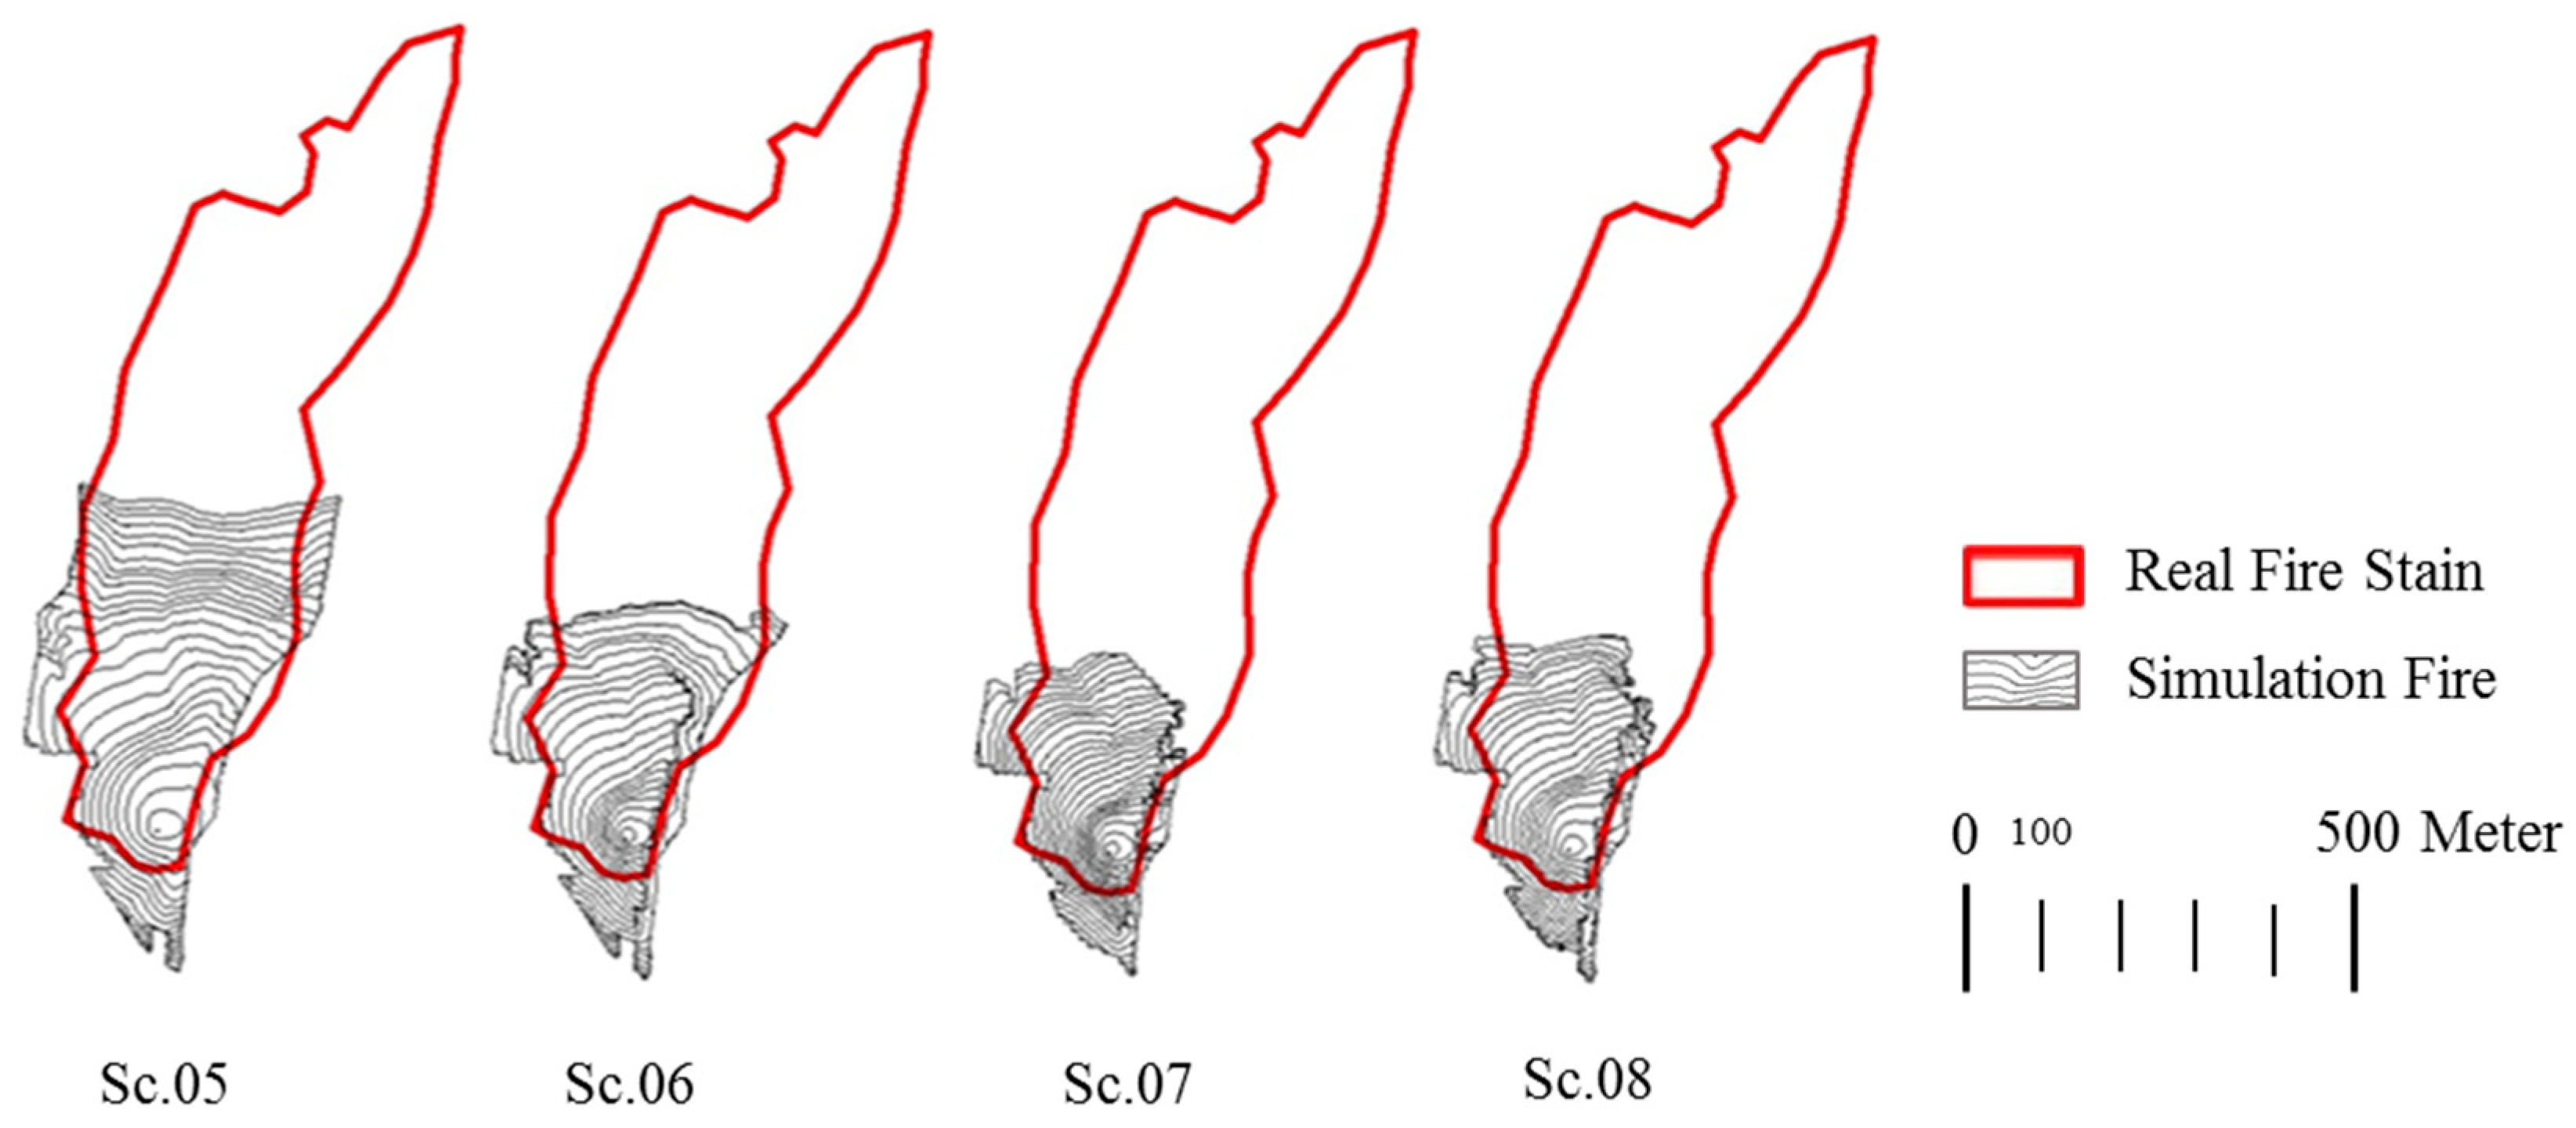
Appendix B. Scenarios


| Item | Scenario | Objective Variable | Average Wind Speed (km/h) | Average Air Relative Humidity (%) |
|---|---|---|---|---|
| 1 | Ref. | - | 19.42 | 39 |
| 2 | Sc.01 | Air Relative Humidity | 19.42 | 2 |
| 3 | Sc.02 | Air Relative Humidity | 19.42 | 22 |
| 4 | Sc.03 | Air Relative Humidity | 19.42 | 42 |
| 5 | Sc.04 | Air Relative Humidity | 19.42 | 62 |
| 6 | Sc.05 | Air Relative Humidity | 19.42 | 72 |
| 7 | Sc.06 | Air Relative Humidity | 19.42 | 82 |
| 8 | Sc.07 | Air Relative Humidity | 19.42 | 92 |
| 9 | Sc.08 | Air Relative Humidity | 19.42 | 99 |
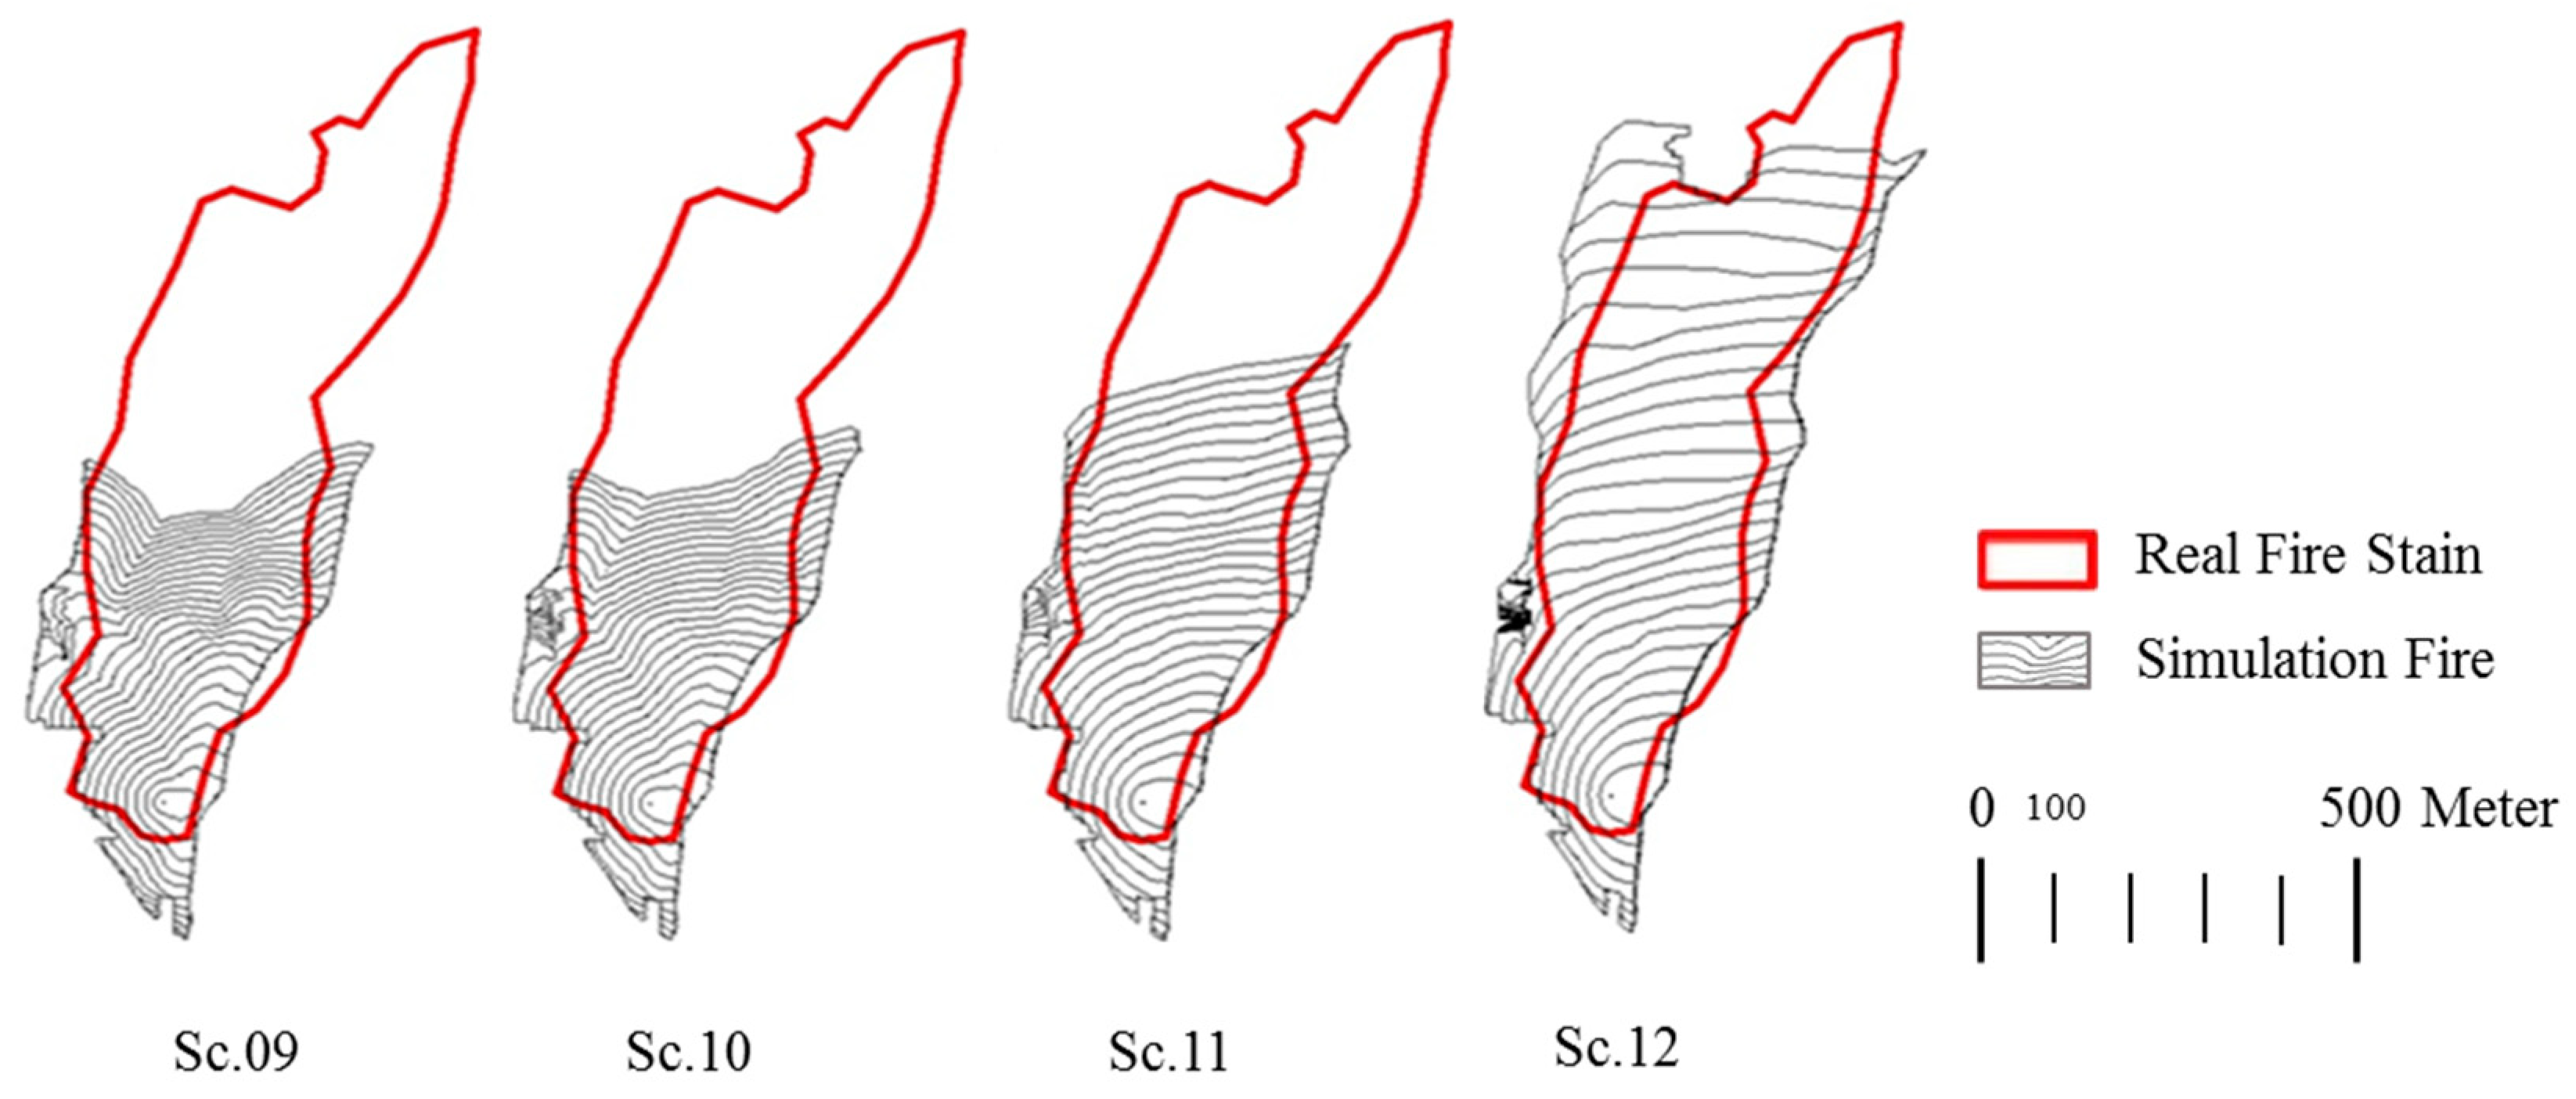
| 10 | Sc.09 | Wind Speed | 4.82 | 39 |
| 11 | Sc.10 | Wind Speed | 16.09 | 39 |
| 12 | Sc.11 | Wind Speed | 38.62 | 39 |
| 13 | Sc.12 | Wind Speed | 120.70 | 39 |
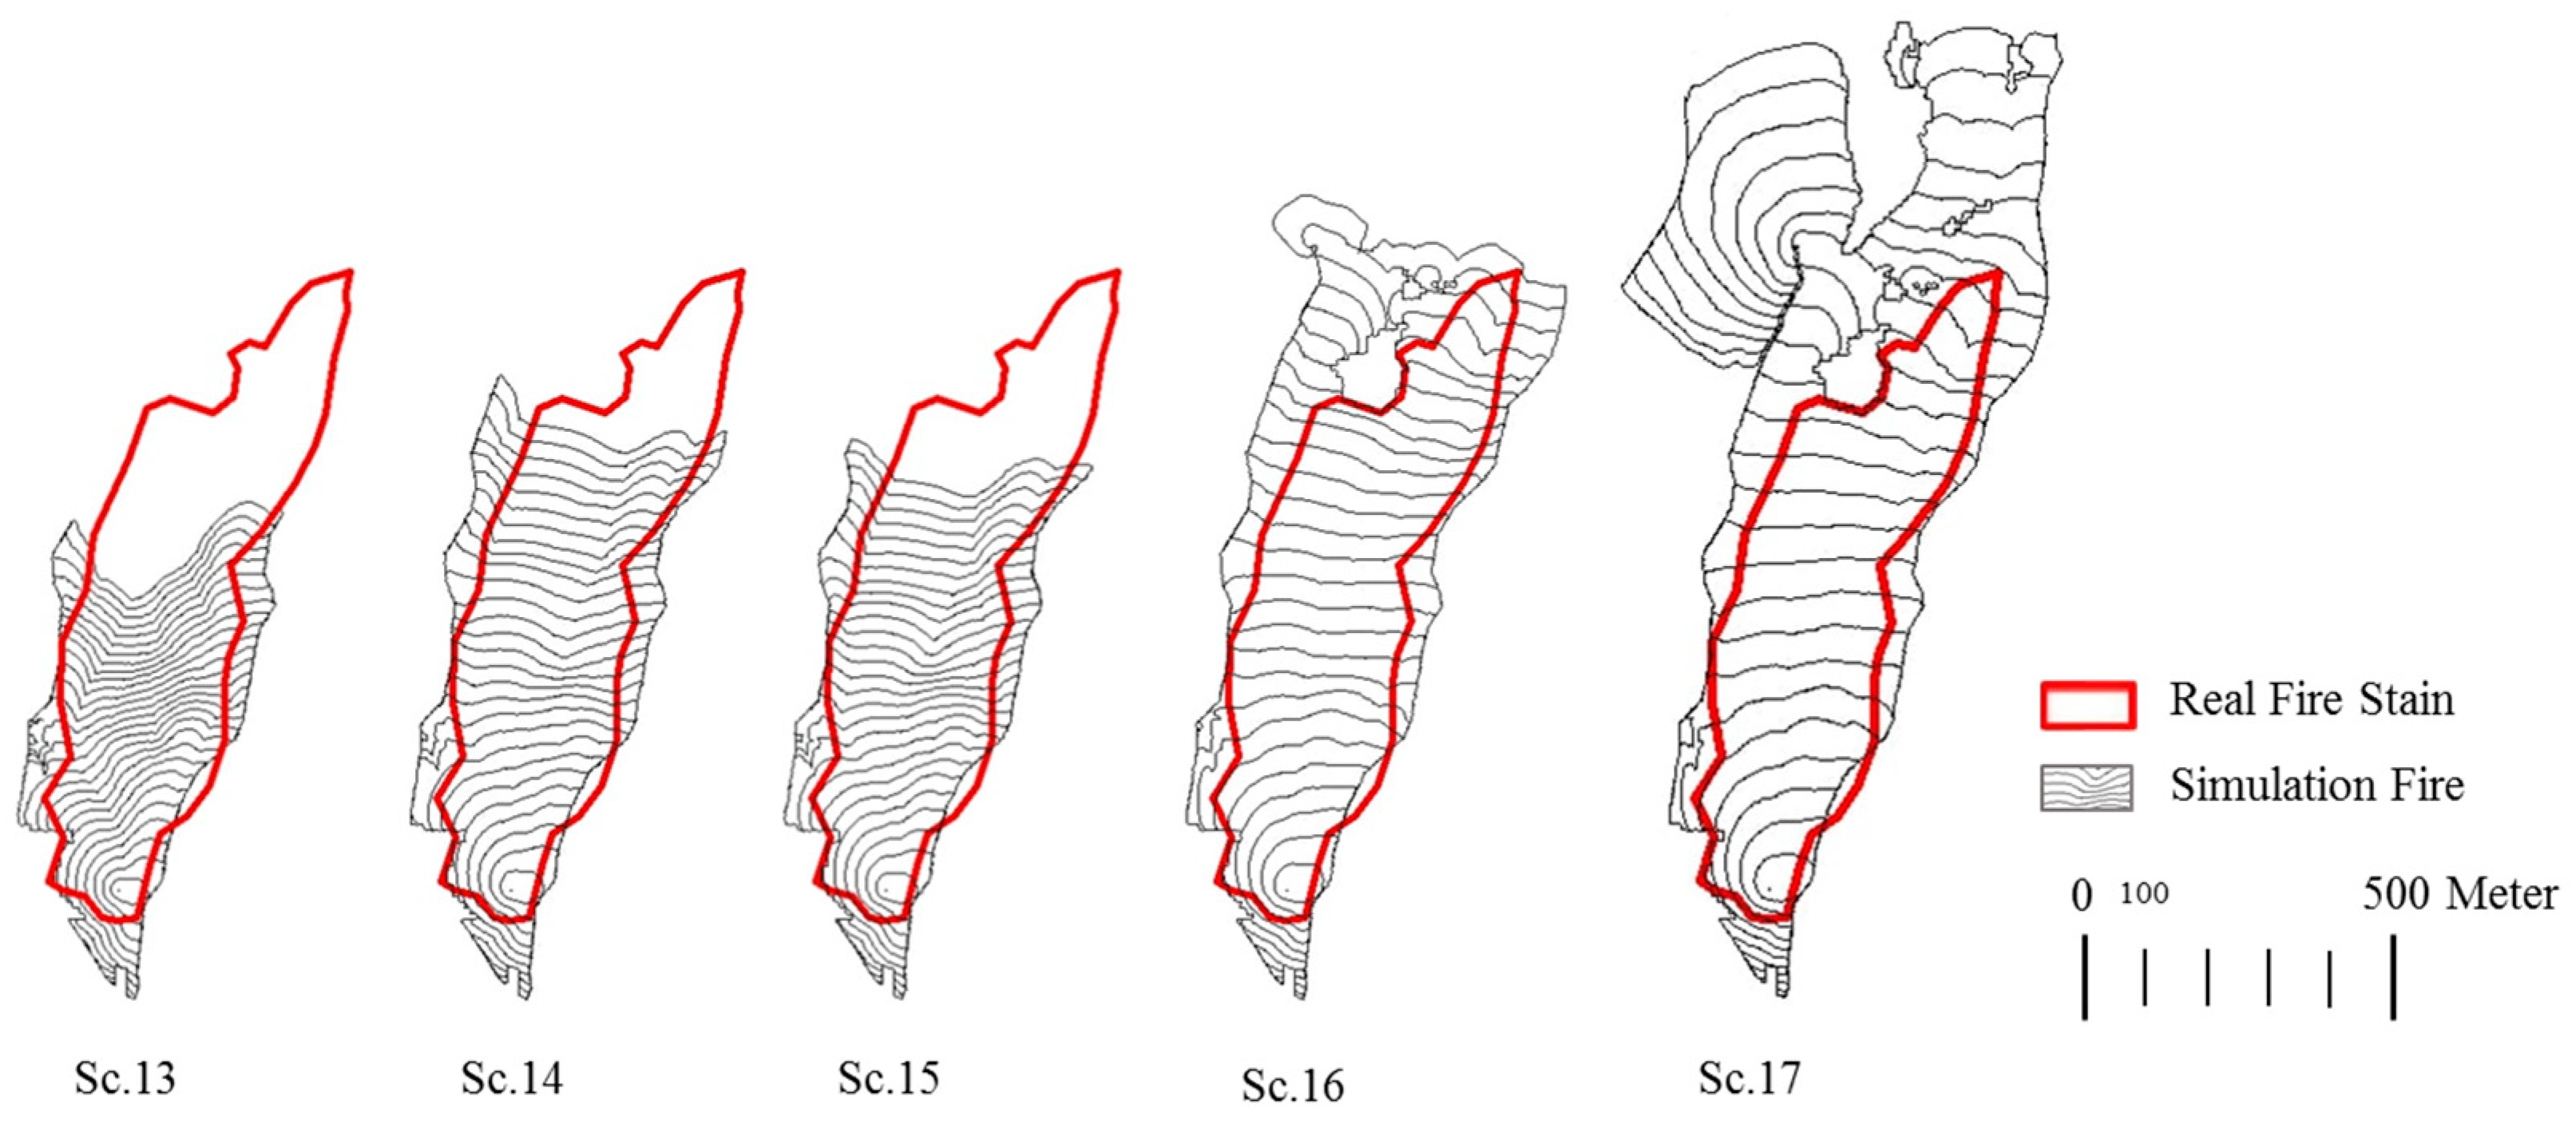
| 14 | Sc.13 | Wind Speed | 4.82 | 22 |
| 15 | Sc.14 | Wind Speed | 16.09 | 22 |
| 16 | Sc.15 | Wind Speed | 19.31 | 22 |
| 17 | Sc.16 | Wind Speed | 28.97 | 22 |
| 18 | Sc.17 | Wind Speed | 38.62 | 22 |
References
- Luo, Y.; Li, Q.; Jiang, L.; Zhou, Y. Analysis of Chinese Fire Statistics during the Period 1997–2017. Fire Saf. J. 2021, 125, 103400. [Google Scholar] [CrossRef]
- Doerr, S.H.; Santín, C. Global Trends in Wildfire and Its Impacts: Perceptions versus Realities in a Changing World. Philos. Trans. R. Soc. B Biol. Sci. 2016, 371, 20150345. [Google Scholar] [CrossRef] [Green Version]
- Kganyago, M.; Shikwambana, L. Assessing Spatio-Temporal Variability of Wildfires and Their Impact on Sub-Saharan Ecosystems and Air Quality Using Multisource Remotely Sensed Data and Trend Analysis. Sustainability 2019, 11, 6811. [Google Scholar] [CrossRef] [Green Version]
- Mamuji, A.A.; Rozdilsky, J.L. Wildfire as an Increasingly Common Natural Disaster Facing Canada: Understanding the 2016 Fort McMurray Wildfire. Nat. Hazards 2019, 98, 163–180. [Google Scholar] [CrossRef]
- Li, X.; Liu, L.; Qi, S. Forest Fire Hazard during 2000–2016 in Zhejiang Province of the Typical Subtropical Region, China. Nat. Hazards 2018, 94, 975–977. [Google Scholar] [CrossRef]
- Tomar, J.S.; Kranjčić, N.; Đurin, B.; Kanga, S.; Singh, S.K. Forest Fire Hazards Vulnerability and Risk Assessment in Sirmaur District Forest of Himachal Pradesh (India): A Geospatial Approach. ISPRS Int. J. Geo-Inf. 2021, 10, 447. [Google Scholar] [CrossRef]
- Ghorbanzadeh, O.; Blaschke, T.; Gholamnia, K.; Aryal, J. Forest Fire Susceptibility and Risk Mapping Using Social/Infrastructural Vulnerability and Environmental Variables. Fire 2019, 2, 50. [Google Scholar] [CrossRef] [Green Version]
- Liu, Y.; Stanturf, J.; Goodrick, S. Trends in Global Wildfire Potential in a Changing Climate. For. Ecol. Manag. 2010, 259, 685–697. [Google Scholar] [CrossRef]
- Eskandari, S.; Amiri, M.; Sãdhasivam, N.; Pourghasemi, H.R. Comparison of New Individual and Hybrid Machine Learning Algorithms for Modeling and Mapping Fire Hazard: A Supplementary Analysis of Fire Hazard in Different Counties of Golestan Province in Iran. Nat. Hazards 2020, 104, 305–327. [Google Scholar] [CrossRef]
- Zong, X.; Tian, X.; Yin, Y. Impacts of Climate Change on Wildfires in Central Asia. Forests 2020, 11, 802. [Google Scholar] [CrossRef]
- Kalabokidis, K.; Palaiologou, P.; Gerasopoulos, E.; Giannakopoulos, C.; Kostopoulou, E.; Zerefos, C. Effect of Climate Change Projections on Forest Fire Behavior and Values-at-Risk in Southwestern Greece. Forests 2015, 6, 2214–2240. [Google Scholar] [CrossRef] [Green Version]
- Eskandari, S.; Ghadikolaei, J.O.; Jalilvand, H.; Saradjian, M.R. Detection of Fire High-Risk Areas in Northern Forests of Iran Using Dong Model. World Appl. Sci. J. 2013, 27, 770–773. [Google Scholar]
- Ghobadi, G.J.; Gholizadeh, B.; Dashliburun, O.M. Forest Fire Risk Zone Mapping from Geographic Information System in Northern Forests of Iran (Case Study, Golestan Province). Int. J. Agric. Crop Sci. 2012, 4, 818–824. [Google Scholar]
- Beverly, J.L.; McLoughlin, N. Burn Probability Simulation and Subsequent Wildland Fire Activity in Alberta, Canada–Implications for Risk Assessment and Strategic Planning. For. Ecol. Manag. 2019, 451, 117490. [Google Scholar] [CrossRef]
- Argañaraz, J.P.; Gavier Pizarro, G.; Zak, M.; Bellis, L.M. Fire Regime, Climate, and Vegetation in the Sierras de Córdoba, Argentina. Fire Ecol. 2015, 11, 55–73. [Google Scholar] [CrossRef]
- Ghodrat, M.; Shakeriaski, F.; Nelson, D.J.; Simeoni, A. Existing Improvements in Simulation of Fire–Wind Interaction and Its Effects on Structures. Fire 2021, 4, 27. [Google Scholar] [CrossRef]
- Trucchia, A.; D’Andrea, M.; Baghino, F.; Fiorucci, P.; Ferraris, L.; Negro, D.; Gollini, A.; Severino, M. PROPAGATOR: An Operational Cellular-Automata Based Wildfire Simulator. Fire 2020, 3, 26. [Google Scholar] [CrossRef]
- Chew, Y.J.; Ooi, S.Y.; Pang, Y.H.; Wong, K.-S. A Review of Forest Fire Combating Efforts, Challenges and Future Directions in Peninsular Malaysia, Sabah, and Sarawak. Forests 2022, 13, 1405. [Google Scholar] [CrossRef]
- Zhou, T.; Ding, L.; Ji, J.; Yu, L.; Wang, Z. Combined Estimation of Fire Perimeters and Fuel Adjustment Factors in FARSITE for Forecasting Wildland Fire Propagation. Fire Saf. J. 2020, 116, 103167. [Google Scholar] [CrossRef]
- Cai, L.; He, H.S.; Wu, Z.; Lewis, B.L.; Liang, Y. Development of Standard Fuel Models in Boreal Forests of Northeast China through Calibration and Validation. PLoS ONE 2014, 9, e94043. [Google Scholar] [CrossRef]
- Koutsias, N.; Karteris, M. Classification Analyses of Vegetation for Delineating Forest Fire Fuel Complexes in a Mediterranean Test Site Using Satellite Remote Sensing and GIS. Int. J. Remote Sens. 2003, 24, 3093–3104. [Google Scholar] [CrossRef]
- Thompson, J.R.; Spies, T.A. Vegetation and Weather Explain Variation in Crown Damage within a Large Mixed-Severity Wildfire. For. Ecol. Manag. 2009, 258, 1684–1694. [Google Scholar] [CrossRef]
- Forthofer, J.M.; Butler, B.W.; McHugh, C.W.; Finney, M.A.; Bradshaw, L.S.; Stratton, R.D.; Shannon, K.S.; Wagenbrenner, N.S. A Comparison of Three Approaches for Simulating Fine-Scale Surface Winds in Support of Wildland Fire Management. Part II. An Exploratory Study of the Effect of Simulated Winds on Fire Growth Simulations. Int. J. Wildl. Fire 2014, 23, 982–994. [Google Scholar] [CrossRef]
- Forthofer, J.M.; Butler, B.W.; Wagenbrenner, N.S. A Comparison of Three Approaches for Simulating Fine-Scale Surface Winds in Support of Wildland Fire Management. Part I. Model Formulation and Comparison against Measurements. Int. J. Wildl. Fire 2014, 23, 969–981. [Google Scholar] [CrossRef]
- Finney, M.A. FARSITE, Fire Area Simulator—Model Development and Evaluation; US Department of Agriculture, Forest Service, Rocky Mountain Research Station: Fort Collins, CO, USA, 1998. [Google Scholar]
- Rothermel, R.C. A Mathematical Model for Predicting Fire Spread in Wildland Fuels; Intermountain Forest & Range Experiment Station, Forest Service: Ogden, UT, USA, 1972; Volume 115. [Google Scholar]
- Finney, M.A.; Andrews, P.L. FARSITE—A Program for Fire Growth Simulation. Fire Manag. Notes 1999, 59, 13–15. [Google Scholar]
- Boychuk, D.; Braun, W.J.; Kulperger, R.J.; Krougly, Z.L.; Stanford, D.A. A Stochastic Forest Fire Growth Model. Environ. Ecol. Stat. 2009, 16, 133–151. [Google Scholar] [CrossRef]
- Durrett, R. Stochastic Models of Growth and Competition. In Patch Dynamics; Springer: Berlin/Heidelberg, Germany, 1993; pp. 176–183. [Google Scholar]
- Knight, I.; Coleman, J. A Fire Perimeter Expansion Algorithm-Based on Huygens Wavelet Propagation. Int. J. Wildl. Fire 1993, 3, 73–84. [Google Scholar] [CrossRef]
- Finney, M.A.; Ryan, K.C. Use of the FARSITE Fire Growth Model for Fire Prediction in US National Parks. In Proceedings of the International Emergency Management and Engineering Conference, Nice, France, 9–12 May 1995; Sullivan, J.D., Wybo, J.L., Buisson, L., Eds.; Citeseer. International Emergency Management and Engineering Society: Paris, France, 1995; pp. 183–189. [Google Scholar]
- Arca, B.; Duce, P.; Laconi, M.; Pellizzaro, G.; Salis, M.; Spano, D. Evaluation of FARSITE Simulator in Mediterranean Maquis. Int. J. Wildl. Fire 2007, 16, 563–572. [Google Scholar] [CrossRef]
- Salis, M.; Arca, B.; Alcasena, F.; Arianoutsou, M.; Bacciu, V.; Duce, P.; Duguy, B.; Koutsias, N.; Mallinis, G.; Mitsopoulos, I. Predicting Wildfire Spread and Behaviour in Mediterranean Landscapes. Int. J. Wildl. Fire 2016, 25, 1015–1032. [Google Scholar] [CrossRef]
- Arca, B.; Duce, P.; Pellizzaro, G.; Laconi, M.; Salis, M.; Spano, D. Evaluation of FARSITE Simulator in Mediterranean Shrubland. For. Ecol. Manag. 2006, 234, S110. [Google Scholar] [CrossRef]
- Reinhardt, E.D.; Dickinson, M.B. First-Order Fire Effects Models for Land Management: Overview and Issues. Fire Ecol. 2010, 6, 131–142. [Google Scholar] [CrossRef]
- Zigner, K.; Carvalho, L.M.V.; Jones, C.; Benoit, J.; Duine, G.-J.; Roberts, D.; Fujioka, F.; Moritz, M.; Elmquist, N.; Hazard, R. Wildfire Risk in the Complex Terrain of the Santa Barbara Wildland–Urban Interface during Extreme Winds. Fire 2022, 5, 138. [Google Scholar] [CrossRef]
- Zigner, K.; Carvalho, L.M.V.; Peterson, S.; Fujioka, F.; Duine, G.-J.; Jones, C.; Roberts, D.; Moritz, M. Evaluating the Ability of FARSITE to Simulate Wildfires Influenced by Extreme, Downslope Winds in Santa Barbara, California. Fire 2020, 3, 29. [Google Scholar] [CrossRef]
- Clark, R.E.; Hope, A.S.; Tarantola, S.; Gatelli, D.; Dennison, P.E.; Moritz, M.A. Sensitivity Analysis of a Fire Spread Model in a Chaparral Landscape. Fire Ecol. 2008, 4, 1–13. [Google Scholar] [CrossRef]
- Friggens, M.M.; Loehman, R.A.; Constan, C.I.; Kneifel, R.R. Predicting Wildfire Impacts on the Prehistoric Archaeological Record of the Jemez Mountains, New Mexico, USA. Fire Ecol. 2021, 17, 18. [Google Scholar] [CrossRef]
- Adab, H.; Kanniah, K.D.; Solaimani, K. Modeling Forest Fire Risk in the Northeast of Iran Using Remote Sensing and GIS Techniques. Nat. Hazards 2013, 65, 1723–1743. [Google Scholar] [CrossRef]
- Shafiei, A.B.; Akbarinia, M.; Jalali, G.; Hosseini, M. Forest Fire Effects in Beech Dominated Mountain Forest of Iran. For. Ecol. Manag. 2010, 259, 2191–2196. [Google Scholar] [CrossRef]
- Jahdi, R.; Salis, M.; Darvishsefat, A.A.; Mostafavi, M.A.; Alcasena, F.; Etemad, V.; Lozano, O.; Spano, D. Calibration of FARSITE Simulator in Northern Iranian Forests. Nat. Hazards Earth Syst. Sci. 2015, 15, 443–459. [Google Scholar] [CrossRef] [Green Version]
- Jahdi, R.; Salis, M.; Alcasena, F.J.; Arabi, M.; Arca, B.; Duce, P. Evaluating Landscape-Scale Wildfire Exposure in Northwestern Iran. Nat. Hazards 2020, 101, 911–932. [Google Scholar] [CrossRef]
- Jaafari, A.; Rahmati, O.; Zenner, E.K.; Mafi-Gholami, D. Anthropogenic Activities Amplify Wildfire Occurrence in the Zagros Eco-Region of Western Iran. Nat. Hazards 2022, 114, 457–473. [Google Scholar] [CrossRef]
- Lan, Z.; Su, Z.; Guo, M.; Alvarado, E.C.; Guo, F.; Hu, H.; Wang, G. Are Climate Factors Driving the Contemporary Wildfire Occurrence in China? Forests 2021, 12, 392. [Google Scholar] [CrossRef]
- Jahdi, R.; Darvishsefat, A.A.; Etemad, V.; Mostafavi, M.A. Wind Effect on Wildfire and Simulation of Its Spread (Case Study: Siahkal Forest in Northern Iran). J. Agric. Sci. Technol. 2014, 16, 1109–1121. [Google Scholar]
- Ryu, S.-R.; Chen, J.; Zheng, D.; Lacroix, J.J. Relating Surface Fire Spread to Landscape Structure: An Application of FARSITE in a Managed Forest Landscape. Landsc. Urban Plan. 2007, 83, 275–283. [Google Scholar] [CrossRef]
- Li, X.; Zhao, G.; Yu, X.; Yu, Q. A Comparison of Forest Fire Indices for Predicting Fire Risk in Contrasting Climates in China. Nat. Hazards 2014, 70, 1339–1356. [Google Scholar] [CrossRef]
- Stratton, R.D. Assessing the Effectiveness of Landscape Fuel Treatments on Fire Growth and Behavior. J. For. 2004, 102, 32–40. [Google Scholar]
- Filippi, J.-B.; Mallet, V.; Nader, B. Representation and Evaluation of Wildfire Propagation Simulations. Int. J. Wildl. Fire 2013, 23, 46–57. [Google Scholar] [CrossRef]
- Filippi, J.-B.; Mallet, V.; Nader, B. Evaluation of Forest Fire Models on a Large Observation Database. Nat. Hazards Earth Syst. Sci. 2014, 14, 3077–3091. [Google Scholar] [CrossRef]
- Thompson, M.P.; Bowden, P.; Brough, A.; Scott, J.H.; Gilbertson-Day, J.; Taylor, A.; Anderson, J.; Haas, J.R. Application of Wildfire Risk Assessment Results to Wildfire Response Planning in the Southern Sierra Nevada, California, USA. Forests 2016, 7, 64. [Google Scholar] [CrossRef] [Green Version]
- Thompson, M.P.; Gannon, B.M.; Caggiano, M.D.; O’Connor, C.D.; Brough, A.; Gilbertson-Day, J.W.; Scott, J.H. Prototyping a Geospatial Atlas for Wildfire Planning and Management. Forests 2020, 11, 909. [Google Scholar] [CrossRef]
- CSR Group Group. Chesmandaz Scientific Research. Available online: https://gisland.org (accessed on 1 May 2021).
- INCC Iran National Cartographic Center. Available online: https://www.ncc.gov.ir/ (accessed on 8 May 2021).
- Arca, B.; Bacciu, V.; Duce, P.; Pellizzaro, G.; Salis, M.; Spano, D. Use of FARSITE Simulator to Produce Fire Probability Maps in a Mediterranean Area. In Proceedings of the 7th Symposyum on Fire and Forest Meteorology, Bar Harbor, ME, USA, 23–25 October 2007; pp. 23–26. [Google Scholar]
- Congalton, R.G. A Review of Assessing the Accuracy of Classifications of Remotely Sensed Data. Remote Sens. Environ. 1991, 37, 35–46. [Google Scholar] [CrossRef]
- Miller, C. Simulation of the Consequences of Different Fire Regimes to Support Wildland Fire Use Decisions. Fire Ecol. 2007, 3, 83–102. [Google Scholar] [CrossRef]
- Hammond, D.H.; Strand, E.K.; Hudak, A.T.; Newingham, B.A. Boreal Forest Vegetation and Fuel Conditions 12 Years after the 2004 Taylor Complex Fires in Alaska, USA. Fire Ecol. 2019, 15, 32. [Google Scholar] [CrossRef] [Green Version]
- Heisig, J.; Olson, E.; Pebesma, E. Predicting Wildfire Fuels and Hazard in a Central European Temperate Forest Using Active and Passive Remote Sensing. Fire 2022, 5, 29. [Google Scholar] [CrossRef]
- Li, X.; Zhang, M.; Zhang, S.; Liu, J.; Sun, S.; Hu, T.; Sun, L. Simulating Forest Fire Spread with Cellular Automation Driven by a LSTM Based Speed Model. Fire 2022, 5, 13. [Google Scholar] [CrossRef]
- Anderson, H.E. Aids to Determining Fuel Models for Estimating Fire Behavior [Grass, Shrub, Timber, and Slash, Photographic Examples, Danger Ratings]; USDA Forest Service general technical report; US Department of Agriculture, Forest Service, Intermountain Forest and Range Experiment Station: Fort Collins, CO, USA, 1982. [Google Scholar]
- Anderson, H.E. Aids to Determining Fuel Models for Estimating Fire Behavior; US Department of Agriculture, Forest Service, Intermountain Forest and Range: Ogden, UT, USA, 1981; Volume 122. [Google Scholar]
- Scott, J.H. Standard Fire Behavior Fuel Models: A Comprehensive Set for Use with Rothermel’s Surface Fire Spread Model; US Department of Agriculture, Forest Service, Rocky Mountain Research Station: Fort Collins, CO, USA, 2005. [Google Scholar]
- IRIMO Iran Meteorological Organization. Available online: https://www.irimo.ir (accessed on 1 July 2020).
- Rothermel, R.C. How to Predict the Spread and Intensity of Forest and Range Fires; US Department of Agriculture, Forest Service, Intermountain Forest and Range: Ogden, UT, USA, 1983; Volume 143. [Google Scholar]
- WUW Website Weather Underground’s WunderMap. Available online: https://www.wunderground.com/ (accessed on 7 November 2021).


| Item | Simulation Information | Input Parameter |
|---|---|---|
| 1 | Latitude of fire starting point | 37.10° |
| 2 | Longitude of fire starting point | 49.85° |
| 3 | Height of fire starting point (m) | 120 |
| 4 | Maximum air temperature (°C) | 23 |
| 5 | Minimum air temperature (°C) | 5 |
| 6 | Precipitation (mm) | 0 |
| 7 | Maximum Wind Speed (km/h) | 33.79 |
| 8 | Average Wind Speed (km/h) | 19.42 |
| 9 | Average wind direction | S |
| 10 | Average air relative humidity (%) | 39 |
| 11 | The moment the fire starts | 17 December 2010—(17:00) |
| 12 | The moment of the end of the fire | 18 December 2010—(08:00) |
| Level | and SC Value Range | Interpretation |
|---|---|---|
| 1 | <0 | No agreement |
| 2 | [0.0–0.2] | Slight agreement |
| 3 | [0.2–0.4] | Fair agreement |
| 4 | [0.4–0.6] | Moderate agreement |
| 5 | [0.6–0.8] | Substantial agreement |
| 6 | [0.8–1.0] | Almost perfect agreement |
| Item | Fuel | Code |
|---|---|---|
| 1 | Residential Area | NB1 |
| 2 | Agricultural Land | NB3 |
| 3 | Uncovered Land | NB9 |
| 4 | Natural Forest (Timber–Grass–Shrub) | TU3 |
| 5 | Low-Density Broadleaf Forestry | TL2 |
| 6 | Medium-Density Broadleaf Forestry | TL6 |
| 7 | Coniferous Forests | TL8 |
| 8 | High-Density Broadleaf Forestry | TL9 |
| 9 | Hardwood litter | FM9 |
| 10 | Timber (litter and understory) | FM10 |
| Item | Simulation Information | Value |
|---|---|---|
| 1 | Average air temperature (°C) | 20 |
| 2 | Average air relative humidity (%) | 39 |
| 3 | Fuel Moisture Correction | 7 |
| 4 | Fire month | December |
| 5 | Shading status of vegetation in the area | Shady |
| 6 | Height of the fire point relative to the meteorological station | Above the meteorological station |
| 7 | Slope orientation | Southern |
| 8 | Ground slope | 0–30% |
| 9 | Dead Fuel Moisture Content Correction (%) | 6 |
| 10 | The initial moisture of the dead fuel | 13 |
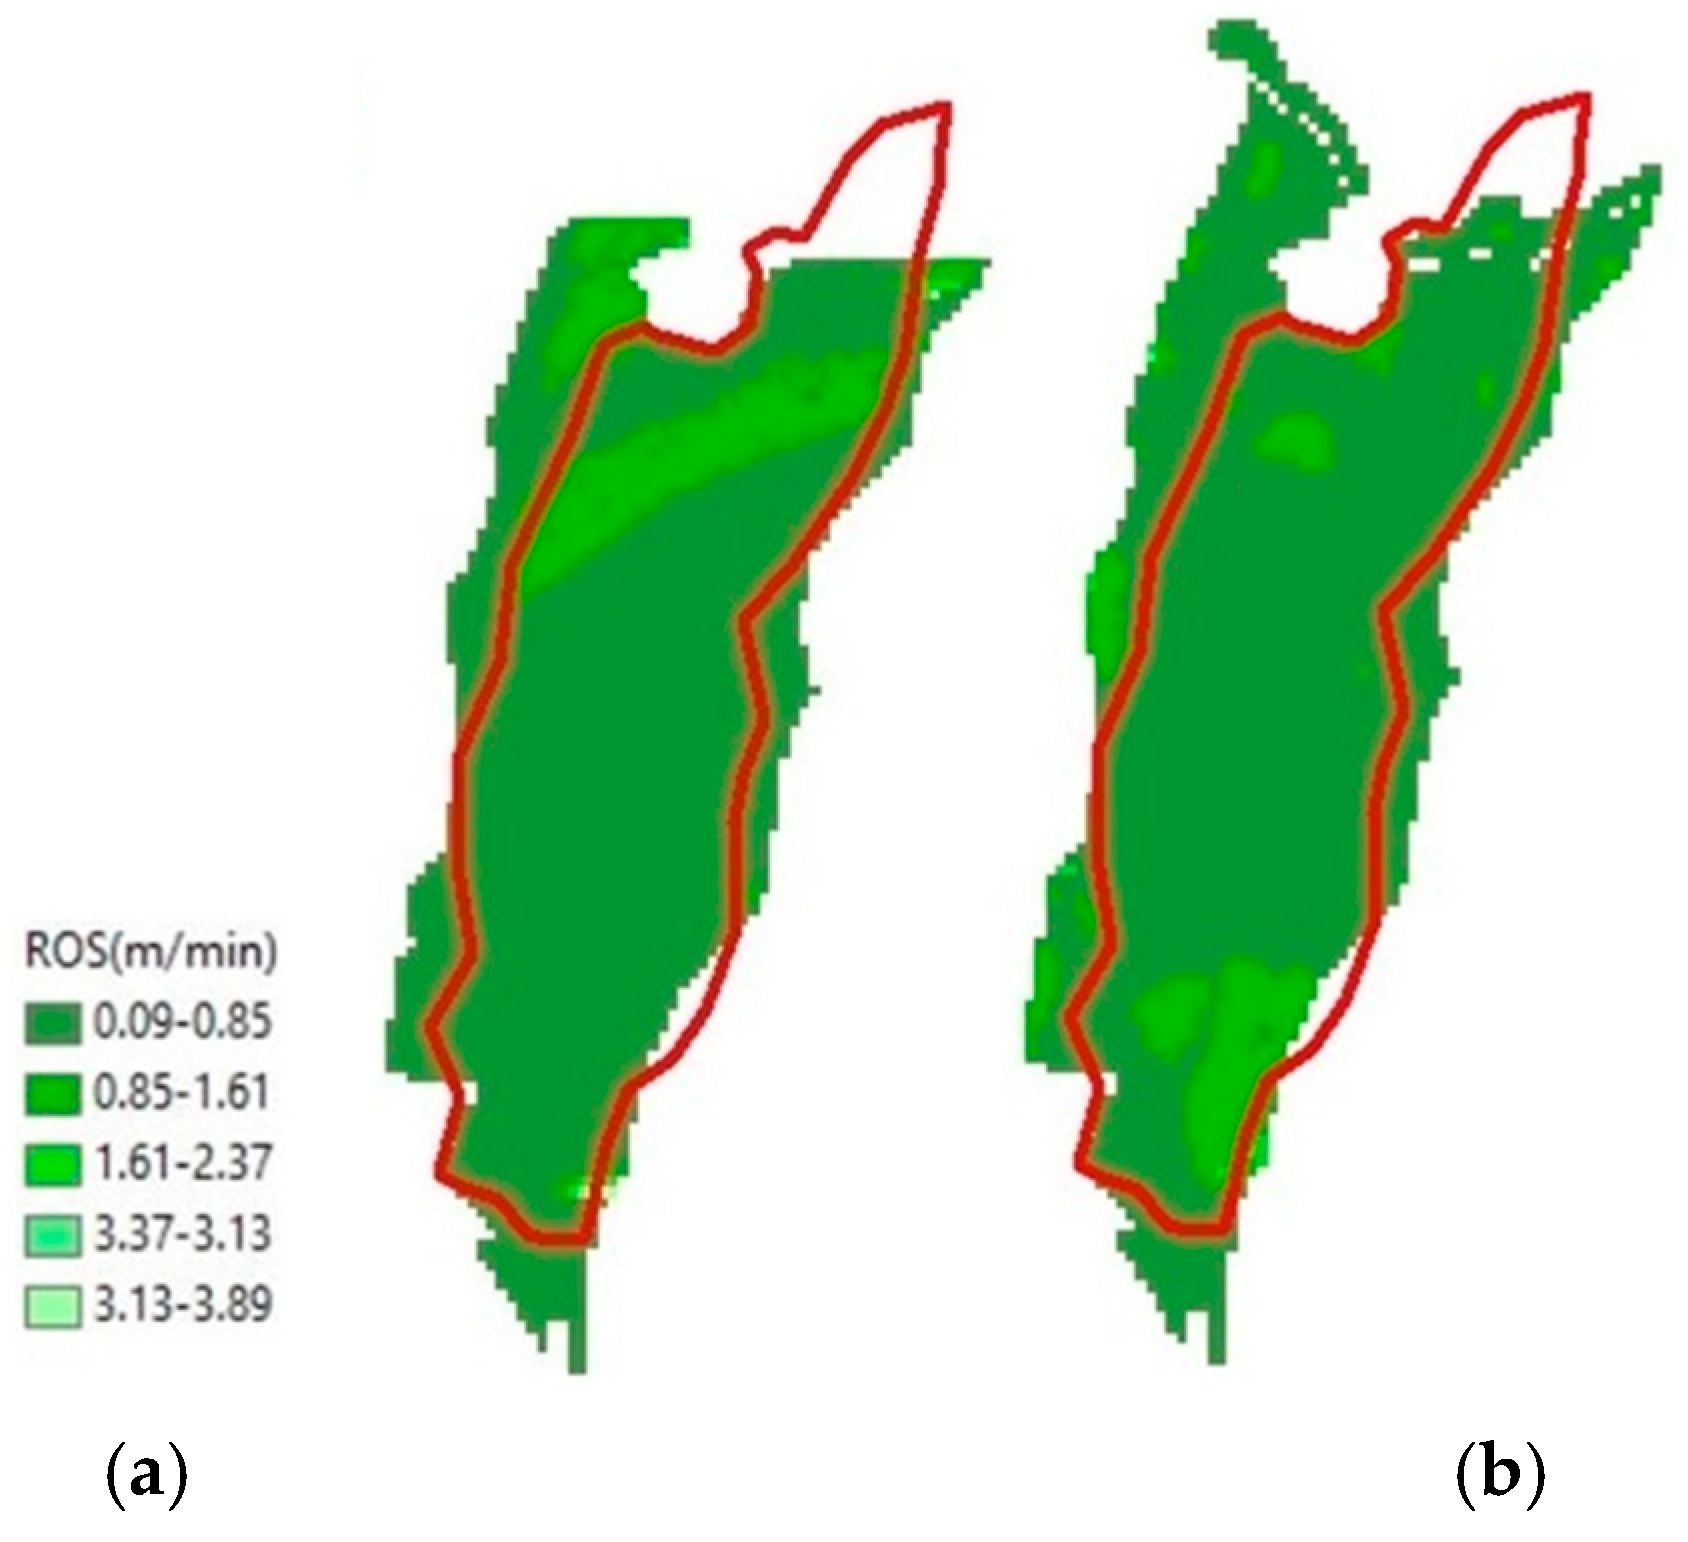
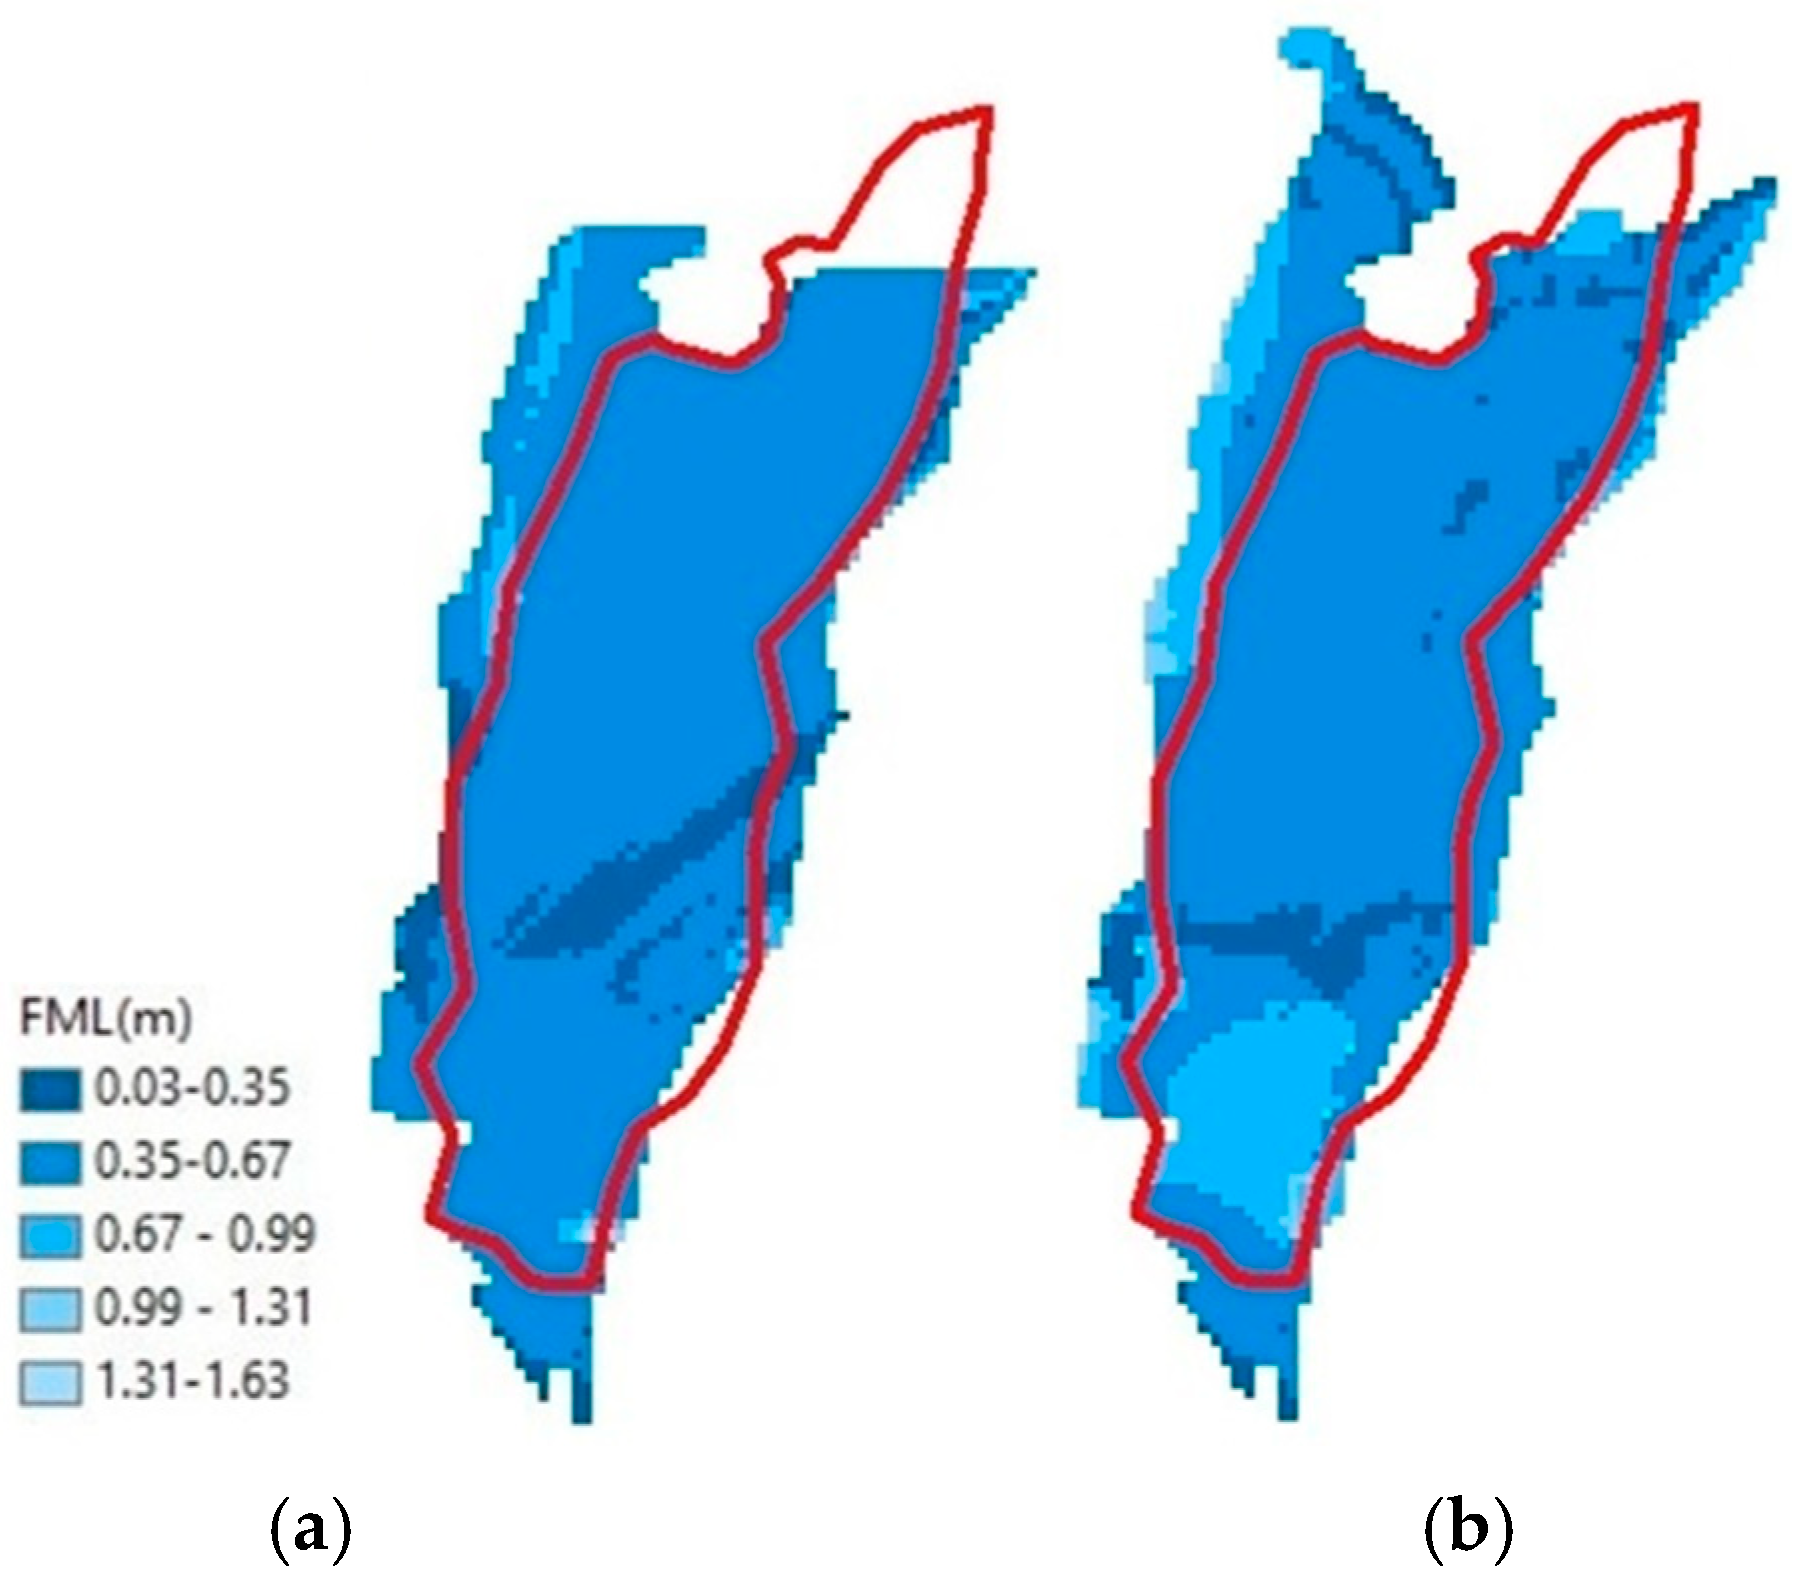
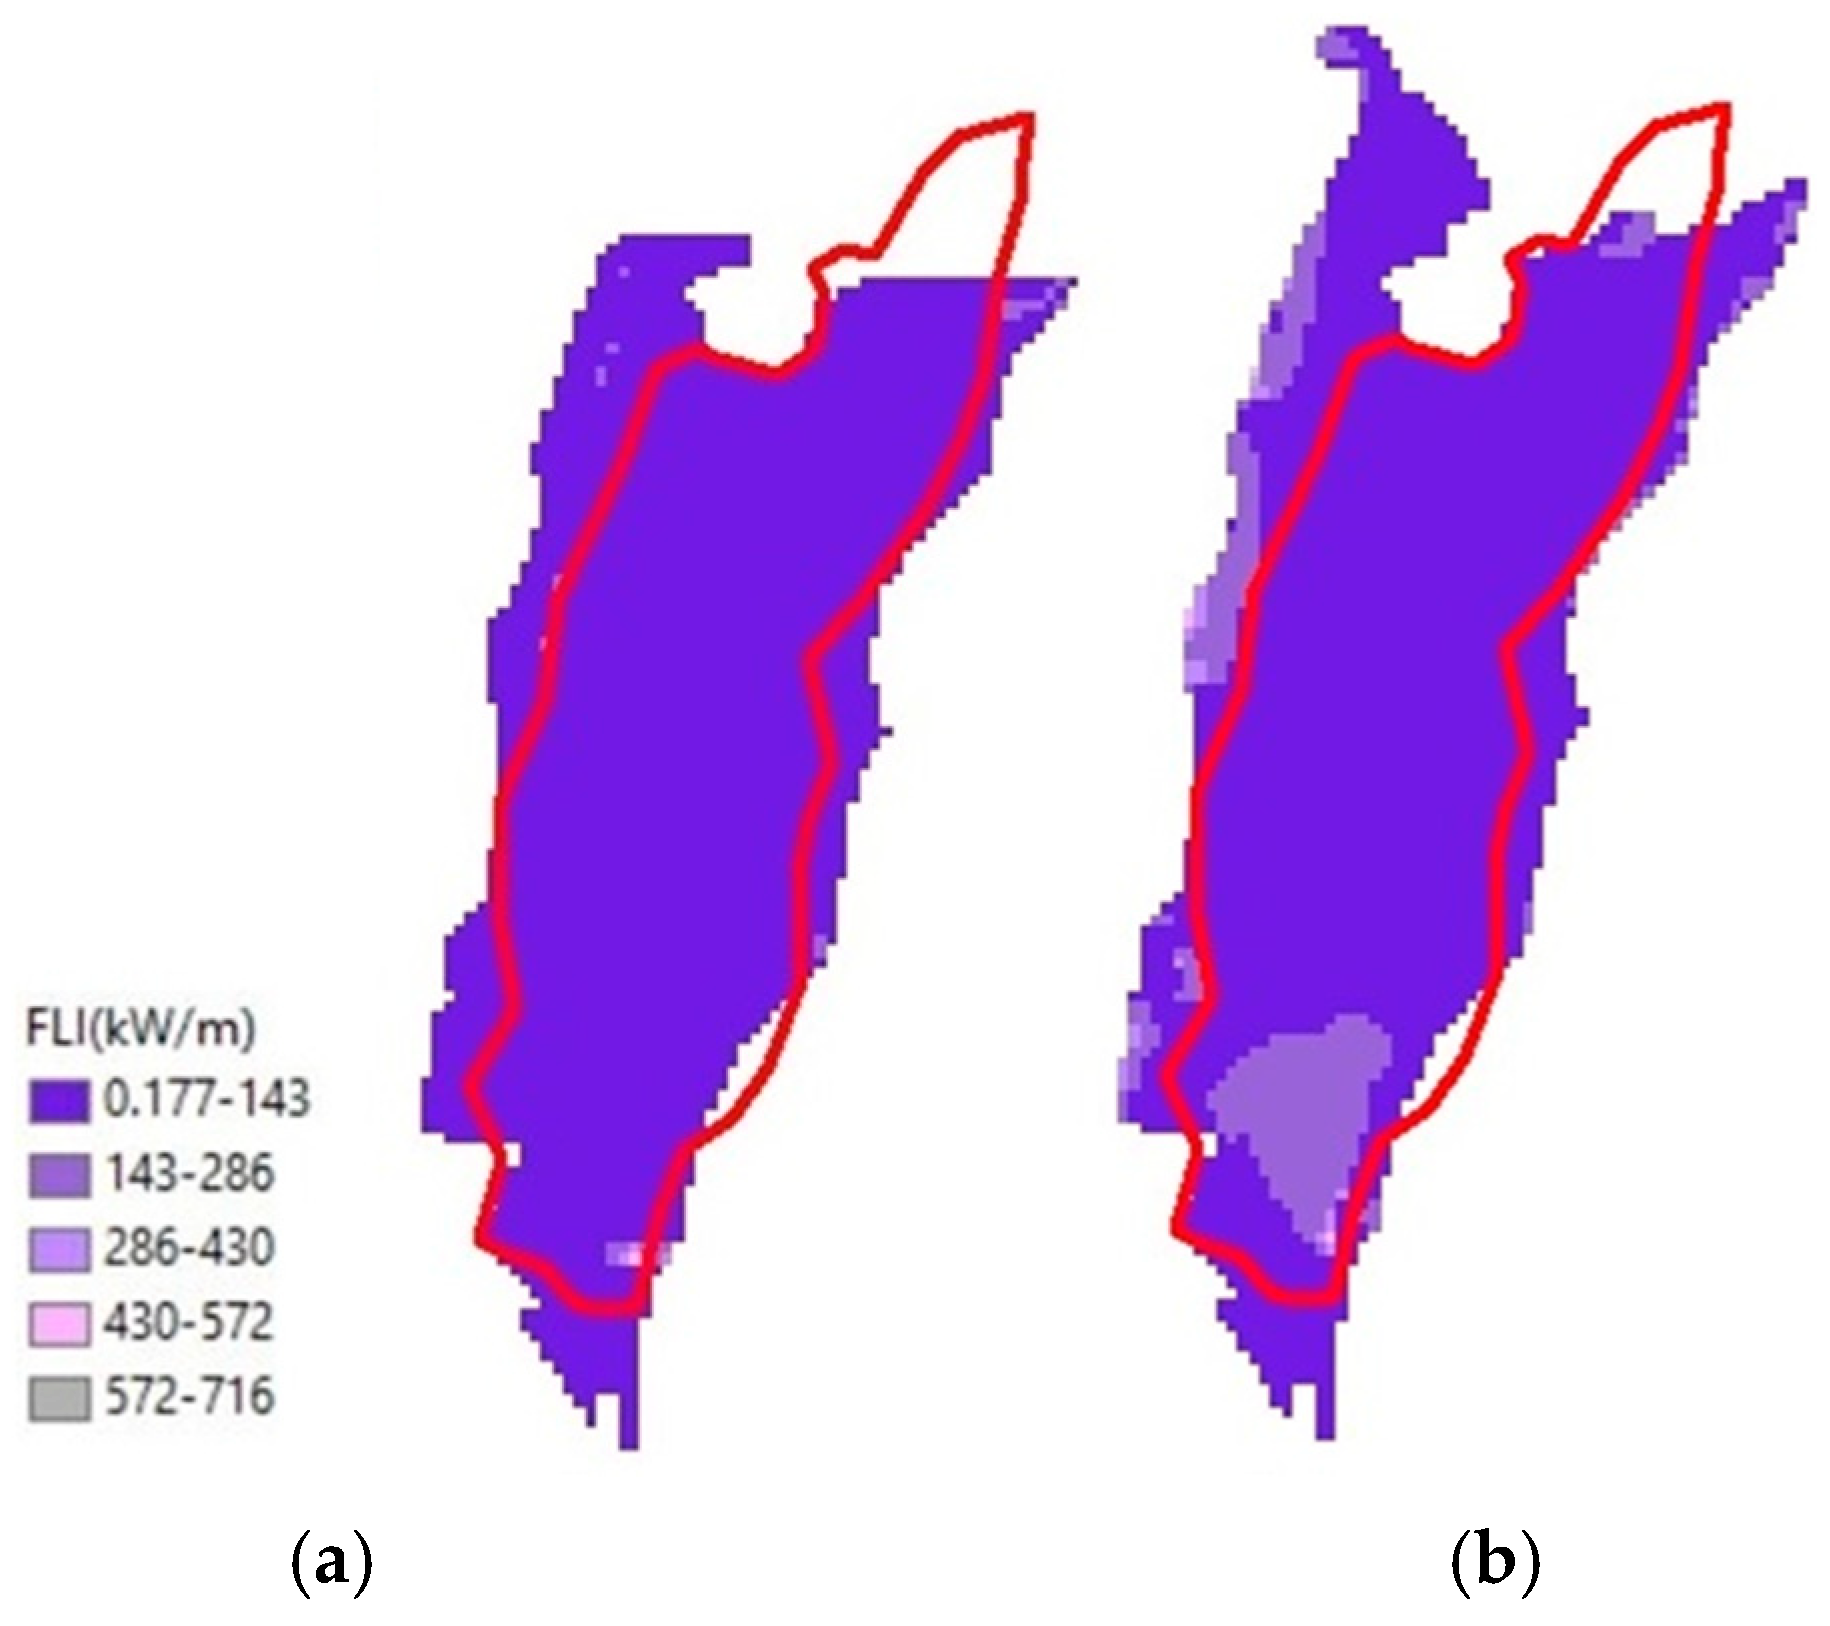
| ROS (m/min) | Fire Line Intensity (kW/m) | Flame Length (m) | Fire Behavior Severity |
|---|---|---|---|
| 0–0.6 | 0–10 | 0–0.3 | Very low |
| 0.6–1.6 | 10–100 | 0.3–1.2 | Low |
| 1.6–6.6 | 100–1000 | 1.2–2.4 | Medium |
| 6.6–16.6 | 1000–10,000 | 2.4–3.6 | High |
| 16.6–50 | 10,000–100,000 | 3.6–7.5 | Very High |
| >50 | >100,000 | >7.5 | Intense |
| Scenario | Flammable Fuel Groups | a (ha) | b (ha) | c (ha) | SC | OI | |
|---|---|---|---|---|---|---|---|
| V1 | (TL6, TL9) | 16.21 | 5.29 | 7.84 | 0.71 | 0.68 | −0.19 |
| V2 | (FM9, TL9) | 20.14 | 6.06 | 3.91 | 0.80 | 0.78 | 0.22 |
| V3 | (TL6, FM9) | 15.77 | 4.63 | 8.28 | 0.71 | 0.68 | −0.28 |
| V4 | (TL6, FM10) | 16.74 | 4.26 | 7.31 | 0.74 | 0.72 | −0.26 |
| V5 | (FM9) | 18.94 | 5.16 | 5.11 | 0.79 | 0.76 | 0.01 |
| Fuel Type 1 | ROS (m/min) | Fire Line Intensity (kW/m) | Flame Length (m) |
|---|---|---|---|
| (TL6, TL9) | 0.41 ± 0.16 | 42.51 ± 28.43 | 0.41 ± 0.11 |
| (FM9, TL9) | 0.47 ± 0.18 | 40.87 ± 28.43 | 0.41 ± 0.11 |
| (TL6, FM9) | 0.37 ± 0.14 | 26.88 ± 10.44 | 0.34 ± 0.06 |
| (TL6, FM10) | 0.46 ± 0.16 | 47.24 ± 37.78 | 0.42 ± 0.14 |
| (FM9) | 0.43 ± 0.17 | 27.33 ± 11.31 | 0.34 ± 0.06 |
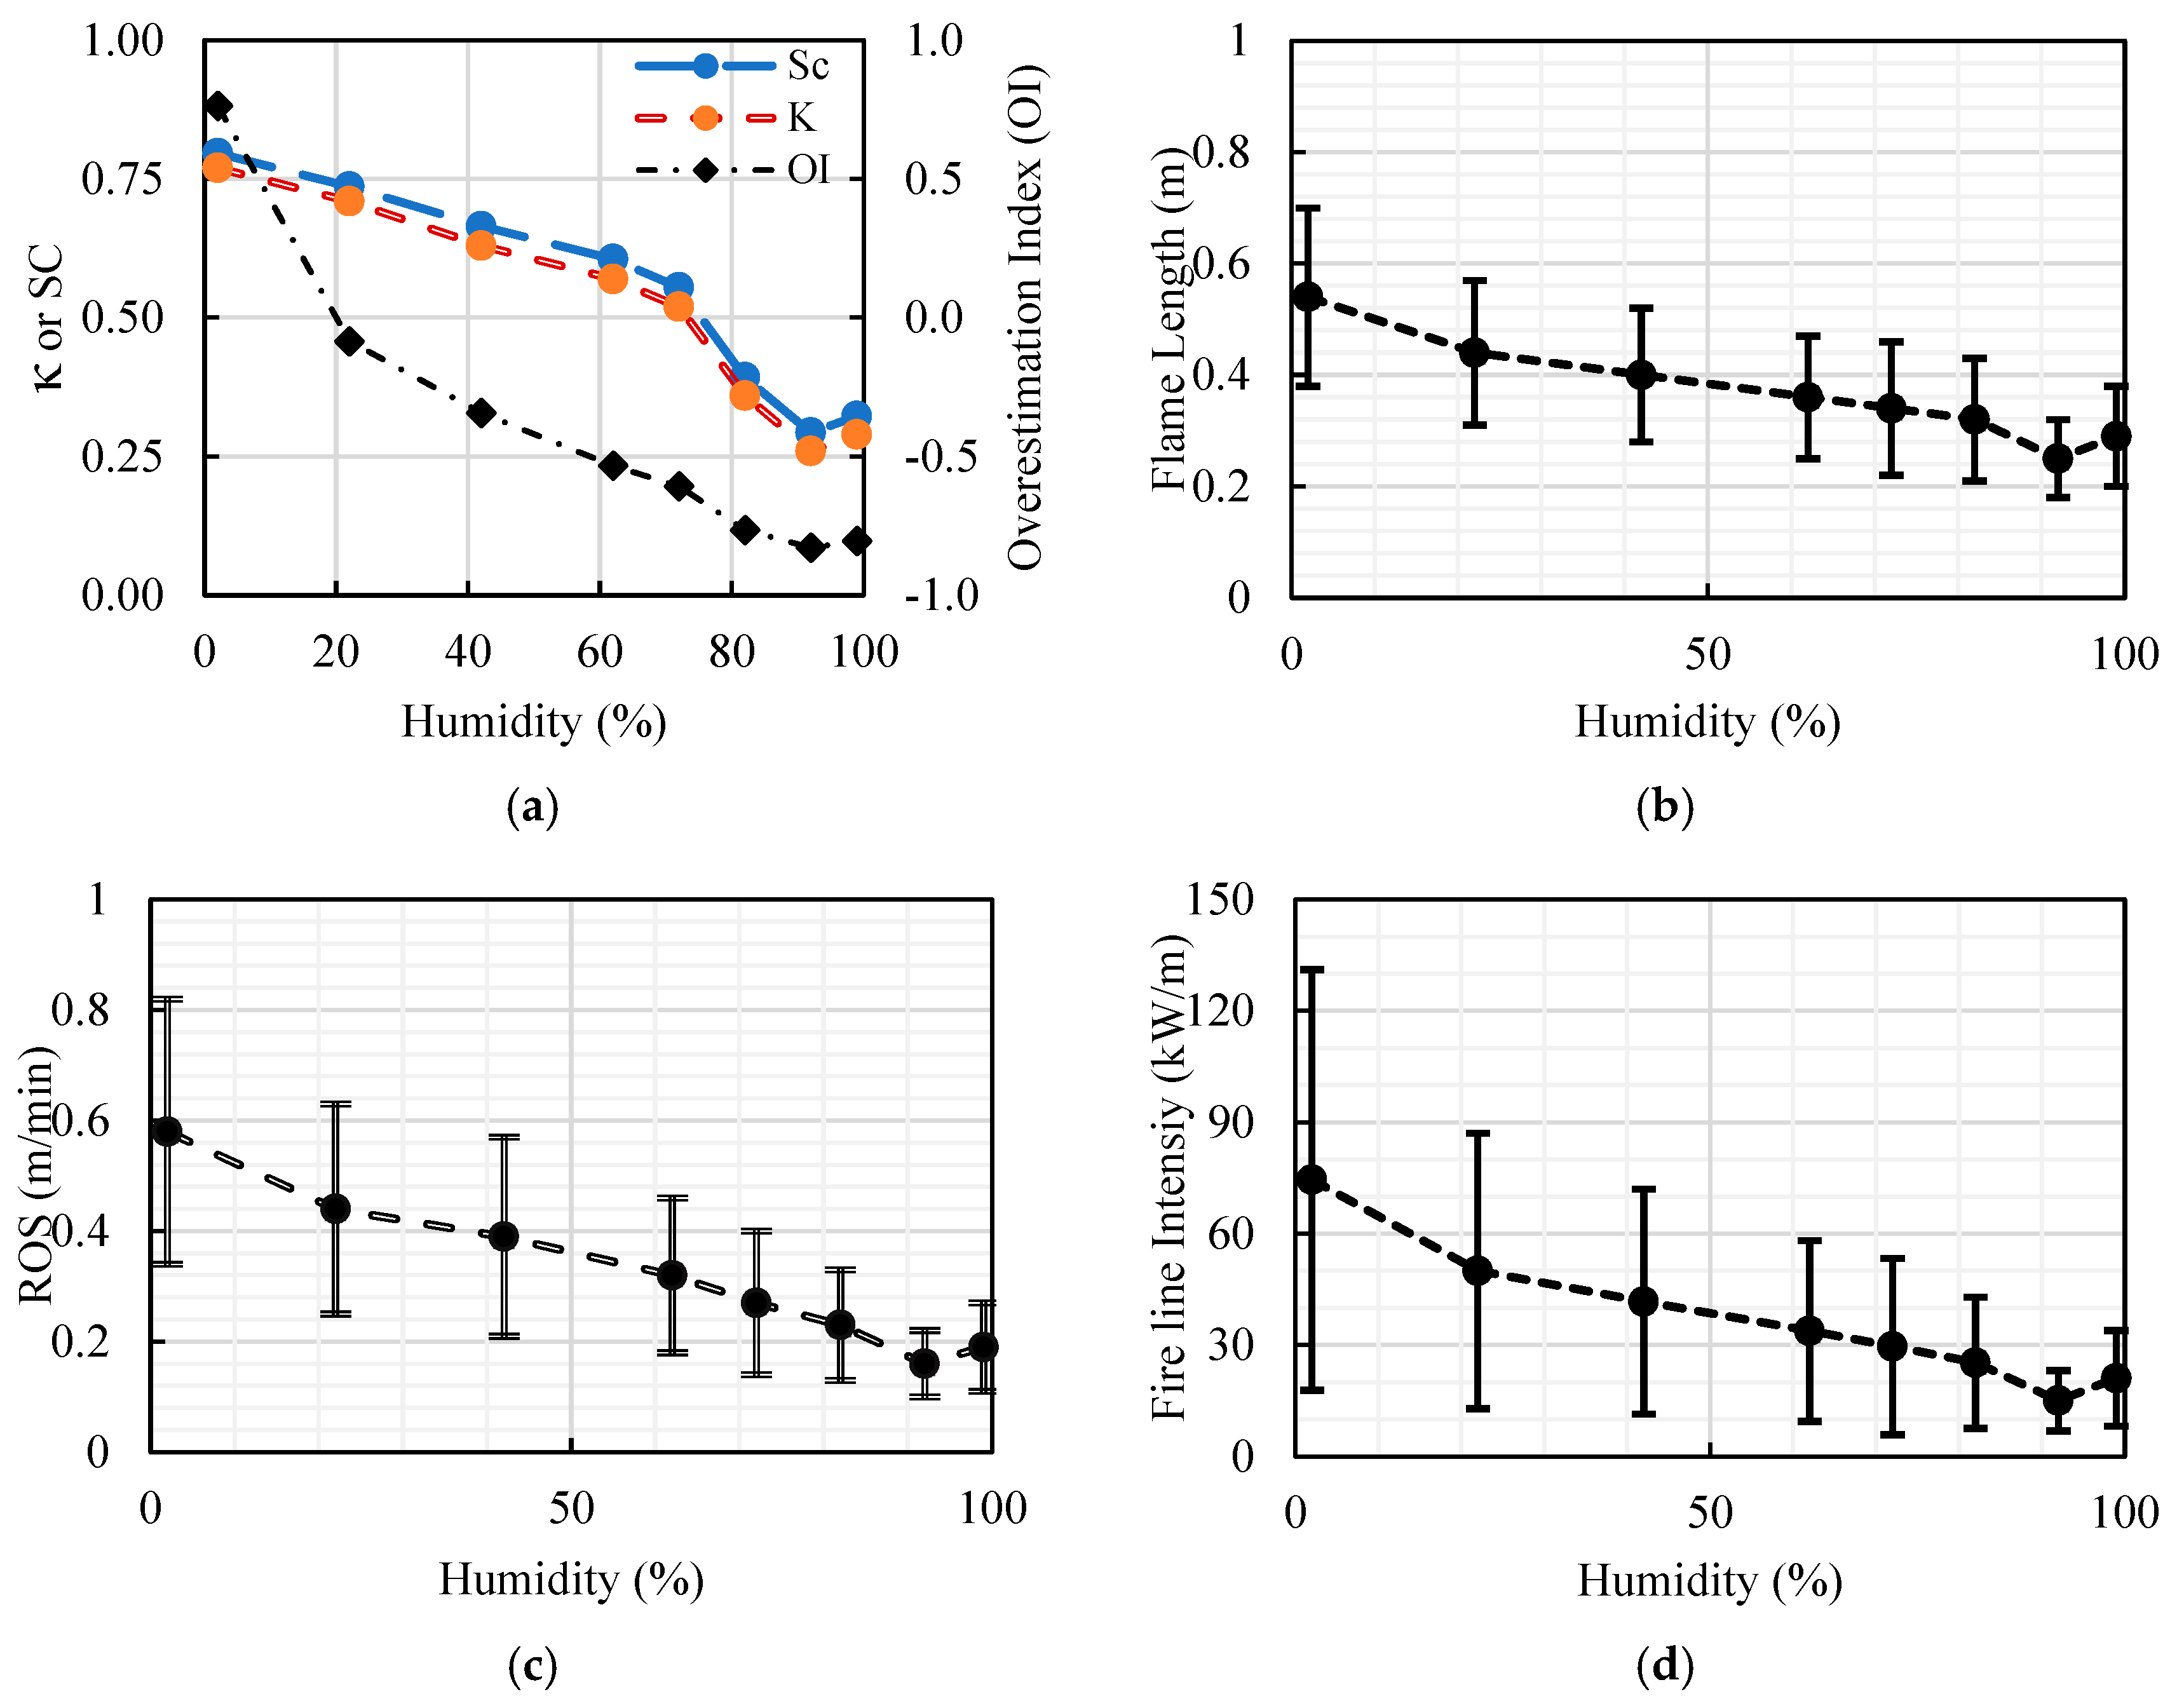
| Scenario | a (ha) | b (ha) | c (ha) | SC | OI | ROS (m/min) | Fire Line Intensity (kW/m) | Flame Length (m) | |
|---|---|---|---|---|---|---|---|---|---|
| Sc.01 | 22.68 | 10.22 | 1.37 | 0.80 | 0.77 | 0.76 | 0.58 ± 0.24 | 74.54 ± 56.61 | 0.54 ± 0.16 |
| Sc.02 | 17.32 | 5.68 | 6.73 | 0.74 | 0.71 | −0.08 | 0.44 ± 0.19 | 50 ± 37.04 | 0.44 ± 0.13 |
| Sc.03 | 14.35 | 4.75 | 9.70 | 0.67 | 0.63 | −0.34 | 0.39 ± 0.18 | 41.71 ± 30.26 | 0.4 ± 0.12 |
| Sc.04 | 12.04 | 3.66 | 12.01 | 0.61 | 0.57 | −0.53 | 0.32 ± 0.14 | 33.86 ± 24.37 | 0.36 ± 0.11 |
| Sc.05 | 10.11 | 3.19 | 13.04 | 0.55 | 0.52 | −0.61 | 0.27 ± 0.13 | 29.66 ± 23.77 | 0.34 ± 0.12 |
| Sc.06 | 6.45 | 2.35 | 17.60 | 0.39 | 0.36 | −0.76 | 0.23 ± 0.1 | 25.28 ± 17.62 | 0.32 ± 0.11 |
| Sc.07 | 4.45 | 1.85 | 19.60 | 0.29 | 0.26 | −0.83 | 0.16 ± 0.06 | 15.07 ± 8.13 | 0.25 ± 0.07 |
| Sc.08 | 5.03 | 2.07 | 19.02 | 0.32 | 0.29 | −0.80 | 0.19 ± 0.08 | 21.11 ± 12.86 | 0.29 ± 0.09 |
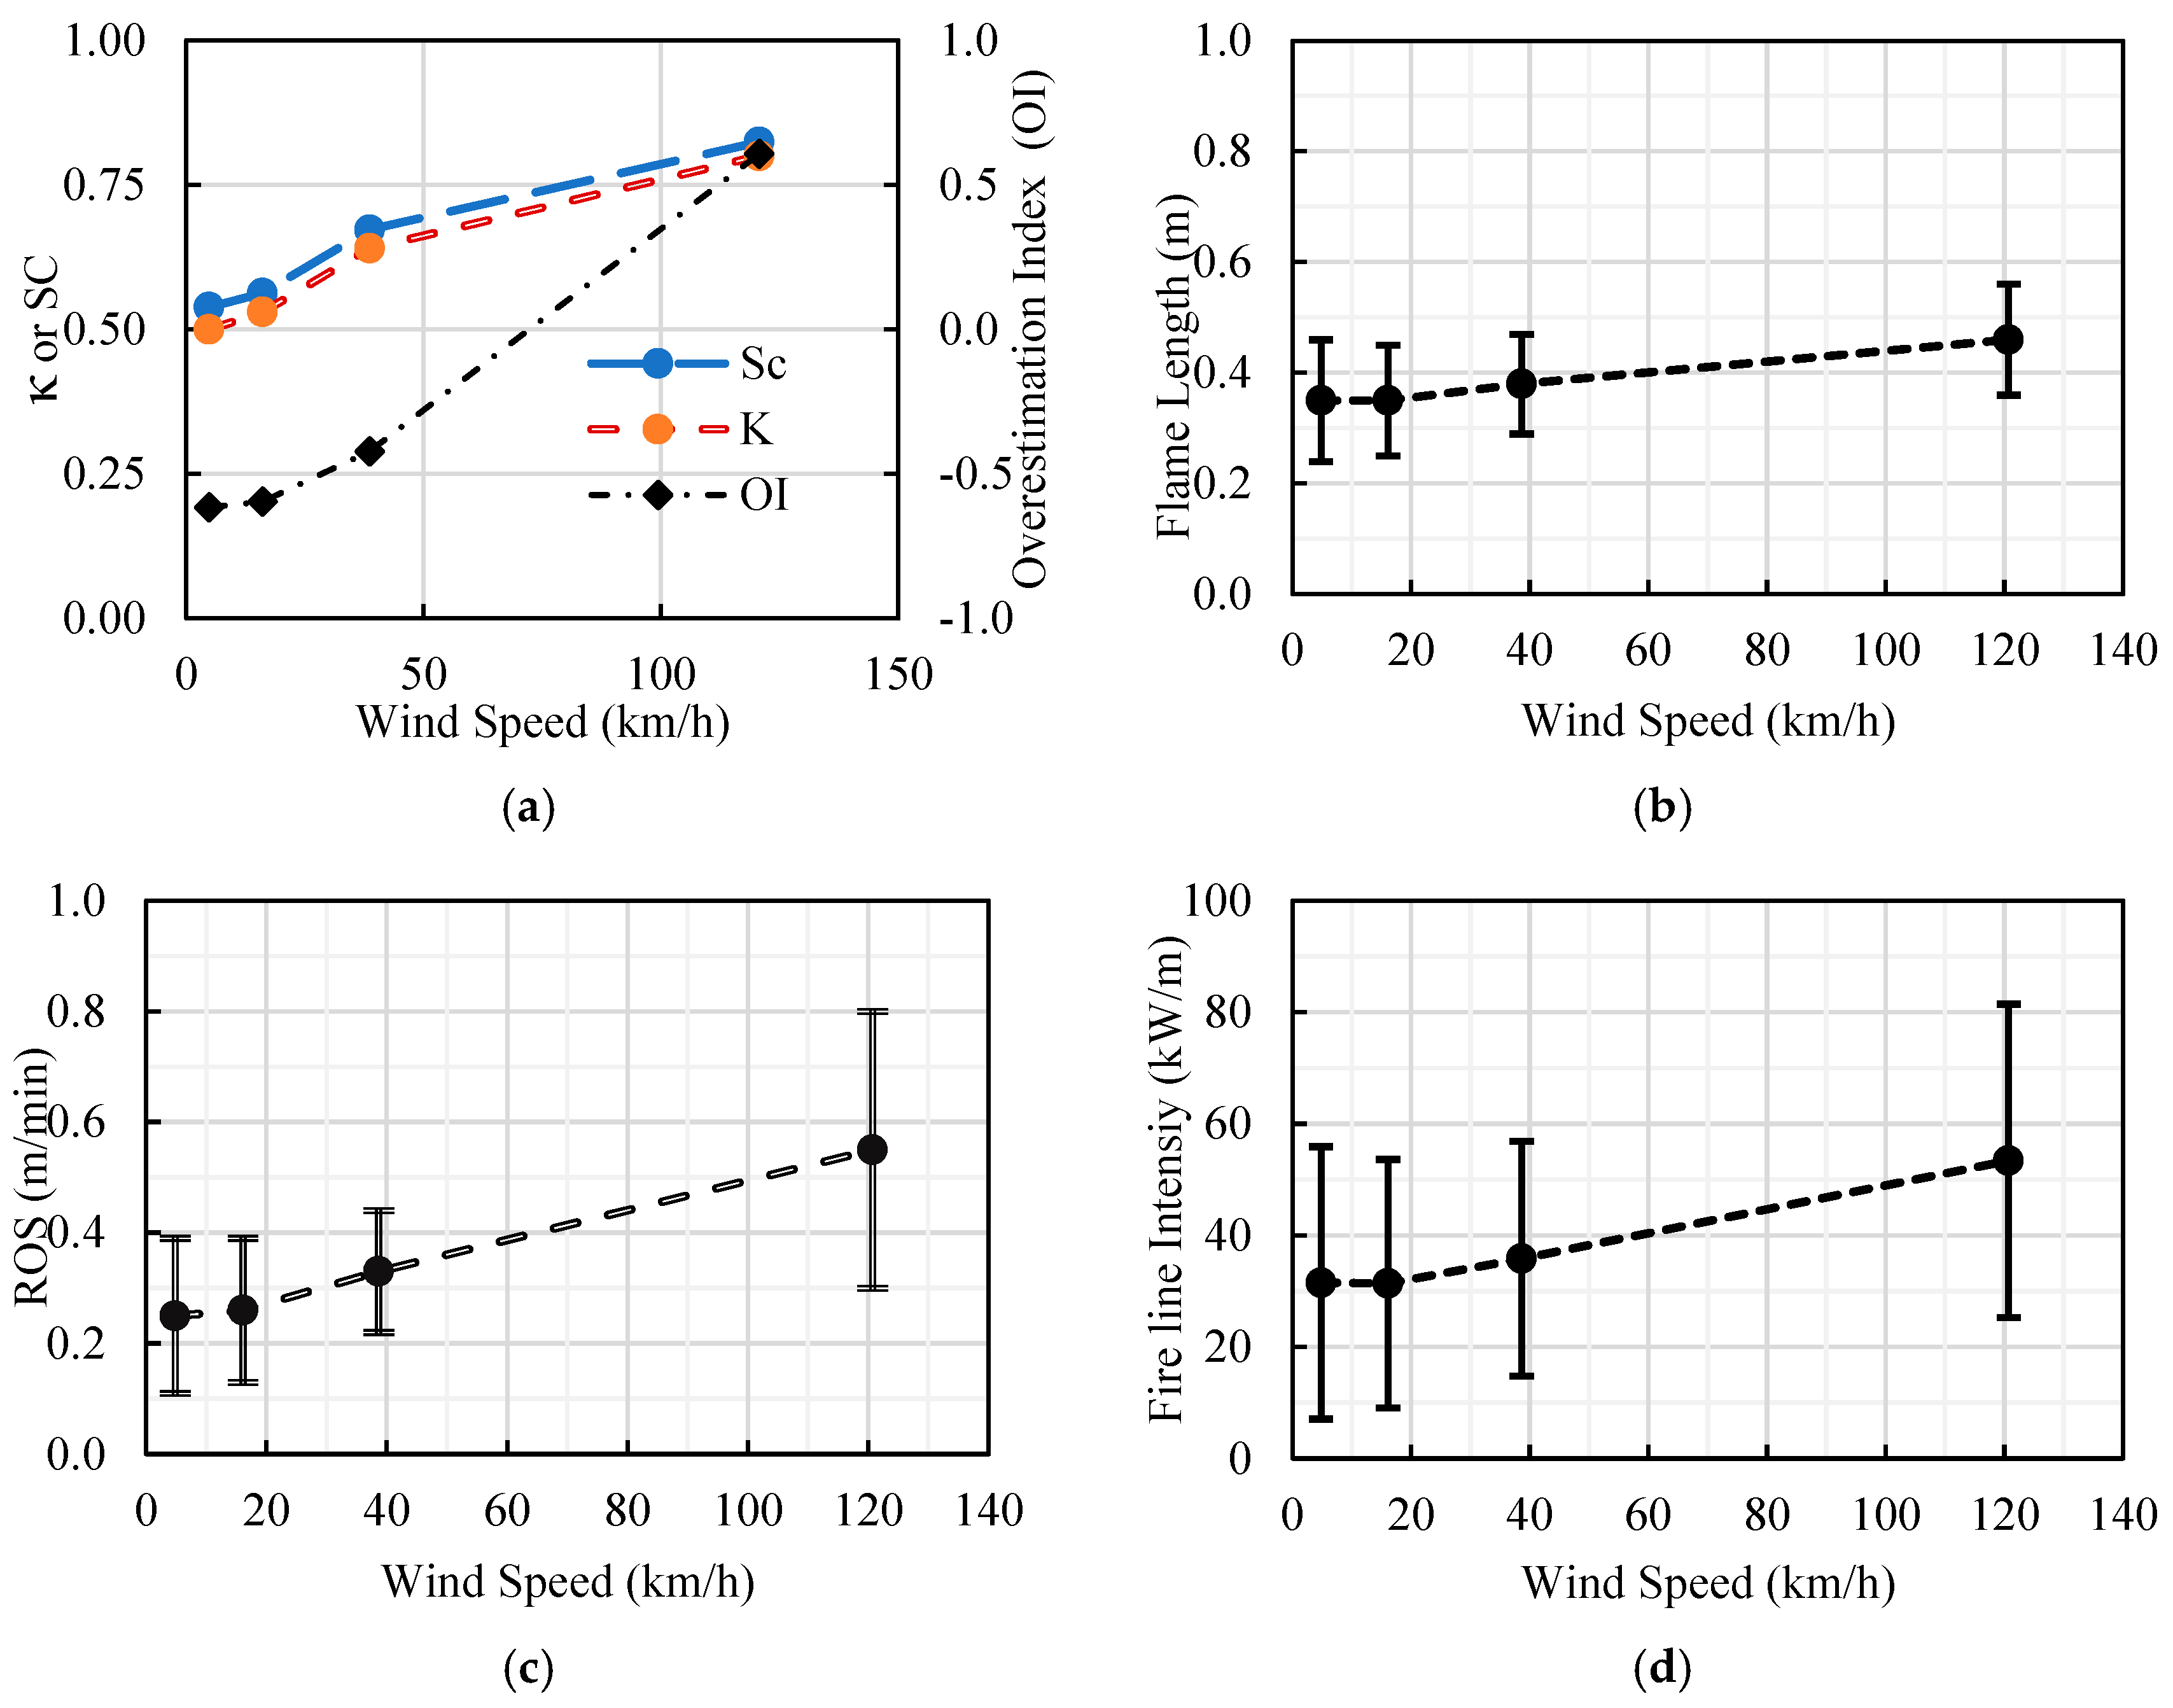
| Sc.09 | 10.08 | 3.32 | 13.97 | 0.54 | 0.50 | −0.62 | 0.25 ± 0.14 | 31.51 ± 24.4 | 0.35 ± 0.11 |
| Sc.10 | 10.73 | 3.37 | 13.32 | 0.56 | 0.53 | −0.60 | 0.26 ± 0.13 | 31.37 ± 22.27 | 0.35 ± 0.1 |
| Sc.11 | 14.20 | 4.00 | 9.85 | 0.67 | 0.64 | −0.42 | 0.33 ± 0.11 | 35.82 ± 21.04 | 0.38 ± 0.09 |
| Sc.12 | 22.19 | 7.61 | 1.86 | 0.82 | 0.80 | 0.61 | 0.55 ± 0.25 | 53.39 ± 28.08 | 0.46 ± 0.1 |
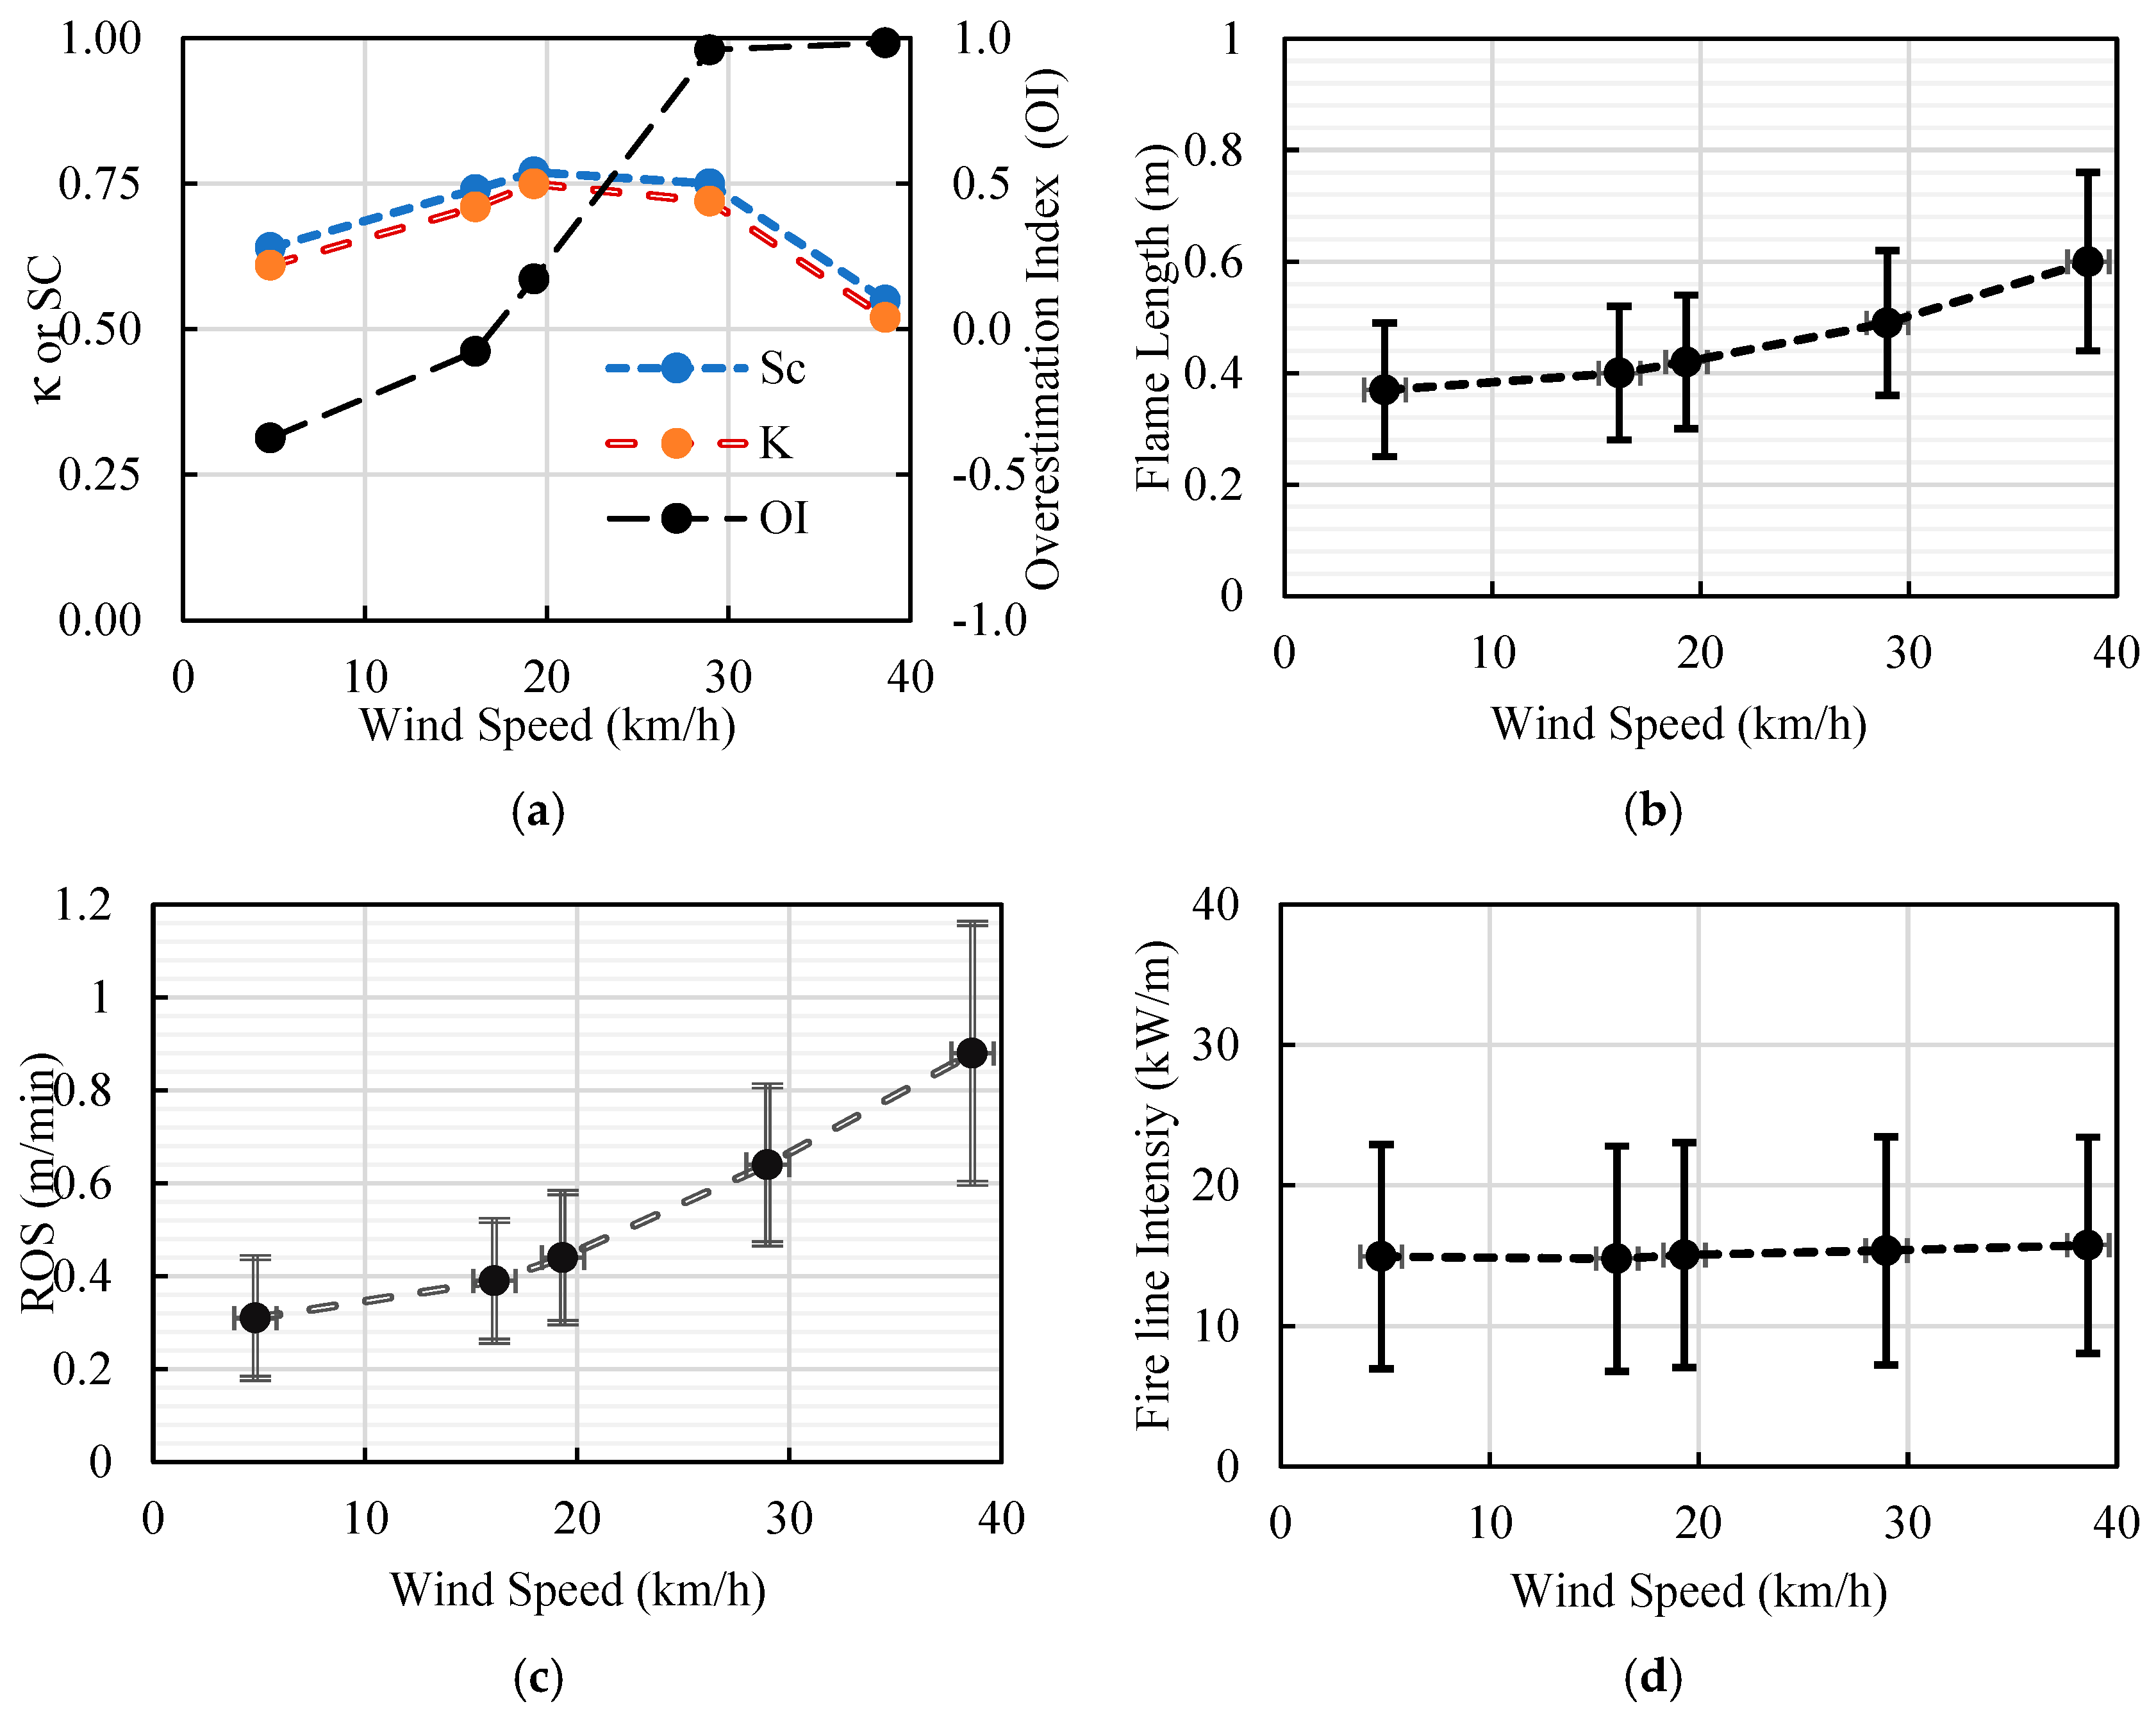
| Sc.13 | 13.66 | 4.74 | 10.39 | 0.64 | 0.61 | −0.37 | 0.31 ± 0.13 | 14.95 ± 7.99 | 0.37 ± 0.12 |
| Sc.14 | 17.34 | 5.76 | 6.71 | 0.74 | 0.71 | −0.08 | 0.39 ± 0.13 | 14.80 ± 8.02 | 0.40 ± 0.12 |
| Sc.15 | 19.39 | 6.61 | 4.66 | 0.77 | 0.75 | 0.17 | 0.44 ± 0.14 | 15.06 ± 8.01 | 0.42 ± 0.12 |
| Sc.16 | 23.75 | 14.75 | 0.3 | 0.75 | 0.72 | 0.96 | 0.64 ± 0.17 | 15.37 ± 8.12 | 0.49 ± 0.13 |
| Sc.17 | 23.75 | 37.95 | 0.3 | 0.55 | 0.52 | 0.98 | 0.88 ± 0.28 | 15.76 ± 7.71 | 0.60 ± 0.16 |
Disclaimer/Publisher’s Note: The statements, opinions and data contained in all publications are solely those of the individual author(s) and contributor(s) and not of MDPI and/or the editor(s). MDPI and/or the editor(s) disclaim responsibility for any injury to people or property resulting from any ideas, methods, instructions or products referred to in the content. |
© 2023 by the authors. Licensee MDPI, Basel, Switzerland. This article is an open access article distributed under the terms and conditions of the Creative Commons Attribution (CC BY) license (https://creativecommons.org/licenses/by/4.0/).
Share and Cite
Mohammadian Bishe, E.; Norouzi, M.; Afshin, H.; Farhanieh, B. A Case Study on the Effects of Weather Conditions on Forest Fire Propagation Parameters in the Malekroud Forest in Guilan, Iran. Fire 2023, 6, 251. https://doi.org/10.3390/fire6070251
Mohammadian Bishe E, Norouzi M, Afshin H, Farhanieh B. A Case Study on the Effects of Weather Conditions on Forest Fire Propagation Parameters in the Malekroud Forest in Guilan, Iran. Fire. 2023; 6(7):251. https://doi.org/10.3390/fire6070251
Chicago/Turabian StyleMohammadian Bishe, Esmaeil, Mohammad Norouzi, Hossein Afshin, and Bijan Farhanieh. 2023. "A Case Study on the Effects of Weather Conditions on Forest Fire Propagation Parameters in the Malekroud Forest in Guilan, Iran" Fire 6, no. 7: 251. https://doi.org/10.3390/fire6070251