


Experimental Study of Scale Effect in Tunnel Fires at Different Sealing Ratios
1
Sichuan Building Materials Industry & Fire Research Institute Co., Ltd., Chengdu 610000, China
2
Department of Fire Safety Engineering, Southwest Jiaotong University, Chengdu 610000, China
3
School of Architecture and Design, Southwest Jiaotong University, Chengdu 610000, China
*
Author to whom correspondence should be addressed.
Fire 2023, 6(3), 92; https://doi.org/10.3390/fire6030092
Submission received: 6 February 2023
/
Revised: 19 February 2023
/
Accepted: 21 February 2023
/
Published: 28 February 2023
(This article belongs to the Special Issue Advance in Tunnel Fire Research)
Abstract
:Fully or partially sealing the openings of tunnels to accelerate the self-extinction of fires provides a promising firefighting tactic to beat large fires in a long tunnel. So far, most experimental studies on the characteristics of fire with different sealing ratios have been conducted in reduced-scale tunnels. However, whether the findings in a reduced-scale tunnel can be converted to its full-scale prototype tunnel based on scaling laws has not yet been adequately studied. A series of experiments with heat-release rates of 15.8, 31.6 and 63.2 kW were conducted with sealing ratios ranging from 0% to 100% in a prototype tunnel measuring 20 m long, 0.9 m wide and 0.46 m high. The experimental results were compared with those from a 1/2 reduced-scale tunnel measuring 10 m long, 0.45 m wide and 0.23 m high. It showed that temperature rise along the tunnel in the 1/2 reduced-tunnel could be significantly underestimated. The differences in temperature rise increased monotonously with distance away from the fire seat, and they were as high as 70% at the tunnel portals, irrespective of the heat-release rates and sealing ratios. The study showed that the scale effect of fires was not sensitive to the Reynolds number of flows in tunnels. The minimal sealing ratio for the self-extinction of fires in the prototype tunnel was 85%, whilst it was 75% in the 1/2 reduced-scale tunnel, and the study revealed that the fires were much easier to extinguish in the 1/2 reduced-scale tunnel than those in the prototype tunnel, where the fires can sustain in a lower oxygen concentration. The study demonstrated that scaling laws could be invalid for tunnel fires with different sealing ratios and that results observed in reduced-scale tunnels should be further verified when applied to full-scale prototypes.
1. Introduction
Sealing the portals of a tunnel so as to prevent the access of fresh air from reaching the fire seat provides an alternative approach for firefighters to extinguish a fire in long tunnels. Full-scale fire experiments are limited by costs and resources, whilst reduced-scale models based on the governing laws of physics are a cost-effective alternative means to gain detailed insights into fire dynamics and allow fire investigators to replicate fire scenarios at a dramatically reduced cost. Scaling laws based on preserving the Froude number, which characterizes the ratio between inertia and buoyancy forces, have been widely used in small-scale fire experiments [1,2,3,4,5,6,7,8]. A number of studies were conducted in reduced-scale tunnels with different sealing ratios to explore the characteristics of fires. Chen et al. [9] performed a set of experimental tests in a 1/9 reduced-scale tunnel to study the effect of asymmetrical sealing of tunnel portals on fire behavior and temperature distribution. The results showed that the hot smoke region shifts to the side that is not completely sealed, and the combustion at the side with a lower sealing ratio is more violent with a higher temperature and longer flame length. Chen et al. [10] further conducted a series of experiments to explore the characteristics of combustion in the 1/9 reduced-scale tunnel with sealing ratios varying from 0%, 25%, 50%, 75% and 100%. The experimental results demonstrated that the temperatures under the tunnel ceiling varied greatly with sealing ratios, which was primarily due to the comprehensive effect between the heat loss from the hot smoke flowing out of the tunnel portals and the heat produced by fire, and both of these factors were related to the opening area of tunnel portals. Huang et al. [11] numerically investigated tunnel fires with different heat-release rates with sealing ratios varying from 0% to 100%. Yao et al. [3,12] experimentally investigated fire behavior in a completely sealed reduced-scale tunnel and found that the flame tended to incline towards the closer end-wall with an increasing angle when it approached the end-wall. Yao et al. [13] further studied under-ventilated fires in a model tunnel and found that early sealing before the violent burning stage can decrease the maximum mass loss rate to half of that without sealing for cases with sealing ratios of 75 + 75% and 75 + 100% at both ends of the tunnel, and that a higher sealing ratio resulted in a lower mass loss rate and a higher CO concentration. Wang et al. [14] conducted a number of fire tests with both methanol and propane fires ranging from 5.6 to 16.8 kW in two 1:20 reduced-scale tunnels having identical cross-section sizes of 0.45 m wide and 0.23 m high but different lengths, i.e., 20.8 m and 10 m long, respectively. Natural smoke control was adopted for both tunnels. The experimental results showed that both methanol fires and propane fires self-extinguished in the 20.8 m-long tunnel within around 600 s, except the 5.6 kW methanol fire. The larger the heat-release rates of the fires, the quicker the time to self-extinction. However, self-extinction was not observed in the 10 m-long tunnel with both methanol fires and propane fires. Xu et al. [15] performed a set of experiments in a 1:10 model tunnel with a length of 6 m to study the smoke propagation characteristics and found that the self-extinction phenomenon could not be observed, which was consistent with the results of an investigation by Wang et al. [14] in a 10 m tunnel. Lin et al. [16] further studied the impact of slopes on the self-extinction of fire in a 20.8 m long tunnel under natural ventilation. The results showed that methanol fires with heat-release rates of 5.6, 11.2 and 16.8 kW self-extinguished both in the horizontal tunnel and the 1% tilted tunnel, whilst self-extinction was not observed in the 5% tilted tunnel. To shorten the time to self-extinction in a long tunnel, You et al. [17] studied the impact of blocks with different configurations and at different locations in a 1/20 reduced-scale model tunnel to make the fire self-extinguish more quickly. The blockage ratio was fixed at 65%. The blocks were symmetrically positioned at varying distances from 4 m to 10 m. The shorter the distance of the blocks to the fire seat, the quicker the time to self-extinction. The presence of blocks significantly promotes the mixing of the smoke layer and accelerates the descent rate of the smoke layer, which results in highly vitiated supplying air approaching the fire seat and, thus, a reduction in the time to self-extinction. Shi et al. [18] conducted a series of fire tests in a 1/20 reduced-scale model tunnel to explore the impact of different sealing ratios, varying from 0%, 65%, 75%, 85% to 100%, on the self-extinction of fires. The experimental results showed that self-extinction occurred at a sealing ratio of 75% or above except for a heat-release rate of 2.8 kW, where self-extinction occurred only at a 100% sealing ratio. This finding demonstrates that the partial sealing strategy at a sealing ratio of 75% or above could extinguish medium or large fires in relatively short tunnels, and it provides a promising method for firefighting catastrophic fires in tunnels. It should be noted that radiation plays a significant role and it is difficult to comply with the scaling law. Li and Hertzberg [19] investigated scaling of internal wall temperatures with room fire tests on three different scales, that is, full scale (1:1), medium scale (1:2) and small scale (1:3.5), and concluded that the scaling of radiative heat transfer is still expected to be acceptable in model scales. Ingason et al. [20] concluded that the scaling of radiative heat transfer is still expected to be acceptable in model scales.
Based on the literature review on tunnel fires, extensive studies have been conducted in reduced-scale tunnels and the scaling ratios ranged from 1/3 to 1/50. Vauquelin et al. [21] discussed some scaling laws and concluded that when the Boussinesq approximation cannot be assumed, a density distortion between full scale and reduced scale is not compatible with full similitude. Tilley et al. [22] studied the application of scaling laws in an atrium configuration and concluded that preserving the Froude number alone is not sufficient when the flow becomes weakly turbulent. For tunnel fires under natural ventilation, flames could impinge on the ceiling directly and the temperature rises can be as high as 600~1000 °C, particularly close to the fire seat, since the heat-release rates involved range from 5~50 MW. Lin et al. [23] studied the similarity of scaling laws for tunnel fires with natural ventilation by using two model tunnels, i.e., one long tunnel measuring 20 m long, 0.9 m wide and 0.46 m high and a 1/2 reduced-tunnel measuring 10 m long, 0.45 m wide and 0.23 m high. The experiment demonstrated that the data deduced from the 1/2 tunnel based on scaling laws could lead to a significant under-estimation of the peak temperature rises along the tunnel with errors as high as 50~70%, except those above the fire sources.
The objective of this manuscript is to systemically evaluate the differences in self-extinction behaviors in tunnels with varying sealing ratios. The manuscript is structured as follows: Section 2 introduces the experimental setup and measurements, Section 3 presents the experimental results, and Section 4 presents the conclusions drawn.
2. Experimental Setup
Based on Froude scaling laws [20], the scaling correlations related to the study are expressed as shown in Table 1.
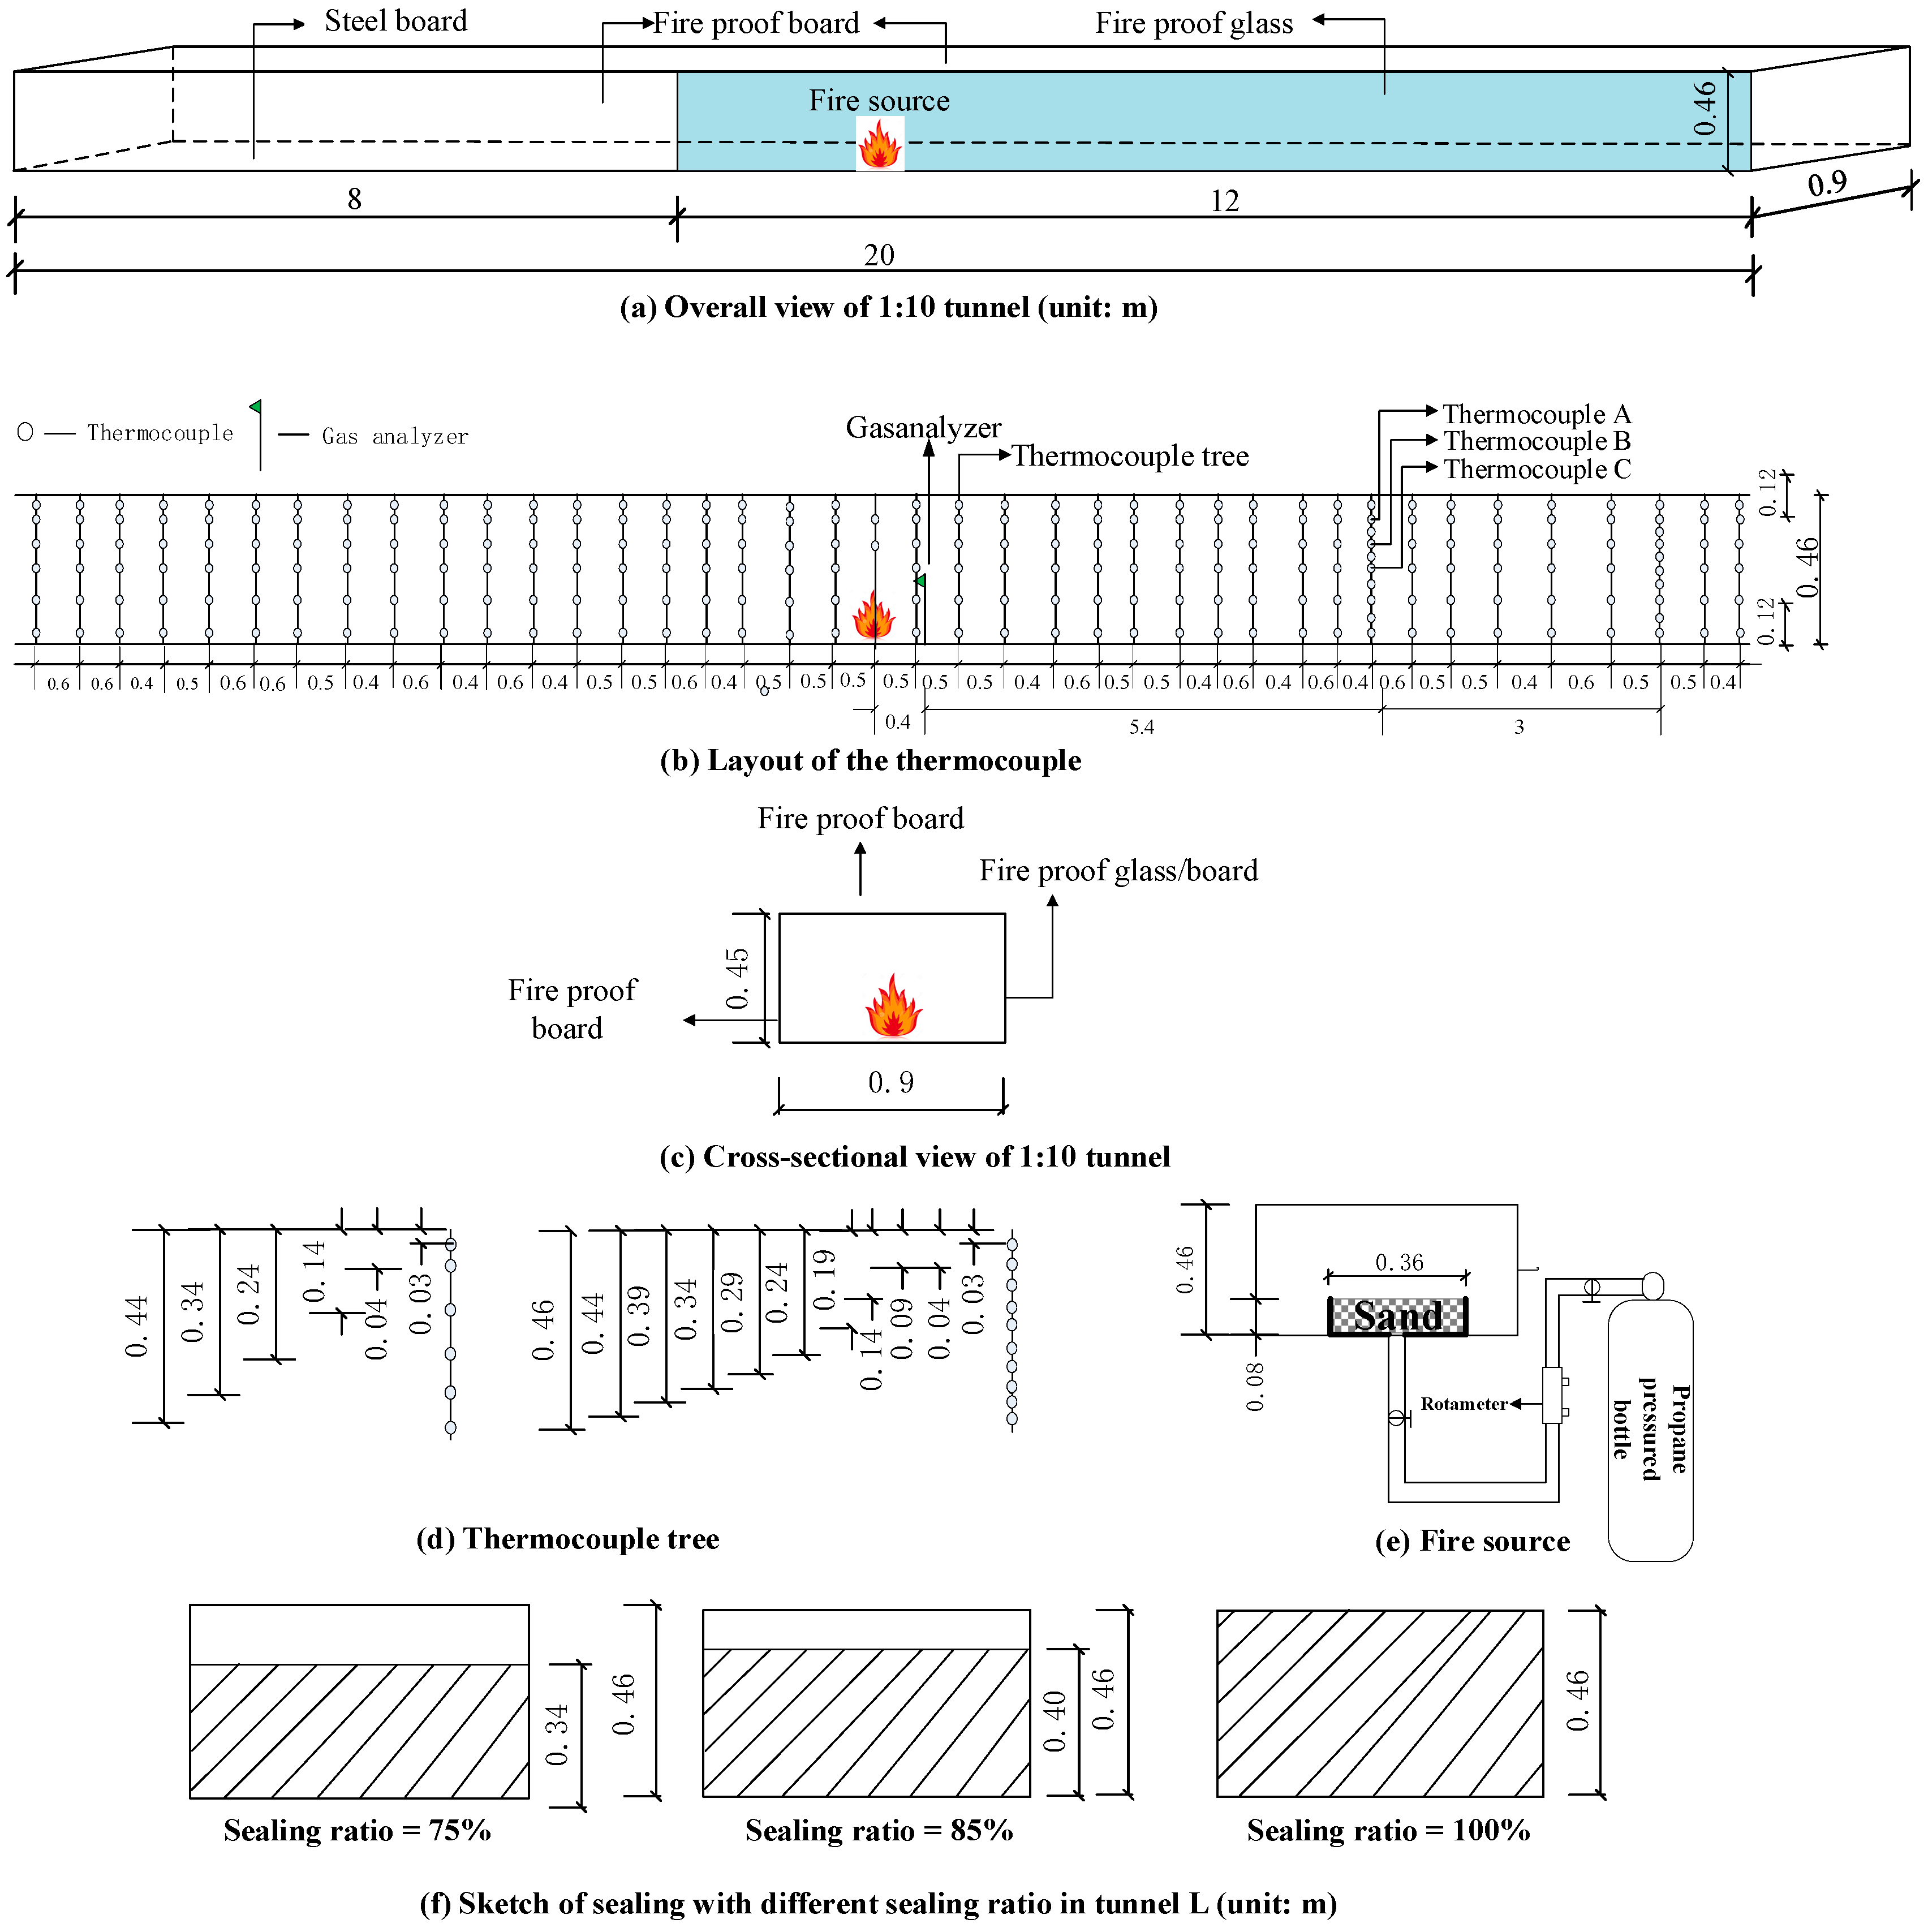
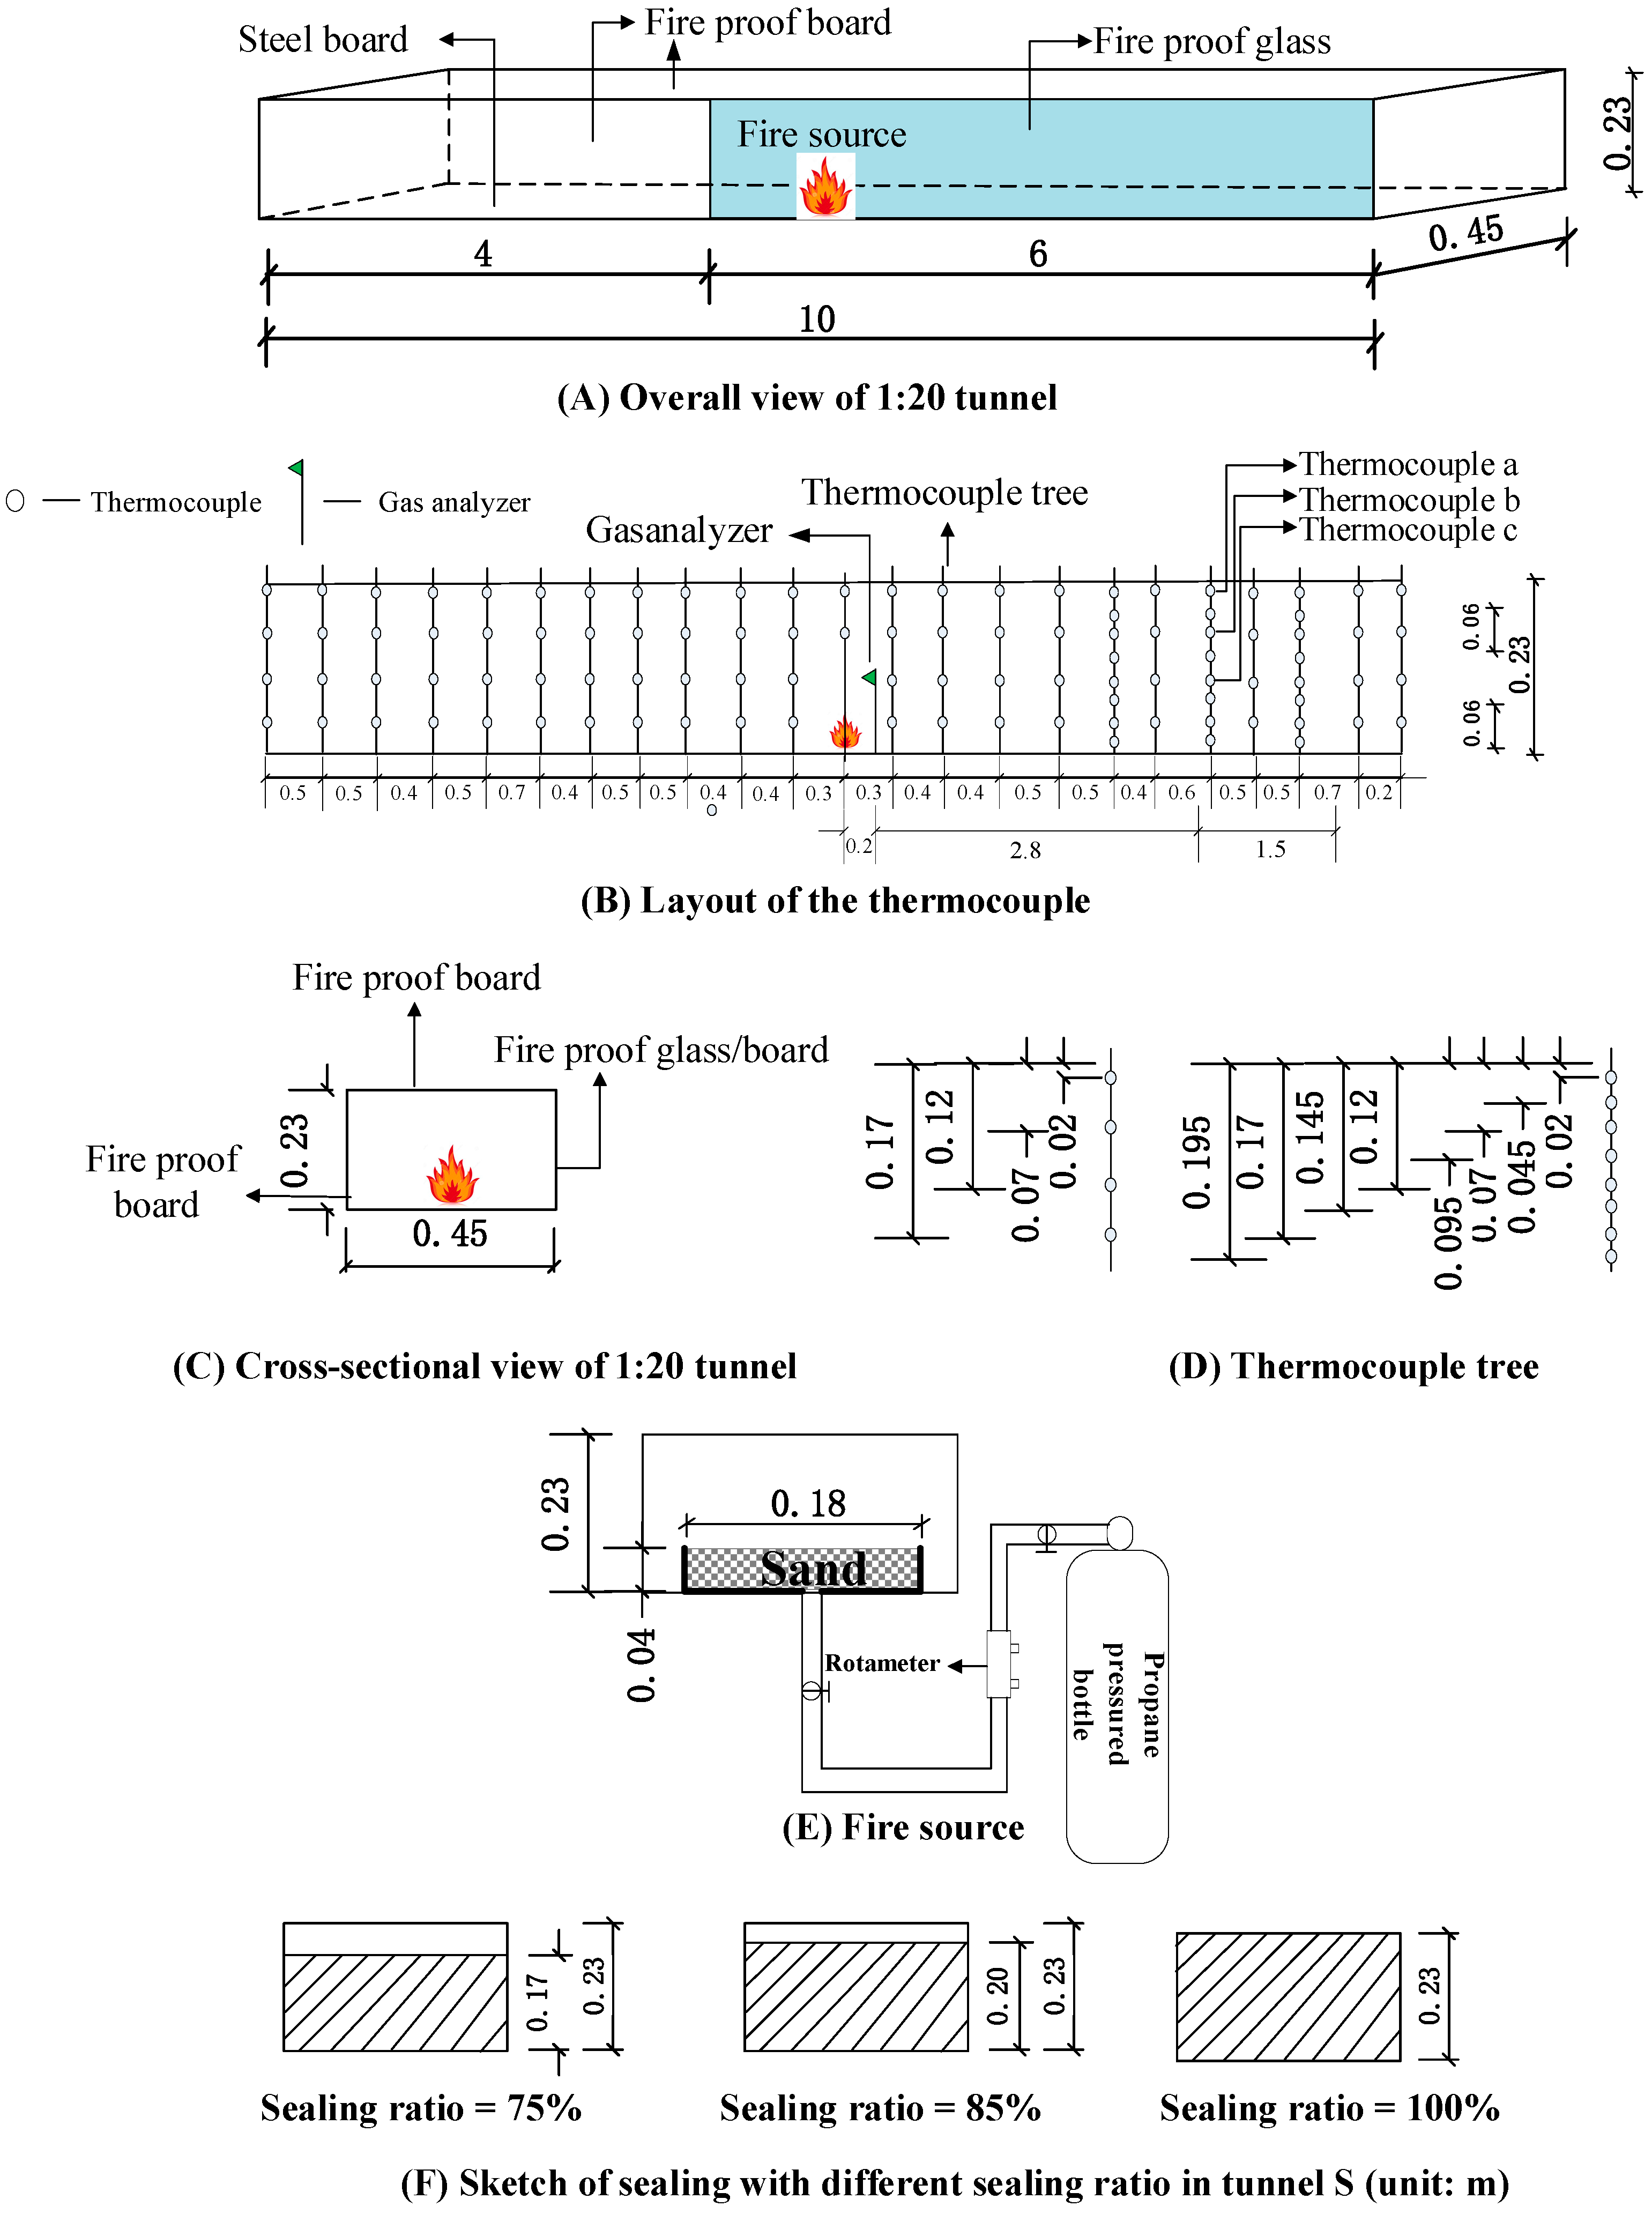
The Memorial Tunnel Fire Ventilation Test Program [24] was a comprehensive, full-scale test program that was conducted to provide definitive data to support ventilation system design and test operating concepts. The section of the Memorial Tunnel was scaled down to 1:10 and was defined as Tunnel-L, as shown in Figure 1. The sizes of Tunnel-L were 20 m long, 0.9 m wide and 0.46 m high. Then, the section of the Memorial Tunnel was scaled down to 1:20 and was named Tunnel-S, as referenced from Lin et al. [23]; the sizes of Tunnel-S were 10 m long, 0.45 m wide and 0.23 m high. For simplicity, Tunnel-L was defined as the prototype and Tunnel-S was its corresponding 1/2 reduced-scale tunnel. Both Tunnel-L and Tunnel-S were made of materials with the same thermal properties. Their ceilings and walls were made of 6 mm-thick PROMATECT®-fire-proof board (density = 975 kg/m3, thermal conductivity at 20 °C, and specific heat = 0.92 kJ/kg·K), except a 12 m-long side wall in Tunnel-L and a 6 m-long side wall in Tunnel-S, which were made of fire-rated glass for observation of smoke during the experiment. The floors of both tunnels were made of 2 mm-thick steel plate protected with fire-proof paint. Both Tunnel-L and Tunnel-S were made of the same material with a very low heat transfer coefficient of =0.17 W/m·K, which represented a nearly adiabatic condition, and heat loss through the solid boundaries was expected to be minimal and negligible.
In Tunnel-L, as shown in Figure 1a,b, two kinds of K-type thermocouples were used. One was armored thermocouples installed close to the fire seat with a measuring range of 0–1000 °C and a measuring error of around ±1.5 °C. The other type was Teflon-insulated thermocouples, installed at least 0.7 m away from the fire seat with a measuring range of −50–300 °C and a measuring error of around ±0.5 °C. The detailed arrangements of the thermocouples are shown in Figure 1c,d. Two thermocouples were located 0.24 m and 0.34 m above the fire source, and 20 thermocouple trees were installed on the right side of the tunnel. Among them, 18 trees had four thermocouples at different heights, namely, 0.02 m, 0.04 m, 0.14 m, 0.24 m, 0.34 m and 0.44 m underneath the tunnel ceiling; two trees had thermocouples at 0.02 m, 0.04 m, 0.09 m, 0.14 m, 0.19 m, 0.24 m, 0.29 m, 0.34 m, 0.39 m and 0.44 m underneath the ceiling. A gas analyzer was used to measure the concentration of oxygen at 0.2 m along the center axis of the tunnel.
Fires using propane gas, as shown in Figure 1e, were set at the center of the tunnel. The flow rates of the gas were controlled by a rotameter connected to a pressurized gas bottle. The gas flow was stabilized on a sand-filled pan, measuring 0.36 m long, 0.36 m wide and 0.08 m high for Tunnel-L, as shown in Figure 1f. The heat of the combustion of propane gas is 50.33 MJ/kg based on SFPE [25] and its density is 1.83 kg/m3. The flow rates of propane gas were 0.670 m3/h, 1.341 m3/h and 2.681 m3/h for HRRs of 15.8 kW, 31.6 KW and 63.2 KW in Tunnel-L, which correspond to 5 MW, 10 MW and 20 MW, respectively, in a full-scale tunnel. The detailed set-up of Tunnel-S, as shown in Figure 2, was introduced in Lin et al. [23] and Shi et al. [18] and was omitted hereby for brevity.
The portals of the tunnel were symmetrically sealed by using PVC board with sealing ratios varying from 0% to 100%, as shown in Figure 1f and Figure 2F. A series of tests with heat-release rates of 15.8, 31.6 and 63.2 kW were conducted in Tunnel-L, and fire tests with corresponding heat-release rates of 2.8, 5.6 and 11.2 KW were conducted in Tunnel-S. For each test, two repeated experiments were carried out. The detailed information of the tests is tabulated in Table 2 and Table 3. Limiting oxygen concentration in Table 2 is defined as the measured oxygen concentration close to the fire seat when the fire was self-extinguished.
3. Experimental Results
For each scenario as shown in Table 2 and Table 3, two repeated tests were conducted. The repeatability R is defined as:
where and are the temperature rises in the two repeated tests at the same point, and N is the total number of times.
3.1. Peak Temperature Rises above the Fire Source in Tunnel-S
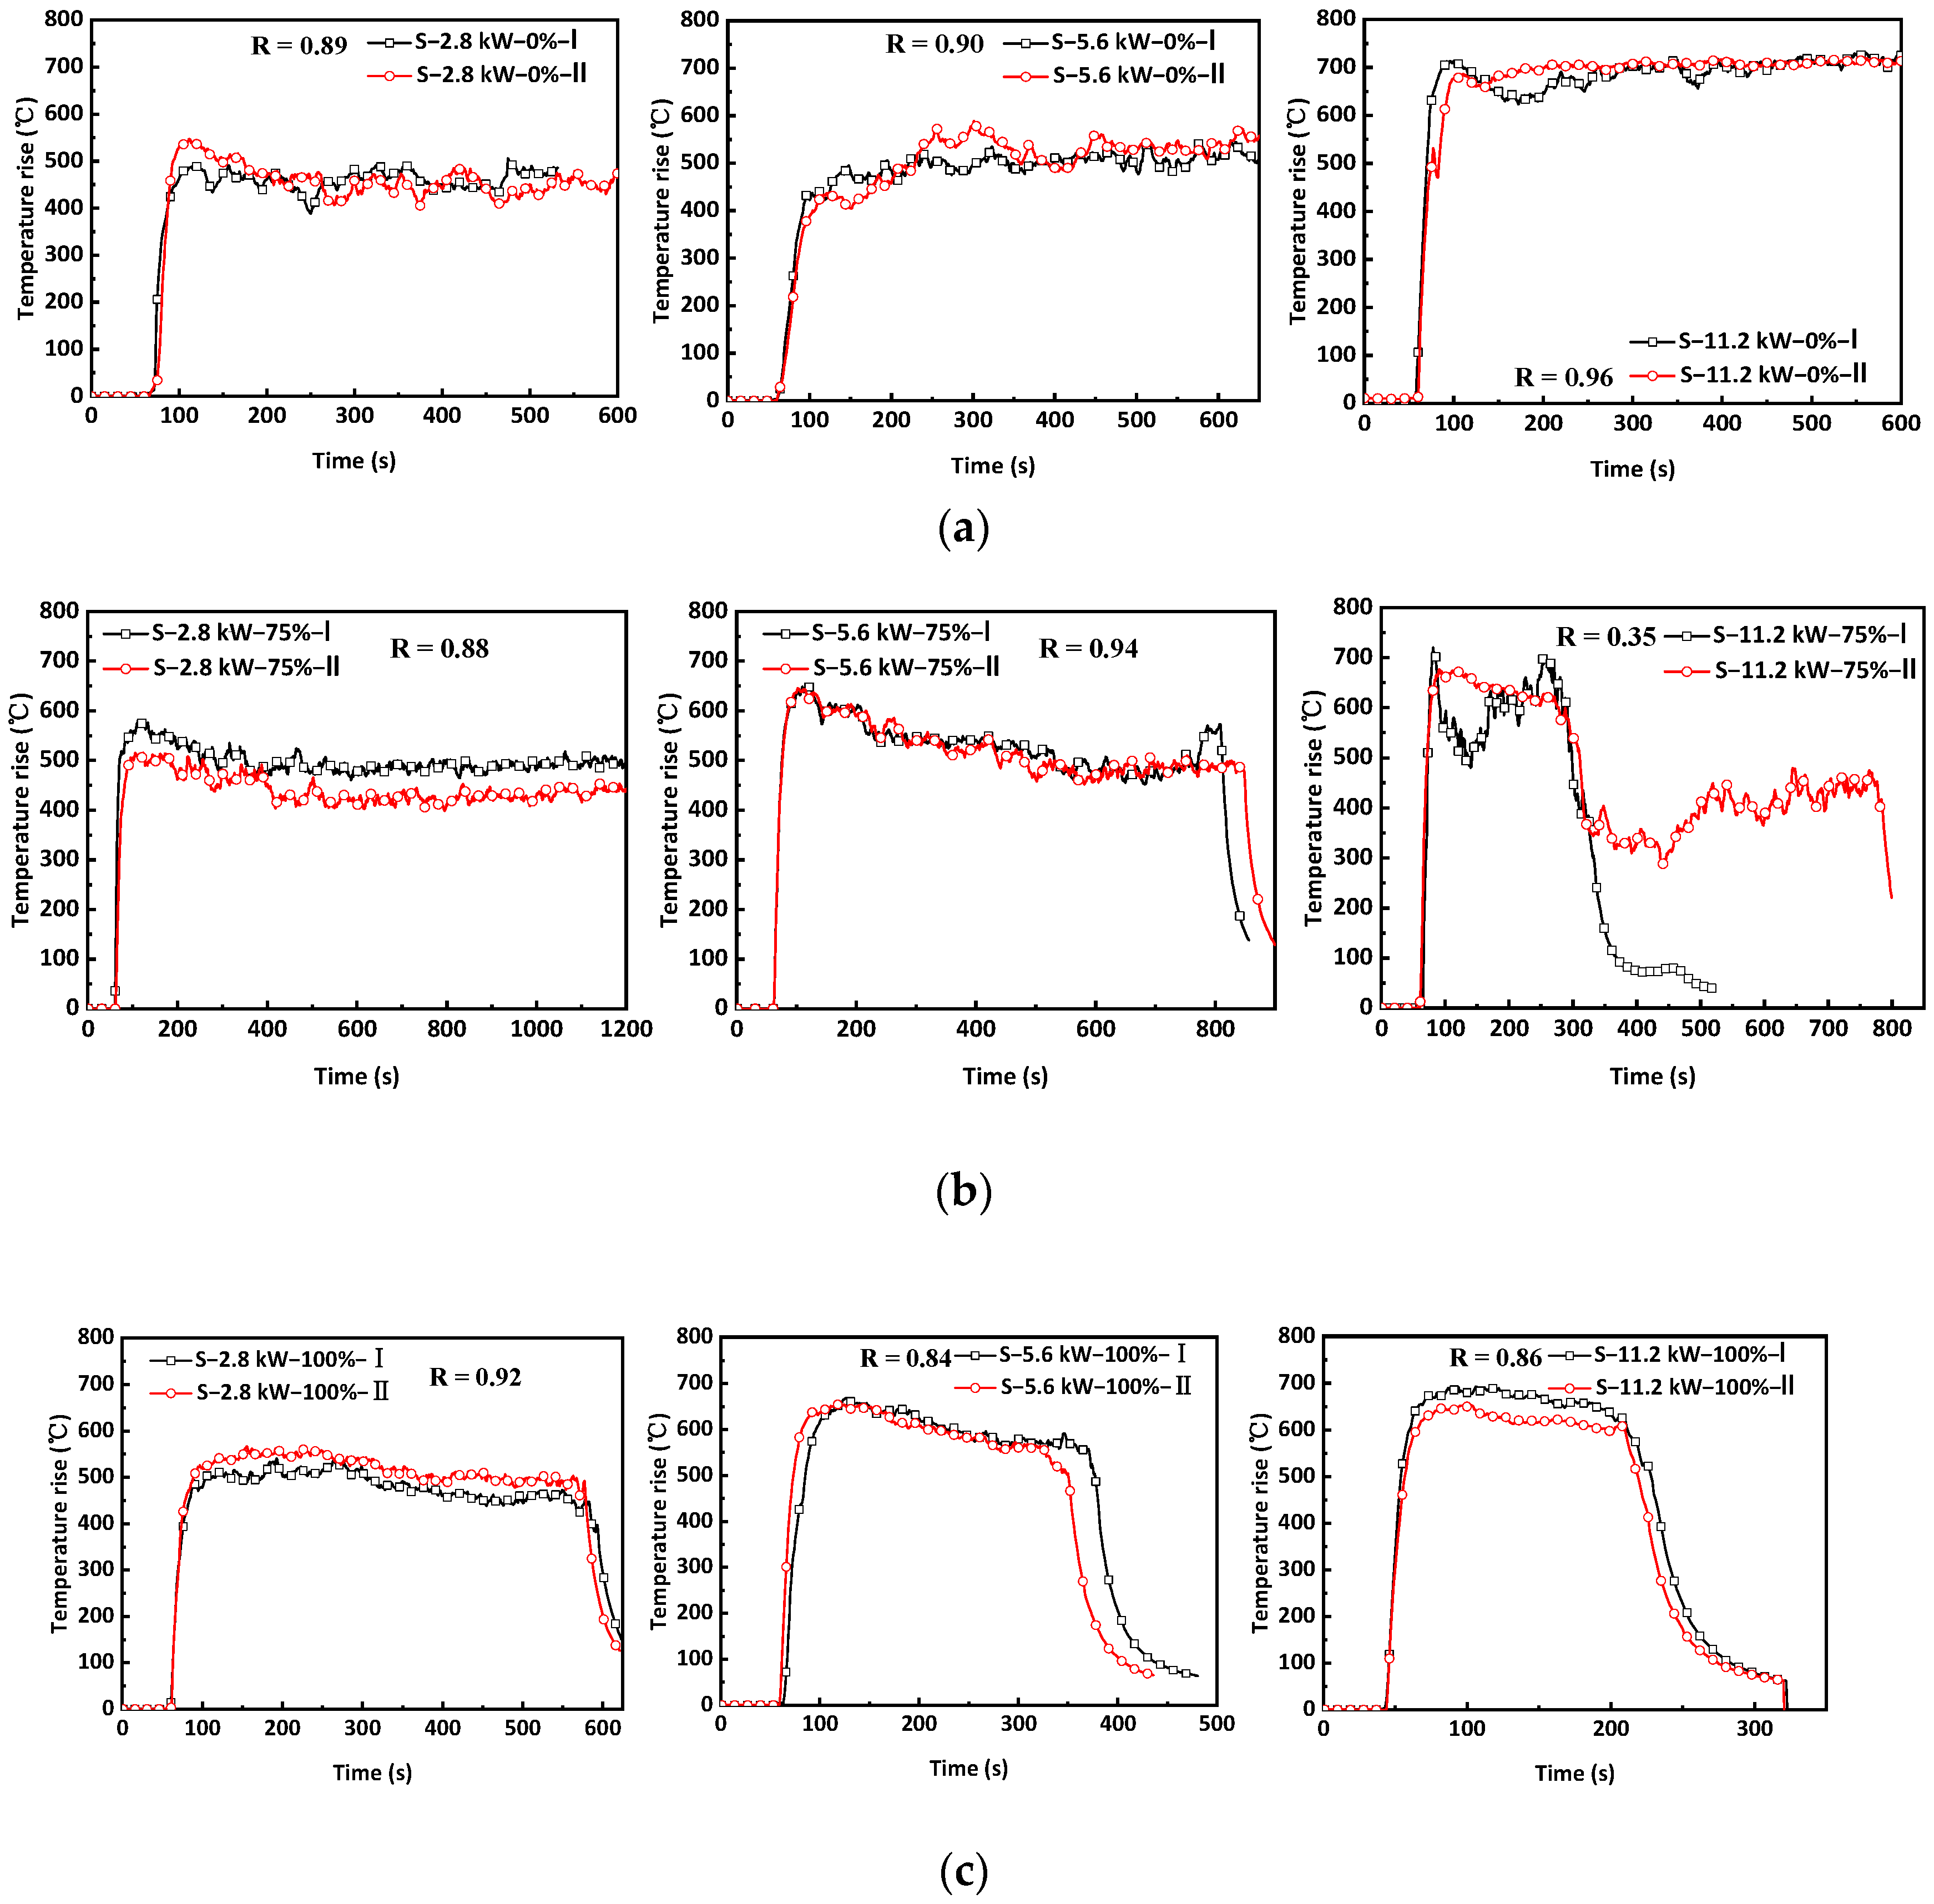
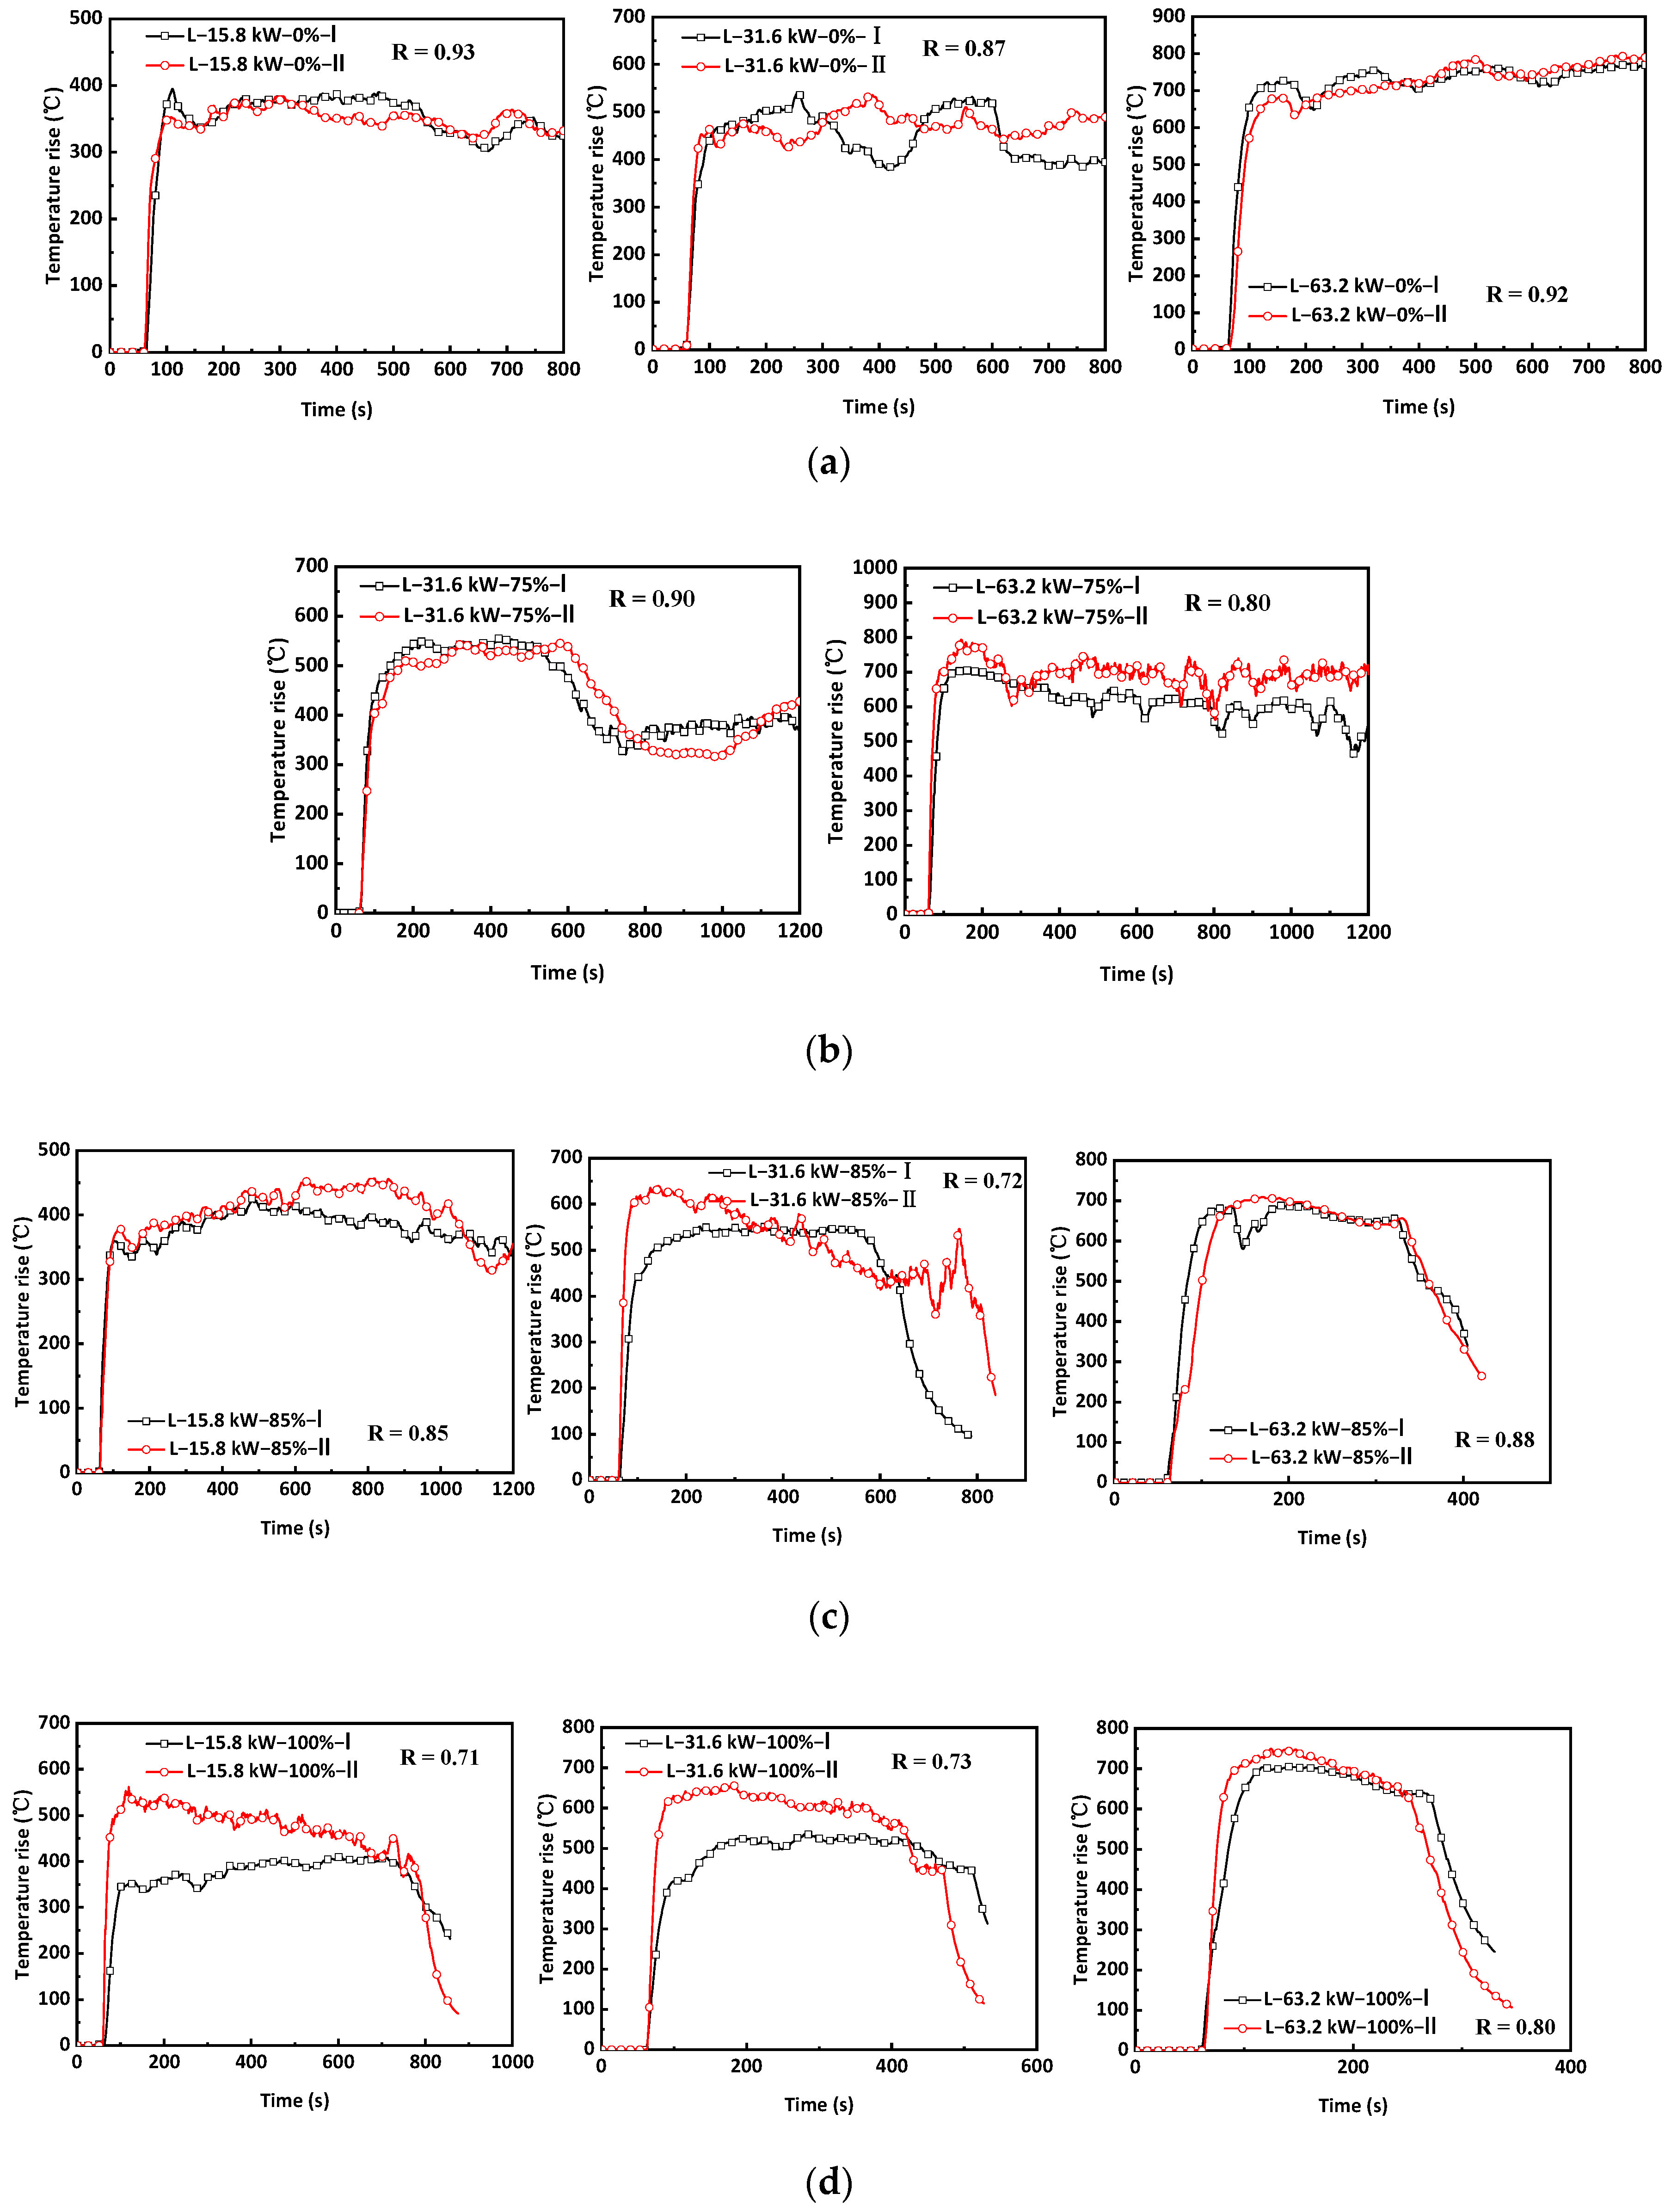
Figure 3 presents the evolution of peak temperature above the fire seat in Tunnel-S at different sealing ratios ranging from 0% to 100%. For heat-release rates of 2.8, 5.6 and 11.2 kW, the repeatabilities were at 88~96% except for in two scenarios: one was a heat-release rate of 5.6 kW at a sealing ratio of 85% and the other was a heat-release rate of 11.2 kW at a sealing ratio of 75%, and the repeatabilities were 35% and 42%, respectively. The low repeatability was due to the fires self-extinction at distinct times and the peak temperature still agreed well prior to the occurrence of self-extinction. Figure 4 presents the evolution of peak temperature above the fire seat in Tunnel-L at different sealing ratios, and the repeatabilities were at 71~93% as well.
In Tunnel-S, at a sealing ratio of 0%, the temperature rises reached the peak shortly after the ignition of the fires and maintained a relatively steady constant throughout the tests. At a sealing ratio of 75%, the temperature rises reached peaks of approximately 550 °C, 650 °C and 670 °C shortly after the ignition of the fires with heat-release rates of 2.8 kW, 5.6 kW and 11.2 KW, respectively. For a 2.8 kW fire, the temperature rises decreased gradually with time and combustion persisted for more than 20 min. For a 5.6 kW fire, the temperature rises reduced to zero at approximately 800 s with the self-extinction of the fire. For a 11.2 kW fire, the temperature rises varied greatly in the two tests. In one test, the temperature rises plunged from 600 °C to approximately 400 °C at around 300 s and then stayed at approximately 400 °C until the self-extinction of the fire at around 700 s. In the other test, the temperature rises plunged from 600 °C to approximately zero at around 300 s due to the self-extinction of the fire. At a sealing ratio of 85%, the patterns of peak temperature rises for the three heat-release rates agreed well with those with a sealing ratio of 75%. The temperature rises for 2.8 kW decreased slightly with time while combustion was sustained for more than 20 min, and the peak temperature rises for 5.6 kW and 11.2 kW reduced to zero at approximately 600 s and 300 s as the fires reached self-extinction. At a sealing ratio of 100%, the evolution of peak temperature rises for the three heat-release rates generally agreed and the peak temperature rises reduced to zero after a certain period of time due to the self-extinction of the fires.
3.2. Peak Temperature Rises above the Fire Source in Tunnel-L
In Tunnel-L, at a sealing ratio of 0%, the peak temperature rises stayed at relative constants throughout the experiment for 15.8, 31.6 and 63.2 KW, which corresponded to 2.8, 5.6 and 11.2 kW in Tunnel S. At a sealing ratio of 75%, the peak temperature rises for a 31.6 kW fire stayed at 550 °C for approximately 600 min and then plunged to 350 °C until the end of the experiment. For a 63.2 kW fire, the peak temperature rises declined continually whilst the combustion persisted for more than 20 min. It was noted that both 5.6 kW and 11.2 kW fires self-extinguished in Tunnel-S at a sealing ratio of 75%. However, both 31.6 kW and 63.2 kW fires in Tunnel-L, which corresponded to 5.6 KW and 11.2 KW fires in Tunnel-S, sustained for more than 20 min. At a sealing ratio of 85%, the peak temperature rises for a 15.8 kW fire decreased gradually with time whilst combustion persisted for 20 min. For a 31.6 kW fire, the temperature rises reduced to zero at approximately 600~800 s with the self-extinction of the fire. For a 63.2 KW fire, the temperature rises plunged from 700 °C to approximately zero at around 300 s due to the self-extinction of the fire. At a sealing ratio of 100%, the evolutions of peak temperature rises of the three fires generally agreed and the peak temperature rises reduced to zero after a period of time due to the self-extinction of the fires.
3.3. A Comparision of Peak Temperature Rises above the Fire Source in Two Tunnels
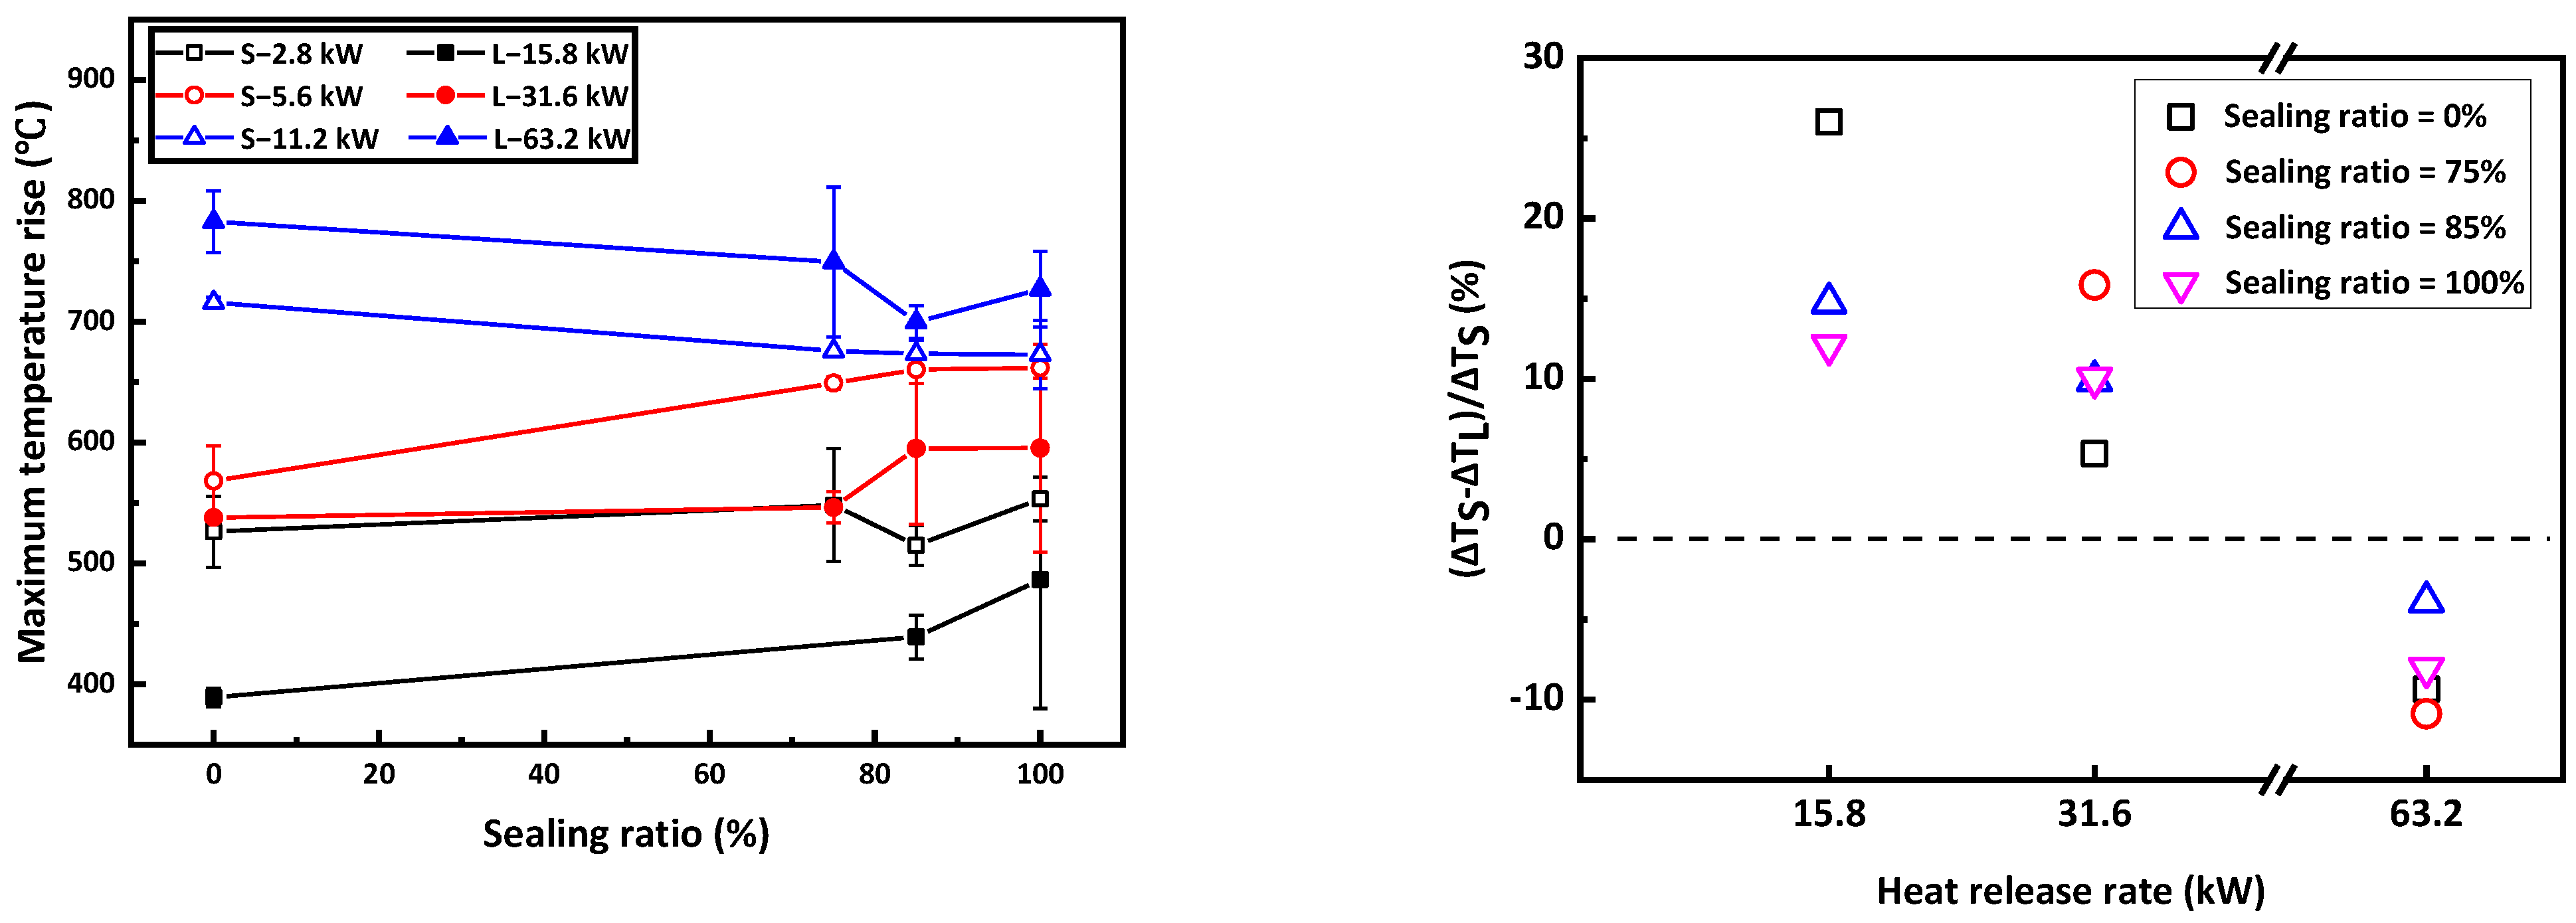
A comparison of the maximum temperature rises in the two tunnels with different sealing ratios is shown in Figure 5. The mean of the peak temperature rises in two repeated tests was taken as the maximum temperature rise. For fires with heat-release rates of 2.8 and 5.6 KW in Tunnel-S, the maximum temperature increased slightly with the sealing ratios. This may be due to the increase in the sealing ratio reducing the amount of smoke flowing out of the tunnel and, subsequently, leading to the accumulation of hot smoke in the tunnel. For fires with heat-release rates of 11.2 kW, the maximum temperature declined with the increase in sealing ratios, which was in contrast to the 2.8 and 5.6 KW fires. This may be due to the fact that the fire with a larger heat release was in under-ventilated conditions due to the sealing of the portals, thus, the incomplete combustion of fires led to lower temperature rises with larger sealing ratios. In Tunnel-L, the maximum temperature increased with the increase in sealing ratio for smaller fire sizes, i.e., 15.8 kW and 31.6 KW, and decreased with the increase in sealing ratios for larger fire sizes, i.e., 63.2 KW. The relationship between the maximum temperature rises and the sealing ratios in Tunnel-L agreed well with that in Tunnel-S. A further comparison was made between the difference in maximum temperature in the two tunnels as shown in Figure 5. At a 0% sealing ratio, the maximum temperature was approximately 520 °C for a 2.8 KW fire in Tunnel-S, whilst it was approximately 380 °C for a 15.8 kW fire in Tunnel-L. For both 2.8 kW and 5.6 KW fires at sealing ratios from 75% to 100%, the maximum temperature in Tunnel-S was approximately 5~26% higher than its counterpart in Tunnel-L. At varying sealing ratios from 0% to 100%, the maximum temperature in Tunnel-S was approximately 5~26% higher than its counterpart in Tunnel-L for smaller fire sizes, i.e., 2.8 kW and 5.6 KW, whilst the maximum temperature in Tunnel-S was approximately 5~10% lower than its counterpart in Tunnel-L for larger fire sizes, i.e., 11.2 kW.
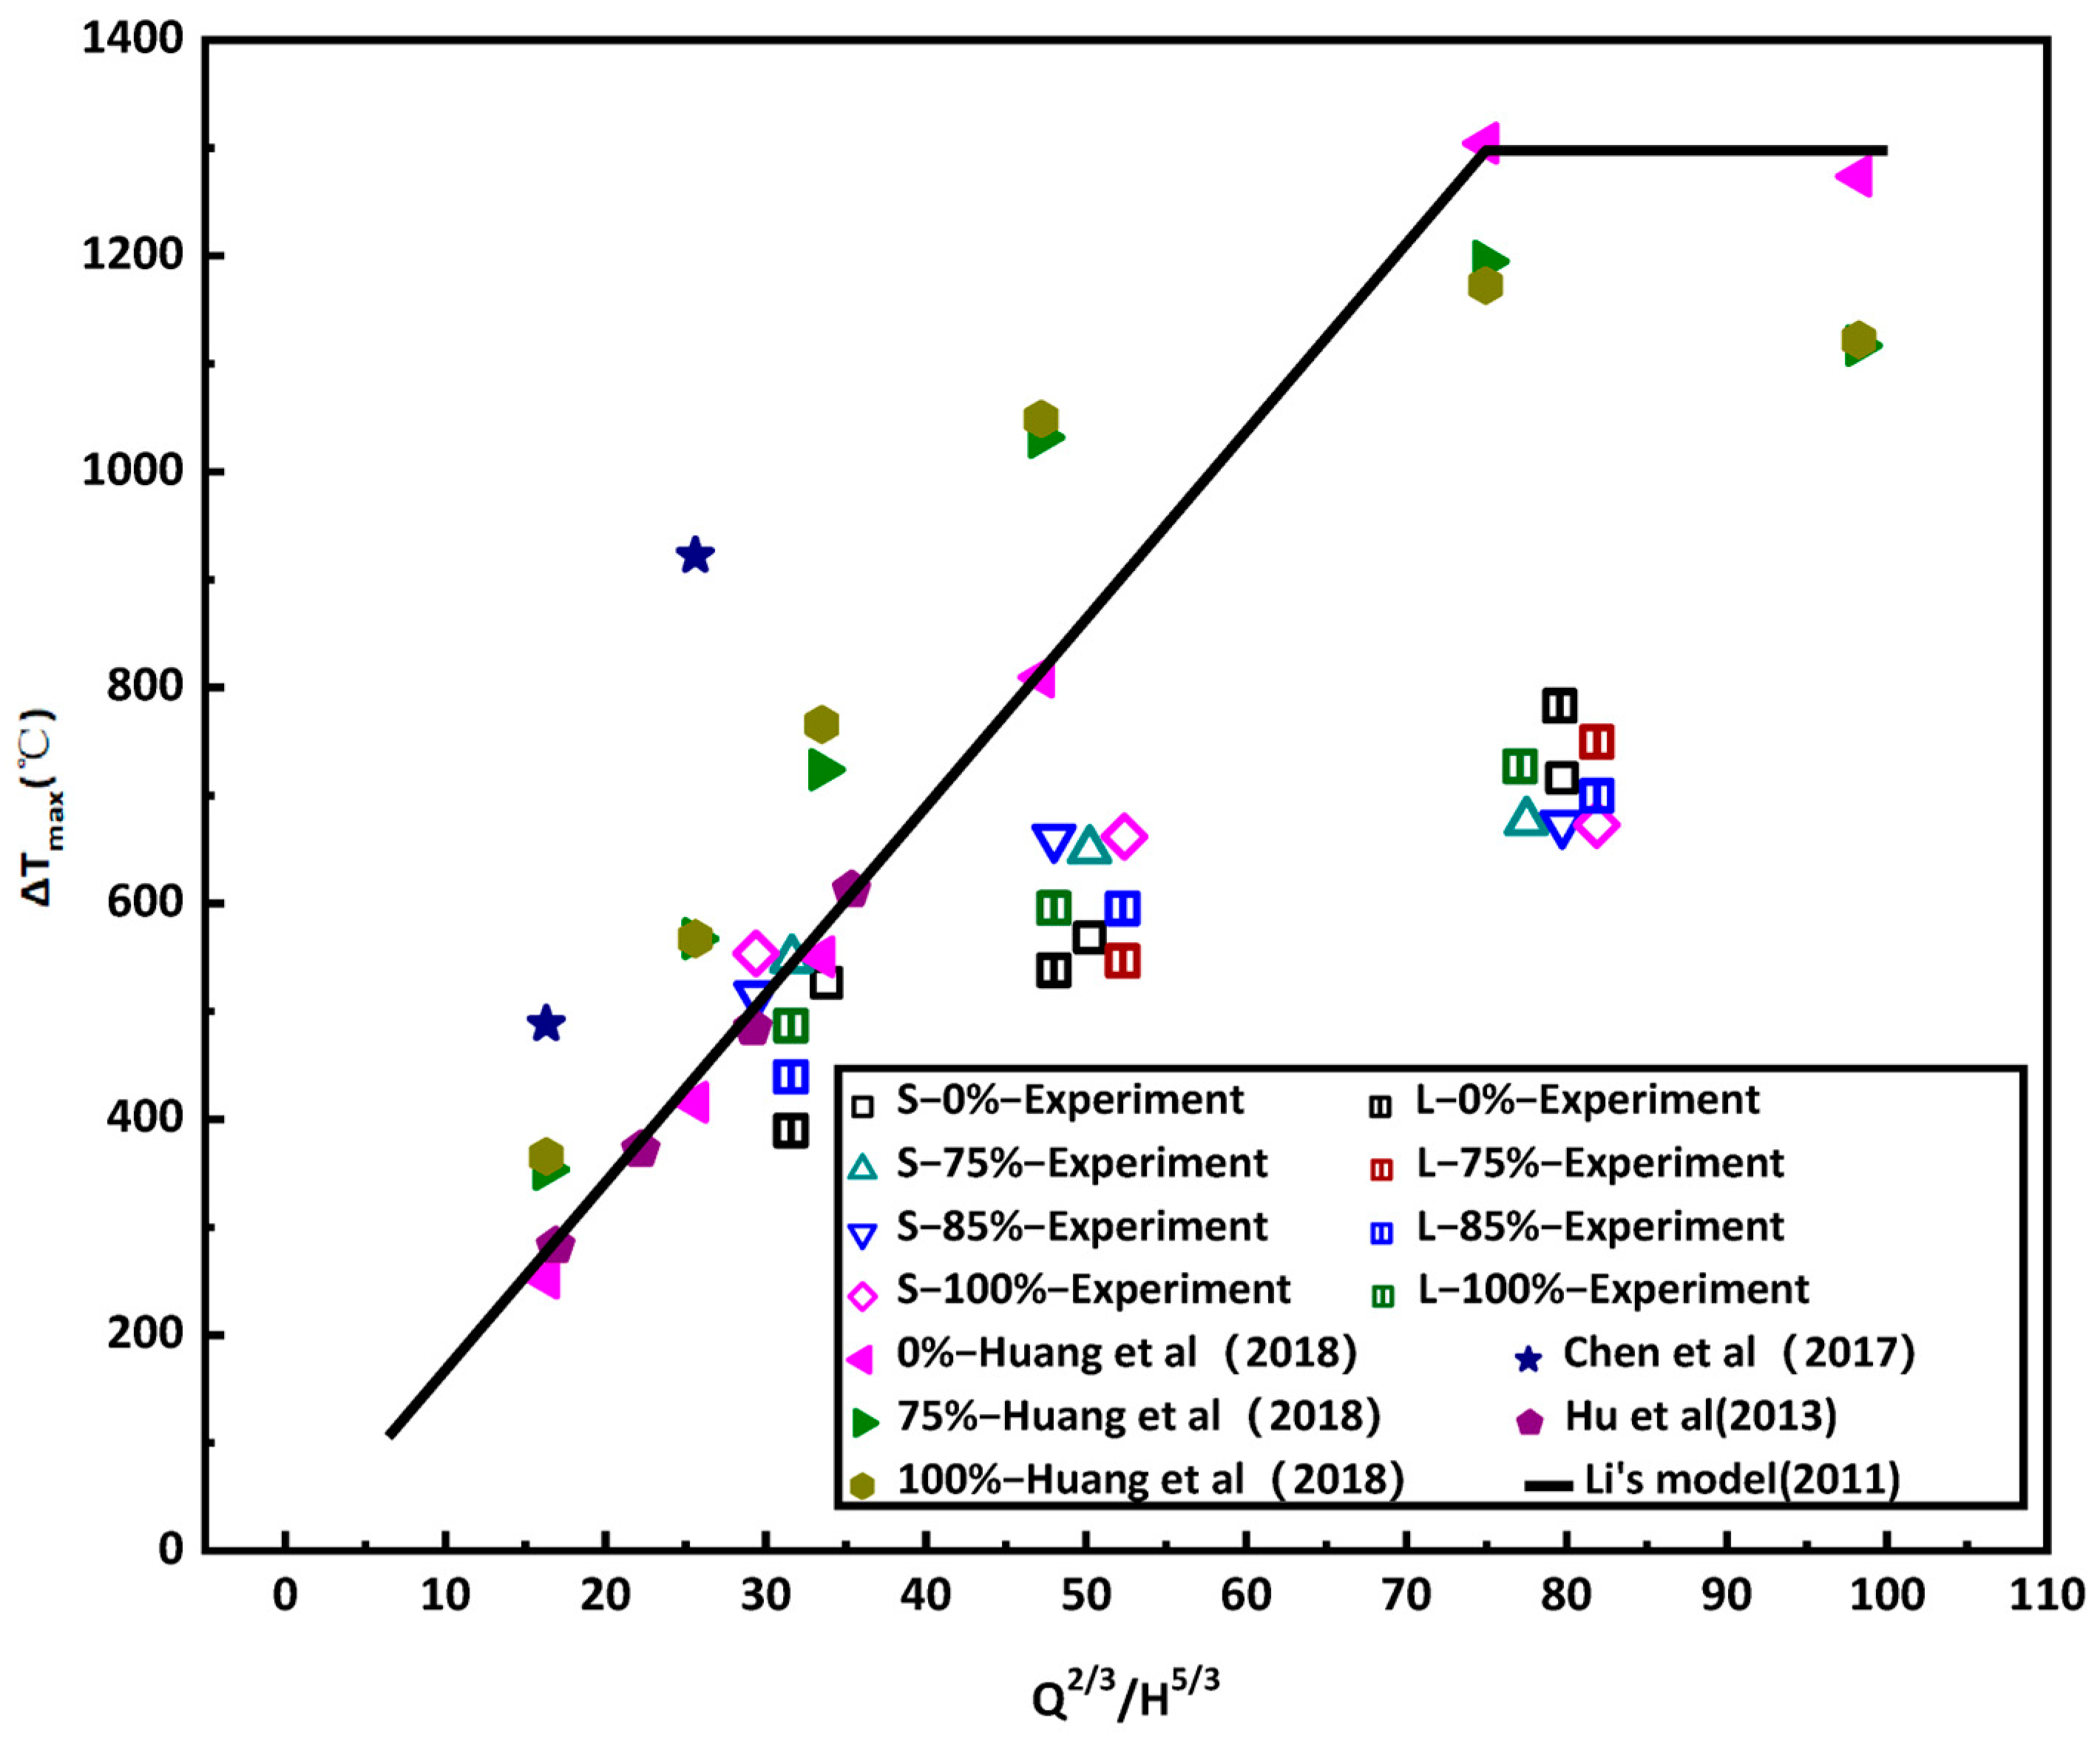
The equations on the maximum temperature rise under the ceiling proposed by Li et al. [26], as shown in Equation (2), were further compared with our results.
where ; is the maximum ceiling temperature rise (K); is the total heat-release rate (kW); is longitudinal ventilation velocity (m/s); is the radius of fire source (m); is the height from the surface of fire source to the tunnel ceiling (m); is the dimensionless ventilation velocity; is the characteristic plume velocity (m/s); is the convective heat-release rate of fire source (kW); is the gravitational acceleration (m/s2); is the ambient air density (kg/m3); is the specific heat of air at constant pressure (kJ/kg·K); and is the ambient temperature (K).
The experiment data from Huang et al. [11], Chen et al. [10] and Hu et al. [27] were included in Figure 6 for comparison. For low heat-release rates at different sealing ratios in both scales, the maximum temperatures above the fire seat prior to self-extinction in this study were agreeable with Equation (2), but they are much lower than in the data from Huang et al. [11] and Chen et al. [10]. For larger heat-release rates, the maximum temperatures in this study were much lower than the predicted values and other researchers, irrespective of the sealing ratios.
3.4. Extinction Times at Different Sealing Ratios
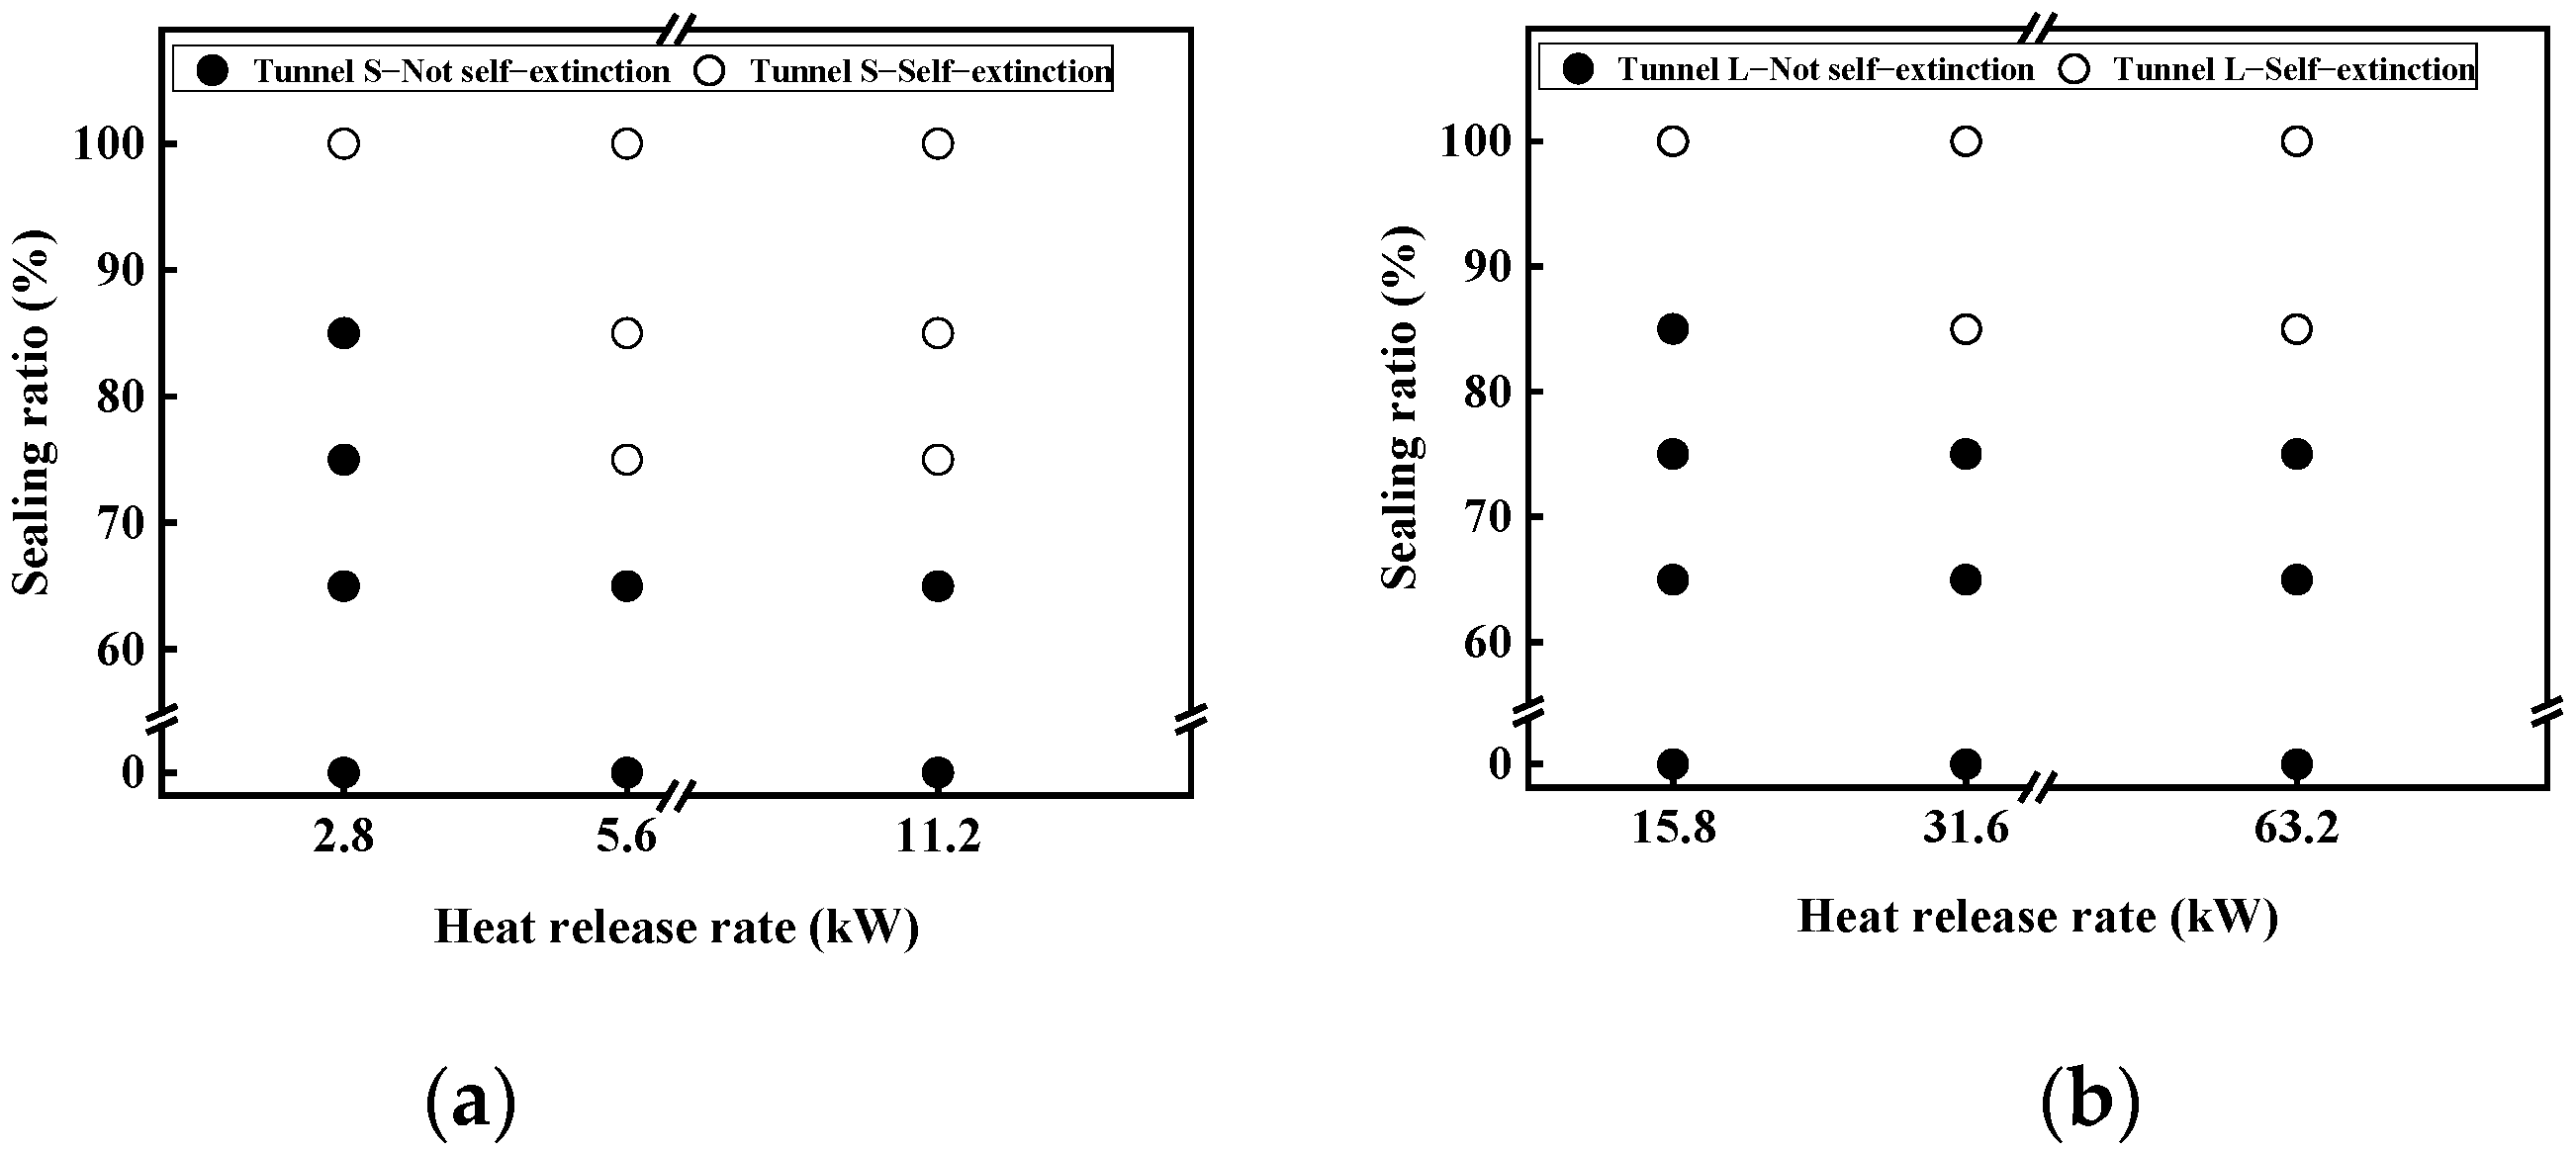
Based on the findings of Shi et al. [18] in Tunnel-S, self-extinction occurred at a sealing ratio of 75% or above, except for a heat-release rate of 2.8 kW, for which self-extinction occurred only at a 100% sealing ratio. They concluded that the minimal critical sealing for the self-extinction of fires was 75%, as shown in Figure 7a.
A series of experiments in Tunnel-L with sealing ratios of 0%, 75%, 85% and 100% were conducted. As expected, self-extinction did not occur at a 0% sealing ratio for heat-release rates of 15.8, 31.6 and 63.2 kW, which corresponded to the heat-release rates of 2.8, 5.6 and 11.2 kW in Tunnel-S. In Tunnel-L with a 75% sealing ratio, self-extinction did not occur for fires of 15.8, 31.6 and 63.2 kW, which was contradictory to the finding observed in Tunnel-S. In Tunnel-L with an 85% sealing ratio, the 15.8 KW fire persisted throughout the experiment and the fires of 31.6 and 63.2 kW self-extinguished after a period of time. Therefore, the minimal critical sealing for the self-extinction of fires was 85% based on the finding in Tunnel-L, whilst it was 75% based on the finding in Tunnel-S. Based on comparison of the findings on critical sealing ratios for the self-extinction of fires, we can see that the fires were much easier to extinguish in the reduced-scale tunnel.
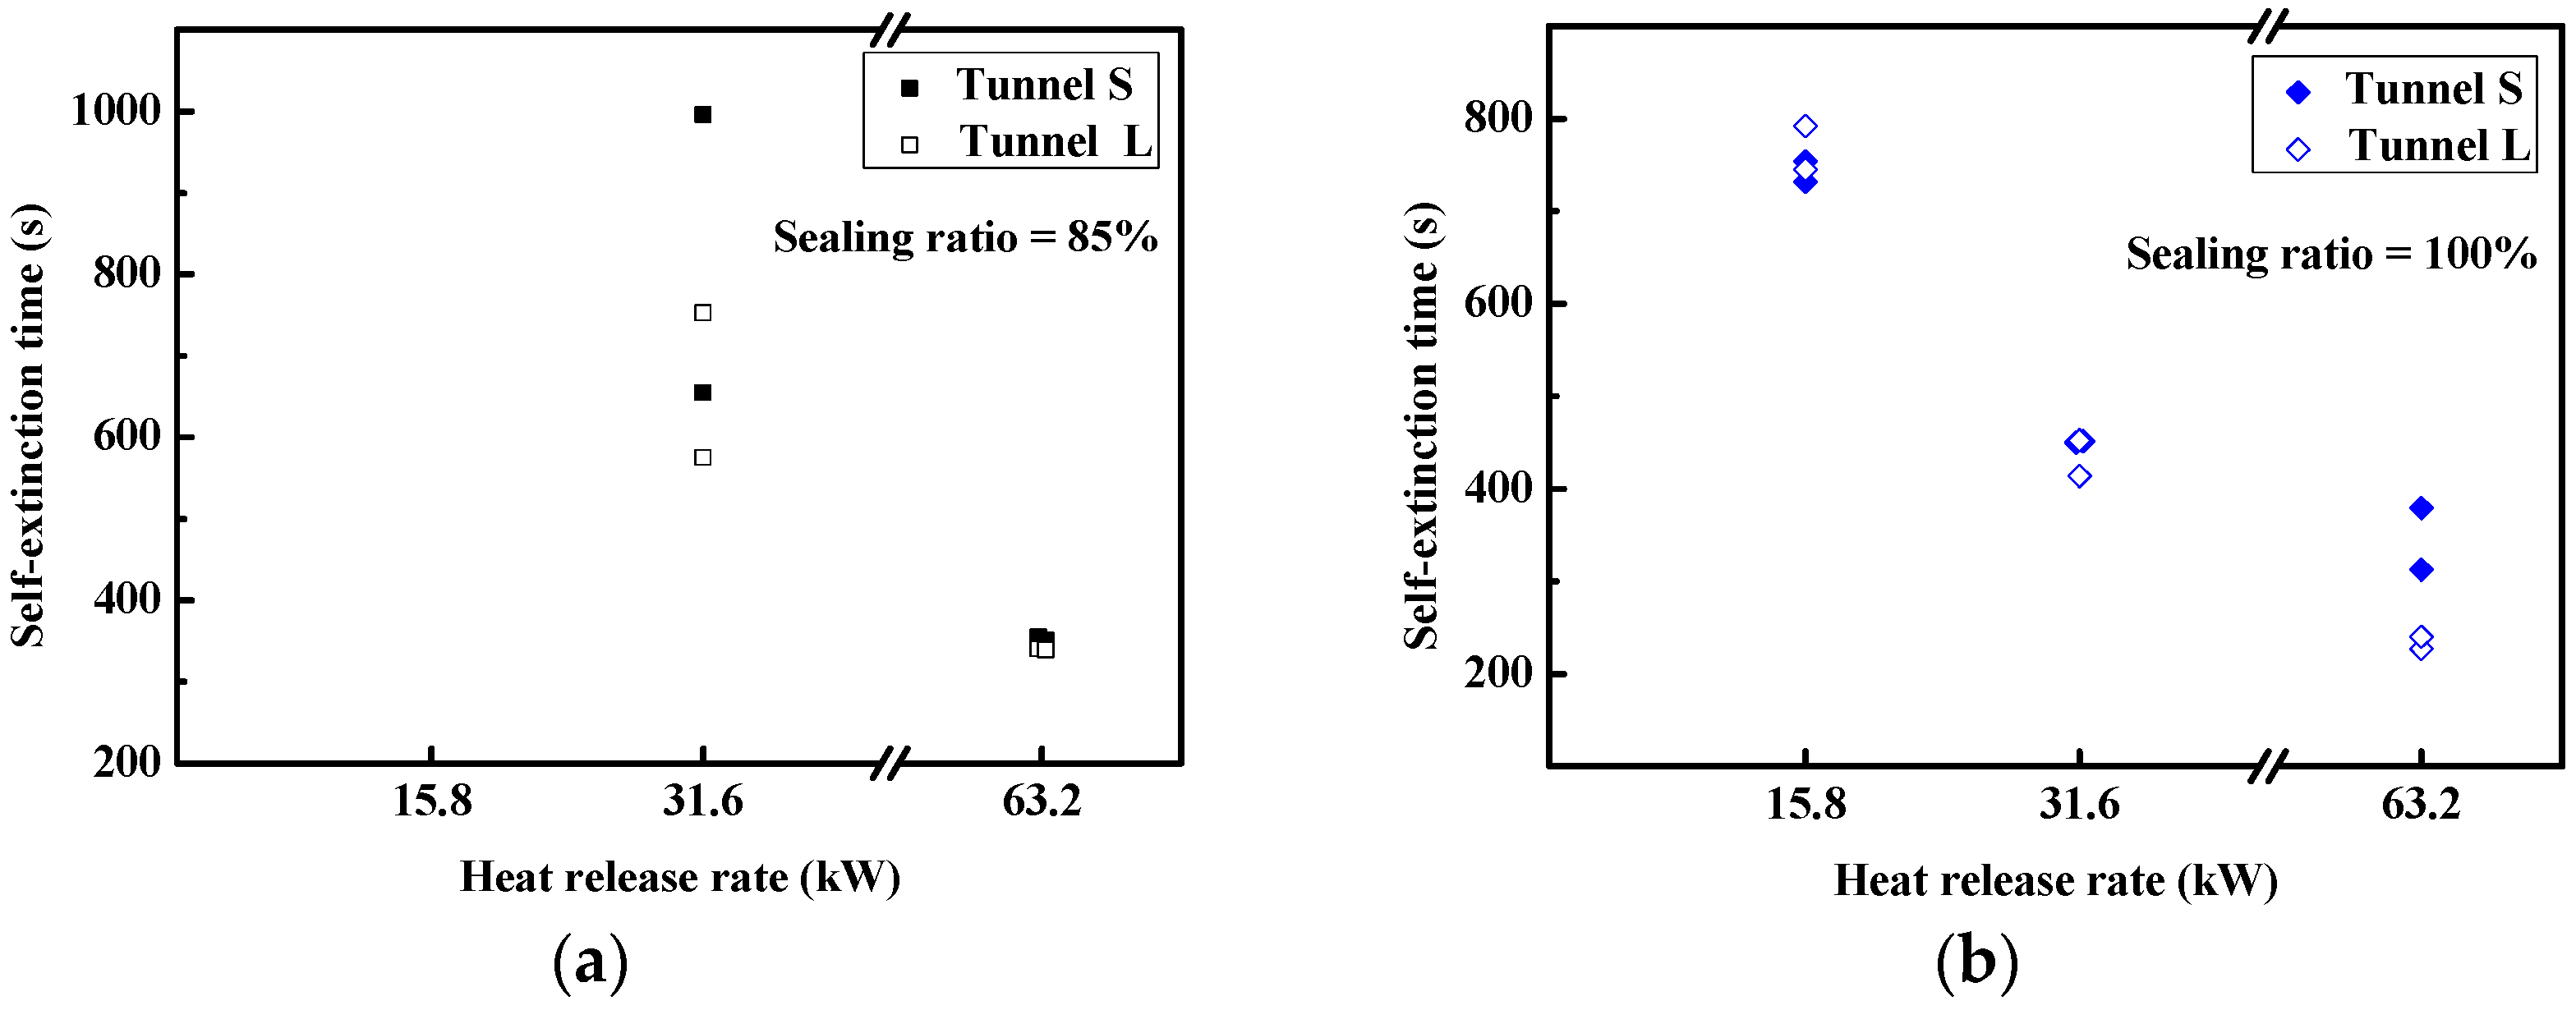
Figure 8 presents the times to self-extinction at varying heat-release rates. The times in Tunnel-S were converted to their corresponding counterparts in Tunnel-L. It can be seen that the times to self-extinction reduced with the increase in the heat-release rates both for sealing ratios of 85% and 100%. At an 85% sealing ratio, the times to self-extinction for 5.6 kW were 463 s and 704 s in Tunnel-S, and they were 654 s and 995 s when converted to the prototype tunnel.
The actual times to self-extinction of fires of 31.6 kW were 575 s and 753 s in Tunnel-L. The average time to self-extinction for a 31.6 kW fire was over-predicted by around 24% by using the 1/2 reduced-scale tunnel. The times to self-extinction for 11.2 kW were 251 s and 248 s in Tunnel-S, and they were 355 s and 351 s when converted to the prototype tunnel. The actual times to self-extinction for 63.2 KW fire were 340 s and 339 s in Tunnel-L. The average time to self-extinction was over-predicted by approximately 4% by using the 1/2 reduced-scale tunnel. At a 100% sealing ratio, the time to self-extinction was over-predicted by approximately 19%, 4.6% and 20%, for 15.8, 31.6 and 63.2 KW fires, respectively, by using the 1/2 reduced-scale tunnel.
3.5. Attenuation of Temperature Rises along the Tunnels
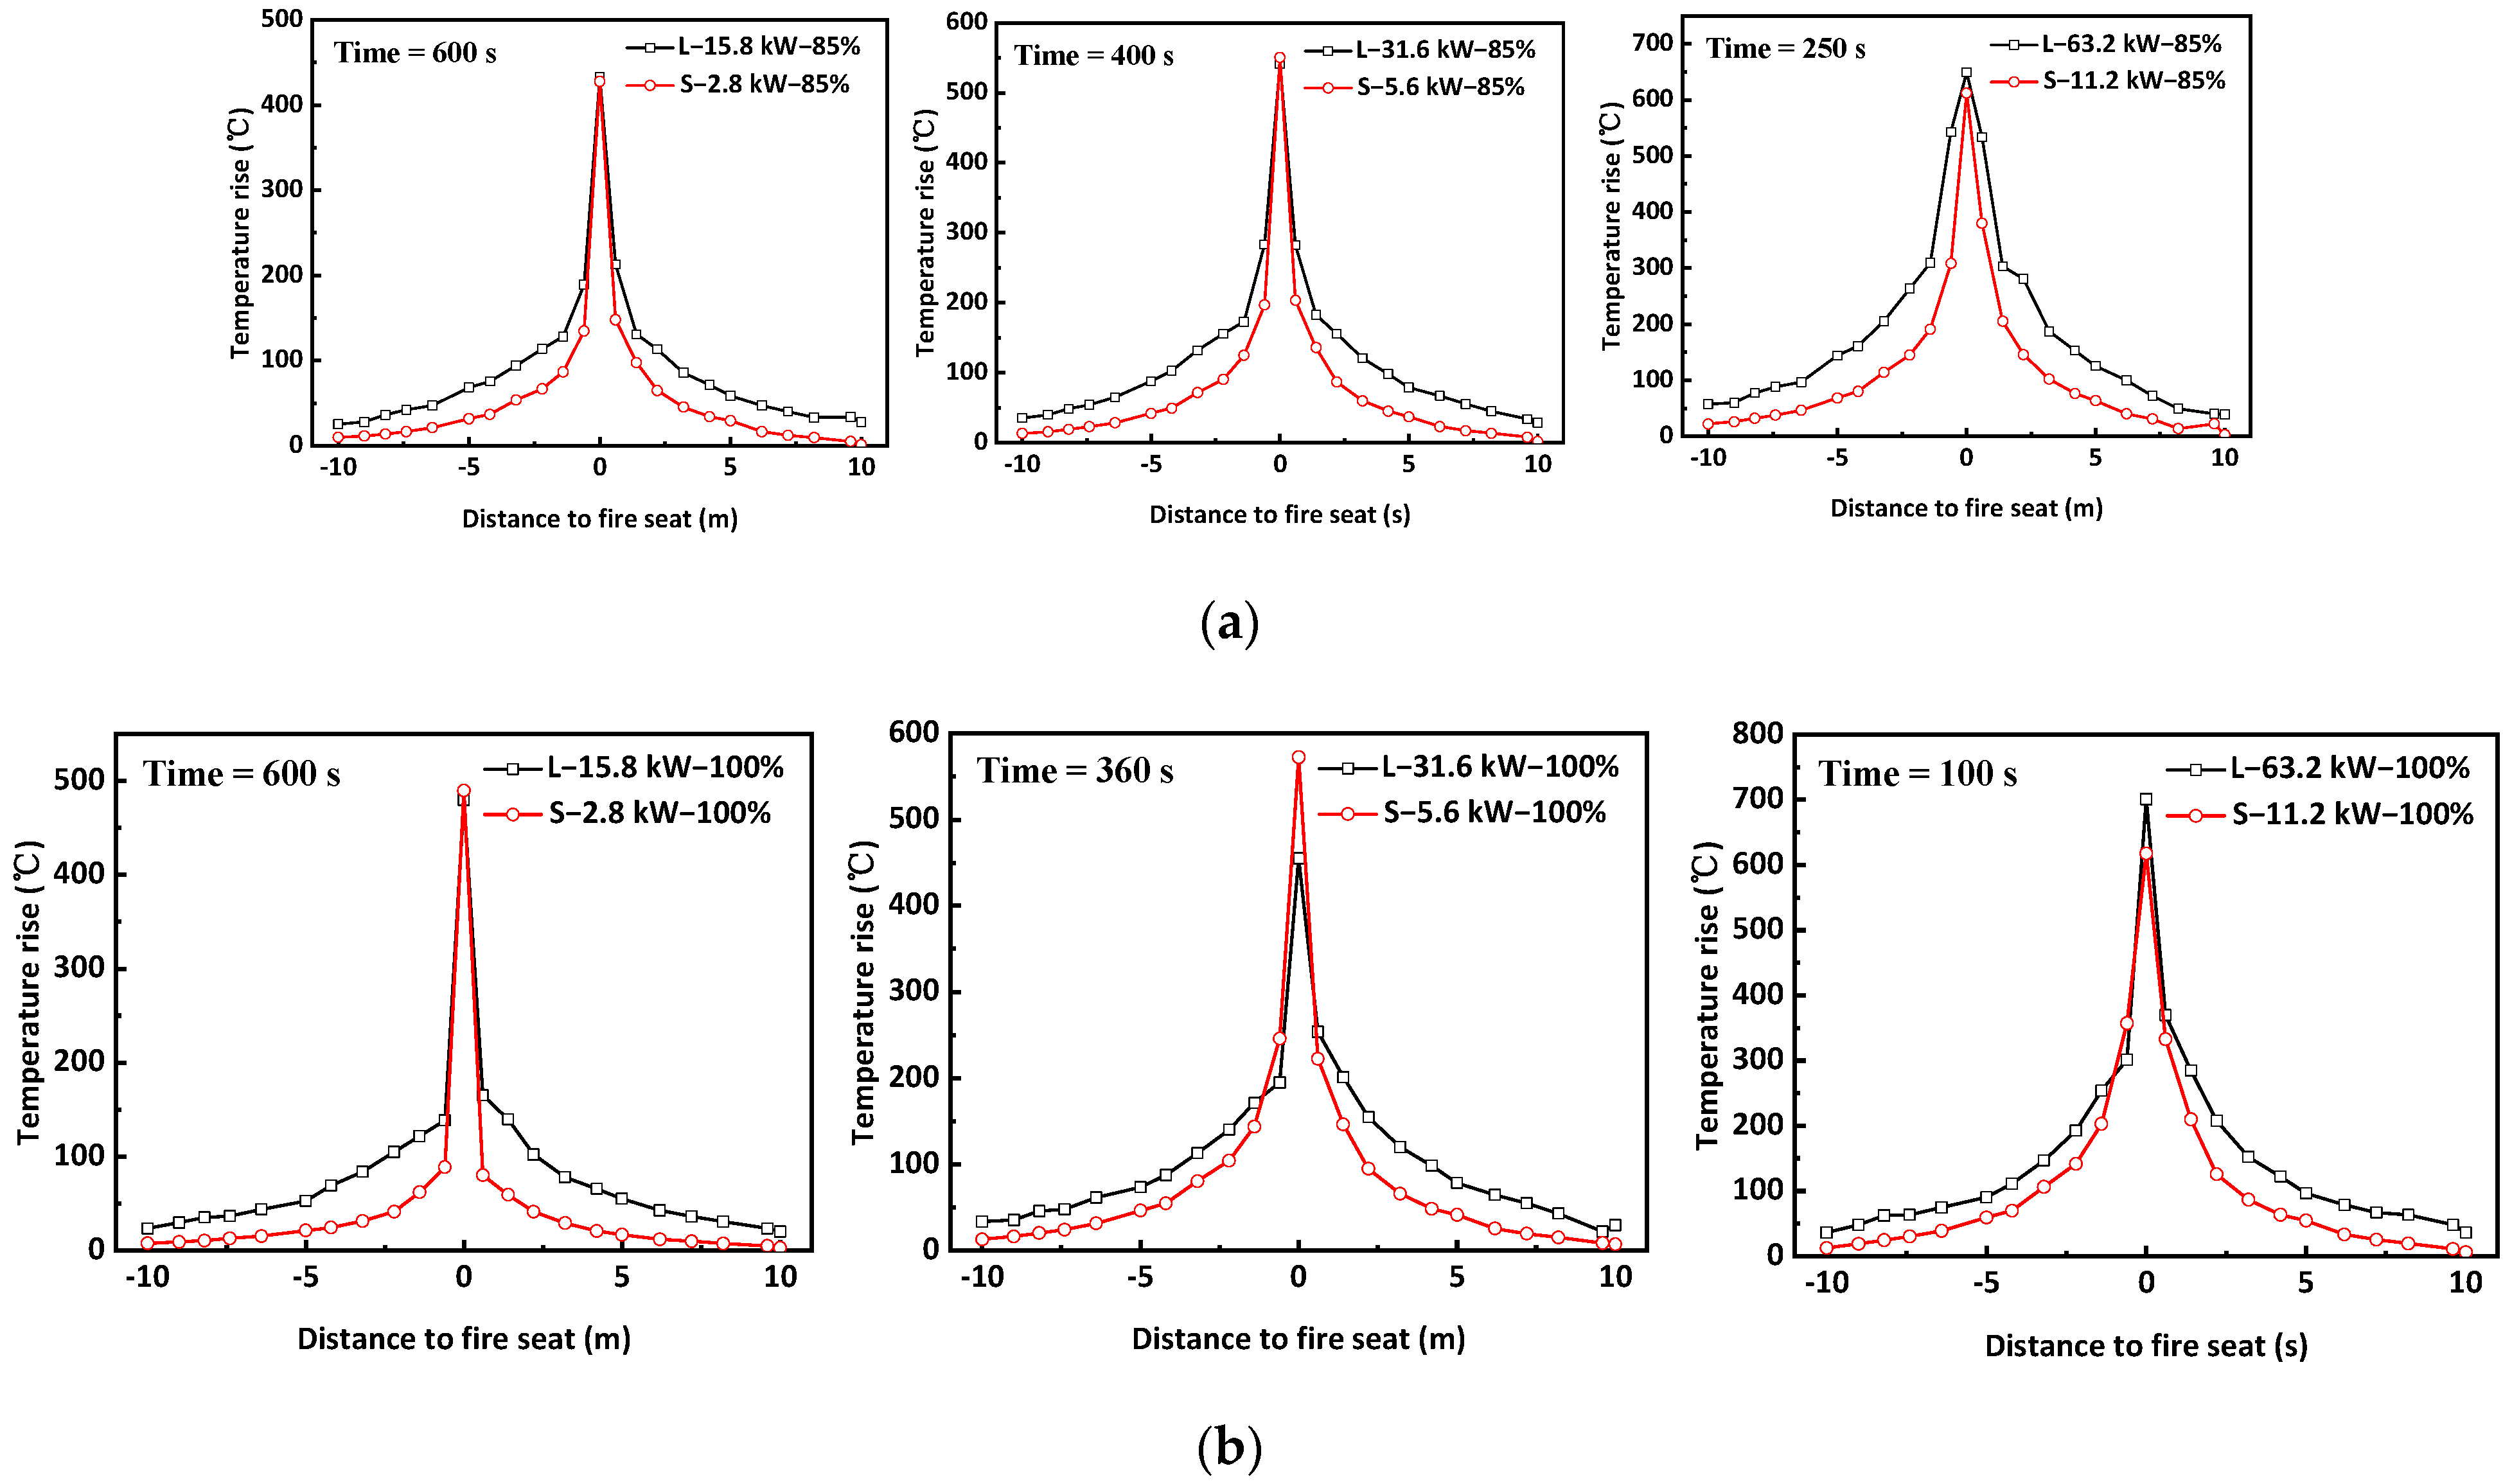
To clearly demonstrate the differences in peak temperature rises along the two tunnels, the peak temperature rises along Tunnel-S in the 1st test were converted for comparison to those along Tunnel-L, based on the scaling laws of temperature, distance and time, as shown in Figure 9.
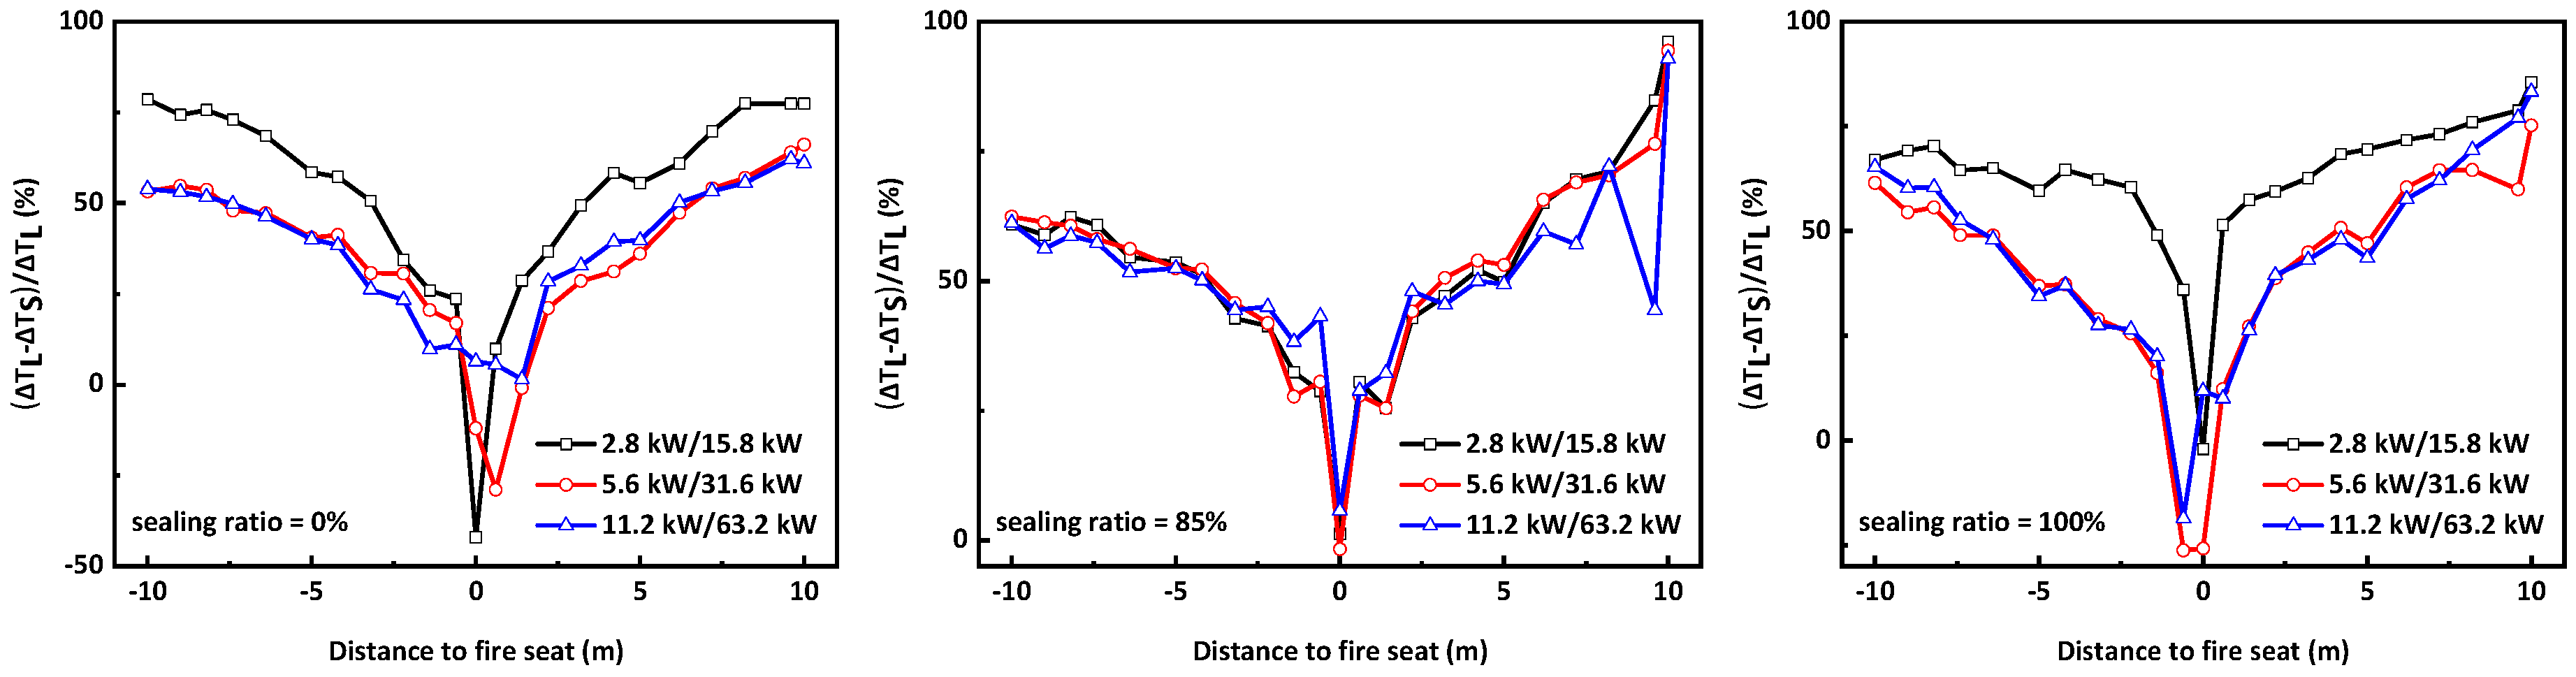
At an 85% sealing ratio, as shown in Figure 9a, the temperature rises for a 2.8 kW fire in Tunnel-S at 424 s and a 15.8 KW fire in Tunnel-L at 600 s were taken as the fires persisted for 20 min. In both Tunnel-S and Tunnel-L, the maximum temperatures were generally symmetrical on both sides of the fire seats as fires were located at the center of the tunnel. The temperature rises decreased with increasing distance away from the fire seat. However, it was noted that the temperature rises along the Tunnel-S were less than those along Tunnel-L. A similar pattern was observed when comparing 5.6 kW and 31.6 kW, and 11.2 kW and 63.2 KW. Therefore, the temperature rises along the reduced-scale tunnel were much less than those along the full-scale tunnel. Furthermore, it was noted that the temperature differences increased almost monotonously with distance away from the fire seat and they were as high as 70% at the tunnel portals, as shown in Figure 10. At a sealing ratio of 100%, the maximum temperature along the tunnel prior to the self-extinction of fires was taken for comparison, as shown in Figure 9b. A similar trend was observed, and the temperature rises along Tunnel-S were less than those along Tunnel-L, and the differences increased monotonously with distance away from the fire seat, irrespective of the sealing ratios and heat-release rates, as shown in Figure 10. Lin et al. [22] studied the similarity of scaling laws for tunnel fires with natural ventilation by using the same two model tunnels, and their experimental results demonstrated that the data deduced from the 1/2 tunnel based on scaling laws could lead to a significant under-estimation of the temperature rises along the tunnel with errors as high as 50~70%, except for those above the fire sources. The results for tunnels at varying sealing ratios were consistent with those with natural ventilation.
Based on the comparison between the results at varying sealing ratios and different heat-release rates, the temperature differences between the 1/2 reduced-scale tunnel and the prototype tunnel increased almost monotonously with distance, and they were as high as 70% at the tunnel portals irrespective of the sealing ratios and heat releases. Emri and Saito [28] pointed out that fire-induced flow near the fire source is dominated by the inertial and buoyancy force and the Froude number scaling close to the fire seat is valid. However, with an increase in distance away from the fire seat, the Reynolds number decreases, which means that the viscous force begins to influence the flow and the Froude number scaling begins to fail.
Lin et al. [23] studied the Reynolds numbers of fires ranging from 2.8~11.2 KW in both tunnels under natural ventilation, and they were approximately 3000~5000 and 14,000~37,000 in tunnel-S and Tunnel-L respectively. The flow was turbulent in general at a sealing ratio of 0%. With the increase in sealing ratio from 0% to 100%, it was believed that the Reynolds number of the former were much lower than was the case when the movement of air and smoke was significantly constrained in the sealing conditions. Particularly for a sealing ratio of 100%, most parts of the tunnels should be in laminar flow. However, the comparison of the two cases illustrated that the errors were almost the same, irrespective of the sealing ratios and heat-release rates. It seems that the scale effect of fires was not sensitive to the Reynolds number of flows in tunnels. Meanwhile, it can be inferred that the differences between the reduced-scale tunnel and prototype tunnel increased with the length of the tunnel.
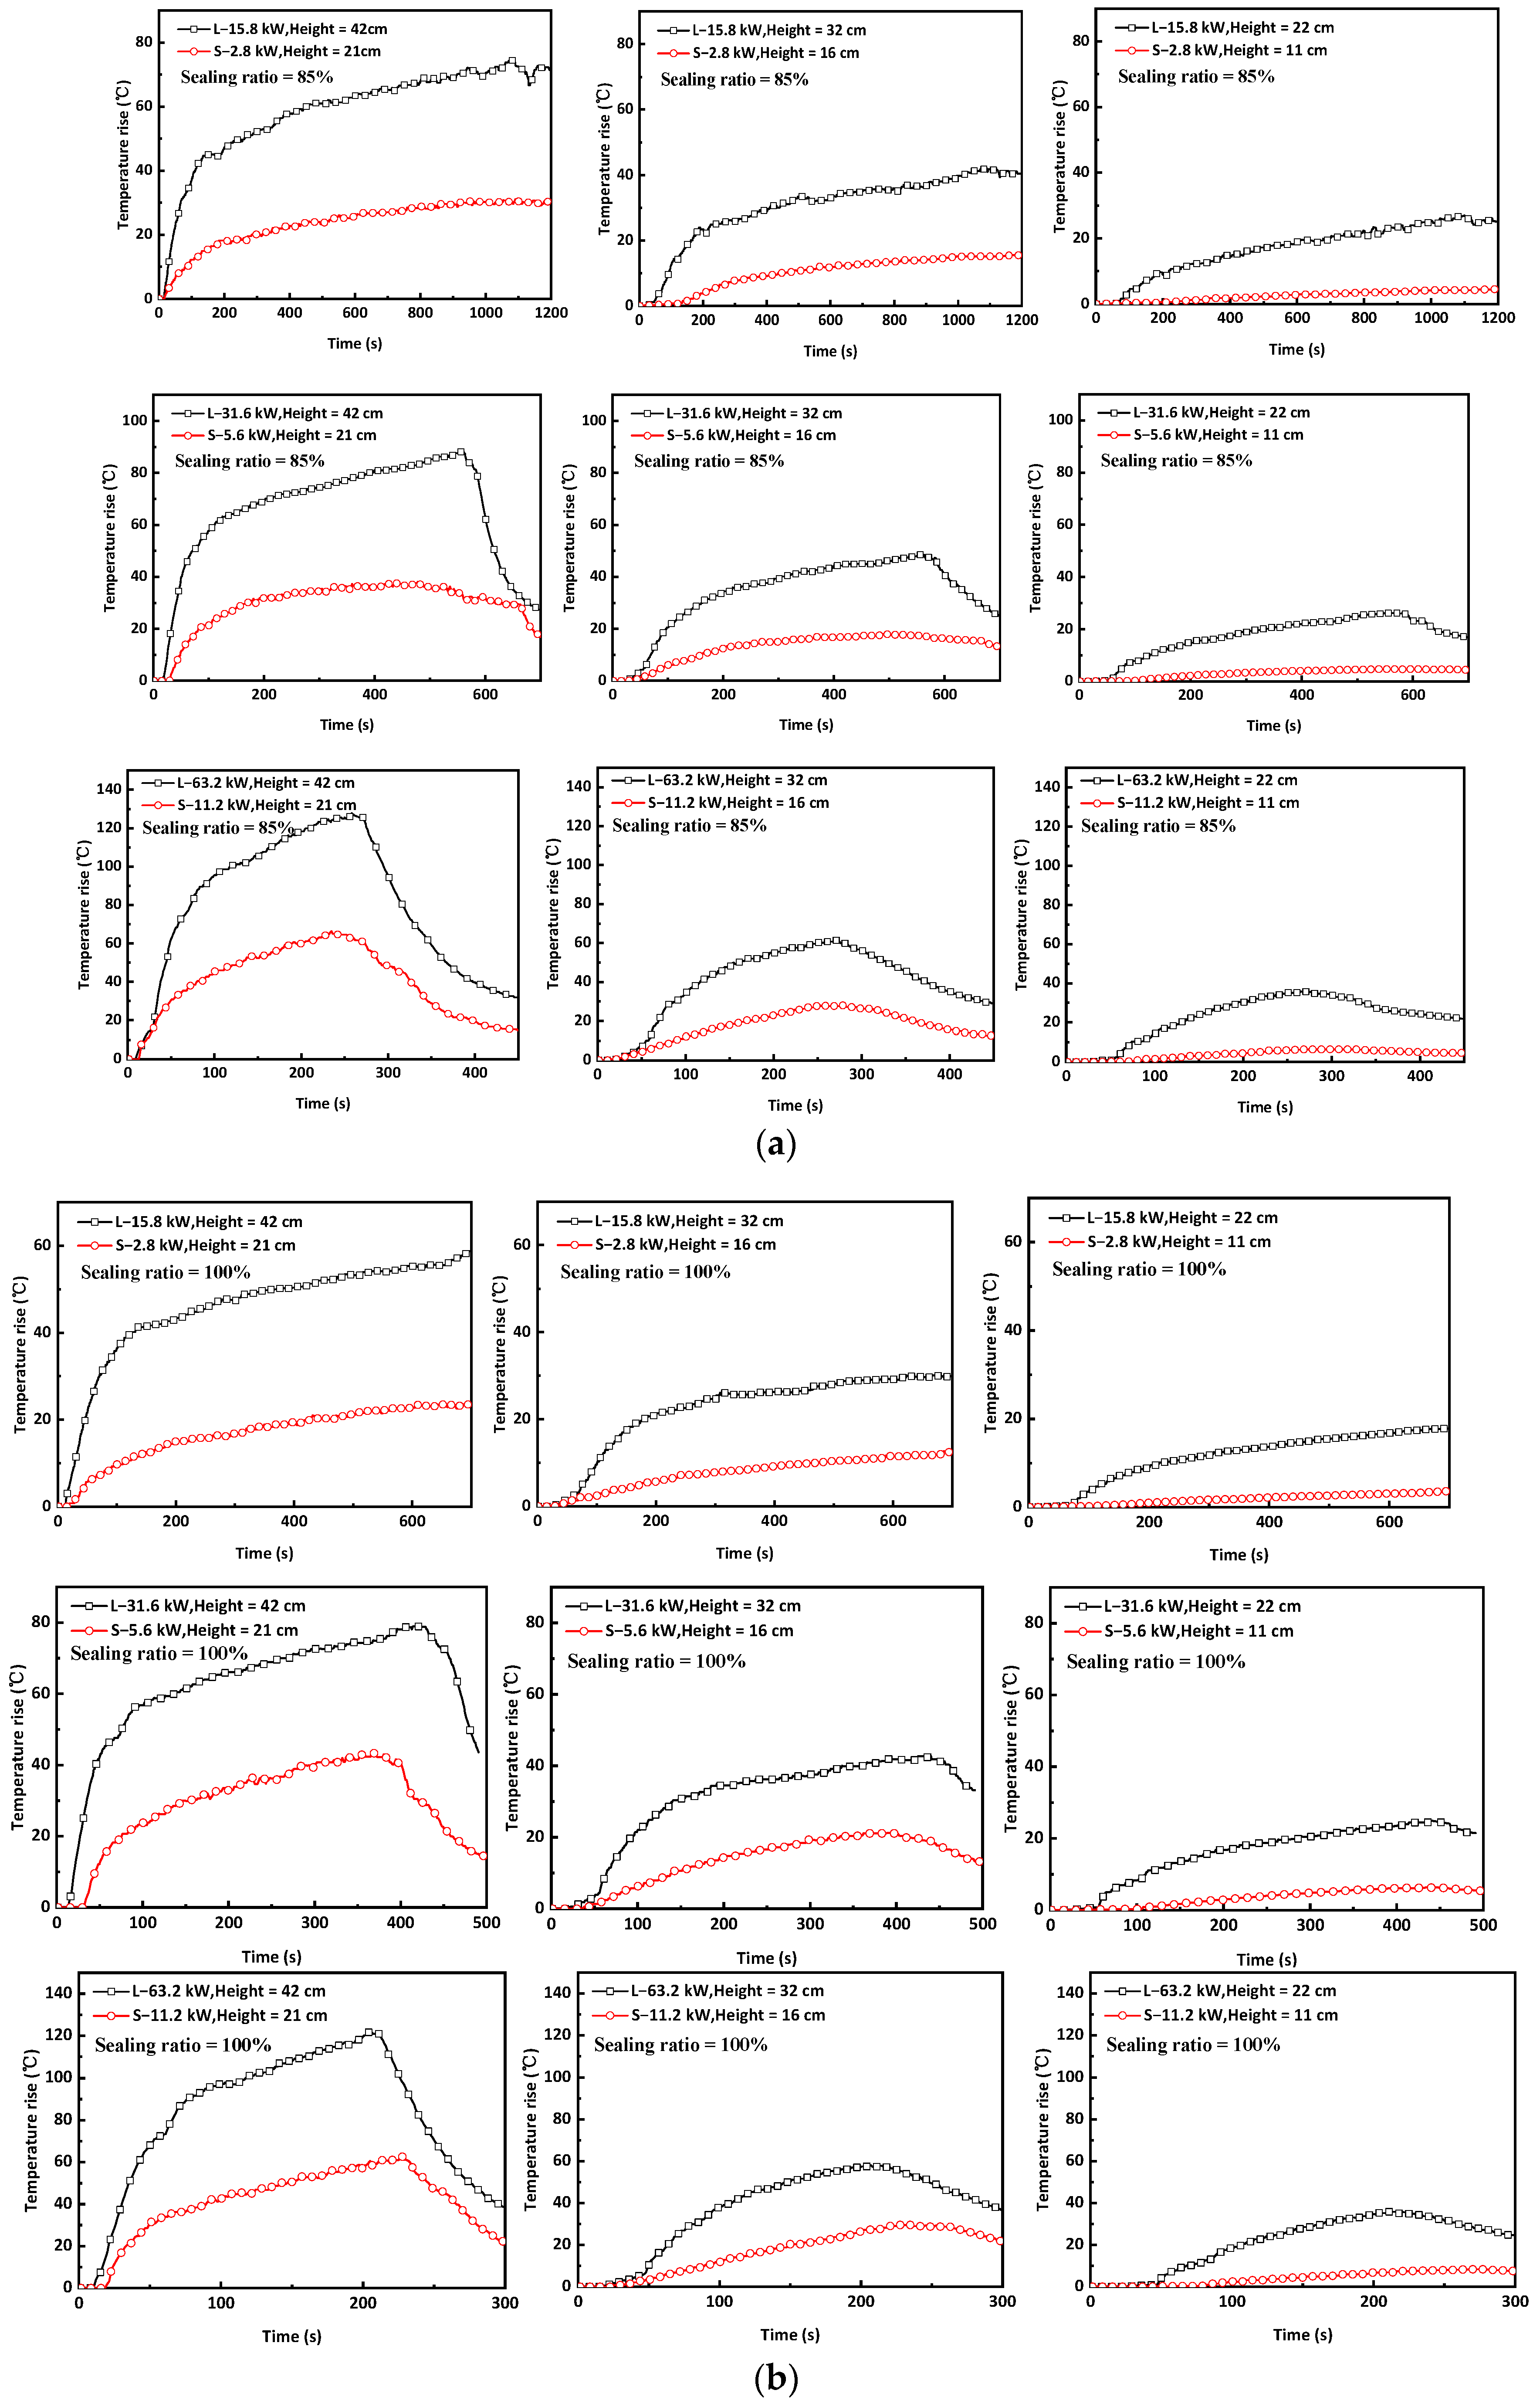
To further demonstrate the evolution of temperature with time, temperature rises at three points, A, B and C, located 6 m away from the fire seat and 42 cm, 32 cm and 22 cm above the floor in Tunnel-L, were compared with their corresponding points, a, b and c, located 3 m away from the fire seat and 21 cm, 16 cm and 11 cm above the floor in Tunnel-S, as shown in Figure 11. When comparing 2.8 kW and 15.8 kW fires at an 85% sealing ratio, the temperature rises at different heights increased over time throughout the experiment. At point a, the maximum temperature rise in Tunnel-S was approximately 25 °C, whilst it was 72 °C at point A in Tunnel-L, and the error in temperature rise at this point by using the 1/2 reduced-scale tunnel exceeded 65%. At point b, the maximum temperature rise in Tunnel-S was approximately 18 °C, while the actual measured temperature rise at point B in Tunnel-L was approximately 40 °C, with an error of approximately 55%. At point c, the maximum temperature rise was approximately 4 °C in Tunnel-S, while the actual measured temperature rise at point B was approximately 25 °C, with an error of approximately 84%. Similarly, at a sealing ratio of 100%, the temperature rises at the three points in reduced-scale models were significantly underestimated, and the error was as high as 85%.
3.6. Similarity in Oxygen Concentration
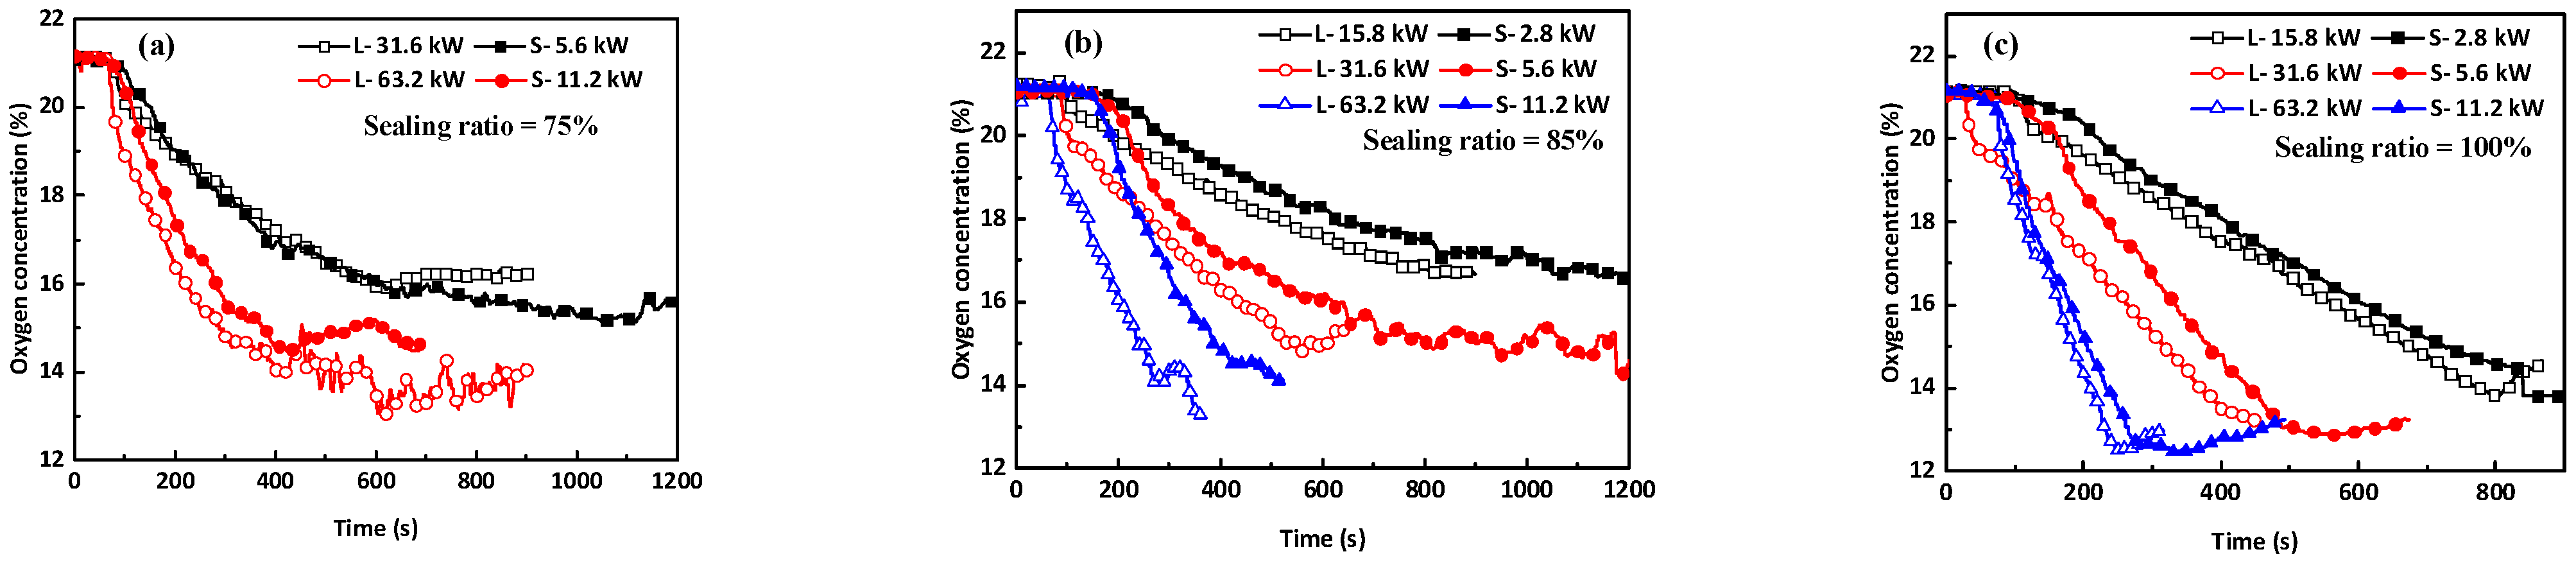
To further explore the detailed combustion characteristics of fires in the two tunnels, the evolution of oxygen concentrations close to the fire seats at different sealing ratios were quantitatively studied throughout the experiment, as shown in Figure 12. The measuring point in Tunnel-S was located 0.2 m away from the fire seats, 0.12 m underneath the ceiling in Tunnel-S, which corresponded to the point located 0.4 m away from the fire seats, 0.24 m underneath the ceiling in Tunnel-L. The gas concentrations and the times measured in Tunnel-S were converted for comparison to those in Tunnel-L based on the scaling law.
For a 5.6 kW fire in Tunnel-S at a sealing ratio of 75%, the oxygen concentrations close to the fire seat decreased continually to approximately 15.2% and the fire self-extinguished at around 746 s, which corresponded to 1055 s for a 31.6 kW fire in Tunnel-L. The experimental results for a 31.6 kW fire in Tunnel-L showed that the oxygen concentrations declined in a similar pattern as observed in Tunnel-S in the first 600 s and they stayed at a relative constant of approximately 16% after 600 s in Tunnel-L with no occurrence of self-extinction. For an 11.2 KW fire in Tunnel-S at a sealing ratio of 75%, the oxygen concentration declined to approximately 15.1% at 406 s and then the fire self-extinguished. For a corresponding fire of 63.2 kW fire in Tunnel-L, the oxygen concentrations reduced to a minimum of approximately 13% whilst the fire persisted throughout the test. It is interesting to note that the 63.2 kW fire could be sustained at a lower oxygen concentration of approximately 13% in Tunnel-L, whilst the corresponding fire, i.e., 11.2 kW, extinguished at a much higher oxygen concentration, i.e., 15.1%, in Tunnel-S.
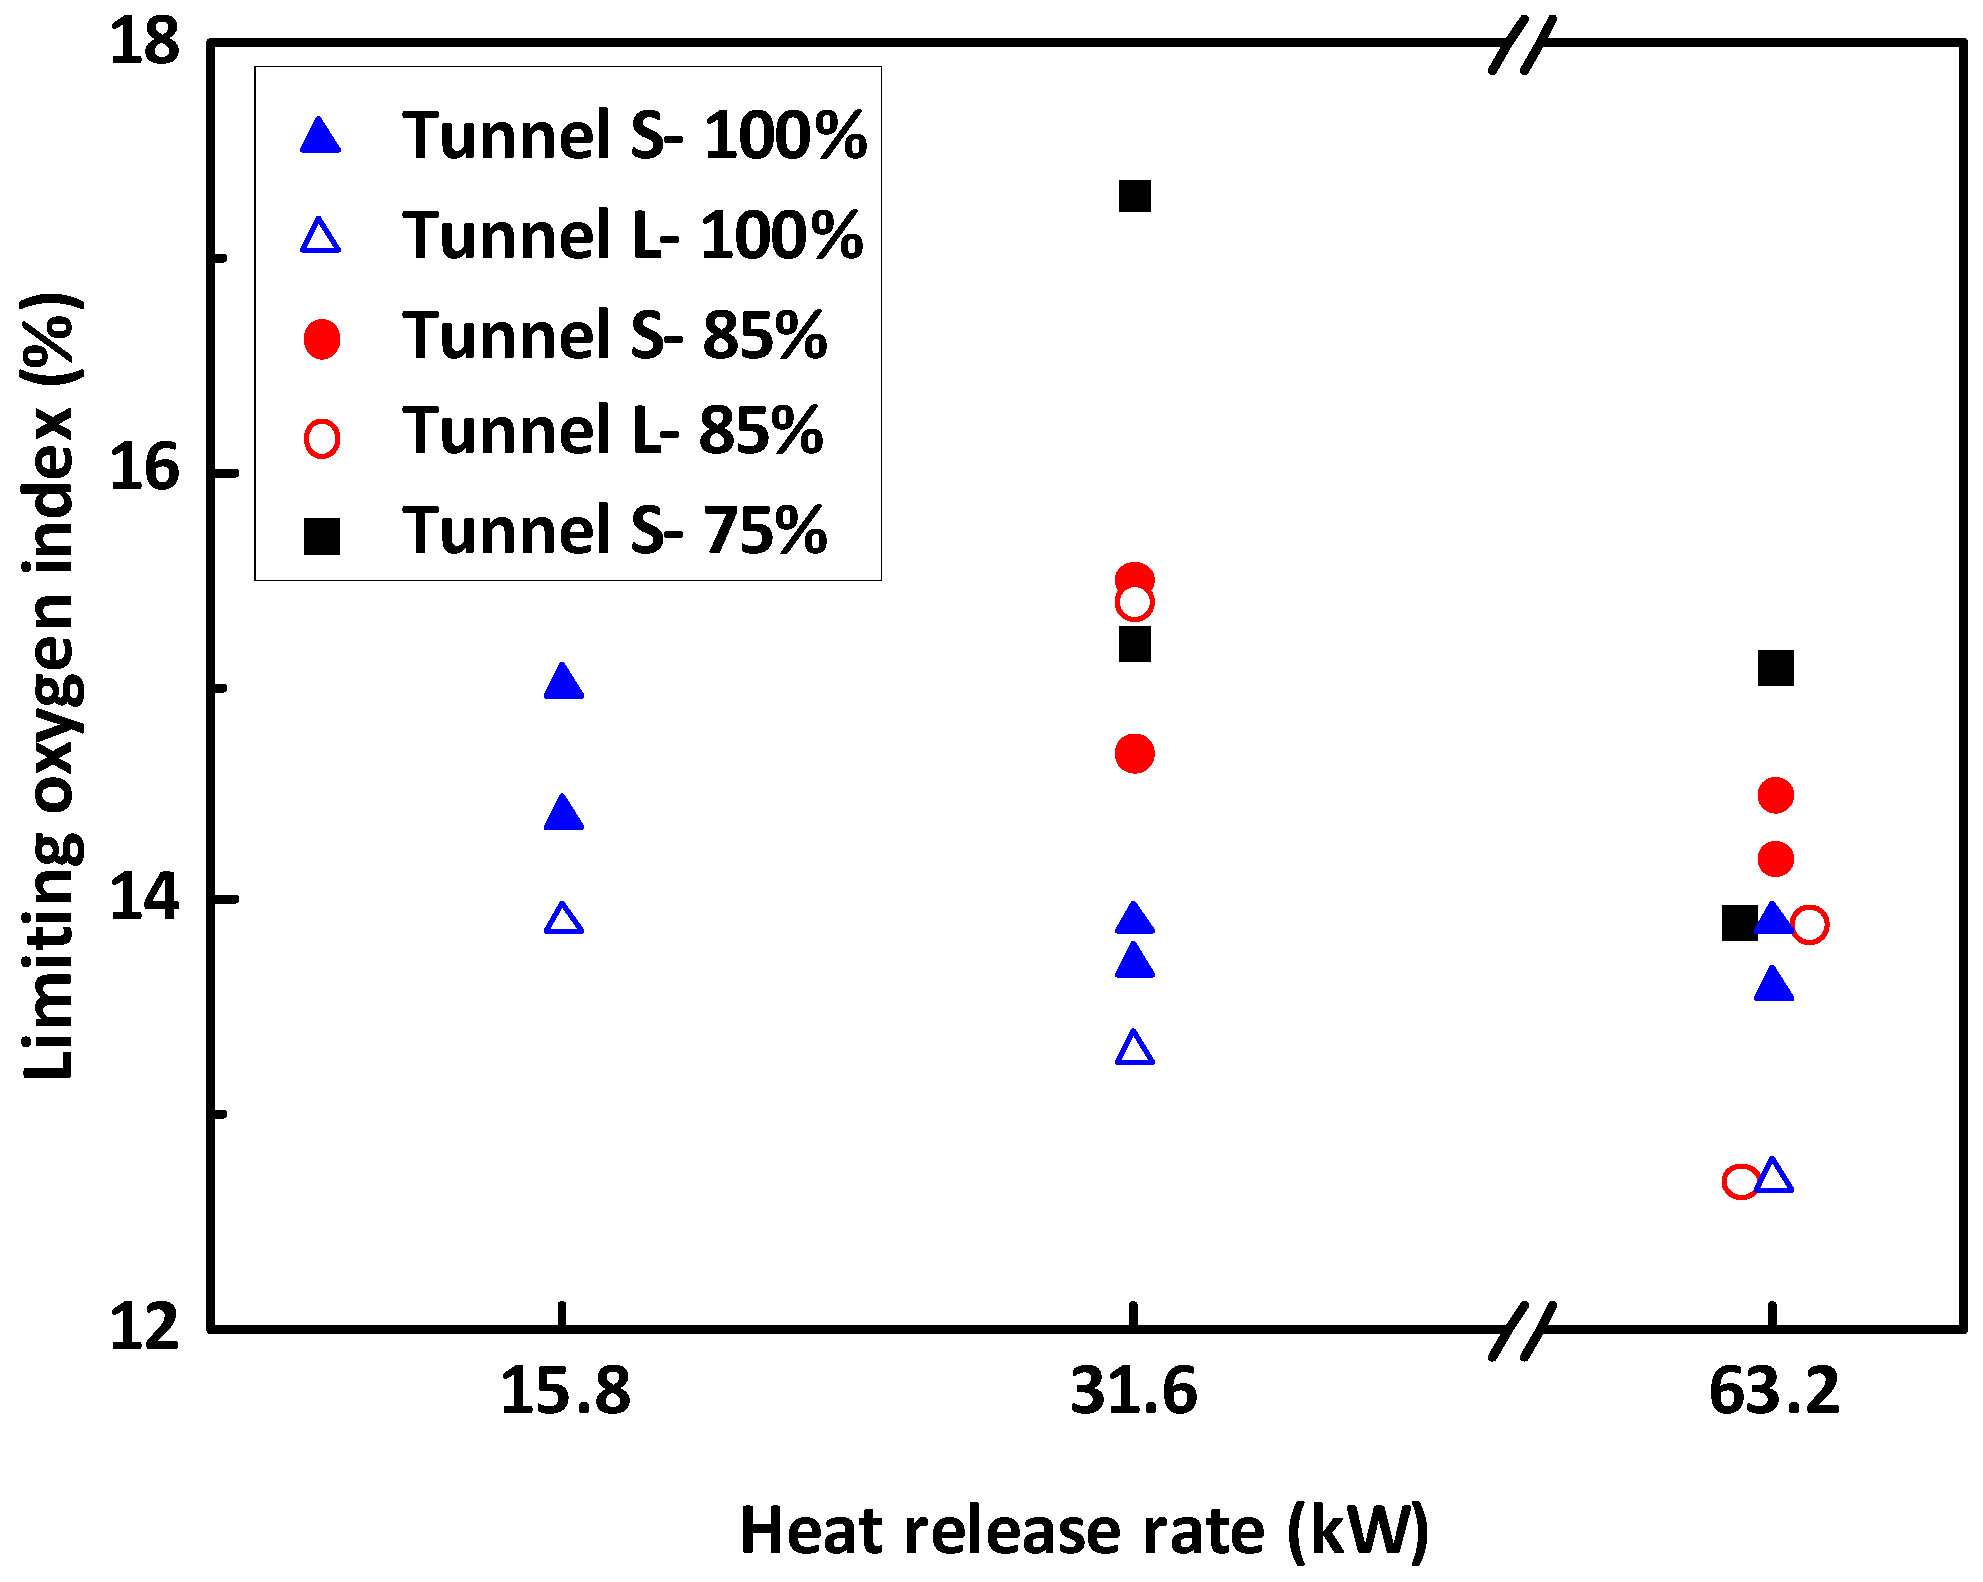
Figure 12 shows the comparison of experimental results between the two tunnels at sealing ratios of 85% and 100%. The oxygen concentrations of fires with heat-release rates of 2.8, 5.6 and 11.2 kW in Tunnel-S declined much more slowly than the corresponding heat-release rates in Tunnel-L. In other words, the oxygen concentration was over-predicted using the 1/2 reduced-scale tunnel. Figure 13 presents the limiting oxygen concentration in the two tunnels. The higher the sealing ratio, the lower the limiting oxygen concentration. Furthermore, the limiting oxygen concentrations in the prototype tunnel were lower than those in the reduced-scale tunnel.
4. Conclusions
Based on the literature review, most studies on tunnel fires so far were conducted in reduced-scale tunnels with scaling ratios ranging from 1/6 to 1/50. Sealing the portals of tunnels provides a promising fire-fighting approach to extinguish a fire in relatively long tunnels. However, whether the findings in a reduced-scale tunnel can be converted to its full-scale prototype tunnel based on scaling laws has not yet been adequately studied. A series of experiments with heat-release rates of 15.8, 31.6 and 63.2 kW were conducted with sealing ratios ranging from 0% to 100% in a prototype tunnel, measuring 20 m long, 0.9 m wide and 0.46 m high. The experimental results were compared with those from its corresponding 1/2 reduced-scale tunnel, measuring 10 m long, 0.45 m wide and 0.23 m high.
For smaller fire sizes, i.e., 2.8 kW and 5.6 KW, the maximum temperature above the fire seat in the 1/10 tunnel was over-predicted by approximately 5~26% using a 1/20 reduced-scale tunnel, and for larger fire sizes, i.e., 11.2 kW, the maximum temperature in the 1/10 tunnel was under-predicted by 5~10 by using a 1/20 reduced-scale tunnel, irrespective of the sealing ratios. The maximum temperature rise along the tunnels in the 1/20 tunnel was also significantly under-predicted. The error increased almost monotonously with distance from the fire seat, and they were as high as 70% at the tunnel portals, irrespective of the sealing ratios and heat-release rates. Furthermore, the temperature rises at other heights could be under-predicted by 85%, depending on the locations. With the increase in sealing ratio from 0% to 100%, the Reynolds number of the former were much lower than was the case when the movement of air and smoke was significantly constrained in the sealing conditions. However, the comparison of the two cases illustrated that the errors were almost the same, irrespective of the sealing ratios, and we can concluded that the scale effect of fires was not sensitive to the Reynolds number of flows in tunnels.
The critical sealing ratio for the self-extinction of fires was 75% in the 1/20 reduced-scale tunnel, whilst it was 85% in the 1/10 tunnel. It seemed that the fires were much more easily extinguished in the reduced-scale tunnel. Therefore, it is expected that the critical sealing ratio for a full-scale tunnel could be larger than 85%.
The study revealed that experimental results from reduced scale models should be further verified when applied to full-scale tunnels. It should be noted that the scale in this study was from 1/20 to 1/10 and the scaling ratio was only 2. It is expected that errors in temperature rises, critical sealing ratio for the self-extinction of fires, and oxygen concentration could be more significant for a full-scale tunnel. Further study should be conducted in tunnels with different sizes.
Author Contributions
Conceptualization, P.L. and B.L.; formal analysis, L.C. and X.W.; resources, P.L. All authors have read and agreed to the published version of the manuscript.
Funding
The authors greatly acknowledge the financial support from National Natural Science Foundation of China (No. 71974161).
Institutional Review Board Statement
Not applicable.
Informed Consent Statement
Not applicable.
Conflicts of Interest
The authors declare no conflict of interest.
References
- Roh, J.S.; Yang, S.S.; Ryou, H.S.; O Yoon, M.; Jeong, Y.T. An experimental study on the effect of ventilation velocity on burning rate in tunnel fires—Heptane pool fire case. Build. Environ. 2008, 43, 1225–1231. [Google Scholar] [CrossRef]
- Lee, S.R.; Ryou, H.S. An Experimental Study of the Effect of the Aspect Ratio on the Critical Velocity in Longitudinal Ventilation Tunnel Fires. J. Fire Sci. 2005, 23, 119–138. [Google Scholar] [CrossRef]
- Yao, Y.; He, K.; Peng, M.; Shi, L.; Cheng, X.; Zhang, H. Maximum gas temperature rise beneath the ceiling in a portals-sealed tunnel fire. Tunn. Undergr. Space Technol. 2018, 80, 10–15. [Google Scholar] [CrossRef]
- Wu, Y.; Bakar, M. Control of smoke flow in tunnel fires using longitudinal ventilation systems—A study of the critical velocity. Fire Saf. J. 2000, 35, 363–390. [Google Scholar] [CrossRef]
- Li, Y.Z.; Ingason, H. Model scale tunnel fire tests with automatic sprinkler. Fire Saf. J. 2013, 61, 298–313. [Google Scholar] [CrossRef]
- Ingason, H. Model scale railcar fire tests. Fire Saf. J. 2007, 42, 271–282. [Google Scholar] [CrossRef]
- Hansen, R.; Ingason, H. Heat release rates of multiple objects at varying distances. Fire Saf. J. 2012, 52, 1–10. [Google Scholar] [CrossRef] [Green Version]
- Choi, B.; Oh, C.; Kim, M.; Han, Y.; Choi, J. A new design criterion of fire ventilation for transversely ventilated tunnels. Tunn. Undergr. Space Technol. 2006, 21, 277–278. [Google Scholar] [CrossRef]
- Chen, C.-K.; Zhu, C.-X.; Liu, X.-Y.; Yu, N.-H. Experimental investigation on the effect of asymmetrical sealing on tunnel fire behavior. Int. J. Heat Mass Transf. 2016, 92, 55–65. [Google Scholar] [CrossRef]
- Chen, C.-K.; Xiao, H.; Wang, N.-N.; Shi, C.-L.; Zhu, C.-X.; Liu, X.-Y. Experimental investigation of pool fire behavior to different tunnel-end ventilation opening areas by sealing. Tunn. Undergr. Space Technol. 2017, 63, 106–117. [Google Scholar] [CrossRef]
- Huang, Y.; Li, Y.; Dong, B.; Li, J.; Liang, Q. Numerical investigation on the maximum ceiling temperature and longitudinal decay in a sealing tunnel fire. Tunn. Undergr. Space Technol. 2018, 72, 120–130. [Google Scholar] [CrossRef]
- Yao, Y.; Cheng, X.; Zhang, S.; Zhu, K.; Zhang, H.; Shi, L. Maximum smoke temperature beneath the ceiling in an enclosed channel with different fire locations. Appl. Therm. Eng. 2017, 111, 30–38. [Google Scholar] [CrossRef]
- Yao, Y.; Cheng, X.; Shi, L.; Zhang, S.; He, K.; Peng, M.; Zhang, H. Experimental study on the effects of initial sealing time on fire behaviors in channel fires. Int. J. Therm. Sci. 2018, 125, 273–282. [Google Scholar] [CrossRef]
- Wang, K.-H.; Chen, J.-M.; Wang, Z.-K.; Gao, D.-L.; Wang, G.-Y.; Lin, P. An experimental study on self-extinction of tunnel fire under natural ventilation condition. Tunn. Undergr. Space Technol. 2018, 84, 177–188. [Google Scholar] [CrossRef]
- Xu, Z.; Zhao, J.; Liu, Q.; Chen, H.; Liu, Y.; Geng, Z.; He, L. Experimental investigation on smoke spread characteristics and smoke layer height in tunnels. Fire Mater. 2019, 43, 303–309. [Google Scholar] [CrossRef]
- Lin, P.; Wang, Z.-K.; Wang, K.-H.; Gao, D.-L.; Shi, J.-K.; You, S.-H.; Chen, Z.-N.; Wang, G.-Y.; Mei, X.-J. An experimental study on self-extinction of methanol fire in tilted tunnel. Tunn. Undergr. Space Technol. 2019, 91, 102996. [Google Scholar] [CrossRef]
- You, S.-H.; Wang, K.-H.; Shi, J.-K.; Chen, Z.-N.; Gao, D.; Chen, J.-M.; Lin, P. Self-extinction of methanol fire in tunnel with different configuration of blocks. Tunn. Undergr. Space Technol. 2020, 98, 103343. [Google Scholar] [CrossRef]
- Shi, J.-K.; Zuo, C.; Xiong, Y.-Y.; Zhou, M.; Lin, P. Experimental study of different sealing ratios on the self-extinction of tunnel fires. Tunn. Undergr. Space Technol. 2021, 112, 103894. [Google Scholar] [CrossRef]
- Li, Y.Z.; Hertzberg, T. Scaling of internal wall temperatures in enclosure fires. J. Fire Sci. 2015, 33, 113–141. [Google Scholar] [CrossRef] [Green Version]
- Ingason, H.; Li, Y.Z.; Lönnermark, A. Tunnel Fire Dynamics; Springer: Berlin/Heidelberg, Germany, 2014. [Google Scholar]
- Vauquelin, O.; Michaux, G.; Lucchesi, C. Scaling laws for a buoyant release used to simulate fire-induced smoke in laboratory experiments. Fire Saf. J. 2008, 44, 665–667. [Google Scholar] [CrossRef]
- Tilley, N.; Rauwoens, P.; Fauconnier, D.; Merci, B. On the extrapolation of CFD results for smoke and heat control in reduced-scale set-ups to full scale: Atrium configuration. Fire Saf. J. 2013, 59, 160–165. [Google Scholar] [CrossRef] [Green Version]
- Lin, P.; Xiong, Y.-Y.; Zuo, C.; Shi, J.-K. Verification of Similarity of Scaling Laws in Tunnel Fires with Natural Ventilation. Fire Technol. 2021, 57, 1611–1635. [Google Scholar] [CrossRef]
- Kile, G.W.; Gonzalez, J.A. The memorial tunnel fire ventilation test program: The longitudinal and natural tests. J. Ashrae Trans. 1997, 103, 701–713. [Google Scholar]
- Hurley, M.J. SFPE Handbook of Fire Protection Engineering; Springer: Berlin/Heidelberg, Germany, 2015. [Google Scholar]
- Li, Y.Z.; Lei, B.; Ingason, H. The maximum temperature of buoyancy-driven smoke flow beneath the ceiling in tunnel fires. Fire Saf. J. 2011, 46, 204–210. [Google Scholar] [CrossRef]
- Hu, L.H.; Wu, L.; Liu, S. Flame length elongation behavior of medium hydrocarbon pool fires in cross air flow. Fuel. 2013, 111, 613–620. [Google Scholar] [CrossRef]
- Emori, R.I.; Saito, K. A Study of Scaling Laws in Pool and Crib Fires. Combust. Sci. Technol. 1983, 31, 217–231. [Google Scholar] [CrossRef]
Figure 1.
Set-up of Tunnel-L and arrangement of instruments (unit: m).

Figure 2.
Set-up of Tunnel-S and arrangement of instruments (unit: m).

Figure 3.
Evolution of peak temperature rise above the fire source in Tunnel-S at different sealing ratios (the time included 60 s prior to fire ignition). (a) Sealing ratio = 0%, (b) Sealing ratio = 75%, (c) Sealing ratio = 100%.
Figure 3.
Evolution of peak temperature rise above the fire source in Tunnel-S at different sealing ratios (the time included 60 s prior to fire ignition). (a) Sealing ratio = 0%, (b) Sealing ratio = 75%, (c) Sealing ratio = 100%.

Figure 4.
Evolution of peak temperature rise above the fire source in Tunnel-L at different sealing ratios (the time included 60 s prior to fire ignition). (a) Sealing ratio = 0%, (b) Sealing ratio = 75%, (c) Sealing ratio = 85%, (d) Sealing ratio = 100%.
Figure 4.
Evolution of peak temperature rise above the fire source in Tunnel-L at different sealing ratios (the time included 60 s prior to fire ignition). (a) Sealing ratio = 0%, (b) Sealing ratio = 75%, (c) Sealing ratio = 85%, (d) Sealing ratio = 100%.

Figure 5.
Comparison of maximum temperature in Tunnel-S and Tunnel-L at varying sealing ratios.


Figure 7.
Comparison of the critical sealing ratios in the two tunnels. (a) Critical sealing ratio in Tunnel S, (b) Critical sealing ratio in Tunnel L.
Figure 7.
Comparison of the critical sealing ratios in the two tunnels. (a) Critical sealing ratio in Tunnel S, (b) Critical sealing ratio in Tunnel L.

Figure 8.
Comparison of the self-extinction time in the two tunnels. (a) sealing ratio of 85%, (b) sealing ratio of 100%.
Figure 8.
Comparison of the self-extinction time in the two tunnels. (a) sealing ratio of 85%, (b) sealing ratio of 100%.

Figure 9.
Comparison of temperature rise along Tunnel-S and Tunnel-L at varying sealing ratios. (a) Sealing ratio of 85%, (b) Sealing ratio of 100%.
Figure 9.
Comparison of temperature rise along Tunnel-S and Tunnel-L at varying sealing ratios. (a) Sealing ratio of 85%, (b) Sealing ratio of 100%.

Figure 10.
Difference in temperature rise between Tunnel S and Tunnel L.

Figure 11.
Comparison of transient temperature rises for three points (A, B and C were 6 m away from the fire seats along the tunnel and at 42 cm, 32 cm and 22 cm above the floor in Tunnel-L, which corresponded to the points a, b and c at 3 m away from the fire seats along the tunnel at 21 cm, 16 cm and 11 cm above the floor in Tunnel-S). (a) Sealing ratio = 85%, (b) Sealing ratio = 100%.

Figure 12.
Evolution of oxygen concentrations close to the fire seat at different sealing ratios. (a) Sealing ratio = 75%, (b) Sealing ratio = 85%, (c) Sealing ratio = 100%.
Figure 12.
Evolution of oxygen concentrations close to the fire seat at different sealing ratios. (a) Sealing ratio = 75%, (b) Sealing ratio = 85%, (c) Sealing ratio = 100%.

Figure 13.
Limiting oxygen concentration at varying heat-release rates and scales.


Table 1.
A list of scaling correlations.
| Type | Scaling Law | Unit |
|---|---|---|
| Heat-release rate | kW | |
| Velocity | m/s | |
| Time | s | |
| Temperature | K | |
| Gas concentration | - |
Subscripts M and F represent model scale and full scale respectively.
Table 2.
Summary of tested fire scenarios in Tunnel-L.
| No. | HRR/kW | Self-Extinction or Not | Self-Extinction Time/s | Limiting Oxygen Concentration/% |
|---|---|---|---|---|
| L-15.8–0%-Ⅰ | N | - | - | |
| L-15.8–75%-Ⅰ | N | - | - | |
| L-15.8–85%-Ⅰ | N | - | - | |
| L-15.8–85%-Ⅱ | 15.8 | N | - | - |
| L-15.8–100%-Ⅰ | Y | 745 | - | |
| L-15.8–100%-Ⅱ | Y | 792 | 13.9 | |
| L-31.6–0%-Ⅰ | N | - | - | |
| L-31.6–75%-Ⅰ | N | - | - | |
| L-31.6–75%-Ⅱ | N | - | - | |
| L-31.6–85%-Ⅰ | Y | 753 | - | |
| L-31.6–85%-Ⅱ | 31.6 | Y | 575 | 15.4 |
| L-31.6–100%-Ⅰ | Y | 414 | NA | |
| L-31.6–100%-Ⅱ | Y | 452 | 13.3 | |
| L-63.2–0%-Ⅰ | N | - | - | |
| L-63.2–75%-Ⅰ | N | - | - | |
| L-63.2–75%-Ⅱ | N | - | - | |
| L-63.2–85%-Ⅰ | 63.2 | Y | 340 | 13.9 |
| L-63.2–85%-Ⅱ | Y | 339 | 12.7 | |
| L-63.2–100%-Ⅰ | Y | 227 | NA | |
| L-63.2–100%-Ⅱ | Y | 240 | 12.7 |
NA—not available.
Table 3.
Summary of tested fire scenarios in Tunnel-S.
| No. | HRR/kW | Self-Extinction or Not | Self-Extinction Time/s | Limiting Oxygen Concentration/% |
|---|---|---|---|---|
| S-2.8–0%-Ⅰ | 2.8 | N | - | - |
| S-2.8–75%-Ⅰ | N | - | - | |
| S-2.8–75%-Ⅱ | N | - | - | |
| S-2.8–85%-Ⅰ | N | - | - | |
| S-2.8–85%-Ⅱ | N | - | - | |
| S-2.8–100%-Ⅰ | Y | 517 | 15 | |
| S-2.8–100%-Ⅱ | Y | 533 | 14.4 | |
| S-5.6–0%-Ⅰ | 5.6 | N | - | - |
| S-5.6–75%-Ⅰ | Y | 746 | 15.2 | |
| S-5.6–75%-Ⅱ | Y | 788 | 17.3 | |
| S-5.6–85%-Ⅰ | Y | 463 | 15.5 | |
| S-5.6–85%-Ⅱ | Y | 704 | 14.7 | |
| S-5.6–100%-Ⅰ | Y | 319 | 13.9 | |
| S-5.6–100%-Ⅱ | Y | 318 | 13.7 | |
| S-11.2–0%-Ⅰ | 11.2 | N | - | - |
| S-11.2–75%-Ⅰ | Y | 406 | 15.1 | |
| S-11.2–75%-Ⅱ | Y | 726 | 13.9 | |
| S-11.2–85%-Ⅰ | Y | 251 | 14.5 | |
| S-11.2–85%-Ⅱ | Y | 248 | 14.2 | |
| S-11.2–100%-Ⅰ | Y | 221 | 13.6 | |
| S-11.2–100%-Ⅱ | Y | 168 | 13.9 |
Disclaimer/Publisher’s Note: The statements, opinions and data contained in all publications are solely those of the individual author(s) and contributor(s) and not of MDPI and/or the editor(s). MDPI and/or the editor(s) disclaim responsibility for any injury to people or property resulting from any ideas, methods, instructions or products referred to in the content. |
© 2023 by the authors. Licensee MDPI, Basel, Switzerland. This article is an open access article distributed under the terms and conditions of the Creative Commons Attribution (CC BY) license (https://creativecommons.org/licenses/by/4.0/).
Share and Cite
MDPI and ACS Style
Chen, L.; Wang, X.; Li, B.; Lin, P. Experimental Study of Scale Effect in Tunnel Fires at Different Sealing Ratios. Fire 2023, 6, 92. https://doi.org/10.3390/fire6030092
AMA Style
Chen L, Wang X, Li B, Lin P. Experimental Study of Scale Effect in Tunnel Fires at Different Sealing Ratios. Fire. 2023; 6(3):92. https://doi.org/10.3390/fire6030092
Chicago/Turabian StyleChen, Ling, Xuan Wang, Baiyi Li, and Peng Lin. 2023. "Experimental Study of Scale Effect in Tunnel Fires at Different Sealing Ratios" Fire 6, no. 3: 92. https://doi.org/10.3390/fire6030092