
Energy-Efficient De-Duplication Mechanism for Healthcare Data Aggregation in IoT


1
School of Information and Communication Engineering, Guilin University of Electronic Technology, Guilin 541004, China
2
Guangxi Key Laboratory of Wireless Broadband Communication and Signal Processing, School of Information and Communication, Guilin University of Electronic Technology, Guilin 541004, China
3
Department of Computer Science, National University of Modern Languages (NUML), Islamabad 44000, Pakistan
*
Authors to whom correspondence should be addressed.
Future Internet 2024, 16(2), 66; https://doi.org/10.3390/fi16020066
Submission received: 5 December 2023
/
Revised: 9 February 2024
/
Accepted: 11 February 2024
/
Published: 19 February 2024
Abstract
:The rapid development of the Internet of Things (IoT) has opened the way for transformative advances in numerous fields, including healthcare. IoT-based healthcare systems provide unprecedented opportunities to gather patients’ real-time data and make appropriate decisions at the right time. Yet, the deployed sensors generate normal readings most of the time, which are transmitted to Cluster Heads (CHs). Handling these voluminous duplicated data is quite challenging. The existing techniques have high energy consumption, storage costs, and communication costs. To overcome these problems, in this paper, an innovative Energy-Efficient Fuzzy Data Aggregation System (EE-FDAS) has been presented. In it, at the first level, it is checked that sensors either generate normal or critical readings. In the first case, readings are converted to Boolean digit 0. This reduced data size takes only 1 digit which considerably reduces energy consumption. In the second scenario, sensors generating irregular readings are transmitted in their original 16 or 32-bit form. Then, data are aggregated and transmitted to respective CHs. Afterwards, these data are further transmitted to Fog servers, from where doctors have access. Lastly, for later usage, data are stored in the cloud server. For checking the proficiency of the proposed EE-FDAS scheme, extensive simulations are performed using NS-2.35. The results showed that EE-FDAS has performed well in terms of aggregation factor, energy consumption, packet drop rate, communication, and storage cost.
1. Introduction
The Internet of Things (IoT) is undeniably an innovative technology [1] that brings ease to our lives [2] and reshapes the industrial sector [3]. It comprises innumerable sensors that can perceive data from various domains including temperature, humidity, fire detection, and many more. The real-time transmission of this aggregated data into the central server assists in examining and taking immediate action as per current circumstances. A variety of IoT-enabled wearable devices can be fixed in attires, entrenched on the body, or stuck to a patient’s skin. These implanted devices are used to remotely examine the health conditions of patients [4]. It frequently takes patients’ vital health-related data and performs trivial computations before transmitting it further to a central entity [5]. The doctors, nursing staff, or other medical professionals who have access can check the data anytime to analyze and make suitable decisions at the right time [6].
Data aggregation is a mechanism in which data are collected, combined, and summarized at the aggregator node and then forwarded further [7]. In IoT-enabled WSNs, the environment can be homogeneous or heterogeneous. In a homogenous network, all nodes are of the same type and generate the same type of data which makes it comparatively easy to handle. The heterogeneous environment is quite complex as nodes are different and produce data in different formats [8]. Based on network size, different data aggregation approaches are considered. Centralized data aggregation (CDA) and in-network data aggregation (IDA) are the most commonly used techniques. The CDA is most commonly used for small networks, in which there is only one aggregator that gathers data from all nodes of the network. The IDA approach eliminates the drawbacks of the former technique by providing multiple AN nodes distributed in the network to collect data from nodes and send it to the Base Station (BS) [9].
De-duplication is a mechanism to identify and remove similar copies of data and serves as a central approach to cope with the growing volumes of data efficiently [10]. The de-duplication process is employed by using two main strategies. The inline de-duplication approach occurs in real-time when data are checked for duplicates before storing it in the storage system. Background de-duplication works as a post-process once data has been primarily written to the storage system. It includes periodically scanning the present data to detect and remove duplicates [11]. In the healthcare sector, the vast collection of medical records, diagnostic reports, and patient histories can lead to data redundancy, which ultimately utilizes high storage space and increases energy consumption. Energy consumption is directly proportional to the network lifetime and unnecessary repeated data wastes the sensor device resources [12].
The necessity of developing a new technique in healthcare is because of the critical need for continuous improvement and innovation in medical monitoring systems. Existing healthcare schemes suffer from the challenges of ineffective data aggregation, inappropriate redundant data handling, energy consumption, and storage costs in heterogeneous environments [13]. In the healthcare sector, sensor devices collect data in detail and frequently transmit it to BS. This unnecessary replication of data drains the limited resources of sensor nodes [14]. These resources need to be used wisely, especially in the context of healthcare where precise information is required for better treatment. The development of the proposed technique becomes imperative to minimize these challenges comprehensively.
The research question for this work is as follows: How can we improve the de-duplication process of healthcare data to achieve better aggregation and packet delivery ratio while reducing the energy consumption and communication cost?
This paper presents a de-duplication mechanism for the Energy Efficient Fuzzy Data Aggregation System (EE-FDAS) to enhance network lifetime in heterogeneous environments by mitigating data duplication issues. The novelty of the proposed EE-FDAS lies in its mechanism of handling healthcare data. The EE-FDAS focuses on handling the data in different formats generated by various sensors in healthcare environments. It is based on the three-tiered approach, In the first case, when data lies in a normal range and has no variation, instead of transmitting full 16 or 32-bit data, only Boolean digit 0 is sent. In the second case, when there is a partial irregularity in data readings, only those values are sent in full form, while normal data is transmitted in Boolean digits. In the third scenario, when all data readings lie in the critical range then all values are sent in their original format, it occurs rarely. This approach demonstrates the adaptability of EE-FDAS to diverse healthcare data scenarios. Moreover, the proposed scheme contributes to the sustainability of healthcare monitoring systems by reducing redundancy issues, ensuring a more robust and resource-efficient solution in the domain of IoT-enabled Wireless Sensor Networks (WSNs). This improvement assists in enhancing the usefulness of remote patient monitoring, mainly in resource-constrained and rural healthcare settings, eventually improving the quality and accessibility of healthcare services. The contributions of this research are presented as follows:
- (1)
- We thoroughly studied the most relevant and latest literature on data aggregation approaches in the domain of IoT. This comprehensive study forms the foundation for understanding the existing landscape and identifying gaps for improvement in the field of the healthcare sector.
- (2)
- This work presents the EE-FDAS scheme, employing a three-tiered approach to data transmission based on the nature of the healthcare data.
- (3)
- Next, the proposed mechanism is applied at the sensor level to transmit Boolean digits for in-range values, whereas the complete data readings are shared in case of variation. The EE-FDAS, by enhancing the efficiency of data aggregation in healthcare WSNs, contributes to the progression and sustainability of modern healthcare technologies.
- (4)
- An extensive number of simulations are performed by using NS 2.35. Results are extracted from trace files to compare with counterparts.
The rest of paper is organized as follows. Section 2 presents the latest existing schemes on data aggregation. In Section 3, the problem statement and system of the proposed solution are described. In Section 4, the solution of the proposed scheme is described in detail. Section 5 illuminates results and analysis while Section 6 presents the conclusion and future work.
2. Literature Review
In WSNs, numerous sensors generate different types of data. These data are aggregated before transmitting to the base station. The purpose of data aggregation is to enhance network lifetime, lessen high energy consumption, and load-balancing, increase scalability, and lessen latency. Much research has been performed on data aggregation, which is categorized into two sections. Each category is elaborated with its relevant techniques. Protocols should be described in detail, while well-established methods can be briefly described and appropriately cited.
2.1. Clustering-Based Data Aggregation Schemes
In clustering-based data aggregation techniques, sensor nodes are grouped into clusters. Each cluster comprises a Cluster Head (CH) which is selected according to some conditions. The CH collects data from Cluster Members (CMs) and transmits it to the base station. For clustering, the K-means algorithm is employed and the numbers of clusters are determined by using the elbow method as mentioned in Equation (1) as it informs about total clusters. To enhance security and resolve the cost issue of healthcare aggregated data, clusters are further divided into sub-clusters.
SSE represents the sum of squared errors, x denotes the total sensors in the cluster, and ck is the kth cluster. Data are aggregated at the sensor level by considering extreme points only where the duplicated data is not transmitted to CH. The Extrema Point (EP) mechanism is not very flexible to use as it may not apply to all kinds of data [13,14]. The CH uses a Bayesian-fusion algorithm to calculate trust scores for CMs and transmits aggregated data to BS. In the same context, to enhance the security of healthcare data, an anonymity-based clustering method has been used. By employing the client-server model, anonymization is ensured before transmitting it to the aggregator node [15].
Ahmed et al. [16] proposed that IoT devices gather data from devices and transmit it to BS using a fuzzy matrix. The collected data are then sent to the edge server. The cloud server validates the edge server and blockchain technology is utilized to avoid malicious attacks. For security, sensor nodes transmit encrypted data to Aggregator Nodes (Ans). To reduce energy consumption, communication, and storage costs, Ans further transmit compressed data to fog servers [17]. While Ananth et al. [18] performed clustering by the glow swarm optimization method. The proposed scheme has lower latency and is suitable for medical applications but multi-layer clustering may increase complexity [19]. Basha et al. proposed a technique to enhance efficiency and security in WSNs while resolving energy consumption issues. The Conditional Tug of War Optimization is used to calculate node trust. Energy optimization was achieved by cluster-based data aggregation, yet the method only focused on node energy levels. Major factors, including node distance and degree, were neglected [20]. Abid et al. have employed multi-clustering in which the aggregator node’s energy level is checked from time to time. In case it is greater than the threshold factor, the Candidate Flag bit will be set as 1. In case energy is low, the Aggregator node is replaced with the nearest node. It has a better load-balancing strategy but if the nearest chosen aggregator has low energy, the whole network will be affected [21].
To overcome energy utilization in the healthcare sector, a fuzzy-based data aggregation scheme is introduced. By considering the heterogeneous environment, an appropriate parent node is selected for each node, afterwards when data is aggregated it is checked for duplicate values. If they exist, they are replaced with the Boolean digit 0 at Level 2. This significantly reduces data size, overcomes storage space, as well as increases the aggregation factor [22]. Randhawa et al. [23] employed K-means clustering and fuzzy logic for aggregation. The aggregation rate, energy utilization, and data persistence are taken as fuzzy input, and network lifetime is obtained as output. The scheme has reduced the duplicate ratio. To monitor patient data in the healthcare system. Yang et al. [24] have presented a centralized approach to reduce energy consumption and enhance efficiency. The selection of the CH is performed by BS and energy is preserved by switching idle sensors to a sleep state. The scheme has a better network lifetime but a high storage cost and some other parameters should also be considered for CH selection [24]. Dwivedi et al. [25] have introduced an energy improvement scheme for homogenous WSNs. To select an appropriate CH from nodes, the rank is calculated. The higher rank increases the likelihood of a node being selected as CH. The CMs select clusters by using a fuzzy system. When clustering is finalized, CMs transmit data to CH, which CH aggregates and forwards to BS. The proposed scheme gains better energy utilization and reduces the chances of hotspot issues. Some other parameters should be considered for the intelligent selection of CH to overcome latency [25].
To improve energy utilization and lessen the issue of congestion, Mohseni et al. have presented a cluster-based strategy that includes two crucial stages. The first stage involves establishing sensors in clusters. For transmitting data from sensors to CH, and CH to BS, the shortest path is selected by using the Capuchin Searching algorithm that helps in overcoming energy consumption. The scheme is simulated over MATLAB and it has a better network lifetime, lower delay, and higher rate of packet delivery. The scheme uses a Capuchin searching algorithm that is not very efficient in the case of large networks [26]. To enhance the network lifetime of sensors in the medical field, multi-hop routing is checked. The scheme has a better lifetime, but not enough parameters are considered for hop selection and the security aspect for maintenance is neglected [27,28]. To securely transmit healthcare data, active sensors are selected by the Archimedes algorithm and the shortest path is selected by an attribute-centered binary scheme [29]. Similarly, clustering and data aggregation is performed for underwater WSNs [30,31]. The first layer contains medical sensors to capture the patient’s condition and data is transferred to a fog server. The fog server prioritizes the data based on the health state and intensity of diseases. This task is performed by fog clusters. If the computing cost is greater than available resources then by offloading mechanism, data is transferred to the cloud. In the end, reports are created for medical staff to take better steps in treatment [32].
2.2. Tree-Based Data Aggregation Schemes
In this category, child sensor nodes transmit data to parent nodes and these parent nodes send aggregated data to the base station at the next level, creating a hierarchy. To efficiently aggregate data, a tree-based structure is employed. For fuzzification, min-max normalization is performed. A node with a lesser sum of weight and having a direct connection is elected as a parent. The scheme has considered the heterogeneous environment’s complexity, but as attributes increase, no procedure is used to control energy utilization [33].
Wang et al. [34] introduced a scheme in which sensor nodes are arranged in a grid-based structure and BS is the root node where aggregated data is transmitted. The child’s heads are gathered until all cell heads are added to the tree while using minimum energy. For energy utilization by cell head, Equations (2) and (3) are used.
C_ij is consumed energy for sending data packets from i-th cell to the j-th cell of the tree. d_ij represents the distance between two cells, C_iB shows the energy utilized for transmitting data packets from i-th cell to the base station. The simulation proved that nodes have a higher lifetime. The shortcoming of the scheme is that when the child nodes are high it creates a longer depth, which increases the energy consumption of the parent node. To overcome the drawbacks of the previous scheme, the present scheme passes through phases of grid construction, construction of trees, and data transmission. The whole network is divided into a grid of MxN area. Every sensor possesses a Global Positioning System (GPS) to learn about its environmental location and calculate coordinates about the grid, in which the sensor lies. Limited child nodes are allowed to avoid uneven energy consumption and hotspot problems. The scheme has better data aggregation and efficiently manages network load but no fault tolerance policy is introduced in case node failure occurs [35].
The whole network area is distributed into grids, and an aggregating node is elected by using fuzzy logic. For it, CH distance, and link quality metrics like neighboring Overlap and Algebraic Connectivity are used, which in output informs the status of selecting an aggregating node. For relocation purposes, the Fruit Fly Optimization Algorithm (FOA) is used, which involves relocation conditions and the path to which the sink is switched. The scheme has a lower packet loss ratio but FOA is not very efficient for large networks [36]. This three-layered scheme comprises of Smart meters (SMs), Fog nodes, and cloud servers. During data transmission, SMs reduce data size and send it to local fog nodes. Then, fog nodes gather this data after checking it for integrity. Then, it is transmitted to the last layer of the cloud. The cloud extracts this data and computes its hash to check whether it is original. If data is not altered it is saved or otherwise removed [37].
After a detailed analysis of the existing schemes, the major identified gaps are outlined as follows. Various schemes primarily focus on energy optimization as it is a crucial parameter for prolonging the network lifetime and reducing overall energy consumption. As a result, the energy consumption did not decrease as much as it should have. Many techniques employ various strategies to efficiently aggregate data, but limited work has been undertaken to address redundant data specifically in the healthcare sector. There is a persistent need for more research to improve the effectiveness of handling redundancy, particularly in the healthcare domain.
In comparison to existing data aggregation techniques, the proposed Energy-Efficient Fuzzy Data Aggregation System (EE-FDAS) showcases distinct strengths, particularly in addressing redundancy and energy consumption challenges within a healthcare environment. By reducing the data packet size through the use of Boolean digits for normal range data, the overall data size is minimized, facilitating efficient transmission with lower energy utilization compared to [35], which exhibits higher energy consumption. Simultaneously, the smaller packet size of data readings contributes to lower latency, contrasting with the higher latency observed in [25]. Additionally, EE-FDAS reduces system complexity relative to Ref. [33], enhancing scalability in large systems. Furthermore, the proposed scheme incurs lower communication and storage costs compared to [17]. In summary, EE-FDAS stands out as a comprehensive solution, effectively addressing key issues in healthcare data aggregation and offering notable advantages over existing techniques On the whole, it represents a promising advancement in data aggregation techniques, offering a comprehensive and efficient solution for healthcare applications.
3. System Model and Problem Statement
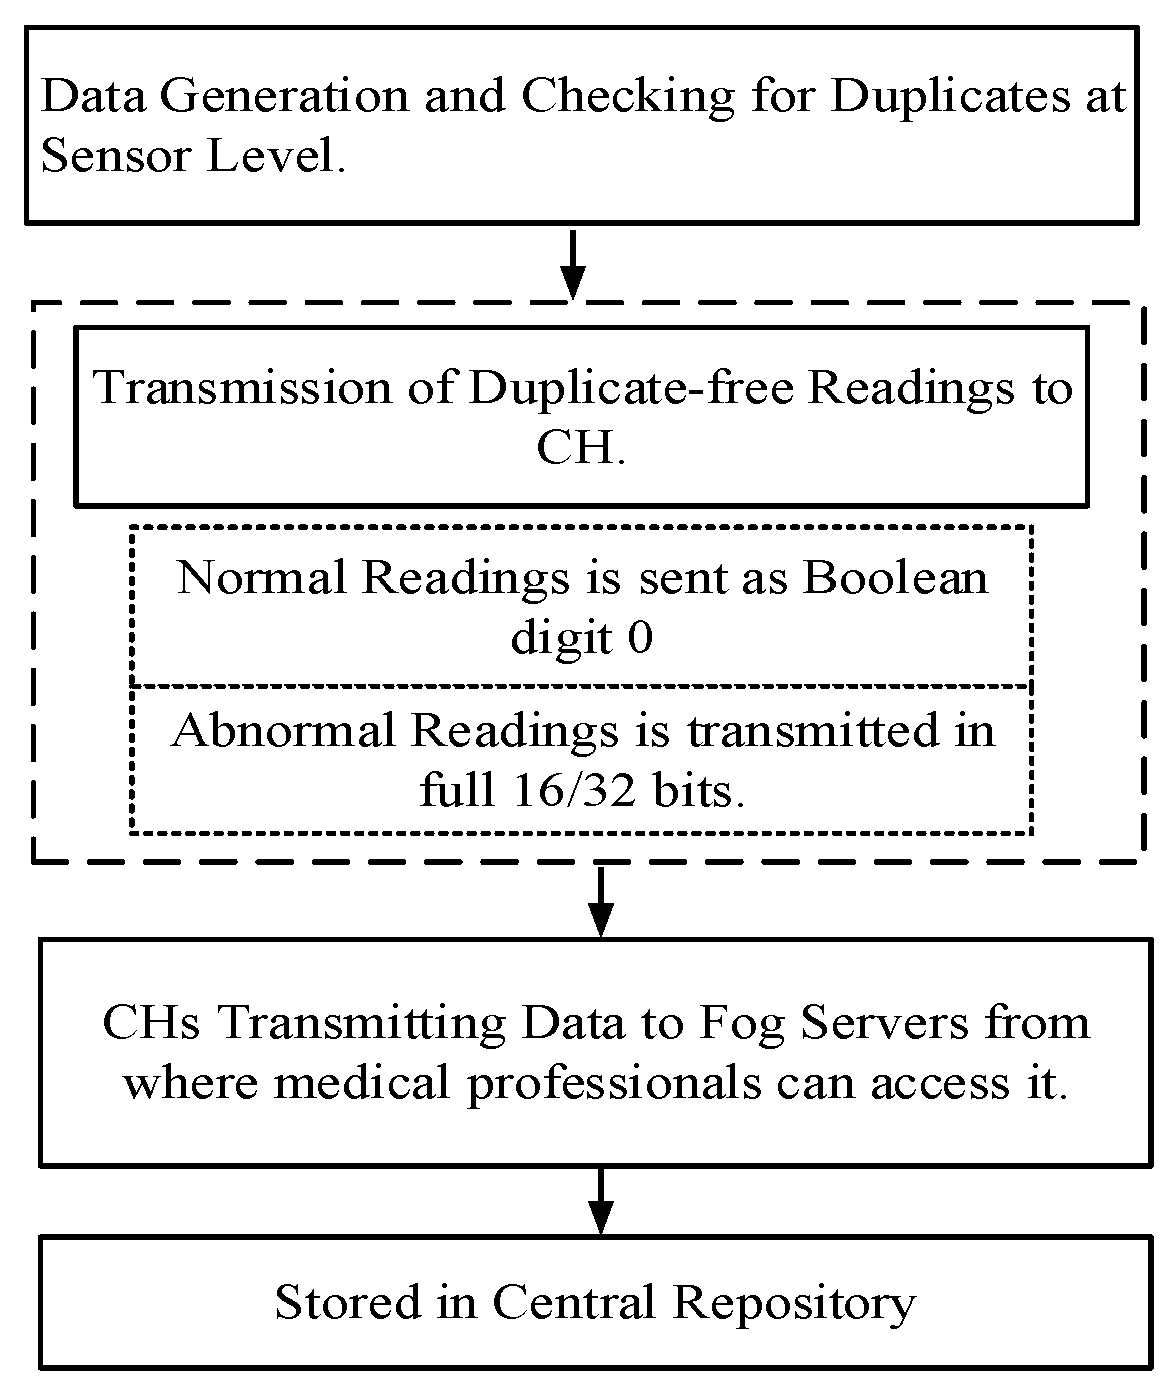
This section discusses the system model of the proposed scheme along with the problem statement. In a heterogeneous environment, sensor nodes are attached to patients’ bodies, generating data readings in various formats. The proposed scheme passes through three main phases, as illustrated in Figure 1, and implements a cluster-based approach for data aggregation. At Level 1, the deployed sensors take relevant readings from the patient’s body and transmit them to the CH. Data will be concatenated at the aggregation node (AN) before being transmitted towards the Fog. Moreover, the data of one AN can also be transmitted through other AN, ensuring an optimum approach for handling healthcare data. In case there is no fluctuation in values, they are transmitted as Boolean digit 0 for overcoming data redundancy. At Level 2, all CHs forward aggregated data to the Fog servers, from which medical professionals can access patient’s medical information and can make suitable decisions according to the condition of patients. The Electronic Health Record (EHR)/ Electronic Medical Record (EMR) are maintained at Medical servers in the hospitals, whereas the Fog Servers receive data from multiple medical servers. There may be one Fog Server in one big city or even in one province as well. This information is also shared with the central cloud server via fog servers at Level 3 and subsequently stored in the repository, so that data can be used soon after if needed.
In the literature, it has been observed that the sensor devices at Level 1 collect readings from a patient’s body, and they simply transmit it to the CH without checking for duplicate values. There is a high possibility that the majority of deployed sensors transmit normal range readings. When values fall in the normal range, it means that the patient is not experiencing any threatening condition. So, there is no need to transmit full 16 or 32-bit duplicate readings frequently. By transmitting this redundant data in full form, energy consumption, and communication cost arises. Therefore, for handling this voluminous data, a high storage capacity is also needed. To resolve these issues, an efficient scheme is required that handles duplicate data at the device level.
4. Proposed Solution
In this section, a new scheme has been presented, entitled Energy Efferent Fuzzy Data Aggregation System (EE-FDAS), to resolve the identified problem. In the healthcare sector, various types of sensors are deployed in the patient’s body that collect readings in different formats. These readings vary from each other as sensors that collect single-part values, such as BPM, produce 16-bit readings. Similarly, some sensors generate readings into two values. For instance, sensor monitoring BP generates data in two parts, including systolic and diastolic readings. Both generate 16-bit data which collectively becomes 32-bit long. It makes the environment extremely heterogeneous which ultimately raises energy utilization. In the proposed scheme, at level 1, when sensors generate data it is checked whether it lies in the normal range or not. If it falls in the normal range, instead of transmitting the whole 16 or 32 bits, only Boolean digit 0 is transmitted which takes only 1 bit. The phases of EE-FDAS are shown in Figure 2.
The patients are mainly equipped with wearable sensors checking different parameters including blood sugar level, heartbeat rate, blood pressure [38] body temperature, respiration rate or pulse oximetry [39], gastrointestinal tract, oxygen saturation, and hemoglobin [40]. The thresholds represent standardized value ranges globally recognized for numerous healthcare parameters.
Moreover, our proposed solution is adaptable to changes in thresholds because the collector node consolidates and processes values based on the specified threshold ranges. These ranges can be easily updated in the collector nodes at any stage if needed. The sensors take readings from patients’ bodies in the form of concatenated strings. For instance, patient A data values for body temperature, heart rate, oxygen level, cholesterol, and sugar level in the format of 98.9:75:98:130:180. The data readings gathered from the body are categorized as normal or critical. For instance, the Beats per Minute (BPM) of a healthy person lies between 60 to 100 beats per minute, and is considered as the normal range, but if the readings are greater or lower than these threshold values, it is considered as critical. Similarly for BP, the normal range is 120/80 mmHg. When the Systolic Pressure or Diastolic Pressure varies from these defined thresholds, it is considered a critical reading.
In a healthy human being, these parameter readings remain stable and fall within the normal range. In such occasions, the senor nodes simply transmit a single Boolean digit 0 to the CH. Conversely, if a person is unwell, irregularities might be visible in one or two sensor readings, while the other data readings usually remain consistent. In such cases, the critical data is transmitted in its original format, while the other sensors deliver only the Boolean digit. In very rare circumstances, all the deployed sensors generate unusual readings. For such cases, all the values are sent in their original format. The detailed algorithm is explored in the base paper [22]. Practically, the likelihood of this case is much lower than the first two cases. To describe it well, a case study of Patient B is presented. Patient B is equipped with a set of wearable sensors to monitor crucial health parameters, including blood pressure (BP), temperature, cholesterol level, oxygen saturation level, heart rate, and sugar level. These sensors provide real-time data, allowing for continuous health monitoring. The fluctuation occurs in heart rate and cholesterol level. The generated concatenated string is generated as 0:0:210:0:45:0.
The EE-FDAS scheme presents a mechanism that justifies its suitability for most of the practical applications in healthcare settings. For example, patients with chronic conditions, such as hypertension or hypotension, are equipped with wearable sensors. It transmits relevant health data based on the patients’ real-time health conditions. It optimizes data transmission by sending concise information during normal health conditions, ensuring remote healthcare providers receive critical data promptly for timely intervention. Similarly, patients with diabetes, particularly people who are at risk of hyperglycemia or hypoglycemia, are equipped with wearable sensors that continuously monitor their blood glucose levels. These patients may experience sudden fluctuation in blood sugar. These crucial data readings are promptly transmitted, acting as a timely intervention to prevent the patient from reaching a critical and potentially life-threatening state. The list of notations for the proposed scheme EE-FDAS is shown in Table 1.
Transmitting only critical data significantly reduces data volume and increases the efficiency of the proposed solution. The Time Division Multiple Access (TDMA) method is used to ensure collision-free data transmission. This approach also assists doctors and medical professionals in accessing only clear-cut and suspicious information for better diagnoses and treatment more efficiently. Additionally, this approach will significantly reduce the load on CH as well as reduce energy consumption. Furthermore, it increases the lifetime of nodes and provides only critical data to doctors.
The primary emphasis of the algorithm lies in processing data generated by sensors. Initially, the data is examined to identify and eliminate duplicate values. Subsequently, the processed readings are transmitted to CHs for additional analysis. In the case of normal health readings, a Boolean representation is employed. Upon receiving this data at CHs, alerts are generated for emergencies, reporting to the relevant staff. The data is forwarded to a Fog server for detailed analysis by medical professionals. Further, this data is stored at the central repository, facilitating potential future needs. The algorithm is running on healthcare sensor nodes. When wearable sensor devices take data readings from the patient’s body, the proposed algorithm checks it for duplicated values before transmitting it further. Sensor nodes in the proposed scheme perform the task of collecting health-related data. These sensors are deployed to monitor various health parameters such as blood sugar levels, heartbeat rate, blood pressure, body temperature, respiration rate, pulse oximetry, gastrointestinal tract conditions, oxygen saturation, and hemoglobin levels. The collected data are in different formats and checked for duplicated data readings.
In steps 4–23, Algorithm 1 selects the healthcare sensor node as the input and delivers a de-duplicated data list as the output. If the number of readings for the current sensor node is 1, it calls the first function, AggregateMessage, with the one reading set as the input. The purpose of the function is to process the reading and concatenate it to the dataString. For all sensor nodes, produced data are saved after time t. In case the number of readings for the current sensor node is 2, it calls the second AggregateMessage function, which proceeds two readings as the input. The function opts for both readings and concatenates them to the dataString. In step 6, the case of emergency conditions is checked, and the system may adopt the lossless behavior without skipping the readings and concatenate in an original string as given in steps 17–19. The same steps are executed when the threshold is approached to share the full readings. The threshold can be set as 10 or above as per the criteria approved for the scenario. It is applied when sensors take readings frequently and transmit them at regular intervals having to detect even minor changes in readings for the patient. In case of exceeding the threshold, the count is reinitialized to zero and the control will be moved to steps 17–19 in the next execution to concatenate the full readings in original format.
In steps 24–30, the function AggregateMessage (IN_ARGS) is described which is used for processing a single sensor reading. If the sensor reading lies in the normal range then only a Boolean digit “0” is transmitted and concatenated to the data string. In steps 31–46, both flags are initialized as True, and the function AggregateMessage (IN_ARGS1, IN_ARGS2) is presented that takes two parameters. This function checks every reading against separate thresholds THL1, THU1, THL2, and THU2. If (IN_ARGS1 and IN_ARGS2) reading lies outside the threshold, then original values are concatenated to the dataString and set flag1 and flag2 as False. Then, flag1 and flag2 are checked, if it is true then it indicates normal data, and Boolean digit 0 is transmitted. After processing all sensor nodes, the algorithm sends the de-duplicated data to Fog Servers.
| Algorithm 1: Transmission of Non-duplicated data to CH |
|
The CH receives aggregated data from sensor nodes which is described by using Algorithm 2. The CH, after receiving concatenated data strings, processes it. When data are received at CH, the status of emergency flag is also checked, and if it is true, it indicates that the patient has a critical condition. Afterwards, it generates an alarm and notifies to response team and this data is transmitted in its original form to the fog server so that medical staff can use this emergency data for future analysis. If the data are normal, it is simply transmitted further for record-keeping.
| Algorithm 2: Receiving and Processing Data at Cluster Heads |
|
When aggregated data is reached at Fog Server, it is checked for integrity by calculating its hash. In case the data is not corrupted, it is saved and further transmitted to the cloud server. Otherwise, it is rejected. The mechanism is also explained in Algorithm 3.
| Algorithm 3: Data Received at Fog Server |
|
5. Result and Analysis
For checking the effectiveness of the proposed scheme EE-FDAS, extensive simulation is performed under NS 2.35. The sensor nodes are placed in the network area of 3000 × 3000 m. The transmission range of these nodes is considered 30 m and it remains the same for all types of attributes. The sensor nodes produce data packets after every 30 s. The total time allotted for simulation is 2500 s. The tool command language (TCL) file contains comprehensive information about configuring and deploying nodes in the network. For implementing the functionality of sending and receiving data packets, separate classes are built by using C language. Afterward, to extract processed data result files, AWK files are considered. In each simulation scenario, the nodes are deployed in a Gaussian distribution model to deploy the patients where the different types of sensor nodes are attached to each patient as per the monitoring of required healthcare parameters. The result of the proposed scheme is compared with some existing robust schemes including FDAS, EHDA, DICA, and DICA_EXTENSION. The list of parameters is presented in Table 2.
The attribute represents the sensor nodes, when there is only one attribute, it shows a homogeneous network where all sensors have the same type. For instance, all sensors take temperature or heart rate readings. When the number of attributes increases, the network starts becoming heterogeneous, demonstrating the existence of more sophisticated sensors. When there are two types of attributes, it indicates that both are taking different readings. For example, the first type of sensor could be monitoring sugar levels, and the other could be a blood pressure monitor. When the number of attributes is four, it shows the existence of four different sensors that are taking values of blood glucose, heart rate monitors, blood pressure, and oxygen saturation. As the number of attributes remains increasing it ultimately boost the complexity, and makes the environment highly heterogeneous. It enhances the ability to monitor and gather patient data thoroughly via numerous sensors. We have considered the emergency scenario to share full readings and the threshold based scenario to send message with complete readings after the adjusted threshold as 10 or above. In this scenario, a little communication cost and energy consumption will be increased to send a full message of larger bit size containing all the original values of all attributes after a certain threshold.
The evaluation parameters that are considered more crucial and suitable for de-duplication and data aggregation are chosen. The key metrics, including energy consumption, average aggregation, needed transmission slots, packet loss ratio, and storage cost, are analyzed to assess the performance of the EE-FDAS scheme. The proposed scheme is simulated under a different number of attributes in a heterogeneous environment to check its efficiency from a simple to a complex environment.
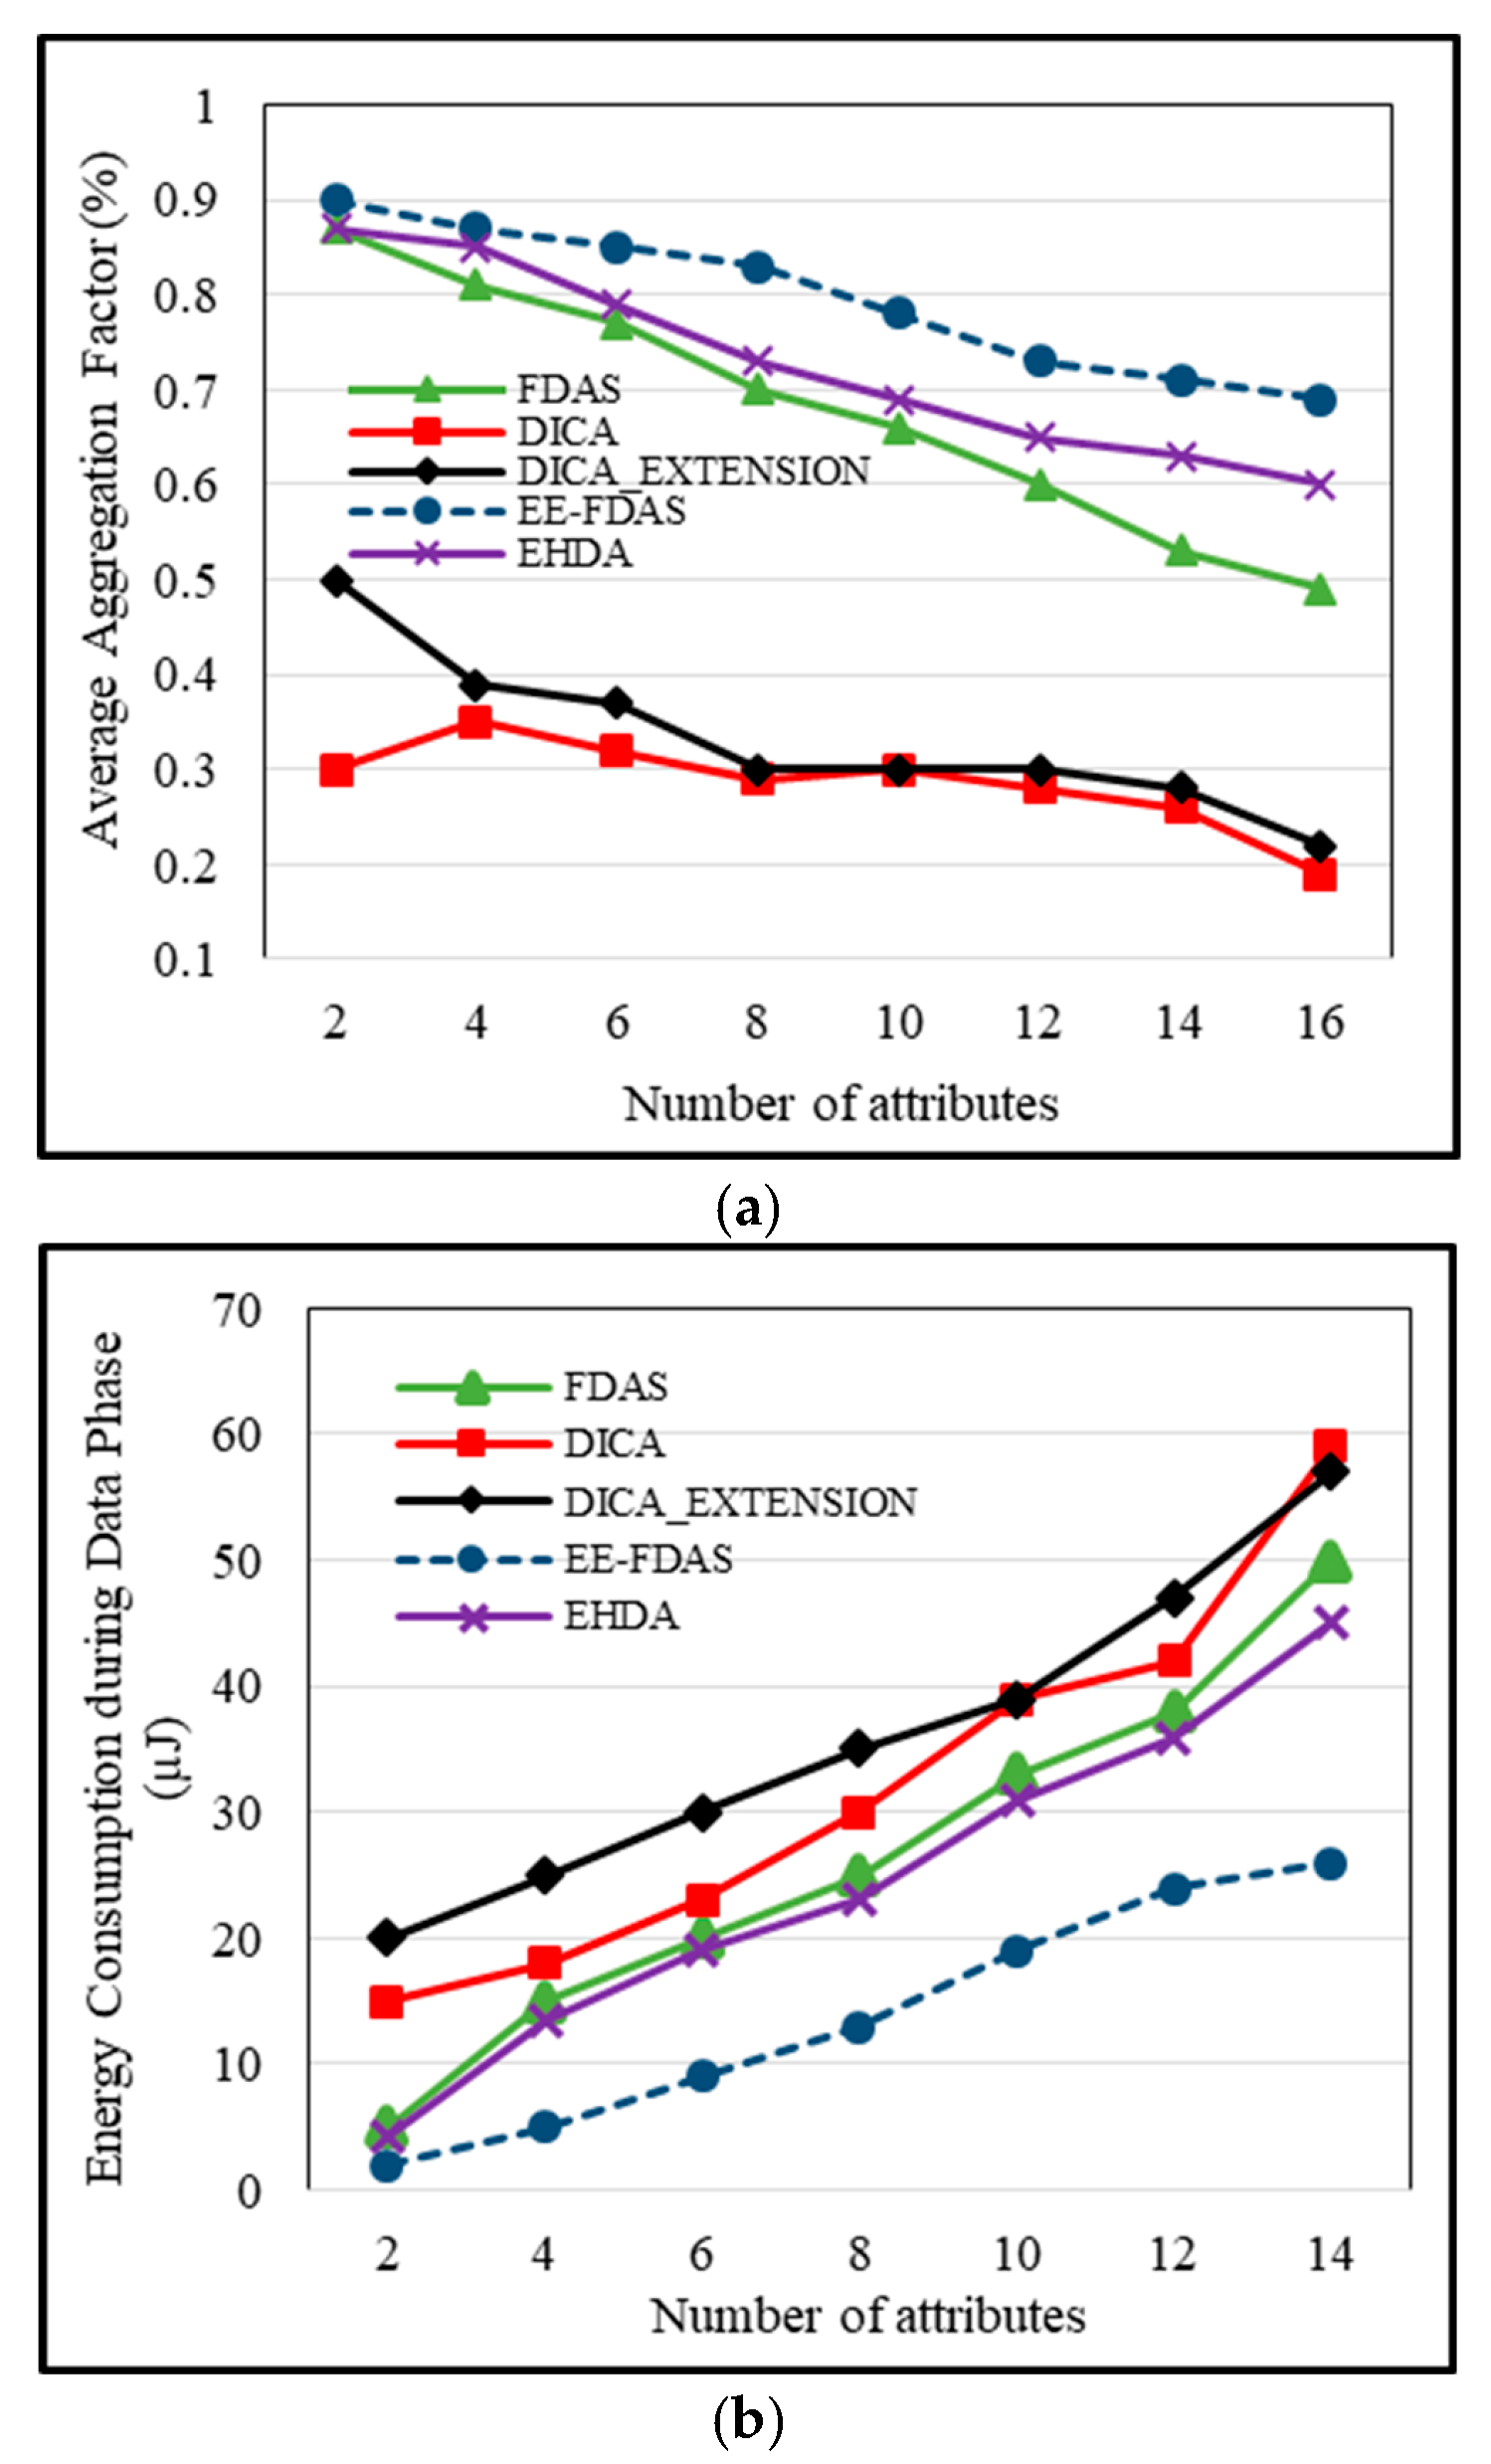
5.1. Impact of Number of Attributes on Average Aggregation
The aggregation denotes the total data packets that are gathered at CHs before transmitting it to the Fog server. For this metric, the simulation is performed 5 times and the average is calculated. In case number of attribute is 1, the performance of most of the techniques is well. But when the attributes start increasing, the complexity increases, and the aggregation factor starts dropping. When attributes increase, the DICA and DICA_EXTENSION efficacy starts decreasing. The reason behind is that it starts generating different data packets that might be 16 or 32 bits and continuously transmitting these data packets to CH, which increases the load on CH and the aggregation factor starts decreasing. While EHDA and FDAS have achieved high aggregation levels because EHDA compresses its data size before transmission FDAS has selected a suitable parent node for each generated data. When the parent node is selected intelligently, it needs to process lower data packets further and it improves the aggregation. The proposed scheme has higher aggregation as it checks for duplicated normal values at the sensor level and replaces it with Boolean digit 0 which reduces load on CH and aggregation reaches up to its higher level.
The scheme maintains the effectiveness of compression by focusing on preserving crucial information while reducing data size. EE-FDAS minimizes the probability of losing important information by reducing redundant data by changing it with Boolean digits. The rationale behind this approach is that when data is compacted into smaller sizes, the likelihood of data loss during transmission decreases, especially in environments with low bandwidth. By replacing redundant information with Boolean digits, EE-FDAS ensures that the compressed data remains informative while reducing the risk of loss, contributing to the scheme’s overall efficacy in optimizing data size without neglecting critical details. The X-axis represents the number of attributes and the Y-axis shows the average aggregation factor. In Figure 3a, when the number of attributes is 4, the aggregation factor remains 0.3, 0.39, 0.81, 0.85 and 0.87 in DICA, DICA_EXTENSION, FDAS, EHDA and EE-FDAS, respectively.
5.2. Energy Consumption at Data Phase
Energy utilization is a critical metric, as sensors have limited energy. Effectively handling this energy is vital for elongating the overall network lifetime. During the process of data transmission, sensor nodes utilize high energy. The energy consumption per bit is 5 nJ. For instance, if 6 nodes are generating single-part data, resulting in 16 × 6 = 96 bits. The energy consumption is calculated as 96 bit × 5 nJ/bit = 480 nJ. Similarly, when sensor nodes generate data with two parts, producing data of 32 bits, consuming 32 × 6 = 192 bits. So, the energy utilization in this situation is 192 bit × 5 nJ/bit = 1152. In resource-constrained environments, the dissipation of this much energy leads to the earlier death of nodes. As the number of attributes increases, energy consumption further escalates.
To address this issue, the proposed EE-FDAS scheme adopts a strategy during the data phase. It involves transmitting a Boolean digit “0” whenever sensors produce regular data readings. This Boolean digit only takes 1 bit. Normally, patients exhibit fluctuations in 1 or 2 sensors. By sending complete values for these sensors while sending “0” digits for normal data, the resultant data size is considerably reduced. So, the scheme’s design ensures that the non-critical information including routine data, is efficiently compressed without substantial loss while optimizing energy consumption. This decrease in data size finally leads to noticeably lower energy depletion, as compared to the DICA and DICA_EXTENSION techniques. The simulation results specify that FDAS and EHDA attain lower energy consumption. FDAS accomplishes this by reducing data size through the transmission of “0” at level 2 for Boolean data, while EHDA sends compressed data to the Fog server. In contrast, DICA and DICA_EXTENSION do not include any procedure to cope with high energy consumption.
Figure 3b illustrates the association between the number of attributes and energy consumption. The proposed scheme EE-FDAS validates the lowest energy consumption at 24, followed by FDAS at 38, EHDA at 36, DICA at 42, and DICA_EXTENSION at 47.
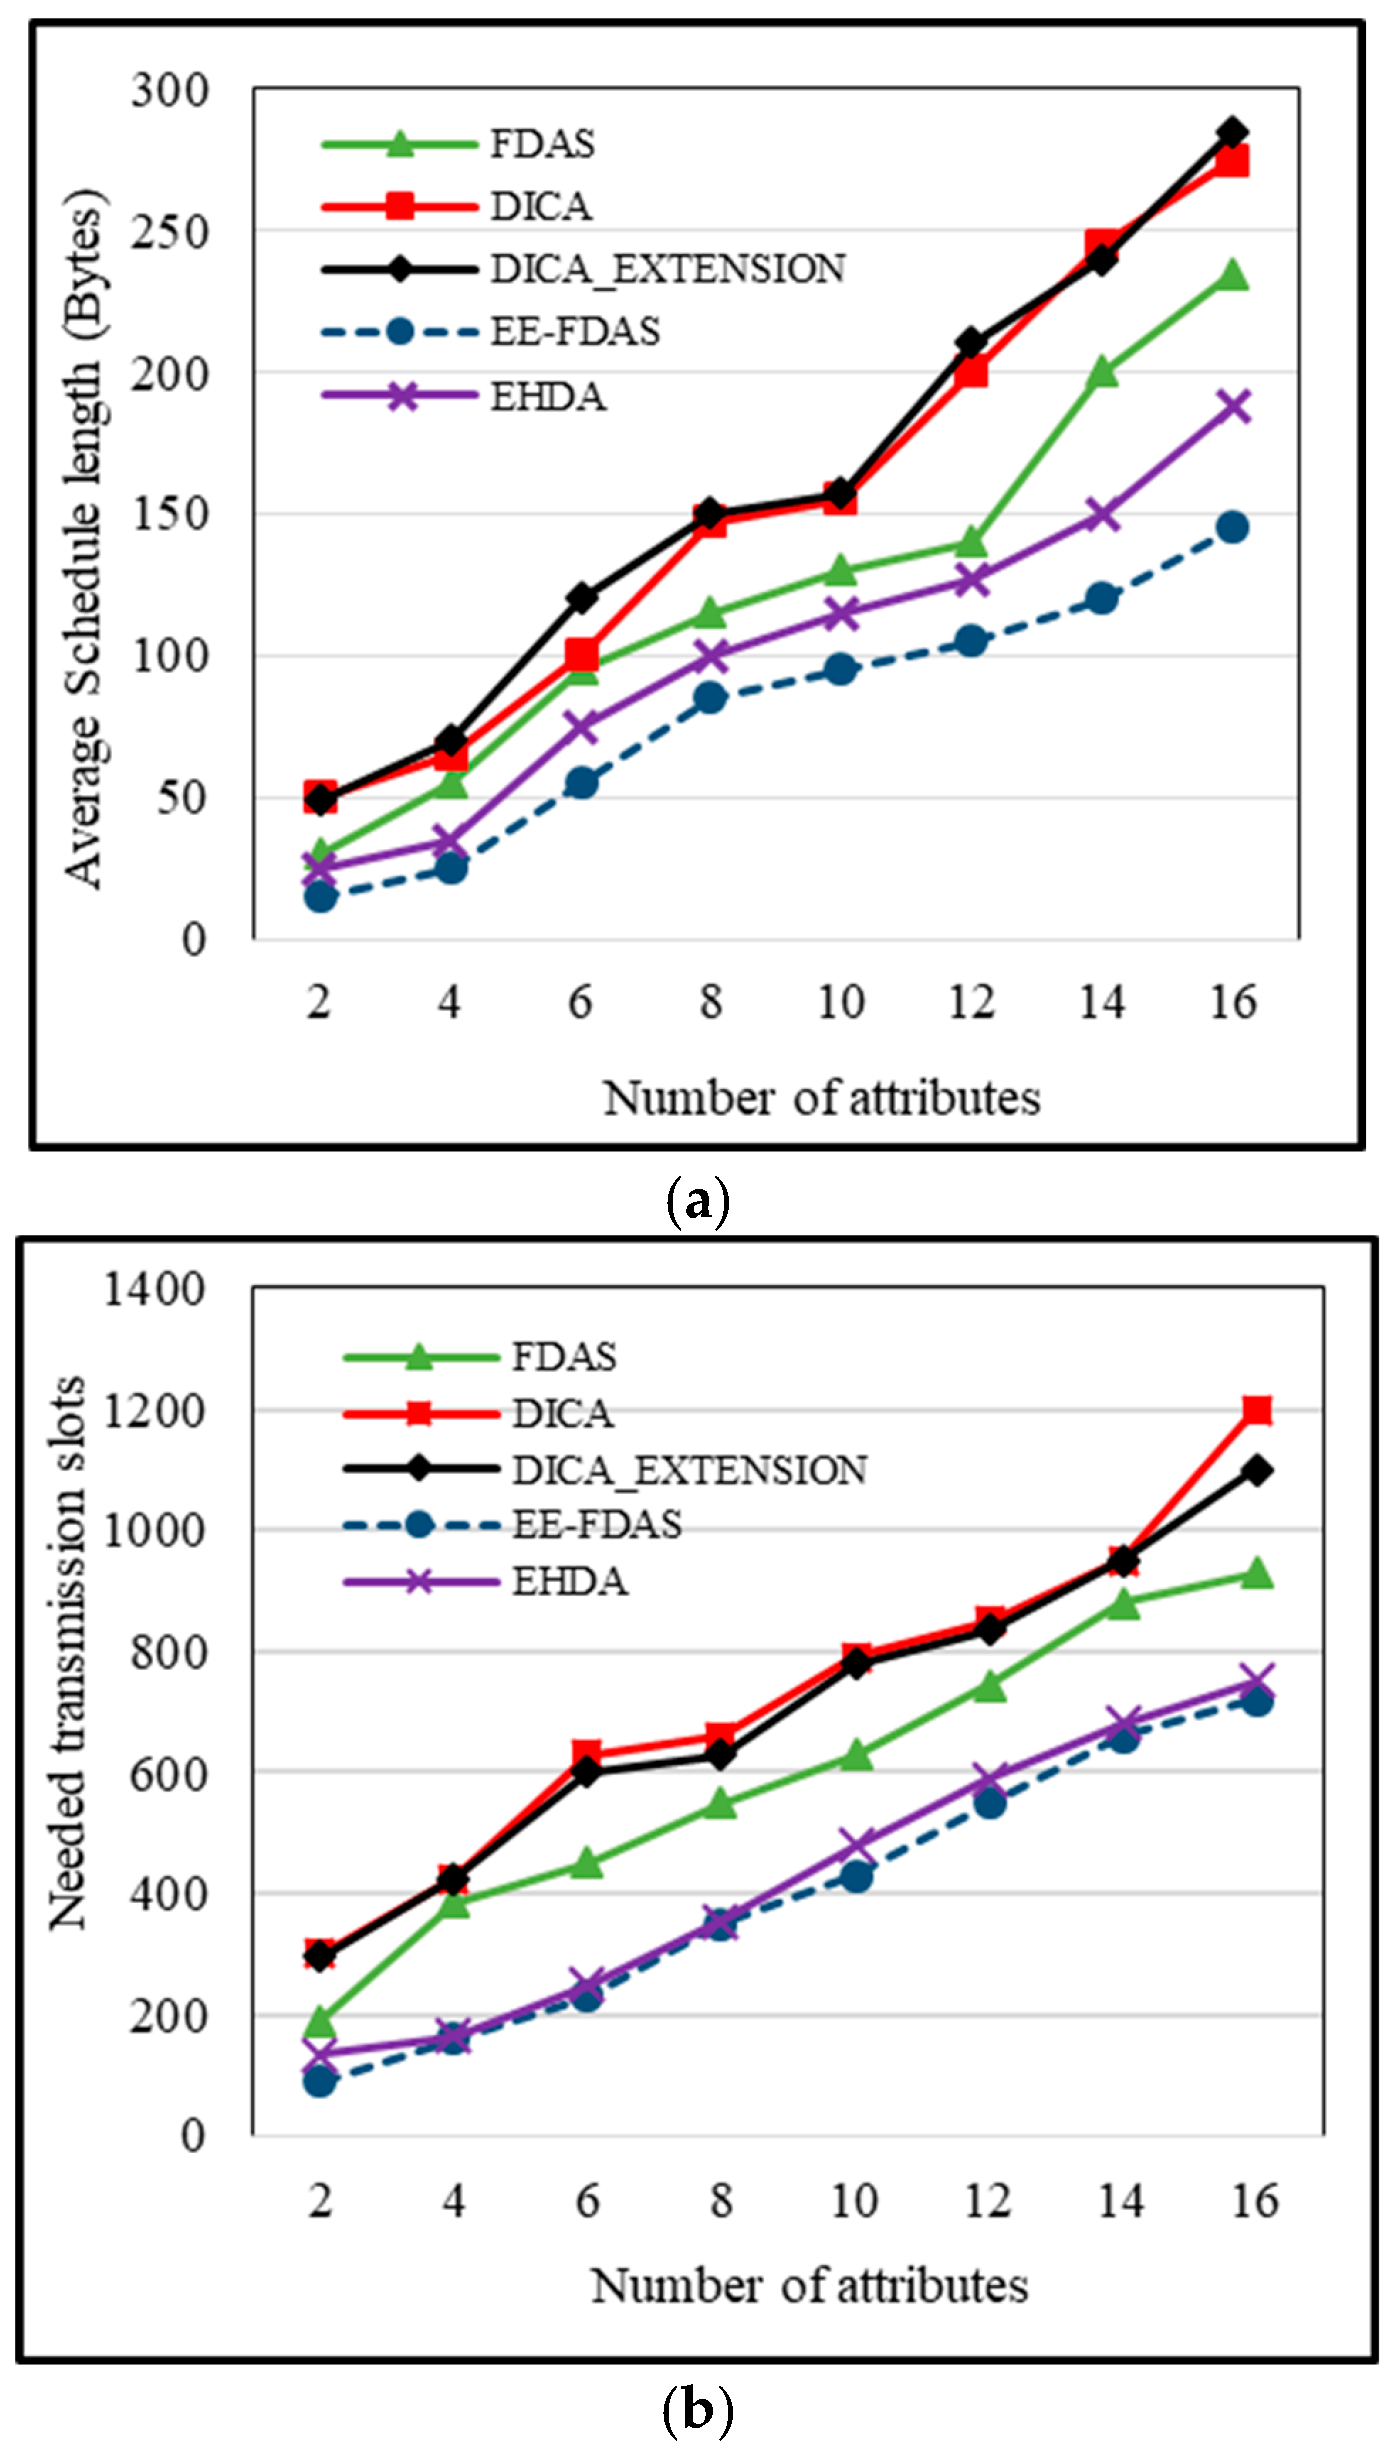
5.3. Impact of the Number of Attributes on Schedule Length
The schedule length (SL) refers to the time needed for sending data from sensor nodes to CHs. When the aggregation factor is high, the SL starts decreasing. This is because proficient data collection results in the minimum time required for sending it to the head node. EE-FDAS achieves a lower SL primarily because of the smaller data size, which effectively increases the level of aggregation and consequently reduces the probability of significant data loss. Both DICA and DICA_EXTENSION demand a longer SL as of lower aggregation, and this requirement remains to increase with the rising complexity of the environment. On the other hand, FDAS and EHDA achieve better SLs because of sustainable aggregation. In Figure 4a, the X-axis shows the number of attributes, whereas the Y-axis signifies the average SL. Due to higher aggregation in EE-FDAS, the SL diminishes to 95 bytes when there are 10 attributes. This SL requirement is 130, 155, 157, and 115 in FDAS, DICA, DICA_EXTENSION, and EHDA, respectively.
5.4. Needed Transmission Slots
In cases of effective aggregation, fewer data packets are generated. The higher aggregation factor requires lower transmission slots to convey the data. EE-FDAS has achieved the lowest transmission slot usage from simple to highly complex environments. The lessened transmission slots reduce the chances of collisions, retransmissions, and interference during data transmission. Therefore, lower data loss takes place as a result of the efficient data transmission procedure by the higher aggregation factor. As demonstrated in Figure 4b, the X-axis represents the number of attributes, while the Y-axis depicts the needed transmission slots for data transmission. In the context of EE-FDAS, only 230 transmission slots are used. The FDAS, DICA, DICA_EXTENSION, and EHDA require 450, 630, 600, and 250 transmission slots, respectively, when the attribute count is 6.
5.5. Impact of the Number of Attributes on Control Overhead
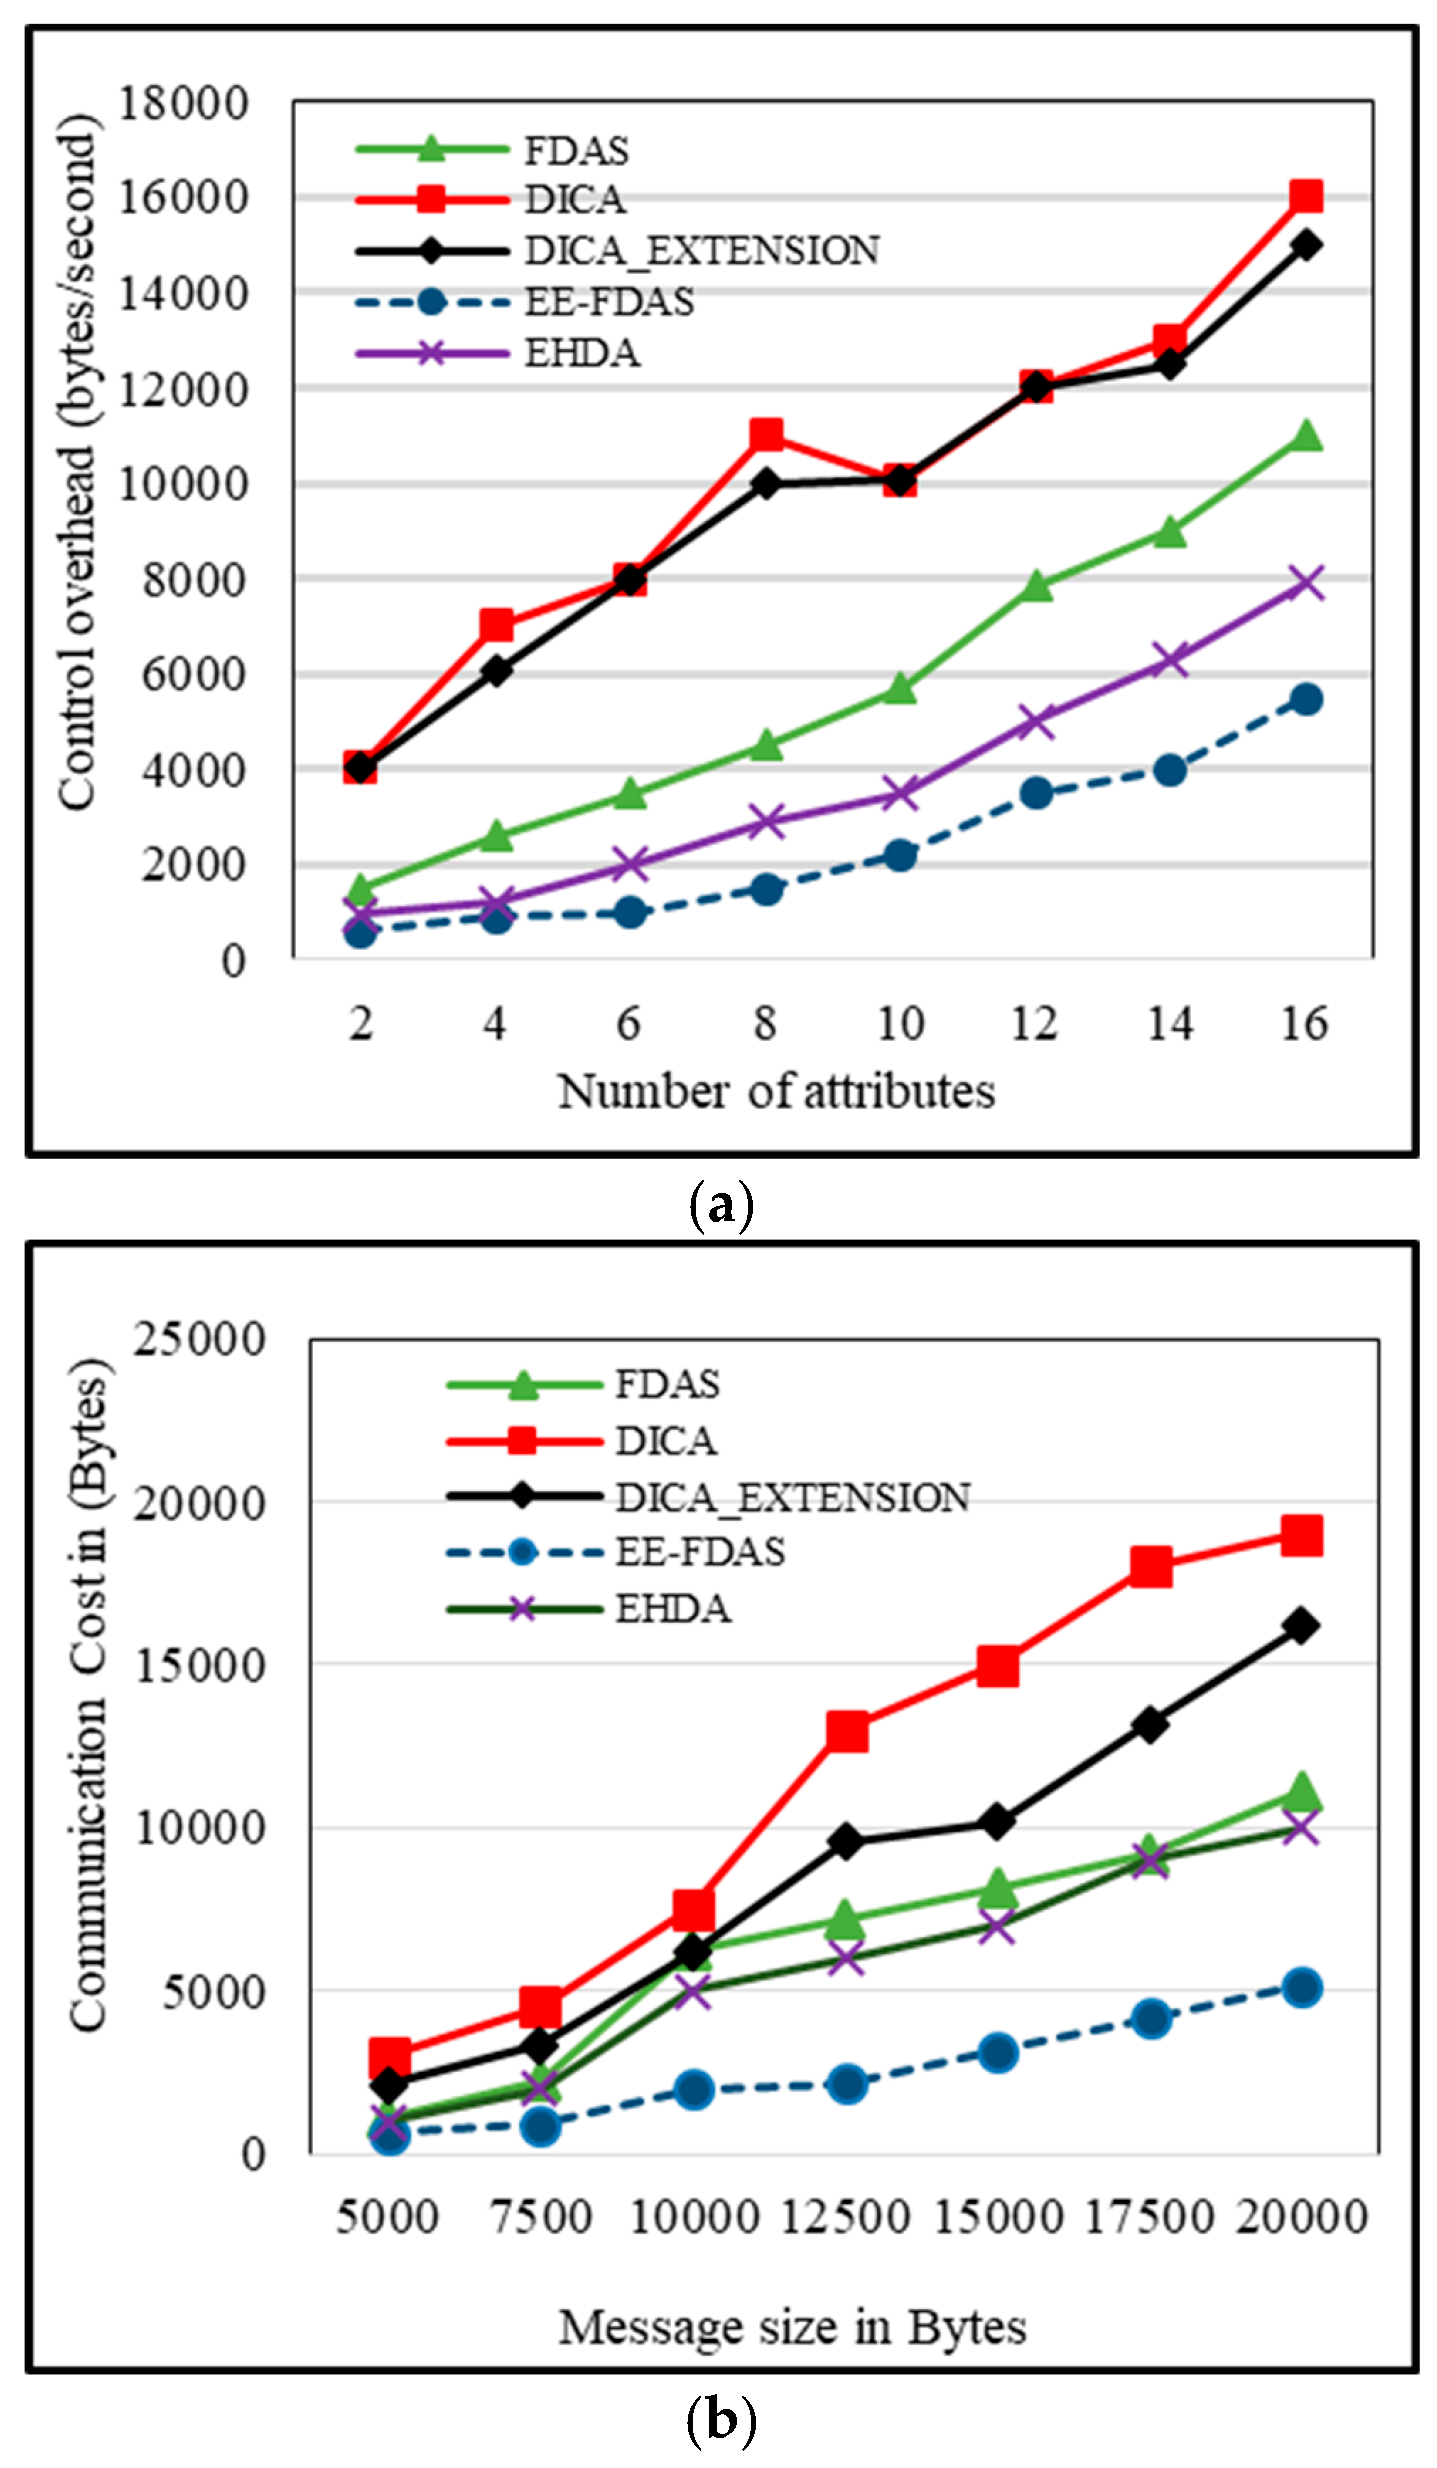
The control overhead involves the exchange of additional messages that are essential for maintaining network performance. These messages are transmitted to facilitate the selection of transmission slots, ensuring a smooth data transmission process. The process of choosing transmission slots involves a sequence of requests, replies, and transmissions. When selecting additional slots, multiple series of these messages are exchanged.
The control overhead is directly related to energy consumption. Higher control overhead leads to high energy utilization. In the proposed scheme, only critical data is transmitted, decreasing the data size and subsequently demanding fewer slots. This reduction helps alleviate the control overhead. The exchange of minimal control messages for slot selection lessens network congestion, thereby reducing the likelihood of data loss. In the FDAS, slot and parent selection happens simultaneously, efficiently reducing control overhead. Furthermore, the EHDA approach compresses data before transmission, further reducing the required number of slots. Yet, schemes like DICA and DICA_EXTENSION do not employ any strategy to mitigate this problem. Simulation results, depicted in Figure 5a, show that EE-FDAS performs well, with an overhead of 600. The EHDA, FDAS, DICA, and DICA_EXTENSION have overhead values of 950, 1500, 4050, and 4030, respectively, in cases where the number of attributes is 2.
5.6. Communication Cost
The data packet size directly affects communication costs. The proposed scheme transfers normal data as Boolean digit 0, considerably decreasing the packet size. The small packet lowers the communication cost and overall reduces the chances of packet loss. In FDAS and EHDA, data packets are also small in size, resulting in lower costs as compared to larger data packets. The results of all schemes are depicted in Figure 5b. When a packet size of 1000 bytes is transmitted, FDAS, EHDA, DICA, and DICA_EXTENSION have costs of 6250 bytes, 5000 bytes, 7500 bytes, and 6100 bytes, respectively. However, among all the schemes, EE-FDAS has the lowest cost of 1990 bytes.
5.7. Packet Delivery Ratio
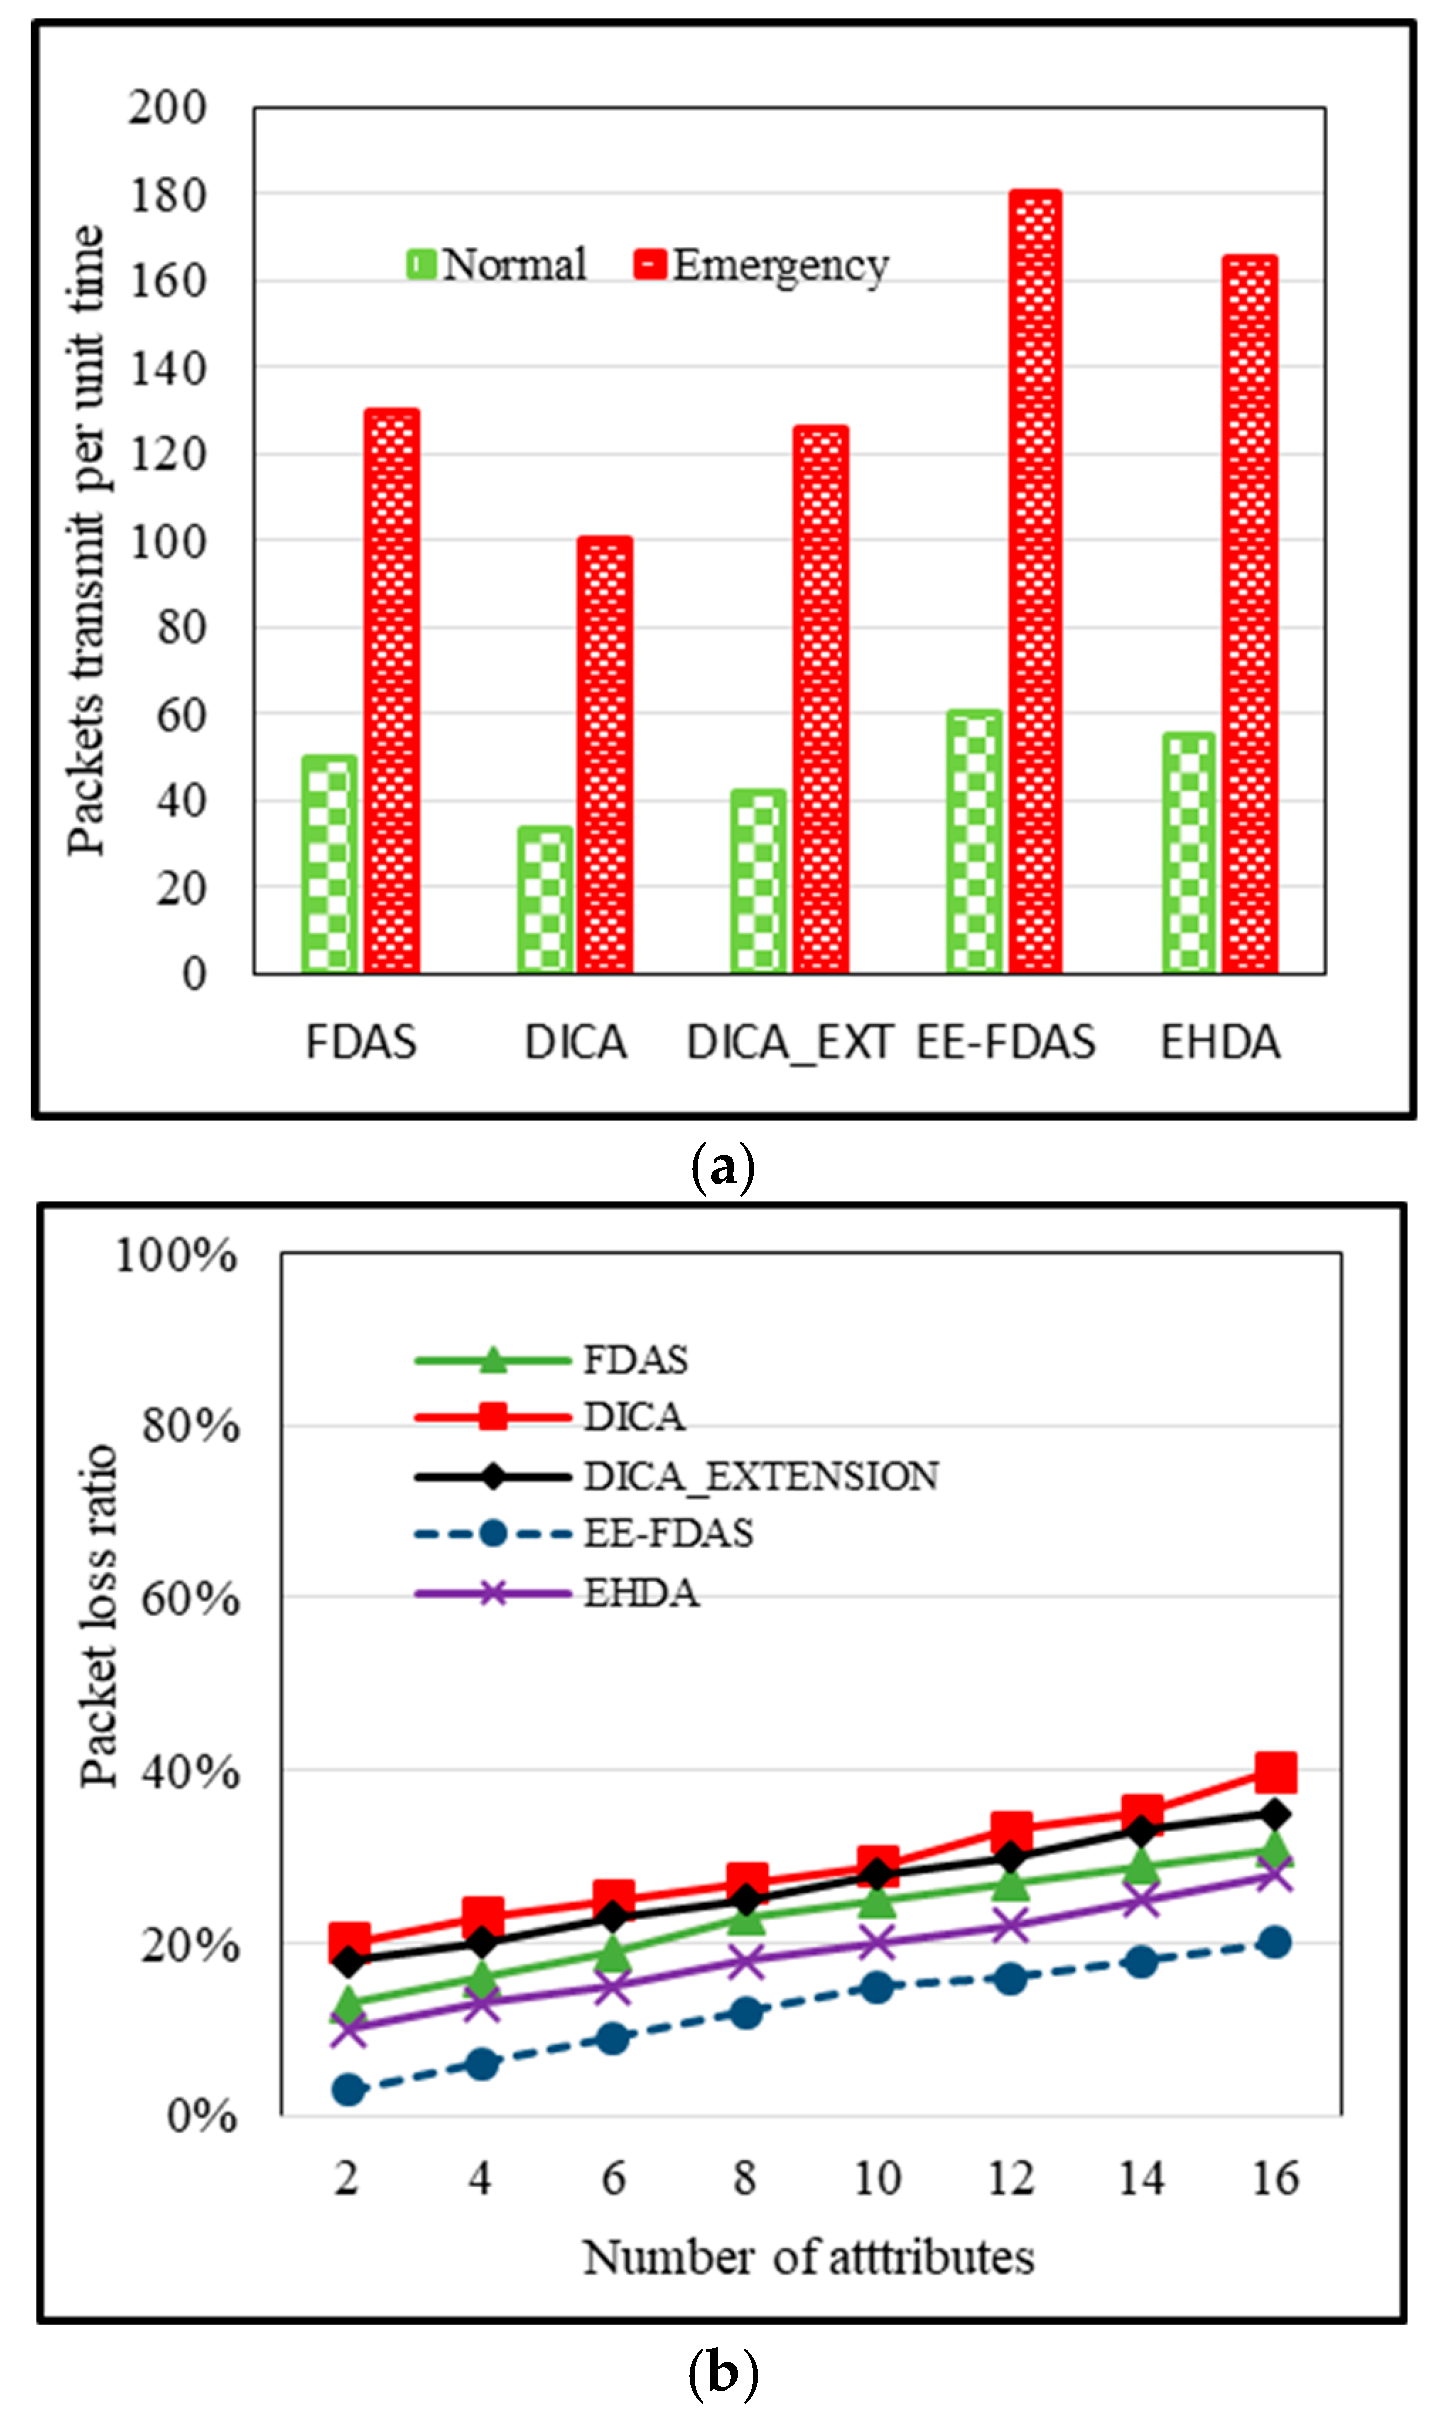
The packet delivery ratio is a metric that measures the successful data packets transmitted. In a normal scenario, with a rate of 60 packets, if the unit of time is one hour, it translates to one packet per minute. However, in an emergency scenario, this rate is likely to increase, such as 3 packets per minute. If the packet-sending rate is high, the Packet Delivery Ratio (PDR) tends to increase. In emergency scenarios, this rate is likely to be even higher, and with larger attribute sizes, the PDR is also expected to be higher. In case of the threshold sending full readings, a threshold also only raises the packet size when full readings are shared. The average packet size and its delivery will be in between the normal and emergency scenario. The high PDR in EHDA is because of effective data compression and encryption that allows the efficient and reliable transmission of sensitive healthcare data. The use of fuzzy logic for parent selection, considering factors like residual energy, load on the node, and relative node connectivity, allows a more effective mechanism for data transmission. This approach improves energy efficiency by selecting a suitable parent node that also increases PDR. The proposed scheme EE-FDAS has attained better PDR because of the utilization of Boolean digits for normal data that is small in size. It ultimately increases PDR. The DICA has a bit-lower PDR because of inappropriate parent selection for data transmission without knowing the type of data packet. Figure 6a illustrates that the FDAS has attained a delivery ratio of 50 for normal and 130 for emergency cases. Similarly, DICA has achieved 33 for normal and 100 for emergency cases. The DICA_EXT, EE-FDAS, and EHDA achieved ratios of 42, 60, and 55 for normal cases while for emergencies they attained ratios of 126, 180, and 163, respectively. The resulting values for the threshold based scenario.
5.8. Packet Loss ratio
The packet drop ratio discusses the proportion of data packets lost or dropped during transmission. It is an inverse proportion to PDR. Different factors can trigger the dropping of a packet, together with the large size of the data packet. If the packet is small, the chance of dropping is reduced. Furthermore, data packets with large sizes are more prone to being dropped. As in case some data bits are corrupted, leading to the entire message being dropped. If the bandwidth is low, the network can become congested due to large-sized data packets, which in turn starts a higher packet loss. The EE-FDAS has more compressed data, when the size is reduced it lowers the chances of being dropped. As shown in Figure 6b, the proposed scheme retains a lower drop ratio because of smaller data packets. It eases successful data transmission, letting packets be transmitted even when the bandwidth is low. Additionally, only critical data is transmitted in its full form while normal data is sent in Boolean digits. This plays an important role in reducing the drop ratio. In case of the threshold based scenario, the packet size grows only for the a few packets sent after a certain count. In a similar context, EHDA and FDAS also hold low drop rates, while DICA and DICA_EXTENSION experience a higher dropping ratio due to the large-sized packets required to pass through several hops before reaching the parent node. The packet drop ratio remains 73%, 87%, 80%, 53% and 43% in FDAS, DICA, DICA_EXTENSION, EHDA, and EE-FDAS when the attribute count is 12.
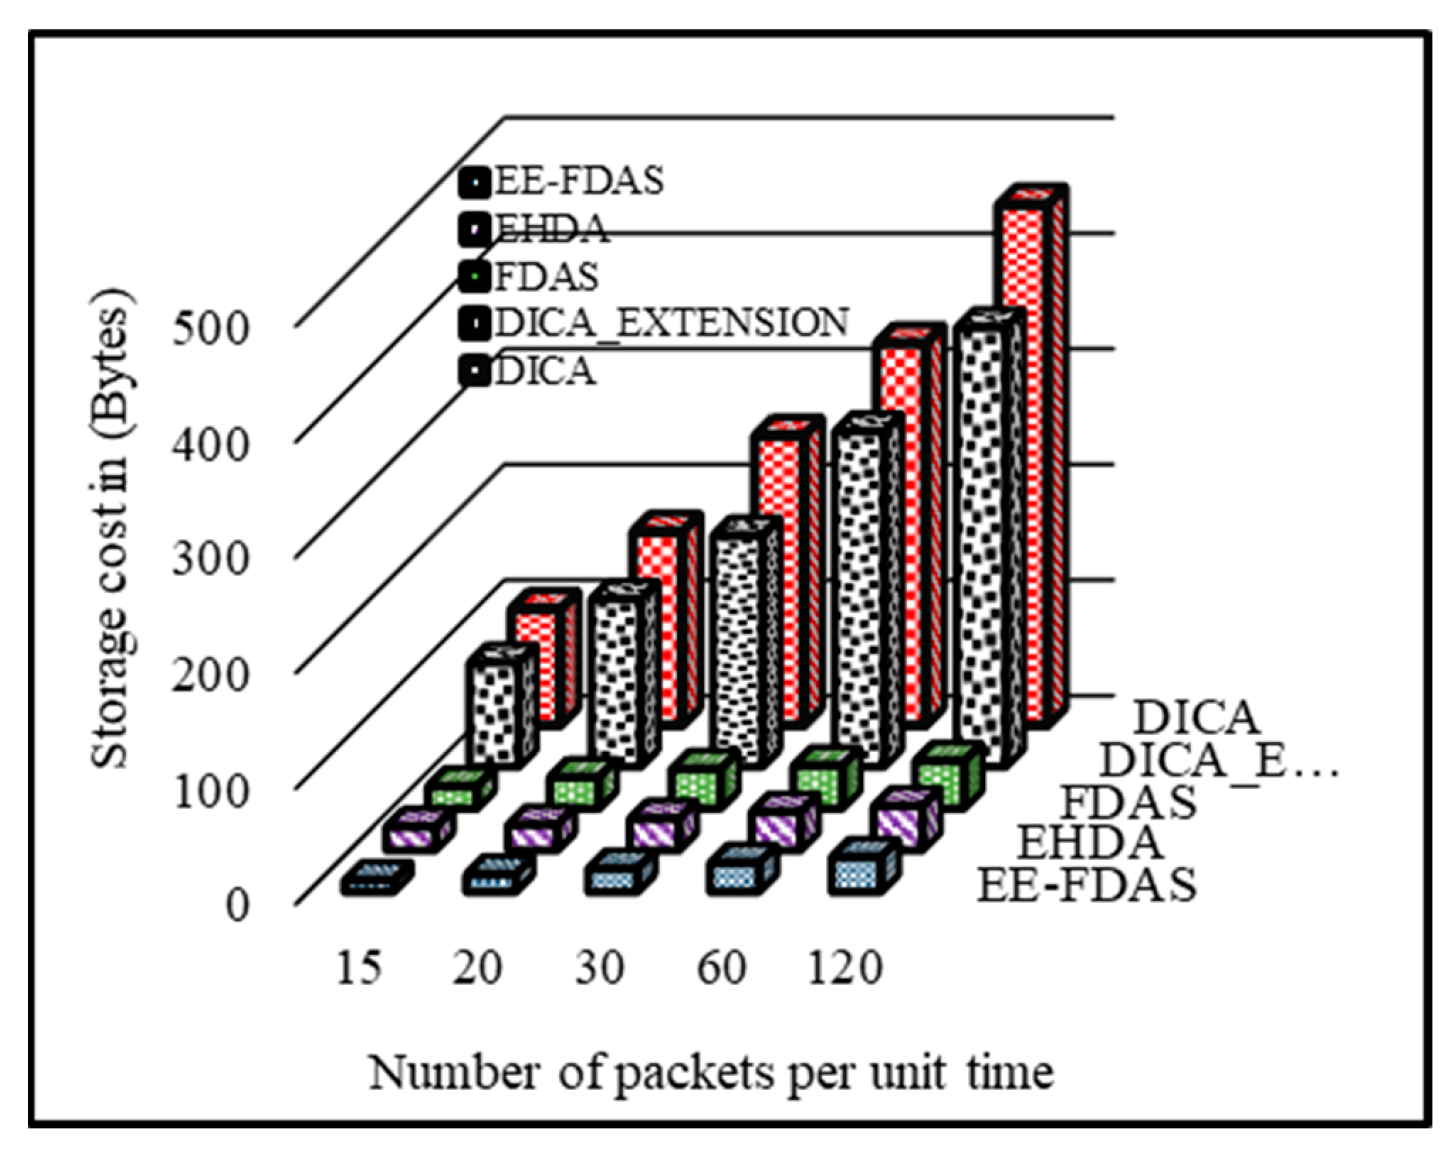
5.9. Storage Cost
As the generated packets are low in size, they take less storage and ultimately reduce storage costs. The lower storage cost in the scheme is because EE-FDAS has generated more compacted data packets. For instance, if 15 packets are transmitted in 60 min, its rate will be 1 packet per 4 min. If the data is transmitted as 1 packet per 3 min, 20 packets are transmitted in 60 min. Similarly, if the rate is 1 packet per 2 min, then 30 packets are sent in 60 min. Similarly, for 1 packet per minute, the transmission rate is 60 packets per 60 min. In case of emergency when the packet is transmitted after every 30 s, it shows 120 packets per hour. For calculating the data size as per the number of parameters sent, it is checked that how many values are 16-bit and how many are 32-bit, Packet Size = sum + header size then their sum and data packets header size provides packet size. The X-axis shows the number of packets per unit of time while the y-axis represents the storage cost in bytes. In Figure 7, the storage cost is presented when number of packets per unit time is 20, the FDAS, DICA, DICA_EXTENSION, and EHDA takes 27 bytes, 167 bytes, 145 bytes, and 22 bytes. Apart from this, the proposed scheme EE-FDAS has the lowest communicating cost of 15 bytes because 50% to 60% of values are in the normal range so they are replaced with the Boolean digit zero which significantly shrinks the data packet size.
6. Discussion
As a comprehensive analysis, the proposed scheme EE-FDAS is compared with the existing robust schemes FDAS, EHDA, DICA, and DICA_EXTENSION. The proposed scheme significantly reduces duplicated data transmission, data volume, and minimizes the load on CH, resulting in high data aggregation in EE-FDAS, FDAS, and EHDA. This efficiency of transmitting only critical data significantly reduces data volume thereby enhancing the overall system’s performance. In contrast, the data packet size increases for only the certain packets sent with full readings after a threshold. It has little affect in increasing the transmission cost per bit and hence, the energy consumption as well. In EHDA, ANs compresses data that reduces packet size and increases aggregation level, and FDAS selects suitable parents of the same attributes which enhances the aggregation and lessens energy consumption.
On the contrary, DICA and DICA_EXTENSION have not implemented any such mechanism so data aggregation in both of them is quite low. Higher aggregation leads to lower SL and fewer transmission slots therefore EE-FDAS, FDAS, and EHDA have maintained lower values for these metrics as compared to DICA and DICA_EXTENSION. The SL analysis highlights EE-FDAS’s ability to achieve a lower SL due to its importance on higher data aggregation.
The data transmission time reduction improves overall effectiveness of the system. Considering the required transmission slots, EE-FDAS needed lower slots as a result of its efficient data aggregation strategy. This reduction not only minimizes the chances of collisions and retransmissions but also contributes to a more reliable and effective scheme in healthcare paradigm. Fewer transmission slots lead to lower control overhead because fewer messages are exchanged for slot selection as compared to base schemes. The lower control overhead contributes to decreased network congestion and, consequently, reduced likelihood of data loss. When data packet size is low, it retains a minimum packet loss ratio because in lower bandwidth data packets pass easily due to reduced size.
The impact of the number of attributes on energy consumption further highlights the effectiveness of EE-FDAS. As the system complexity grows, EE-FDAS constantly exhibits lower energy consumption compared to its counterparts. By transmitting Boolean digit 0 for normal data readings, the scheme diminishes energy depletion, contributing to prolonged node lifetimes and persistent network efficiency. Communication costs and storage costs in EE-FDAS have economic advantages. The scheme’s approach of showing normal data with Boolean digit 0 leads to smaller packet sizes, lessening both communication and storage costs. This economic efficiency is vital for the practical implementation of healthcare sensor networks, especially in scenarios where resources are limited. To further handle the scenarios where the full readings are required to analyze the differences of the out range values, the proposed scenario manages a threshold to send a packet with all readings. It helps to practically analyze and predict the health status based on the sensing values. In context of sampling theorem, certain values of the input variables cause impact on the resulting metrics. The number of attributes are varied from 2 to 16 as input and the results are shown for metrics including aggregation factor, energy consumption, schedule length, transmission slots, control overhead and PDR. It has been observed that the reducing the size of attributes achieves better results. The size of attributes is reduced by replacing in-range values with Boolean values for a certain threshold. By increasing the threshold value, the resultant average size of packet reduces which results in better performance. Overall, EE-FDAS has performed well for all metrics, and EHDA and FDAS have maintained good performance in most of the parameters. The performance of DICA and DICA_EXTENSION starts dropping as the complexity of the environment increases, so it is not suitable to implement in a heterogeneous environment.
7. Conclusions
In this article, the proposed scheme provides a robust solution for improving data transmission within the heterogeneous healthcare environment. The sensors generate patient data readings in different formats. When data readings lie in the normal range, the proposed scheme transmits the Boolean digit 0 for them at the very initial level. Only irregular data readings are transmitted in full form. The key findings are that the proposed solution reduces data size and improves the performance by eliminating duplicate data and reducing the load on CHs. It further increases the aggregation factor and reduces energy consumption during data transmission. Apart from this, communication and storage costs are also reduced. The stored data on Fog servers and the cloud is demanded to be very precise to help medical professionals focus on only critical readings. EE-FDAS streamlines data transmission processes to improve patient care, particularly for individuals in rural or underserved areas. The proposed scheme is simulated by using NS 2.35 and EE-FDAS has outperformed as compared to existing schemes. Results show that aggregation factor is 0.81, 0.85 and 0.87 in FDAS, EHDA and EE-FDAS. The packet drop ratio remains in FDAS, DICA, DICA_EXTENSION, EHDA and EE-FDAS is 73%, 87%, 80%, 53% and 43%. In the context of transmission slots, FDAS, DICA, DICA_EXTENSION, and EHDA require 450, 630, 600, and 250, whereas EE-FDAS dominates by taking only 230 transmission slots. In future, energy-efficient compression techniques will be implemented for critical readings without compromising on data quality.
Author Contributions
Conceptualization, M.N.U.K. and Z.T.; data curation, M.N.U.K. and Z.T.; funding acquisition, Z.T. and W.C.; investigation, Z.T., W.C. and W.P.; methodology, Z.T, A.U. and M.N.U.K.; project administration, M.N.U.K., A.U. and W.P.; software, M.N.U.K., A.U. and W.P.; supervision, Z.T. and W.C.; validation, M.N.U.K. and Z.T.; visualization, M.N.U.K. and A.U.; writing—original draft, M.N.U.K.; writing—review and editing, M.N.U.K., Z.T. and A.U. All authors have read and agreed to the published version of the manuscript.
Funding
This study was supported by the Natural Science Foundation of Guangxi Province under grant 2021GXNSFAA220010.
Data Availability Statement
The data presented in this study are available in this article.
Acknowledgments
The authors would like to acknowledge Guilin University of Electronic Technology for their valuable support.
Conflicts of Interest
The authors declare no conflicts of interest.
Abbreviation
A list of acronyms and abbreviations are presented below:
| IoT | Internet of Things |
| CDA | Centralized data aggregation |
| IDA | In-network data aggregation |
| CH | Cluster Head |
| EP | Extrema Point |
| BS | Base Station |
| GPS | Global Positioning System |
| PDR | Packet Delivery Ratio |
| BP | Blood Pressure |
| BPM | Beats per Minute |
| FOA | Fruit Fly Optimization Algorithm |
| EHR | Electronic Health Record |
| EMR | Electronic Medical Record |
| SMs | Smart meters |
| NS | Network Simulator |
| WSNs | Wireless Sensor Networks |
| ANs | Aggregator nodes |
| TDMA | Time Division Multiple Access |
| SL | Schedule Length |
| CMs | Cluster Members |
References
- Tu, Y.; Chen, H.; Yan, L.; Zhou, X. Task Offloading Based on LSTM Prediction and Deep Reinforcement Learning for Efficient Edge Computing in IoT. Future Internet 2022, 14, 30. [Google Scholar] [CrossRef]
- Stoyanova, M.; Nikoloudakis, Y.; Panagiotakis, S.; Pallis, E.; Markakis, E.K. A Survey on the Internet of Things (IoT) Forensics: Challenges, Approaches, and Open Issues. IEEE Commun. Surv. Tutor. 2020, 22, 1191–1221. [Google Scholar] [CrossRef]
- Bin Zikria, Y.; Afzal, M.K.; Kim, S.W.; Marin, A.; Guizani, M. Deep learning for intelligent IoT: Opportunities, challenges and solutions. Comput. Commun. 2020, 164, 50–53. [Google Scholar] [CrossRef]
- Aouedi, O.; Sacco, A.; Piamrat, K.; Marchetto, G. Handling Privacy-Sensitive Medical Data with Federated Learning: Challenges and Future Directions. IEEE J. Biomed. Health Inform. 2023, 27, 790–803. [Google Scholar] [CrossRef] [PubMed]
- Arora, S. IoMT (Internet of Medical Things): Reducing Cost While Improving Patient Care. IEEE Pulse 2020, 11, 24–27. [Google Scholar] [CrossRef]
- Saeedi, I.D.I.; Al-Qurabat, A.K.M. A Systematic Review of Data Aggregation Techniques in Wireless Sensor Networks. J. Phys. Conf. Ser. 2021, 1818, 012194. [Google Scholar] [CrossRef]
- Zeb, A.; Islam, A.K.M.M.; Zareei, M.; Al Mamoon, I.; Mansoor, N.; Baharun, S.; Katayama, Y.; Komaki, S. Clustering Analysis in Wireless Sensor Networks: The Ambit of Performance Metrics and Schemes Taxonomy. Int. J. Distrib. Sens. Netw. 2016, 12, 4979142. [Google Scholar] [CrossRef]
- Rani, A.; Kumar, S. A survey of security in wireless sensor networks. In Proceedings of the 2017 3rd International Conference on Computational Intelligence & Communication Technology (CICT), Ghaziabad, India, 9–10 February 2017; pp. 1–5. [Google Scholar] [CrossRef]
- Zhang, J.; Yin, H.; Wang, J.; Luan, S.; Liu, C. Severe Major Depression Disorders Detection Using AdaBoost-Collaborative Representation Classification Method. In Proceedings of the 2018 International Conference on Sensing, Diagnostics, Prognostics, and Control (SDPC), Xi’an, China, 15–17 August 2018; pp. 584–588. [Google Scholar]
- Baligodugula, V.V.; Amsaad, F.; Tadepalli, V.V.; Radhika, V.; Sanjana, Y.; Shiva, S.; Meduri, S.; Maabreh, M.; Alsaadi, N.; Tashtoush, Y.; et al. A Comparative Study of Secure and Efficient Data Duplication Mechanisms for Cloud-Based IoT Applications. In Proceedings of the 2023 International Conference on Advances in Computing Research (ACR’23), Orlando, FL, USA, 8–10 May 2023; pp. 569–586. [Google Scholar]
- Pragash, K.; Jayabharathy, J. A survey on DE–Duplication schemes in cloud servers for secured data analysis in various applications. Measurement. Sensors 2022, 24, 100463. [Google Scholar] [CrossRef]
- Aher, C.N. Trust Calculation for Improving Reliability of Routing and Data Aggregation in WSN. Int. J. Electron. Eng. 2019, 11, 386–392. [Google Scholar]
- Yousefpoor, M.S.; Yousefpoor, E.; Barati, H.; Barati, A.; Movaghar, A.; Hosseinzadeh, M. Secure data aggregation methods and countermeasures against various attacks in wireless sensor networks: A comprehensive review. J. Netw. Comput. Appl. 2021, 190, 103118. [Google Scholar] [CrossRef]
- Kadiravan, G.; Sujatha, P.; Asvany, T.; Punithavathi, R.; Elhoseny, M.; Pustokhina, I.V.; Pustokhin, D.A.; Shankar, K. Metaheuristic Clustering Protocol for Healthcare Data Collection in Mobile Wireless Multimedia Sensor Networks. Comput. Mater. Contin. 2021, 66, 3215–3231. [Google Scholar] [CrossRef]
- Onesimu, J.A.; Karthikeyan, J.; Sei, Y. An efficient clustering-based anonymization scheme for privacy-preserving data collection in IoT based healthcare services. Peer-to-Peer Netw. Appl. 2021, 14, 1629–1649. [Google Scholar] [CrossRef]
- Ahmed, A.; Abdullah, S.; Bukhsh, M.; Ahmad, I.; Mushtaq, Z. An Energy-Efficient Data Aggregation Mechanism for IoT Secured by Blockchain. IEEE Access 2022, 10, 11404–11419. [Google Scholar] [CrossRef]
- Ullah, A.; Said, G.; Sher, M.; Ning, H. Fog-assisted secure healthcare data aggregation scheme in IoT-enabled WSN. Peer-to-Peer Netw. Appl. 2020, 13, 163–174. [Google Scholar] [CrossRef]
- Ny, S.R.; Ananth, A.G.; Reddy, L.S. Optimal Cluster-Based Data Aggregation in WSN for Healthcare Application. Adv. Dyn. Syst. Appl. 2021, 16, 683–701. [Google Scholar]
- Ranjani, N.Y.S.; Ananth, A.; Reddy, L.S. A Firebug Optimal Cluster based Data Aggregation for Healthcare Application. IOP Conf. Ser. Earth Environ. Sci. 2022, 1057, 012006. [Google Scholar] [CrossRef]
- Basha, A.R. Energy efficient aggregation technique-based realisable secure aware routing protocol for wireless sensor network. IET Wirel. Sens. Syst. 2020, 10, 166–174. [Google Scholar] [CrossRef]
- Abid, B.; Nguyen, T.T.; Seba, H. New data aggregation approach for time-constrained wireless sensor networks. J. Supercomput. 2015, 71, 1678–1693. [Google Scholar] [CrossRef]
- Khan, M.N.U.; Tang, Z.; Cao, W.; Abid, Y.A.; Pan, W.; Ullah, A. Fuzzy based Efficient Healthcare Data Collection and Analysis Mechanism using Edge Nodes in IoMT. Sensors 2023, 23, 7799. [Google Scholar] [CrossRef]
- Randhawa, S. Sukhchandan Jain, Data Aggregation in Wireless Sensor Networks; Springer: Singapore, 2020. [Google Scholar] [CrossRef]
- Yang, G.; Jan, M.A.; Menon, V.G.; Shynu, P.G.; Aimal, M.M.; Alshehri, M.D. A Centralized Cluster-Based Hierarchical Approach for Green Communication in a Smart Healthcare System. IEEE Access 2020, 8, 101464–101475. [Google Scholar] [CrossRef]
- Dwivedi, A.K.; Sharma, A.K. EE-LEACH: Energy Enhancement in LEACH using Fuzzy Logic for Homogeneous WSN. Wirel. Pers. Commun. 2021, 120, 3035–3055. [Google Scholar] [CrossRef]
- Mohseni, M.; Amirghafouri, F.; Pourghebleh, B. CEDAR: A cluster-based energy-aware data aggregation routing protocol in the internet of things using capuchin search algorithm and fuzzy logic. Peer-to-Peer Netw. Appl. 2023, 16, 189–209. [Google Scholar] [CrossRef]
- Sert, S.A.; Alchihabi, A.; Yazici, A. A Two-Tier Distributed Fuzzy Logic Based Protocol for Efficient Data Aggregation in Multihop Wireless Sensor Networks. IEEE Trans. Fuzzy Syst. 2018, 26, 3615–3629. [Google Scholar] [CrossRef]
- Chavva, S.R.; Sangam, R.S. An energy-efficient multi-hop routing protocol for health monitoring in wireless body area networks. Netw. Model. Anal. Health Inform. Bioinform. 2019, 8, 21. [Google Scholar] [CrossRef]
- Singh, S.; Kumar, D. Energy-efficient secure data fusion scheme for IoT based healthcare system. Futur. Gener. Comput. Syst. 2023, 143, 15–29. [Google Scholar] [CrossRef]
- Joshi, S.; Anithaashri, T.; Rastogi, R.; Choudhary, G.; Dragoni, N. IEDA-HGEO: Improved Energy Efficient with Clustering-Based Data Aggregation and Transmission Protocol for Underwater Wireless Sensor Networks. Energies 2022, 16, 353. [Google Scholar] [CrossRef]
- Omeke, K.G.; Mollel, M.; Shah, S.T.; Arshad, K.; Zhang, L.; Abbasi, Q.H.; Imran, M.A. Dynamic Clustering and Data Aggregation for the Internet-of-Underwater-Things Networks. In Proceedings of the 2022 14th International Conference on Computational Intelligence and Communication Networks (CICN), Al-Khobar, Saudi Arabia, 4–6 December 2022; pp. 322–328. [Google Scholar]
- Benila, S.; Usha Bhanu, N. Fog Managed Data Model for IoT based Healthcare Systems. J. Internet Technol. 2022, 23, 217–226. [Google Scholar] [CrossRef]
- Bhushan, S.; Kumar, M.; Kumar, P.; Stephan, T.; Shankar, A.; Liu, P. FAJIT: A fuzzy-based data aggregation technique for energy efficiency in wireless sensor network. Complex Intell. Syst. 2021, 7, 997–1007. [Google Scholar] [CrossRef]
- Wang, N.-C.; Chen, Y.-L.; Huang, Y.-F.; Chen, C.-M.; Lin, W.-C.; Lee, C.-Y. An Energy Aware Grid-Based Clustering Power Efficient Data Aggregation Protocol for Wireless Sensor Networks. Appl. Sci. 2022, 12, 9877. [Google Scholar] [CrossRef]
- Wang, N.-C.; Lee, C.-Y.; Chen, Y.-L.; Chen, C.-M.; Chen, Z.-Z. An Energy Efficient Load Balancing Tree-Based Data Aggregation Scheme for Grid-Based Wireless Sensor Networks. Sensors 2022, 22, 9303. [Google Scholar] [CrossRef]
- Gandhi, G.S.; Vikas, K.; Ratnam, V.; Babu, K.S. Grid clustering and fuzzy reinforcement-learning based energy-efficient data aggregation scheme for distributed WSN. IET Commun. 2020, 14, 2840–2848. [Google Scholar] [CrossRef]
- Shruti; Rani, S.; Singh, A.; Alkanhel, R.; Hassan, D.S.M. SDAFA: Secure Data Aggregation in Fog-Assisted Smart Grid Environment. Sustainability 2023, 15, 5071. [Google Scholar] [CrossRef]
- Khan, M.Z.; Alhazmi, O.H.; Javed, M.A.; Ghandorh, H.; Aloufi, K.S. Reliable Internet of Things: Challenges and Future Trends. Electronics 2021, 10, 2377. [Google Scholar] [CrossRef]
- Soufiene, B.O.; Bahattab, A.A.; Trad, A.; Youssef, H. LSDA: Lightweight Secure Data Aggregation Scheme in Healthcare using IoT. In Proceedings of the ICIST ‘20: 10th International Conference on Information Systems and Technologies, Rome, Italy, 4–5 June 2020. [Google Scholar]
- Bhansali, P.K.; Hiran, D.; Gulati, K. Secure data collection and transmission for IoMT architecture integrated with federated learning. Int. J. Pervasive Comput. Commun. 2022, ahead-of-print. [Google Scholar] [CrossRef]
Figure 1.
System Model.

Figure 2.
Phases of EE-FDAS.

Figure 3.
The impact of the Number of Attributes on Average Aggregation is explained in (a) while Energy Consumption during the data phase is shown in (b).
Figure 3.
The impact of the Number of Attributes on Average Aggregation is explained in (a) while Energy Consumption during the data phase is shown in (b).

Figure 4.
The impact of the Number of Attributes on Average SL is shown in (a) whereas Needed Transmission Slots are displayed in (b).
Figure 4.
The impact of the Number of Attributes on Average SL is shown in (a) whereas Needed Transmission Slots are displayed in (b).

Figure 5.
The impact of the Number of Attributes on Control overhead is shown in (a) whereas Communication Cost is exhibited in (b).
Figure 5.
The impact of the Number of Attributes on Control overhead is shown in (a) whereas Communication Cost is exhibited in (b).

Figure 6.
In (a), the graph displays Packet Delivery Ratio, representing successfully delivered packets per unit time, while (b) illustrates the Packet Loss Ratio.
Figure 6.
In (a), the graph displays Packet Delivery Ratio, representing successfully delivered packets per unit time, while (b) illustrates the Packet Loss Ratio.

Figure 7.
The Storage Cost by Number of packets per unit time.


Table 1.
List of Notations.
| Sr. | Notation | Description |
|---|---|---|
| 1. | SL | Cluster Heads |
| 2. | THL | Lower Threshold |
| 3. | THU | Upper Threshold |
| 4. | THL1 | Lower Threshold for 1st parameter |
| 5. | THU1 | Upper Threshold for 1st parameter |
| 6. | THL2 | Lower Threshold for 2nd parameter |
| 7. | THU2 | Upper Threshold for 2nd parameter |
| 8. | N[i].Reading[] | Sensor readings for the Node N[i] |
| 9. | dataString | Concatenated string having all values |
| 10. | Rdata | Recived Data at the Fog Server |
Table 2.
Simulation Parameters with respective values.
| Parameters | Values |
|---|---|
| Simulation Duration | 2500 s |
| No. of arranged nodes | 300 |
| Organization of nodes | Random |
| Transmission range | 30 m |
| Broadcasting power consumption | 0.5819 µJ |
| Receiving energy utilization | 0.049 µJ |
| Size of network | 3000 m × 3000 m |
Disclaimer/Publisher’s Note: The statements, opinions and data contained in all publications are solely those of the individual author(s) and contributor(s) and not of MDPI and/or the editor(s). MDPI and/or the editor(s) disclaim responsibility for any injury to people or property resulting from any ideas, methods, instructions or products referred to in the content. |
© 2024 by the authors. Licensee MDPI, Basel, Switzerland. This article is an open access article distributed under the terms and conditions of the Creative Commons Attribution (CC BY) license (https://creativecommons.org/licenses/by/4.0/).
Share and Cite
MDPI and ACS Style
Khan, M.N.U.; Cao, W.; Tang, Z.; Ullah, A.; Pan, W. Energy-Efficient De-Duplication Mechanism for Healthcare Data Aggregation in IoT. Future Internet 2024, 16, 66. https://doi.org/10.3390/fi16020066
AMA Style
Khan MNU, Cao W, Tang Z, Ullah A, Pan W. Energy-Efficient De-Duplication Mechanism for Healthcare Data Aggregation in IoT. Future Internet. 2024; 16(2):66. https://doi.org/10.3390/fi16020066
Chicago/Turabian StyleKhan, Muhammad Nafees Ulfat, Weiping Cao, Zhiling Tang, Ata Ullah, and Wanghua Pan. 2024. "Energy-Efficient De-Duplication Mechanism for Healthcare Data Aggregation in IoT" Future Internet 16, no. 2: 66. https://doi.org/10.3390/fi16020066
Note that from the first issue of 2016, this journal uses article numbers instead of page numbers. See further details here.