1. Introduction
Nowadays, Internet speed is an eminent concern for both users and service providers; hence, cellular companies are in a battle for fifth generation (5G) Internet implementation to provide a super-fast and reliable connection to their users [
1]. So, enhancing the reliability, capacity, and speed of channels is mandatory. There are actions to accomplish those tasks, such as massive multiple-input and multiple-output (MIMO) or low power and low latency for the tactile internet, among others [
2].
The primary focus of 5G networks is to enhance the transmission speed, capacity, and reliability of wireless channels. The fulfillment of these tasks is possible with the use of low power and low latency for the tactile internet, the Internet of Things (IoT), massive multiple-input and multiple-output (MIMO), robotics, autonomous vehicles, and industry [
2].
It is essential for real-time applications and seamless connectivity with low latency requirements to have a reliable network, and 5G offers a latency of 1 ms to satisfy this requirement [
3]. In the future, the above traits of 5G will assist in upcoming big data applications such as diagnosing critical-life situations in hospitals, fast money transfer in a stealthy way, handling inventory in warehouses, and much more [
4].
LTE, 4G, and their earlier generations cannot support the latest traffic-intensive applications with quality of service (QoS). Here is where the 5G characteristic offers an average data rate of more than 100 megabits per second (Mbps) and data rates of up to 20 Gbps (faster than 4G) to meet these requirements [
5].
Applying supervised learning algorithms to high-dimensional datasets is a common challenge in various areas of research and practical application. One of the most widely used methods that allow for the extraction of the most relevant characteristics of the data to reduce its dimensionality and represent them in a lower dimensional space [
6,
7] is principal component analysis (PCA). However, although PCA can improve the performance of supervised learning algorithms, it can also hide important information and affect the performance of these algorithms.
This article presents a study on applying supervised learning algorithms to a dataset after having undergone a PCA procedure. The main objective is to analyze how PCA affects the performance of supervised learning algorithms for classifying 5G/B5G services in terms of processing time and generalization capacity. We also analyze if PCA is suitable based on the following decision metrics: accuracy, precision, recall, f1 score, and Matthew’s correlation coefficient (MCC).
The methodology used in this article considers the use of a public dataset and the application of the five supervised learning algorithms used by the authors in [
1], such as decision tree (DT), random forest (RF), support vector machines (SVM), K-nearest neighbors (KNN), and multi-layer perceptron classifier (MLPC). In addition, we are applying a K-Folds cross-validation (K = 10) procedure to ensure the validity of the results.
The main contributions of this study are as follows:
- ➢
The reduction of dimension in QoS parameters with respect to the 5G dataset, maintaining 95% of data variance;
- ➢
The evaluation of the impact of PCA on the performance of supervised learning algorithms and the comparison of the results obtained with a previous study that did not use PCA;
- ➢
The identification of the best hyperparameters of five SL algorithms to obtain the best possible results for the PCA 5G dataset;
- ➢
The improvement of the performance metrics of SL models concerning previous studies, with an accuracy of 98.1% and an F1 score of 98%.
These results can benefit various application areas of network management and telecommunications service providers.
The organization of the rest of this paper is as follows:
Section 2 discusses the PCA involved in service classification and the methodology applied.
Section 3 describes the methodology used in the present work and how we used PCA to reduce the characteristics of the database. In
Section 4, we present the simulation results of this study and the comparison with previous work. Finally,
Section 5 concludes the article with some final remarks, the limitations of this paper, and suggestions for future work.
2. Related Works
PCA has proven to be an effective technique for reducing the dimensionality of datasets in various research areas. In the context of 5G networks, several studies explored using the PCA strategy to reduce the complexity of datasets used in service classification. These related works focus on applying PCA to data related to QoS measurements in 5G/B5G networks.
The authors in [
8] analyze the throughput obtained with the variations observed on the identified parameters on which it depends. They analyzed the problem as a regression problem and applied regressor models. We analyzed multiple models ranging from statistical to probabilistic and machine learning to deep recurrent networks with a 10-fold cross-validation. Moreover, we applied dimensionality reduction to the dataset and observed the performance.
Reference [
9] introduces a weighted principal component analysis (WPCA)-based service recommendation method. WPCA is a modification of PCA that allows for the weighting of different variables. This weighting can reflect the importance of different variables in the recommendation process. The authors use a real-world dataset of user ratings of movies to evaluate the WPCA-based service recommendation method.
Reference [
10] compares the performance of different text classifiers when using principal component analysis (PCA) as a feature extraction method. The results showed that PCA can improve the performance of all three text classifiers. The authors also found that the number of principal components used can affect the performance of the text classifiers. In general, using more principal components leads to better performance. However, using too many principal components can lead to overfitting.
Reference [
11] discusses the importance of service level agreements (SLAs) in 5G networks and beyond, especially for 5G-enabled healthcare systems. SLAs are a set of promises a service provider makes to its customers to meet and help ensure service quality.
Reference [
12] proposes a method for segmenting medical images using principal component analysis (PCA). The method first uses PCA to reduce the dimensionality of the image data. The authors reduced the dimensionality by projecting the data onto a lower-dimensional subspace that captures the most critical information in the data. The authors further evaluated the proposed method on a dataset of medical images. The results showed that the proposed method permits highly accurate segmenting images.
Reference [
13] introduces principal component analysis (PCA) as a statistical method for reducing the dimensionality of data while retaining as much information as possible. PCA is a widely used technique in many fields, including machine learning, data mining, and image processing. The authors used PCA to reduce the dimensionality of the data from 12 to 3 components. These components correlated with the three main tumor types in the study.
The related works presented consistently demonstrated the effectiveness of principal component analysis (PCA) in various critical tasks within 5G networks. These works highlight how PCA can improve performance in critical areas such as channel estimation, user pooling, resource allocation, and interference management. In all cases, the PCA-based approach outperformed traditional algorithms by reducing dimensionality and exploiting relevant features in datasets from 5G networks.
In
Table 1, we compare previous research works and identify the gap, which effectively highlights the milestones achieved in the current literature and the area of opportunity at the time. Moreover, it highlights the importance of our study by focusing on the area of opportunity that still requires attention and how this research can contribute to the advancement of service classification in 5G/B5G networks.
These studies support the idea that PCA is a powerful tool with which to improve the performance and efficiency of 5G networks by providing a more compact representation of data and enabling more accurate decision-making. These investigations establish the groundwork for forthcoming advancements and enhancements in the domain of 5G networks, fostering the examination of PCA-based methodologies in additional domains and applications inside this framework.
In conclusion, PCA is a promising technique in 5G networks, offering opportunities to optimize and improve various critical aspects of these networks. Knowledge and understanding of PCA applications in this context are essential to continued advancement in the search for more efficient and effective solutions in designing and deploying next-generation networks.
Our proposal takes advantage of some of the areas of opportunity shown in
Table 1 (Articles [
8], [
11], and [
13]). We use PCA’s advantages to reduce dimensions in a 5G dataset, apply different SL algorithms that learn to classify services, and finish with the search for hyperparameters to obtain better results. We claim that a better service classification leads to a better QoS for the operator and, in turn, compliance with the SLAs.
3. Methodology
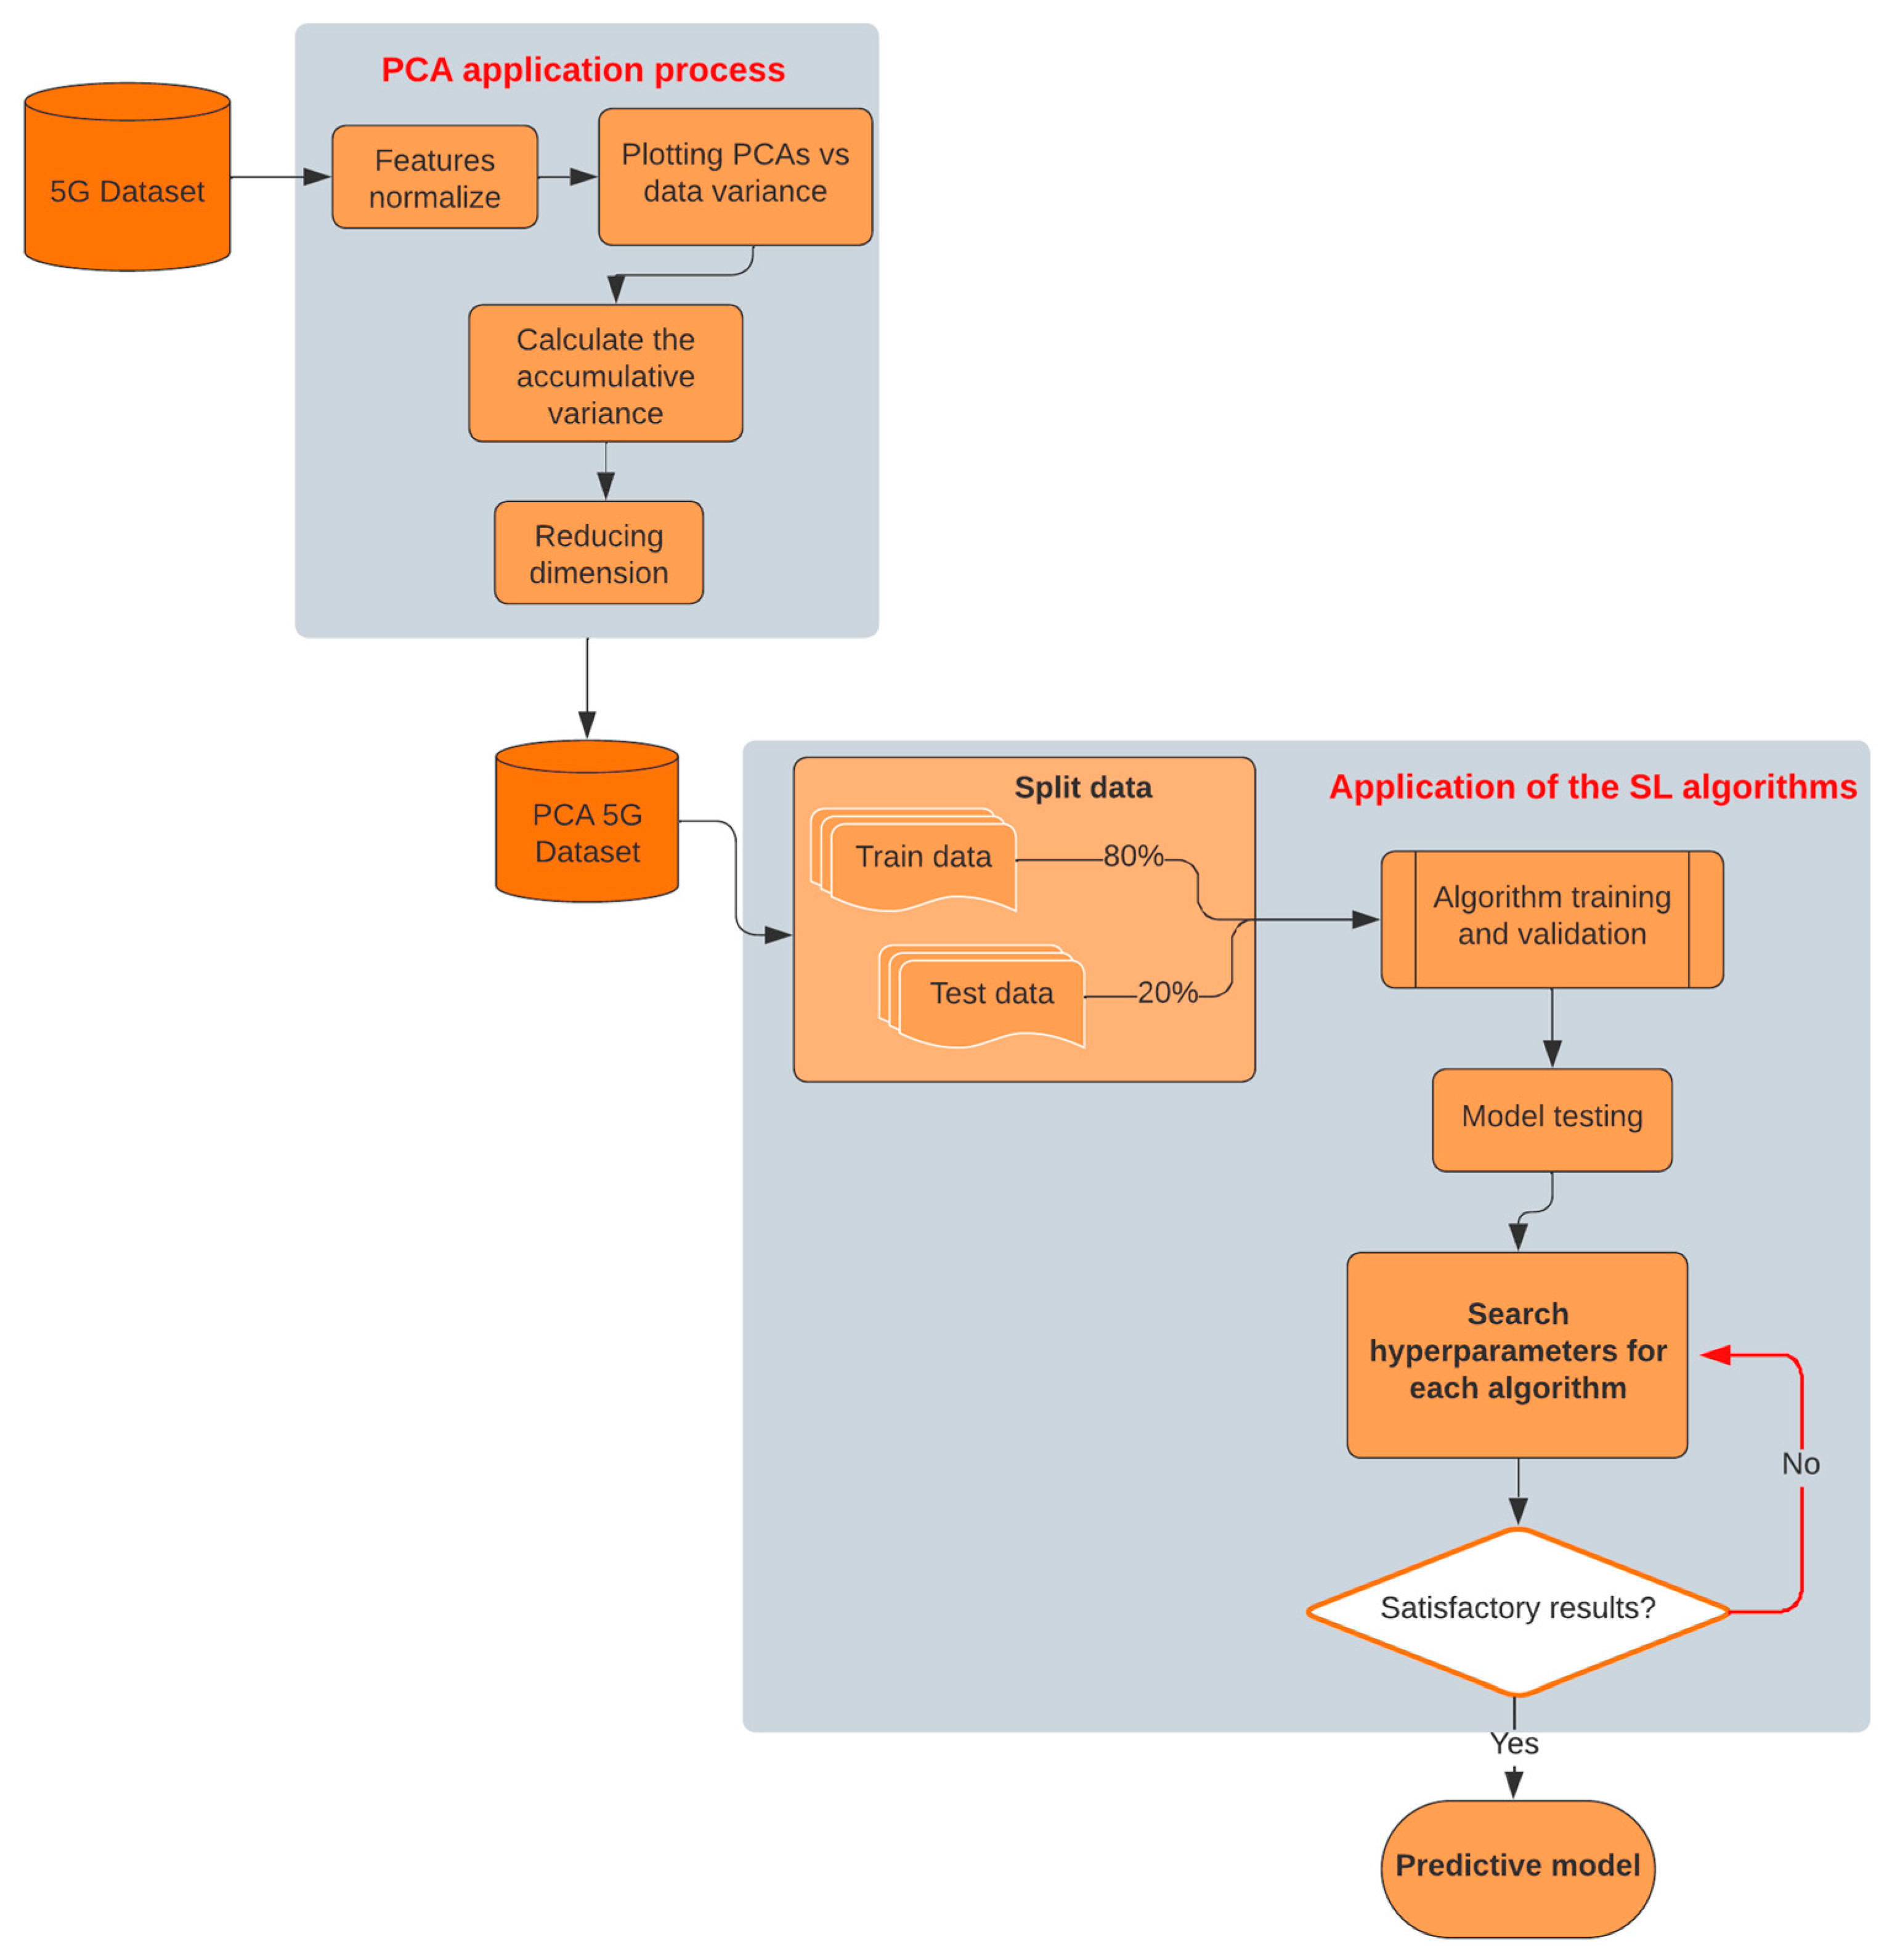
In this section, we present the fundamental process covered by this study to evaluate the effectiveness of service classification using SL algorithms in the context of 5G/B5G networks. Our approach considers three crucial phases that converge in the search for an optimal solution: the first involves the reduction of the dimensionality of our data using PCA, followed by the application of SL algorithms, and culminating in the search for hyperparameters that allow us to obtain more solid and precise results.
Figure 1 shows the block diagram of the processes followed in this work. This diagram provides an overview of the interconnected stages that make up our methodological approach. This section thoroughly explores each phase, highlighting the techniques used in each step.
This comprehensive approach allows for a deeper understanding of our case study; it demonstrates the importance of each phase in obtaining accurate and relevant results in the context of next-generation networks.
This work evaluates the SL scheme’s performance in classifying services after passing the training data through a PCA procedure. We used the same dataset and SL algorithms (DT, RF, SVM, KNN, and MLPC) for this analysis as in [
1]. This research focuses on precisely evaluating the PCA’s impact on the data.
The dataset used in this study was created manually following communication standards. The dataset includes 165 samples and 13 variables, which are key performance indicators (KPIs) and key quality indicators (KQIs) of 5G services. Variables represent essential performance metrics such as latency, throughput, and packet loss, among others.
We performed the PCA analysis to reduce the dimension of the dataset, as shown in
Figure 1. We had to normalize the features of the 5G dataset because we needed each feature to contribute equally. We calculated the accumulative variance and observed how principal components retained 95% of the original variance. Derived from this process, we created a PCA 5G dataset and a group of supervised learning models to classify the new data (PCA dataset). We performed a cross-validation evaluation and compared the performance metrics of the models obtained in this study with the previous research results.
Since we want to measure the impact of PCA on the dataset to guarantee the comparability of the results, we use the same parameters to fit the machine learning models in both studies. In addition, we performed a detailed comparison of the results obtained from the confusion matrices and performance metrics. Later, we search for the best hyperparameters for each algorithm to obtain the best possible results in the performance metrics.
We must observe the confusion matrix to evaluate the performance metrics in an ML problem. A confusion matrix visualizes the predictive model’s performance, presents confusion in two labels, and permits us to obtain the performance metrics’ equations. Each row represents the current label for the test values (Y test), and the matrix columns represent the number of predictions for each label (
Y) made by the predictive model.
Table 2 shows an example of a confusion matrix.
True Positives: the number of current values classified as belonging to a particular class, for which the model’s prediction is correct;
False Positives: these are the current values classified as belonging to an incorrect class (they are considered by the model to be positive, but the prediction is wrong);
False Negatives: these are values that belong to a particular class but are classified differently (incorrect prediction);
True Negatives: these are observations that do not belong to a given class and are classified correctly.
A series of metrics can be derived from the results in the confusion matrix of
Table 2 and used to evaluate the performance of the predictive model. The metrics are accuracy, precision, recall, and F1 score [
14]. We added the Matthew’s correlation coefficient (MCC) metric, and it is defined as follows:
- 2.
Precision:
- 3.
Recall:
- 4.
F1 score:
- 5.
Matthew’s correlation coefficient (MCC): This is the only binary classification rate that generates a high score only if the binary predictor can correctly predict most positive and negative data instances. It ranges in the interval [−1, +1], with extreme values −1 and +1 reached in cases of perfect misclassification and perfect classification, respectively. At the same time, MCC = 0 is the expected value for the coin-tossing classifier [
15]. It is an alternative measure unaffected by the issue of unbalanced datasets.
In summary, the methodological approach employed in this article combines the PCA technique with well-established SL algorithms for accurate data classification. In addition, our proposal searches for the hyperparameters of each algorithm to find the best results. Furthermore, we evaluated the effectiveness of this approach in terms of performance metrics. We compared it with previous work to demonstrate the utility of PCA analysis in data classification in next-generation networks.
4. Simulation Results
This section explains the steps necessary to meet our research approach (see
Figure 1).
Section 4.1 focuses on applying the PCA to the dataset and understanding the possible results obtained from this analysis.
Section 4.2 focuses on applying SL algorithms to the PCA dataset, and
Section 4.3 focuses on searching for the best hyperparameters of each SL algorithm.
4.1. PCA Application
Continuing with the general scheme shown in
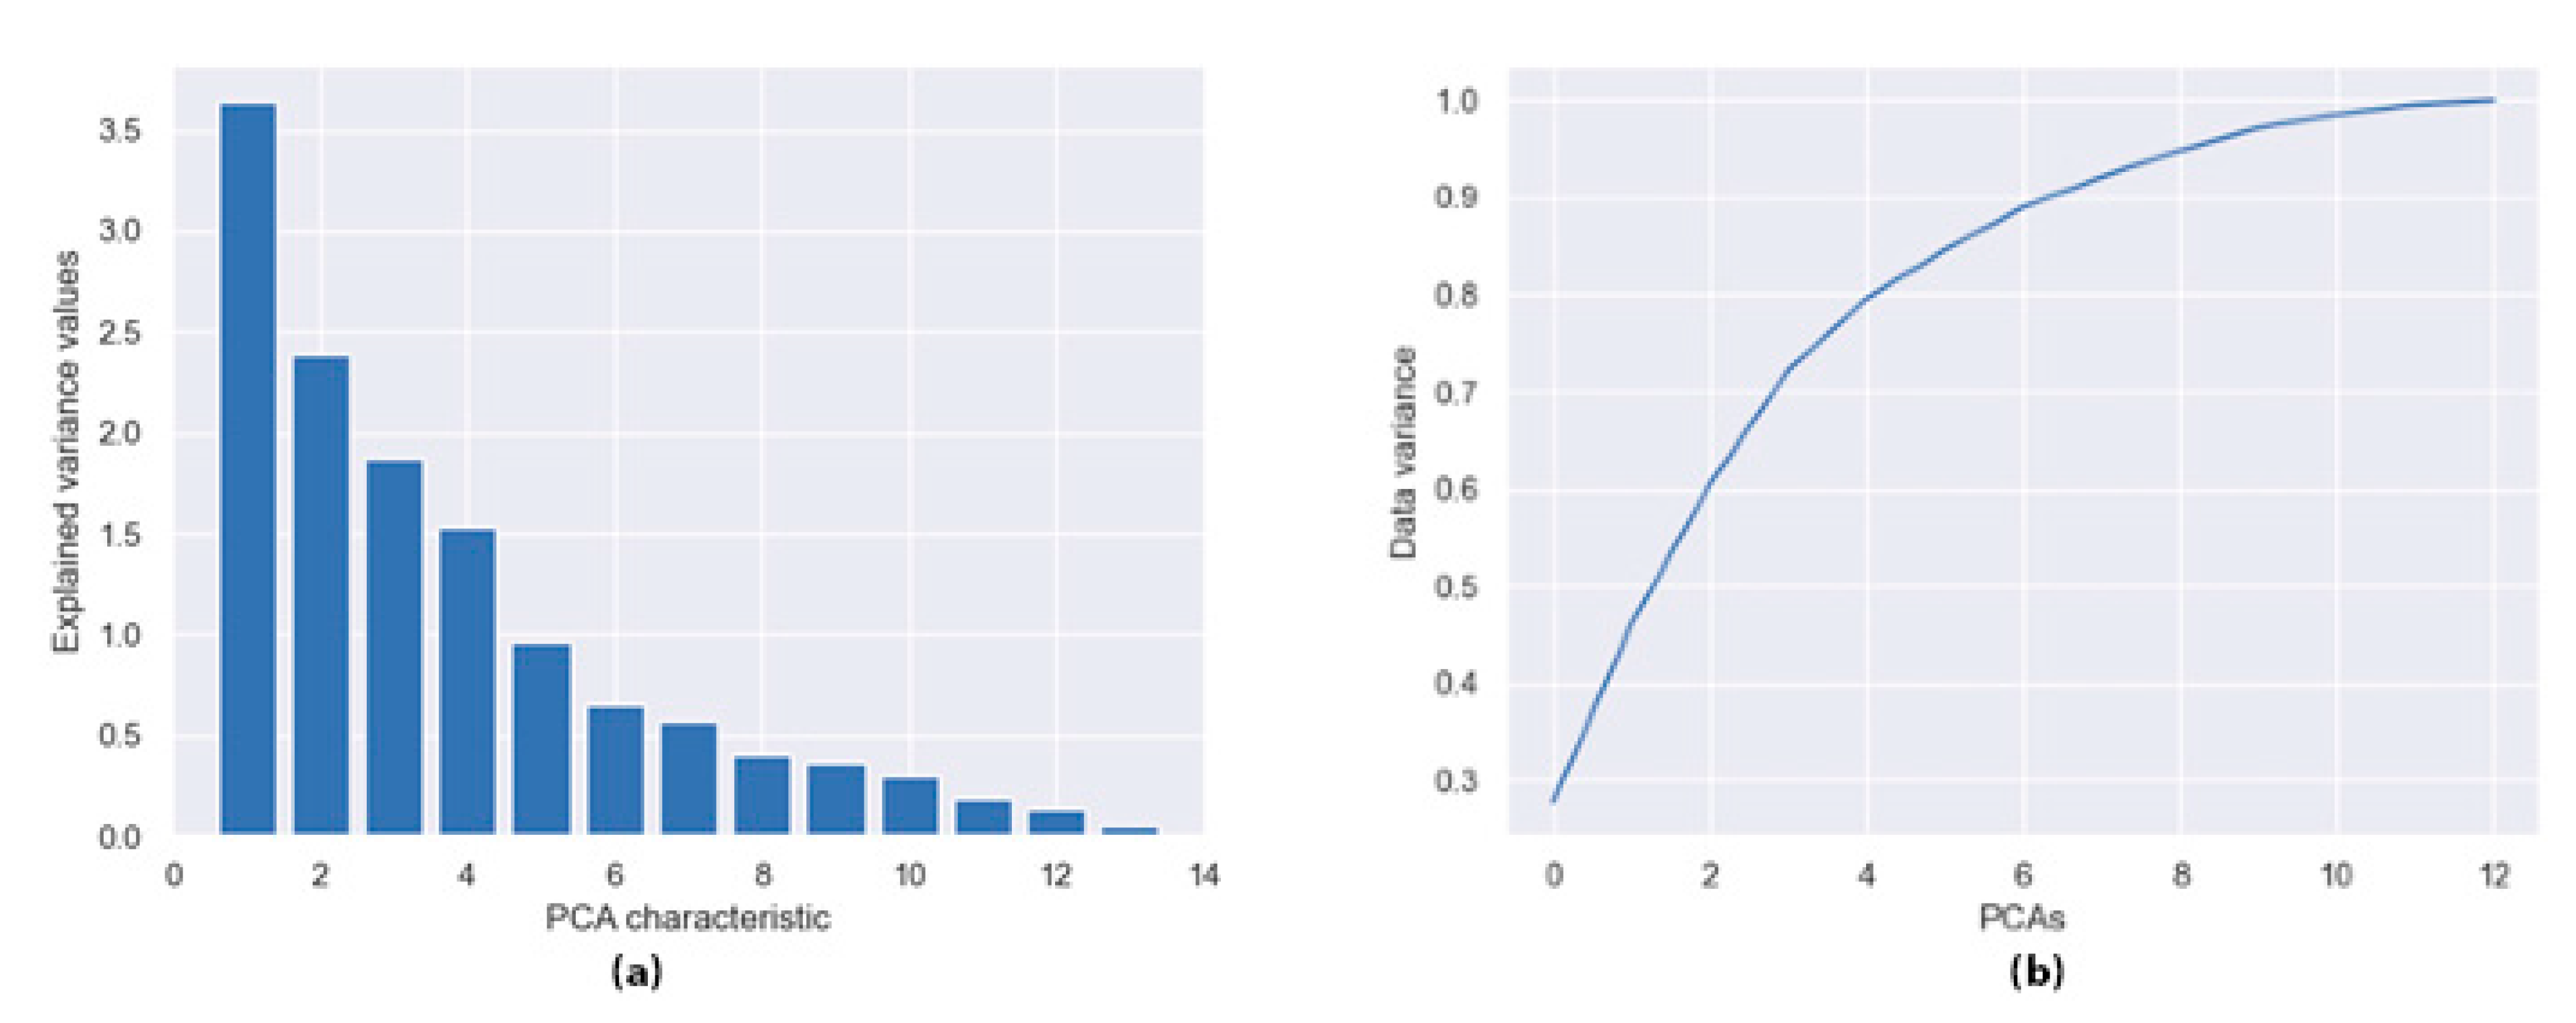
Figure 1, first, we normalized all features in the dataset to ensure they were all on the same scale. Then, we conducted the PCA analysis considering all the input variables to understand the individual contribution of each characteristic in terms of variance.
Figure 2a shows this representation, and from characteristic eight, in terms of variance, we note less relevance.
Therefore, this graph indicates that we must consider reducing the dimensions from 13 to approximately 9. Likewise, we know the cumulative sum of the importance of the variances of each component individually since the permits visualization of which main component to consider.
Figure 2b shows the importance of each component until reaching 100% of the variance.
Figure 2b shows that from the ninth principal component onwards, the graph maintains an almost linear shape and does not represent more than 5% of the main variance of the data. We calculated the cumulative sum to determine the exact percentage of variance in each component.
Table 3 shows the results of this analysis.
Observing the results of
Table 3, we note, with nine principal components guaranteed, approximately 95% of the original variance of the data. With this, it is possible to reduce the dimensions of 13 training variables to 9, which is considered sufficient to fulfill the purpose of this article.
Therefore, we created a new dataset (PCA dataset) of dimension (165, 10); the 165 rows of data are maintained, the nine columns correspond to the nine main components, and the last column corresponds to the labels of the 5G services for classification. In
Appendix A,
Table A1 shows a fragment of the PCA dataset containing the first ten rows.
4.2. Applications of the SL Algorithms
The next step is to apply the SL algorithms and train them using the training data from the PCA dataset. Later, it is imperative to divide the data, train and validate the algorithms, and test and validate the model.
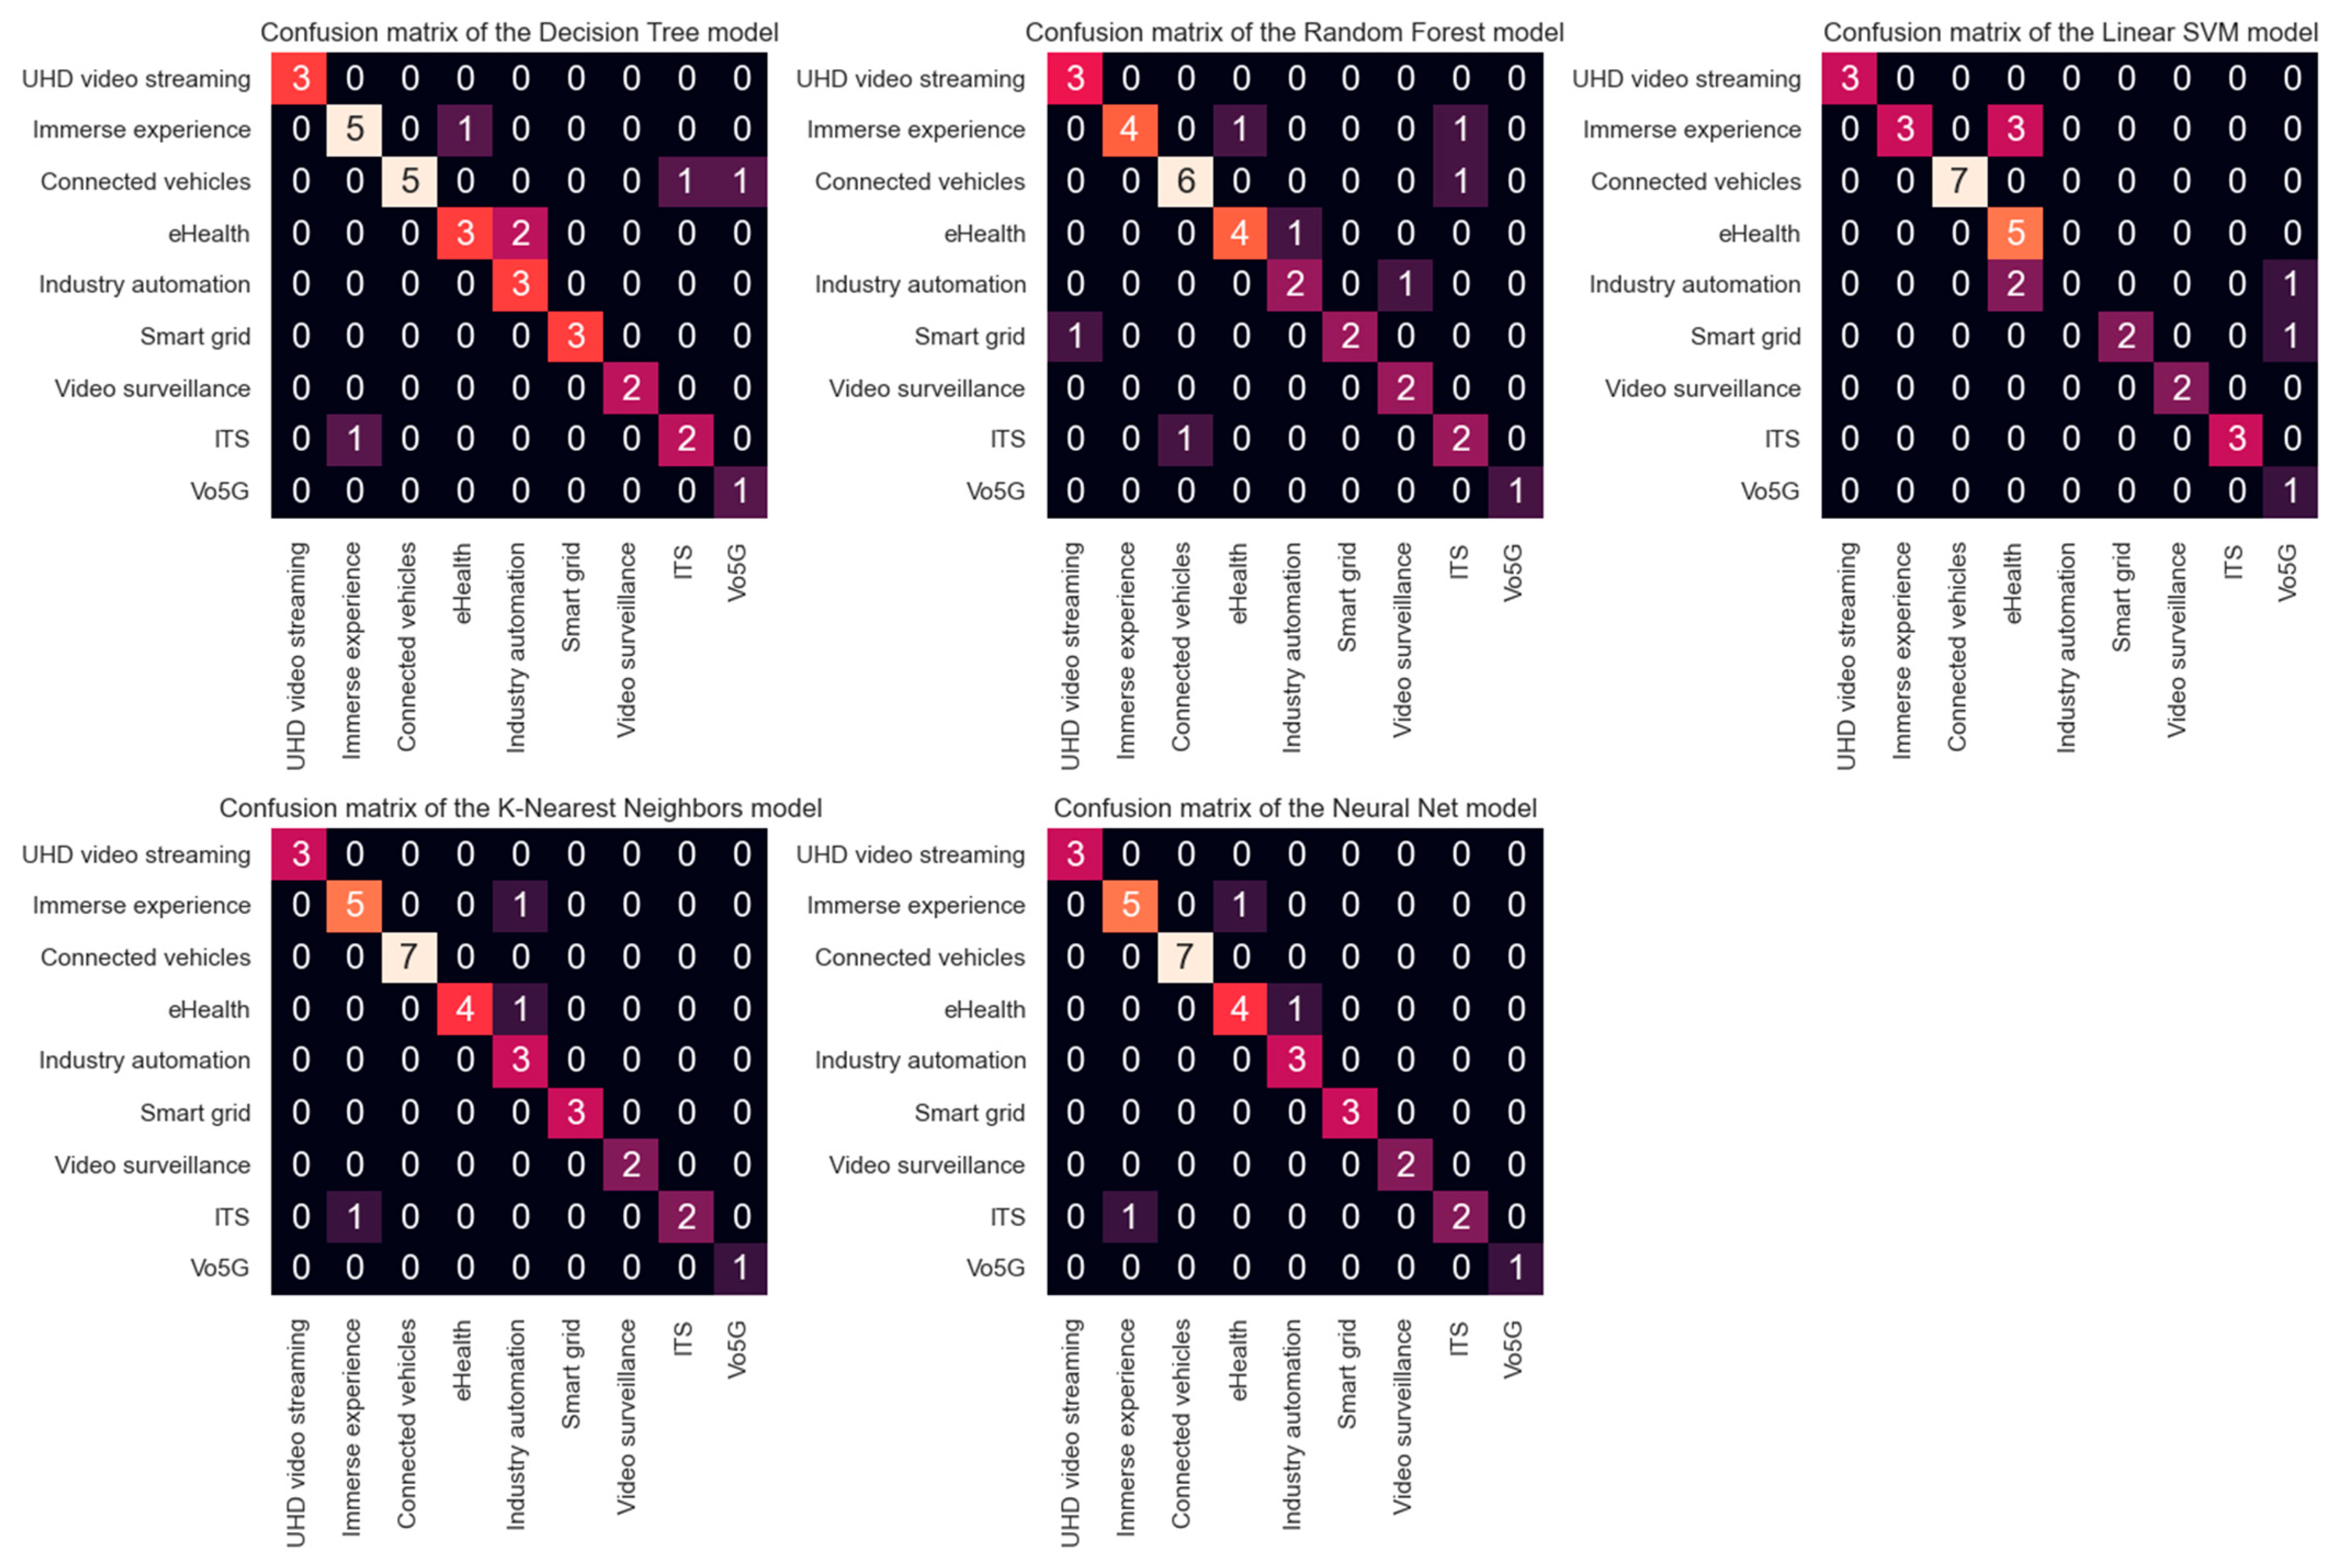
As a reminder, for the validation scenario and to simulate the proposed system, we used SL algorithms: DT, RF (with five trees), SVM (with a linear kernel), KNN (with K = 3), and MLPC, using the Python language and the Anaconda Navigator platform with Jupyter Notebook as IDE. We considered nine essential 5G services to be classified: ultra-high-definition (UHD) video streaming, immersive experience, connected vehicles, e-health, industry automation, video surveillance, smart grid, intelligent transport systems (ITS), and voice over 5G (Vo5G). In this article, we used the same performance evaluation metrics of the model (accuracy, precision, recall, F1 score, and MCC) obtained from the confusion matrix.
The dataset had dimensions of 165 × 10, where the first nine columns represented the principal component, and the last contained the labels of the services. We divided the database into two parts, where 80% (132) of the data (Xtrain) to train the algorithms was created and once trained, generated the predictive model. We used the remaining 20% (Xtest) to test the model.
The models may be prone to underfitting or overfitting, meaning that they will work perfectly for the training data (Xtrain) that are already known, but their accuracy may be lower for new services (Xtest). According to [
16], there are two possible approaches to avoiding overfitting: increasing the volume of the database; or reserving additional data by dividing the dataset into three parts (training, validation, and testing). Increasing the amount of data was difficult because there were insufficient known data from the 5G service; hence, additional data were reserved, the K-Folds cross-validation technique was applied using K = 10 [
17], and we obtained the results shown in
Table 4. All the data formed part of the original PCA dataset and did not constitute three new datasets.
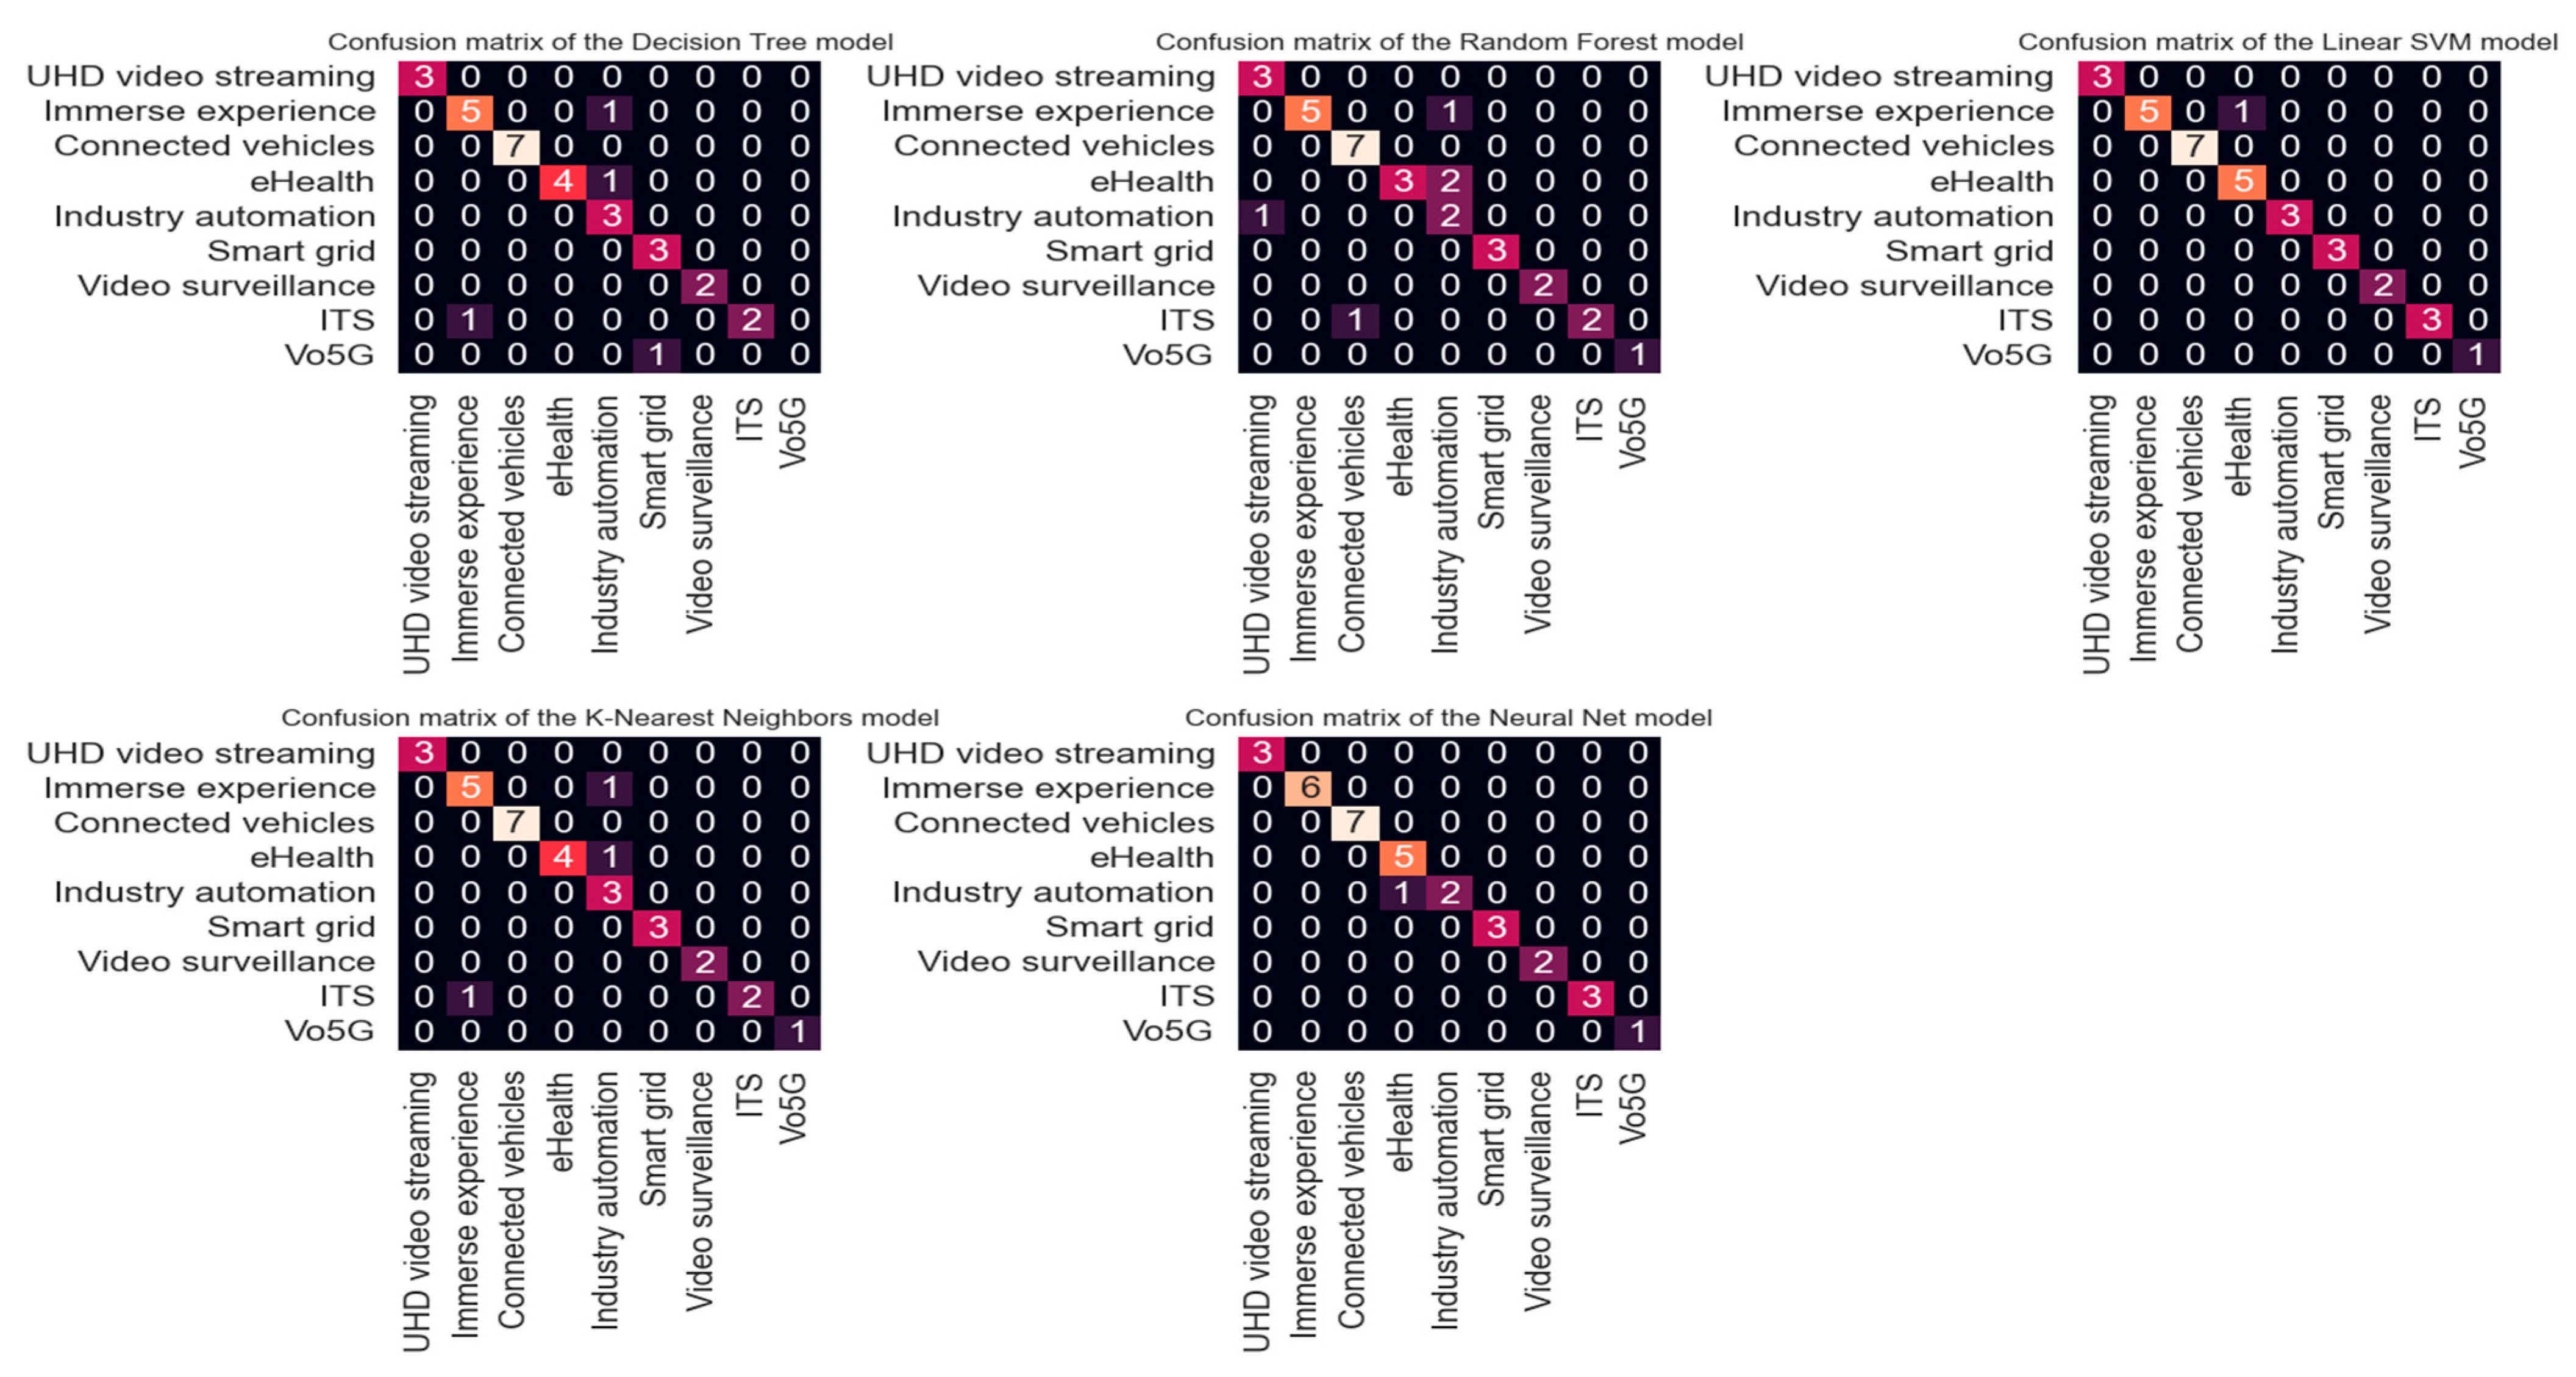
Figure 3 shows the confusion matrices obtained during the testing process for each model in the simulation. The main diagonal shows the number of correct predictions the predictive model makes. Values outside the main diagonal represent wrong predictions.
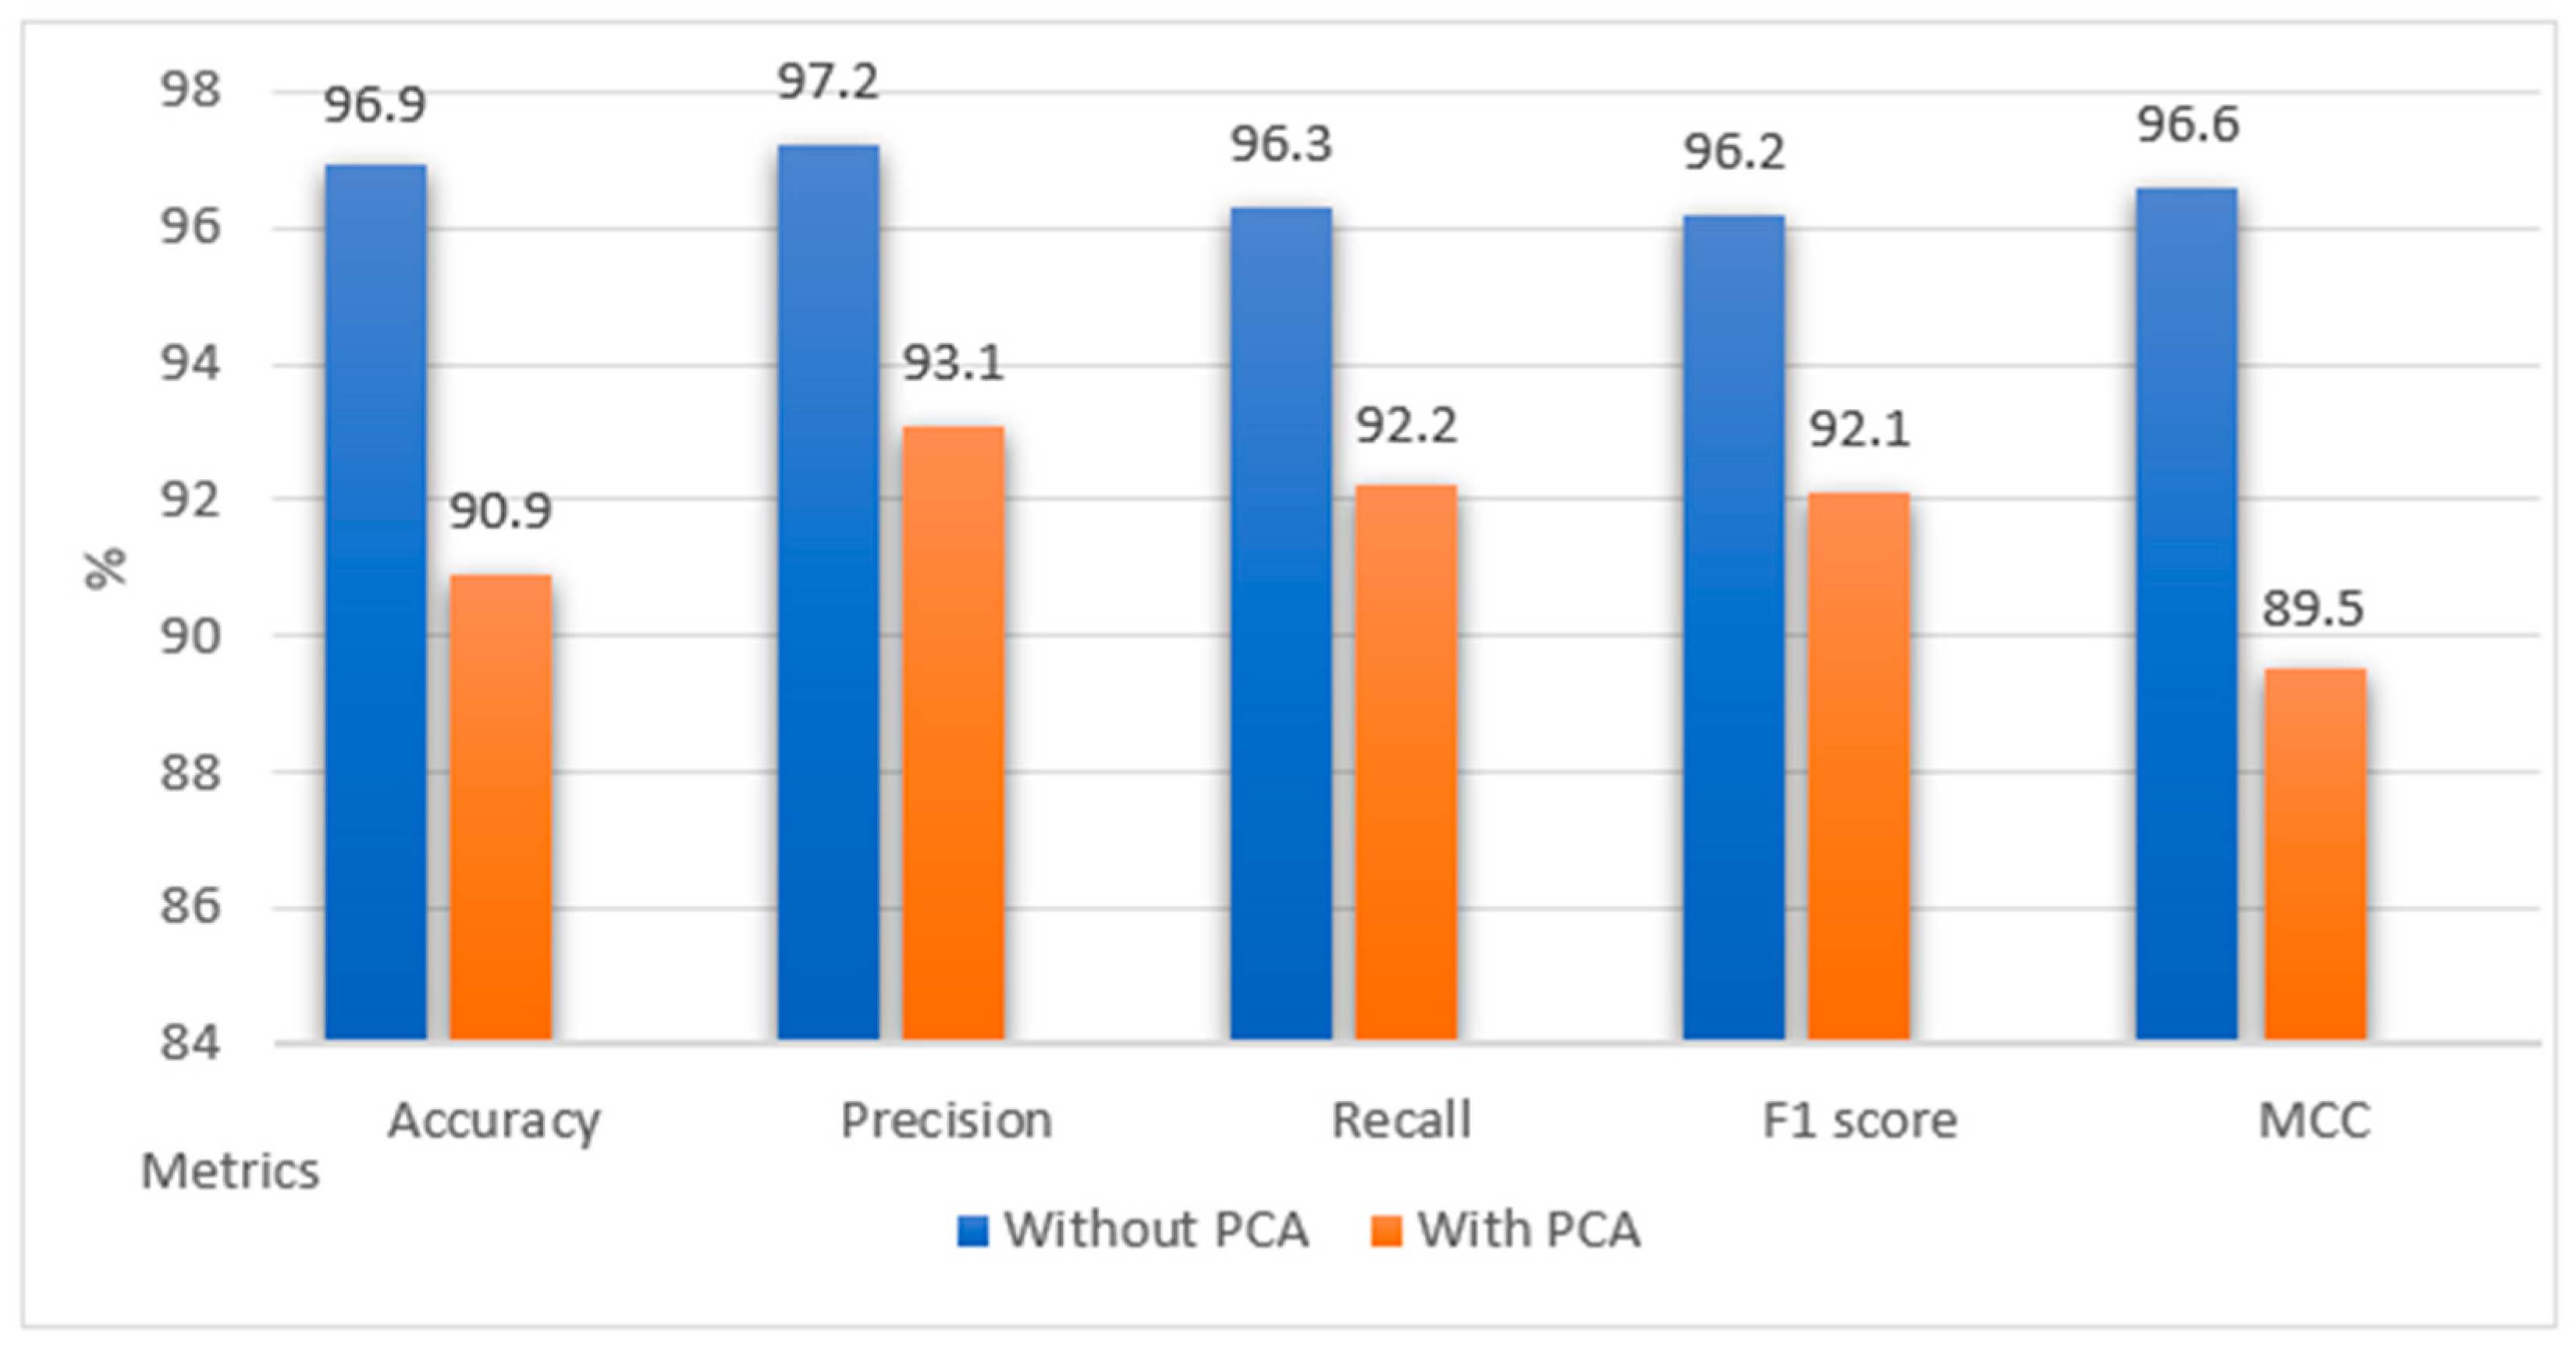
Then, we applied Equations (1)–(5) of the metrics obtained from the confusion matrix to evaluate the performance of the predictive models.
Table 5 shows the results.
Table 5 shows that for the DT and RF models, after applying PCA, the values of the performance metrics decreased considerably. This decrement could be because the data now have fewer features, many even with negative values, and a slight change in the dataset can make the tree structure unstable, which can cause variance [
10].
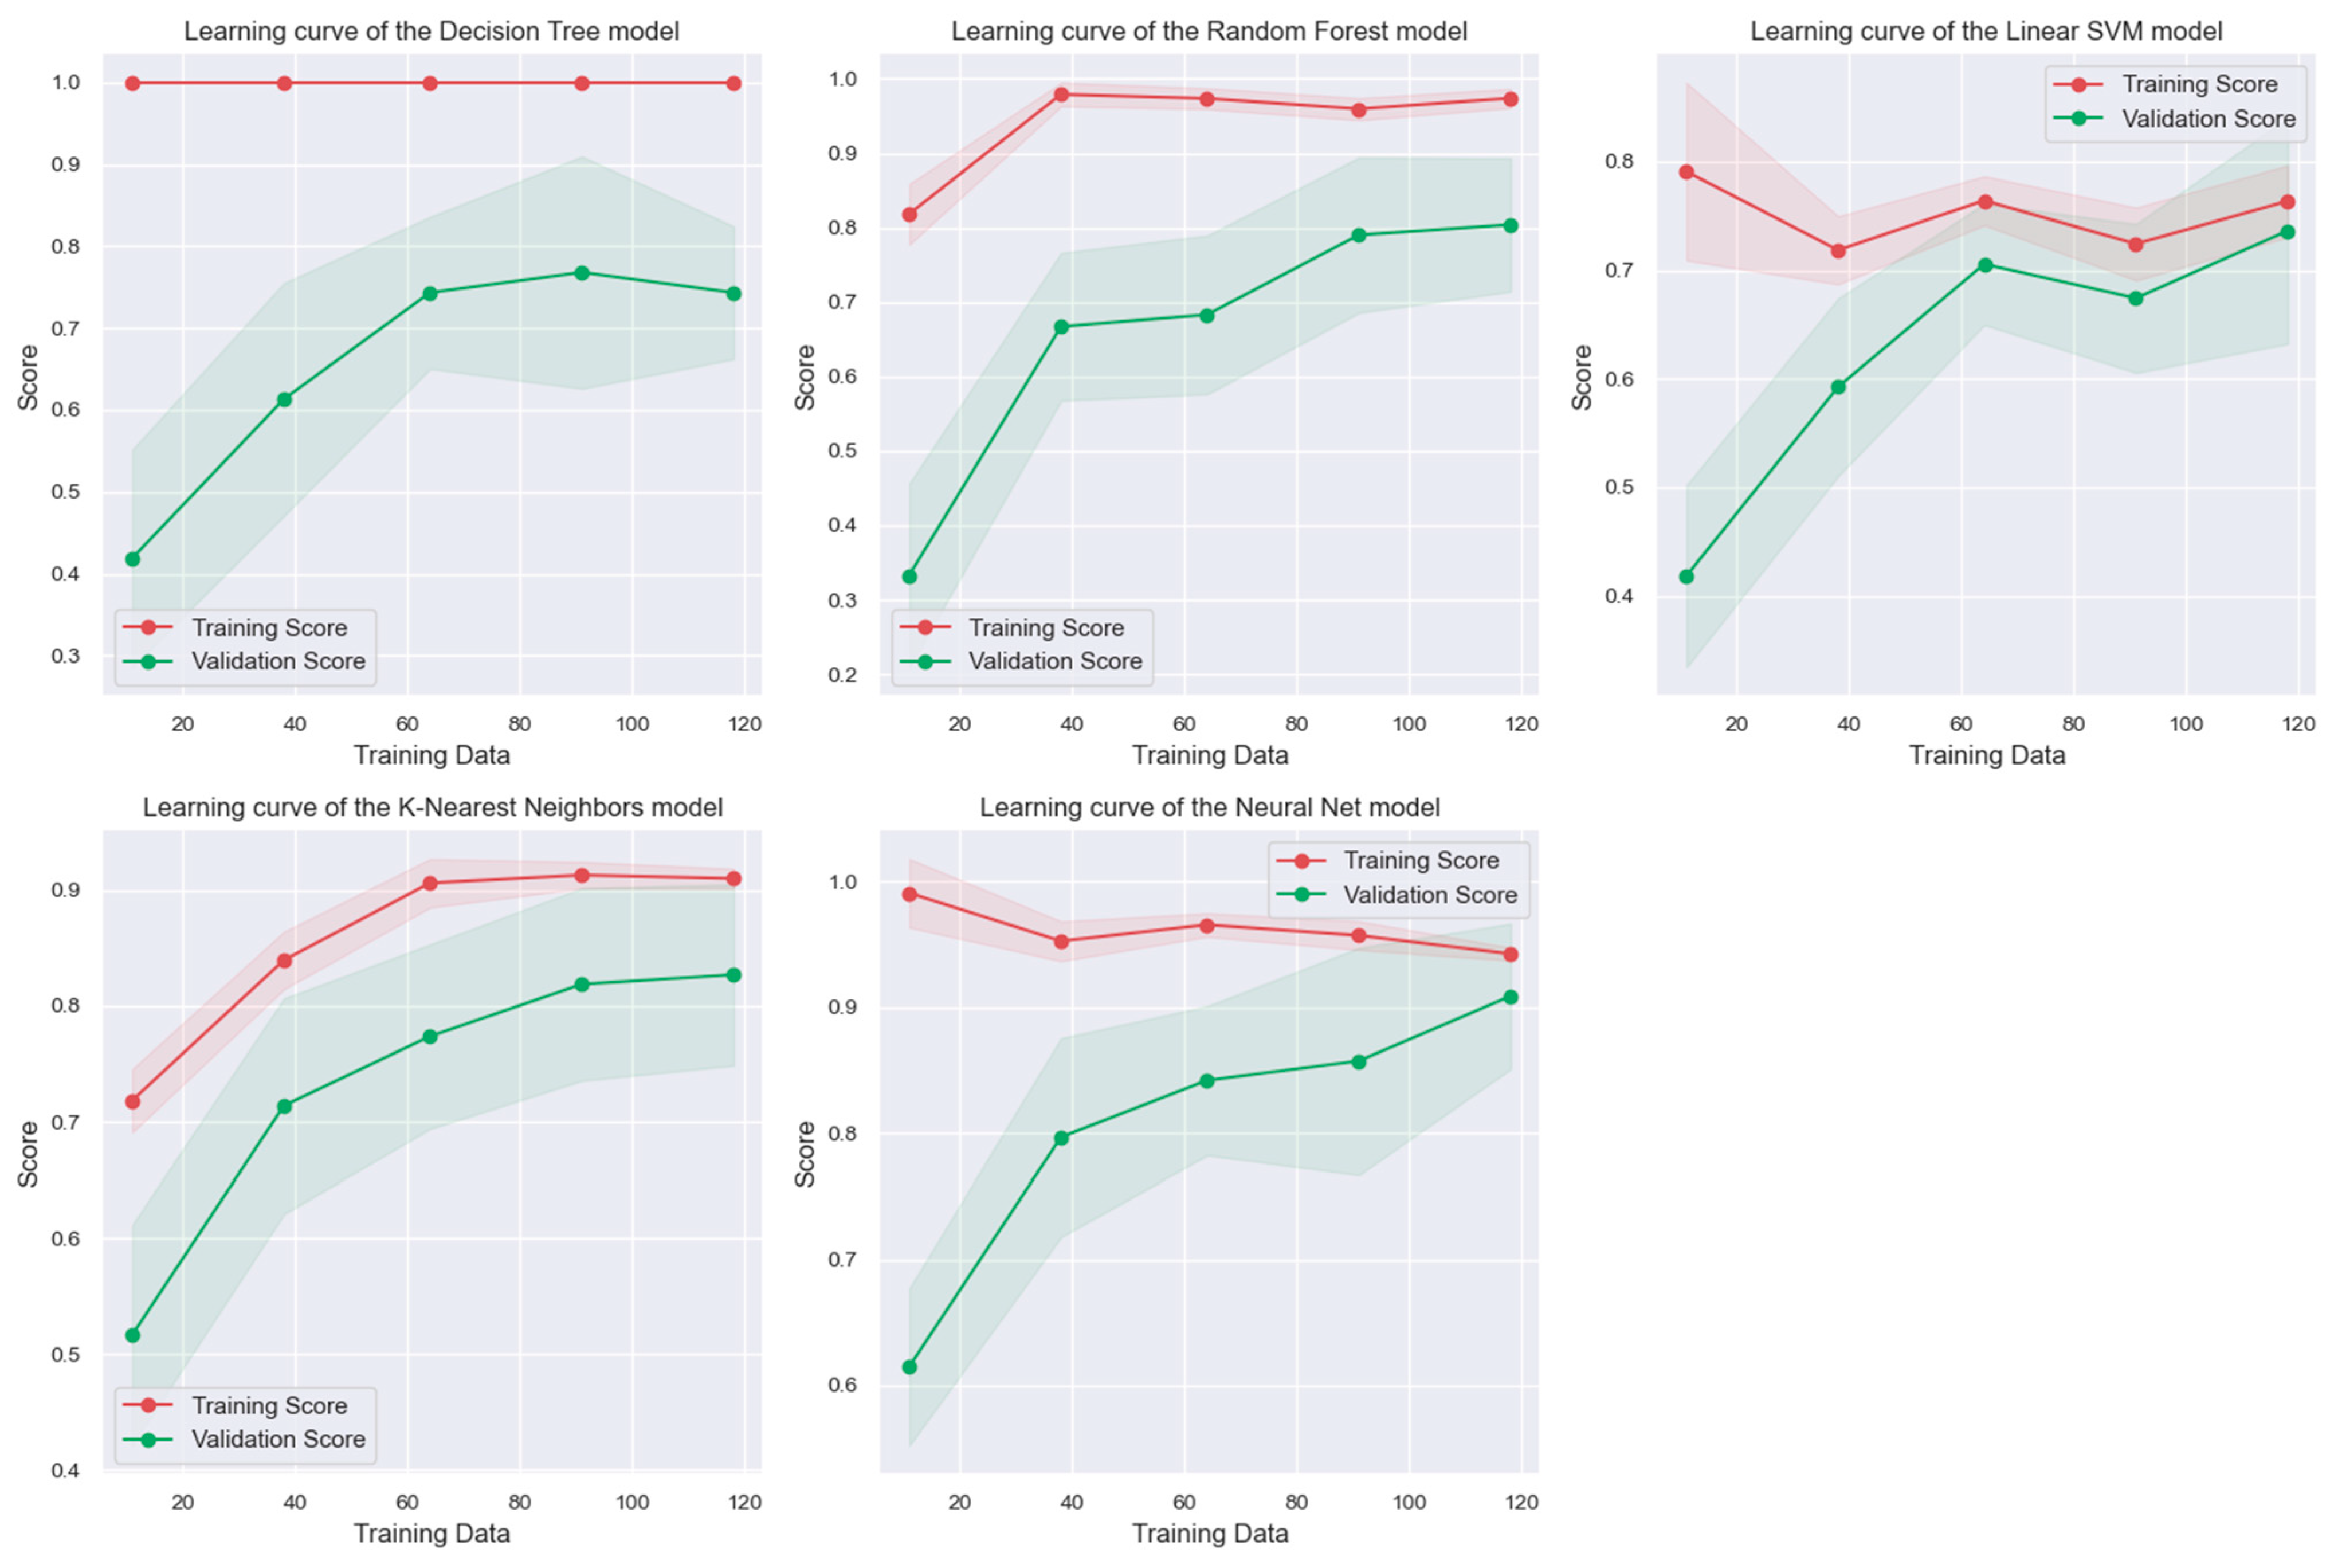
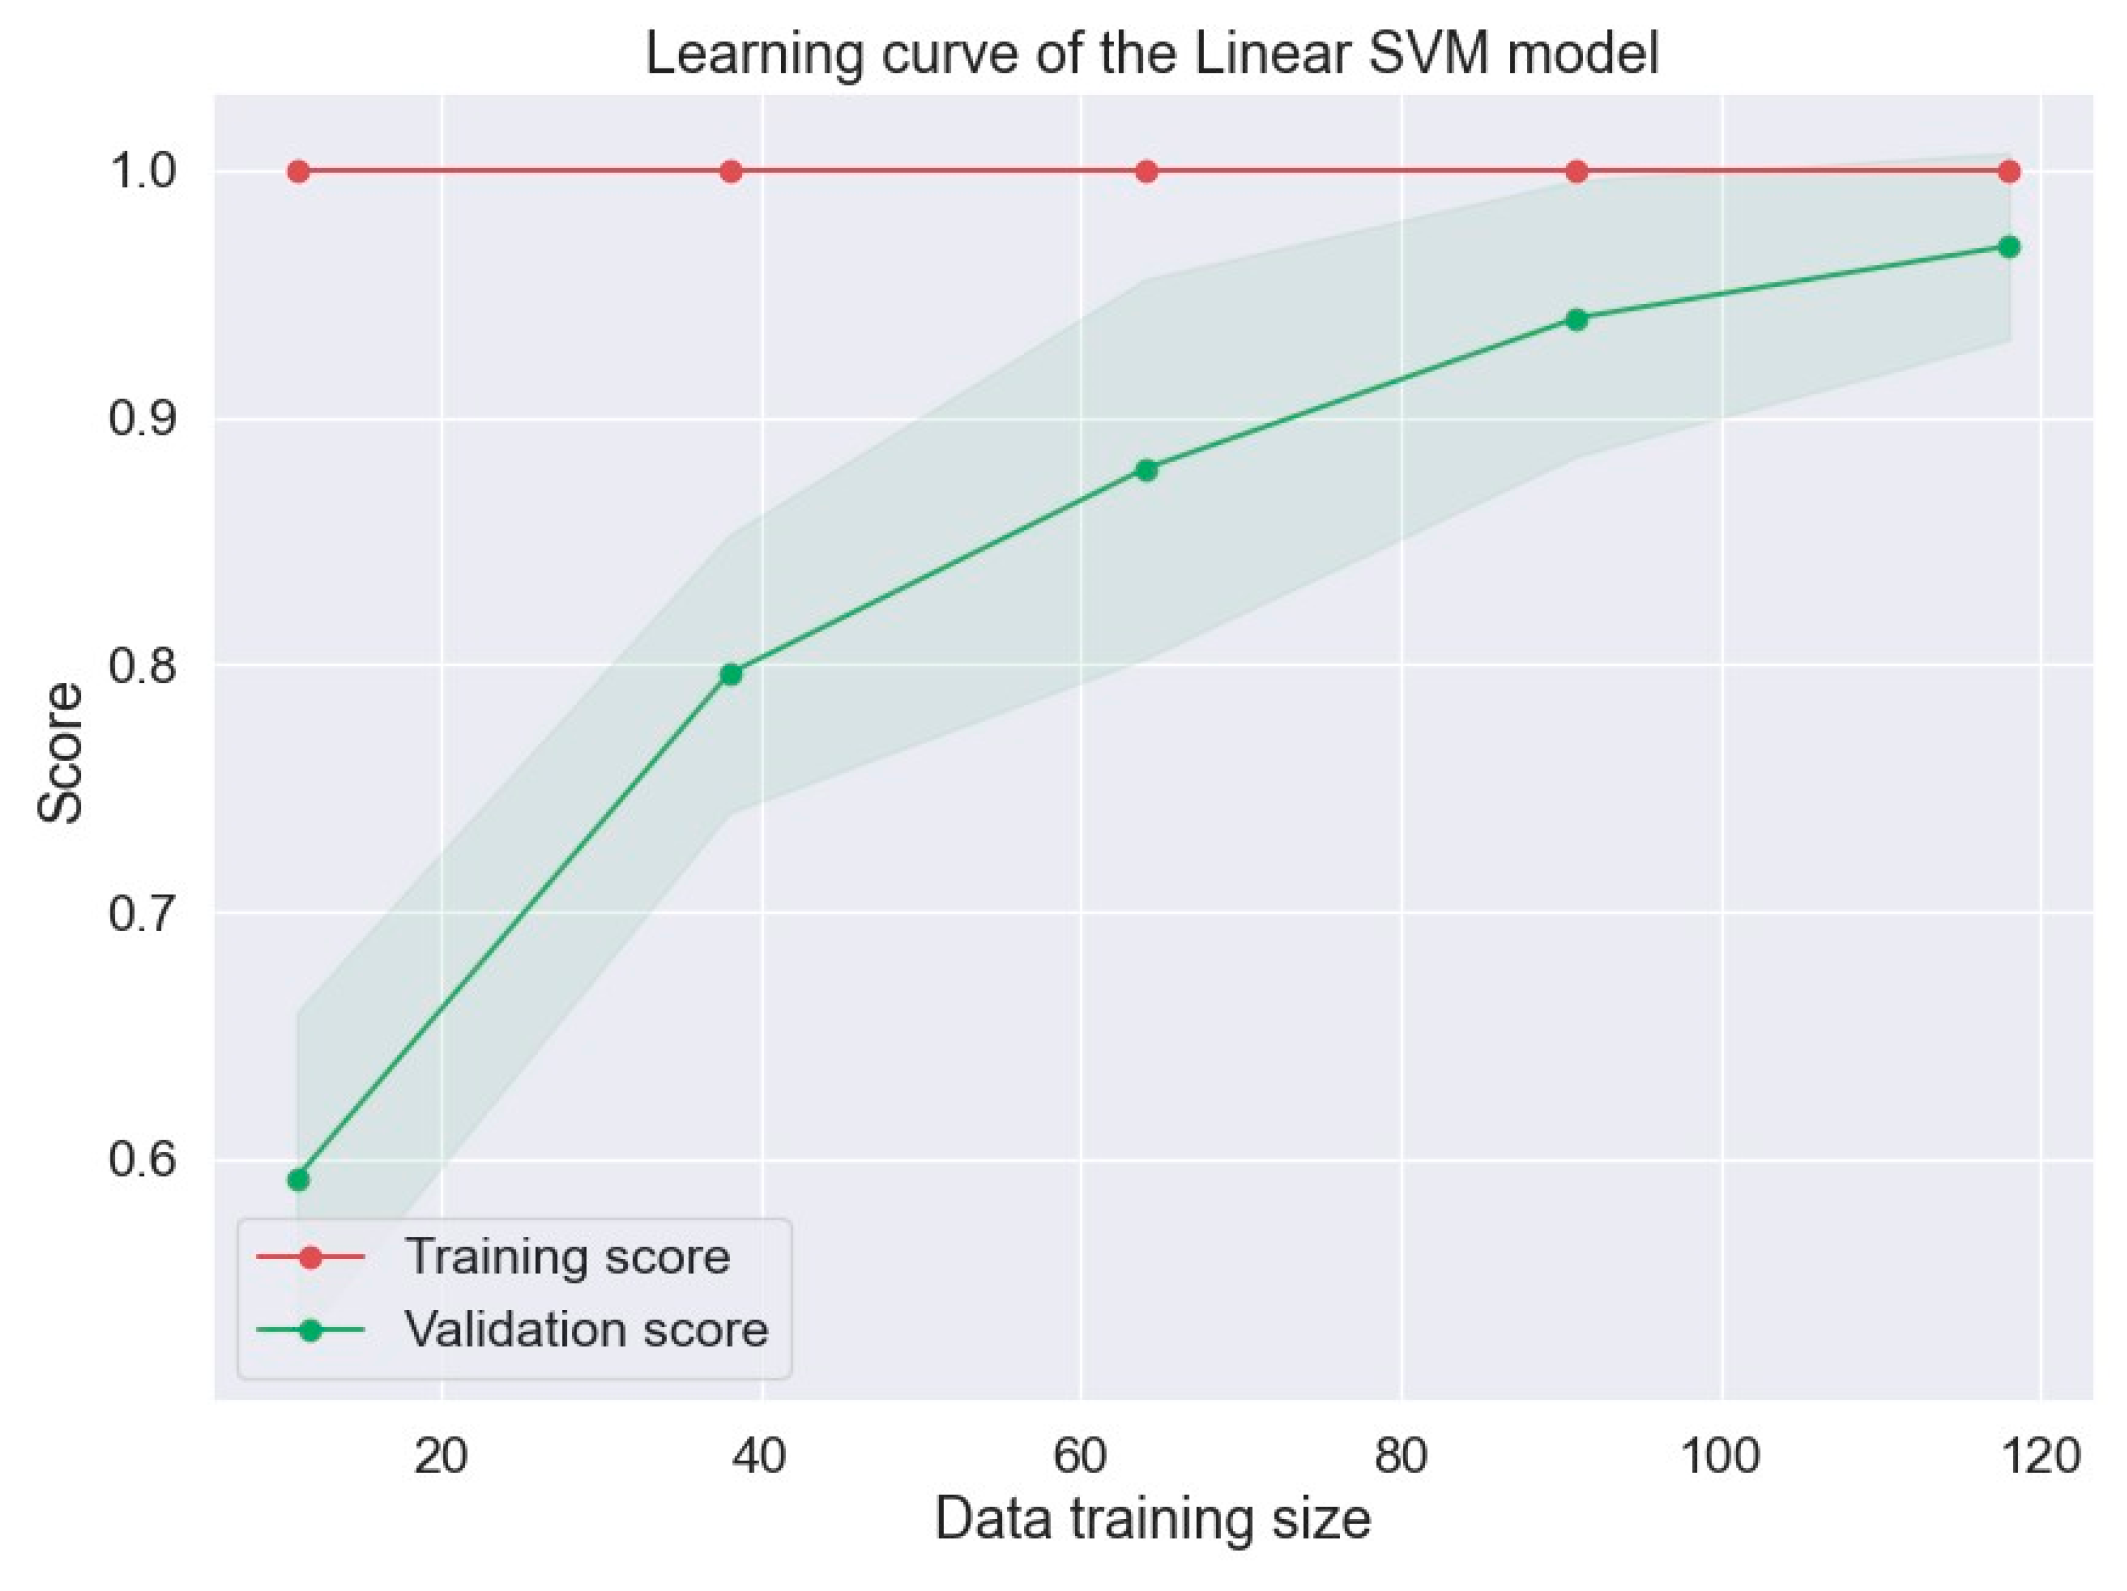
KNN and MLPC are the ones that provide the best results. However, when analyzing the results of the cross-validation metrics, the KNN model could not have learned better or presented an underfitting. To make it easier to see if the model is overfitting or underfitting, and to obtain a better understanding of this,
Figure 4 shows the learning curves of each model, where each curve represents how each model learned by comparing the training data with the test data.
In
Figure 4, we observed that the model that learns best is the SVM model; however, since the validation metrics values are low, we need to obtain the best results. When analyzing the graph corresponding to KNN, the validation curve is not close to the learning curve, so we inferred that the model is not correctly adjusted.
In the case of the MLPC model, both curves approach each other at the point where we reach 120 input data. Furthermore, the cross-validation metric for this model is 90.16%, and the accuracy obtained in the testing phase was 90.9%. The best result of fitting the model to the dataset is when there is a difference of less than 1%.
After applying PCA to the original dataset, the model that obtained the best results was the MLPC.
Figure 5 compares the MLPC of this work and the RF of the previous paper. However, these results are optional, so we searched for the best hyperparameters.
4.3. Applications of Hyperparameters
Considering the results in
Section 4.2, we observed that those obtained in [
1] do not improve. The hyperparameters of the different, previously created ML models are analyzed in this subsection to determine if improving performance metrics is possible after applying PCA.
ML models such as DT, RF, SVM, KNN, and MLPC involve several of the hyperparameters we set before running. In contrast to direct, first-level model parameters determined during training, these second-level tuning parameters must often be carefully optimized to achieve maximal performance [
18].
To select an appropriate hyperparameter configuration for the specific dataset at hand, users of ML algorithms can resort to default values of hyperparameters specified in implementing software packages, or manually configure them, for example, based on recommendations from the literature, experience, or trial and error [
18].
There are many techniques with which to search for hyperparameters, from a simple grid or random search to iterative procedures or iterated F-racing [
18]. This work uses simple grid and random search techniques to search for hyperparameters, training the models with the PCA dataset.
In
Appendix A,
Table A2, shows the different ML models’ input variables, data types, and hyperparameters, with their possible values. After an exhaustive search, the best hyperparameters found for the PCA dataset are show in
Table 6:
5. Results Discussion
In this section, we delve deeper into the outcomes of our study regarding service classification in 5G/B5G networks after applying PCA and hyperparameters. We present the confusion matrices and the performance metrics. Moreover, we conduct a direct comparison with the results of a previous study. This analysis phase is pivotal as it allows us to comprehend our approach’s effectiveness and relevance in the context of next-generation networks.
A distinctive aspect of our research is the direct comparison with a prior study that addressed service classification in 5G/B5G networks without applying PCA. This comparison offers a clear insight into how dimensionality reduction through PCA influences the performance of SL algorithms. The outcomes of this comparison are pivotal to determining the effectiveness of our approach and its impact on the current state of research in this field.
Figure 6 shows the confusion matrices obtained from these models.
Now, we applied Equations (1)–(5) of the metrics obtained from the confusion matrix to evaluate the performance of the predictive models with the hyperparameters.
Table 7 shows the results.
Figure 7 shows the learning curve of the SVM algorithm with hyperparameters. So, we can see now that the SL algorithm was learning well with the validation set of data (X test and Y test).
We obtained better results than those shown in previous research work.
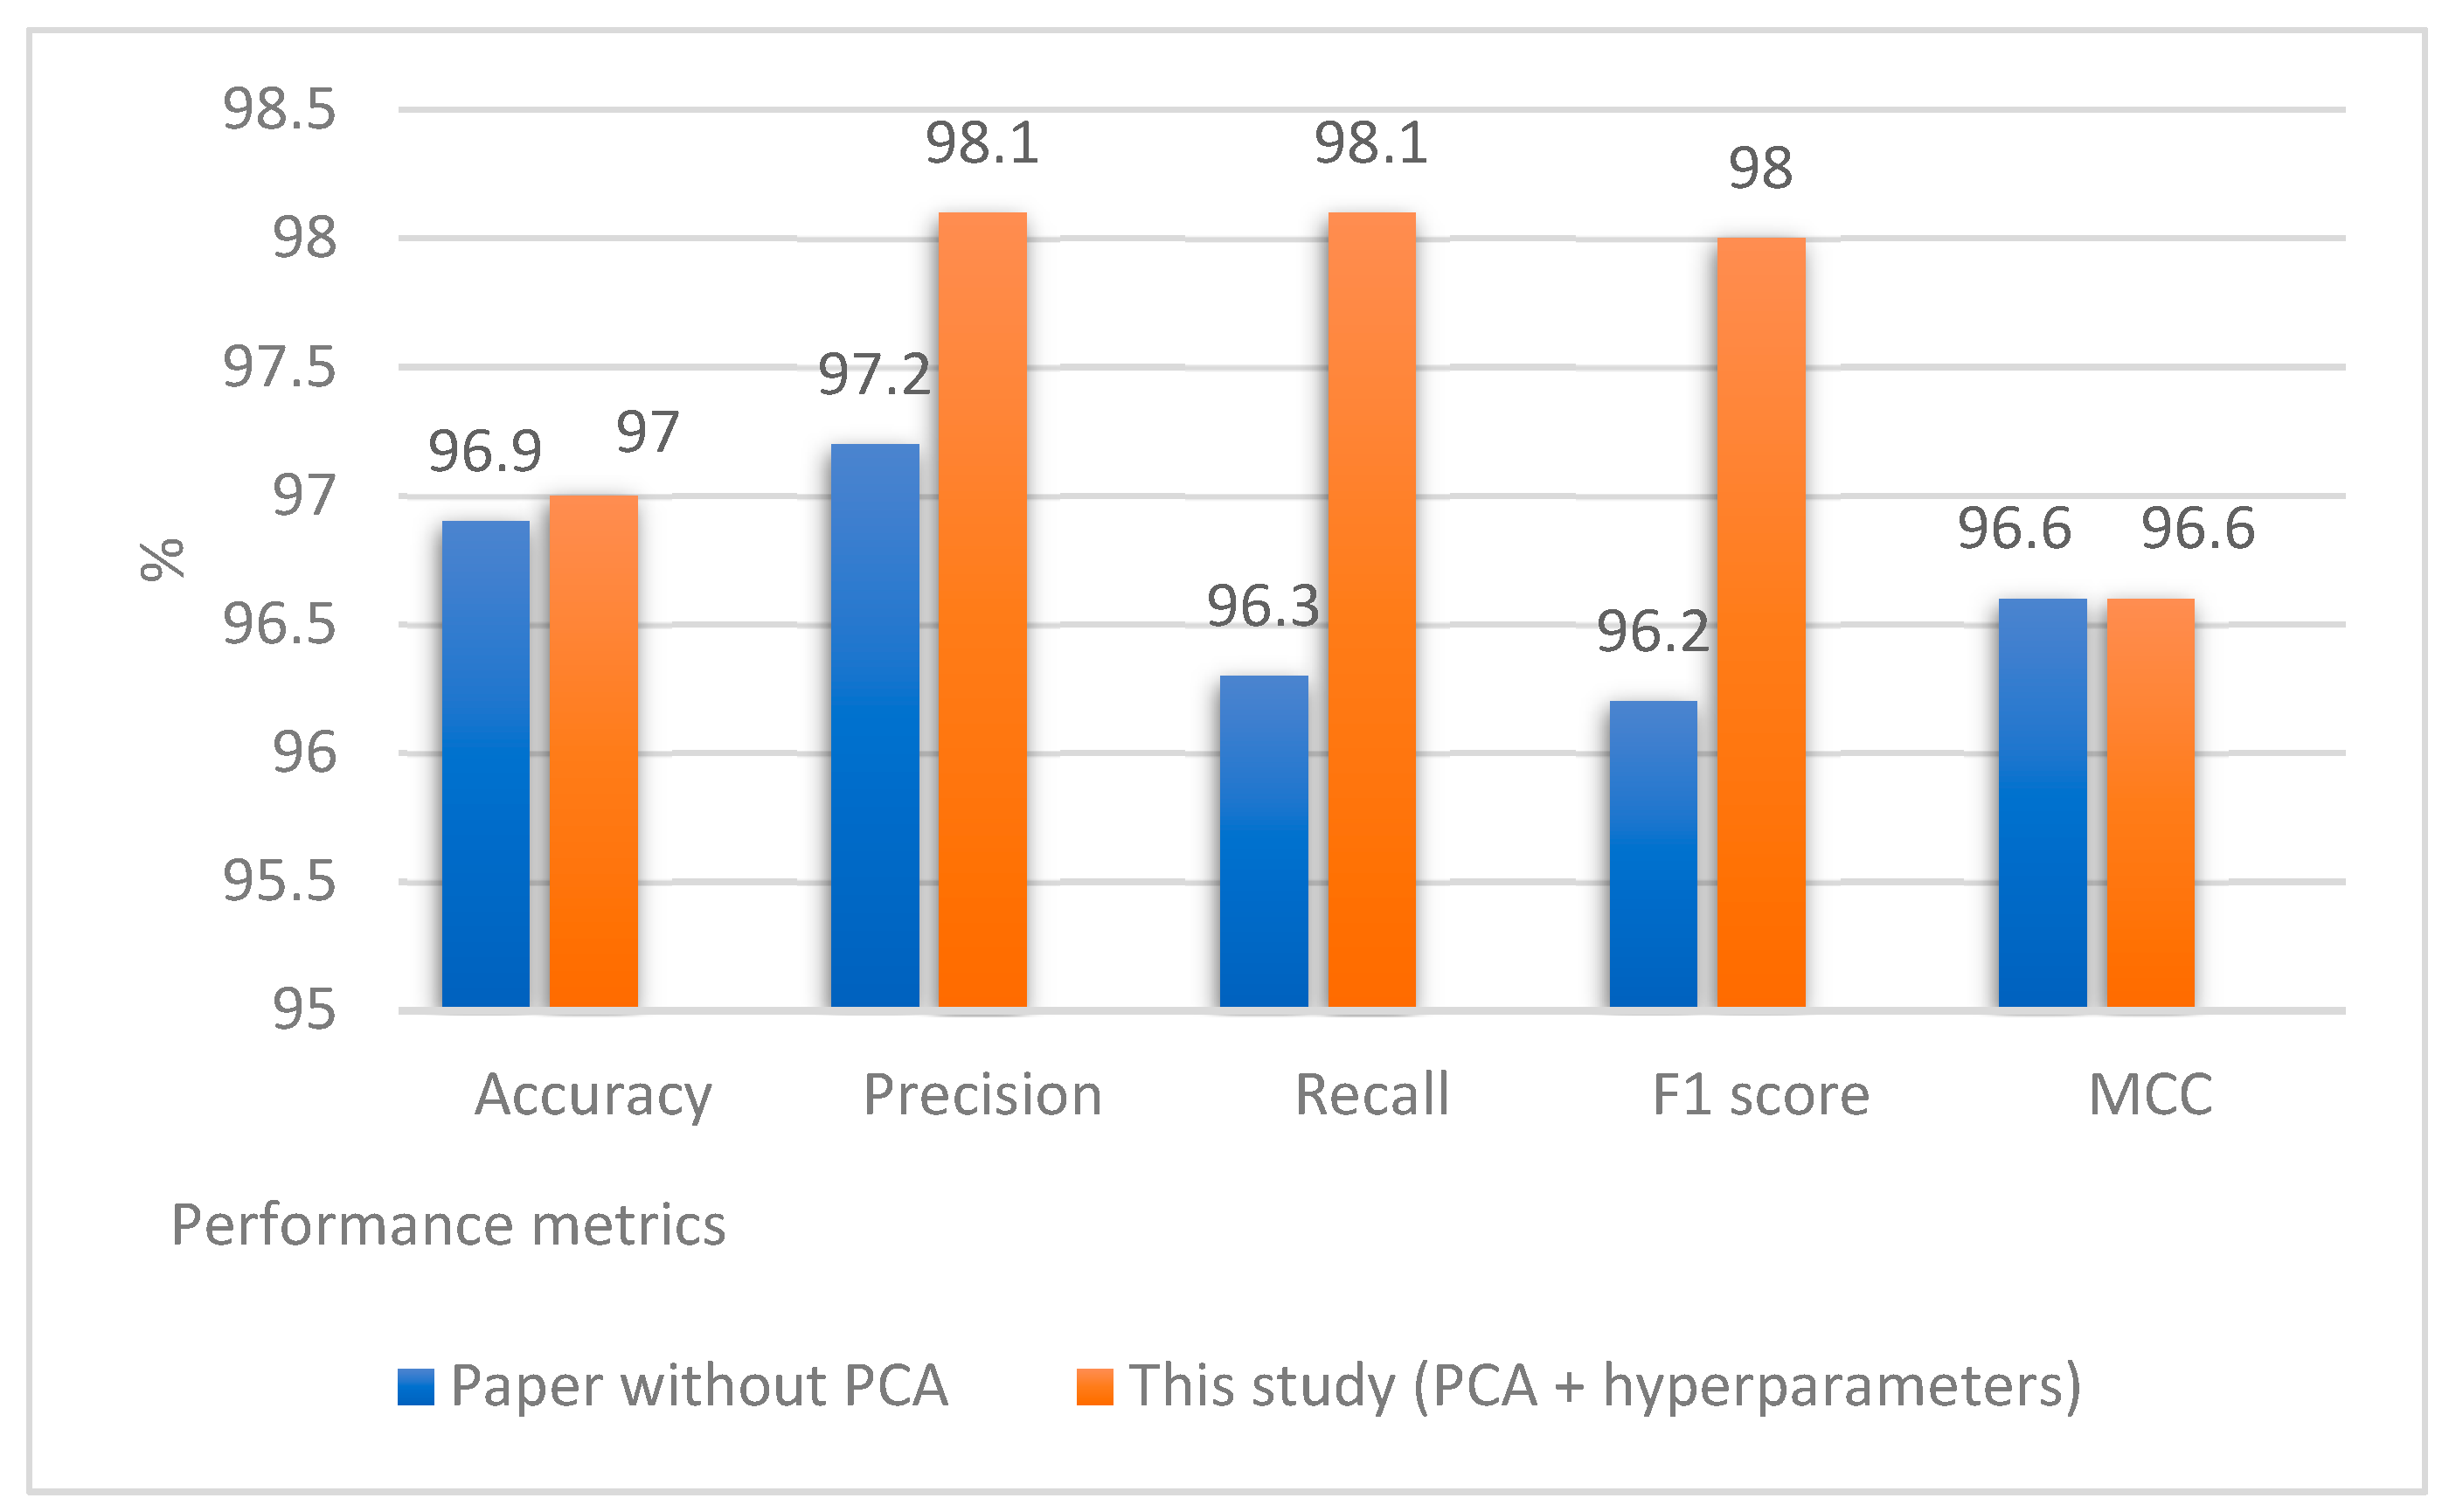
Figure 8 shows a comparative table between the SVM model, which obtained the best results in this work, and the RF from previous studies.
Research Applicability
Our research results can benefit various application areas of network management and telecommunications service providers. The areas of applicability of this work are as follows:
Improvement of QoS in new generation networks: Through dimensionality reduction using PCA and the search for hyperparameters, it allows for a more precise and efficient classification of services. Our approach directly impacts the end-user experience by ensuring reliability and efficiency in the delivery of network services. Users of 5G/B5G services will experience more robust connectivity and greater satisfaction due to improved QoS.
Efficiency in resource usage: By finding the best hyperparameters for SL algorithms, we optimize a future resource allocation with economic and operational implications. Network service providers can achieve more efficient use of available resources, reducing costs and improving their operations’ sustainability by not over-allocating network resources.
SLA compliance: Our research work can significantly reduce errors in service classification. This process is essential to ensuring that SLAs are consistently met and that service providers deliver on their service quality promises to customers. Reduced errors benefit end-users and businesses by minimizing interruptions and improving service reliability.
Future Research: The results and approaches presented in this work serve as a starting point for additional research seeking to improve next-generation network efficiency and quality. Researchers and professionals in the field of telecommunications can leverage these results to drive technological advances and address emerging challenges in 5G/B5G networks.
6. Conclusions
In summary, in this work, a service classification analysis was conducted in 5G/B5G networks using a dataset containing KPI and KQI variables. Principal component analysis (PCA) was applied to effectively reduce the dimensionality of the dataset while employing the same ML classification algorithms (DT, RF, SVM, KNN, MLPC) as in [
1]. The results indicate that the MLPC algorithm achieved an accuracy of 90.9% and a Matthews correlation coefficient of 89.5%. While these results are relevant and satisfactory, they did not surpass the performance metrics obtained in prior research.
As demonstrated in
Figure 4, the initial application of these algorithms revealed suboptimal learning outcomes. In response, we undertook an exploration of hyperparameters for the ML algorithms. Following that, the hyperparameters were fine-tuned and subsequently implemented, resulting in notable enhancements in performance. Notably, the SVM algorithm exhibited a precision of 98.1% and an F1 score of 98%.
Figure 8 directly compares the SVM result and the earlier findings.
In conclusion, this study underscores the critical role of PCA analysis and hyperparameter optimization in service classification within 5G/B5G networks. It is important to note that a more precise service classifier directly translates into improved quality of service (QoS), ensuring that users experience higher performance and reliability standards, and thereby meeting and surpassing the expectations outlined in service-level agreements (SLA). These insights are poised to significantly enhance the QoS and ensure SLA compliance in next-generation network environments.
The main limitation of this research is the lack of a public 5G dataset that contains real measurements of QoS parameters from service providers. Service providers do not often share their networks’ operational data, making it challenging to find operational data, which is why synthetic datasets are used. In future work, an area of interest will be the ability to execute ML algorithms to classify services according to performance and quality parameters extracted from operators.
In future work, we will consider the implementation of dynamic PCA, an adaptive approach that can dynamically adjust PCA parameters to suit evolving network conditions.
Author Contributions
Conceptualization, J.E.P.-V., J.E.L.-R. and J.D.G.-F.; Methodology, J.D.G.-F., J.E.P.-V. and J.T.-R.; Software, J.D.G.-F.; Validation, R.R.-R., J.T.-R. and M.A.A.-A.; data curation, J.D.G.-F. and J.E.P.-V.; writing—original draft preparation, J.D.G.-F., J.E.P.-V. and J.E.L.-R.; writing—review and editing, J.E.L.-R., R.R.-R., M.A.A.-A. and J.T.-R. All authors have read and agreed to the published version of the manuscript.
Funding
This research was funded by the Centro de Investigacion Cientifica y de Educacion Superior de Ensenada, Baja California (CICESE), Mexico, and the Consejo Nacional de Humanidades, Ciencias y Tecnologias (CONAHCYT), Mexico.
Data Availability Statement
The data that support the findings of this study are available from the corresponding author, upon reasonable request.
Acknowledgments
The authors would like to thank to the CICESE and the CONAHCYT for their support.
Conflicts of Interest
The authors declare no conflict of interest.
Appendix A
Table A1.
Fragment of ten entries of the PCA dataset.
Table A1.
Fragment of ten entries of the PCA dataset.
| PC1 | PC2 | PC3 | PC4 | PC5 | PC6 | PC7 | PC8 | PC9 | Service |
|---|
| 2.5756558 | 0.24621559 | −1.35927118 | 3.23078901 | 1.09972575 | −0.69121917 | −0.73070834 | −1.16510564 | −0.00452683 | UHD_Video_Streaming |
| 3.19269459 | 0.46629112 | −1.93486147 | 1.82095405 | 1.18999224 | −0.45830314 | −0.1137988 | −1.13037469 | 0.87825037 | UHD_Video_Streaming |
| 3.68179527 | −0.11216349 | 1.42957963 | −1.12968081 | −0.34314677 | 0.06361543 | −0.18534234 | 0.44228557 | −0.1214715 | Immerse_Experience |
| −0.2956968 | −0.3660506 | −1.53749501 | −1.18555701 | 0.84736679 | 0.01813633 | −0.74932499 | 0.61125113 | 0.27002474 | Smart_Grid |
| −2.1886923 | 1.654586 | 0.90803809 | 0.96660038 | −0.8333005 | 0.66169658 | −0.92042026 | −0.12399808 | −1.37094177 | ITS |
| −2.3979213 | 1.74833131 | 2.18157625 | 1.22849353 | 2.49116385 | −0.34653657 | −0.58041048 | 0.71969267 | 0.25472965 | Vo5G |
| 3.6678642 | 0.19525714 | 1.72733445 | −0.77410883 | −0.62850646 | 0.11037757 | −0.08152386 | −0.06107831 | 0.08985644 | Immerse_Experience |
| −0.4308387 | −2.43457613 | 0.51735842 | 0.53574906 | −0.52068866 | −0.77749575 | 0.29709111 | 0.02079445 | 0.0129068 | e_Health |
| −0.7316077 | −2.54502195 | 0.36201518 | 0.21264354 | −0.46036545 | −0.62669515 | 0.29703591 | 0.42173884 | 0.05331082 | Connected_Vehicles |
| −0.2116078 | −1.18875613 | −1.44643445 | −0.92424323 | 0.25153326 | −0.56259378 | −0.27871799 | 0.59457551 | −0.10843045 | Industry_Automation |
Table A2.
Hyperparameters of the algorithms.
Table A2.
Hyperparameters of the algorithms.
| SL Algorithms | Hyperparameters | Type | Lower | Upper | Values |
|---|
| DT | criterion
max_depth
min_samples_split | string
numeric
numeric | -
2
2 | -
16
10 | gini, entropy
2, 4, 6, 8, 10, 16
2, 4, 6, 8, 10 |
| RF | criterion
max_depth
min_samples_split
n_estimators | string
numeric
numeric
numeric | -
None
2
10 | -
20
10
100 | gini, entropy
None, 5, 10, 20
2, 5, 10
10, 50, 100 |
| SVM | kernel
C parameter | string
numeric | -
| -
| linear, poly, sigmoid, rbf
to |
| KNN | n_neighbors
weights
algorithm
p | numeric
string
string
numeric | 3
-
-
1 | 11
-
-
2 | 3, 5, 7, 9, 11
uniform, distance
auto, ball_tree, kd_tree, brute
1, 2 |
| MLPC | hidden_layer_sizes
activation
alpha
solver
max_iter | matrix
string
numeric
string
numeric | -
-
0.0001
-
10 | -
-
1
-
3000 | (50, 50, 50), (50, 100, 50), (100,)
identity, logistic, tanh, relu
0.0001, 0.05, 0.1, 1
sgd, adam
10 to 3000 |
References
- Preciado-Velasco, J.E.; Gonzalez-Franco, J.D.; Anias-Calderon, C.E.; Nieto-Hipolito, J.I.; Rivera-Rodriguez, R. 5G/B5G service classification using supervised learning. Appl. Sci. 2021, 11, 4942. [Google Scholar] [CrossRef]
- Sufyan, A.; Khan, K.B.; Khashan, O.A.; Mir, T.; Mir, U. From 5G to beyond 5G: A Comprehensive Survey of Wireless Network Evolution, Challenges, and Promising Technologies. Electronics 2023, 12, 2200. [Google Scholar] [CrossRef]
- Gökarslan, K.; Sandal, Y.S.; Tugcu, T. Towards a URLLC-Aware Programmable Data Path with P4 for Industrial 5G Networks. In Proceedings of the 2021 IEEE International Conference on Communications Workshops (ICC Workshops), Montreal, QC, Canada, 14–23 June 2021; pp. 1–6. [Google Scholar] [CrossRef]
- Valanarasu, R.; Christy, A. Comprehensive Survey of Wireless Cognitive and 5G Networks. J. Ubiquitous Comput. Commun. Technol. 2019, 1, 23–32. [Google Scholar] [CrossRef]
- Amjad, M.; Musavian, L.; Rehmani, M.H. Effective Capacity in Wireless Networks: A Comprehensive Survey. IEEE Commun. Surv. Tutor. 2019, 21, 3007–3038. [Google Scholar] [CrossRef]
- Shlens, J. A Tutorial on Principal Component Analysis. Educational 2014, 51. [Google Scholar] [CrossRef]
- Xia, Z.; Chen, Y.; Xu, C. Multiview PCA: A Methodology of Feature Extraction and Dimension Reduction for High-Order Data. IEEE Trans. Cybern. 2022, 52, 11068–11080. [Google Scholar] [CrossRef] [PubMed]
- Mithillesh Kumar, P.; Supriya, M. Throughput Analysis with Effect of Dimensionality Reduction on 5G Dataset using Machine Learning and Deep Learning Models. In Proceedings of the 2022 International Conference on Industry 4.0 Technology (I4Tech), Pune, India, 23–24 September 2022; pp. 1–7. [Google Scholar] [CrossRef]
- Qi, L.; Dou, W.; Chen, J. Weighted principal component analysis-based service selection method for multimedia services in cloud. Computing 2016, 98, 195–214. [Google Scholar] [CrossRef]
- Taloba, A.I.; Eisa, D.A.; Ismail, S.S. A Comparative Study on using Principle Component Analysis with different Text Classifiers. Int. J. Comput. Appl. 2018, 180, 1–6. [Google Scholar] [CrossRef]
- Qureshi, H.N.; Manalastas, M.; Zaidi, S.M.A.; Imran, A.; Al Kalaa, M.O. Service Level Agreements for 5G and Beyond: Overview, Challenges and Enablers of 5G-Healthcare Systems. IEEE Access 2021, 9, 1044–1061. [Google Scholar] [CrossRef]
- Maneno, K.M.; Rimiru, R.; Otieno, C. Segmentation via principal component analysis for perceptron classification. In Proceedings of the 2nd International Conference on Intelligent and Innovative Computing Applications, ACM, New York, NY, USA, 24–25 September 2020; pp. 1–8. [Google Scholar] [CrossRef]
- Beattie, J.R.; Esmonde-White, F.W.L. Exploration of Principal Component Analysis: Deriving Principal Component Analysis Visually Using Spectra. Appl. Spectrosc. 2021, 75, 361–375. [Google Scholar] [CrossRef] [PubMed]
- Hossin, M.; Sulaiman, M.N. A Review on Evaluation Metrics for Data Classification Evaluations. Int. J. Data Min. Knowl. Manag. Process 2015, 5, 1–11. [Google Scholar] [CrossRef]
- Chicco, D.; Jurman, G. The advantages of the Matthews correlation coefficient (MCC) over F1 score and accuracy in binary classification evaluation. BMC Genom. 2020, 21, 6. [Google Scholar] [CrossRef]
- Liyanapathirana, L. Classification Model Evaluation. 2018. Available online: https://heartbeat.fritz.ai/classification-model-evaluation-90d743883106 (accessed on 8 October 2023).
- Anonimous. Cross-Validation: Evaluating Estimator Performance. Scikit-Learn. 2020, pp. 1–10. Available online: https://scikit-llearn.org/stable/modules/cross_validation.html# (accessed on 8 October 2023).
- Probst, P.; Bischl, B.; Boulesteix, A.-L. Tunability: Importance of Hyperparameters of Machine Learning Algorithms. Mach. Learn. 2018. [CrossRef]
| Disclaimer/Publisher’s Note: The statements, opinions and data contained in all publications are solely those of the individual author(s) and contributor(s) and not of MDPI and/or the editor(s). MDPI and/or the editor(s) disclaim responsibility for any injury to people or property resulting from any ideas, methods, instructions or products referred to in the content. |
© 2023 by the authors. Licensee MDPI, Basel, Switzerland. This article is an open access article distributed under the terms and conditions of the Creative Commons Attribution (CC BY) license (https://creativecommons.org/licenses/by/4.0/).


 ,
, 


