Unveiling the Landscape of Operating System Vulnerabilities


Department of Electrical Engineering and Computer Science, Howard University, Washington, DC 20059, USA
*
Author to whom correspondence should be addressed.
Future Internet 2023, 15(7), 248; https://doi.org/10.3390/fi15070248
Submission received: 15 June 2023
/
Revised: 20 July 2023
/
Accepted: 20 July 2023
/
Published: 24 July 2023
(This article belongs to the Section Smart System Infrastructure and Applications)
Abstract
:Operating systems play a crucial role in computer systems, serving as the fundamental infrastructure that supports a wide range of applications and services. However, they are also prime targets for malicious actors seeking to exploit vulnerabilities and compromise system security. This is a crucial area that requires active research; however, OS vulnerabilities have not been actively studied in recent years. Therefore, we conduct a comprehensive analysis of OS vulnerabilities, aiming to enhance the understanding of their trends, severity, and common weaknesses. Our research methodology encompasses data preparation, sampling of vulnerable OS categories and versions, and an in-depth analysis of trends, severity levels, and types of OS vulnerabilities. We scrape the high-level data from reliable and recognized sources to generate two refined OS vulnerability datasets: one for OS categories and another for OS versions. Our study reveals the susceptibility of popular operating systems such as Windows, Windows Server, Debian Linux, and Mac OS. Specifically, Windows 10, Windows 11, Android (v11.0, v12.0, v13.0), Windows Server 2012, Debian Linux (v10.0, v11.0), Fedora 37, and HarmonyOS 2, are identified as the most vulnerable OS versions in recent years (2021–2022). Notably, these vulnerabilities exhibit a high severity, with maximum CVSS scores falling into the 7–8 and 9–10 range. Common vulnerability types, including CWE-119, CWE-20, CWE-200, and CWE-787, are prevalent in these OSs and require specific attention from OS vendors. The findings on trends, severity, and types of OS vulnerabilities from this research will serve as a valuable resource for vendors, security professionals, and end-users, empowering them to enhance OS security measures, prioritize vulnerability management efforts, and make informed decisions to mitigate risks associated with these vulnerabilities.
1. Introduction
An operating system (OS) is the backbone of a computer system, serving as the interface between users, applications, and hardware components to communicate and function seamlessly. All the activities, ranging from simple mouse click events and keyboard keystrokes to complex applications like graphics design or gaming, are controlled and governed by the OS. However, OSs are prone to security vulnerabilities that pose significant challenges, potentially leading to system breaches, data leaks, and unauthorized access. For instance, a recent security vulnerability [1] published by Microsoft on 14 February 2023 shows the Denial of Service (DoS) vulnerability in many of its products, including Windows 10, Windows 11, Windows Server 2022, etc., with the overall base severity score of 7.5/10. Such vulnerabilities can help attackers to exploit OSs and conduct malicious activities, for instance, the Google security research team reported the DoS vulnerability being exploited by the attackers in the Ubuntu Linux OS [2]. To protect the vulnerabilities from being exploited, OS vendors often release security updates and patches to secure their OS from being exploited. Despite the security fixes and strong protection by the corresponding vendors, thousands of OS vulnerabilities are reported each year [3]. Therefore, it is quite important to understand the vulnerabilities and their trends, severity, and types.
Understanding the landscape of OS vulnerabilities is crucial from multiple perspectives. Firstly, it enables OS vendors to identify and address vulnerabilities within their products, thereby enhancing the security and resilience of their OSs. This research aims to provide OS vendors with valuable insights into the specific vulnerabilities and common weakness patterns prevalent in various OS categories and versions. Secondly, this research serves as a valuable resource for end-users. By comprehending the vulnerabilities present in popular OSs, end-users can adopt appropriate security measures to protect their systems and personal data. Understanding the types and severity of vulnerabilities empowers end-users to make informed decisions when it comes to OS selection, security configurations, and best practices. Additionally, this research contributes to the broader field of cybersecurity. By studying OS vulnerabilities, researchers can gain insights into the evolving threat landscape and develop effective strategies to counter emerging risks. It provides an opportunity to identify trends, patterns, and common vulnerability types, which can inform the development of robust security frameworks and defensive mechanisms.
In this paper, we first collect entire Common Vulnerabilities and Exposure (CVE) IDs from CVE Mitre. We clean the dataset based on different CVE statuses (reserved, rejected, disputed, etc.). Next, we scrape the data for each CVE ID from the National Vulnerability Database (NVD) website. Specifically, we collect data points such as product type, product name, product versions, vendor name, CVSS scores, and CWE ID. We then extract only those data related to OS vulnerabilities, finally creating two refined datasets, namely OS_CAT and OS_VER, specifically tailored to our research objectives. Using this dataset, we sample highly vulnerable OS categories within the time range from 1999 to 2022. Additionally, we identify highly vulnerable OS versions within the recent years of 2021 and 2022, providing insights into the current state of vulnerabilities in these OS versions. Following the sampling process, we conducted an in-depth analysis of the collected data. We study the trends in OS vulnerabilities, examining how vulnerabilities have evolved over time. We also assess the severity of vulnerabilities based on the widely adopted Common Vulnerability Scoring System (CVSS) scores. Furthermore, we analyze the types of vulnerabilities present in the OSs based on the Common Weakness Enumeration (CWE) system. By employing this rigorous methodology, we aim to provide comprehensive insights into OS vulnerabilities, their trends, severity, and common weakness patterns.
The main contributions of this paper are summarized below:
- We collect high-quality vulnerability data from the NVD and prepare two precise datasets, one for OS categories and another for OS versions.
- We identify the top 10 OS categories based on the all-time high vulnerability count (1999–2022). Furthermore, we identify the top 10 highly vulnerable OS versions in recent years (2021–2022).
- We conduct a comprehensive year-wise examination of reported vulnerabilities in our sampled OSs, spanning the period from 1999 to 2022.
- We also evaluate the severity of the identified vulnerabilities for both OS categories and OS versions using CVSS scores.
- We investigate the types of vulnerabilities mostly observed in both OS categories and OS versions.
We organize the rest of the paper as follows. In Section 2, we discuss the concepts and definitions associated with this study, followed by Section 3 where we present the literature of works related to OS security and vulnerability assessments. In Section 4, we discuss the research methodology with three broad subsections. Section 5 illustrates findings which are further divided into four broad subsections. The limitations of the research and the future works are discussed in Section 6. Finally, Section 7 summarizes and concludes the paper.
2. Background
This section describes the background definitions and concepts utilized in this study.
2.1. Common Platform Enumeration (CPE)
This is the standard approach used to recognize various classes of applications, OSs, and hardware devices among various computing assets [4]. In our study, we collect the CPE 2.3 configurations from the NVD. Given a computing product, CPE 2.3 provides the complete categorization of that product based on the following syntax:
where the category will be either ‘a’ for application, ‘h’ for hardware, or ‘o’ for OS, and lower-level product information that is not provided is marked as ‘*’. For instance, the CPE configuration for Android 10.3 is as follows:
Table 1 shows two representative entries with segregation of the CPE configuration into vendor name, OS name, and version. According to CPE, a product is termed to be under the OS class, then it needs to be an intermediary either between user and hardware or between applications and hardware [4,5]. Therefore, OS kernels or firmware also fall under the OS category in the CPE2.3 configuration. However, we filter out the OS kernels and firmware in our study and select only actual OSs.
2.2. Common Vulnerability Scoring System (CVSS)
This provides an open framework to assess computing vulnerabilities by providing standard CVSS scores. A CVSS score for the given vulnerability is calculated as follows [6]:
where base metrics represent the intrinsic characteristics of the vulnerability, temporal metrics represent the characteristics of the vulnerability that change over time, and environmental metrics refer to characteristics with respect to the user environment. The latter two metrics are optional.
The CVSS utilizes a numerical score ranging from 0 to 10 to assess the severity of vulnerabilities. A CVSS score of 0 represents a benign vulnerability with minimal or no potential for exploitation, while a score of 10 indicates the highest likelihood of being exploited. The CVSS scores are provided by the National Institute of Science and Technology (NIST) and the Common Naming Authority (CNA) based on the severity of the reported vulnerability. Originally, the Common Vulnerability Scoring System (CVSS) version 2.0 was prevalent for assessing the severity of vulnerabilities. However, since June 2019, CVSS version 3 (CVSSv3) has become the widely adopted standard for scoring vulnerability severity. Thus, in our study, we extract four CVSS scores altogether viz. CVSSv2-NIST, CVSSv2-CNA, CVSSv3-NIST, and CVSSv3-CNA [6].
2.3. Common Weakness Enumeration (CWE)
CWE incorporates the list of software and hardware weakness types developed by the community of major OS vendors, commercial information security tool vendors, academia, government agencies, and research institutions. Each classified vulnerability is assigned a CWE ID that provides the definition of vulnerability. CWE is an effective method to understand what types of vulnerabilities are more likely to occur [7]. CWE incorporates the list of software and hardware weakness types developed by the community of major OS vendors, commercial information security tool vendors, academia, government agencies, and research institutions. On a high level, CWE categorizes the weaknesses in two main views as follows:
- CWE-699: This incorporates the weaknesses encountered by developers and those with familiarity with vulnerability taxonomy.
- CWE-1000: This incorporates the research concepts where the research academic researchers create a framework to classify the weaknesses.
Any newly discovered or classified vulnerability has a unique CWE identified (CWE-ID) and falls under either of these two categories. In our study, we extract the lower-level CWE IDs such that we can extract the more specific vulnerability type.
3. Related Work
Prevailing vulnerabilities in OSs have opened up a wide research scope. In the literature, multiple works have been performed on OS vulnerability assessment. Vander et al. in [8] have discussed different types of cyberattacks that OS categories can face. The paper compiles various charts with respect to cyberattacks from multiple sources. Similarly, Kocaman et al. [9] presented a method to compare the CVE record with the OS’s package with the intent of identifying the openness status of the OS. Similarly, the authors of [10] leveraged CVE and CWE definitions to present the attack dynamics by producing multiple visualizations. This work is different from our paper since they create the tool to generate attack graphs, whereas our work is mainly focused on studying the potential attack types based on CWE-IDs. The other similar research includes individual vulnerability assessments, i.e., studies specific to Windows [11], Linux [12], Android [13], etc. The specific study does not provide the big picture of OS security or where the specific OS stands in the vulnerabilities study. Performing a comparative vulnerability assessment of the OSs utilized by end-users is of significant importance when considering OS security. Kaluarachchilage et al. proposed the quantitative analysis of the vulnerability risk of OSs [14]. This research has provided good statistical grounds; however, it lacks the study of trends and types of vulnerabilities and real-world exploits. Furthermore, the above research works do not discuss the trends and severity of the OS versions over a range of years that play a crucial role in understanding the OS vulnerability landscape. On the other hand, the authors of [15] have used a similar sampling strategy of considering CVE entries to select the top 10 vulnerable IoT device categories. Our work employs a similar sampling mechanism; however, it is related to the OS landscape.
The most recent similar research was conducted in 2016 by Gorbenko et al., where they explored the vulnerabilities in enterprise OSs up until 2016 [3]. The same authors discussed intrusion-tolerant architectures with vulnerabilities until 2017 [16]. The literature lacks the study of OS vulnerability assessments in terms of trends, severity, and types in recent years (2017–present). Additionally, our research has found that this time range is the prime years when the vulnerabilities are mostly seen in OSs. This indicates a large research gap and the need for in-depth research on the study of OS vulnerabilities. Addressing this research gap, our paper presents the most recent and up-to-date research on overall OS vulnerability assessments.
4. Research Methodology
Our research focuses on the assessment of different OS vulnerabilities. Different stages of our research are explained in the subsections below.
4.1. Data Collection and Processing
Data collection is a crucial part of our research methodology. The overall data analysis consists of precise numbers, and therefore the data need to be authentic and reliable.
4.1.1. Data Sources: CVE Mitre and NVD
We collected the CVE IDs for the data extraction from Common Vulnerabilities and Exposure (CVE) Mitre. In CVE Mitre, each vulnerability report is thoroughly studied by the security team and provided with a CVE ID, i.e., every vulnerability report has a unique CVE ID. All these CVE IDs along with their description are updated daily by the CVE Mitre Corporation, and the overall data are maintained on their official website https://www.cve.org/Downloads accessed on 28 June 2023. Since the data are updated regularly, it is quite important to note the exact timestamp of the collected data. We downloaded a total of 274073 unique CVE entries as a single CSV file from CVE Mitre on 28 June 2023 22:32:46:334345 timestamp. This research was conducted in early 2023, so we did not have enough data for 2023; hence, we retained only those data within the range of 1999 to 2022. At the time of the download, there was a total of 278,146 CVE entries, and after excluding 20673 CVE entries for the year 2023, we were left with a total of 257,473 data entries consisting of CVE IDs and their corresponding description until 2022. We downloaded the CVE Mitre data only to collect the CVE IDs, since these do not provide the required information. Therefore, the next challenging task was to leverage the collected CVE IDs to scrape further valuable information from the National Vulnerability Database (NVD).
The National Vulnerability Database (NVD) https://nvd.nist.gov accessed on 29 June 2023, is a platform recognized by the US government and therefore is authentic and reliable. The NVD provides complete reported details about the CVE ID. We used the CVE entries from CVE Mitre and prepared a Python script using the BeautifulSoup library to scrape the corresponding details of the entire CVE entries according to Algorithm 1. We collected product type, product name, vendor name, vulnerable versions, CWE IDs, and CVSS scores. Each CVE entry may change over time, and therefore we also recorded the timestamp at the time of individual data scraping from the NVD. The entire web scraping was conducted in 2 days starting from 29 June 2023 to 30 June 2023.
4.1.2. Data Scraping Method
Algorithm 1 shows the method of data scraping from the NVD website using the CVE IDs collected from CVE Mitre. An example of main_url for CVE-2019-15222 is as follows: https://nvd.nist.gov/vuln/detail/CVE-2019-15222 accessed on 28 June 2023.
Information about any CVE ID can be extracted by placing the CVE ID at the end of the main_url. We used requests, BeautifulSoup, and pandas libraries to perform the data scraping and cleaning. In each step, different attributes of “id”, “class”, etc., were used to scrape the corresponding data. For instance, the CVSS scores lie in the “div” block with the attribute of “id” = “vulnCvssPanel”. The function get_warning_text checks for the warning status name with attribute “data-testid” = “vuln-warning-status-name”. The warning texts can be rejected, awaiting_analysis, undergoing_analysis, deferred, etc., based on the provided status. In a similar manner, we created the get_cvss_scores method to extract the CVSSv3-NIST, CVSSv3-CNA, CVSSv2-NIST, and CVSSv2-CNA. The function get_cwe collects the CWE ID if present in the main_url. Finally, the product_type, product_name, vendor, and corresponding versions are extracted using get_all_products_data method. We created this method by extracting the CPE2.3 records present in the main_url and splitting the required products’ data. Each extraction was followed by the timestamp since the data may change over time. There were 278,146 CVE entries to scrape; therefore, we leveraged Python’s multiprocessing library to run the scraping algorithm in parallel.
| Algorithm 1 Data Collection Pseudocode |
 |
4.1.3. Data Decomposition
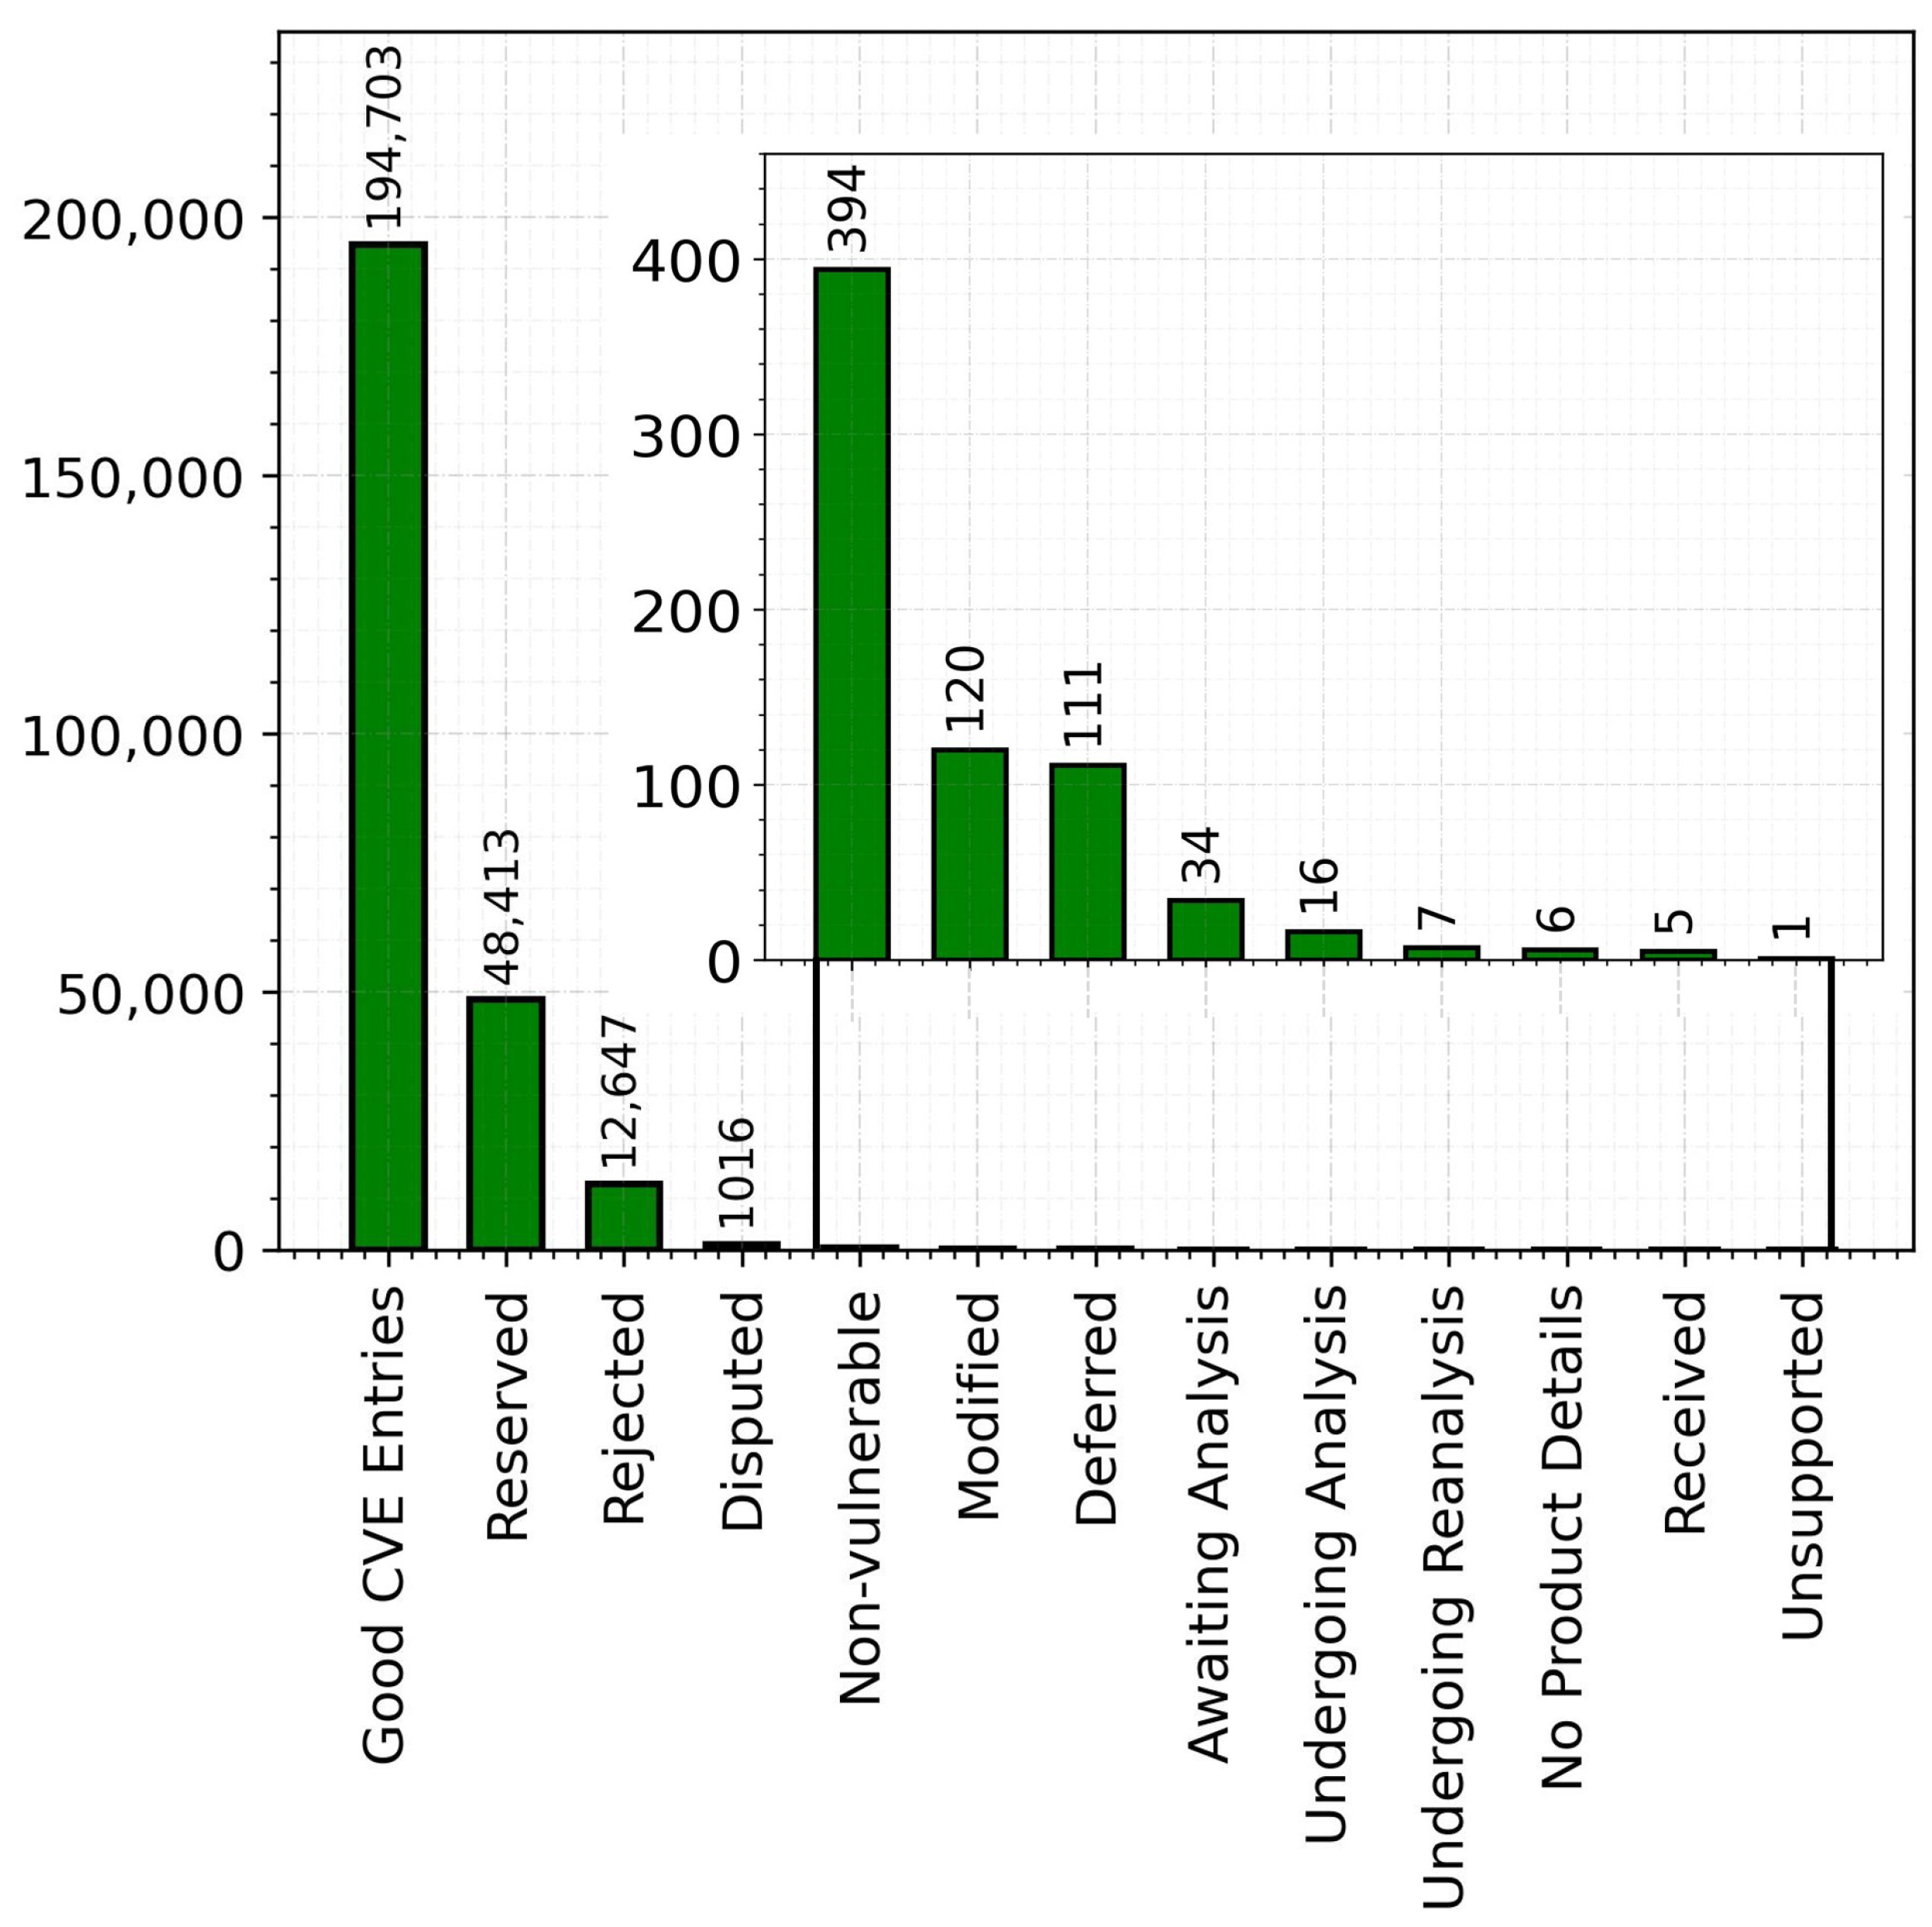
All CVE entries may not be good CVE entries; therefore, we segregated the collected data into multiple categories based on the CVE and NVD statuses https://nvd.nist.gov/vuln/vulnerability-status accessed on 28 June 2023. Figure 1 shows the number of good CVE entries and different other categories of CVE entries that do not provide useful information explained below.
- Reserved
This is the category of CVE records that has been reserved for utilization by a CVE Numbering Authority (CNA) or security researchers. The details of such reserved CVE records are not published and analyzed by NVD. In our collected data, we found 48,413 reserved CVE entries and removed them from our collected data pool since we could not extract any information from them.
- Rejected
A CVE Record is classified as “REJECT” when it is not accepted as a valid CVE Record. This rejection may occur due to reasons such as the withdrawal of the original request, incorrect assignment, or other administrative factors. We found 12,647 CVE records in the “REJECT” status and removed them from our data pool.
- Disputed
When there is a disagreement between two parties regarding the classification of a specific issue as a vulnerability, then the CVE record assigned to that issue is “DISPUTED”. We found 1016 disputed CVE records at the time of our data collection and excluded those records from the analysis.
- Modified
When a CVE record is updated in the source, then it is termed as “MODIFIED” in the NVD. Any modified CVE record with at least one valid and vulnerable CPE configuration is included in our analysis since they were vulnerable at some point in time. However, we found 120 modified CVE IDs without a single valid CPE configuration which are thus excluded from our analysis.
- Deferred
If the analysis of the CVE record is deferred by the NVD due to resources or other concerns, then the CVE record is given a “DEFERRED” status, where we observed 111 deferred CVE entries which we excluded from our analysis.
- Awaiting Analysis
During the time of the data extraction, 34 CVE records were in the “Awaiting Analysis” status. These data did not have complete information; thus, we excluded those CVE records.
- Undergoing Analysis
During the time of data extraction, 16 CVE records were in the “Undergoing Analysis” status. These data did not have complete information; thus, we excluded those CVE records.
- Undergoing Reanalysis
During the time of the data extraction, seven CVE records were in the “Undergoing Reanalysis” status. Those data also did not have complete information, thus, we excluded those CVE records.
- Received
These are the CVE records just received for analysis. We found five such CVE records and removed them from our data pool.
- Unsupported (when assigned)
If the product associated with a CVE entry is no longer supported by the vendors, then the CVE record is referred to as an end-of-life (EOL) product and tagged with an “Unsupported when assigned” tag. In our case, we found only one CVE entry (CVE-2022-48311) that had this status.
- No Product Details
In our scraped data, we found that six CVE IDs (CVE-1999-0261, CVE-1999-0635, CVE-2000-0288, CVE-2000-0889, CVE-2001-0291, and CVE-2003-0565) did not have any Common Platform Enumeration (CPE) configuration or product details during the time of data scraping.
- Non-Vulnerable
There were some CVE IDs where all the CPE configurations were non-vulnerable. For instance, CVE-2004-1510 contains all non-vulnerable CPE configurations as of the scraped timestamp. We found 394 such entries and excluded these as well from our analysis.
- Good CVE Entries
After removing all the above-mentioned incomplete and inconsistent CVE records from our data pool, we finally ended up with 194,703 useful and good CVE entries. We marked a CVE entry as a good CVE entry if it at least had a valid and vulnerable CPE configuration. We use these 194,703 data for our further analysis.
4.1.4. Operating System Data
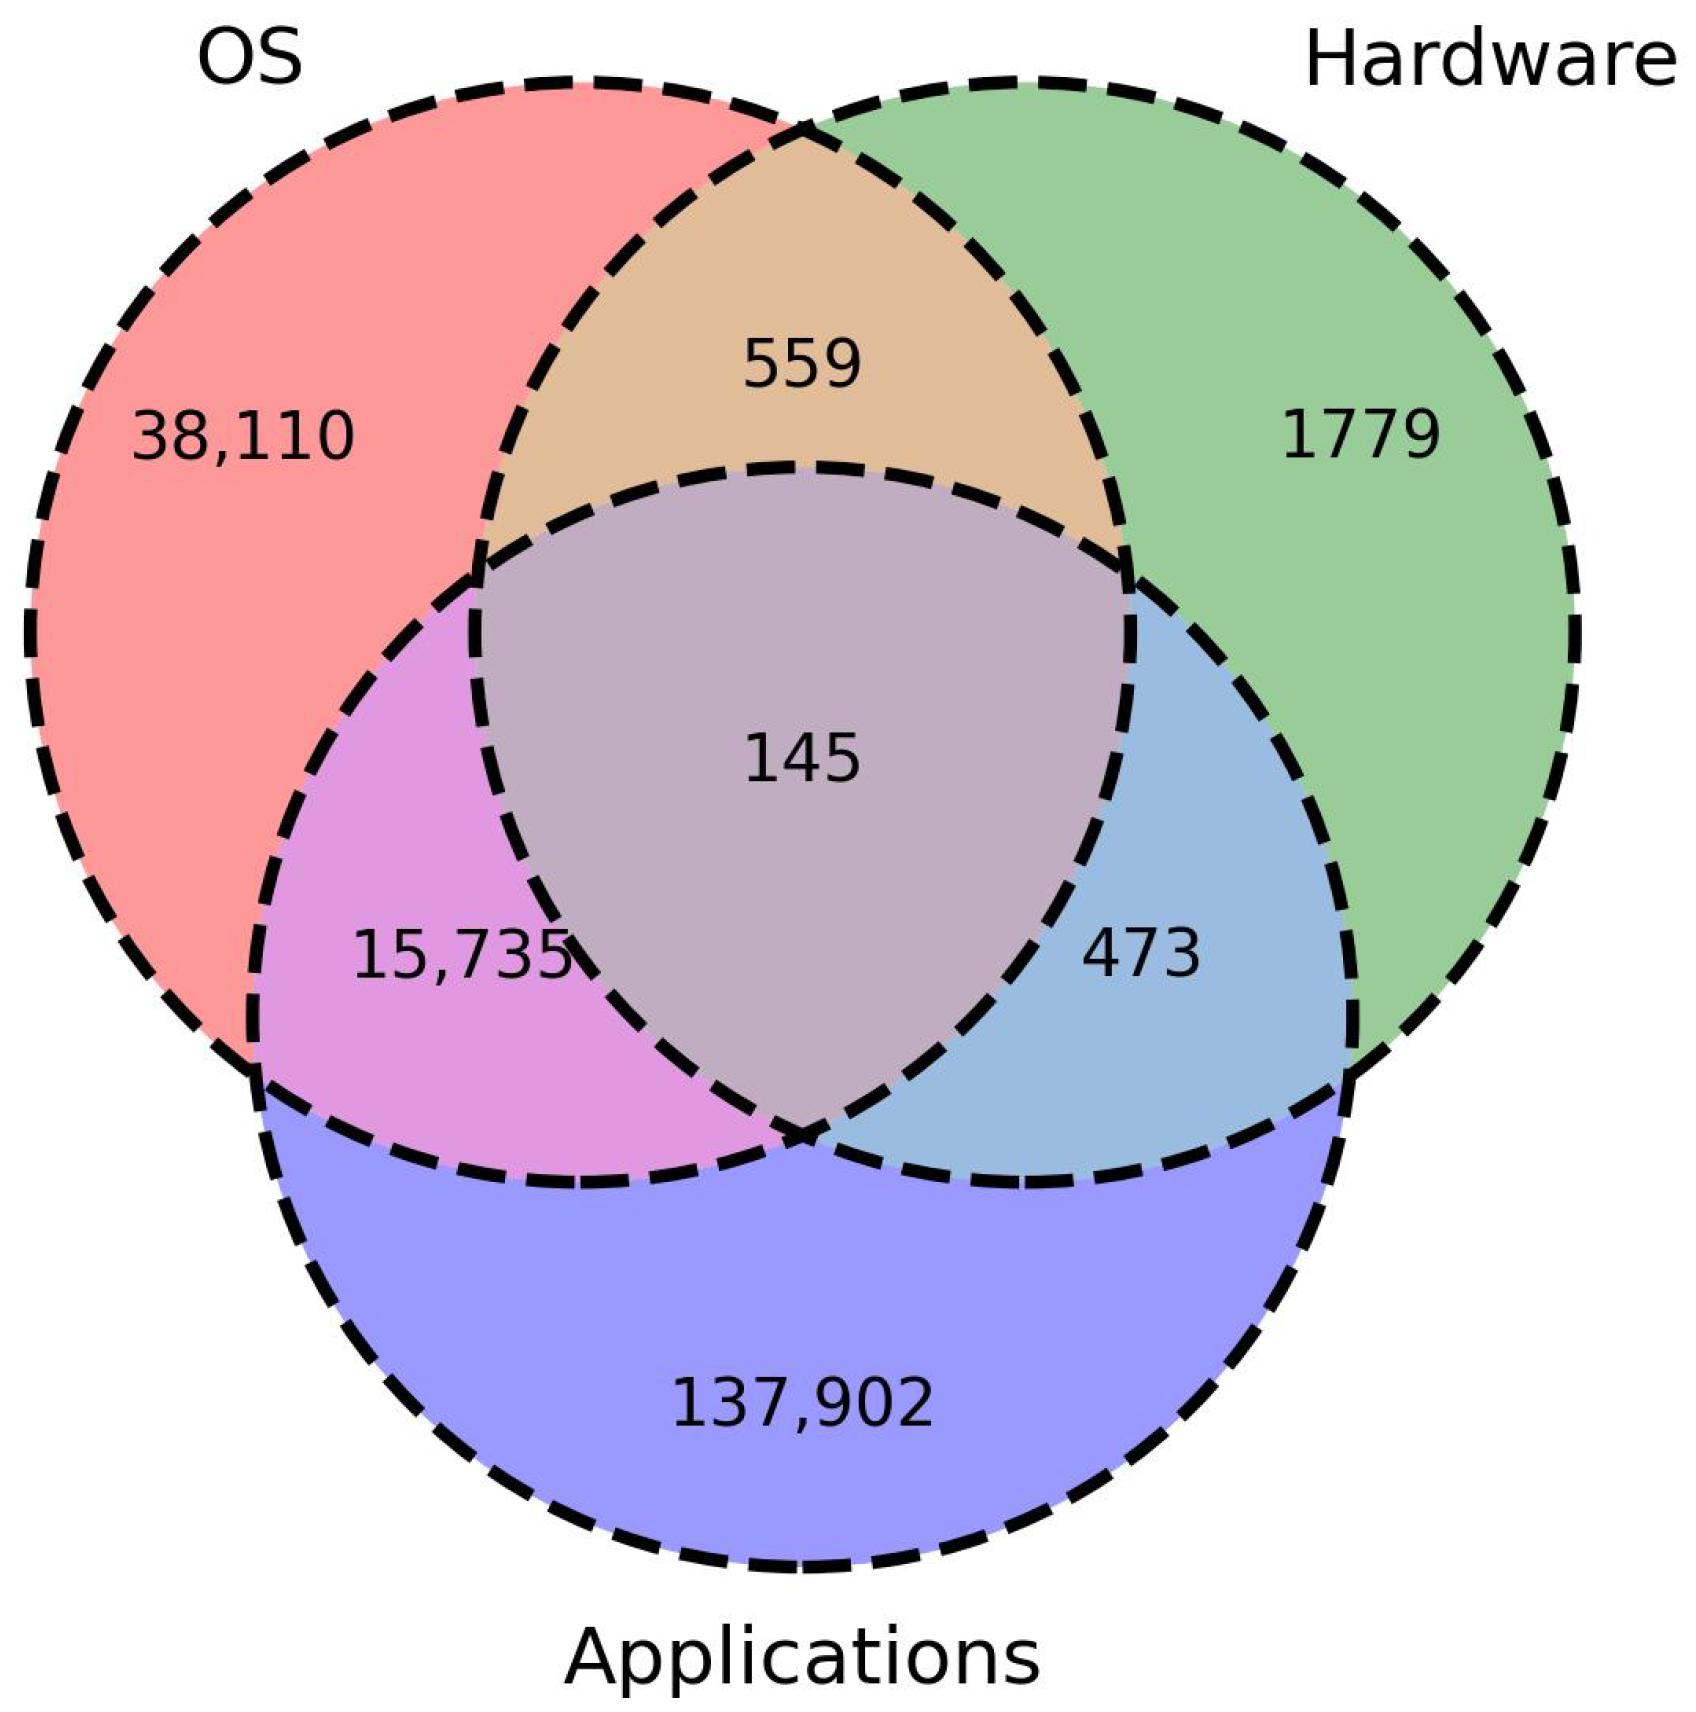
The vulnerabilities associated with a CVE entry can impact multiple applications, hardware, or OSs. Therefore, we prepared a Python script to segregate the CVE entries into OSs, hardware, applications, and the common CVE entries among them as shown by Figure 2. To segregate the product types, first, we applied the Pandas “groupby” function to group the dataframe into OS, hardware, and applications using the column “Product Type”. Next, we applied the “isin” method provided by Pandas library to check whether the CVE IDs of the OSs lie in the CVE ID pool of hardware or applications. Thus, if the CVE ID lies in all three categories, then it is kept at the intersection of three sets, as shown by 145 records in Figure 2. Similarly, if there is no common category, then it is the OS-only CVE record, i.e., 38,110 in the Venn diagram. Out of our 194,703 good CVE entries, we found 54,549 (28.01%) unique CVE entries associated with OSs where 38,110 impacted only the OS, 559 impacted the OS and hardware, 15,735 impacted the OS and applications, and 145 impacted all three of them.
4.2. Sampling of Vulnerable OSs and Vendors
We utilized a dataset consisting of 54,549 unique Common Vulnerabilities and Exposure (CVE) entries to prepare further in-depth datasets and conduct our analysis. From this dataset, we sampled the top 10 vulnerable OS categories and their respective OS versions. It is important to note that each CVE entry can encompass multiple affected OSs, resulting in a significant increase in the number of data points for OS categories and versions. Table 2 presents two illustrative examples, emphasizing the presence of multiple affected OS categories and versions within a single CVE record. For instance, in the case of CVE-2021-44142, a total of 23 unique vulnerable products were observed, of which 18 products belong to unique OS categories. Additionally, when examining the versions of these products, 40 unique vulnerable versions were observed, with 35 of them belonging to unique OS versions. Similarly, CVE-2021-26884 encompasses a total of six unique affected products, all of which belong to unique OS categories. Moreover, there are 16 unique vulnerable versions of these products and all 16 entries correspond to unique OS versions.
Leveraging this knowledge, we created two datasets, one for the OS category and another for OS versions. First, we created the OS category vulnerability dataset, entitled OS_CAT, where we aggregated all the OS versions’ data falling under the same OS category as a single entry. Next, we created the OS version vulnerability dataset, entitled OS_VER by taking all the vulnerable OS versions as the independent entries. For example, for CVE-2021-44142 in Table 2, we take the data from 18 unique OS categories with all versions aggregated together in our OS_CAT dataset, while we take the data from 35 unique OS versions in our OS_VER dataset. Finally, our OS_CAT dataset contained 310,429 total data points and the OS_VER dataset contained 465,084 data points as indicated in Table 3. We used the OS_CAT dataset for the analysis of OS categories, while the OS_VER dataset was used for the analysis of specific OS versions. This comprehensive approach allowed us to account for the diverse range of OS categories and versions affected by the vulnerabilities identified in the CVE dataset. Based on our datasets, we had 1526 unique OS categories, 19,331 unique OS versions, and 426 unique vendors. Finally, we extract the top 10 vulnerable OS categories, the top 10 vulnerable OS versions under each category, and the top 10 vendors with highly vulnerable OS categories.
4.3. Analysis of Vulnerabilities Trends, Severity, and Types
Following the data preparation and sampling of OS categories and versions, we proceeded with a temporal analysis of the selected OS categories and recent OS versions. To conduct this analysis, we leveraged the temporal information encoded within the CVE IDs. The year component of the CVE ID format, represented as CVE-YYYY-XXXXX, indicates the disclosure year of the vulnerability. We grouped the top 10 vulnerable OS categories based on the year indicated in their respective CVE IDs. By doing so, we obtained the number of vulnerabilities reported for each product from 1999 up to 2022. This analysis allows us to understand the trends in vulnerability reports over the years, providing valuable insights into the frequency and distribution of vulnerabilities within each category. Furthermore, examining the trend in vulnerability reports year by year contributes to a better understanding of the evolving landscape of vulnerabilities in the selected OS categories.
Furthermore, it is also evident that not all OS categories with specific versions are necessarily supported by their respective vendors. Hence, we took an additional step to extract the top 10 OSs with specific versions that are confirmed to be supported by the vendors. This selection was made within the recent timeframe of 2021–2022, ensuring that the readers gain insight into the prevailing vulnerabilities that are relevant and applicable in the present time.
On the other hand, we also performed a severity analysis of the vulnerabilities discovered in the top 10 OS categories based on CVSS scores. As discussed in Section 2, we scraped four different CVSS scores based on the availability such that we will have at least one CVSS score for each product. Finally, we computed a single CVSS score by taking the maximum of all four CVSS scores for each product as follows:
After extraction of the CVSS score, we grouped the score into one of ten categories. The CVSS score is a continuous number and thus it will be difficult to generate comparative bar plots. Furthermore, creating the line plots may generate a disoriented graph that may not produce valuable insights. Therefore, we prepare the 10 discrete groups of CVSS scores viz. 0–1, 1–2, 2–3, …, 9–10 classes. All groups include the lower bound and exclude the upper bound except for the CVSS group 9–10, which includes both lower and upper bounds.
We expand our methodology by unfolding the types of vulnerabilities based on the CWE ID. We scraped the reported CWE IDs associated with each data point. We leveraged this CWE ID to rank the top 10 vulnerability types based on the number of times the vulnerability type is observed within the CVE record. It is quite important to understand the year-wise vulnerability types such that the end-users can understand and take necessary precautions about the prevailing vulnerability types. Next, we analyzed the year-wise vulnerability count for each of our top 10 CWE IDs. Then, we compared the vulnerability counts of the CWE IDs common to our top 10 vulnerable OS categories as well as the top 10 vulnerable OS versions in recent years. This comparison provides insights into the vulnerability patterns between the broader range of vulnerable OS categories and the more recent OS versions with specific releases.
5. Findings and Discussion
5.1. Sampling of Vulnerable OS Categories, OS Versions, and Vendors
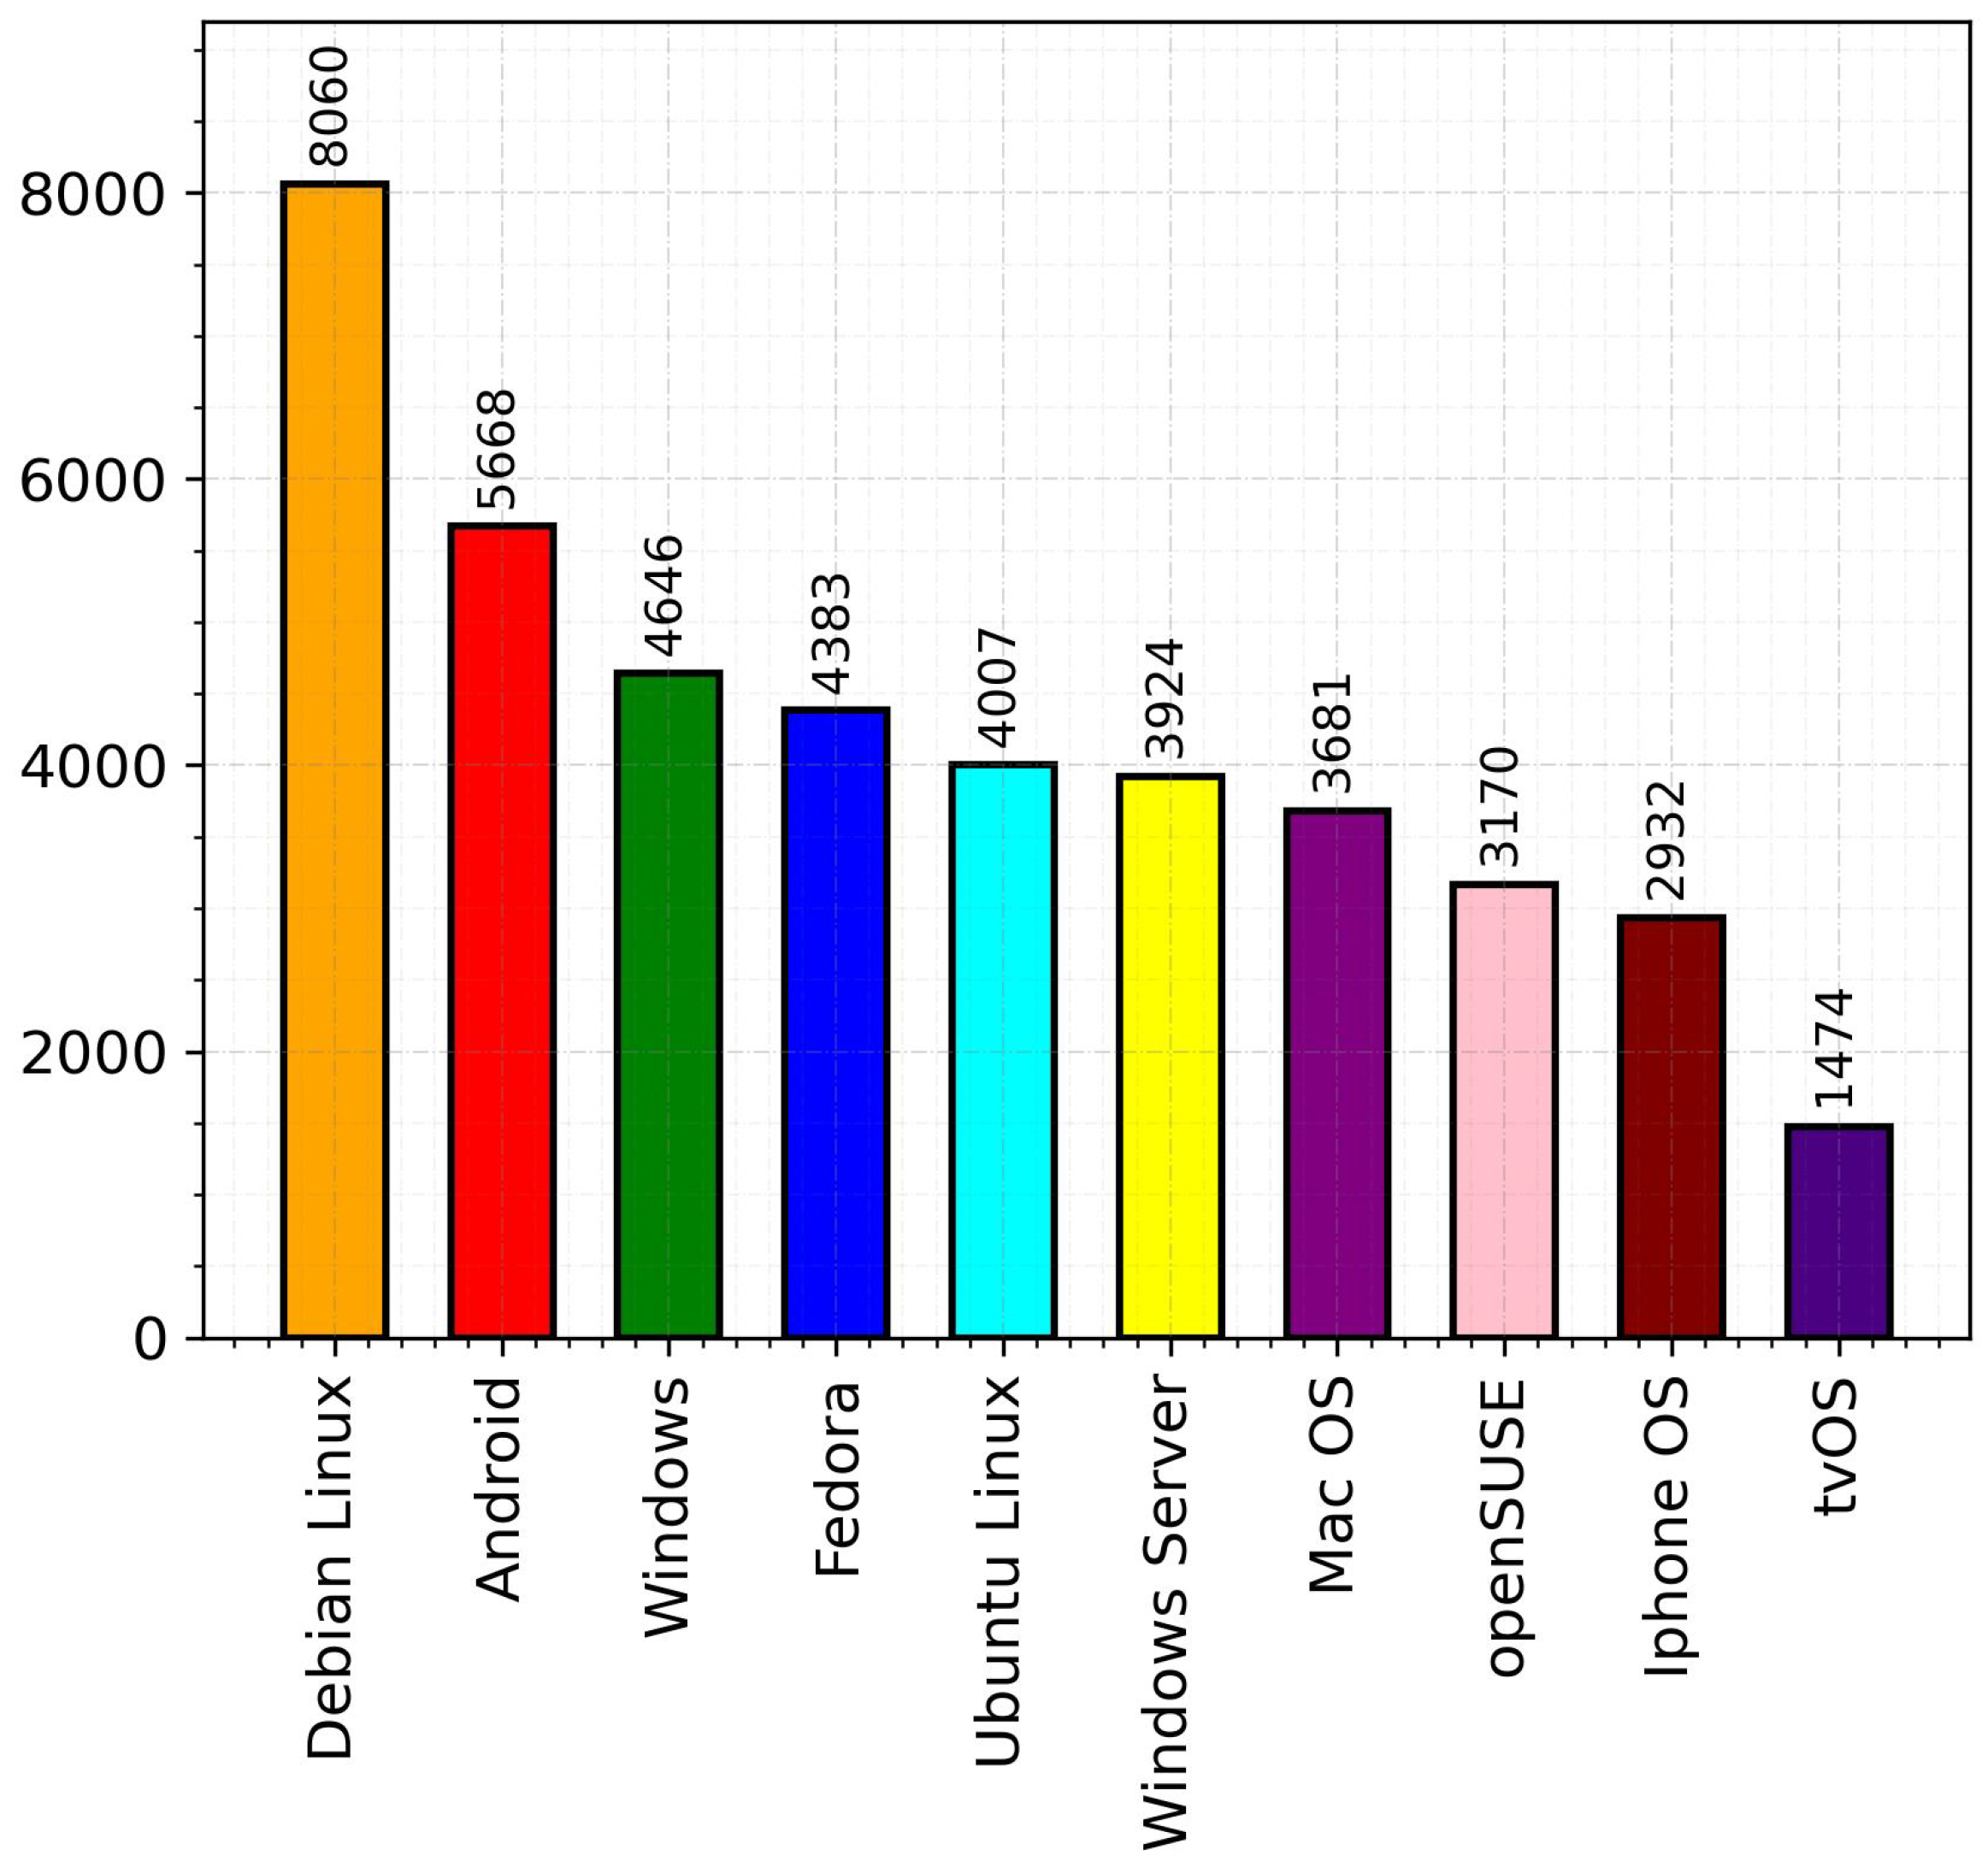
Figure 3 presents a comparative bar chart depicting the highly vulnerable OS categories using our OS_CAT dataset with 310,429 distinct data points. The chart reveals that the top 10 vulnerable OSs consist of a diverse range of OS types encompassing desktop, mobile, server, and TV OSs. The OS categories Debian Linux, Ubuntu Linux, Fedora, and openSUSE have significant numbers of vulnerabilities, highlighting the importance of proactive security practices in the Linux ecosystem. The OSs in the Windows family, i.e., Windows and Windows Server, have 4646 and 3942 vulnerability entries, respectively. The Apple OSs, namely macOS, iPhone OS, and tvOS, also fall in the top 10 list. The OS categories Android and iPhone OS demonstrate vulnerabilities in mobile OSs. With the increasing use of mobile devices, it is crucial to address these vulnerabilities promptly through regular updates and user awareness.
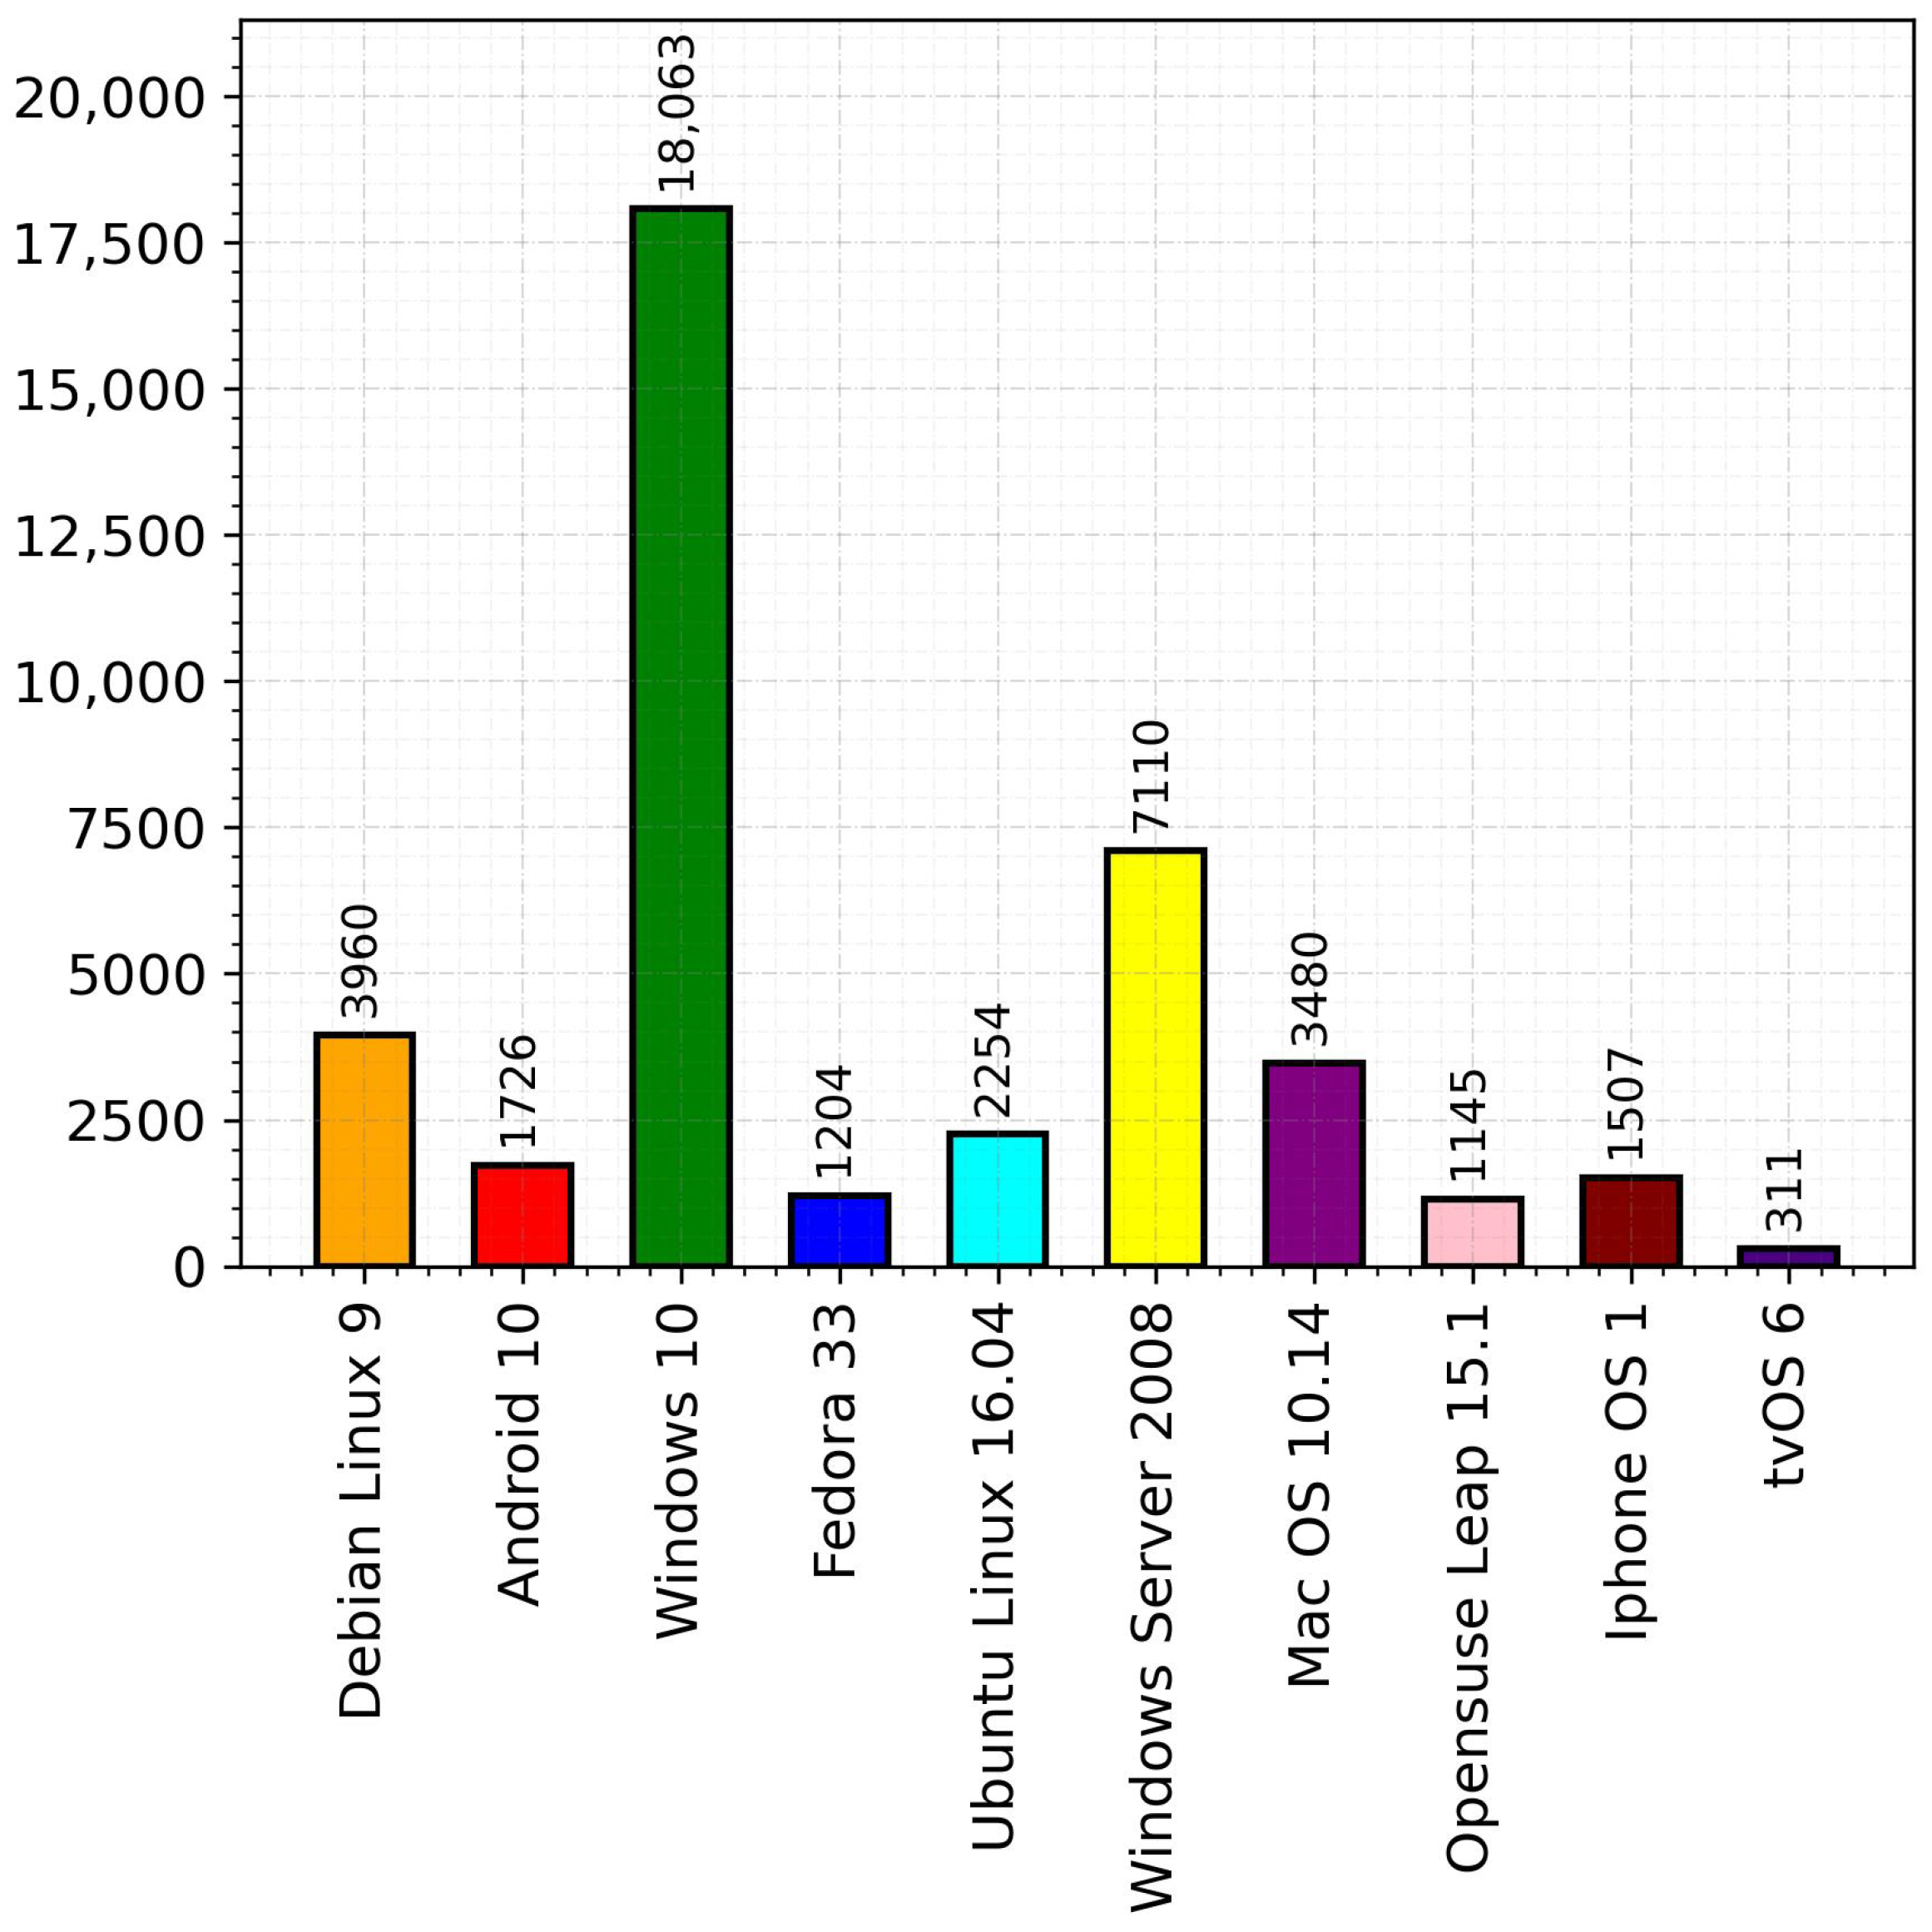
In addition, Figure 4 showcases the number of vulnerabilities reported for specific OS versions under corresponding OS categories, as highlighted by the respective colors, utilizing our OS_VER dataset with 465,084 data points. Surprisingly, Debian Linux 9 and Android 10 have comparatively low vulnerability counts, contrasting their top vulnerable respective OS categories in Figure 3. The chart shows that the top vulnerable OS versions are Windows 10 and Windows Server 2008. The higher number of vulnerabilities in popular desktop OSs like Windows and macOS, as well as mobile OSs like Android and iOS, suggests that attackers may focus their efforts on these widely used platforms due to the potential impact and larger user base.
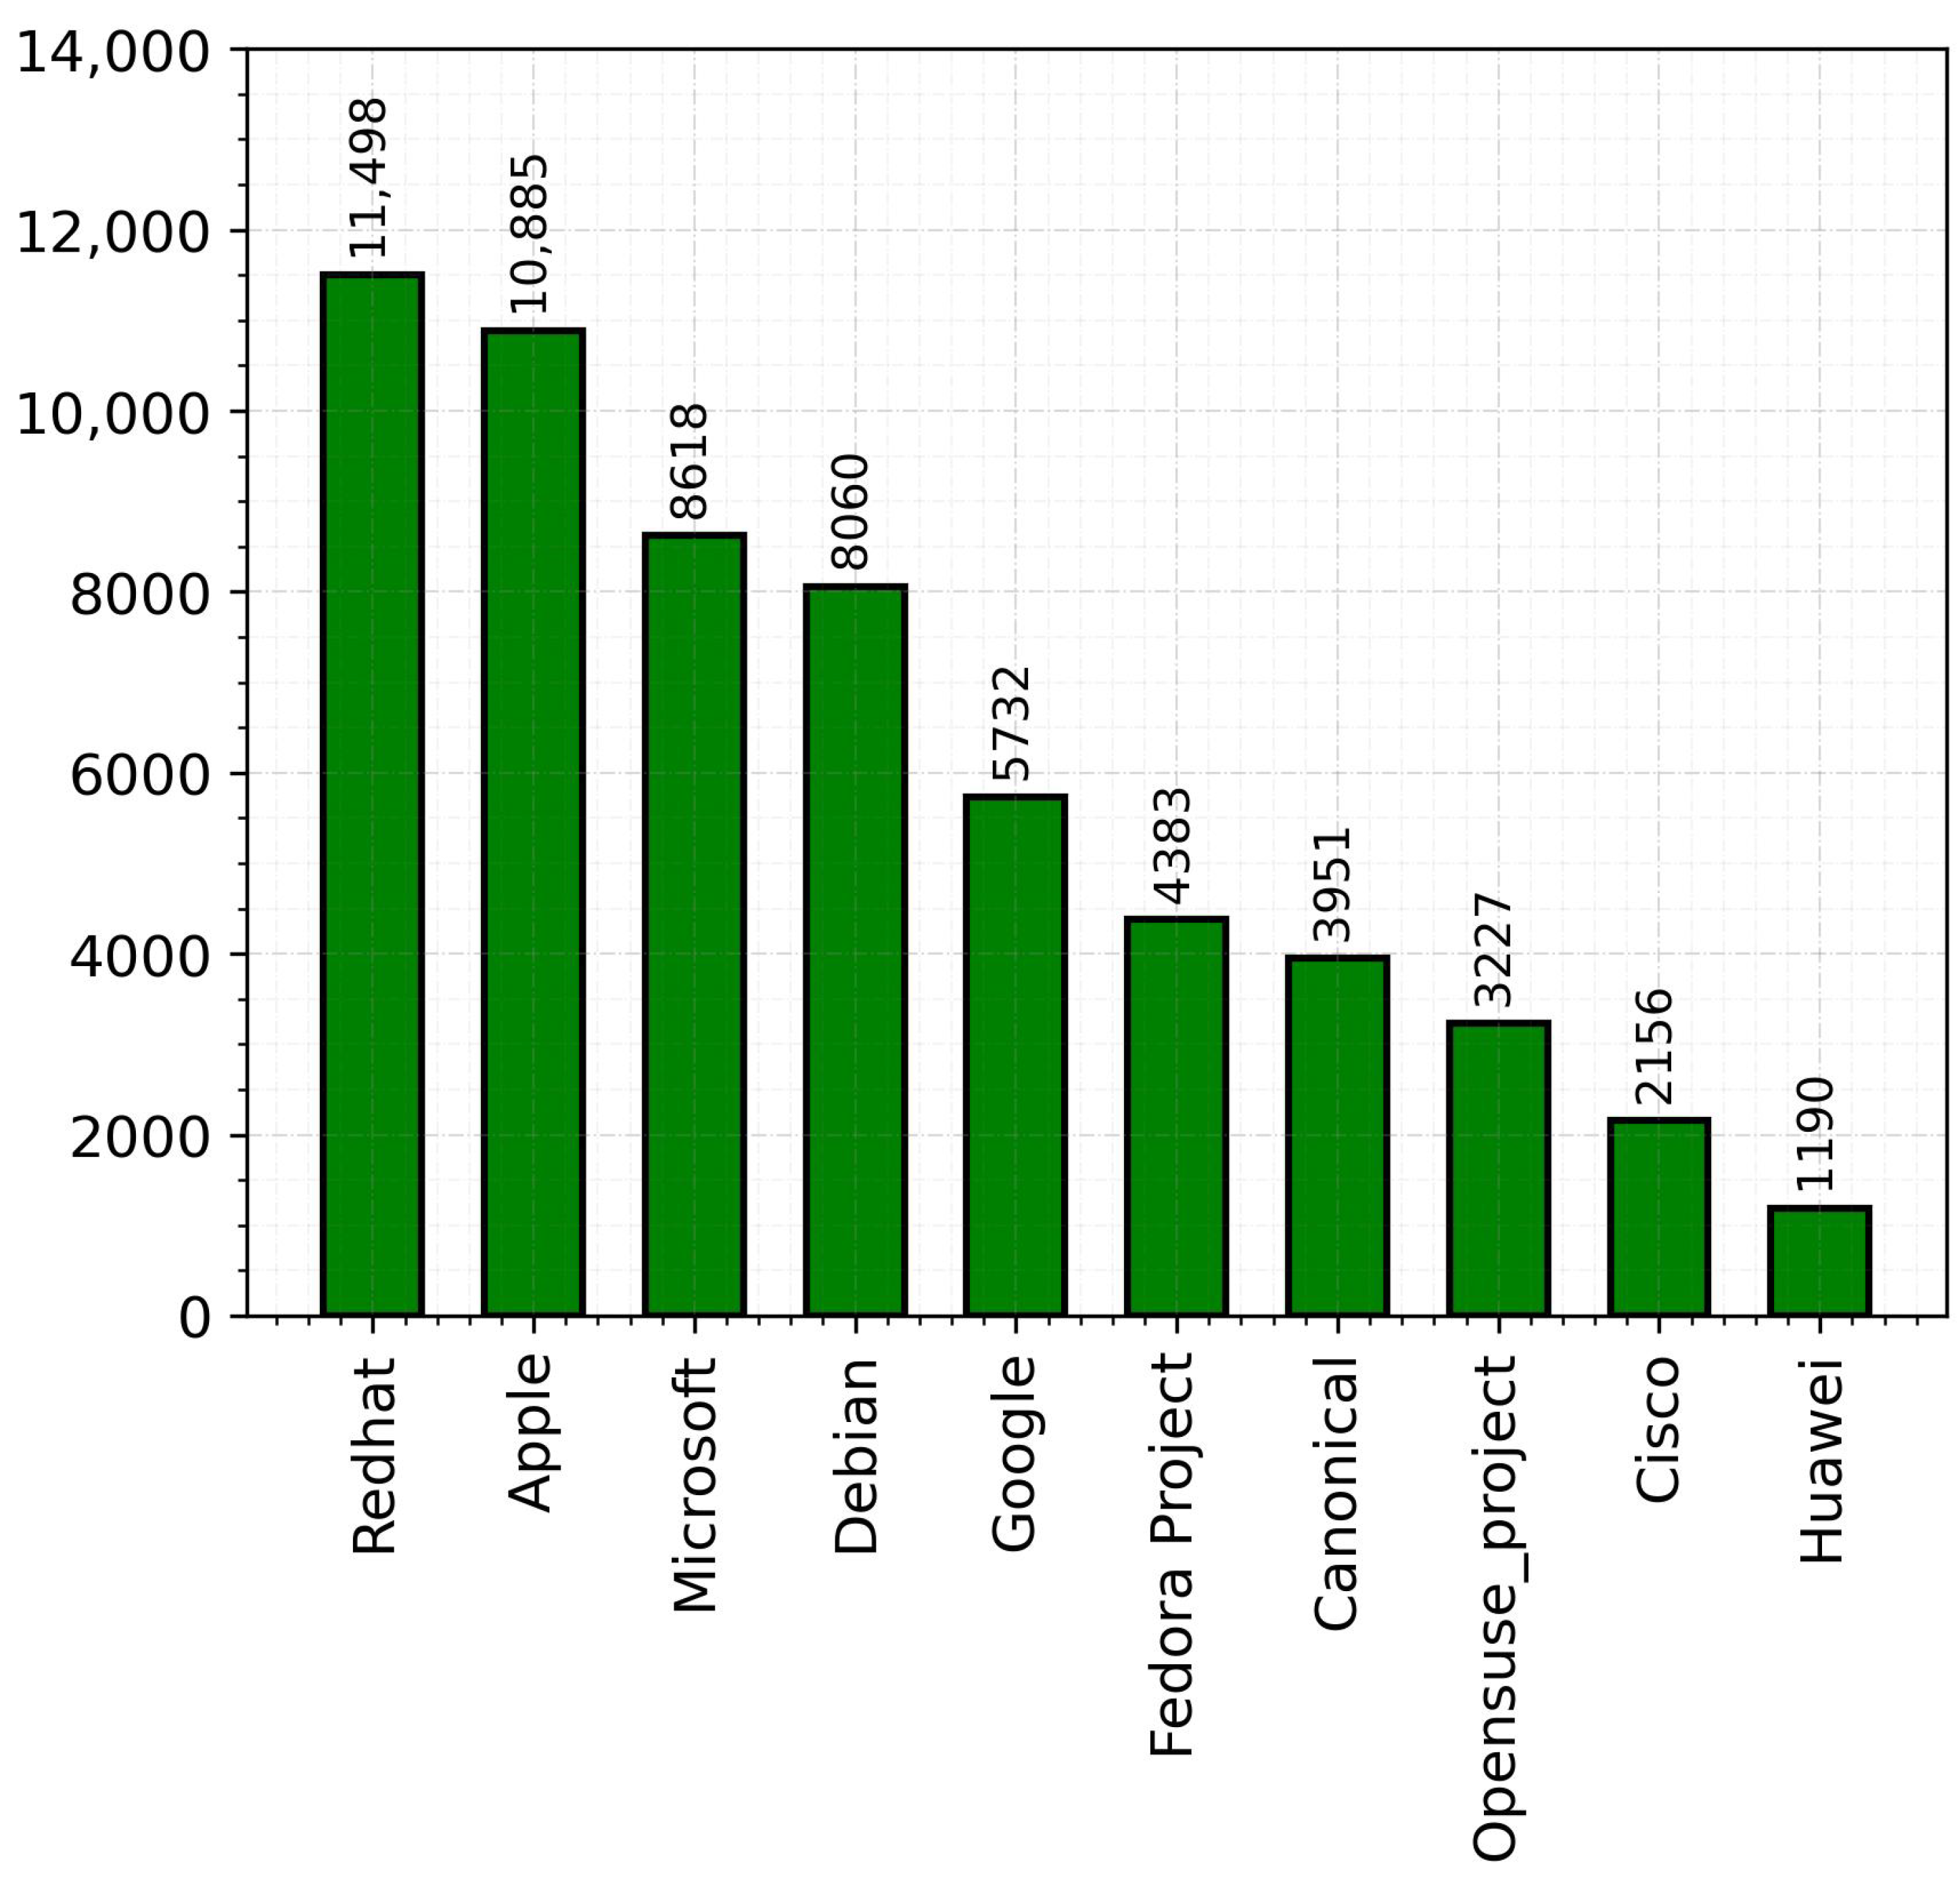
Similarly, Figure 5 shows the top 10 vendors with a high number of vulnerable products. We found that Redhat topped our ranking, with a total of 11,498 reported vulnerabilities, followed by Apple with 10,885 reported vulnerabilities. The presence of a diverse range of vendors, including Redhat, Apple, Microsoft, Debian, Google, Fedora Project, Canonical, openSUSE Project, Cisco, and Huawei, among the top 10 with vulnerable products highlights the need for comprehensive vulnerability management across various vendor ecosystems. The inclusion of vendors like Redhat, Debian, Fedora Project, and openSUSE Project in the top 10 underscores the importance of addressing vulnerabilities in open-source software. The collaborative nature of open-source projects requires active community involvement to identify and remediate security vulnerabilities promptly.
5.2. Year-Wise Vulnerability Results and Pattern Analysis
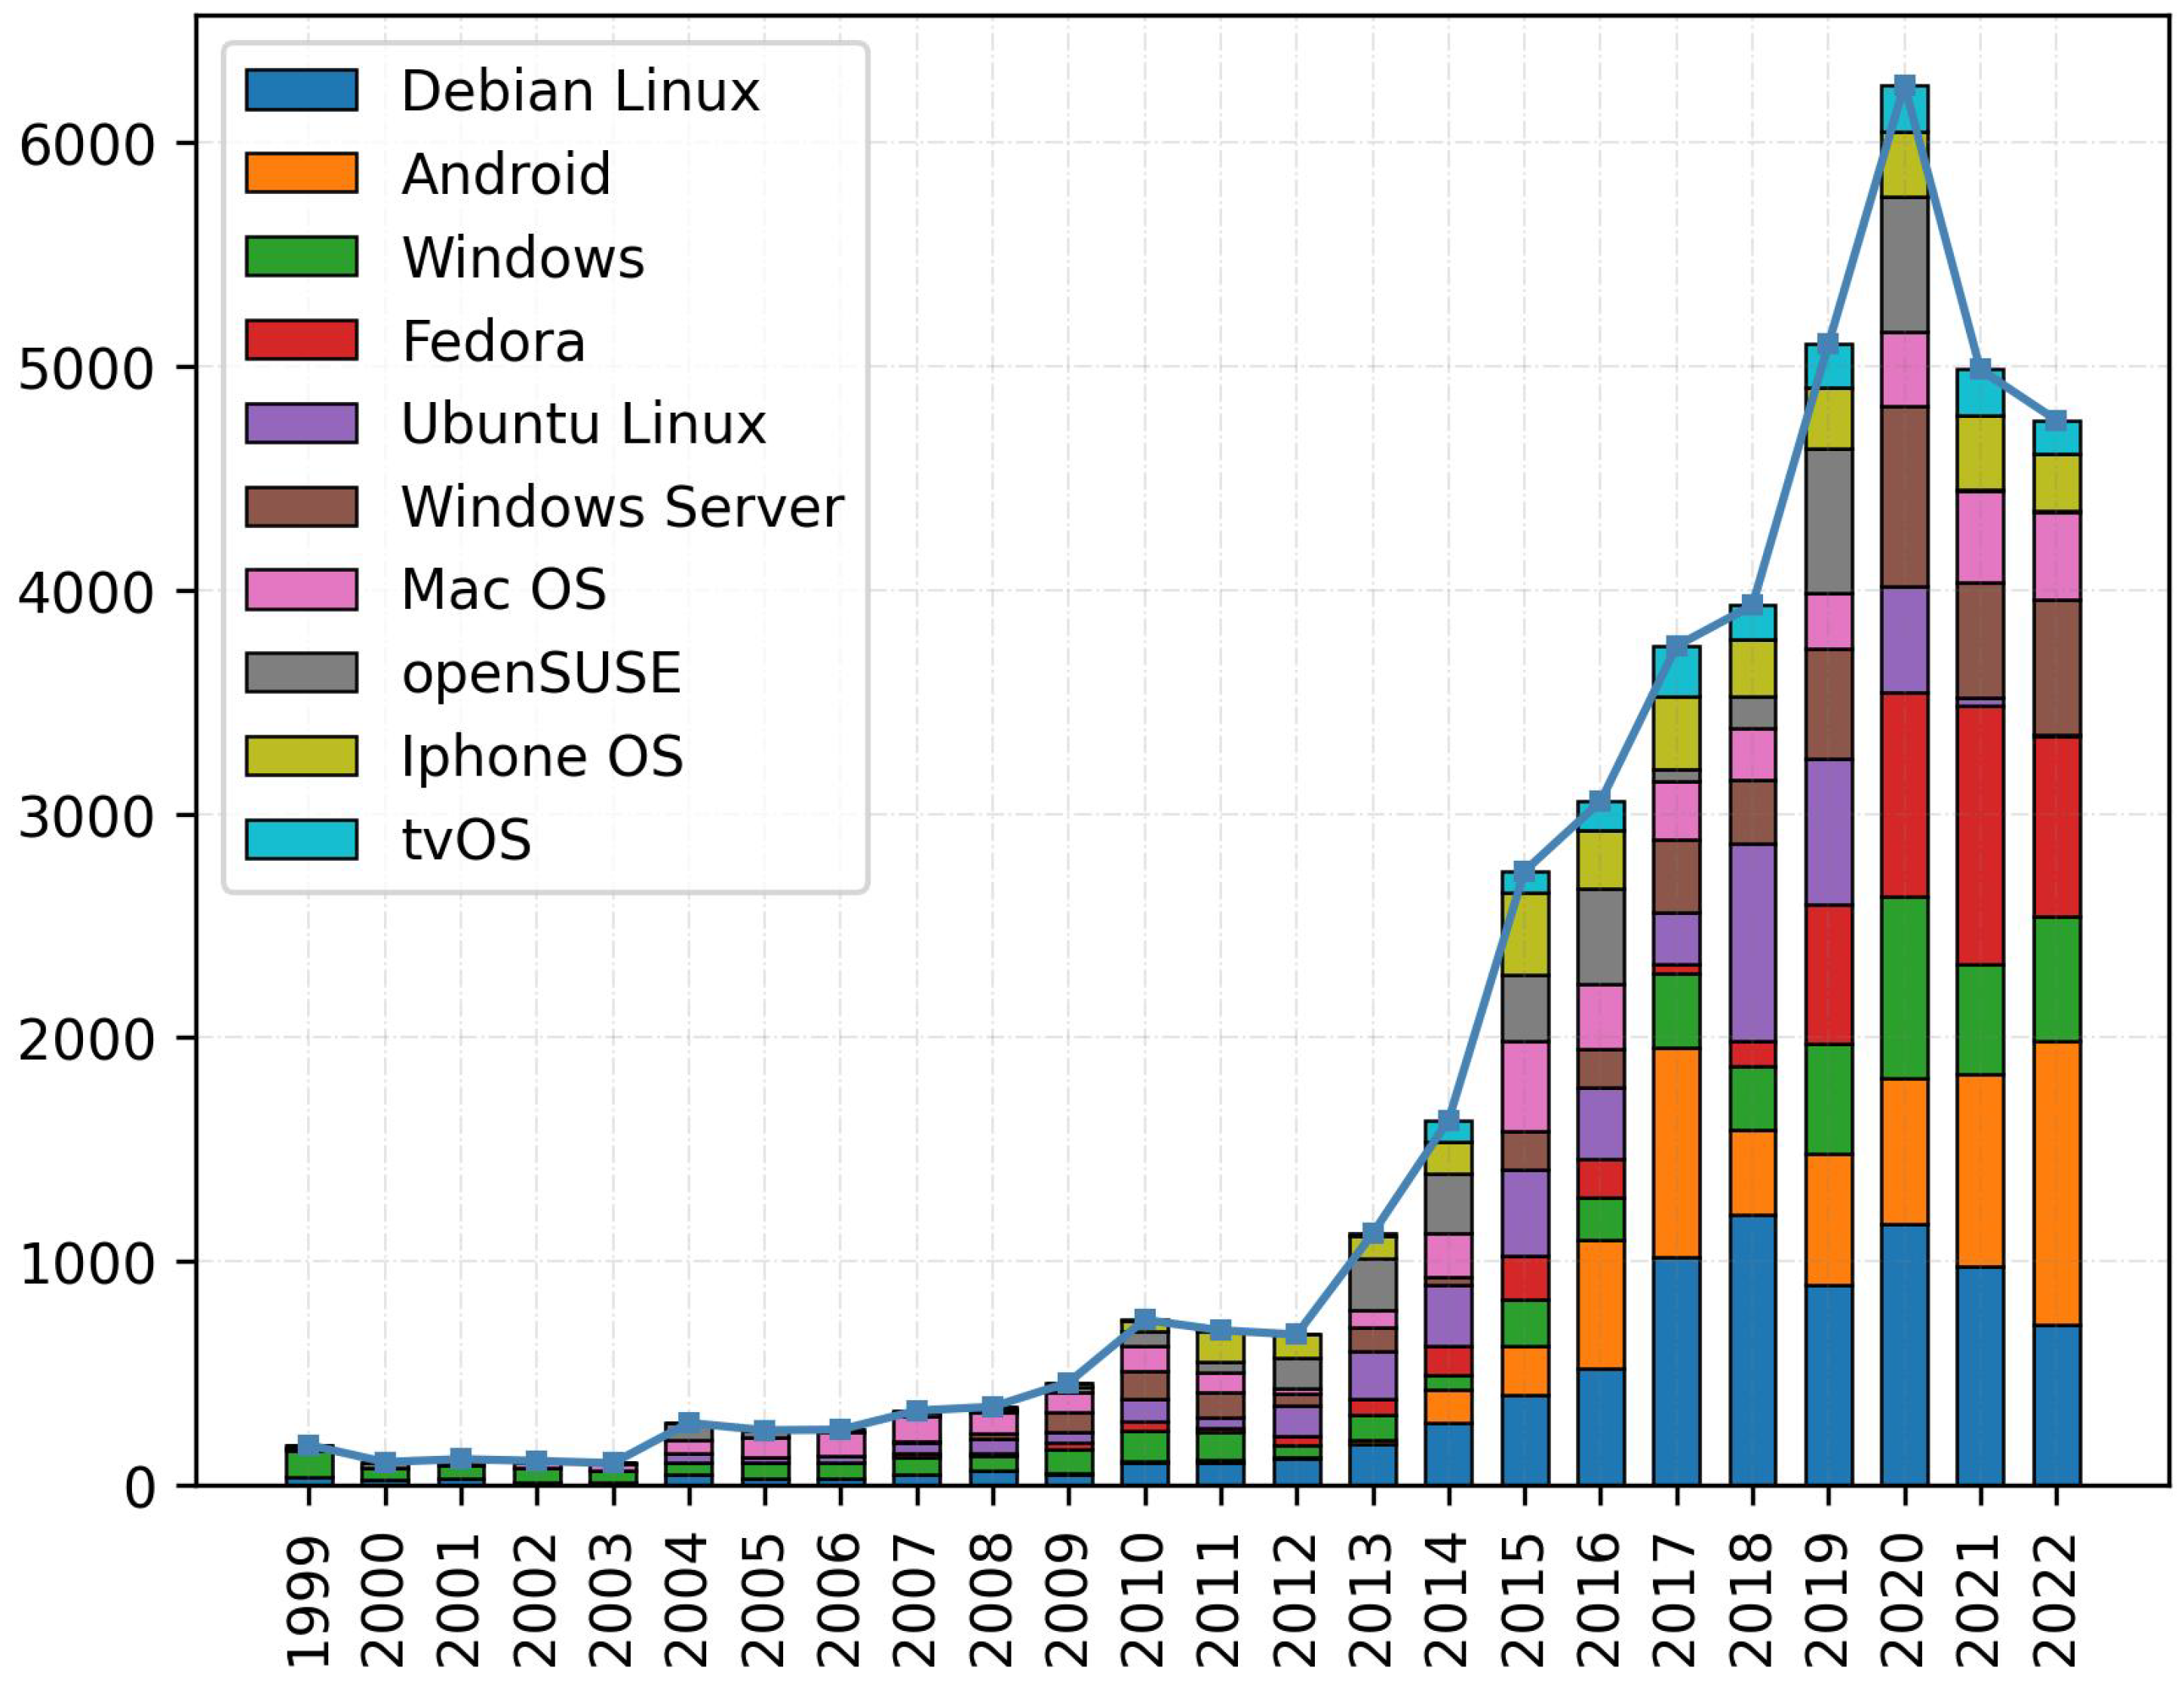
After sampling the top highly vulnerable OS categories, we studied the evolution of vulnerabilities during the period of 1999–2022. Figure 6 shows the stacked bar chart demonstrating the year-wise pattern for our top 10 vulnerable OS categories with the number of reported vulnerabilities. The following are some important and interesting observations from in Figure 6:
- For the listed top 10 OS categories, the growth in vulnerabilities over the years 1999–2022 indicates an Exponential Distribution pattern. From another perspective, we can observe that the highest number of vulnerabilities was reported in 2020, after which the increasing trend was broken and the graph tends to show a downward slope until 2022. This shift can be interpreted as the commencement of the second half of a Gaussian Distribution, with the data from 2020 serving as the mean value.
- In 2017, the number of vulnerability reports impacting Fedora was notably small, with only 42 reports. However, in the subsequent years until 2022, there was a significant increase in the number of vulnerability reports affecting Fedora. This indicates a considerable growth trend in the vulnerabilities associated with the Fedora OS and its versions during that period.
- Debian Linux shows an increasing trend until 2018 and a decreasing trend was seen in recent years, starting in 2020. Android exhibits a slow increment in vulnerability reports across each year, with a total of 1266 reported vulnerabilities in 2022.
- Ubuntu Linux had the highest number of vulnerabilities in 2018. However, after 2018, it exhibited remarkable resilience and stability, as reflected in the significantly reduced vulnerability reports. Specifically, in 2022, Ubuntu Linux encountered a mere nine vulnerability reports. Similarly, openSUSE also experienced an upward trend in vulnerability reports until 2020. However, in recent years, there has been a substantial decrease in the number of vulnerability reports. Specifically, in 2021, there were only six reported vulnerabilities for openSUSE, and in 2022, the number was further reduced to just two entries. This remarkable improvement underscores the efforts made by Ubuntu Linux and openSUSE to bolster the security and reliability of the Linux distribution.
- The Apple OSs, including Mac OS, iPhone OS, and tvOS, consistently demonstrate a relatively low number of vulnerability reports compared to other OS categories. However, the consistency in vulnerability reports each year does not necessarily imply a decline in vulnerabilities. Instead, it suggests that the vulnerability landscape for these Apple OSs remains relatively stable, with a consistent number of vulnerabilities being identified and reported annually. It highlights the need for ongoing security measures and regular updates to address and mitigate these vulnerabilities effectively, despite the consistent number of reports.
Continuing the analysis, Table 4 presents the vulnerabilities of the top 10 unique OS versions during the recent period from 2021 to 2022. Notably, all these OS versions remain actively supported by their respective vendors. The analysis reveals that in recent years, Windows 10 stands out as the most highly vulnerable OS, with a substantial number of 8659 vulnerability reports. This highlights the challenges faced in maintaining the security of Windows 10 and the need for robust security measures to mitigate potential risks. Following Windows 10, the next vulnerable OS is another product from the Windows family, namely Windows 11, with 1293 vulnerability reports in recent years. This indicates that even with the release of a newer version, Windows 11 was not immune to vulnerabilities, emphasizing the ongoing importance of maintaining strong security practices. Additionally, the list includes three highly vulnerable versions of Android (11, 12, and 13). This suggests that despite efforts to enhance the security of Android with each subsequent version, vulnerabilities still persist, indicating the need for continuous updates and security measures for Android devices. Similarly, two highly vulnerable versions of Debian Linux (10 and 11) are identified. Furthermore, Windows Server 2012 and Fedora 37 appear on the list with 753 and 333 vulnerability reports, respectively. Interestingly, the mobile-IoT OS, namely HarmonyOS 2, is also observed in the top 10 list of vulnerable OSs in recent times, with 323 vulnerability reports. All these observations raise a critical concern that even in recent years, widely used OSs belonging to various usage categories (desktop, server, mobile, and IoT) continue to exhibit a high level of vulnerability. Despite ongoing vendor support, these OS versions remain susceptible to security risks. Addressing these vulnerabilities becomes imperative to safeguard systems and enhance overall OS security.
5.3. Severity Analysis Results
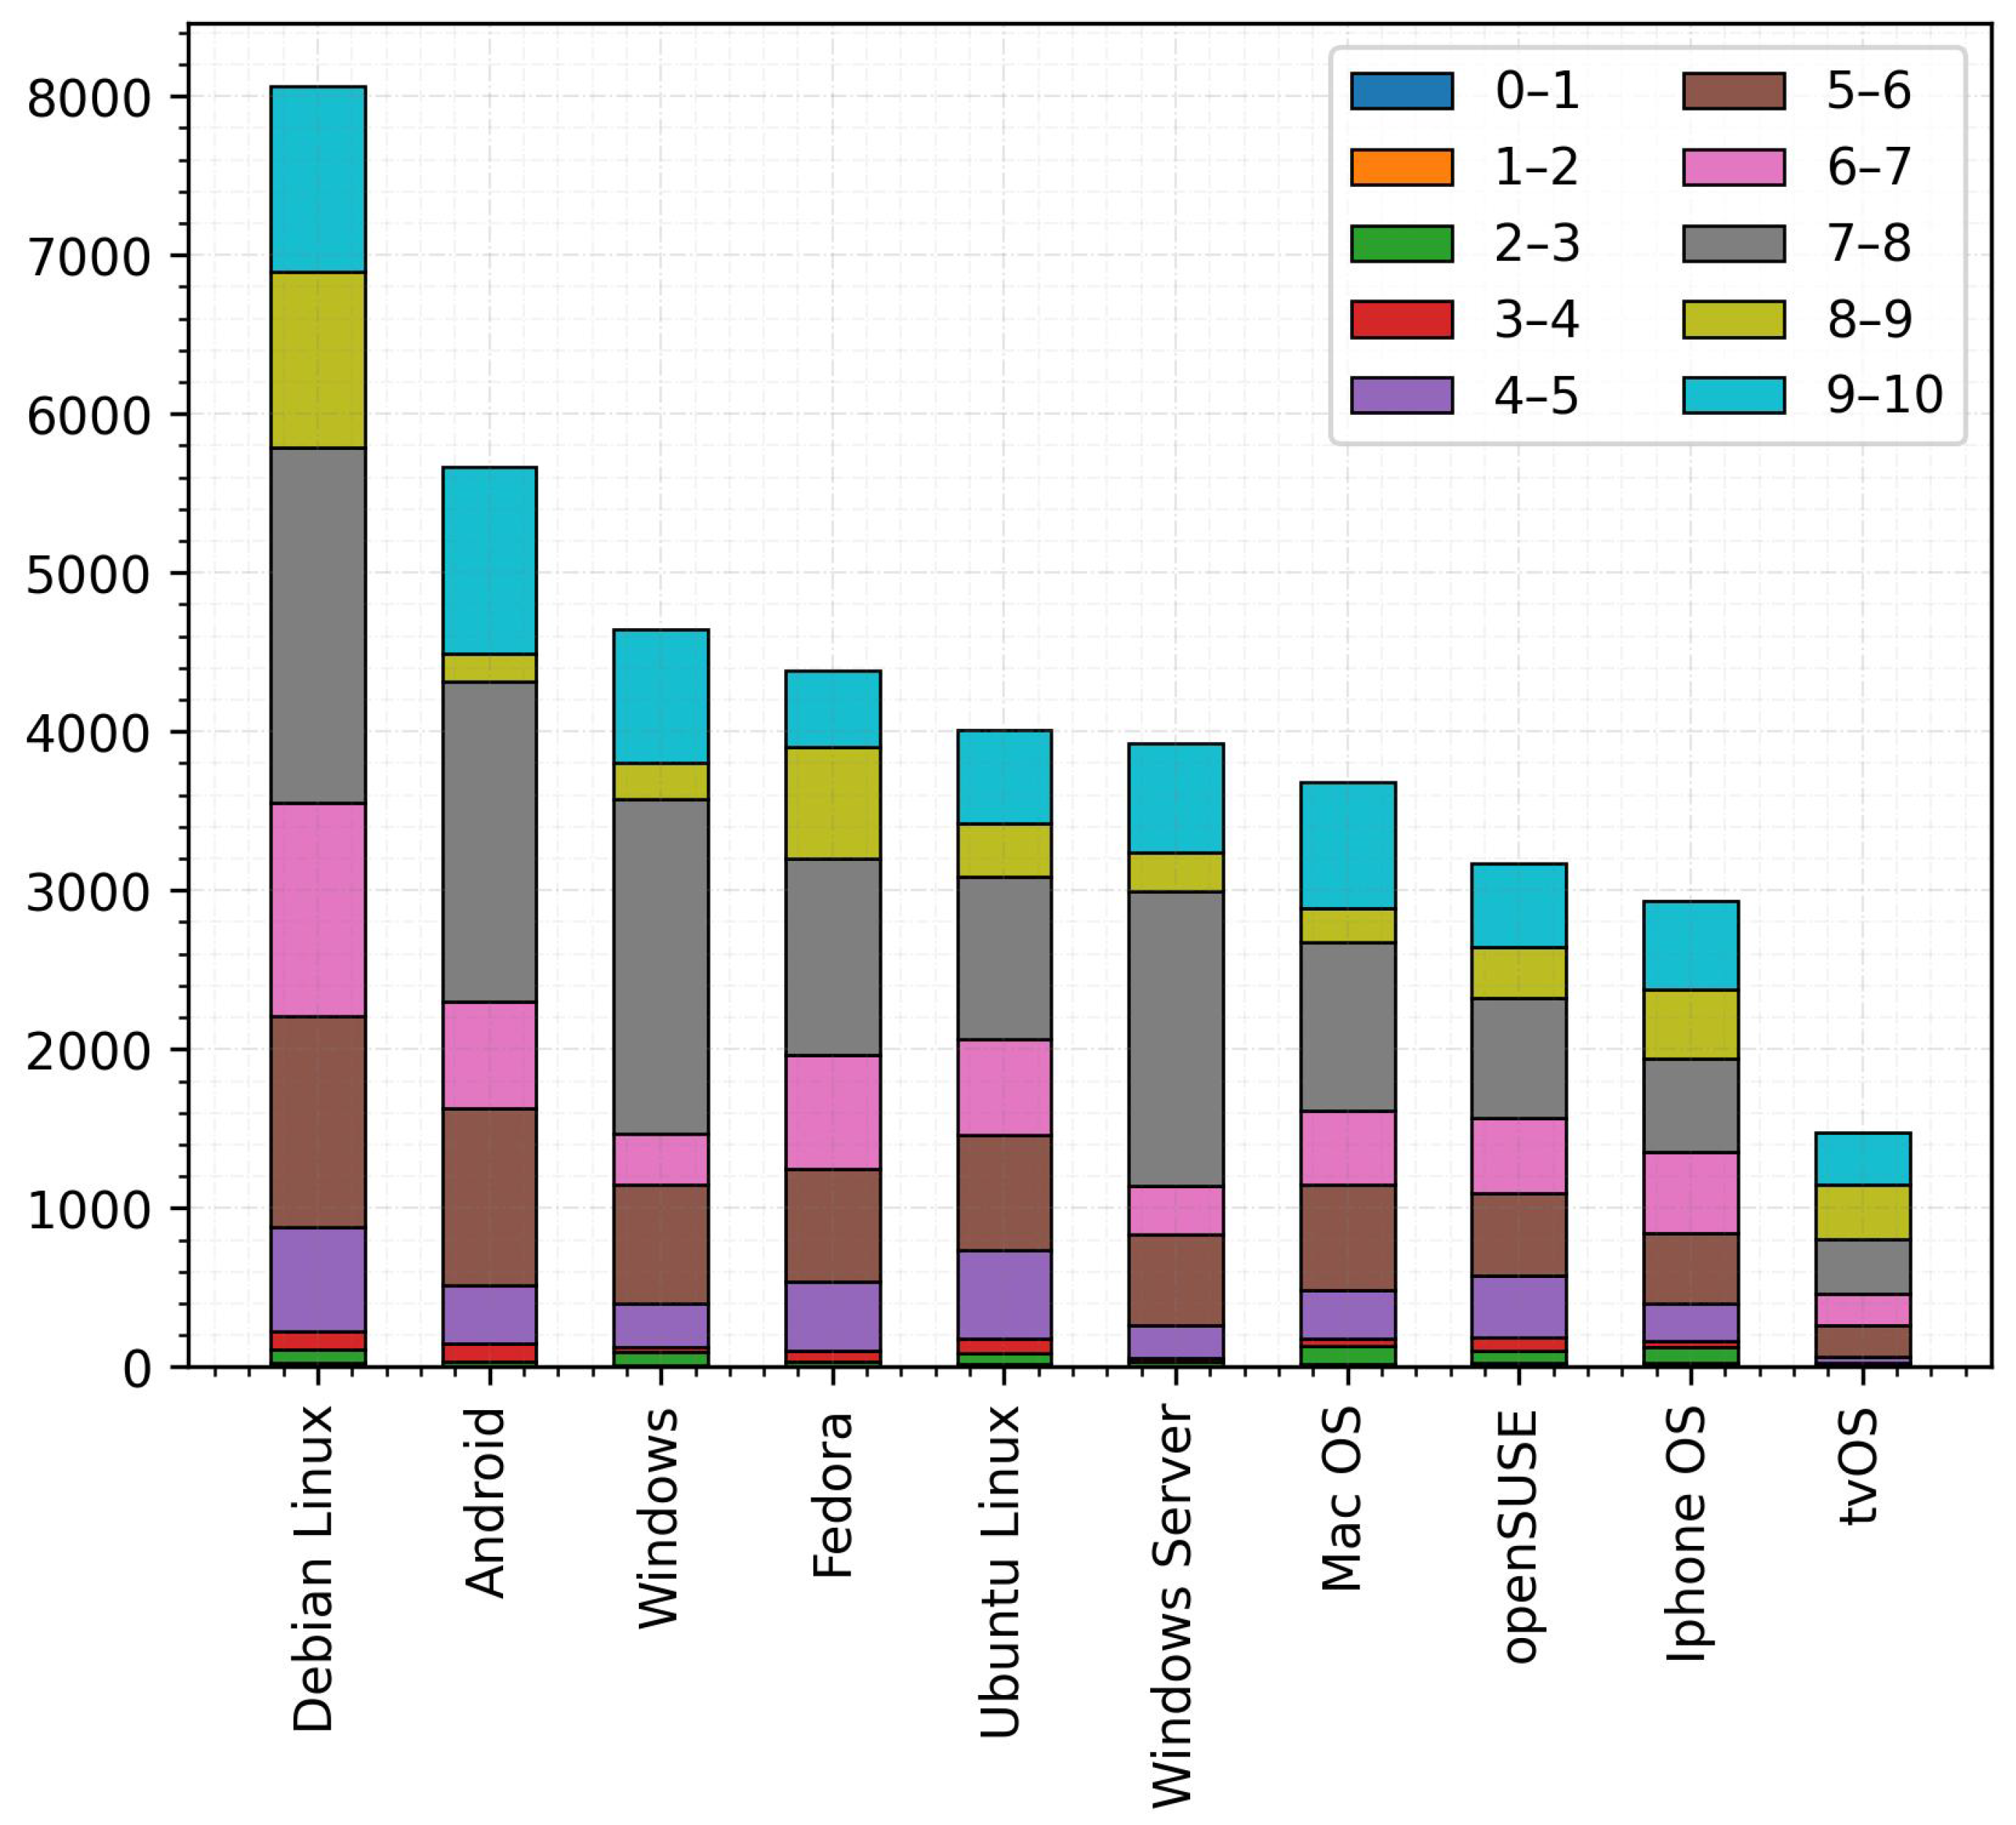
We demonstrate the CVSS score analysis as a stacked bar chart for all the 10 OS categories under study, as shown in Figure 7. This chart is based on the CVSS score reported in our OS_CAT dataset. All the OS categories contain the majority of the CVSS scores above 4. The quite critical observation is that all our top 10 vulnerable OS categories have the majority of vulnerabilities with CVSS scores in the ranges 7–8 and 9–10. This indicates a heightened level of severity and underscores the urgent need for proactive measures to address these vulnerabilities and enhance the security of these OSs. It is crucial to prioritize the identification and patching of vulnerabilities within these score ranges to mitigate potential risks and safeguard the integrity and functionality of these vulnerable systems.
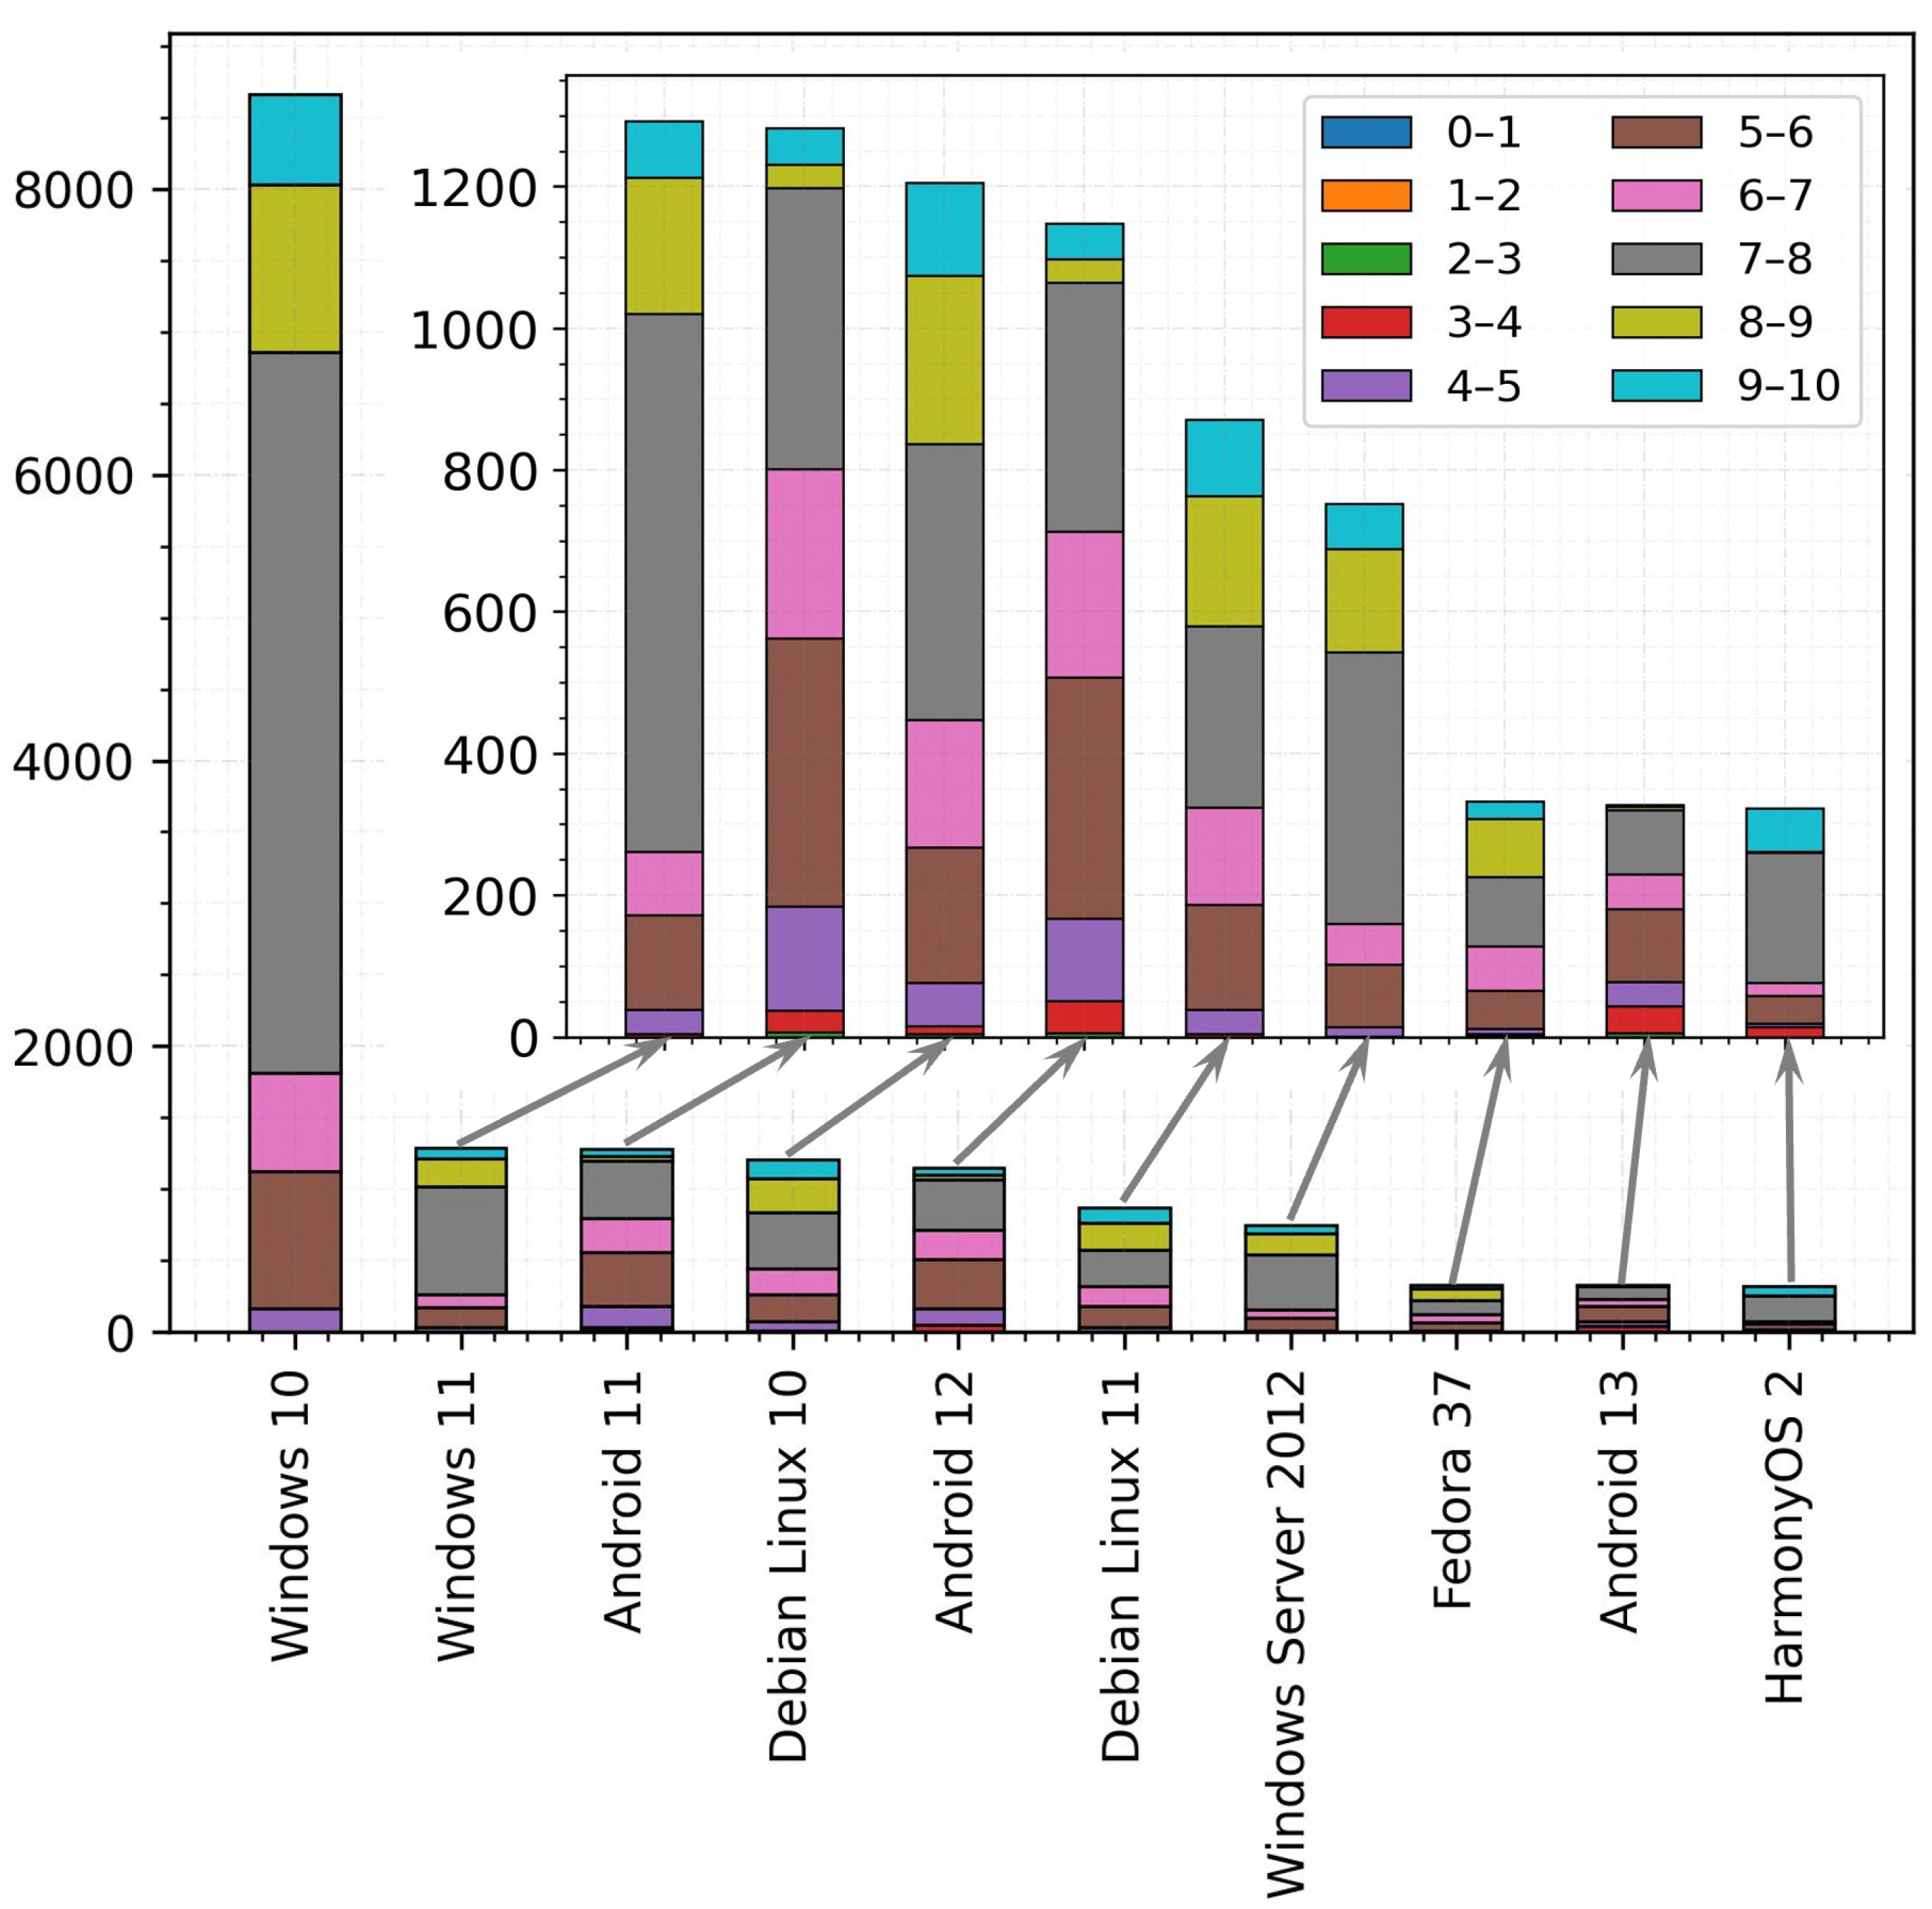
Continuing this analysis, Figure 8 depicts the CVSS scores for our top 10 most recent vulnerable OSs with specific versions. We present the following observations and pattern analysis from the figure:
- For Windows 10, 5046 vulnerability reports indicate CVSS scores between 7 and 8, and 1169 vulnerability reports indicate CVSS scores between 9 and 10. Similarly, for Windows 11, 759 vulnerability reports correspond to CVSS group 7–8, and 192 vulnerability reports correspond to CVSS group 9–10.
- For Android 11 and 12, the majority of CVSS scores lie in groups 5–6 and 7–8. The same pattern is also seen in Android 13; however, the amount is quite lower in number as compared to these two versions.
- Debian Linux 10 and 11 exhibit a similar pattern of CVSS groups, with group 7–8 being the maximum.
- All the top 10 OS versions have the majority of CVSS scores above 5. This indicates the critical potential for exploitation and greater security risks in recent times.
- HarmonyOS 2 has most of its vulnerability reports incorporating 7–8 CVSS scores.
5.4. Types of Vulnerabilities Findings
As we discussed different vulnerability statistics, in this section, we highlight the types of vulnerabilities in terms of CWE IDs. Table 5 shows the ranking of the top 10 vulnerability types seen in overall OSs. We used a dataset consisting of 54,549 unique CVE entries such that a single CWE is associated with a single CVE record. These CWEs are the critical weaknesses that can allow attackers to cause critical and serious damage. Different attack types that the attackers can cause under our top 10 CWE IDs are explained below:
- CWE-787
Under this vulnerability, the attacker can write to out-of-bound memory locations, causing code execution, unexpected results, and even data corruption.
- CWE-119
This weakness allows the attackers to execute arbitrary code, alter the control flow, access critical information, and can also cause a system failure.
- CWE-20
This is the case of improper input validation and allows the attackers to inject malicious input into the program, causing system failure.
- CWE-200
This is the case of confidentiality reveal or information exposure, allowing unauthorized actors to get deeper sensitive information.
- CWE-125
Under this vulnerability, the attacker can read from out-of-bound memory locations that may reveal the sensitive information of the program or user.
- CWE-79
This weakness allows the attackers to execute malicious content from the victim’s browser or inject malicious content into administrative log messages and web pages. After injecting such malicious content, the attacker can perform multiple malicious activities like transferring private information, etc.
- CWE-416
This vulnerability allows the attackers to reference the memory address when it is already freed. This may cause program failure or data corruption.
- CWE-264
Under this weakness, the attacker can gain access control, permissions, and privileges of the program, allowing the attacker to perform malicious activities and also causing system failure.
- CWE-78
This vulnerability enables potential attackers to execute hazardous commands directly within the OS.
- CWE-120
This is the case of buffer overflow, where attackers can exploit the system by deliberately inputting more data into a program or system than it can handle.
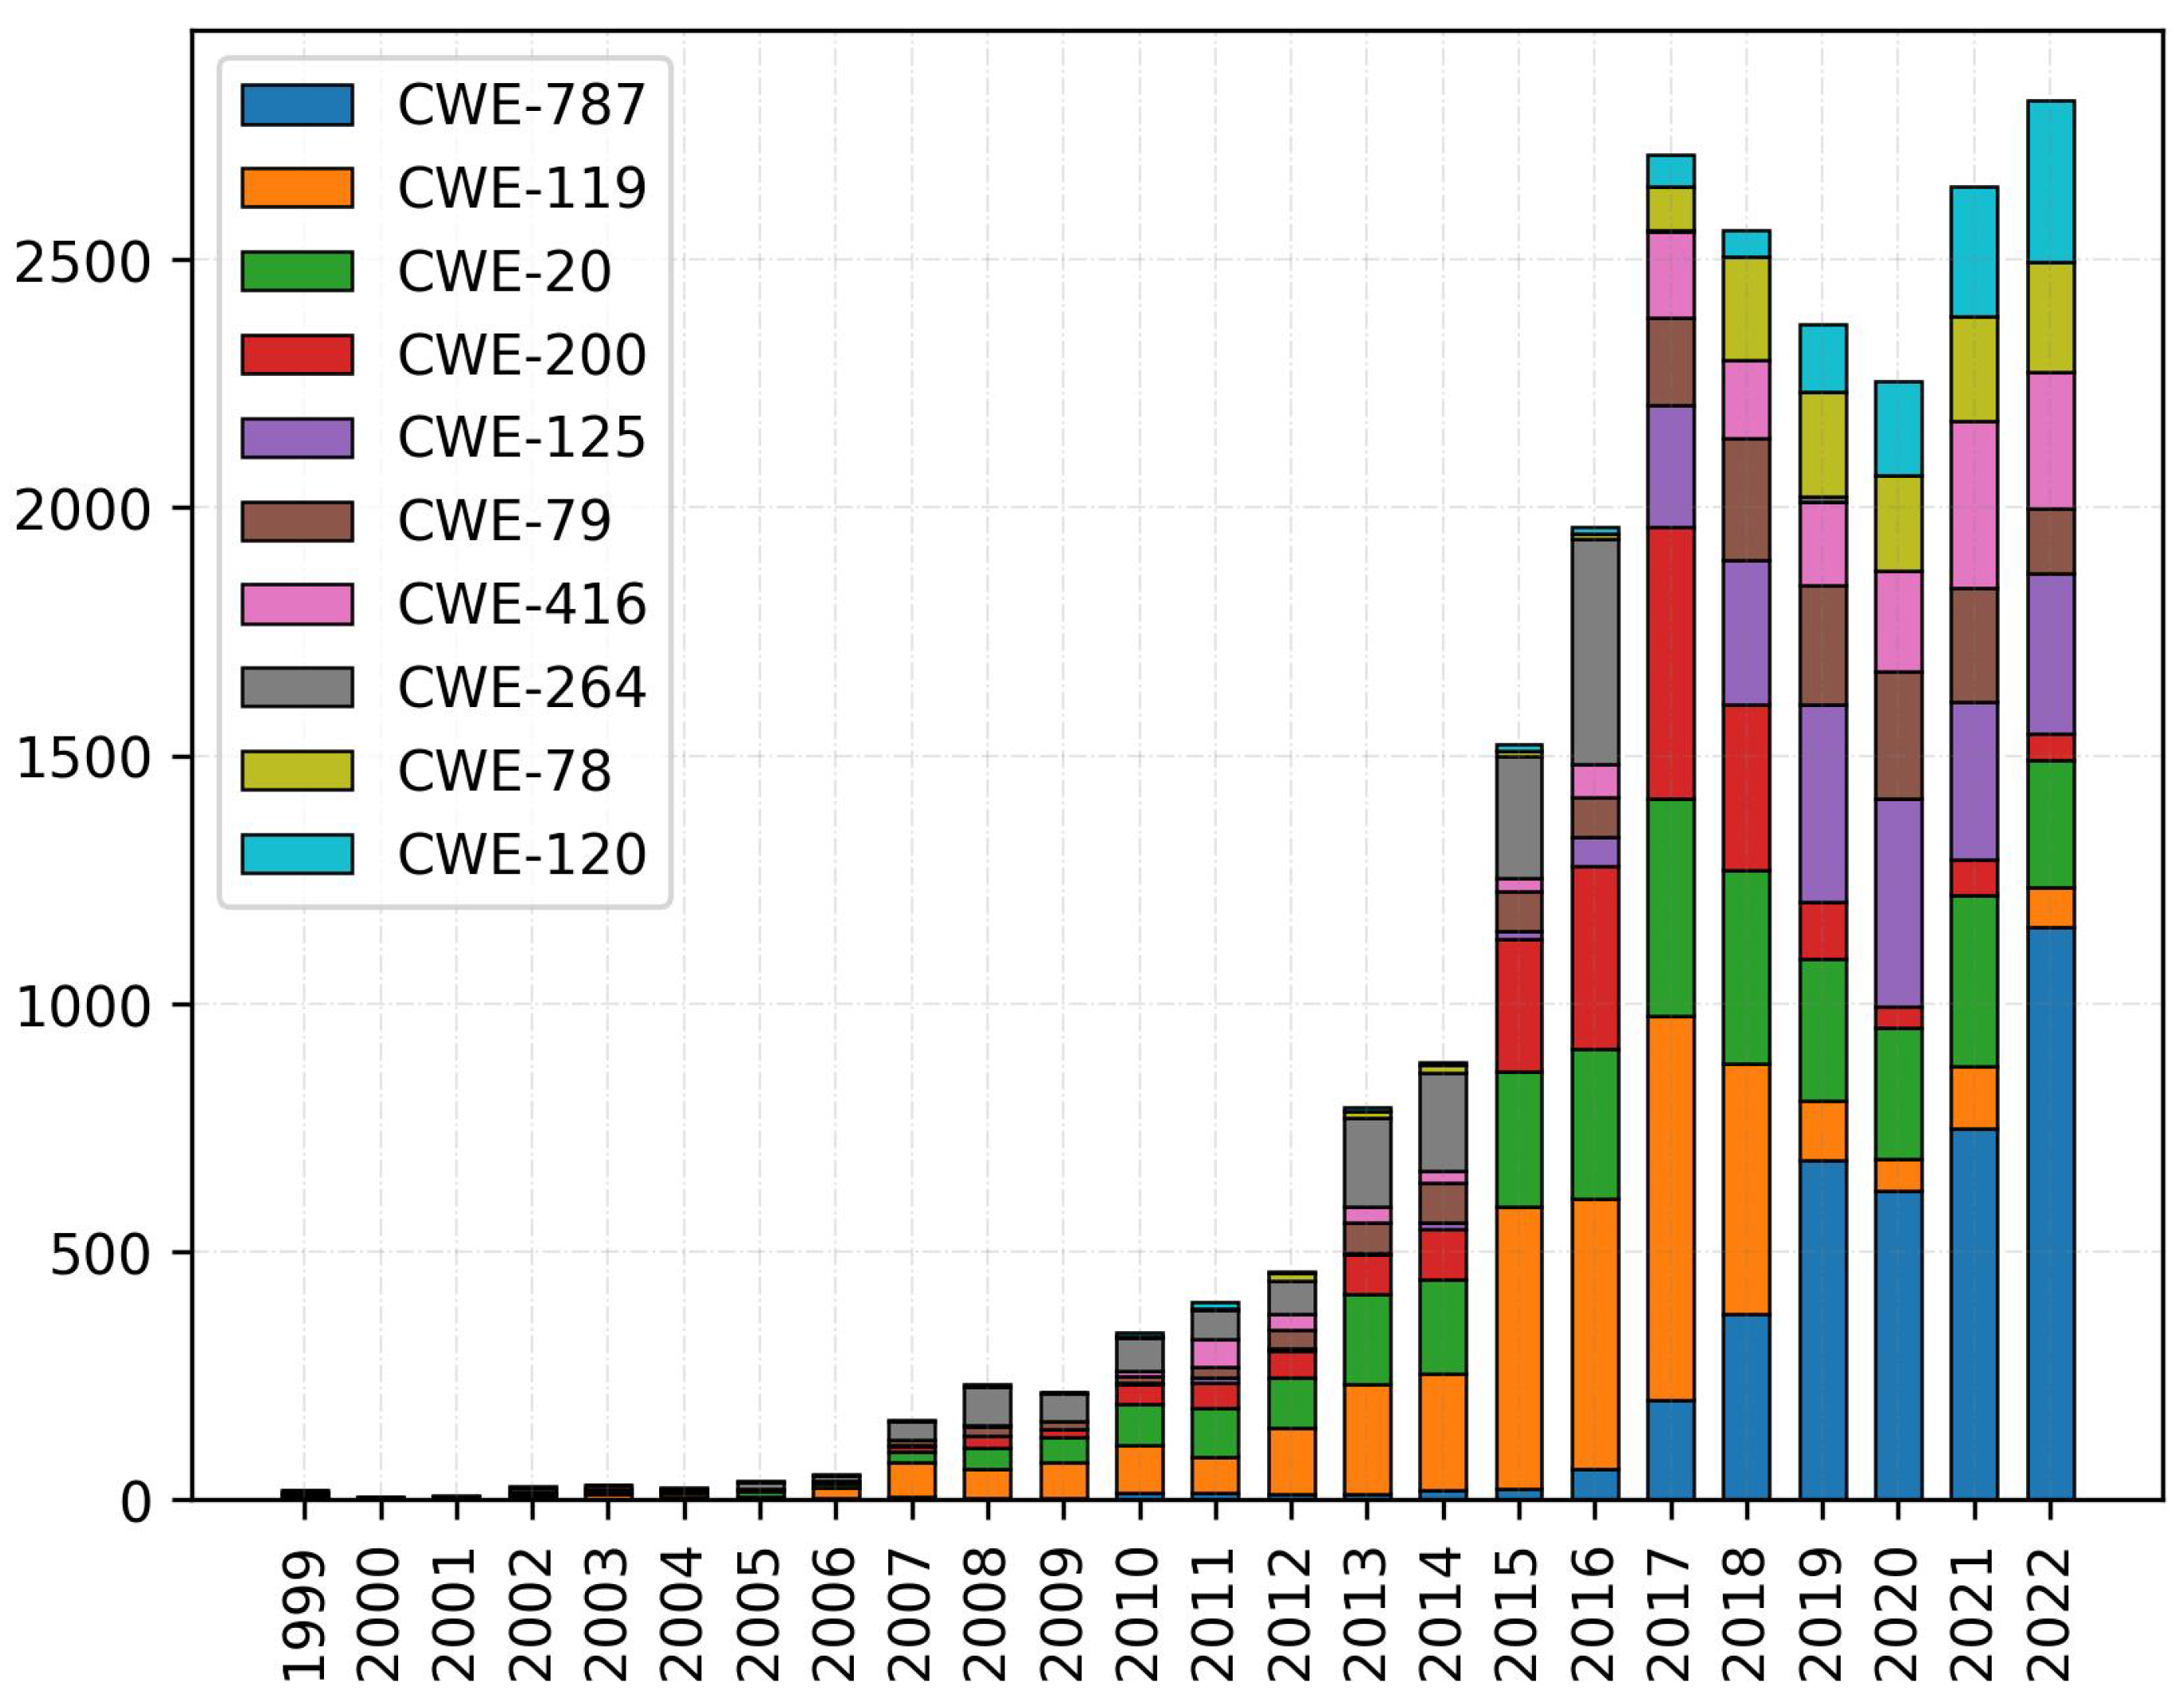
Figure 9 shows the year-wise count of each vulnerability type in our top 10 list. We present the following observations from the figure:
- There is no significant occurrence of CWE-787 until 2017 (200 instances), but rapid growth is seen in CWE-787 starting in 2018 with the all-time high among all vulnerability types in 2022 (1155 instances). This trend serves as an indicator that OSs are encountering an increasing prevalence of out-of-bounds write vulnerabilities every year, and requires immediate attention to this vulnerability type.
- CWE-119 was seen maximize at 774 in 2017; however, by 2022, this figure decreased to a mere 78 instances. This indicates that the OSs are made to be robust, with proper restriction of operations within the bounds of the memory buffer.
- CWE-200 was at its maximum in 2017 (548 instances); however, the figure reduced greatly, with only 55 instances observed in 2022. This indicates that OSs have become alert and strict about the exposure of sensitive information to unauthorized parties.
- The highest number of instances of CWE-264, totaling 453, was recorded in 2016. Surprisingly, this vulnerability exhibited a sharp decline in subsequent years, with no observations reported from 2020 to 2022. This reduction in reported CWE-264 indicates enhancement of security measures and stricter access controls, or in other words, we can say the potential vulnerabilities regarding Permissions, Privileges, and Access Controls have been adequately addressed.
- The rest of the vulnerability types exhibit consistent observations each year.
We expanded our analysis by identifying the common vulnerability types observed in our top 10 vulnerable OS categories. The findings reveal four common vulnerabilities: CWE-119, CWE-787, CWE-20, and CWE-200. Table 6 presents the count of these vulnerability types for each OS category in our top 10 list. It is noteworthy that these four vulnerabilities consistently impacted these OSs from the early 2000s to 2022, as shown by Figure 9. Furthermore, Table 7 demonstrates the most observed CWE weaknesses in our top 10 vulnerable OS versions in recent years, i.e., 2021–2022. We can observe that Windows 10 and Windows 11 are highly vulnerable to CWE-269. The CWE-269 refers to “Improper Privilege Management”, i.e., the product does not assign, check, or track the privileges for the actor. Furthermore, CWE-787 is mostly prevalent in Android versions 11 and 12 and Debian Linux versions 10 and 11 in recent years. Similarly, Windows Server 2012, Fedora 37, Android 13, and HarmonyOS 2 mostly exhibit CWE-200, CWE-416, CWE-862, and CWE-125, respectively.
These findings highlight the common vulnerability types observed across our top 10 vulnerable OS versions. By identifying these vulnerabilities, users and organizations can better understand the prevailing security risks and take appropriate measures to mitigate them. It is highly recommended that the corresponding vendors closely monitor the potential occurrence of these vulnerabilities.
6. Limitations and Future Work
Our work is focused on the analysis of OS vulnerabilities as a whole and does not distinguish between desktop OSs, mobile, IoT OSs, etc. In the future, we can make multiple domain-based OS categories and apply a similar research methodology to study the most vulnerable OSs, trends, and types in each of the categories. This will help the end-users of different OSs in different domains to choose the appropriate OS and adopt necessary precautions against the prevailing vulnerabilities.
Our paper presented the study of OS vulnerabilities from different perspectives. However, our paper lacks a study of the real-world exploitation of these OSs. We can extend this work to find the actual exploits of these vulnerabilities based on various sources, e.g., entries in Exploit-DB (Exploit-DB is the platform that records new exploits and verifies whether an actual exploit has occurred or not.) or Packetstorm (Packetstorm is the platform that reveals different real-world exploits).
7. Conclusions
In conclusion, this paper presents an extensive study of OS vulnerabilities, leveraging high-quality data from the NVD and employing a robust research methodology that involves creating two precise datasets, namely OS_CAT and OS_VER; sampling of vulnerable OSs; and an analysis of trends, severity, and types of vulnerabilities. A detailed analysis reveals that popular OSs such as Debian Linux, Android, Windows, and Fedora, among others, are highly susceptible to vulnerabilities. Most importantly, Windows 10, Windows 11, Android (v11.0, v12.0, v13.0), Windows Server 2012, Debian Linux (v10.0, v11.0), Fedora 37, and HarmonyOS 2 emerge as highly vulnerable OS versions that are still active and supported by vendors. From the vendor’s perspective, Redhat exhibits the highest number of reported vulnerabilities. Our study reveals that the top 10 OS categories and versions consistently face highly severe vulnerabilities, with maximum CVSS scores of 7–8 and 9–10. The study also reveals that the highly vulnerable OSs commonly experience four common vulnerability types viz. CWE-119, CWE-20, CWE-200, and CWE-787. On the other hand, the Linux distributions Ubuntu Linux and openSUSE have demonstrated to be the most secure OS versions in recent years, with only nine and two vulnerability reports, respectively, in 2022.
Based on these findings, it is highly recommended that OS vendors of all 10 OS categories focus on addressing these common weaknesses. The vulnerabilities represented by CWE-119, CWE-787, CWE-20, and CWE-200 are still prevalent in recent years (2021–2022). Furthermore, specific security measures should be implemented to mitigate CWE-269 (improper privilege management) in Windows 10 and Windows 11. For Android, attention should be given to addressing CWE-787 and CWE-862 (missing authorization) vulnerabilities. Debian Linux should strengthen its security measures to combat CWE-787, while Fedora 37 should focus on improving security measures related to CWE-416 (use after free). Additionally, HarmonyOS 2 should take steps to address vulnerabilities associated with CWE-125 (out-of-bounds read). These vulnerabilities are of significant concern as they largely fall into the CVSS score groups of 7–8 and 9–10, indicating a high severity. Finally, we also recommend that end-users of these OSs stay informed about the latest trends, severity levels, and types of vulnerabilities that can affect their OSs.
By shedding light on these findings, this research contributes to a better understanding of the OS vulnerability landscape, promoting the enhancement of OS security measures and vulnerability risk mitigation. The recommendations provided to OS vendors based on these findings aim to improve the security posture of their OSs, reduce the potential for exploitation, and enhance overall system resilience in the face of evolving security threats.
Author Contributions
Conceptualization, D.B.R.; methodology, M.B. and D.B.R.; validation, M.B. and D.B.R.; investigation, M.B.; resources, D.B.R.; data curation, M.B.; writing—original draft, M.B.; writing—review & editing, D.B.R.; Visualization, M.B.; Supervision, D.B.R. All authors have read and agreed to the published version of the manuscript.
Funding
This work was supported in part by the DoD Center of Excellence in AI and Machine Learning (CoE-AIML) at Howard University under Contract W911NF-20-2-0277 with the U.S. Army Research Laboratory, NSF grant #1828811 and DHS Grant 2017-ST-062-000003. However, any opinion, finding, and conclusions or recommendations expressed in this document are those of the authors and should not be interpreted as necessarily representing the official policies, either expressed or implied, of the funding agencies.
Data Availability Statement
Data in this paper will be shared upon request made to the authors.
Conflicts of Interest
The authors declare no conflict of interest.
References
- Microsoft. Windows Secure Channel Denial of Service Vulnerability. 2023. Available online: https://msrc.microsoft.com/update-guide/en-US/vulnerability/CVE-2023-21813 (accessed on 1 June 2023).
- Research, G.S. Linux (Ubuntu)–Other Users Coredumps Can Be Read via Setgid Directory and killpriv Bypass. 2018. Available online: https://www.exploit-db.com/exploits/45033 (accessed on 1 June 2023).
- Gorbenko, A.; Romanovsky, A.; Tarasyuk, O.; Biloborodov, O. Experience report: Study of vulnerabilities of enterprise operating systems. In Proceedings of the 2017 IEEE 28th International Symposium on Software Reliability Engineering (ISSRE), Toulouse, France, 23–26 October 2017; IEEE: New York, NY, USA, 2017; pp. 205–215. [Google Scholar]
- Cheikes, B.A.; Waltermire, D.; Kent, K.A.; Waltermire, D. Common Platform Enumeration: Naming Specification Version 2.3; US Department of Commerce, National Institute of Standards and Technology: Gaithersburg, MD, USA, 2011. Available online: https://csrc.nist.gov/publications/detail/nistir/7695/final (accessed on 2 June 2023).
- Peterson, J.L.; Silberschatz, A. Operating System Concepts; Addison-Wesley Longman Publishing Co., Inc.: Boston, MA, USA, 1985. [Google Scholar]
- Mell, P.; Scarfone, K.; Romanosky, S. The Common Vulnerability Scoring System (CVSS) and Its Applicability to Federal Agency Systems; US Department of Commerce, National Institute of Standards and Technology: Gaithersburg, MD, USA, 2007. Available online: https://csrc.nist.gov/publications/detail/nistir/7435/final (accessed on 5 June 2023).
- Christey, S.; Kenderdine, J.; Mazella, J.; Miles, B. Common Weakness Enumeration; Mitre Corporation: McLean, VA, USA, 2013; Available online: https://cwe.mitre.org/documents/views/view-evolution.html (accessed on 5 June 2023).
- Vander-Pallen, M.A.; Addai, P.; Isteefanos, S.; Mohd, T.K. Survey on types of cyber attacks on operating system vulnerabilities since 2018 onwards. In Proceedings of the 2022 IEEE World AI IoT Congress (AIIoT), Seattle, WA, USA, 6–9 June 2022; IEEE: New York, NY, USA, 2022; pp. 1–7. [Google Scholar]
- Kocaman, Y.; Gonen, S.; Baricskan, M.A.; Karacayilmaz, G.; Yilmaz, E.N. A novel approach to continuous CVE analysis on enterprise operating systems for system vulnerability assessment. Int. J. Inf. Technol. 2022, 14, 1433–1443. [Google Scholar] [CrossRef]
- Sonmez, F.O.; Hankin, C.; Malacaria, P. Attack Dynamics: An Automatic Attack Graph Generation Framework Based on System Topology, CAPEC, CWE, and CVE Databases. Comput. Secur. 2022, 123, 102938. [Google Scholar]
- Sharma, G.; Kumar, A.; Sharma, V. Windows operating system vulnerabilities. Int. J. Comput. Corp. Res. 2011, 1. [Google Scholar]
- Niu, S.; Mo, J.; Zhang, Z.; Lv, Z. Overview of linux vulnerabilities. In Proceedings of the 2nd International Conference on Soft Computing in Information Communication Technology, Taipei, Taiwan, 31 May–1 June 2014; Atlantis Press: Dordrecht, The Netherlands, 2014; pp. 225–228. [Google Scholar]
- Shewale, H.; Patil, S.; Deshmukh, V.; Singh, P. Analysis of android vulnerabilities and modern exploitation techniques. ICTACT J. Commun. Technol. 2014, 5, 863–867. [Google Scholar] [CrossRef]
- Kaluarachchilage, P.K.H.; Attanayake, C.; Rajasooriya, S.; Tsokos, C.P. An analytical approach to assess and compare the vulnerability risk of operating systems. Int. J. Comput. Netw. Inf. Secur. 2020, 12, 1. [Google Scholar] [CrossRef]
- Siwakoti, Y.R.; Bhurtel, M.; Rawat, D.B.; Oest, A.; Johnson, R. Advances in IoT Security: Vulnerabilities, Enabled Criminal Services, Attacks and Countermeasures. IEEE Internet Things J. 2023, 10, 11224–11239. [Google Scholar] [CrossRef]
- Gorbenko, A.; Romanovsky, A.; Tarasyuk, O.; Biloborodov, O. From analyzing operating system vulnerabilities to designing multiversion intrusion-tolerant architectures. IEEE Trans. Reliab. 2019, 69, 22–39. [Google Scholar] [CrossRef] [Green Version]
Figure 1.
Decomposition of unique CVE entries reported within the year range 1999–2022.

Figure 2.
Segregation of good CVE entries as OSs, hardware, and applications.

Figure 3.
Top 10 highly vulnerable OS categories based on all-time (1999–2022) vulnerability reports of OS categories using the OS_CAT dataset with 310,429 data points.
Figure 3.
Top 10 highly vulnerable OS categories based on all-time (1999–2022) vulnerability reports of OS categories using the OS_CAT dataset with 310,429 data points.

Figure 4.
Top 10 highly vulnerable OS versions under corresponding OS categories based on all-time vulnerability reports of OS versions using the OS_VER dataset with 465,084 data points.
Figure 4.
Top 10 highly vulnerable OS versions under corresponding OS categories based on all-time vulnerability reports of OS versions using the OS_VER dataset with 465,084 data points.

Figure 5.
Top 10 vendors with the highest number of vulnerable OSs based on all-time vulnerability reports of OS categories using the OS_CAT dataset within the timeframe of 1999–2022.
Figure 5.
Top 10 vendors with the highest number of vulnerable OSs based on all-time vulnerability reports of OS categories using the OS_CAT dataset within the timeframe of 1999–2022.

Figure 6.
Year-wise vulnerability count of top 10 OS categories using the OS_CAT dataset based on the vulnerability frequencies over the years 1999–2022.
Figure 6.
Year-wise vulnerability count of top 10 OS categories using the OS_CAT dataset based on the vulnerability frequencies over the years 1999–2022.

Figure 7.
CVSS scores for the top 10 OS categories using our OS_CAT dataset.

Figure 8.
CVSS scores for our top 10 highly vulnerable OS versions in recent years (2021–2022) using our OS_VER dataset.
Figure 8.
CVSS scores for our top 10 highly vulnerable OS versions in recent years (2021–2022) using our OS_VER dataset.

Figure 9.
Year-wise observation of the top 10 vulnerability types (CWE IDs).


Table 1.
Examples of categorization of OSs in CPE configuration.
| Vendor | OS Name | Version | CVE ID | CPE Configuration |
|---|---|---|---|---|
| Android | 12.0 | CVE-2022-30713 | ||
| Debian | Debian Linux | 10.0 | CVE-2022-22577 |
Table 2.
Examples showing the CVE records with multiple vulnerabilities count (#) in OS categories and OS versions.
Table 2.
Examples showing the CVE records with multiple vulnerabilities count (#) in OS categories and OS versions.
| CVE ID | #Unique Vuln OS Categories | #Unique Vuln OS Versions |
|---|---|---|
| CVE-2021-44142 | 18/23 | 35/40 |
| CVE-2021-26884 | 6/6 | 16/16 |
Table 3.
OS vulnerability datasets derived using 54549 unique CVE IDs associated with OSs.
| Dataset Name | Number of Data Points | Description |
|---|---|---|
| OS_CAT | 310,429 | Versions aggregated together |
| OS_VER | 465,084 | Versions taken independently |
Table 4.
Vulnerability count (#) of OS versions that are still maintained by their respective vendors, during 2021–2022, using our OS_VER dataset.
Table 4.
Vulnerability count (#) of OS versions that are still maintained by their respective vendors, during 2021–2022, using our OS_VER dataset.
| Rank | Operating System | Vendor | Release Date | #Vulnerabilities |
|---|---|---|---|---|
| 1 | Windows 10 | Microsoft | 29 July 2015 | 8659 |
| 2 | Windows 11 | Microsoft | 5 October 2021 | 1293 |
| 3 | Android 11 | 8 September 2020 | 1283 | |
| 4 | Debian Linux 10 | Debian | 6 July 2019 | 1206 |
| 5 | Android 12 | 4 October 2021 | 1148 | |
| 6 | Debian Linux 11 | Debian | 14 August 2021 | 871 |
| 7 | Windows Server 2012 | Microsoft | 25 November 2013 | 753 |
| 8 | Fedora 37 | Fedora Project | 15 November 2022 | 333 |
| 9 | Android 13 | 15 August 2022 | 328 | |
| 10 | HarmonyOS 2 | Huawei | 2 June 2021 | 323 |
Table 5.
Top 10 vulnerability types across all OSs with their CWE IDs, overall count, and description.
Table 5.
Top 10 vulnerability types across all OSs with their CWE IDs, overall count, and description.
| CWE ID | Count | Description |
|---|---|---|
| CWE-787 | 3945 | Out-of-bounds Write |
| CWE-119 | 3802 | Improper Restriction of Operations within the Bounds of a Memory Buffer |
| CWE-20 | 3365 | Improper Input Validation |
| CWE-200 | 2199 | Exposure of Sensitive Information to an Unauthorized Actor |
| CWE-125 | 2105 | Out-of-bounds Read |
| CWE-79 | 1707 | Cross-site Scripting |
| CWE-416 | 1568 | Use After Free |
| CWE-264 | 1508 | Permissions, Privileges, and Access Controls |
| CWE-78 | 1208 | OS Command Injection |
| CWE-120 | 1107 | Classic Buffer Overflow |
Table 6.
Common vulnerability types observed in our top 10 vulnerable OS categories.
| Count of Vulnerability Types | ||||
|---|---|---|---|---|
| OS Names | CWE-119 | CWE-787 | CWE-20 | CWE-200 |
| Debian Linux | 515 | 768 | 434 | 233 |
| Android | 371 | 744 | 367 | 321 |
| Windows | 205 | 75 | 266 | 325 |
| Fedora | 156 | 441 | 154 | 89 |
| Ubuntu Linux | 366 | 269 | 201 | 135 |
| Windows Server | 142 | 76 | 257 | 306 |
| Mac OS | 696 | 334 | 233 | 188 |
| openSUSE | 291 | 216 | 147 | 88 |
| Iphone OS | 757 | 297 | 200 | 205 |
| tvOS | 403 | 242 | 75 | 48 |
Table 7.
Mostly observed CWE ID along with their maximum counts in our top 10 vulnerable OS versions in recent years (2021–2022).
Table 7.
Mostly observed CWE ID along with their maximum counts in our top 10 vulnerable OS versions in recent years (2021–2022).
| OS Versions | Mostly Observed CWE | Count |
|---|---|---|
| Windows 10 | CWE-269 | 2043 |
| Windows 11 | CWE-269 | 225 |
| Android 11 | CWE-787 | 258 |
| Debian Linux 10 | CWE-787 | 373 |
| Android 12 | CWE-787 | 192 |
| Debian Linux 11 | CWE-787 | 130 |
| Windows Server 2012 | CWE-200 | 226 |
| Fedora 37 | CWE-416 | 59 |
| Android 13 | CWE-862 | 44 |
| HarmonyOS 2 | CWE-125 | 38 |
Disclaimer/Publisher’s Note: The statements, opinions and data contained in all publications are solely those of the individual author(s) and contributor(s) and not of MDPI and/or the editor(s). MDPI and/or the editor(s) disclaim responsibility for any injury to people or property resulting from any ideas, methods, instructions or products referred to in the content. |
© 2023 by the authors. Licensee MDPI, Basel, Switzerland. This article is an open access article distributed under the terms and conditions of the Creative Commons Attribution (CC BY) license (https://creativecommons.org/licenses/by/4.0/).
Share and Cite
MDPI and ACS Style
Bhurtel, M.; Rawat, D.B. Unveiling the Landscape of Operating System Vulnerabilities. Future Internet 2023, 15, 248. https://doi.org/10.3390/fi15070248
AMA Style
Bhurtel M, Rawat DB. Unveiling the Landscape of Operating System Vulnerabilities. Future Internet. 2023; 15(7):248. https://doi.org/10.3390/fi15070248
Chicago/Turabian StyleBhurtel, Manish, and Danda B. Rawat. 2023. "Unveiling the Landscape of Operating System Vulnerabilities" Future Internet 15, no. 7: 248. https://doi.org/10.3390/fi15070248
Note that from the first issue of 2016, this journal uses article numbers instead of page numbers. See further details here.