
Significance of Intermittent Mixing in Mesophilic Anaerobic Digester
by
 , , and
Buta Singh
1,*,
Kornél L. Kovács
2,
Zoltán Bagi
2,
Máté Petrik
1,
Gábor L. Szepesi
1,
Zoltán Siménfalvi
1 and
and
Zoltán Szamosi
1 1
Institute of Energy Engineering and Chemical Machinery, University of Miskolc, 3515 Miskolc, Hungary
2
Department of Biotechnology, University of Szeged, 6720 Szeged, Hungary
*
Author to whom correspondence should be addressed.
Fermentation 2022, 8(10), 518; https://doi.org/10.3390/fermentation8100518
Submission received: 15 September 2022
/
Revised: 28 September 2022
/
Accepted: 5 October 2022
/
Published: 7 October 2022
(This article belongs to the Special Issue Anaerobic Fermentation – a Biological Route towards Achieving Net Neutrality)
Abstract
:The mixing of slurry in an anaerobic digester (AD) is one of many key parameters, which have a significant effect on specific biogas yield (BY) and volatile solid (VS) removal rate. The determination of the optimum mixing regime in a digester is very complex as it depends on a large number of internal and external factors such as microbial community, the rheology of slurry, digester and impeller design, mixing intensity, and mixing intervals. The novelty of this study is the investigation of the optimum mixing regime in a lab-scale digester under semi-continuous mixing regimes by the continuous monitoring of the physicochemical properties of the digestate. In this study, a helical ribbon (HR) impeller was used for the agitation of the slurry operated at 67 rpm for 5 min under various agitation intervals (1 h, 2 h, 3 h, and 4 h). The results showed a 6–12% reduction in BY as the time between mixing operations increased. The highest BY was observed at a mixing frequency of 5 min/h, which produced a total of 54.1 L of biogas as compared to the mixing frequencies of 2 h, 3 h, and 4 h, where the BYs were recorded as 51.2 L, 49.8 L, and 47.3 L, respectively. Volatile fatty acids (VFAs) and FOS/TAC ratio were stabilized at 5–7 Gl−1 and 0.3–0.5, respectively. The appropriate mixing intensity was determined to obtain the highest biogas production, which could lead to lower power consumption for mixing operations.
1. Introduction
Waste-to-energy conversion is one of the most appealing renewable energy technologies in the modern era and recent political/economical/military turbulences. The anaerobic digestion (AD) process is one of them which is receiving more attention day by day due to its low carbon footprints per unit of power production [1]. It has been intensively studied over the past years in order to enhance energy recovery from the organic waste in biogas plants [2,3,4]. The efficiency of a biogas plant is mainly determined by the amount of methane production and the internal power consumption of the plant. Internal operations in a commercial biogas plant consume power for loading, transportation, the mechanical pretreatment of the substrate, the mixing of slurry, etc. The mixing of slurry is one of the prominent factors that determine efficiency in terms of both biogas production and internal power consumption. Anaerobic digesters are usually configured as continuously stirred reactors in order to provide effective mixing for the homogeneous dispersion of the substrate and the heating energy, reduce solid settling and short-circuiting, and preserve the retention time [5]. The optimum hydrodynamic mixing plays a vital role to achieve maximum biogas recovery and a higher organic removal rate. The adequate mixing of slurry also refers to the uniform distribution of fresh substrate to decrease the reaction time and the release of entrapped biogas, avoiding temperature and pH gradients in the entire volume of an AD slurry and hydraulic shear force without breaking the bacterial/archaea morphology [6].
Inadequate mixing can cause the failure of a biogas plant, the accumulation of solids at the bottom along with the formation of foam, scum, and crust at the top of the surface. Nearly 44% of large-scale biogas plants experience sedimentation and crust layer formation from time to time due to improper mixing [7]. Moreover, the mixing operation also consumes 54% of the total electricity consumption by the biogas plant. One possibility to increase the efficiency of a biogas plant is to reduce the mixing time. Therefore, optimum mixing in an AD becomes very critical, especially while operating at a high organic loading rate (OLR) and short hydraulic retention times (HRT). Typically, the mixing operation in a biogas plant is undertaken by three modes, i.e., mechanical, slurry recirculation, and biogas recirculation. According to Lemmer et al. [8], mechanical mixing is the most common among all mixing methods. In mechanical mixing, both mixing intensity and duration impact the biogas production in a biogas plant substantially [9].
Numerous studies can be found which include the optimization of the impeller design and the mixing speed of the impeller [10,11,12,13,14,15]. Singh et al. [6,9] compared the various designs, which were used for the optimization of mixing in the digester. However, documented data on the influence of mixing and ideal intensity are insufficient due to the variation in various parameters in individual experiments such as temperature, total solid (TS) content, and HRT, along with the impeller and digester design. The mixing regime refers to the rotational speed of the impeller and the time gap between the operations of the mixer in a semi-continuous mixing operation [15,16,17]. While intense mixing has been suggested to boost the biodegradation of volatile solids by raising their solubility and area of contact with bacteria, it has also been reported to inhibit the creation of flocks, where syntrophic microbial interactions can occur, and to cause propionate accumulation [18,19]. Higher mixing intensities can significantly affect the composition of the microbial communities (disruption of bacterial flocs) and hence biomass activity, which may result in the reduction in biogas production rates [20,21,22,23]. In the case of mechanical mixing techniques, the different impeller designs and speeds are analyzed [21,24], whereas, for the slurry recirculation, the biogas recirculation, the inlet injection positions and design of nozzles, the recirculation rate, and the mass flow rates are evaluated to optimize mixing in an anaerobic digester [25].
Various studies demonstrated that intermittent mixing operations resulted in the higher efficiency of an anaerobic digester as compared to continuous mixing operations [13,14,26]. In the recent advancements in mixing techniques in an anaerobic digester, conductive additives such as granular activated carbon (GAC) and powdered activated carbon (PAC) are used to evaluate methane productivity and kinetics along with a comprehensive characterization of the quantitative and qualitative features of microbial communities to elucidate the underlying mechanisms of the impacts of different mixing conditions [25]. Tian et al. [15] compared BYs at different agitation intervals (continuous, 2 h, 4 h, 8 h, and 12 h) in a lab scale digester. It was observed that at an agitation interval of 2 h, the highest biogas production rate of 508 ± 49 biogas mL gTS−1 was achieved, which was 14-29% higher than other mixing regimes due to a reduction in floating layers. The floating layers and sedimentation were attributed to the poor contact of the substrate microorganisms. According to Semen et al. [27] the lower the decrease in the agitation interval in a full-scale biogas plant, the higher the specific yield of 11.7% and a decrease in internal energy consumption of 10.4%. Kowalczyk et al. [28] found that 29% of power was saved when the mixing operation time was reduced from 7 h to 2 h day−1 without any negative impact on BY.
Previous studies showed how the results of the optimization of mixing in digesters can vary. In addition, the data regarding the rheology of the slurry, the impeller, and the digester design are missing in most studies, which is a very important aspect to evaluate the mixing in any vessel because the mixing operation is a physical process [29]. The present study investigated the effect of increasing the mixing interval time on the efficiency of the AD process and overall BY. Various parameters such as VFAs, pH, the FOS/TAC ratio, and ammonia concentrations were measured throughout the experiment to have a deeper insight into the process. Based on previous experiments [30], the rotational speed of the mixer was adjusted to 67 rpm.
2. Experimental Setup
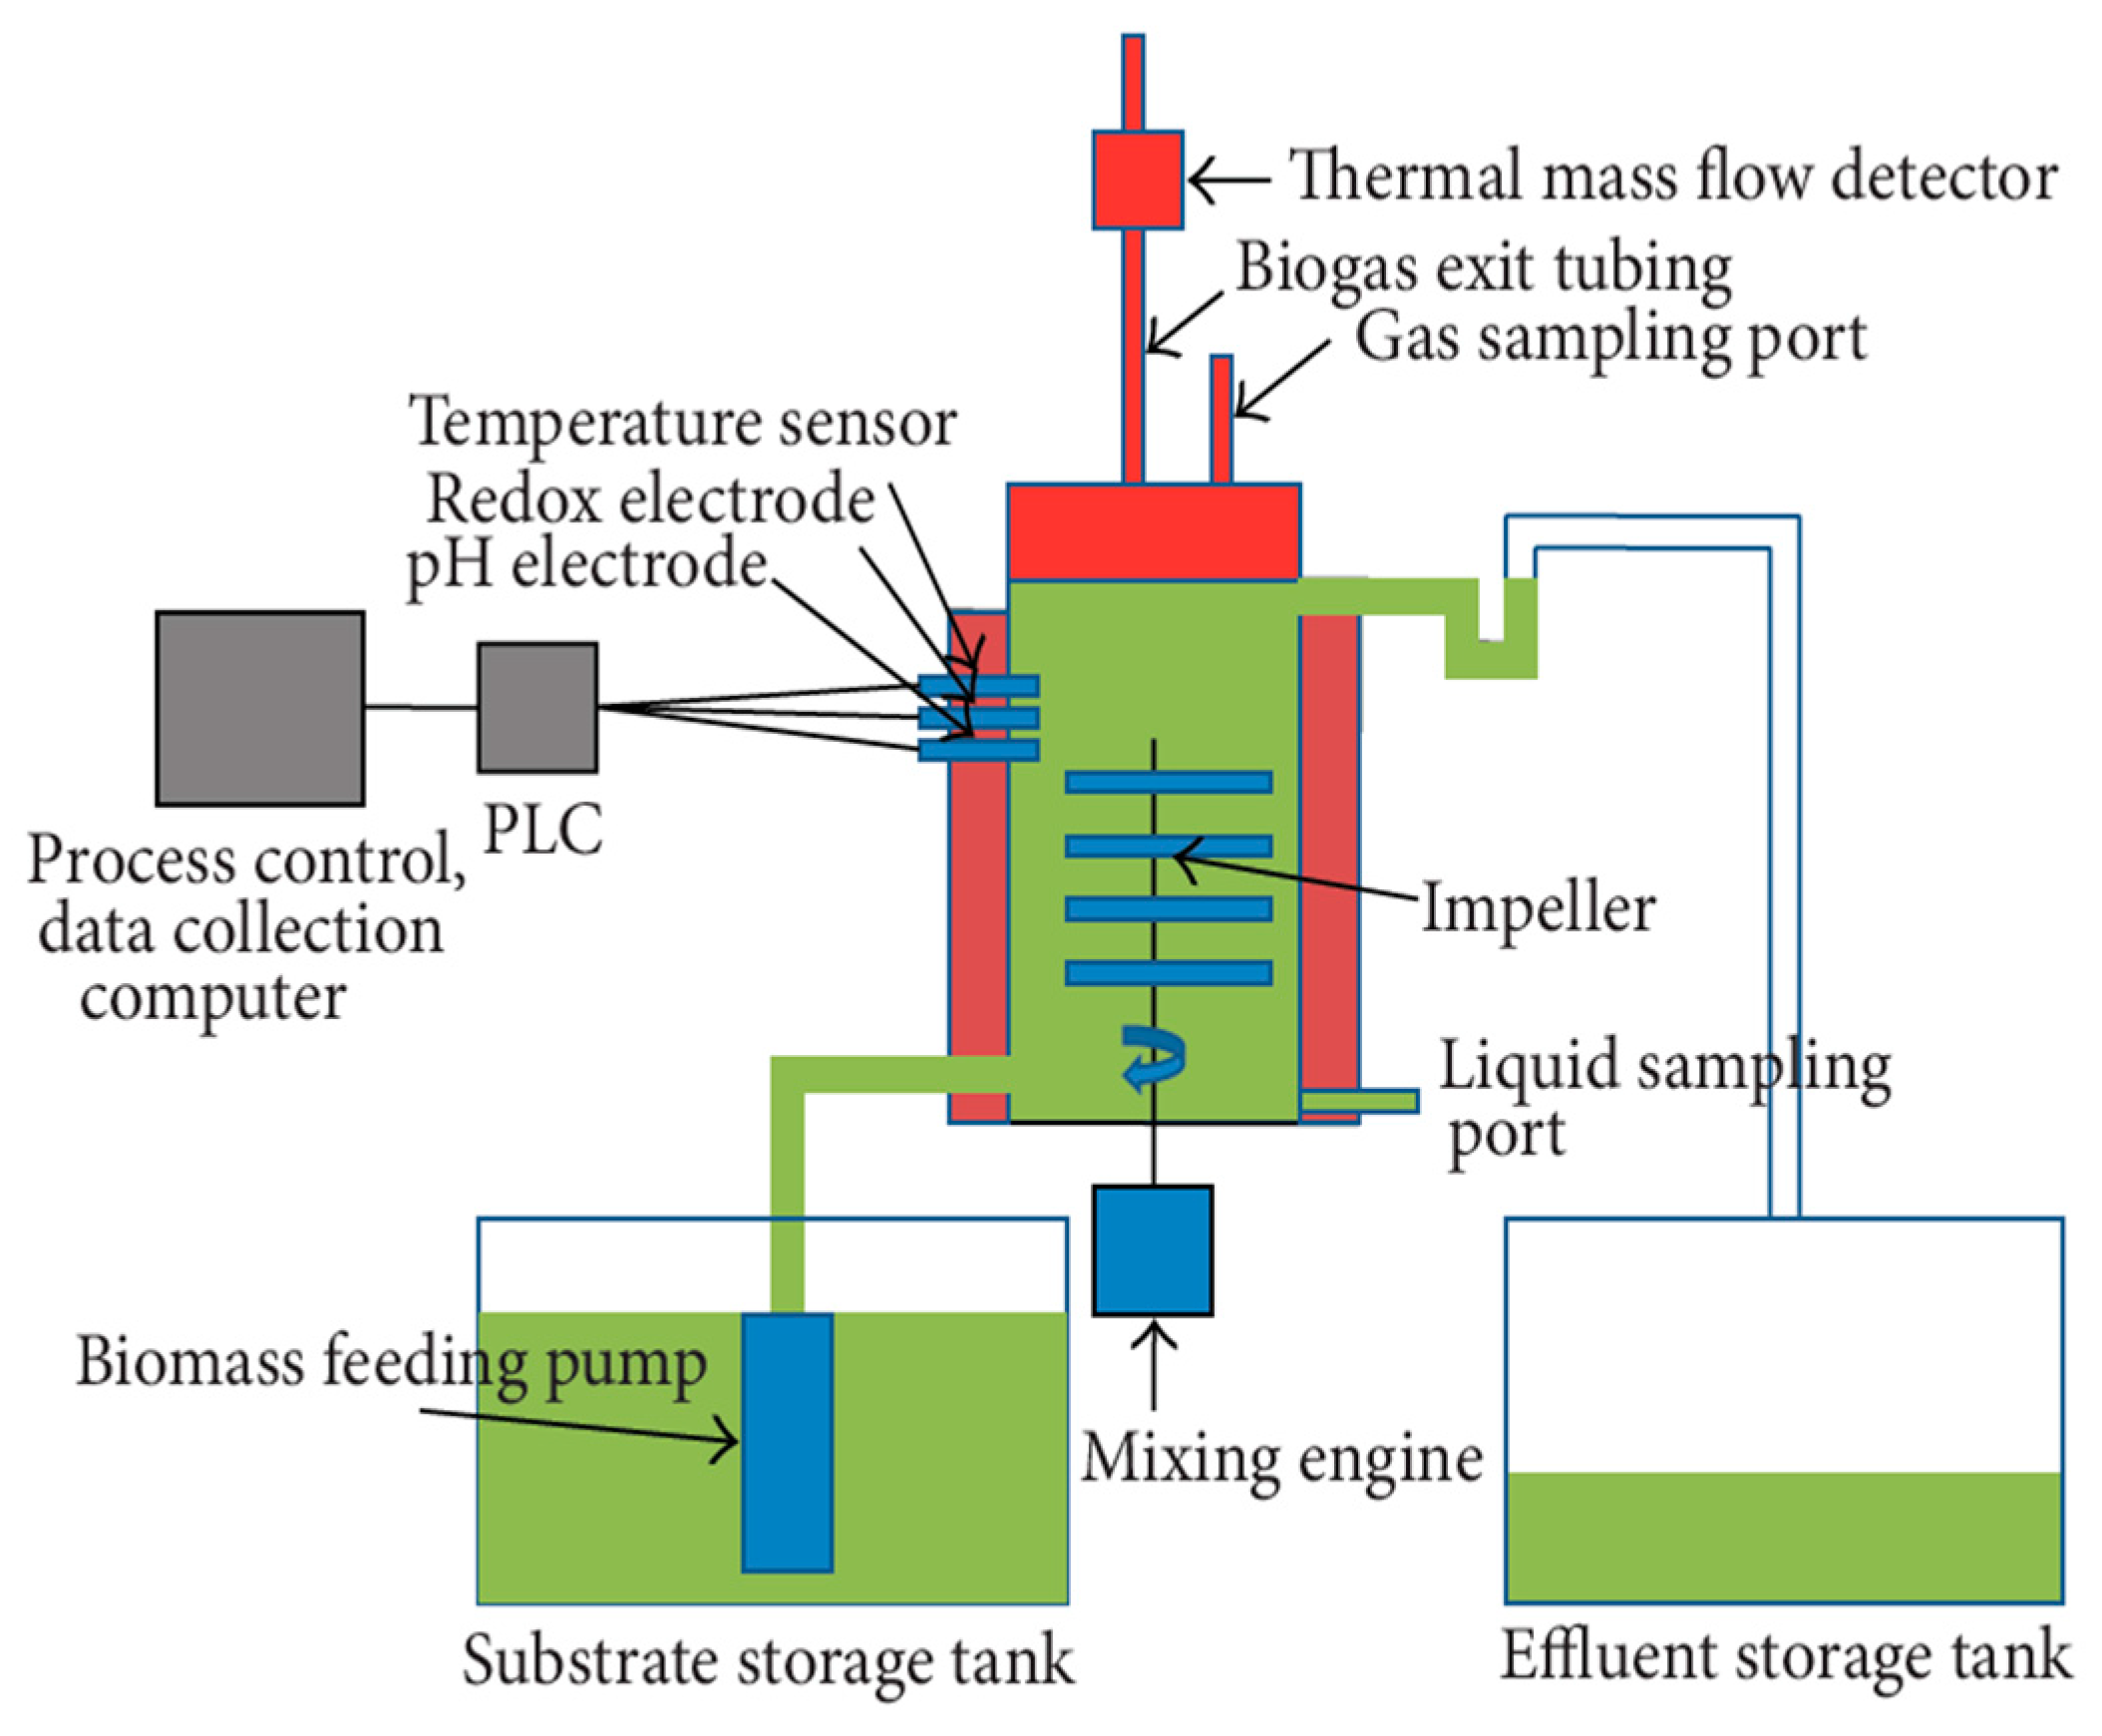
The experiments were undertaken in three identical, single-stage, continuously fed 5 L lab-scale digesters, with a headspace volume of 1 L, formed from stainless steel by Biospin Ltd. Szeged, Hungary [31]. The digesters were operated in identical operating conditions. The schematic 2D diagram of the setup is shown in Figure 1. The key parameters (temperature, mixing speed, and pH) were automatically controlled by computer software. The digesters were named as F1, F2, and F3 for reference. All the impellers were operated by the same electric motor in order to maintain identical mixing conditions. The temperature in the reactor was controlled with an electric heating jacket around the vessel with an accuracy of ±0.5 °C. Three sets of experiments were conducted in parallel to observe the effect of varying shear rates on biogas production rates and methane content. The experiment lasted for 100 days, including two weeks of a pre-run phase.
2.1. Inoculum Feeding, Substrates, and Sampling
The digestate was collected from a commercial biogas plant in Szeged and stored at 4 °C before the start of the experiment. The substrate consisted of a mixture of pig slurry and ensilaged sweet sorghum. In total, 5 L of incubated substrate slurry was added to each of the three digesters. To ensure a steady digestion process and consistent biogas output, the experiment was pre-run for two weeks. At the start of the experiment, ultrapure nitrogen gas was utilized to replace the headspace. Every day, 1 gVS L−1 of α-cellulose was injected into the digester. The digesters were run at a mesophilic temperature (37 °C) with a 15-day HRT. Table 1 displays several parameters of the initial sludge. The TS concentration of the slurry remained constant at 4.28 percent. Digestate samples were taken from the bottom of the digester after mixing.
2.2. Mixing Mode
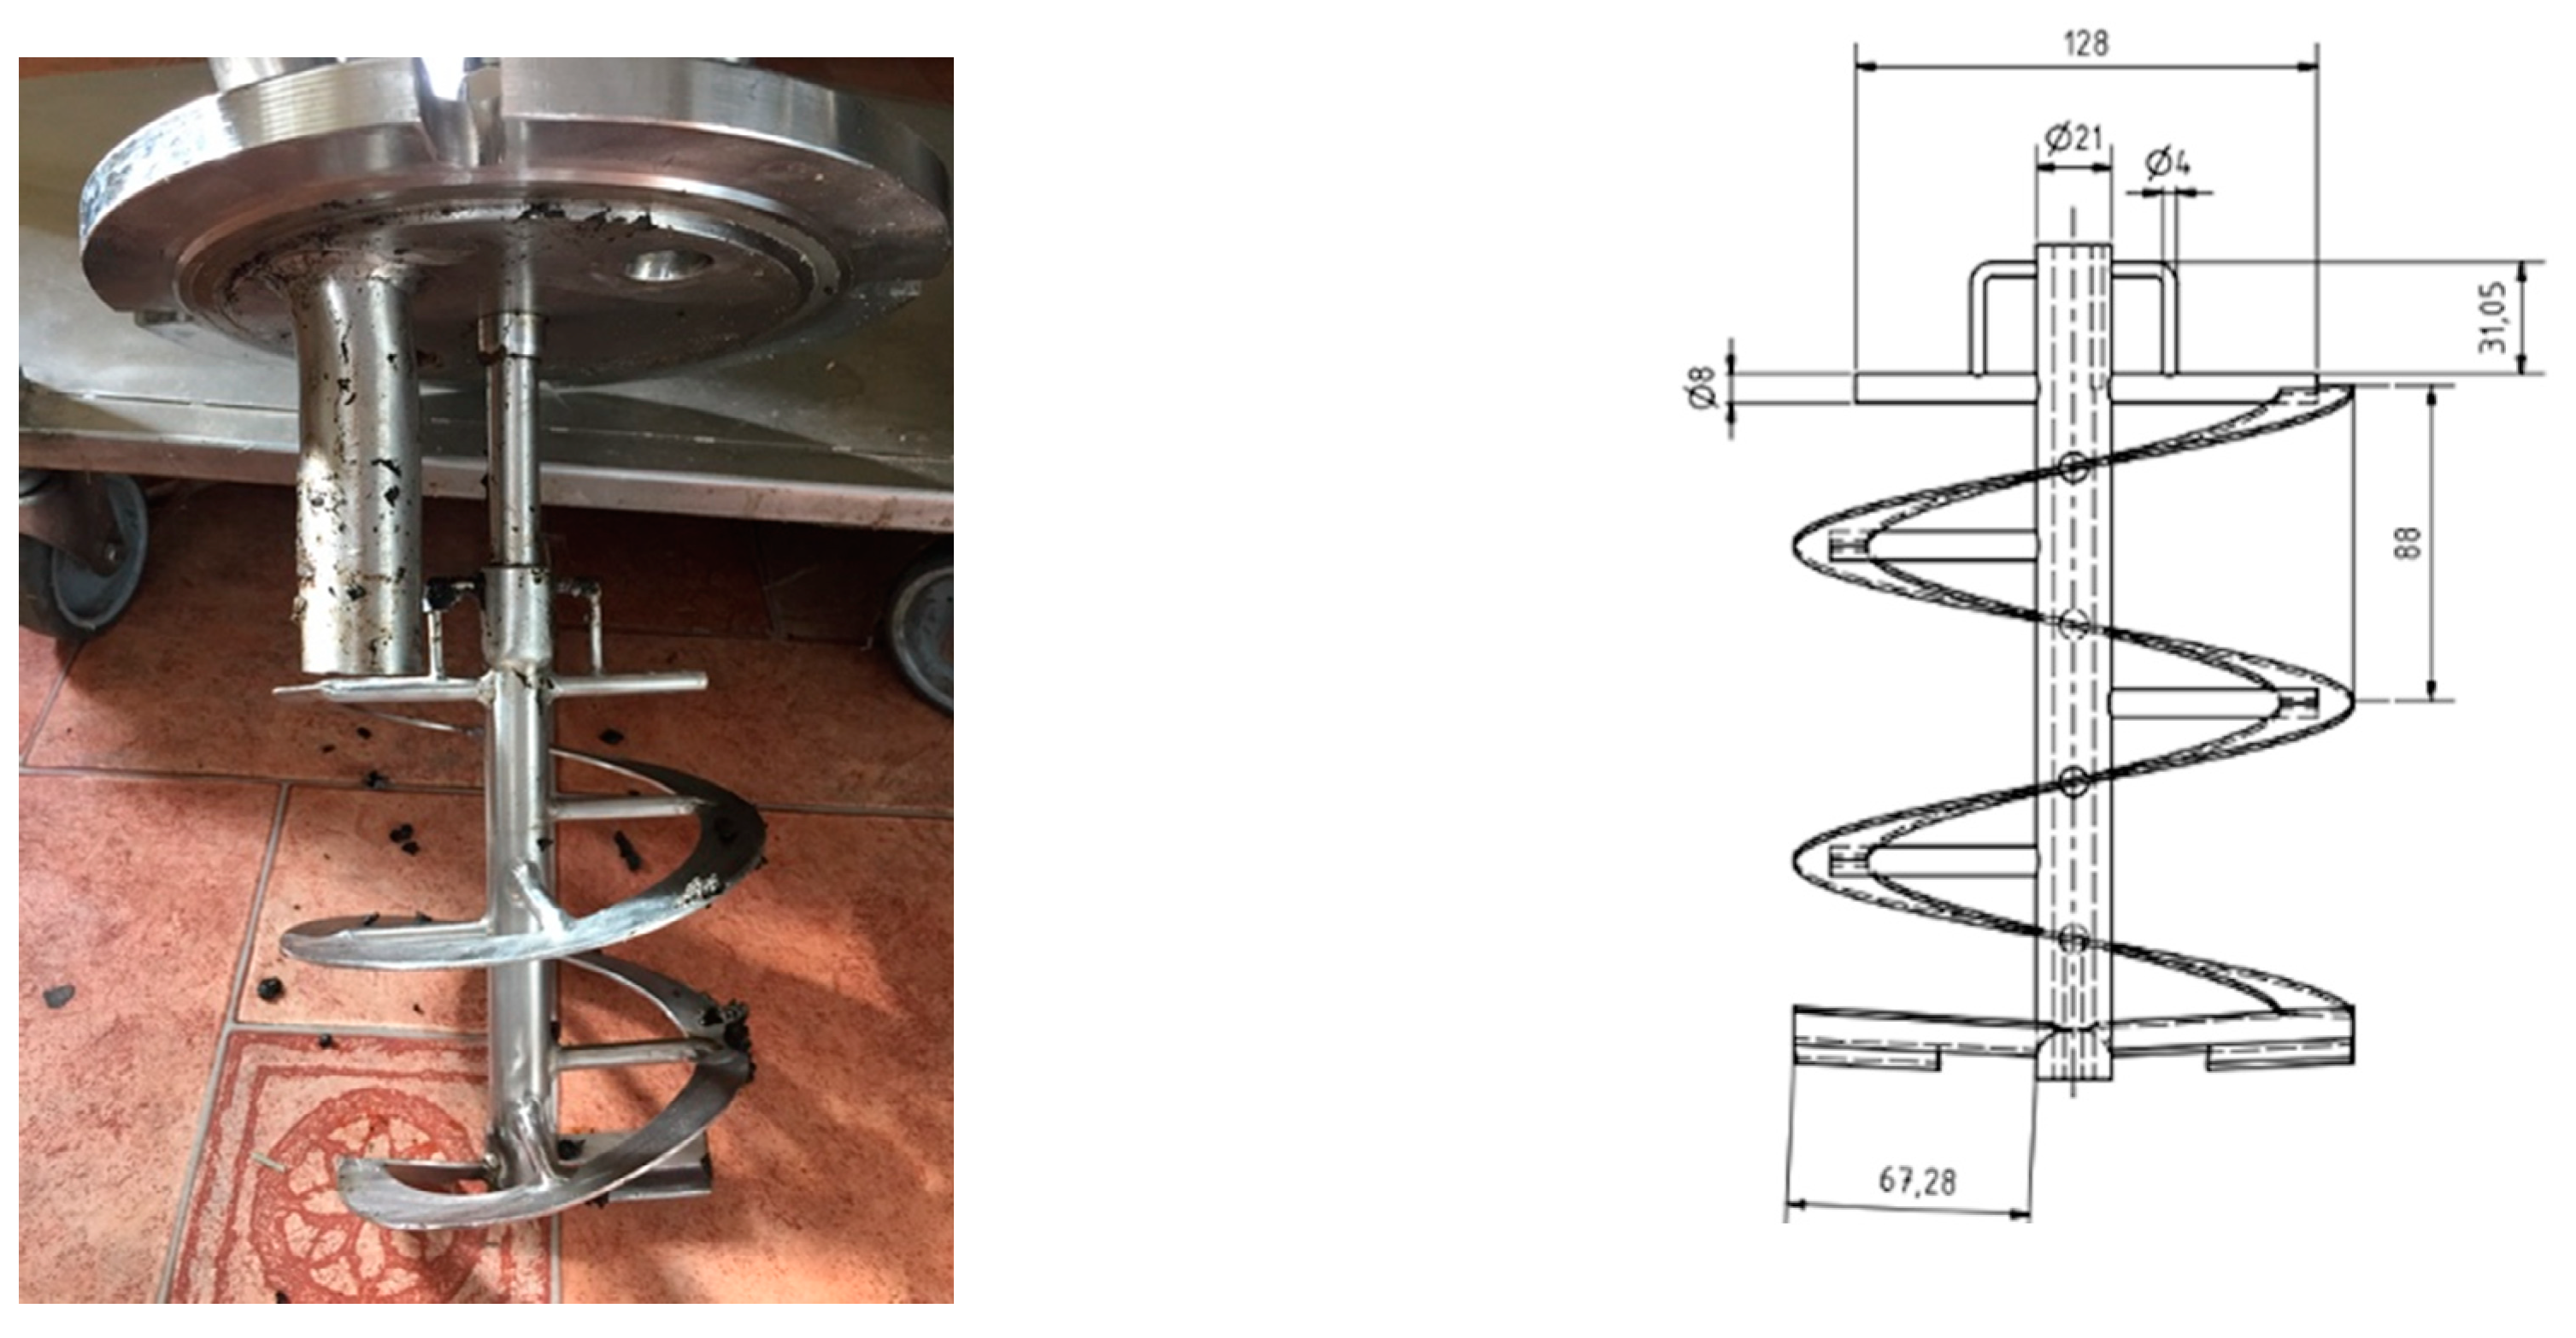
Mechanical mixing using a helical ribbon impeller (Figure 2) was used in this experiment throughout. The intermittent mixing operation was carried out at an agitation rate of 67 rpm for all three digesters. For this purpose, the impellers were turned on for a period of 5 min with turn-off resting intervals of 1 h, 2 h, 3 h, and 4 h.
2.3. Analytical Methods
2.3.1. Gas Analysis
Gas volume values were recorded every four hours by means of direct mass flow controllers (DMFC, Brooks Instruments) attached to each gas exit port. Biogas composition was analyzed using a gas chromatograph (6890N Net-work GC system, Agilent Technologies). A 250 µL gas sample was collected from the headspace and injected into a gas chromatograph that was equipped with a 5 Å molecular sieve column (length 30 m, I.D. 0.53 megabore, film 23 µm) and a thermal conductivity detector.
2.3.2. Volatile Fatty Acids
HPLC (Hitachi Elite, equipped with an ICSep ICE-COREGEL 64H column and a refractive index detector L2490) was used to determine Volatile acids under the following conditions: a solvent of 0.1 N H2SO4, a flow rate of 0.8 mL min−1, a column temperature of 50 °C, and a detector temperature of 41 °C. In total, 10 mL of samples were collected from each digester for analysis. The samples were centrifuged at 13,000 rpm for 10 min to separate the solid and liquid and then filtered through a 0.45 μm membrane. The samples were analyzed every week.
2.3.3. TS and oTS Content
The dry matter content was determined by drying the substrate at 105 °C for 24 h and measuring the residues. The residue was further heated at 550 °C in the oven until its weight did not alter to determine the overall organic solid material.
3. Results and Discussion
3.1. CFD Analysis
In a previous study [30], various mixing speeds (10 rpm, 30 rpm, and 67 rpm) of the impeller in the same AD were compared. Cfd analysis demonstrated the occurrence of substantial unmixed zones at lower mixing speeds, which reached near zero velocities. Slurry homogeneity was achieved at a speed of 67 rpm. Previous experimental results also indicated that increasing the impeller speed to a certain optimal level may increase the mixing performance. Beyond that limit, the power consumption rapidly increases with only a slight improvement in the mixing performance and a decrease in the biogas output. The maximum particle velocity achieved at 67 rpm was noted as 0.24 ms−1, whereas, the average velocity in the entire experiment was calculated as 0.10 ms−1. The dead zone volumes at 67 rpm were reduced to 2%. Following the determination of the optimum mixing regime, the effect of various mixing intervals on biogas yield was further studied.
3.2. Experimental Analysis
3.2.1. Start-Up Phase
All digesters were pre-run until a stable biogas production rate was obtained. The OLRs by α-cellulose substrate were set at 5 g day−1, i.e., 1 g L−1, for the entire experiment, and the reactors were fed once a day. During the start-up phase, process instabilities were observed that might be caused by increased hydrogen concentrations, which result in a better breakdown to propionic acid rather than acetic acid, carbon dioxide, and hydrogen [32]. After the first two weeks of the pre-run, the operation of the digesters became stable with 3.38 ± 0.56–3.56 ± 0.45 L day−1 gas production. After the pre-run period of 15 days, the biogas production was constant and the FOS/TAC ratio was recorded as 0.39 ± 0.06, which is considered normal as it indicates that the digestion process was stable. Different mixing intervals were started at day 15.
3.2.2. Effect of Mixing Intervals on Overall Biogas Yield (BY)
According to the results of our previous study [30], the mixing speed of 67 rpm was selected for further investigation of the effect of interval time, i.e., the resting, non-mixing period in between the mixing operations, on biogas production rate. All three digesters were run with identical parameters such as TS content, temperature, and mixing regimes. A mixing interval time of 1 h was selected in the initial stage (after the start-up phase) of the experiment from day 1 to day 20, which further increased to 2 h, 3 h, and 4 h. The use of three parallel digesters is preferred to obtain more precise data on the effects of varying parameters during the whole experiment. Accordingly, similar trends in all reactors were observed at a particular defined mixing regime.
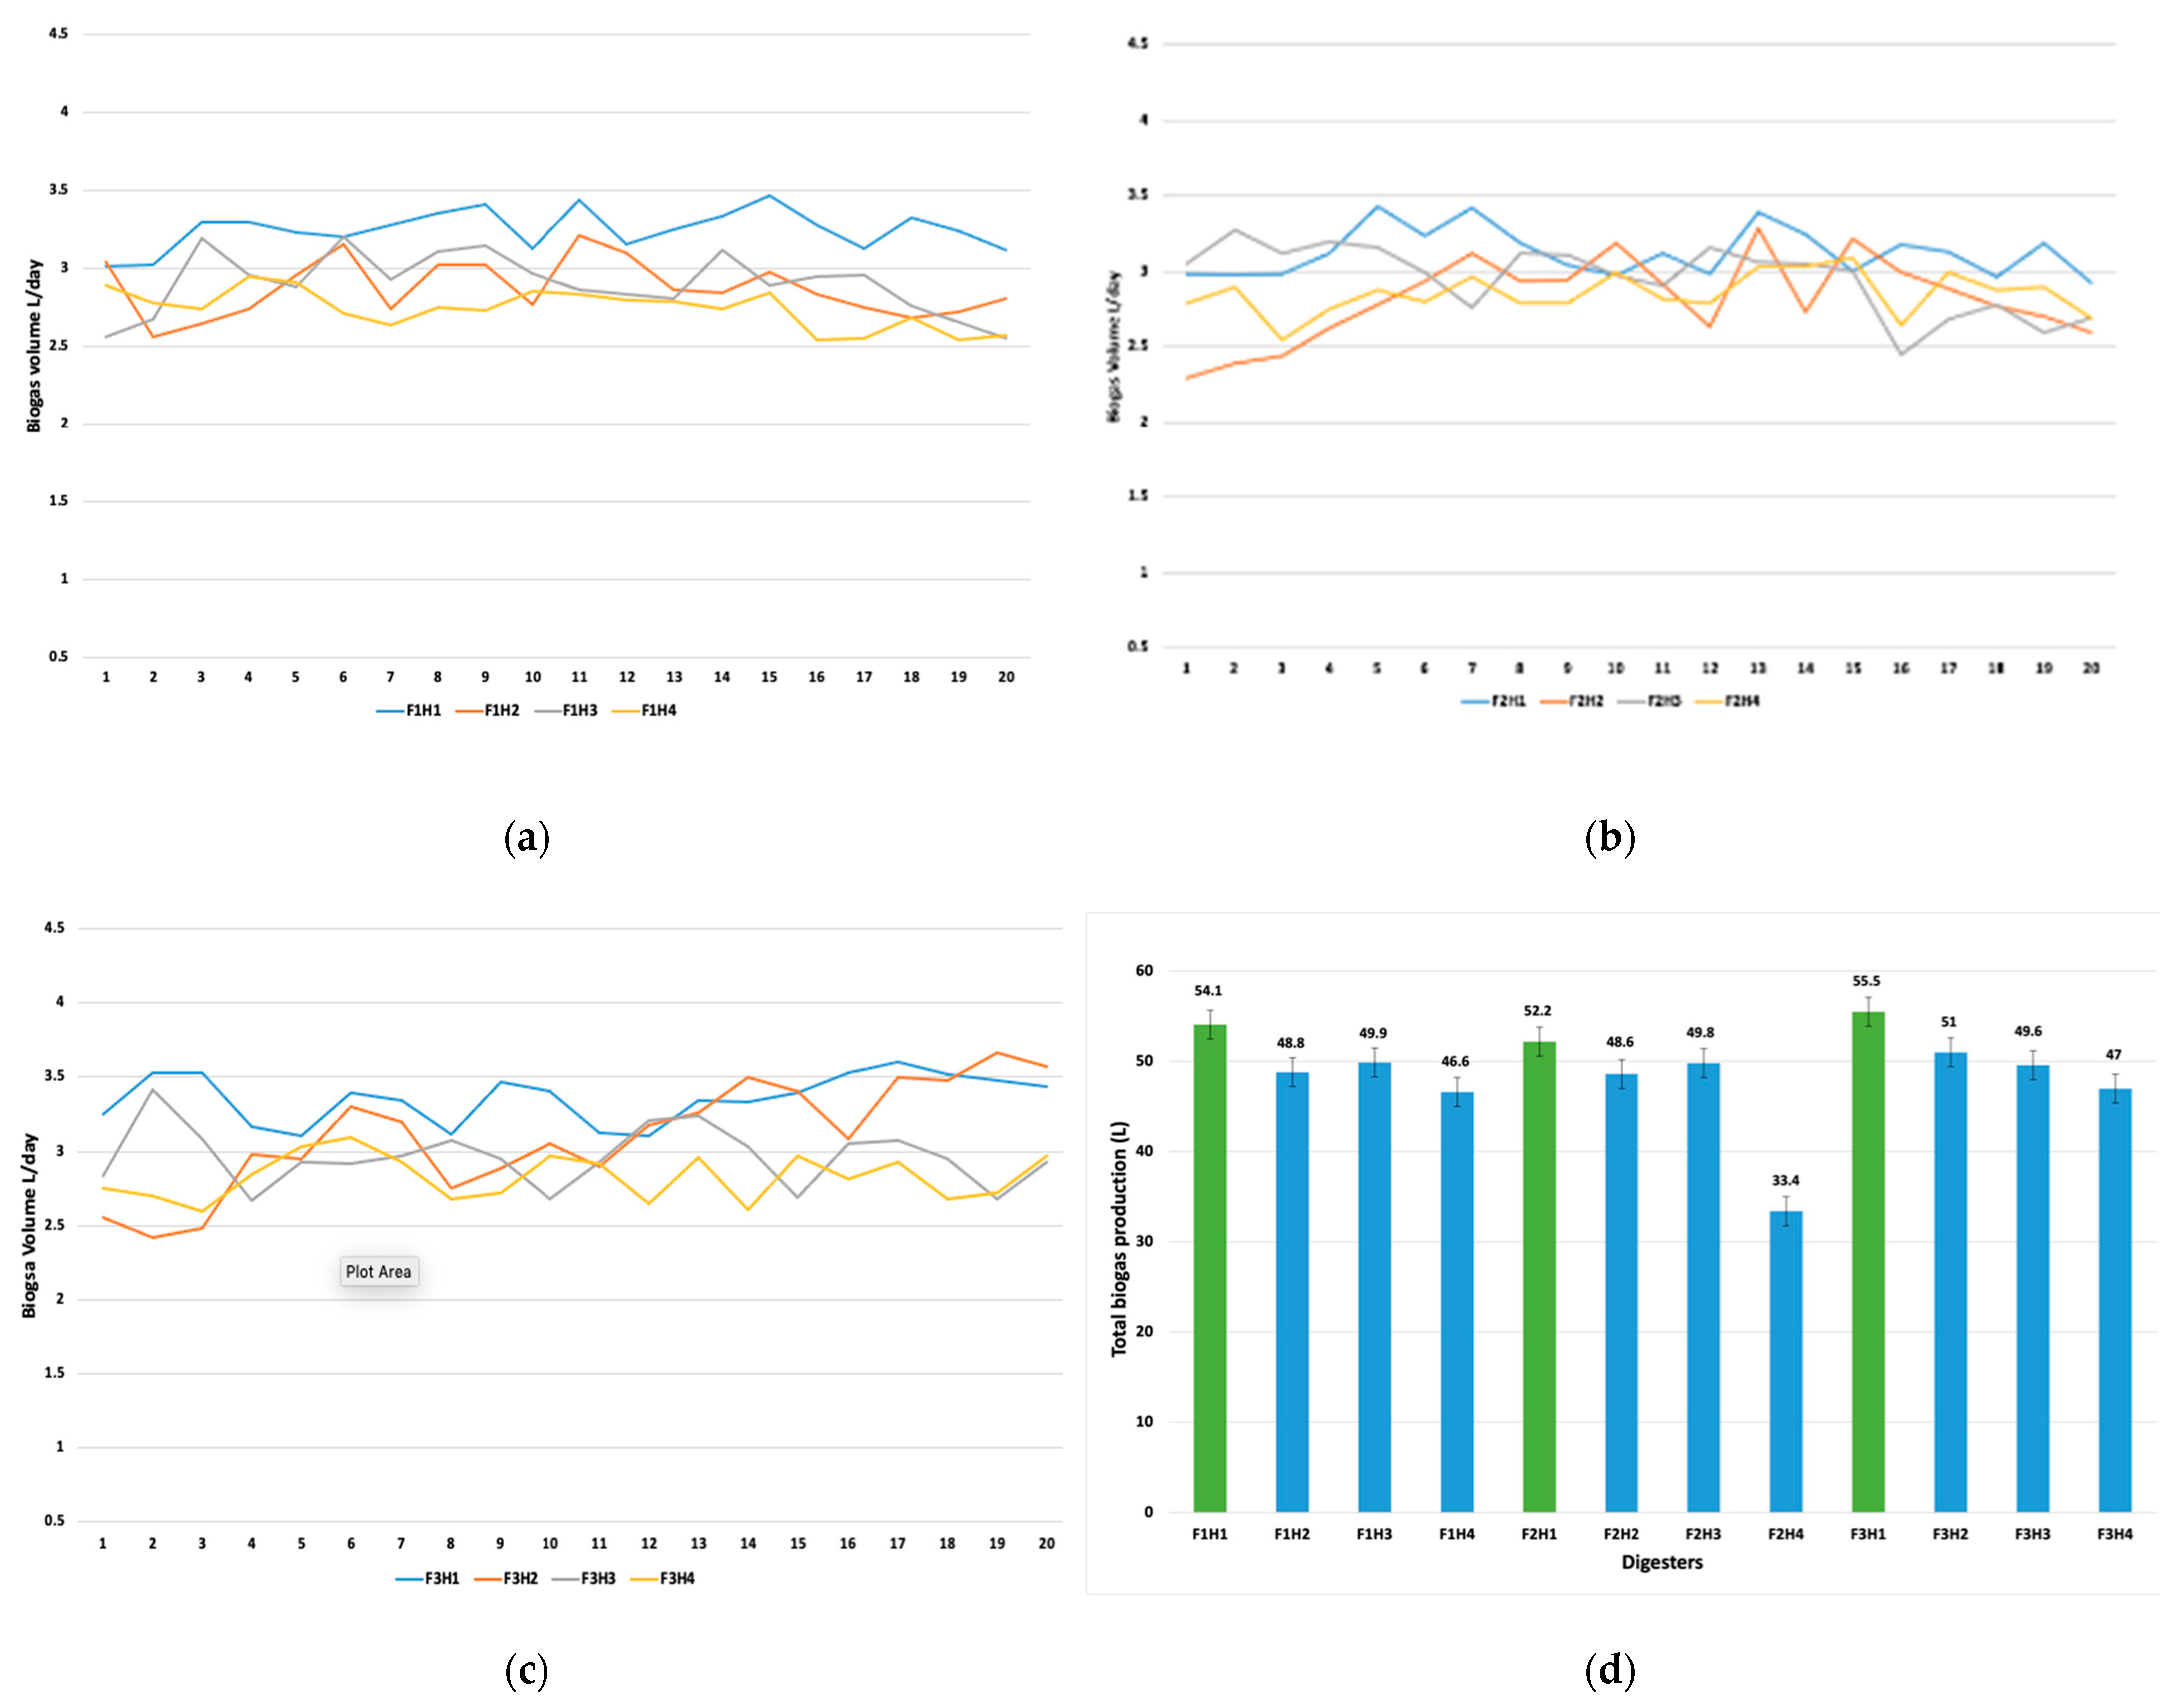
The results from this study indicated that BY was closely related to the mixing interval time. In Figure 3 F represents the digester, and H represents the resting time (in hours) between mixing operations. The daily maximum biogas yields during the resting times of 1, 2, 3, and 4 h were noted as 3.84 L day−1, 3.36 L day−1, 3.12 L day−1, and 2.94 L day−1, respectively (Figure 3a–c). In Figure 3d, the green bars indicate the total biogas production in fermenters 1, 2, and 3 at one hour of resting time. The average daily biogas yields during all the mixing regimes were noted as 3.3, 2.9, 2.8, and 2.5 L day−1, as depicted in Table 2. Similar results were demonstrated by Latha et al. [33] where the mixing regimes were 15 min hr−1 and 30 min hr−1. The maximum biogas yield was observed at a mixing rate of 15 min hr−1 between 50 rpm–200 rpm. The observed higher biogas yields at the minimum resting time are attributed to have favored a better interaction among methanogenic and acetogenic granules and further enhanced the bacterial contact between the substrate and microbes.
Similar trends can be recognized in all three digesters in terms of biogas yields. Figure 3 demonstrates the daily and cumulative biogas production in the digesters. The overall biogas production in fermenter 1 at the resting times of 1 h, 2 h, 3 h, and 4 h was 54.1 L, 48.8 L, 49.9 L, and 46.6 L, respectively. The higher yield of biogas at the resting time of 1 h is assumed to be due to the consequences of better chemical equilibrium along with better buffer action gained during the non-mixing time. The effect of increasing the interval between the mixing periods was observed from day 35 when the resting time was reduced from 1 h to 2 h. The daily biogas production dropped from 0.59 L to 0.41 L in F1, from 0.52 L to 0.41 L in F2, and from 0.61 L to 0.55 L in F3. This variation at different mixing intervals might be attributed to the more frequent mixing, which allowed for more interaction between the substrate and the microorganisms.
The mixing interval of 4 h represented the adverse effect on BY as compared to other intervals. The BY was recorded as 46.6 L, 33.4 L, and 47.3 L in all three digesters, respectively at this particular mixing interval. The main reason for the lower BY was the settling of solid particles at the bottom of the digester during the longer resting times. A BY as low as 14–30% lower was recorded in all digesters in comparison with reduced mixing interval times. The formation of floating layers in the digester is also one of the main factors responsible for deviation in the BY at various mixing intervals [15]. Lowering the mixing interval time possibly led to the prevention of floating layer formation, which was responsible for the smooth discharge of biogas from the slurry. Floating layers are also directly associated with the OLR and TS content [13]. In our case, the OLR was 1 gVS L−1d−1, which is believed to fall within the optimum range where the reduction in the pause in the mixing could lead to a reduction in floating layer formation. Table 3 represents the statical analysis of BY at different mixing intervals in all of the digesters. The results demonstrate the values of p > 0.05, which means the biogas production at the identical mixing intervals in all the digesters produced was similar in terms of quantity.
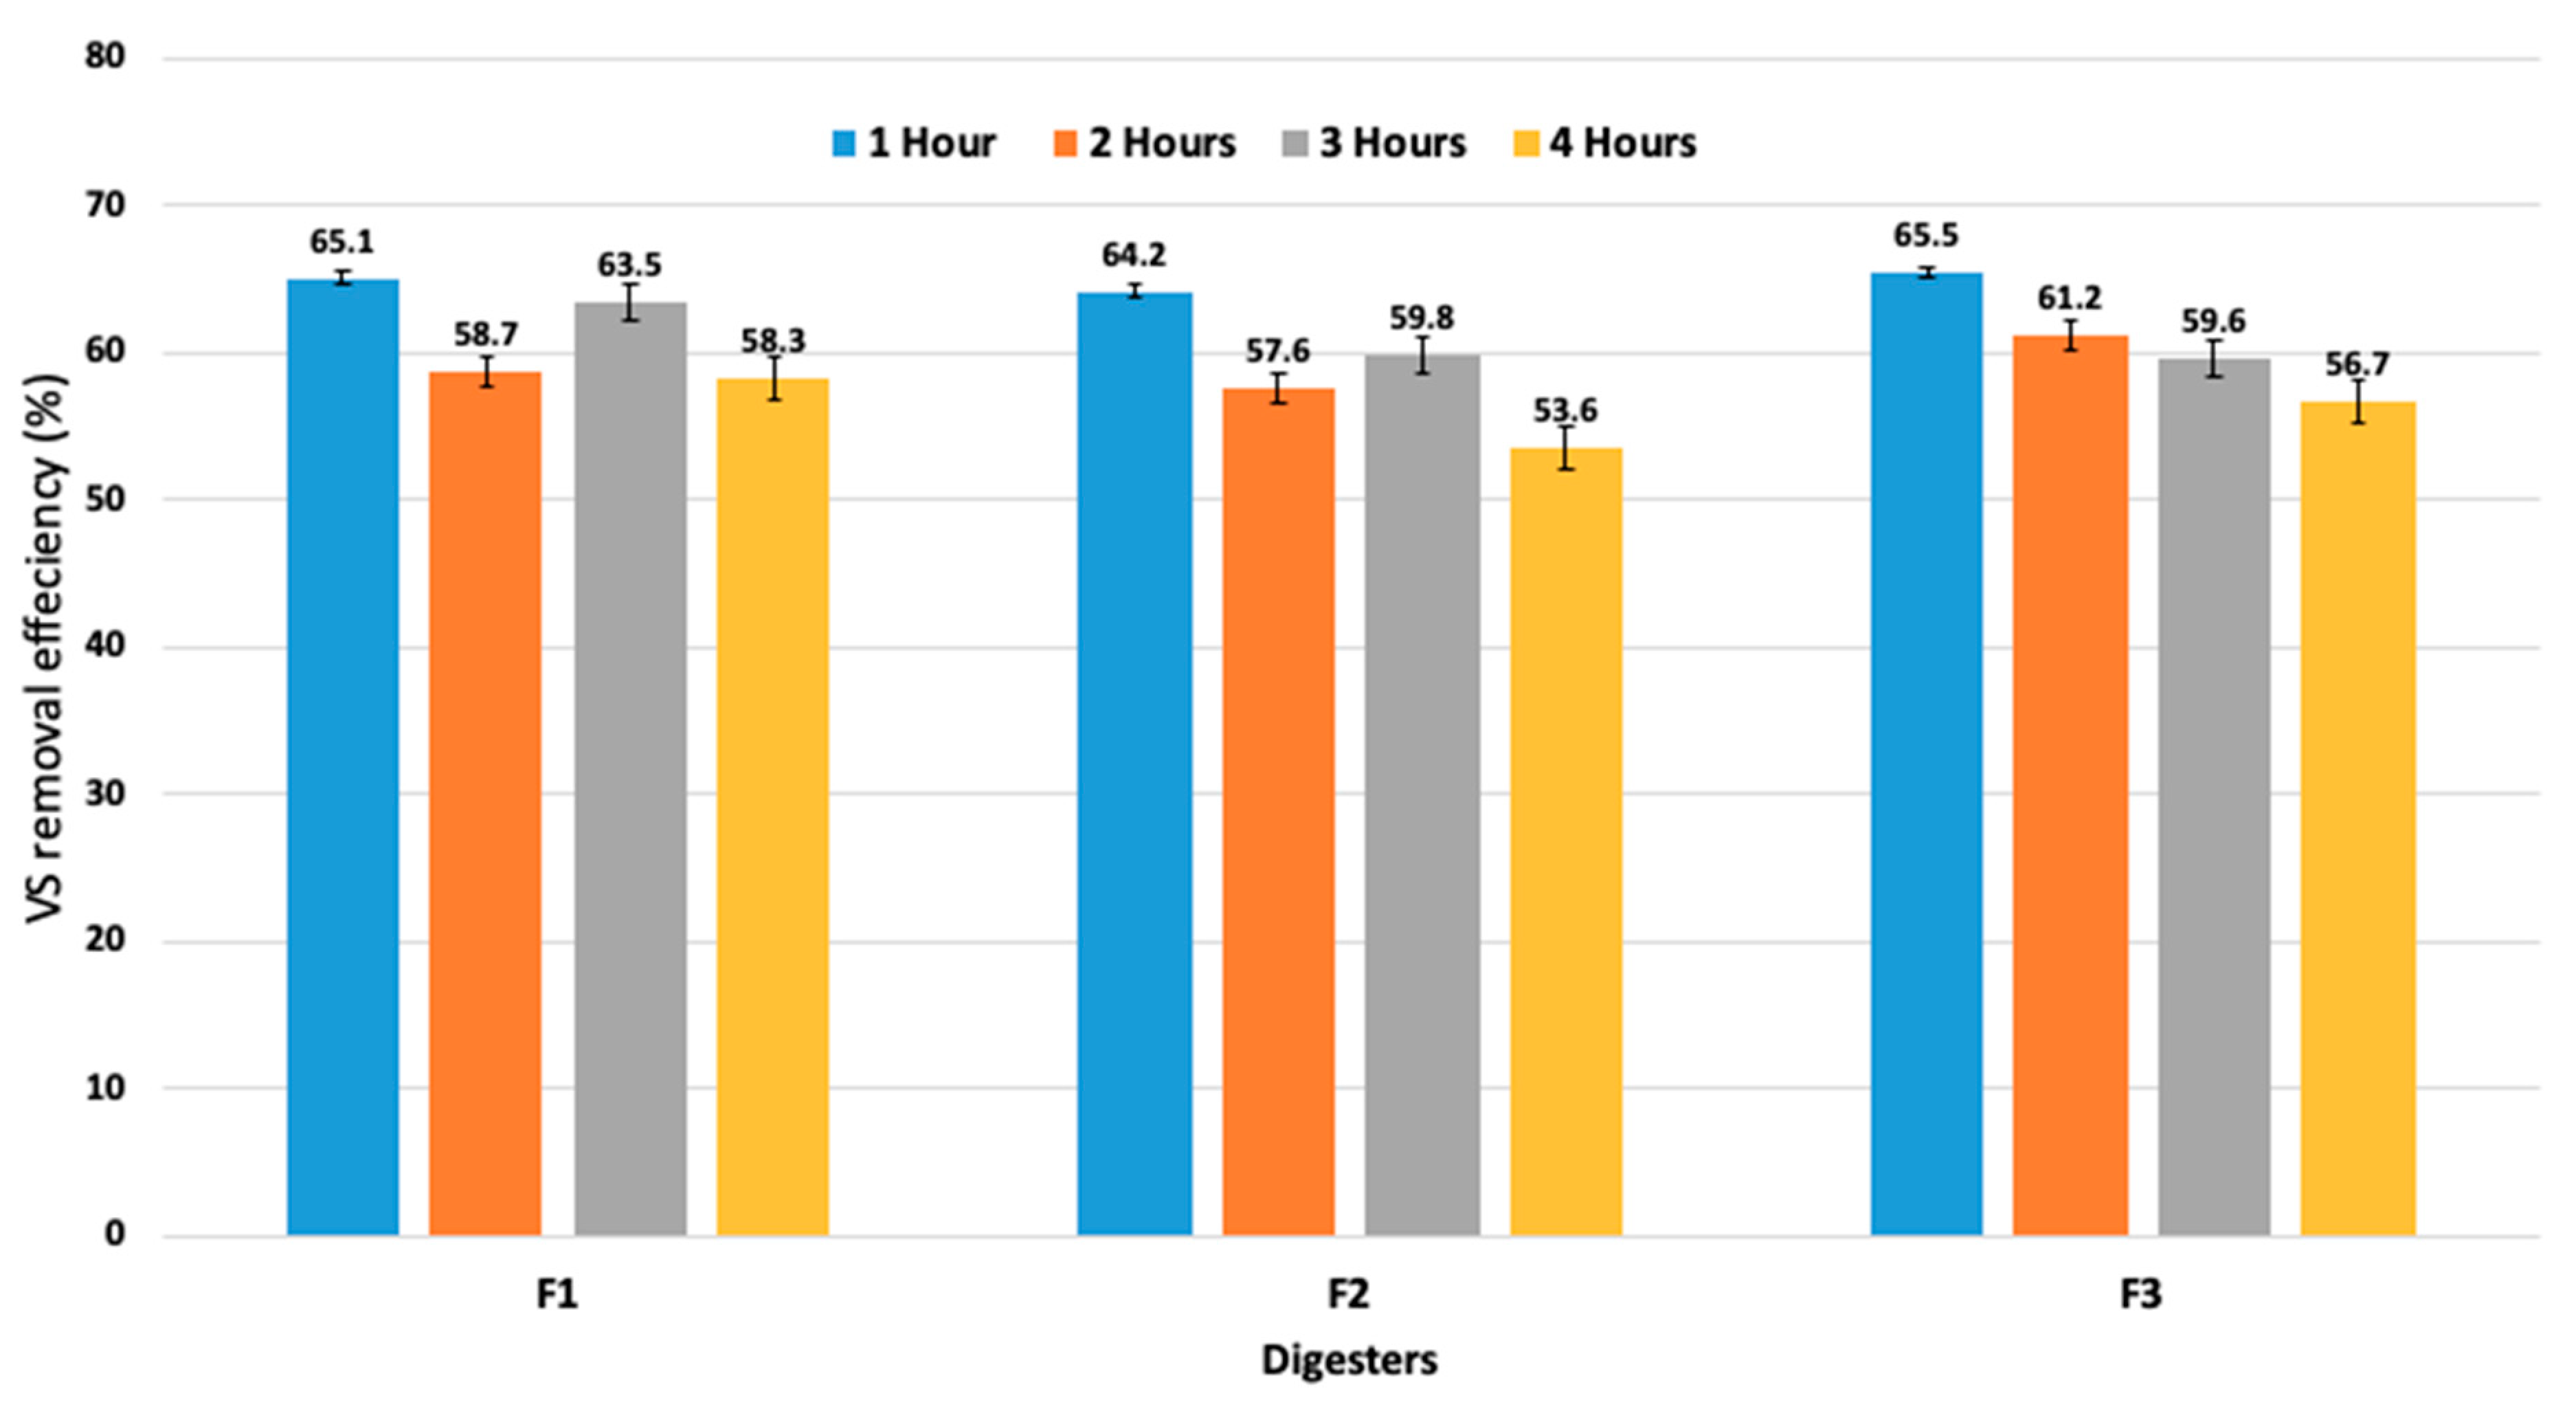
Figure 4 displays the reduction in the VS content in all the digesters at different mixing-resting intervals. Similar trends can be recognized in the BY. The highest VS reduction rates (64.2%–68.5%) were observed at lower mixing–resting intervals. Nevertheless, at the mixing interval of 4 h, the VS reduction was recorded as 58.3 ± 1.4%, 53.6 ± 2.8%, and 56.7 ± 2.5% for F1, F2, and F3, respectively (Table 4). According to the recent study by Caillet et al. [34], the variation in both the TS and reduction in VS was also found when the different samples were taken from both the top and bottom of a lab-scale digester under various mixing speeds of 30, 40, and 50 rpm. The current study of TS and VS contents showed the effect of mixing on the displacement of solid matter. As a result, biogas production can be enhanced by an appropriate mixer design, mixing speed, and mixing–resting interval times. Furthermore, it is suggested that intermittent mixing is adequate for the anaerobic digestion process. Based on these findings, it can be concluded that biogas output could be increased with the reactor design and that the operating parameters (intermittent mixing mode at lower mixing–resting intervals and OLR) can be favorable for both the substrate and the microorganisms.
3.2.3. Impact of Mixing Intervals on VFA Concentration, Alkalinity, pH, and Ammonia
The mixing intensity, mixing mode, and frequency directly influence the AD bioprocess equilibrium and have a major impact on overall biogas production yields [33,35,36]. VFAs such as acetic acid, propionic acid, butyric acid, iso-butyric acid, and valeric acid are produced during the acidogenesis reaction. The rise in VFA concentration has an effect on the efficiency with which substrates are converted to biogas. In this section, the effect of the mixing operation on VFA, pH, the FOS/TAC ratio, and free NH3 is analyzed (Table 5). All parameters were measured twice a week after the completion of the mixing cycle to obtain a homogeneous sample. The rheology of the substrate is one of the major parameters, which have a significant effect on the performance during mixing. The digesters were operated at 4.2% TS content throughout the experiment; therefore, the rheological parameters of the slurry could remain constant, and more precise results can be obtained.
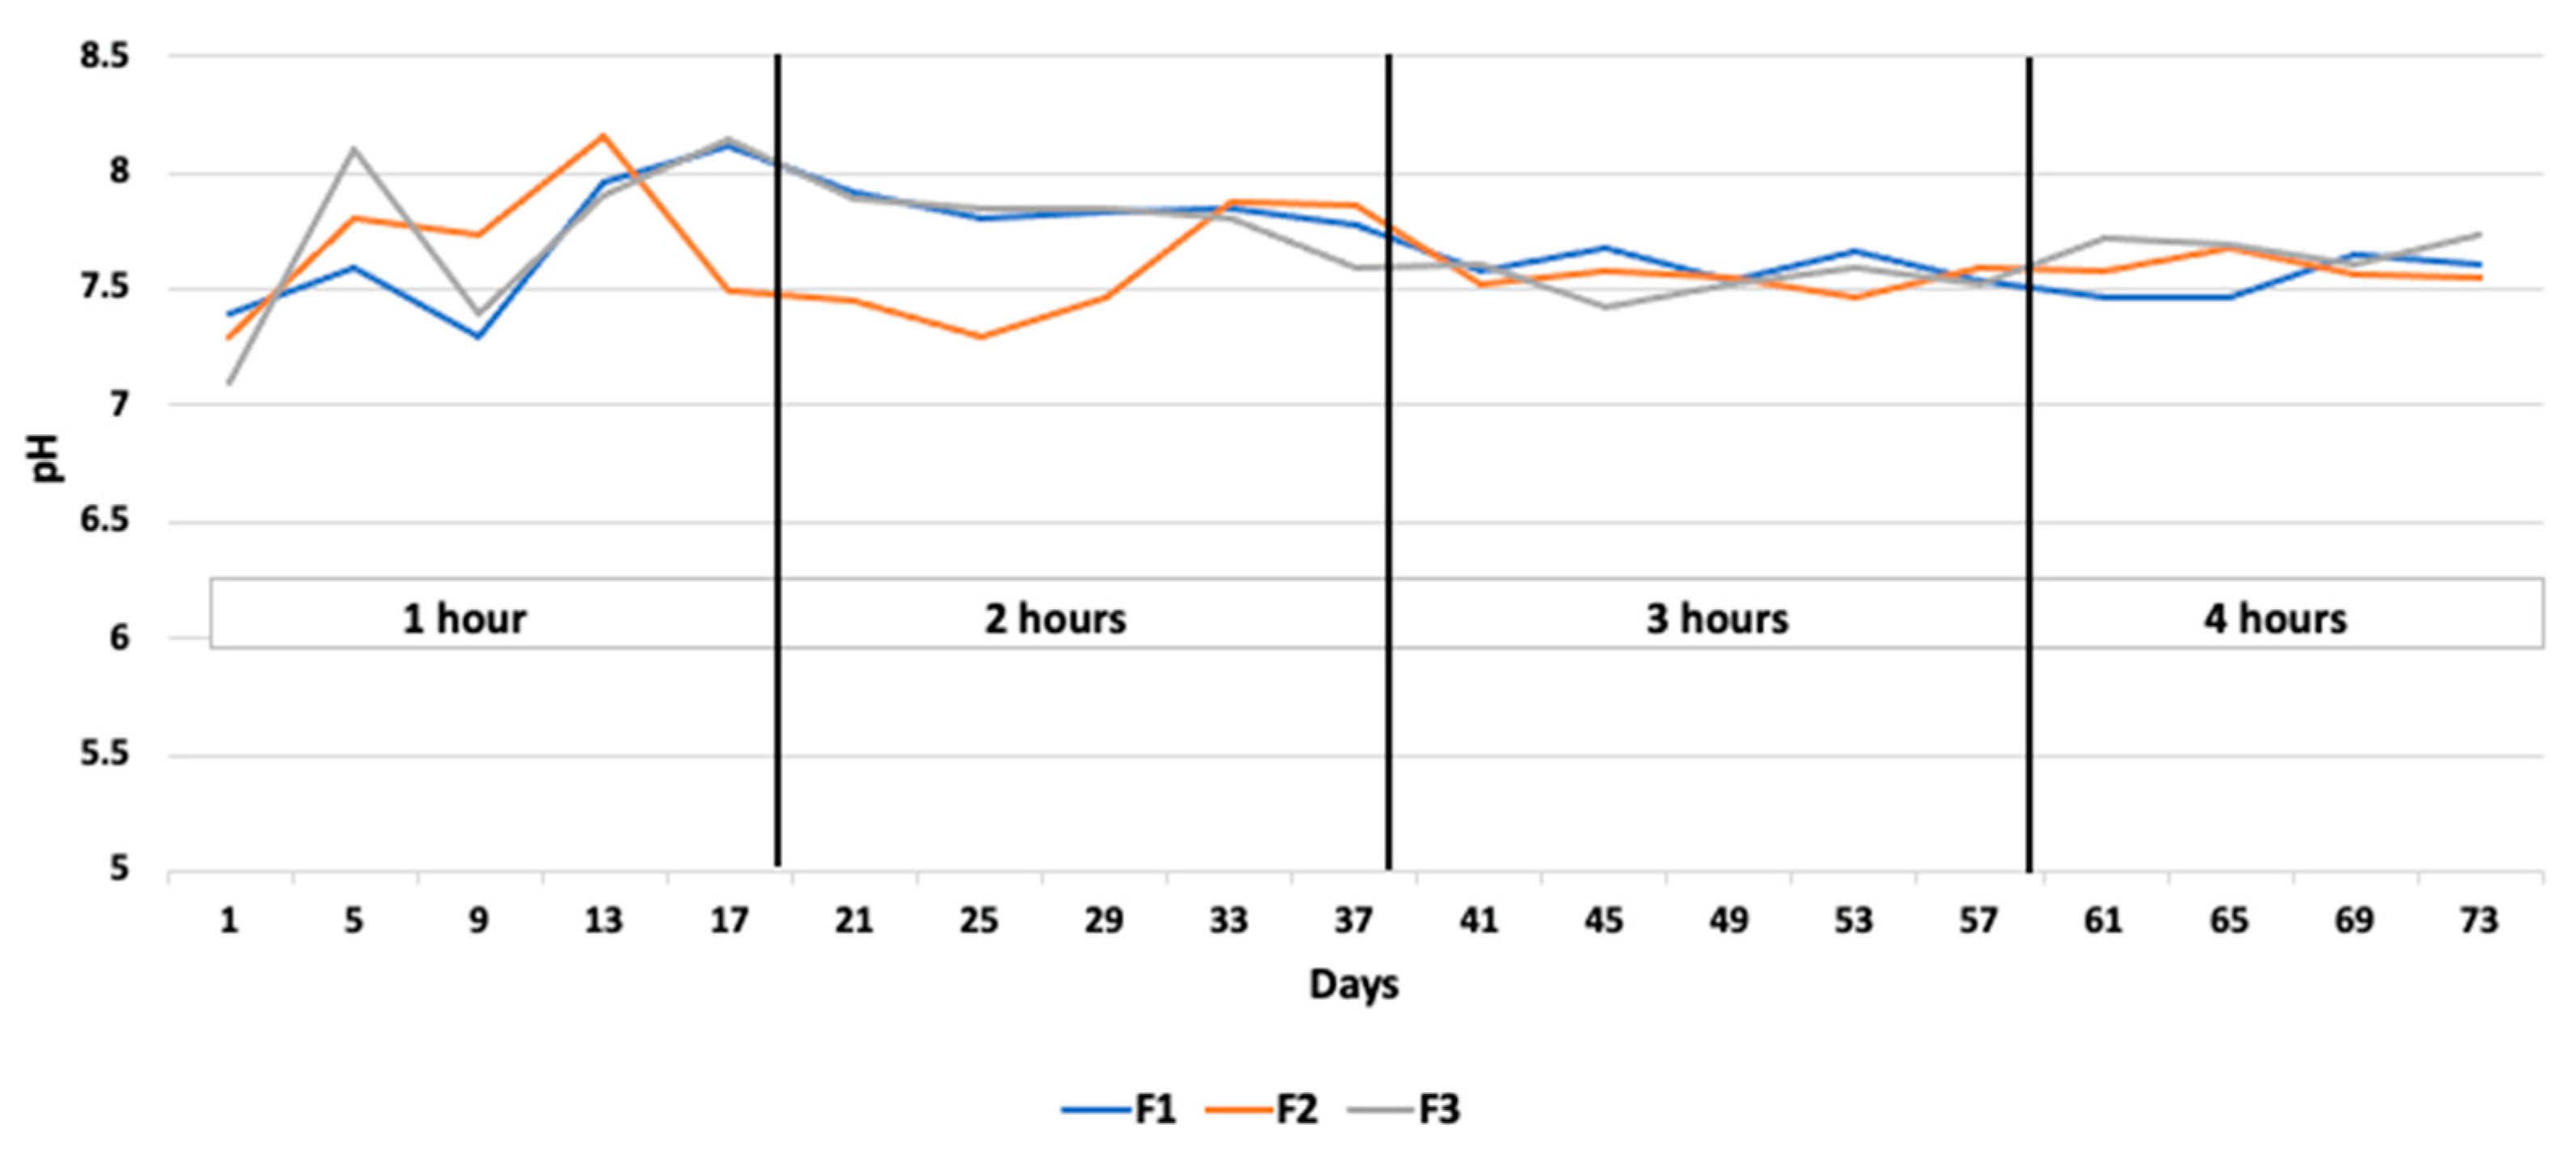
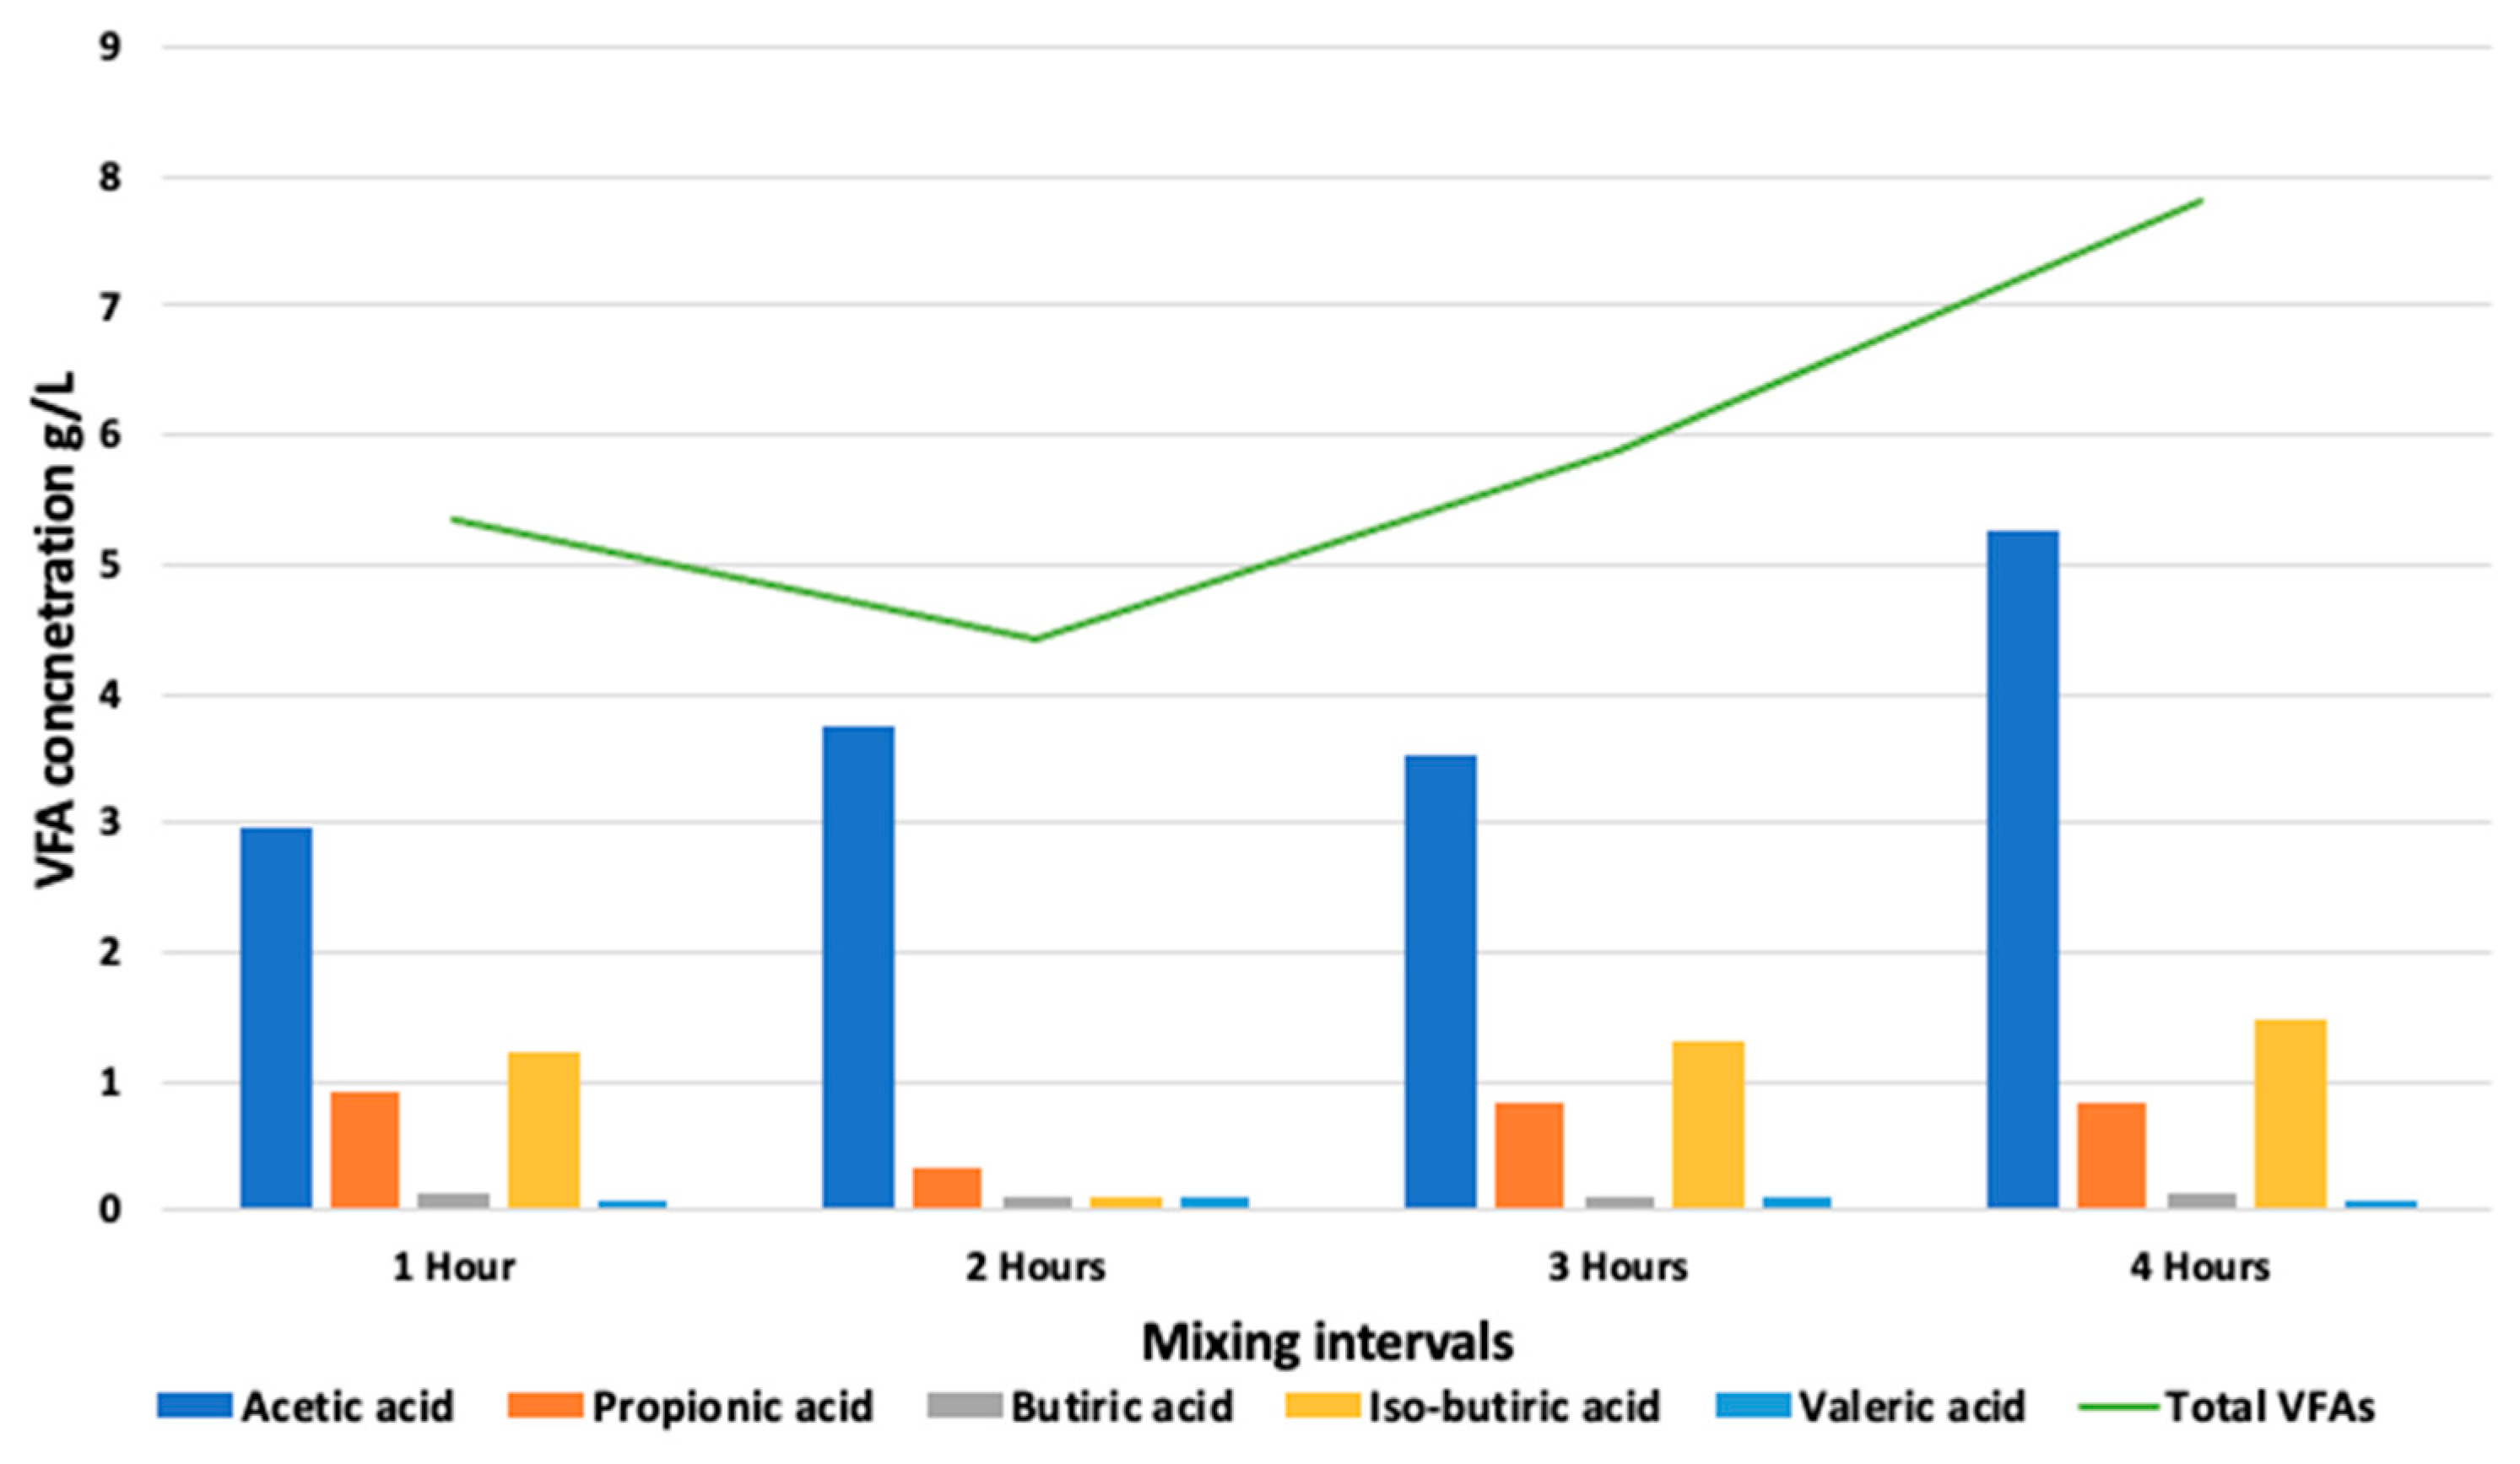
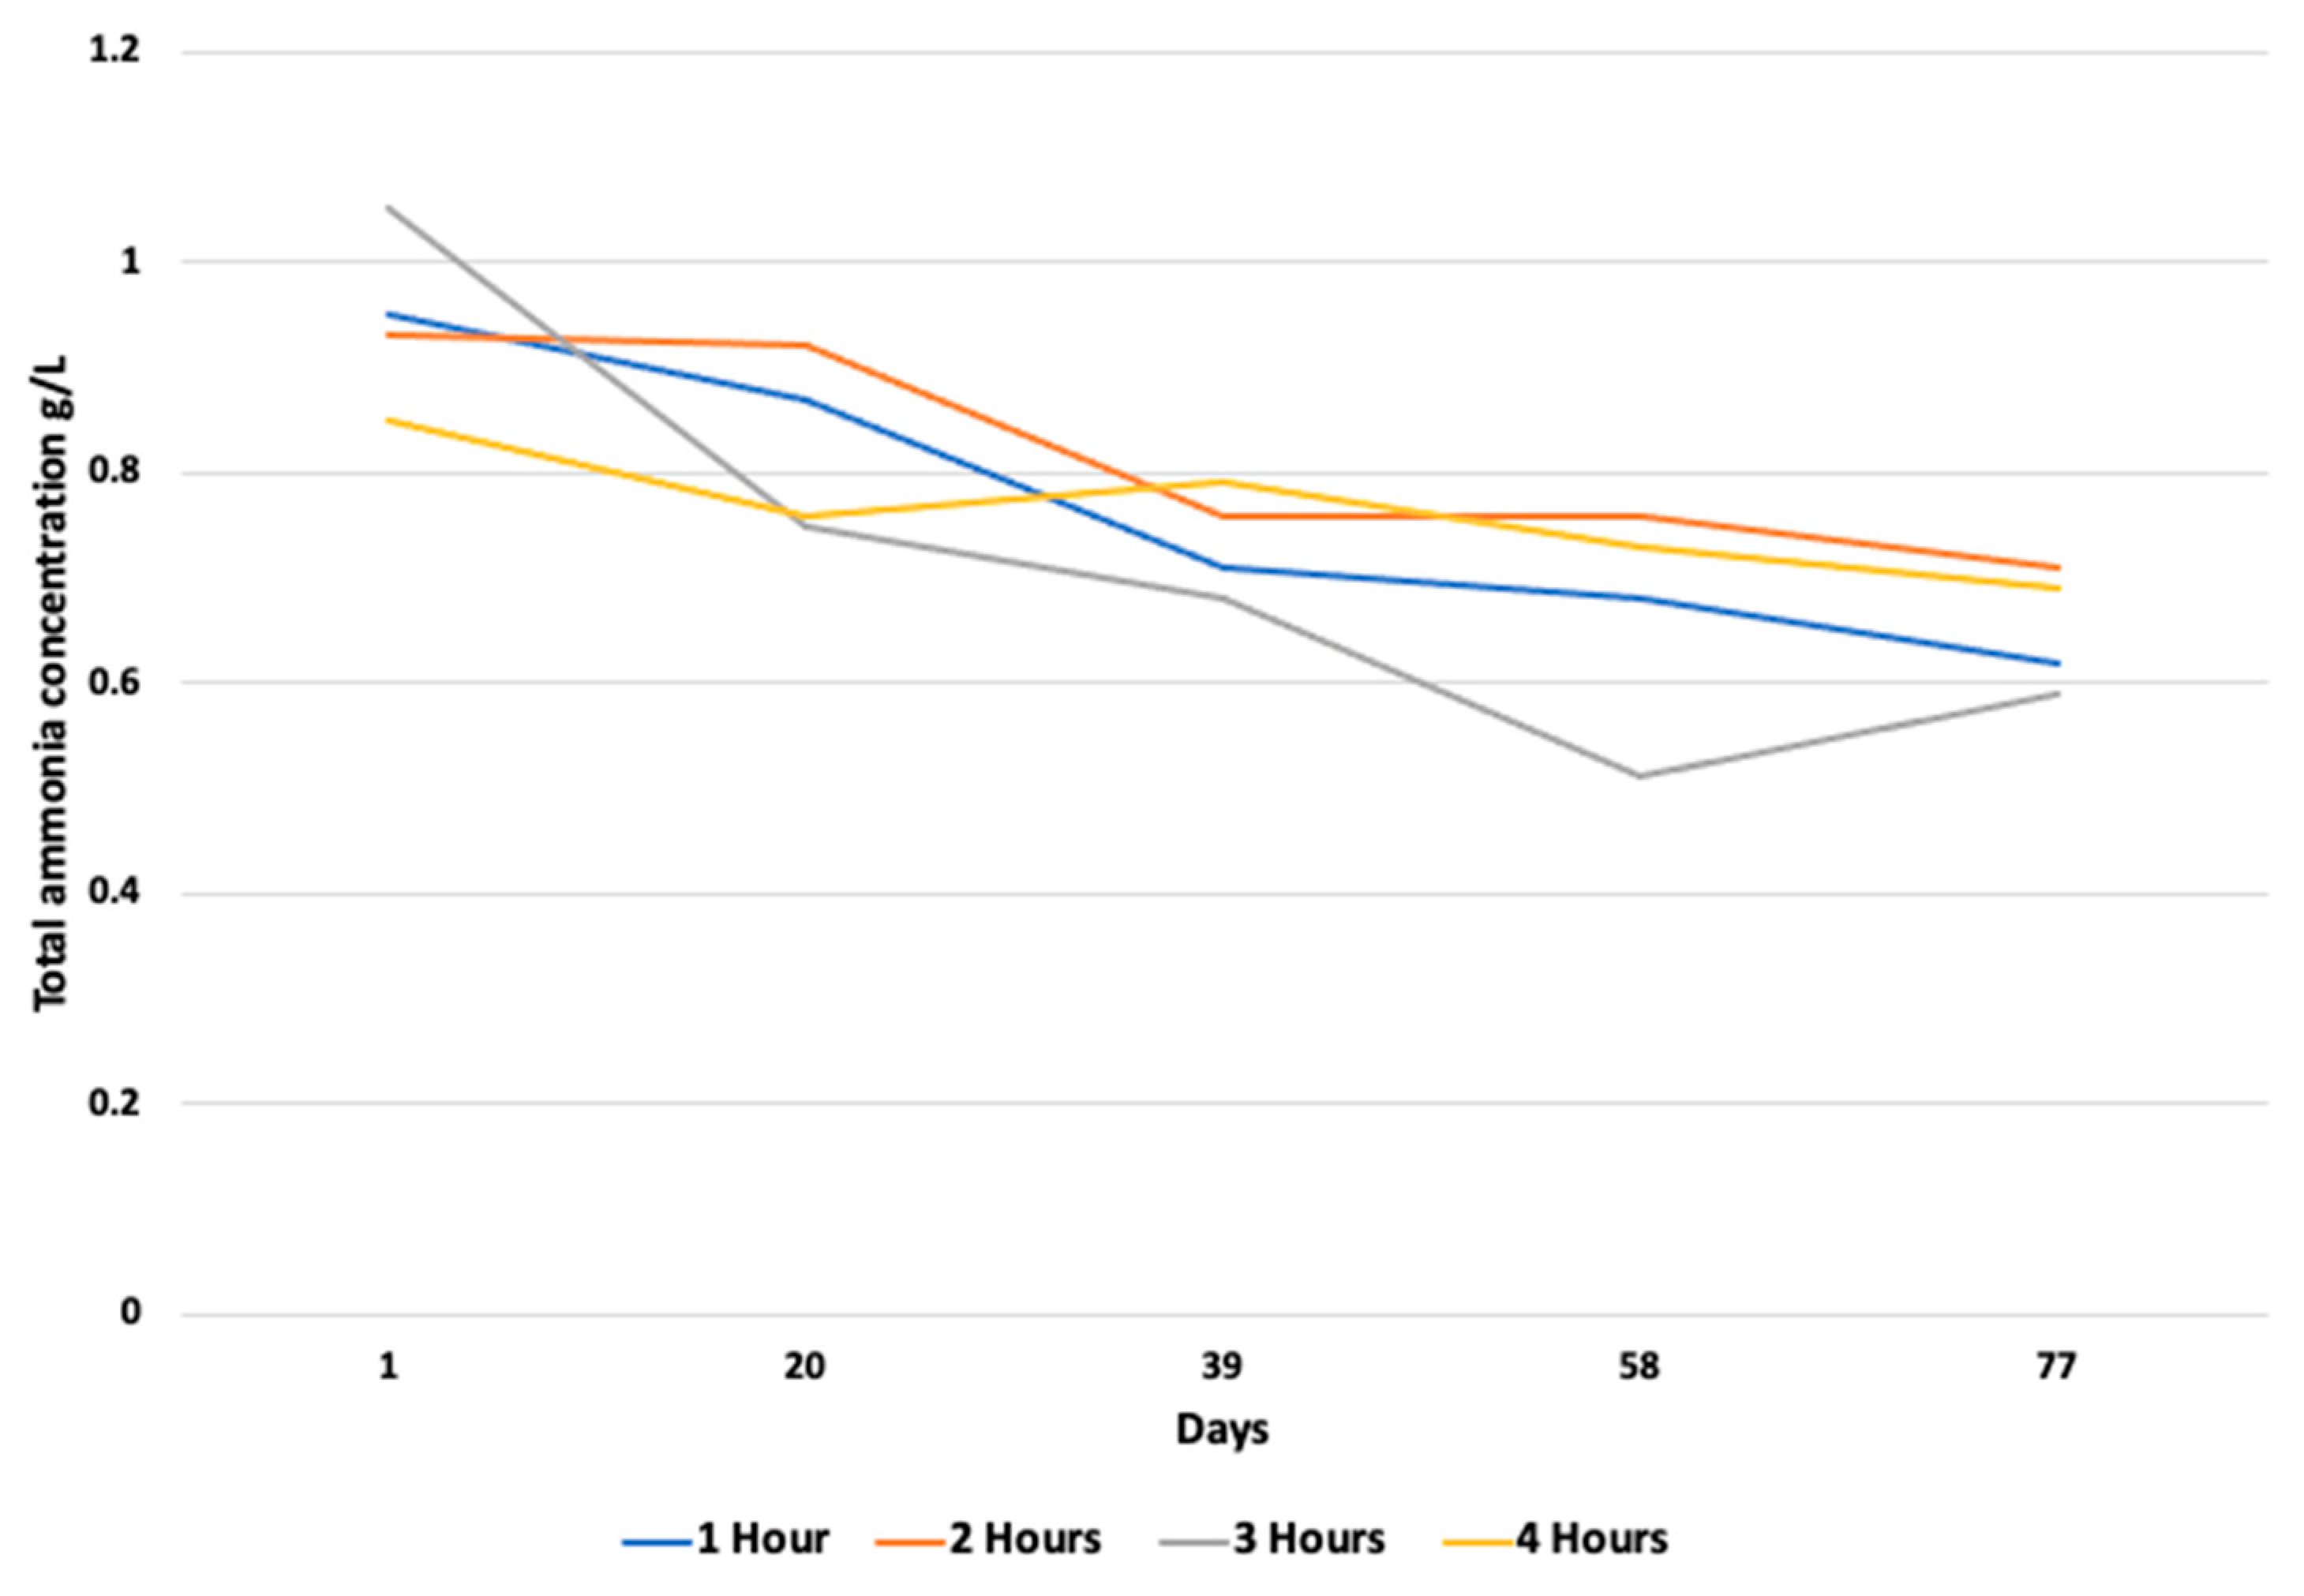
The average pH of the reactor content remained between the optimal limits of 6.8–7.5 throughout the experiment. For one hour of resting time, the average pH recorded in all the digesters is 7.2, 7.0, and 7.7 in digesters 1, 2, and 3, respectively. At the maximum resting time of 4 h, the pH values changed to 7.6, 8.0, and 7.9 in digesters 1, 2, and 3, respectively (Figure 5). Higher pH values at higher resting times were presumably due to a lower accumulation of VFAs during that period. The average VFA levels were noted as 5.8 g/L, 4.4 g/L, 5.3 g/L, and 7.7 g/L for the resting time periods of 1 h, 2 h, 3 h, and 4 h, respectively, followed by a concomitant increase in biogas production (Figure 6). According to Caillet et al. [34], the increase in the VFA content had no detrimental impact on biogas generation. In terms of the biogas production and changes in the ammonium and VFA concentrations, no substantial fluctuation in these two concentrations was found to explain the differences in biogas output. Higher VFA concentrations and lower ammonium concentrations resulted in a higher biogas output, whereas, in the current study, the ammonia concentration was found to be in equilibrium during the whole experiment (Figure 7. Similarly, Franke et al. [37] found that the higher VFA levels (8–10 g L−1) and pH values did not destabilize the anaerobic process.
The concentrations of VFA and alkalinity, as well as the corresponding ratios of VFA-to-alkalinity (FOS/TAC), were used to assess the system’s stability (Table 5). The average FOS/TAC was recorded as 0.39, which was reported below the threshold value of 0.5 for a stable process to avoid the failure of digesters during transient conditions [38]. As a result, the startup with stable digesters was deemed successful prior to commencing varied mixing intervals to prevent the impact of shock loading. Greater alkalinity resulted in increased biogas generation. This outcome was predicted since the digestive environment alkalinity was more conducive to the AD process. Furthermore, a rise in the VFA concentration resulted in an increase in the pH. The average pH for the VFA concentration of 5.8 g L−1 was 7.6, whereas the average pH for the VFA concentration of 7.79 g L−1 was 7.9.
3.2.4. System Mixing Intensity for Semi-Continuous Mixing Mode
The importance of efficient sludge mixing in anaerobic digesters has been recognized as a key design criterion for full-scale anaerobic digesters. For application in the design and operation of systems incorporating mechanical mixing devices, Camp and Stein [39] coined the term velocity gradient:
where G is the average velocity gradient, P is the power dissipation, V is the reactor volume, and μ is the liquid viscosity. For this particular design and construction of setup, the value of G is 10 S−1 as a slow mixing value was applied to the system by adjusting the mixing power to achieve this velocity gradient.
Due to the biochemical process of anaerobic digestion, which includes various microbes and the formation of flocs, the velocity gradient is not the only parameter which determines the overall biogas production rates but also the mixing time and the interval between the mixing regimes. Therefore, the parameter of velocity gradient mixing time integral in the case of the semi-continuous mixing mode is calculated by the following equation:
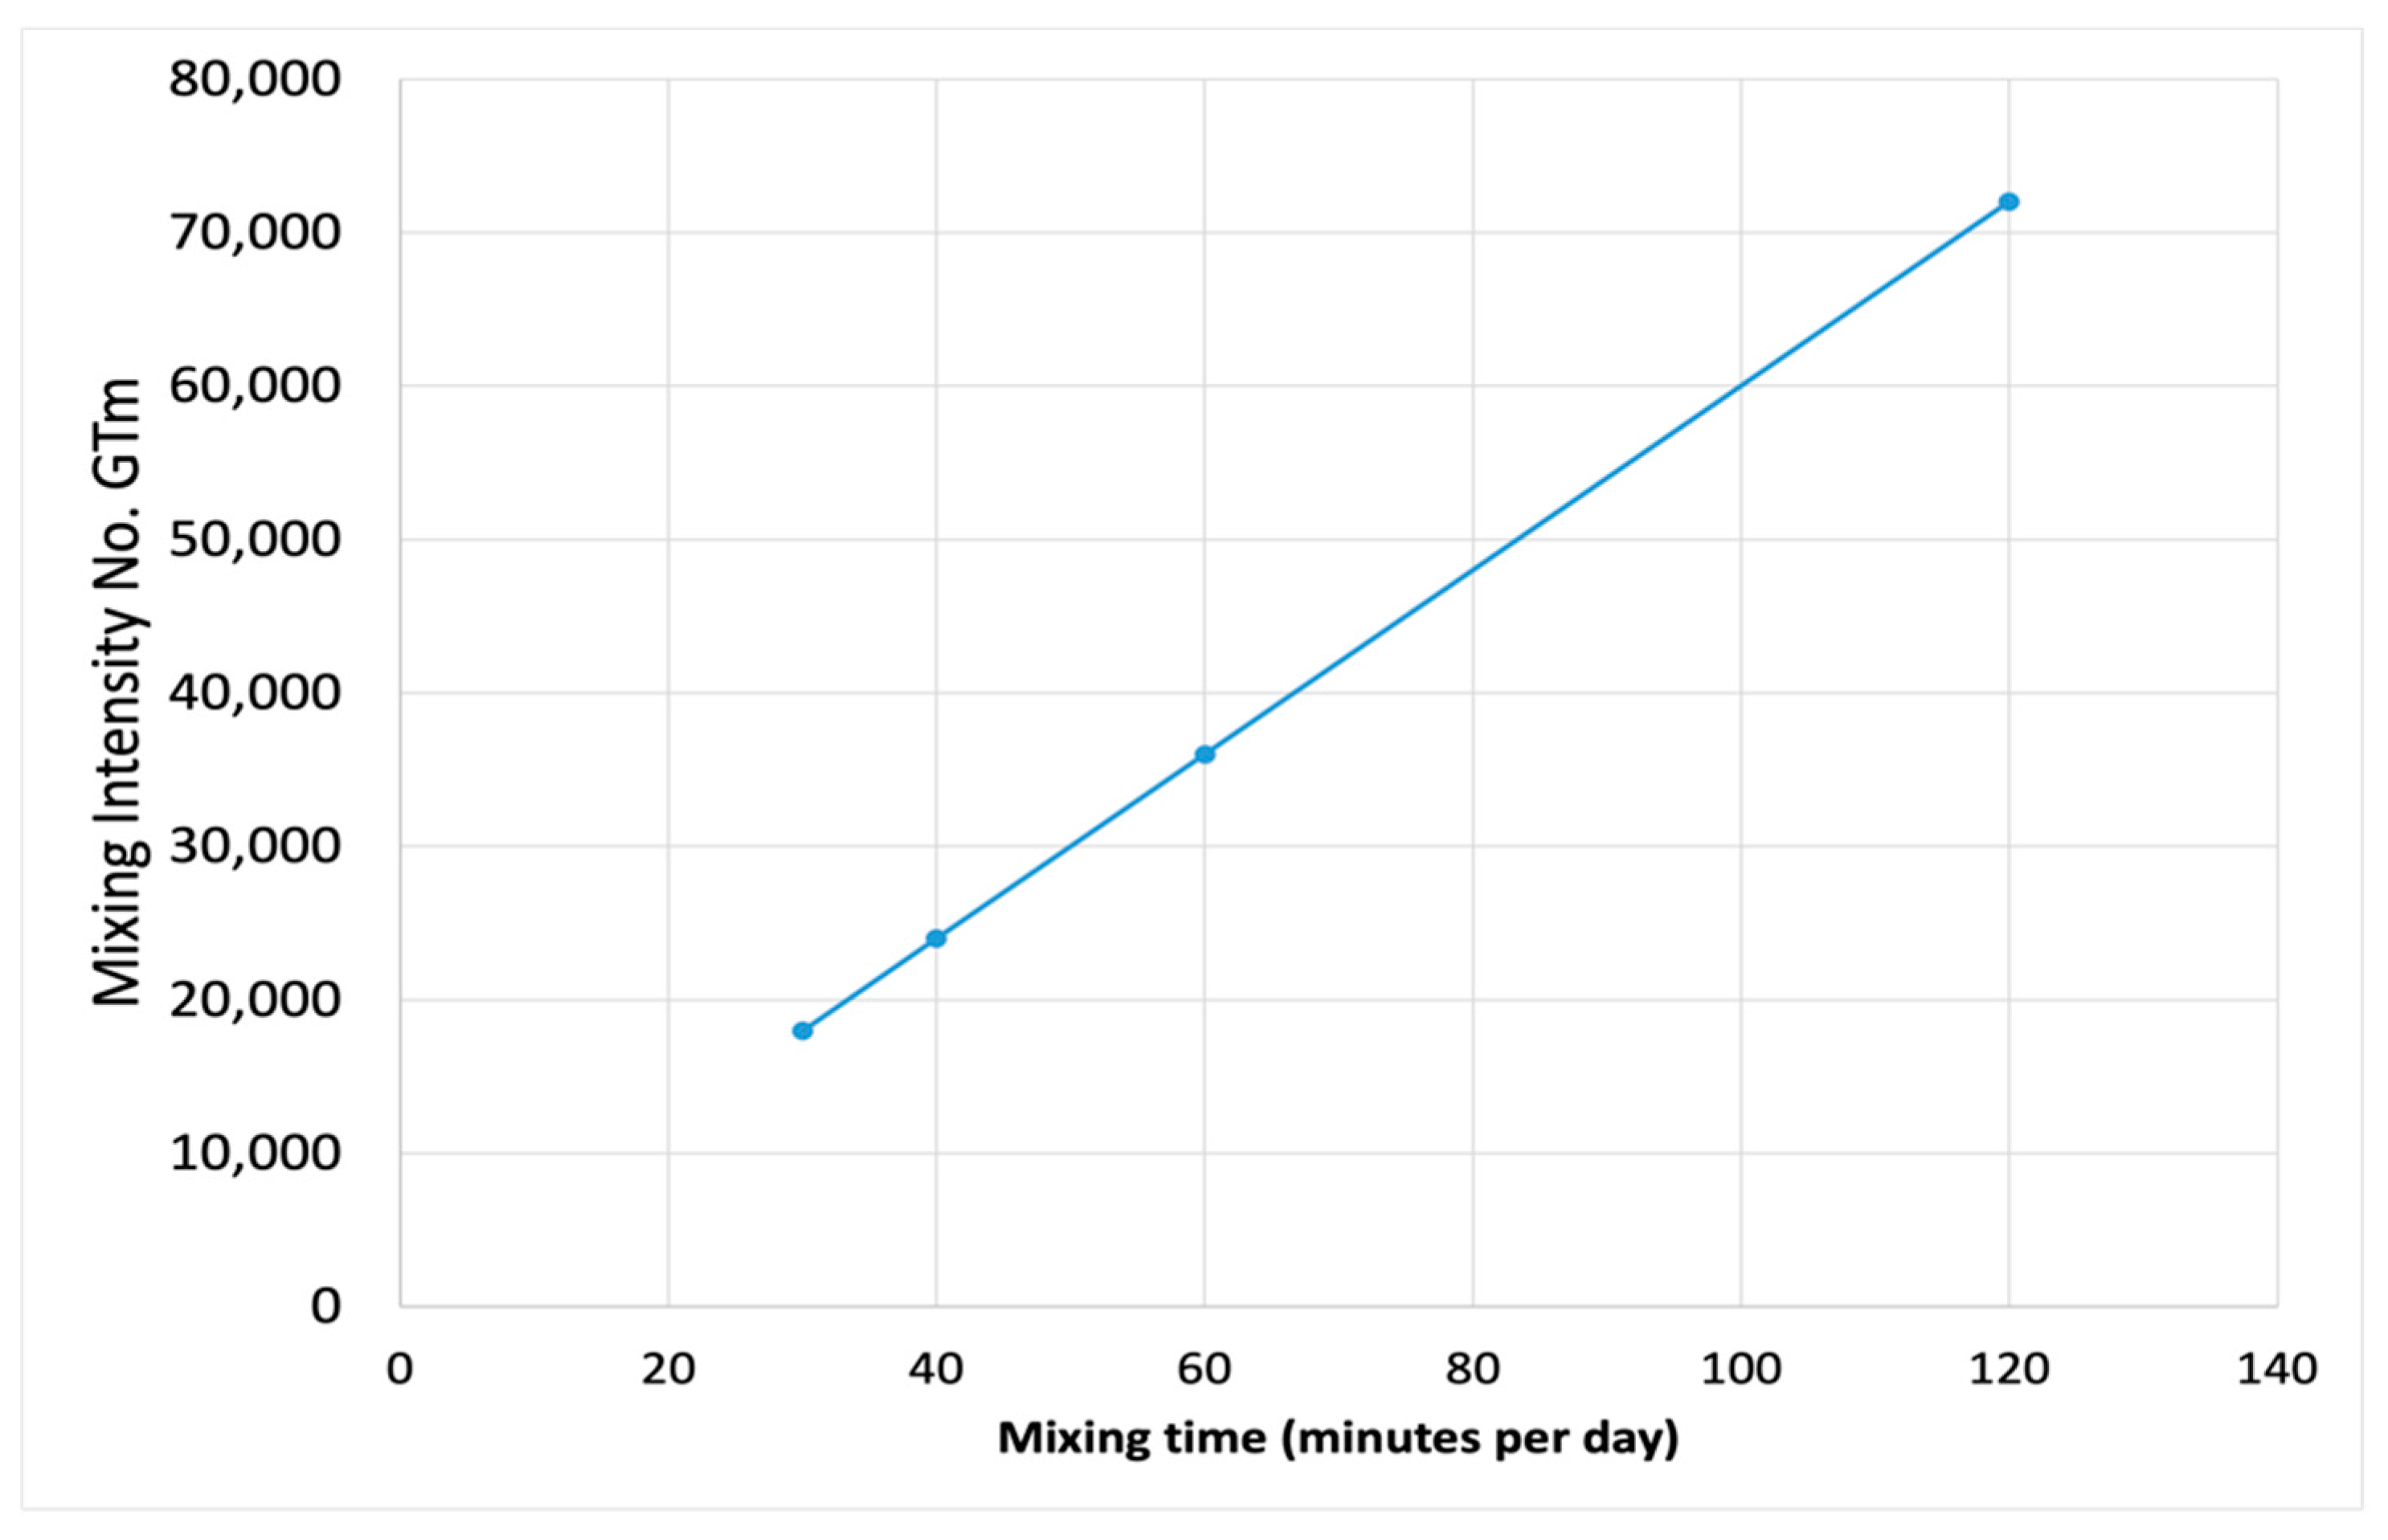
where Tm is the mixing time in seconds. The mixing intensity number can be accurately calculated and can be used to determine the appropriate mixing time of the impeller (Figure 8). In this case, the mixing intensity number of 72,000 is found to be the optimum mixing intensity number, which means mixing the slurry every hour for 5 min at 67 rpm can result in the highest biogas production as compared to other mixing regimes (Table 6).
4. Conclusions
Three digesters were operated under identical inoculation and operating parameters with various mixing–resting intervals. It is concluded that the efficiency of the mesophilic digester is directly associated with the mixing–resting time interval. The mixing regime has an effect on the physicochemical properties of the substrate. The digester performance was best under the minimum resting time of 1 h at 67 rpm impeller speed in this system. During the employed mixing regime, the biogas yield was 5–12% higher as compared to longer resting times. The FOS/TAC ratio was below 0.5, and the VS reduction was noted as 66.1 ± 2.6%. The drop in biogas yield could be due to VFA accumulation to some extent, along with the formation of floating layers and sedimentation at a longer resting time between the mixing operations. The appropriate agitation interval might not only accomplish high biogas generation but also boost the energy efficiency of the process. The findings can be used to run an anaerobic digester in an efficient and cost-effective manner.
Author Contributions
Conceptualization, B.S., K.L.K.; methodology B.S., Z.S. (Zoltán Siménfalvi), Z.S. (Zoltán Szamosi); formal analysis, B.S., K.L.K., Z.B., M.P., G.L.S.; writing—original draft preparation, B.S., K.L.K., supervision, Z.S. (Zoltán Siménfalvi), Z.S. (Zoltán Szamosi). All authors have read and agreed to the published version of the manuscript.
Funding
The support by the Hungarian Research Fund OTKA to ZB (FK123902) is gratefully acknowledged. Additional funding from the National Research, Development and Innovation Office (NKFIH), Hungary was provided through the projects NKFIH-2020-1.1.2-PIACI-KFI-2020-00117 and NKFIH-INNOV-397-13/PALY-2020.
Institutional Review Board Statement
Not applicable.
Informed Consent Statement
Not applicable.
Data Availability Statement
Not applicable.
Conflicts of Interest
The authors declare no conflict of interest.
References
- Suryawanshi, P.C.; Chaudhari, A.B.; Kothari, R.M. Thermophilic anaerobic digestion: The best option for waste treatment. Crit. Rev. Biotechnol. 2010, 30, 31–40. [Google Scholar] [CrossRef] [PubMed]
- Wirth, R.; Kovács, E.; Maróti, G.; Bagi, Z.; Rákhely, G.; Kovács, K.L. Characterization of a biogas-producing microbial community by short-read next generation DNA sequencing. Biotechnol. Biofuels 2012, 5, 41. [Google Scholar] [CrossRef] [Green Version]
- Bagi, Z.; Ács, N.; Bálint, B.; Horváth, L.; Dobó, K.; Perei, K.R.; Rákhely, G.; Kovács, K.L. Biotechnological intensification of biogas production. Appl. Microbiol. Biotechnol. 2007, 76, 473–482. [Google Scholar] [CrossRef]
- Kovács, E.; Wirth, R.; Maróti, G.; Bagi, Z.; Nagy, K.; Minárovits, J.; Rákhely, G.; Kovács, K.L. Augmented biogas production from protein-rich substrates and associated metagenomic changes. Bioresour. Technol. 2015, 178, 254–261. [Google Scholar] [CrossRef] [Green Version]
- Ghanimeh, S.A.; Al-Sanioura, D.N.; Saikaly, P.E.; El-Fadel, M. Correlation between system performance and bacterial composition under varied mixing intensity in thermophilic anaerobic digestion of food waste. J. Environ. Manag. 2018, 206, 472–481. [Google Scholar] [CrossRef]
- Singh, B.; Szamosi, Z.; Siménfalvi, Z. State of the art on mixing in an anaerobic digester: A review. Renew. Energy 2019, 141, 922–936. [Google Scholar] [CrossRef]
- Naegele, H.-J.; Lemmer, A.; Oechsner, H.; Jungbluth, T. Electric Energy consumption of the full scale research biogas plant “Unterer Lindenhof”: Results of longterm and full detail measurements. Energies 2012, 5, 5198–5214. [Google Scholar] [CrossRef]
- Lemmer, A.; Naegele, H.-J.; Sondermann, J. How efficient are agitators in biogas digesters? determination of the efficiency of submersible motor mixers and incline agitators by measuring nutrient distribution in full-scale agricultural biogas digesters. Energies 2013, 6, 6255–6273. [Google Scholar] [CrossRef] [Green Version]
- Singh, B.; Szamosi, Z.; Siménfalvi, Z. Impact of mixing intensity and duration on biogas production in an anaerobic digester: A review. Crit. Rev. Biotechnol. 2020, 40, 508–521. [Google Scholar] [CrossRef] [Green Version]
- Karaeva, J.V.; Khalitova, G.R.; Kovalev, D.A.; Trakhunova, I.A. Study of the Process of Hydraulic Mixing in Anaerobic Digester of Biogas Plant. Chem. Process Eng -Inz. Chem. i Proces. 2015, 36, 101–112. [Google Scholar] [CrossRef]
- Monteith, H.; Stephenson, J. Mixing efficiencies in full-scale anaerobic digesters by tracer methods. Water Pollut. Control Fed. 1981, 53, 78–84. Available online: http://www.jstor.org/stable/25041020 (accessed on 6 August 2022). [CrossRef]
- Wang, B.; Björn, A.; Strömberg, S.; Nges, I.A.; Nistor, M.; Liu, J. Evaluating the influences of mixing strategies on the Biochemical Methane Potential test. J. Environ. Manag. 2017, 185, 54–59. [Google Scholar] [CrossRef] [PubMed]
- Kaparaju, P.; Buendia, I.; Ellegaard, L.; Angelidakia, I. Effects of mixing on methane production during thermophilic anaerobic digestion of manure: Lab-scale and pilot-scale studies. Bioresour. Technol. 2008, 99, 4919–4928. [Google Scholar] [CrossRef] [PubMed]
- Ong, H.K.; Greenfield, P.F.; Pullammanappallil, P.C. Effect of mixing on biomethanation of cattle-manure slurry. Environ. Technol. 2002, 23, 1081–1090. [Google Scholar] [CrossRef]
- Tian, L.; Zou, D.; Yuan, H.; Wang, L.; Zhang, X.; Li, X. Identifying proper agitation interval to prevent floating layers formation of corn stover and improve biogas production in anaerobic digestion. Bioresour. Technol. 2015, 186, 1–7. [Google Scholar] [CrossRef] [PubMed]
- McLeod, J.D.; Othman, M.Z.; Parthasarathy, R. Process intensification of anaerobic digestion: Influence on mixing and process performance. Bioresour. Technol. 2019, 274, 533–540. [Google Scholar] [CrossRef]
- Subramanian, B.; Pagilla, K.R. Anaerobic digester foaming in full-scale cylindrical digesters – Effects of organic loading rate, feed characteristics, and mixing. Bioresour. Technol. 2014, 159, 182–192. [Google Scholar] [CrossRef] [PubMed]
- Kress, P.; Nägele, H.-J.; Oechsner, H.; Ruile, S. Effect of agitation time on nutrient distribution in full-scale CSTR biogas digesters. Bioresour. Technol. 2018, 247, 1–6. [Google Scholar] [CrossRef] [PubMed]
- Lewis, K.; Hughes, W. Optimisation of Methane Production from Anaerobically Digested Cow Slurry Using Mixing Regime and Hydraulic Retention. Ph.D. Thesis, University of Exeter, Exeter, UK, 2015. [Google Scholar]
- Liu, Y.; Tay, J.-H. The essential role of hydrodynamic shear force in the formation of biofilm and granular sludge. Water Res. 2002, 36, 1653–1665. [Google Scholar] [CrossRef] [PubMed]
- Lebranchu, A.; Delaunay, S.; Marchal, P.; Blanchard, F.; Pacaud, S.; Fick, M.; Olmos, E. Impact of shear stress and impeller design on the production of biogas in anaerobic digesters. Bioresour. Technol. 2017, 245, 1139–1147. [Google Scholar] [CrossRef]
- Jiang, J.; Wu, J.; Poncin, S.; Li, H.Z. Effect of hydrodynamic shear on biogas production and granule characteristics in a continuous stirred tank reactor. Process Biochem. 2016, 51, 345–351. [Google Scholar] [CrossRef]
- Hoffmann, R.A.; Garcia, M.L.; Veskivar, M.; Karim, K.; Al-Dahhan, M.H.; Angenent, L.T. Effect of shear on performance and microbial ecology of continuously stirred anaerobic digesters treating animal manure. Biotechnol. Bioeng. 2007, 100, 38–48. [Google Scholar] [CrossRef] [PubMed]
- Amiraftabi, M.; Khiadani, M.; Mohammed, H.A. Performance of a dual helical ribbon impeller in a two-phase (gas-liquid) stirred tank reactor. Chem. Eng. Process. Process Intensif. 2020, 148, 107811. [Google Scholar] [CrossRef]
- Bose, R.S.; Chowdhury, B.; Zakaria, B.S.; Tiwari, M.K.; Dhar, B.R. Significance of different mixing conditions on performance and microbial communities in anaerobic digester amended with granular and powdered activated carbon. Bioresour. Technol. 2021, 341, 125768. [Google Scholar] [CrossRef] [PubMed]
- Lindmark, J.; Thorin, E.; Bel Fdhila, R.; Dahlquist, E. Effects of mixing on the result of anaerobic digestion: Review. Renew. Sustain. Energy Rev. 2014, 40, 1030–1047. [Google Scholar] [CrossRef]
- Önen, S.; Nsair, A.; Kuchta, K. Innovative operational strategies for biogas plant including temperature and stirring management. Waste Manag. Res. 2019, 37, 237–246. [Google Scholar] [CrossRef]
- Kowalczyk, A.; Harnisch, E.; Schwede, S.; Gerber, M.; Span, R. Different mixing modes for biogas plants using energy crops. Appl. Energy 2013, 112, 465–472. [Google Scholar] [CrossRef]
- Singh, B.; Singh, N.; Čonka, Z.; Kolcun, M.; Siménfalvi, Z.; Péter, Z.; Szamosi, Z. Critical analysis of methods adopted for evaluation of mixing efficiency in an anaerobic digester. Sustainability 2021, 13, 6668. [Google Scholar] [CrossRef]
- Singh, B.; Kovács, K.L.; Bagi, Z.; Nyári, J.; Szepesi, G.L.; Petrik, M.; Siménfalvi, Z.; Szamosi, Z. Enhancing efficiency of anaerobic digestion by optimization of mixing regimes using helical ribbon impeller. Fermentation 2021, 7, 251. [Google Scholar] [CrossRef]
- Kovács, K.L.; Ács, N.; Kovács, E.; Wirth, R.; Rákhely, G.; Strang, O.; Herbel, Z.; Bagi, Z. Improvement of biogas production by bioaugmentation. BioMed Res. Int. 2013, 2013, 482653. [Google Scholar] [CrossRef]
- Bryant, M.P. Microbial methane production—Theoretical aspects. J. Anim. Sci. 1979, 48, 193–201. [Google Scholar] [CrossRef]
- Latha, K.; Velraj, R.; Shanmugam, P.; Sivanesan, S. Mixing strategies of high solids anaerobic co-digestion using food waste with sewage sludge for enhanced biogas production. J. Clean. Prod. 2019, 210, 388–400. [Google Scholar] [CrossRef]
- Caillet, H.; Madyira, D.M.; Adelard, L. Study of the performances of a vinasse mesophilic anaerobic digester behavior submitted to intermittent mixing: Monitoring of the physicochemical properties of the digestate and local samples of the digester. Bioresour. Technol. Rep. 2021, 16, 100837. [Google Scholar] [CrossRef]
- Nandi, R.; Saha, C.K.; Alam, M.M. Effect of mixing on biogas production from cowdung. Eco-friendly Agril. J. 2017, 10, 7–13. [Google Scholar]
- Wang, Y.; Dentel, S. The effect of high speed mixing and polymer dosing rates on the geometric and rheological characteristics of conditioned anaerobic digested sludge (ADS). Water Res. 2010, 44, 6041–6052. [Google Scholar] [CrossRef] [PubMed]
- Franke-Whittle, I.H.; Walter, A.; Ebner, C.; Insam, H. Investigation into the effect of high concentrations of volatile fatty acids in anaerobic digestion on methanogenic communities. Waste Manag. 2014, 34, 2080–2089. [Google Scholar] [CrossRef] [Green Version]
- Ferrer, I.; Vázquez, F.; Font, X. Long term operation of a thermophilic anaerobic reactor: Process stability and efficiency at decreasing sludge retention time. Bioresour. Technol. 2010, 101, 2972–2980. [Google Scholar] [CrossRef] [PubMed]
- Camp, T.R. Velocity gradients and internal work in fluid motion. J. Bost. Soc. Civ. Eng. 1943, 30, 219–230. [Google Scholar]
Figure 1.
The schematic 2D diagram of the experimental setup.

Figure 2.
The geometry of the helical ribbon impeller used in this study.

Figure 3.
Represents the daily biogas production for continuous 20 days at different mixing intervals. (a) for digester 1, (b) for digester 2, and (c) for digester 3, respectively. (d) represents the overall biogas production from all three digesters.
Figure 3.
Represents the daily biogas production for continuous 20 days at different mixing intervals. (a) for digester 1, (b) for digester 2, and (c) for digester 3, respectively. (d) represents the overall biogas production from all three digesters.

Figure 4.
Performance of all three anaerobic digesters for total volatile solids removal with different mixing intervals at 67 rpm.
Figure 4.
Performance of all three anaerobic digesters for total volatile solids removal with different mixing intervals at 67 rpm.

Figure 5.
pH levels during the various mixing intervals throughout the experiment.

Figure 6.
VFA concentration at various mixing regimes.

Figure 7.
Total ammonia concentrations during the entire experiment.

Figure 8.
Relationship between mixing intensity number and mixing time.


Table 1.
Characteristics of the substrate used in the experiment.
| Parameter | Value Range |
|---|---|
| TS (%) | 4.28 |
| SS (g L−1) | 57.8 ± 10.0 |
| Total carbon (%) | 46.2 |
| TVS (g L−1) | 87.6 ± 3.4 |
| COD (g L−1) | 141 ± 6.4 |
| VFA (g L−1) | 4.15 ± 1.38 |
| ρ (kg m−3) | 1068 |
| HRT (d) | 18 |
Table 2.
Comparison of biogas production from all three digesters under similar working conditions.
| Mixing Regime 1 (1 h Resting Time) (Period 15–35 days) | Mixing Regime 1 (2 h Resting Time) (Period 35–55 days) | Mixing Regime 3 (3 h Resting Time) (Period 55–75 days) | Mixing Regime 4 (4 h Resting Time) (Period 75–95 days) | |||||||||
|---|---|---|---|---|---|---|---|---|---|---|---|---|
| Fermenters → | F1 | F2 | F3 | F1 | F2 | F3 | F1 | F2 | F3 | F1 | F2 | F3 |
| Total Biogas production (L/d) | 54.1 | 52.24 | 55.5 | 48.9 | 48.6 | 51.2 | 49.9 | 49.8 | 49.6 | 46.6 | 33.4 | 47.3 |
| Maximum BY (daily) (L/d) | 3.84 | 3.24 | 3.71 | 3.36 | 3.20 | 2.91 | 2.98 | 3.12 | 2.34 | 2.94 | 2.82 | 2.35 |
| Minimum BP (daily) (L/d) | 2.50 | 2.44 | 2.43 | 2.36 | 2.39 | 2.42 | 2.34 | 2.53 | 2.77 | 2.31 | 2.22 | 2.43 |
| Average (L/d) | 2.70 | 2.61 | 2.77 | 2.44 | 2.43 | 2.55 | 2.49 | 2.82 | 2.48 | 2.33 | 2.51 | 2.36 |
Table 3.
Statistical analysis of biogas production at various resting times during mixing.
| Resting Time (hr) | Data Set | p Values | ||
|---|---|---|---|---|
| 1 | F1 | F2 | F3 | 0.63712 |
| 2 | F1 | F2 | F3 | 0.092734 |
| 3 | F1 | F2 | F3 | 0.17832 |
| 4 | F1 | F2 | F3 | 0.28374 |
Table 4.
Represents the total VS reduction (%) in all the digesters at various mixing intervals.
| Digesters | Mixing Intervals (hours) | VS Removal Efficiency (%) | Total Biogas Production (L) |
|---|---|---|---|
| F1 | 1 | 65.1 ± 3.4 | 54.1 ± 0.24 |
| 2 | 58.7 ± 2.1 | 48.9 ± 0.31 | |
| 3 | 63.2 ± 3.6 | 49.7 ± 0.25 | |
| 4 | 58.3 ± 1.4 | 46.6 ± 0.14 | |
| F2 | 1 | 64.2 ± 2.5 | 52.2 ± 0.32 |
| 2 | 57.6 ± 3.2 | 48.6 ± 0.13 | |
| 3 | 58.8 ± 5.2 | 49.8 ± 0.26 | |
| 4 | 53.6 ± 2.8 | 33.4 ± 0.27 | |
| F3 | 1 | 68.5 ± 2.7 | 55.5 ± 0.17 |
| 2 | 61.2 ± 3.4 | 51.2 ± 0.30 | |
| 3 | 59.6 ± 3.2 | 49.6 ± 0.23 | |
| 4 | 56.7 ± 2.5 | 47.3 ± 0.21 |
Table 5.
Average performance values of the digesters at various mixing-resting intervals.
| Mixing Regime 1 (1 h Resting Time) (Period 1–20 days) | Mixing Regime 2 (2 h Resting Time) (Period 20–40 days) | Mixing Regime 3 (3 h Resting Time) (Period 40–60 days) | Mixing Regime 4 (4 h Resting Time) (Period 60–80 days) | |||||||||
|---|---|---|---|---|---|---|---|---|---|---|---|---|
| VFA’s (g/L) | 7.3 | 6.1 | 5.8 | 3.1 | 3.8 | 4.9 | 1.1 | 1.9 | 2.2 | 2.4 | 4.3 | 3.1 |
| pH | 7.2 | 7.0 | 7.7 | 7.1 | 8.0 | 7.7 | 8.5 | 7.9 | 8.1 | 7.6 | 8.0 | 7.9 |
| NH4+-N (g/L) | 0.94 | 0.89 | 9.15 | 0.88 | 0.82 | 0.85 | 0.66 | 0.75 | 0.58 | 0.78 | 0.82 | 0.99 |
| FOS/TAC Ratio | 0.34 | 0.49 | 0.45 | 0.35 | 0.44 | 0.47 | 0.29 | 0.24 | 0.42 | 0.24 | 0.35 | 0.44 |
Table 6.
Comparison between total biogas production and the mixing intensity number.
| Resting Time (Hours) | Mixing Time (Minutes Per Day) | Mixing Intensity No. | Total Biogas Production (L) |
|---|---|---|---|
| 1 | 120 | 72,000 | 54.1 |
| 2 | 60 | 36,000 | 51.2 |
| 3 | 40 | 24,000 | 49.9 |
| 4 | 30 | 18,000 | 46.6 |
Publisher’s Note: MDPI stays neutral with regard to jurisdictional claims in published maps and institutional affiliations. |
© 2022 by the authors. Licensee MDPI, Basel, Switzerland. This article is an open access article distributed under the terms and conditions of the Creative Commons Attribution (CC BY) license (https://creativecommons.org/licenses/by/4.0/).
Share and Cite
MDPI and ACS Style
Singh, B.; Kovács, K.L.; Bagi, Z.; Petrik, M.; Szepesi, G.L.; Siménfalvi, Z.; Szamosi, Z. Significance of Intermittent Mixing in Mesophilic Anaerobic Digester. Fermentation 2022, 8, 518. https://doi.org/10.3390/fermentation8100518
AMA Style
Singh B, Kovács KL, Bagi Z, Petrik M, Szepesi GL, Siménfalvi Z, Szamosi Z. Significance of Intermittent Mixing in Mesophilic Anaerobic Digester. Fermentation. 2022; 8(10):518. https://doi.org/10.3390/fermentation8100518
Chicago/Turabian StyleSingh, Buta, Kornél L. Kovács, Zoltán Bagi, Máté Petrik, Gábor L. Szepesi, Zoltán Siménfalvi, and Zoltán Szamosi. 2022. "Significance of Intermittent Mixing in Mesophilic Anaerobic Digester" Fermentation 8, no. 10: 518. https://doi.org/10.3390/fermentation8100518
Note that from the first issue of 2016, this journal uses article numbers instead of page numbers. See further details here.