1. Introduction
Non-
Saccharomyces yeasts (NSY) have long been considered undesirable spoiling microorganisms in the wine industry, but in recent years, there has been an increasing interest in their enological use [
1]. This is mainly due to their ability to enhance varietal characteristics and aroma profile, improving wine quality and reducing alcoholic strength, especially when used in sequential or mixed fermentation with
Saccharomyces cerevisiae [
2,
3].
Generally, NSY show slower growth and lower fermentation capacity compared to
S. cerevisiae [
4], with minor yield in ethanol and glycerol and higher production of volatile acidity [
3], but they may enhance the aromatic complexity and color stability of wines [
5]. Results depend on yeast strain [
3,
6], nitrogen source [
7], metabolism [
8,
9] and fermentation conditions [
2]. Positive effects were also observed during sparkling wine production; Medina-Trujillo and colleagues [
10] observed that the sequential inoculation of
Torulaspora delbrueckii and
Saccharomyces cerevisiae during the fermentation of base wine, improved the foaming properties of the sparkling wine obtained.
An interesting feature that characterizes many NSY is the higher amount of polysaccharides (PS) produced during alcoholic fermentation, in comparison with
S. cerevisiae, which may be related to the higher production capacity or faster cell turnover during the growth phase [
4]. These PS mainly consist of mannoproteins with high mannose/glucose ratio [
4] or galactomannoproteins [
11,
12]; their release varies during the different stages of alcoholic fermentation, in terms of composition (e.g., monosaccharide moieties) and protein fraction, mainly depending on the yeast strain [
13]. A high release of PS was also observed during aging on lees, due to the different structure and chemical composition of cell walls, as well as depending on the different autolytic capacity of the yeasts [
12,
14]. The greater release of PS compared to
S. cerevisiae suggests that the use of NSY strains could reduce the length of sur-lies aging.
Concerning the potential of NSY to protect wine against oxidation, most of the studies available in the literature mainly focused on their use during alcoholic fermentation, with positive effects on the stability of the phenolic fraction in red wines and an improved formation of stable pigments, such as vitisins or other anthocyanin-derived compounds [
6,
15]. Moreover, glutathione (GSH) and other yeast compounds containing cysteine residues (as well as yeast lees themselves) are well known for their antioxidant properties. Most of the studies about this subject have been carried out on
S. cerevisiae [
16,
17], but the increasing interest in NSY has recently led to investigating their GSH metabolism too. A higher ratio between reduced and oxidized GSH (GSH/GSSG) in dry cells during active dry yeast preparation [
18] and a higher amount of reduced GSH produced during single and sequential fermentation [
19] were observed, highlighting once again the great potential of the use of NSY in winemaking.
The aim of this work was to investigate the capacity of different non-Saccharomyces wild strains isolated from red grape pomace and must, to produce polysaccharides and antioxidant compounds, with the purpose of evaluating their potential application for improving sur-lies aging and for the production of yeast derivatives for wine aging. Twenty yeast strains were isolated and identified, on the basis of their colonies and cell morphology (evaluated on differential growth media and by optical microscopy) as well as by 26S rRNA sequencing. The aptitude of the strains isolated to be used for winemaking applications was evaluated in terms of yeast cell viability and biomass production, as well as on the basis of the release of polysaccharides, antioxidant compounds and amino nitrogen after cell growth and after autolysis induced with β-glucanase enzymes, in comparison with commercial strains of S. cerevisiae and T. delbrueckii.
2. Materials and Methods
2.1. Reagents and Materials
Sodium chloride for microbiology, bacteriological peptone, Malt Extract Broth (ME), Wallerstein Laboratory Nutrient agar (WLN), Wallerstein Laboratory Differential agar (WLD) and technical agar were purchased from Oxoid (Milan, Italy); Yeast-Extract Peptone Dextrose broth (YPD) and tetracycline, sodium hydroxide, N-acetyl-L-cysteine, o-phthaldialdehyde (OPA), isoleucine, ethanol (96% v/v), mannan from S. cerevisiae, 4,4′-dithiodipyridine (DTDP), sodium acetate, ethylenediaminetetraacetic acid (EDTA), L-glutathione reduced, sodium phosphate, yeast glutathione reductase, NADPH, 5,5′-dithiobis(2-nitrobenzoic acid) (DTNB) were from Sigma Aldrich Italy (Milan, Italy). Boric acid and hydrochloric acid (37% v/v) were purchased from Carlo Erba Reagents (Milan, Italy). MilliQ water was produced by Milli-Q Advantage A10 apparatus (Merck Millipore, Billerica, MA, USA) and micro-filtered at 0.22 µm before use. Commercial β-glucanase preparation and commercial active dry yeasts (ADY) S. cerevisiae and T. delbrueckii were from Enologica Vason SpA (San Pietro in Cariano, VR, Italy).
2.2. Isolation and Identification of Wild Yeast Strains
Wild yeast strains were isolated from grape juice and pomace of red grapes cv. Merlot, supplied by a local producer (Friuli Venezia Giulia—North-East Italy). Grapes (approx. 1 ton) were harvested at technological ripeness (total soluble solids 20 brix, titratable acidity 6.0 g/L, pH 3.5) and immediately destemmed and crushed in the winery. No maceration was carried out and the mash was directly subjected to pressing.
An overall amount of approximately 2.0 kg of pomace and 2 L of must were collected in sterile conditions after pressing and taken to the lab. Regarding pomace, aliquots of 10.00 g were transferred into sterile stomacher bags, 90 mL of saline-peptone water (8 g/L NaCl, 1 g/L bacteriological peptone) were added and mixed for 1.5 min in a Stomacher machine (PBI, Milan, Italy). Concerning must, it was directly subjected to microbiological analysis.
Decimal dilutions were made in physiological solution and yeasts were counted on Malt Extract (ME) supplemented with tetracycline (10 mg/mL), incubated at 25 °C for 48–72 h for the general count and on WLN and WLD, incubated at 25 °C for 3–5 days for evaluating colony diversity. All trials were conducted in triplicate: three biological replicates for sampling and three technical repetitions for each decimal dilution. After counting, means and standard deviation were calculated. Twenty colonies were isolated from the agar plates also based on their morphology, color and size. Isolates were streaked and purified on YPD agar and then stored at −80 °C in the YPD broth, supplemented with glycerol (30% final concentration). The isolates were then identified.
After purification, a presumptive identification step was performed observing the morphology of the colonies on WLN and WLD. Then, cell morphology was also observed by optical microscopy with phase contrast (100×). Finally, at least one strain per each different morphological profile was selected to confirm the presumptive identification via 26S rRNA gene sequencing as described below.
2.3. DNA Extraction from Pure Cultures
One milliliter of an overnight culture was centrifuged at 14,000×
g for 10 min at 4 °C to pellet the cells and the pellet was subjected to DNA extraction according to Andrighetto et al. [
20].
2.4. Identification of Yeast Isolates
Yeasts were identified by molecular methods by 26S rRNA sequencing. DNA of the isolated strains was used as a target for PCR reaction using primers NL1, 5′-GCC ATA TCA ATA AGC GGA GGA AAA G-3′ and NL4, 5′-GGT CCG TGT TTC AAG ACG G-3′ according to the reaction mixture and amplification protocol described by Iacumin et al. [
21]. After purification using the QIAquick PCR Purification Kit (Qiagen, Milan, Italy), following the Handbook instruction, products were sent to a commercial facility for sequencing (Eurofins MWG GmbH, Martinsried, Germany). Finally, sequences were aligned with those in GeneBank with the Blast program [
22] to determine the closest known relatives, based on the partial 26S rRNA gene homology.
2.5. Biomass Production and Lysis Treatment
For each strain identified, a single pure colony was transferred into sterile test tubes containing 3 mL of YPD broth and incubated at 30 °C for 48 h; three aliquots of 100 µL of the suspensions were then transferred in sterile test tubes containing 10 mL each of YPD broth and further incubated at 30 °C for 48 h.
Viable cells were counted after growth, by plating 100 µL of proper serial dilutions of each sample on Malt Extract Agar and incubating for 48 h at 30 °C. Moreover, the production of biomass was assessed by filtration under vacuum on pre-weighted 0.45 µm cellulose acetate membranes; membranes were washed with sterile water and placed in oven at 60 °C for 2 h up to constant weight. The difference between the initial and final weight was used to calculate the biomass expressed in g/L.
After growth, additional aliquots of yeast suspensions were centrifuged (5 min, 3000 rpm), the biomass was washed twice with sterile water, resuspended in 10 mL of MilliQ water and subjected to enzymatic lysis. A commercial β-glucanase preparation was added (5% w/v) and samples were incubated at 45 °C for 24 h.
Both suspensions (at the end of the growing phase) and autolyzed cultures (after enzyme treatment) were subjected to the analytical determinations reported below. All trials were performed in triplicate and the performances of the strains isolated were compared with those of two commercial strains of S. cerevisiae and T. delbrueckii. Concerning the samples analyzed at the end of the growing phase, because of the presence in the growing medium of compounds deriving from the yeast extract present in the YPD broth (e.g., amino acids, polysaccharides, glutathione and thiol molecules), the growing medium itself was also subjected to the same analytical determinations indicated below and the results obtained were used as blank to correct the data.
2.6. Release of Amino Acids
The amino acids released during growth and after enzymatic lysis were quantified spectrophotometrically by
o-phthaldialdehyde (OPA) derivatization as reported by Dukes and Butzke [
23].
Before analysis, yeast suspensions collected after the growing phase and the autolysates obtained by enzymatic treatment were centrifuged (10 min, 3000 rpm) and 50 µL of the supernatant was subjected to derivatization. A calibration line made with isoleucine (Ile) was prepared (0–10 mM) and the results were expressed in mg per 109 cells.
2.7. Release of Polysaccharides
Polysaccharides were determined by SE-HPLC after ethanol precipitation. Yeast suspensions (after growth) and autolysates (after enzyme treatment) were centrifuged (10 min, 3000 rpm) and 5 mL of supernatant was added to 5 volumes of ethanol (96% v/v). Samples were stored at 0–4 °C for 24 h. The precipitated pellet was separated by centrifugation, washed twice with ethanol (96% v/v), resuspended in 5 mL of MilliQ water and filtered on 0.22 µm cellulose acetate membrane before injection. SE-HPLC separation was achieved using a binary pump Model LC 250 (Perkin-Elmer, Waltham, MA, USA), equipped with a manual injection valve (type 7125 NS Rheodyne, Rohnert Park, CA, USA) and a refractive index detector RID-10A (Shimadzu, Kyoto, Japan). The column was an Ultrahydrogel 250 (6 µm, 300 × 7.8 mm, Waters, Milford, MA, USA). The mobile phase was MilliQ water and the separation was performed in isocratic conditions, with a flow rate of 0.7 mL/min; injection volume was 20 µL. Total polysaccharides were quantified by a calibration line prepared with mannan (10–1000 mg/L); results were given in mg/109 cells.
2.8. Release of Antioxidant Compounds
It is known that antioxidant compounds in yeast mainly consist of thiol molecules and glutathione. The release of such compounds was determined spectrophotometrically, after eliminating from suspensions and autolysates yeast cells, insoluble residues and cell debris. The suspensions collected after growth and enzymatic lysis were centrifuged for 10 min at 3000 rpm, and the supernatant was used for the analysis.
Thiol compounds were determined by derivatization with 4,4′-dithiodipyridine (DTDP), according to Gallardo-Chacón and colleagues [
17]. The amount of soluble thiols was expressed in µmol of GSH per 10
9 cells, using a calibration line prepared with GSH (0–650 µmol/L).
Glutathione was analyzed by the enzymatic assay described by Adams and Liyanage [
24]. Results were expressed in µmol of GSH per 10
9 cells.
2.9. Statistical Analysis
The results obtained were means and standard deviations of three repeated trials. One-way ANOVA and Tukey HSD were carried out for all the parameters evaluated and differences were considered significant at p < 0.05. All elaborations were carried out by the software Statistica for Windows Version 8.0 (StatSoft, Tulsa, OK, USA).
3. Results and Discussion
3.1. Isolation and Identification of Yeast Strains
Different morphotypes were isolated on the selected differential culture media. The morphology of the colonies (
Table S1—Supplementary Materials) allowed us to tentatively identify the genus: for instance, knoblike colonies with cream to light green color, smooth opaque surface and creamy consistency characterize
Saccharomyces spp., while dark green, flat colonies with smooth surface and butter consistency, are typical of
Hanseniaspora spp. Such morphotypes were comparable to those observed by other authors after isolation and identification of native grape microbiota on the same differential culture medium [
25,
26]. Single pure colonies were also analyzed, for each strain, by phase contrast optical microscopy (magnification 100×), further confirming the belonging to the previously hypothesized genera (
Table S1—Supplementary Materials).
On the basis of their morphological similarities, strains were then divided into six groups tentatively corresponding to the genera; at least one strain per group was subjected to PCR amplification and 26S rRNA sequencing. The molecular analysis confirmed the previous identification (
Table S2—Supplementary Materials).
Based on this approach, twenty native yeast strains were tentatively identified in red grape juice and pomace (
Table 1). Seven belong to the genus
Saccharomyces, whereas the remaining thirteen were recognized as NSY, belonging to
Candida spp. (
n = 1),
Hanseniaspora spp. (
n = 5),
Metschnikowia spp. (
n = 1),
Pichia spp. (
n = 2) and
Starmerella spp. (
n = 4). All strains were representative of the spontaneous microbiota of grapes and musts.
3.2. Biomass Production and Microbial Count
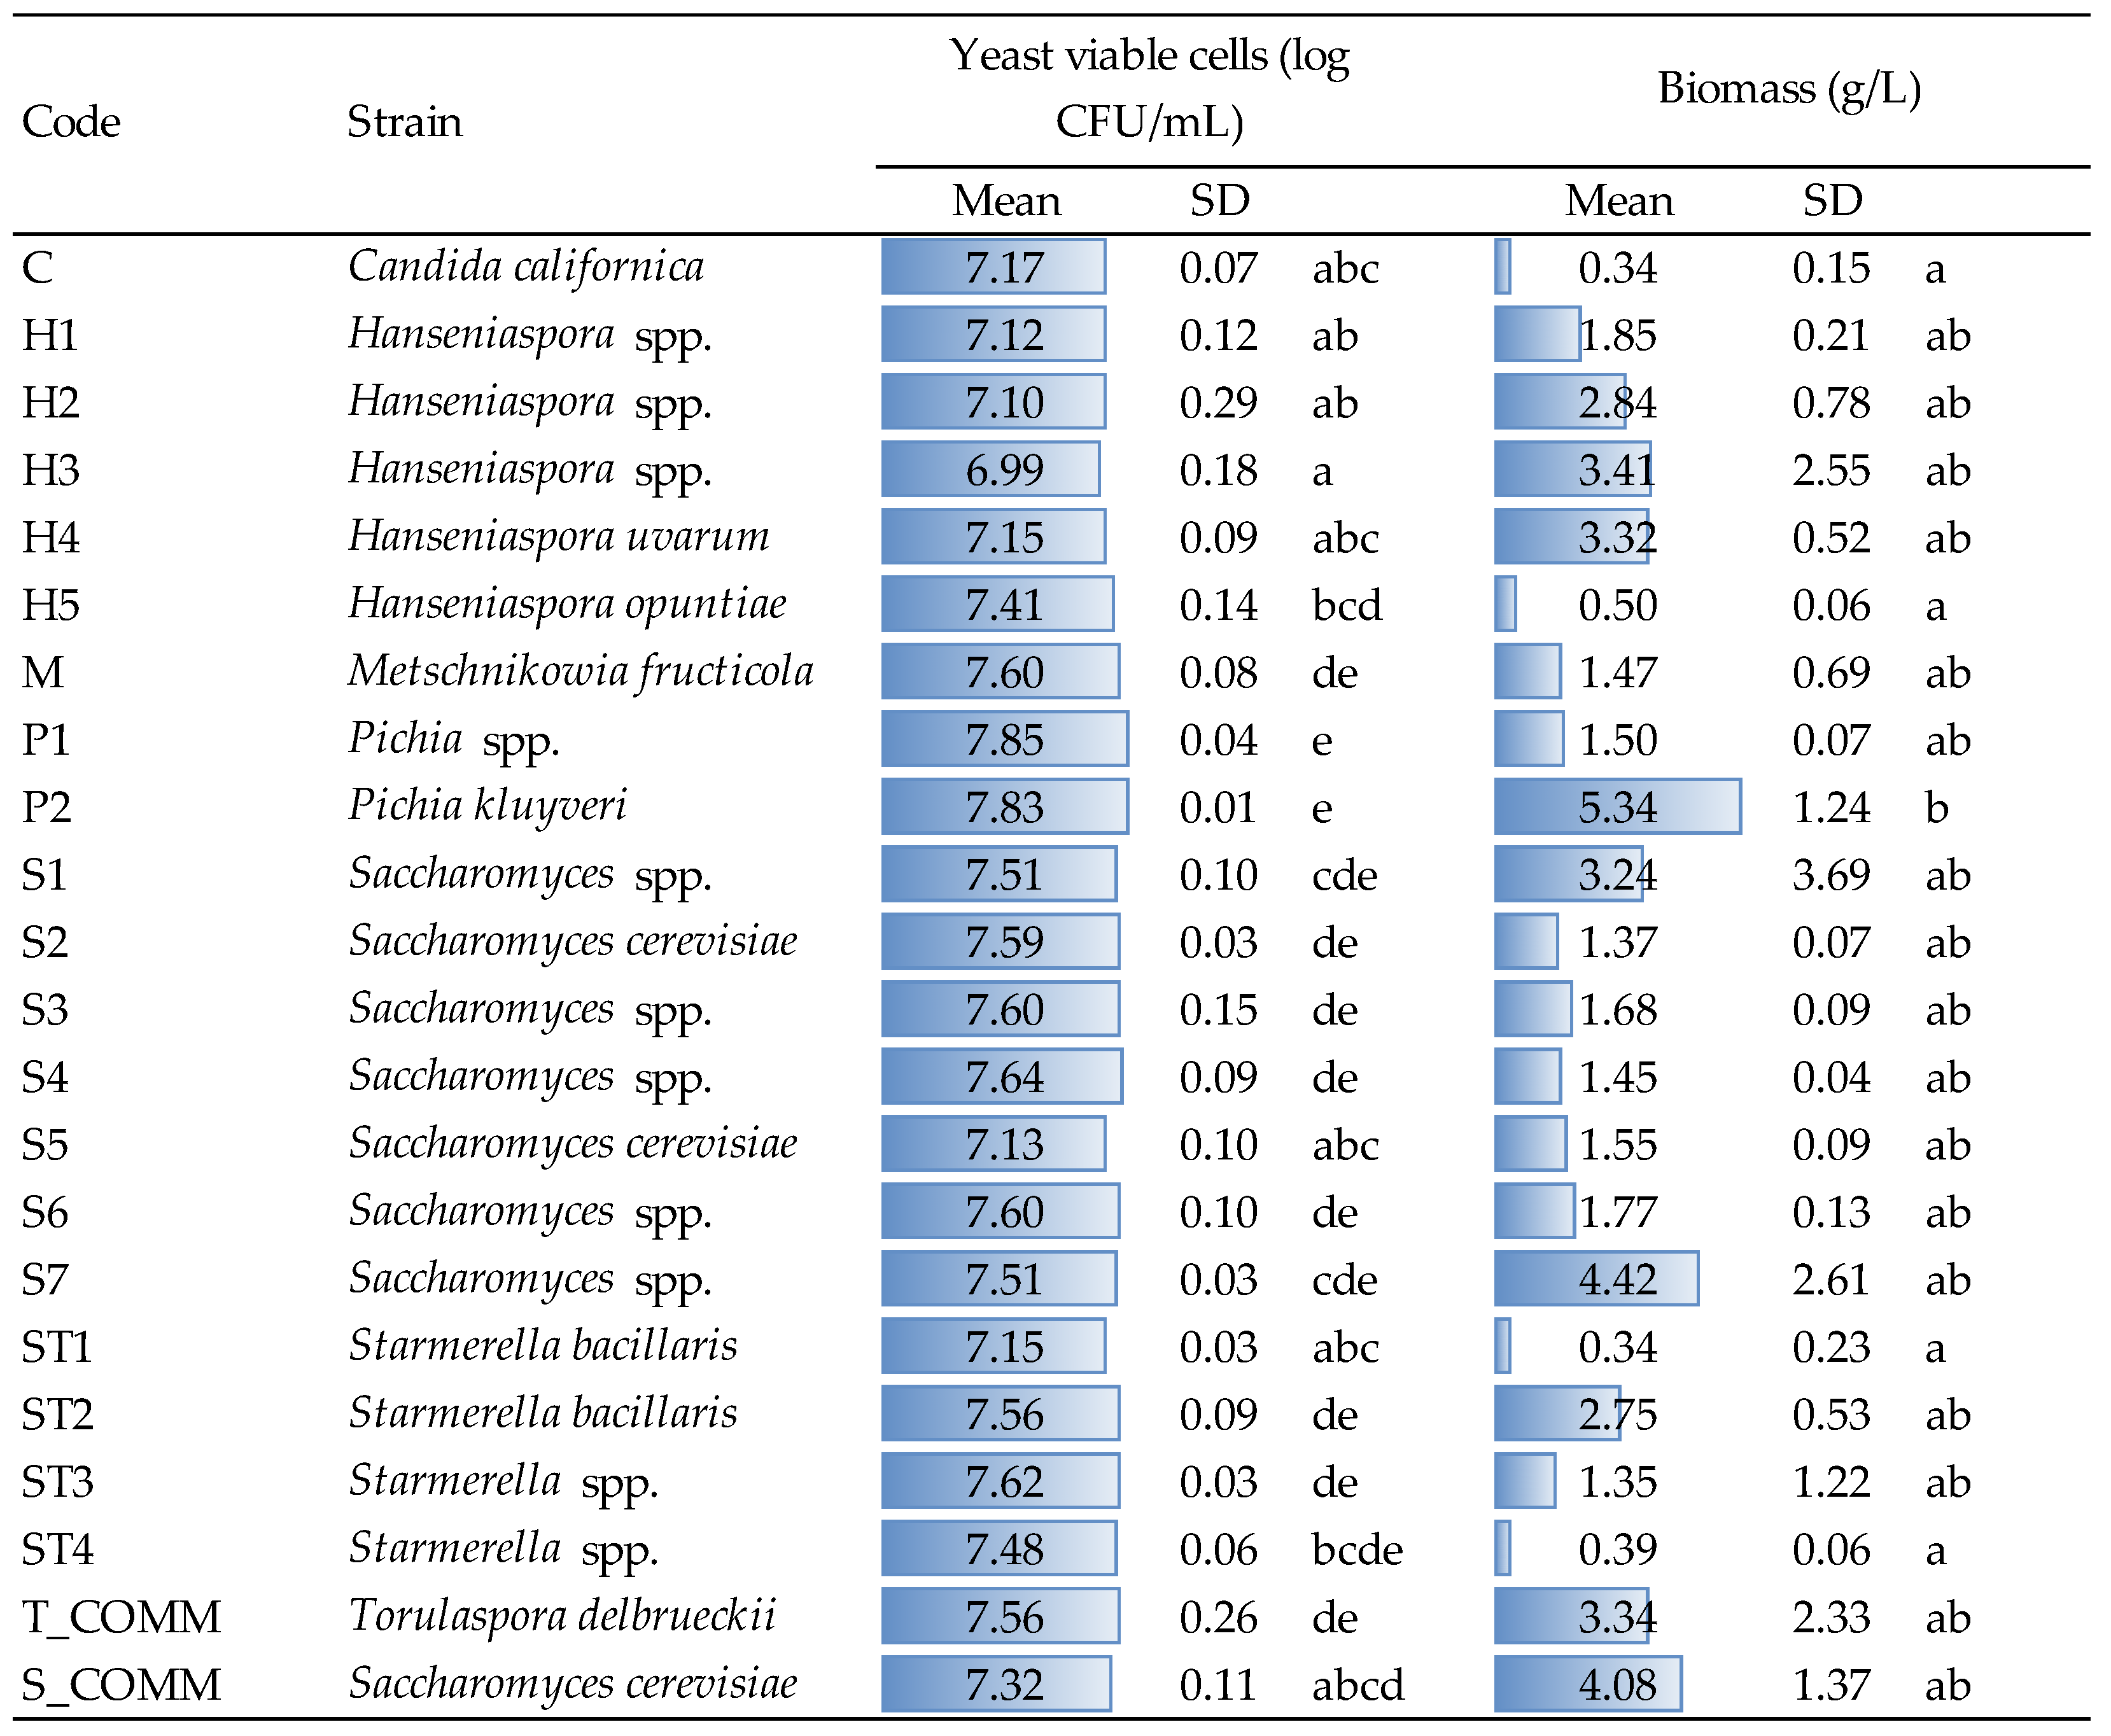
Yeast viability and biomass recovery were evaluated after growth (48 h, YPD medium, 30 °C) for the strains under evaluation and the results are reported in
Figure 1.
Concerning viable cells, statistical elaboration allowed us to highlight significant differences inter- and intra-specie. For instance, the two Pichia strains (P1 and P2) showed significantly higher values than those found for Candida, Hanseniaspora and commercial S. cerevisiae (S_COMM), as well as, within Hanseniaspora itself, the strain H5 significantly differed from strain H3, which showed the lowest average viability (6.99 log CFU/mL). Despite these variations appearing statistically relevant, from a practical point of view, the number of viable cells detected after growth was comparable for all strains, highlighting a good growing capacity in the tested conditions.
Concerning the production of biomass, the highest amount was observed for strain P2 with 5.34 g/L; this value significantly differed from those found for strains C (
Candida spp.), H5 (
Hanseniaspora spp.), ST1 and ST4 (
Starmerella spp.).
Saccharomyces (both commercial and strains S1 and S7), commercial
T. delbruecki and strains H2, H3 and H4 (
Hanseniaspora spp.) also showed interesting biomass recoveries, with values ranging from 2.8 to 4.4 g/L averagely. Even if no other significant differences were observed, the amount of biomass produced by some
Saccharomyces strains, as well as by certain
Hanseniaspora spp. are not negligible from a practical point of view; this feature might be interesting for the production of yeast autolysates, or other yeast-derived products used in winemaking. The results obtained in terms of microbial counts (about 10
7 CFU/mL for all strains) and biomass production agree with those observed by other authors under winemaking conditions [
4,
8], with variations that seemed to be strain-dependent, probably linked to the different ability to use growth factors, sugars and amino acids [
7,
8,
27].
3.3. Release of Polysaccharides after Growth and Lysis Treatment
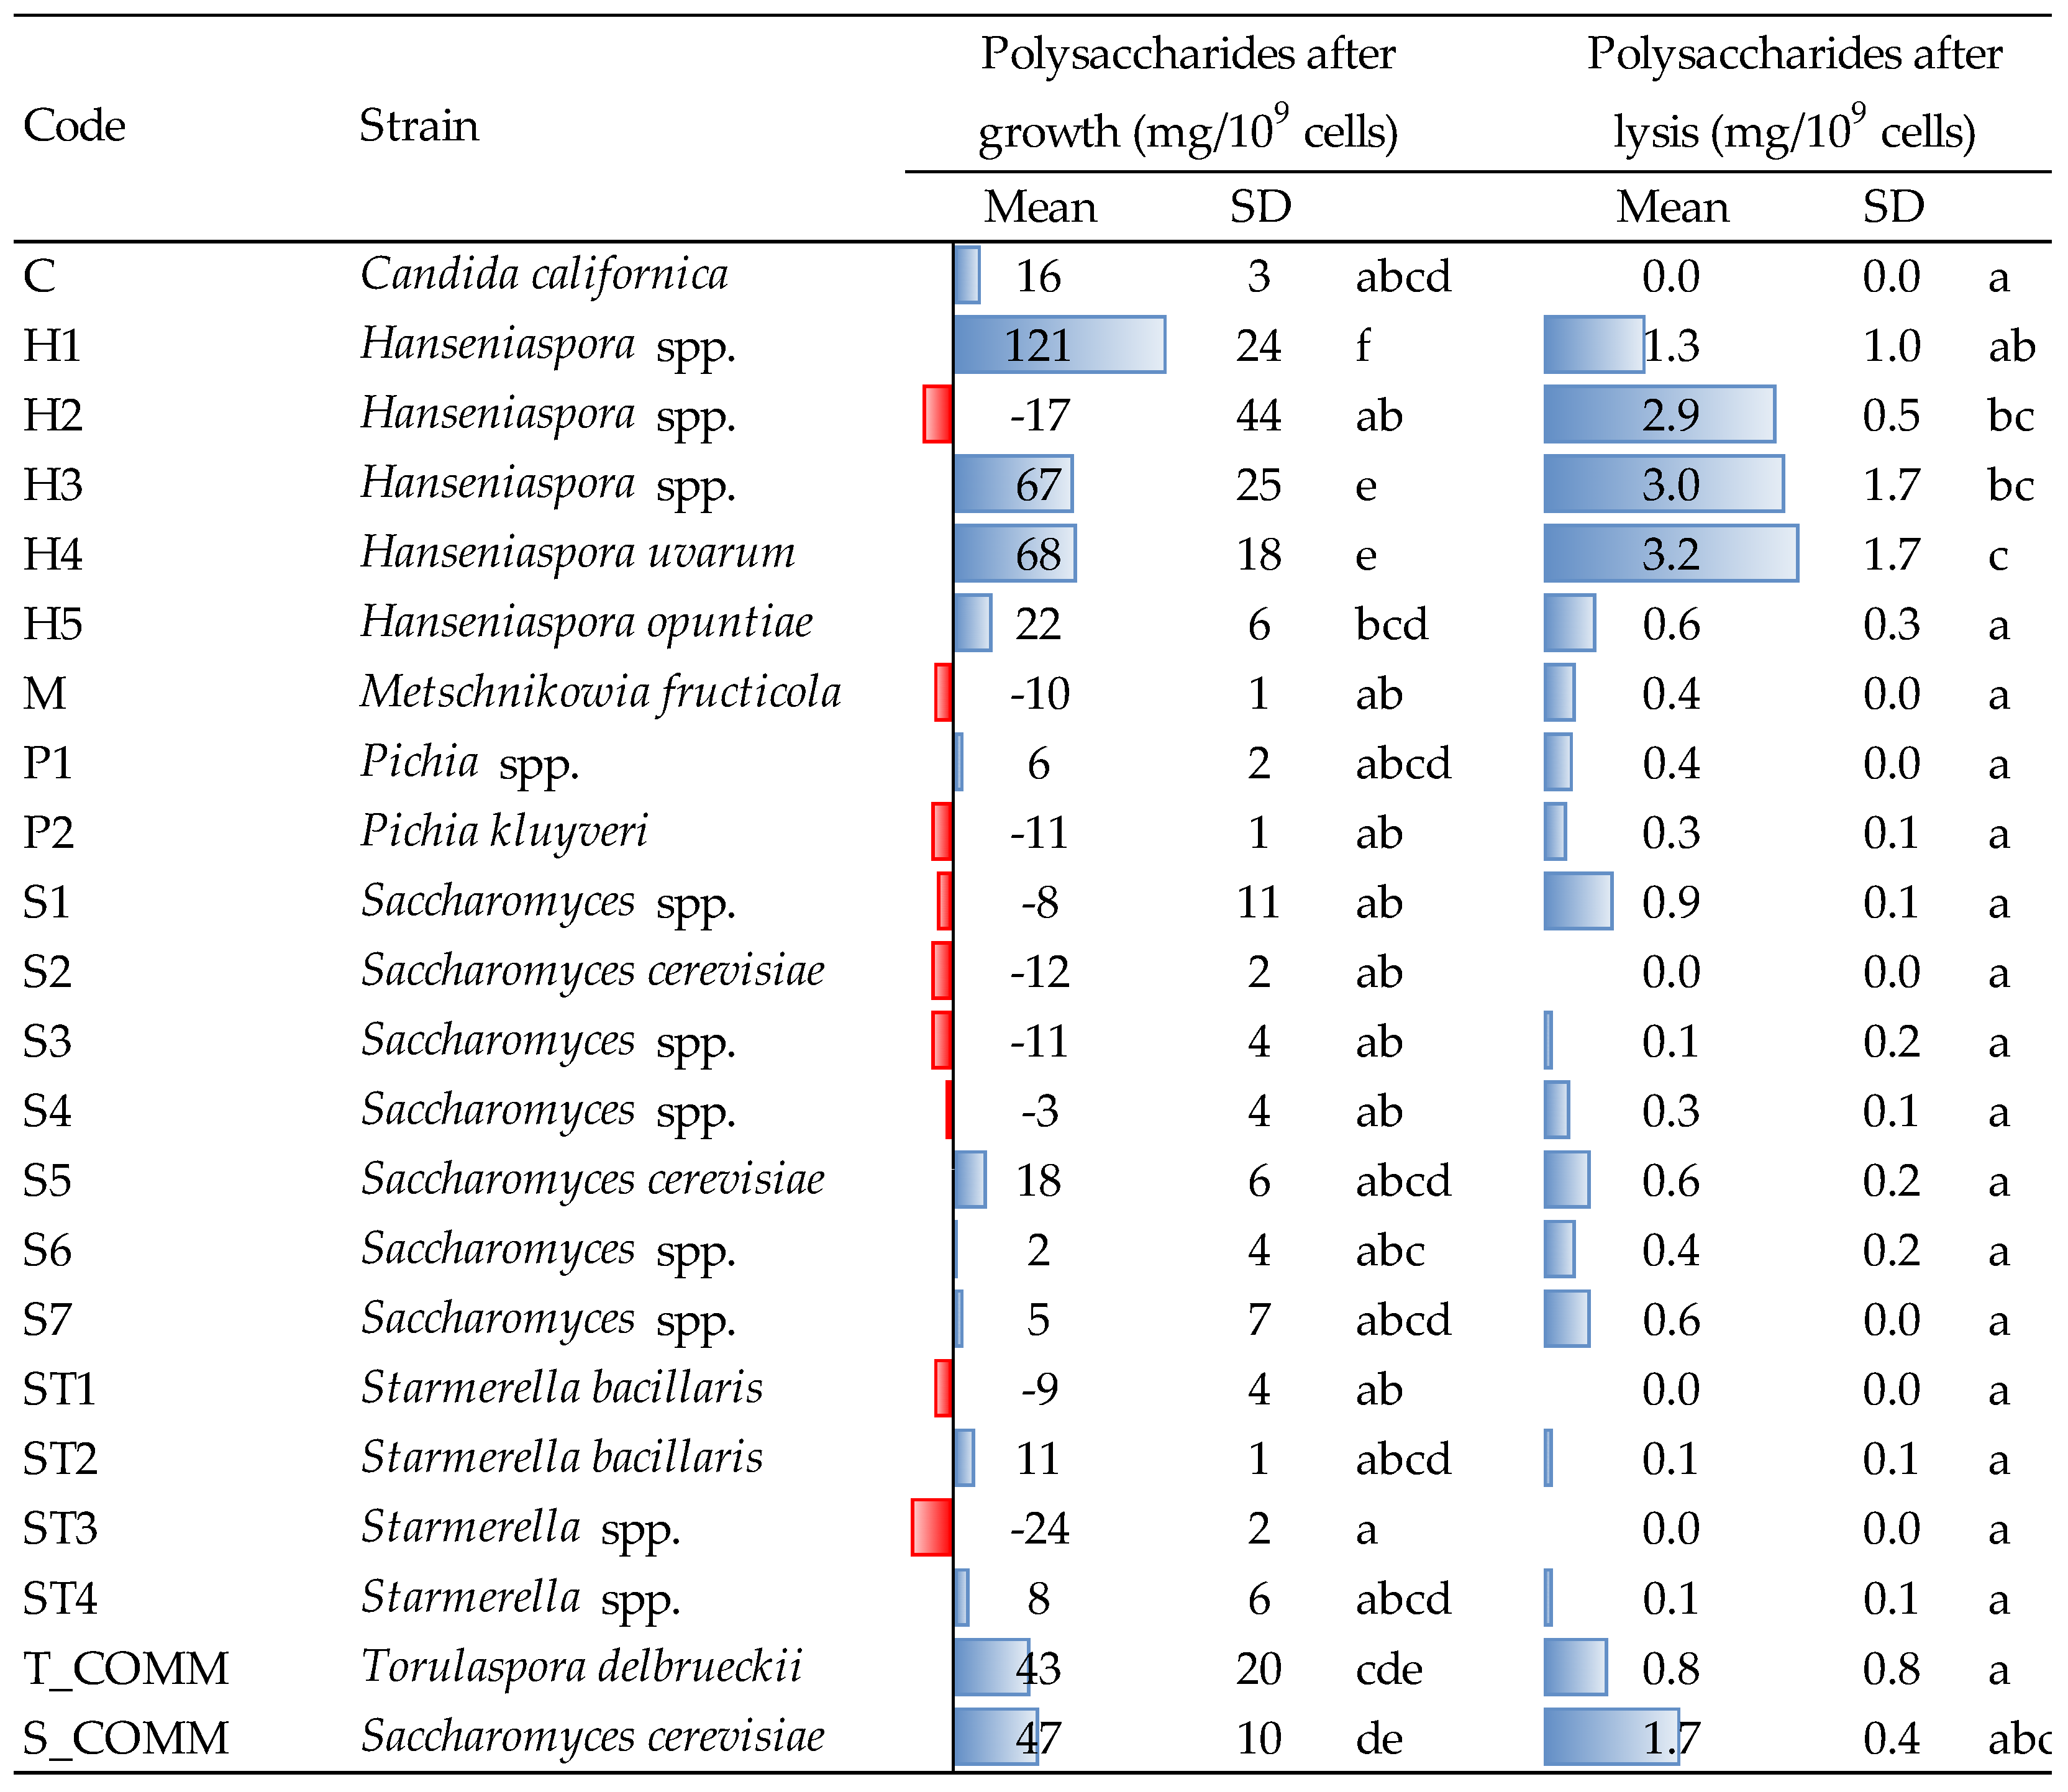
The amount of polysaccharides (PS) detected in the culture medium after growth is reported in
Figure 2.
Hanseniaspora strains (except the one coded as H2) showed the highest release of polysaccharides with major concentration observed for strain H1 (121 mg/10
9 cells), significantly different from all the other strains. H3 and H4 (67–68 mg/10
9 cells) and the two commercial yeasts used as reference (T_COMM and S_COMM) also demonstrated a good capacity in releasing PS. This trend may highlight a higher production rate of cell wall polysaccharides (e.g., mannoproteins and glucans), or a faster cell turnover for these strains during the growing phase. Although the amount of biomass produced by
Hanseniaspora spp. was slightly lower than that observed for some
Saccharomyces (
Figure 1), the ability of the former to produce a higher ratio between polysaccharide and cell dry weight during alcoholic fermentation has already been reported [
4].
The aptitude of
Hanseniaspora spp. to release polysaccharides was confirmed also after β-glucanase treatment (
Figure 2). The best results were observed for strains H2, H3 and H4, followed by the commercial
S. cerevisiae, whereas for the remaining yeasts, the amount of PS released was less than 1 mg/10
9 cells, probably depending on a different cell wall composition and autolytic behavior. On average, the amounts of PS detected after lysis (which correspond to 0–44 mg/L) are less relevant than those released during growth (up to approx. 1600 mg/L for certain strains), confirming previous literature results [
28]. Different strains, moreover, did not determine after growth, an enrichment of the PS content of the growing medium, but a decrease in the concentration initially found in the YPD broth (red bars in
Figure 2).
The capacity of
Hanseniaspora spp. to release PS may be linked to the observation that the autolytic process in this yeast occurred earlier compared to
Saccharomyces spp., resulting in a further, greater liberation of polysaccharides at the end of alcoholic fermentation, when the cells were no longer viable [
13]. This interesting feature of
Hanseniaspora spp. recently led to investigating its contribution to wine quality during fermentation and aging on lees, influencing positively the astringency, body and structure as well as the aroma profile of the resulting wines [
29,
30].
3.4. Release of Amino Acids after Growth and Lysis Treatment
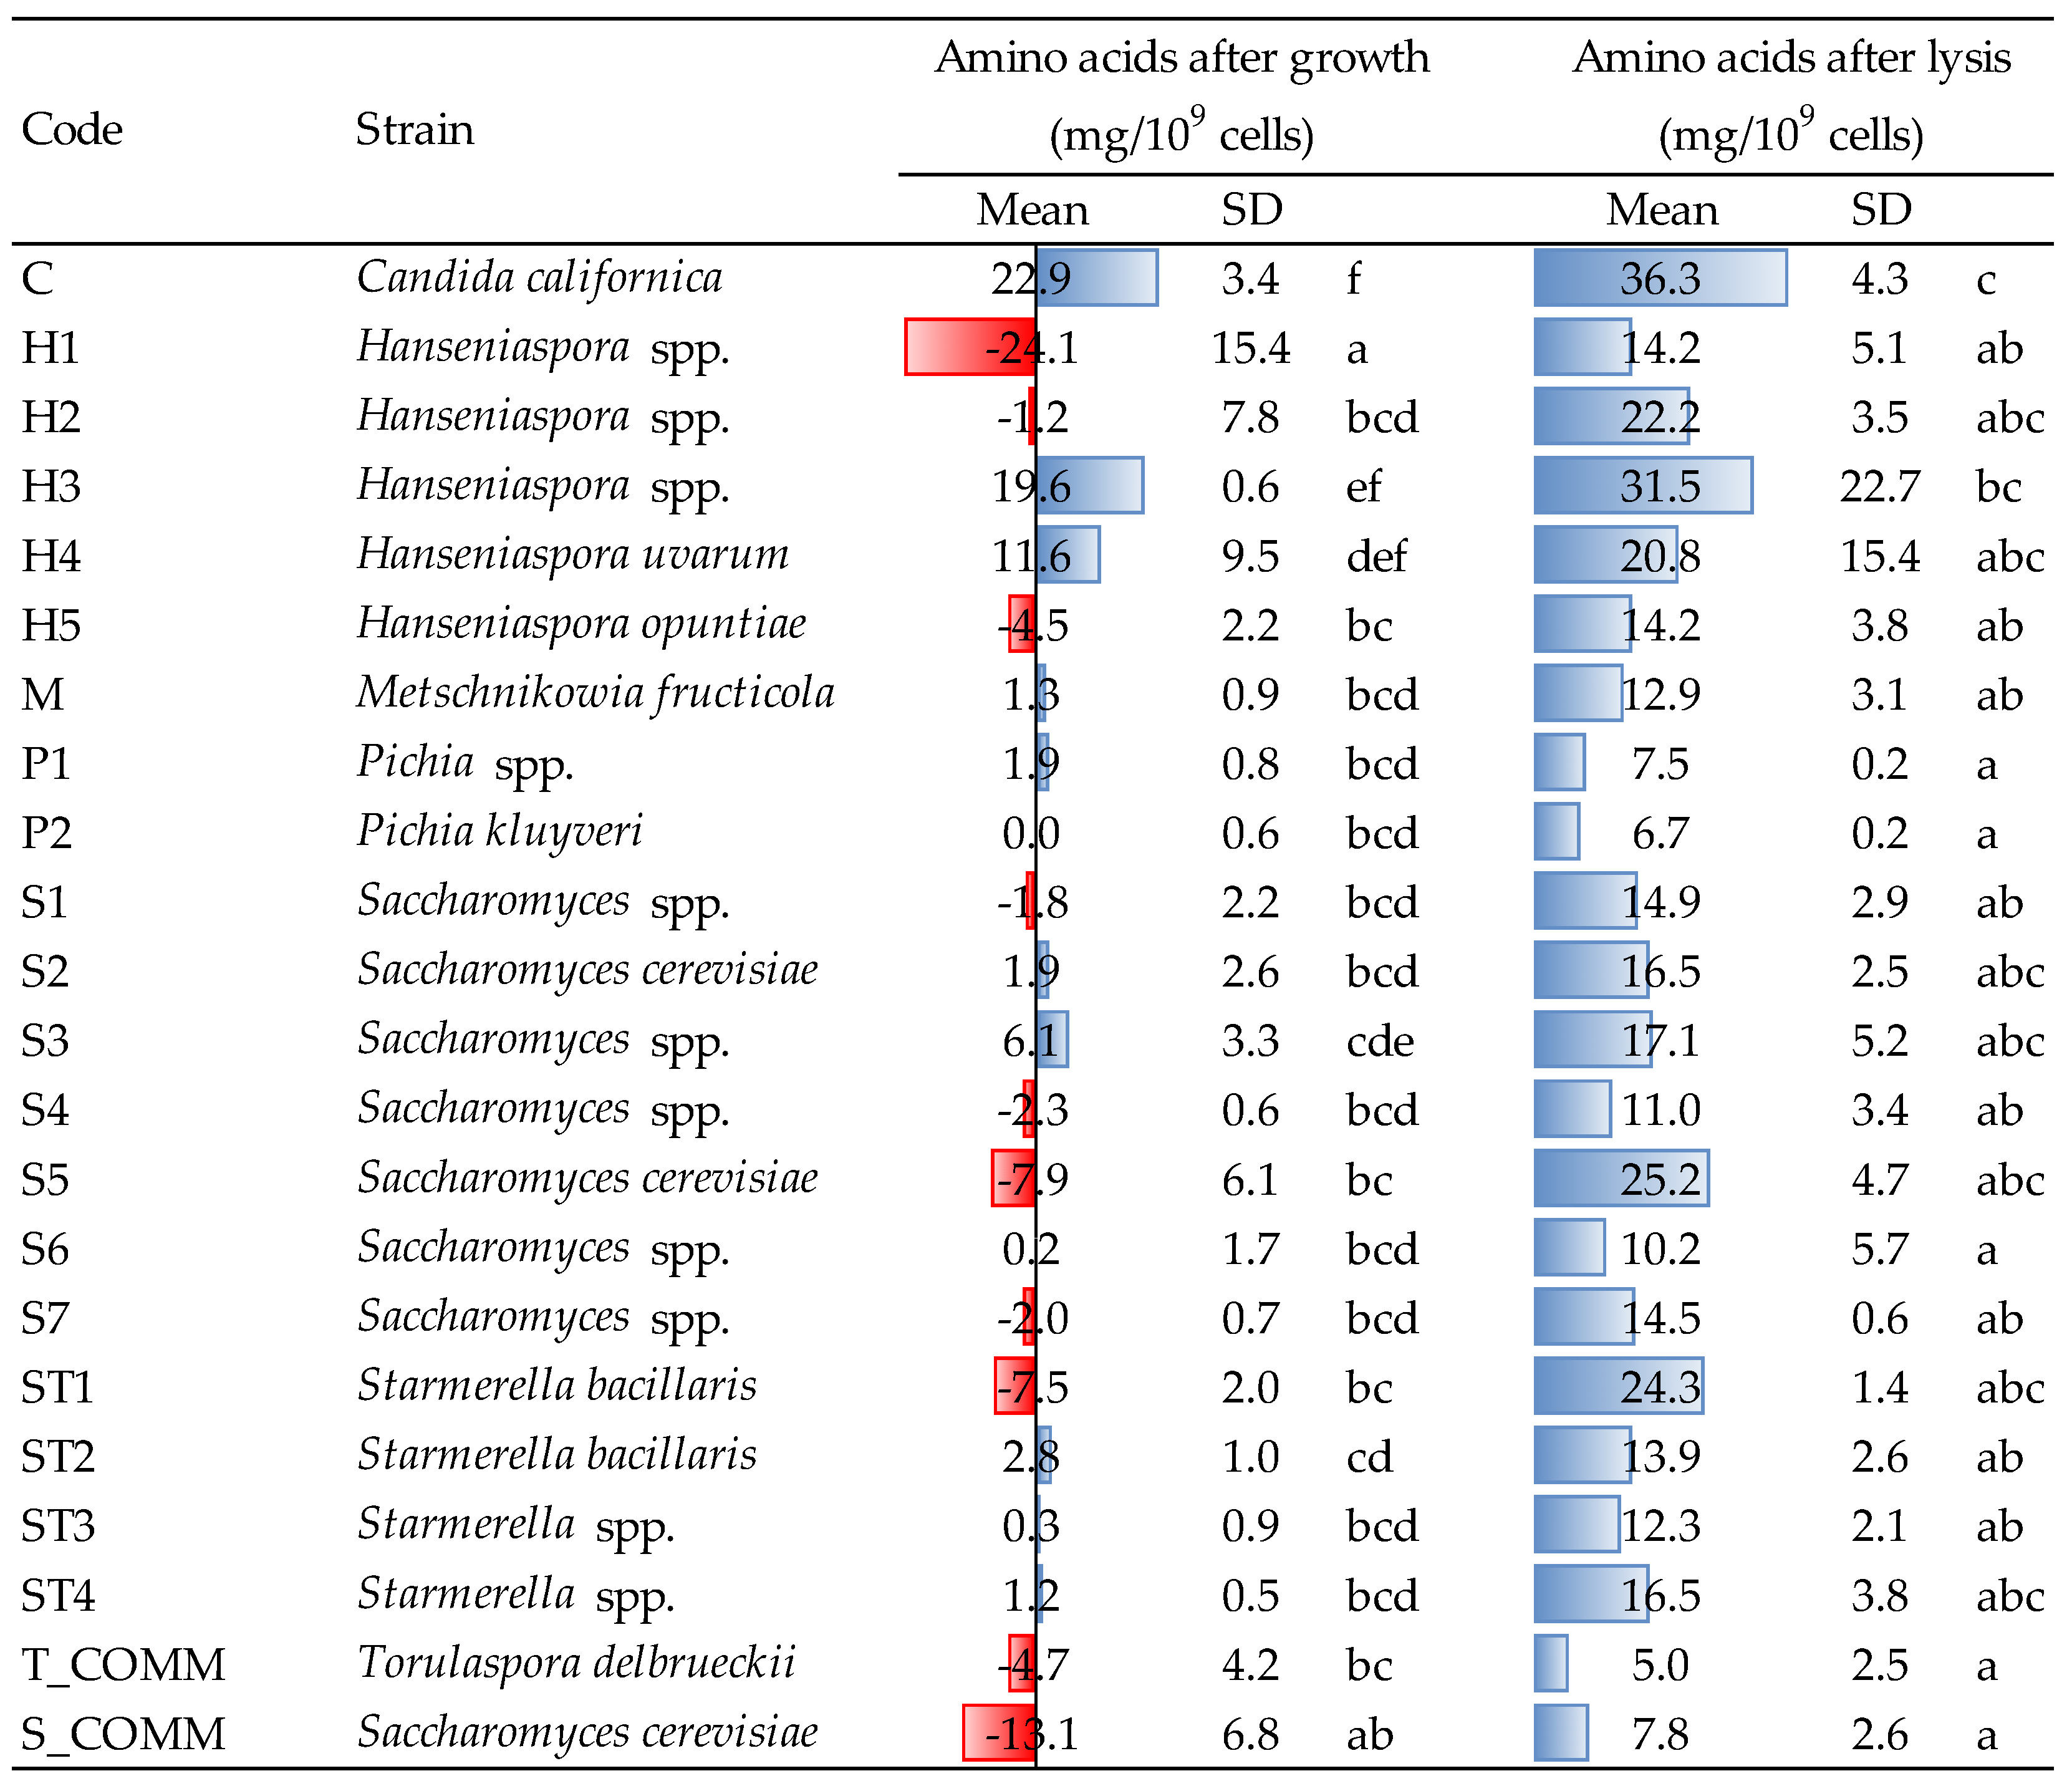
The amounts of amino acids (AA) released by yeast strains after growth and β-glucanase-assisted cell lysis are reported in
Figure 3. Concerning the growing phase, different trends were observed, both when comparing the various yeasts, and within the same genus.
Saccharomyces spp. appeared to be predominantly a consumer of amino nitrogen during growth and only in a few cases it released small amounts of AA (1.9–6.1 mg/10
9 cells for strains S2 and S3).
Candida californica (strain C) was revealed to be the major producer, with an average concentration after growth of approx. 23 mg/10
9 cells, followed by the two
Hanseniaspora H3 and H4 (with 19.6 and 11.6 mg/10
9 cells, respectively). Both the commercial ADY,
S. cerevisiae and
T. delbrueckii, contrary, showed the tendency to consume amino nitrogen (−13.1 and −4.7 mg/10
9 cells, respectively). Within
Hanseniaspora spp., relevant differences were observed also intra-genus: for instance, H3 and H4 significantly differed from the three other strains (H1, H2 and H5) that, in opposition, showed a variable capacity to consume AA, in a range of −1.2 to −24.1 mg /10
9 cells. Finally,
Pichia spp.,
Metschnikowia spp. and almost all
Starmerella strains showed just a minor release of amino nitrogen, with very few significant differences compared to the commercial yeasts used as reference.
As expected, after β-glucanase treatment, the liberation of amino acids increased. The lowest value was observed for commercial T. delbrueckii (5.0 mg/109 cells), while the greatest release was detected for Candida (strain C, 36.3 mg/109 cells). The latter, together with Hanseniaspora H3, was the strain characterized by the greatest production of AA, both after growth and lysis. It is interesting to observe that certain strains, which during growth released low amounts of amino acids (e.g., ST3, ST4 and S2) or even tended to slightly consume them (e.g., S5 and ST1), showed anyhow a non-negligible capacity to liberate amino nitrogen after lysis.
The different behavior towards nitrogen metabolism of the strains evaluated in the present study (release or consumption of amino acids in
Figure 3), might be linked to the different utilization and preference towards nitrogen sources observed by some authors [
7,
27]. Similarly, the major release of amino acids after enzymatic lysis observed for some strains, particularly
Hanseniaspora spp., could be due to the higher susceptibility of yeast cell walls towards enzyme attack or to the faster and earlier development of the autolytic process in such yeasts; the latter hypothesis may also find a confirmation in the observations that Del Fresno et al. made during wine aging on lees [
30].
Amino acid content is an important indicator, to be considered depending on the final utilization of the various strains in winemaking conditions: the ability to produce relevant amounts of amino nitrogen (for NSY) could be a useful feature for their use in sequential or mixed fermentation or for the production of autolyzed alcoholic and malolactic fermentation enhancers (e.g., yeast autolysates); contrary, too high level of amino acids could lead to microbial instability during wine aging on lees, especially in presence of low amounts of sulfur dioxide.
3.5. Release of Antioxidant Molecules after Growth and Lysis Treatment
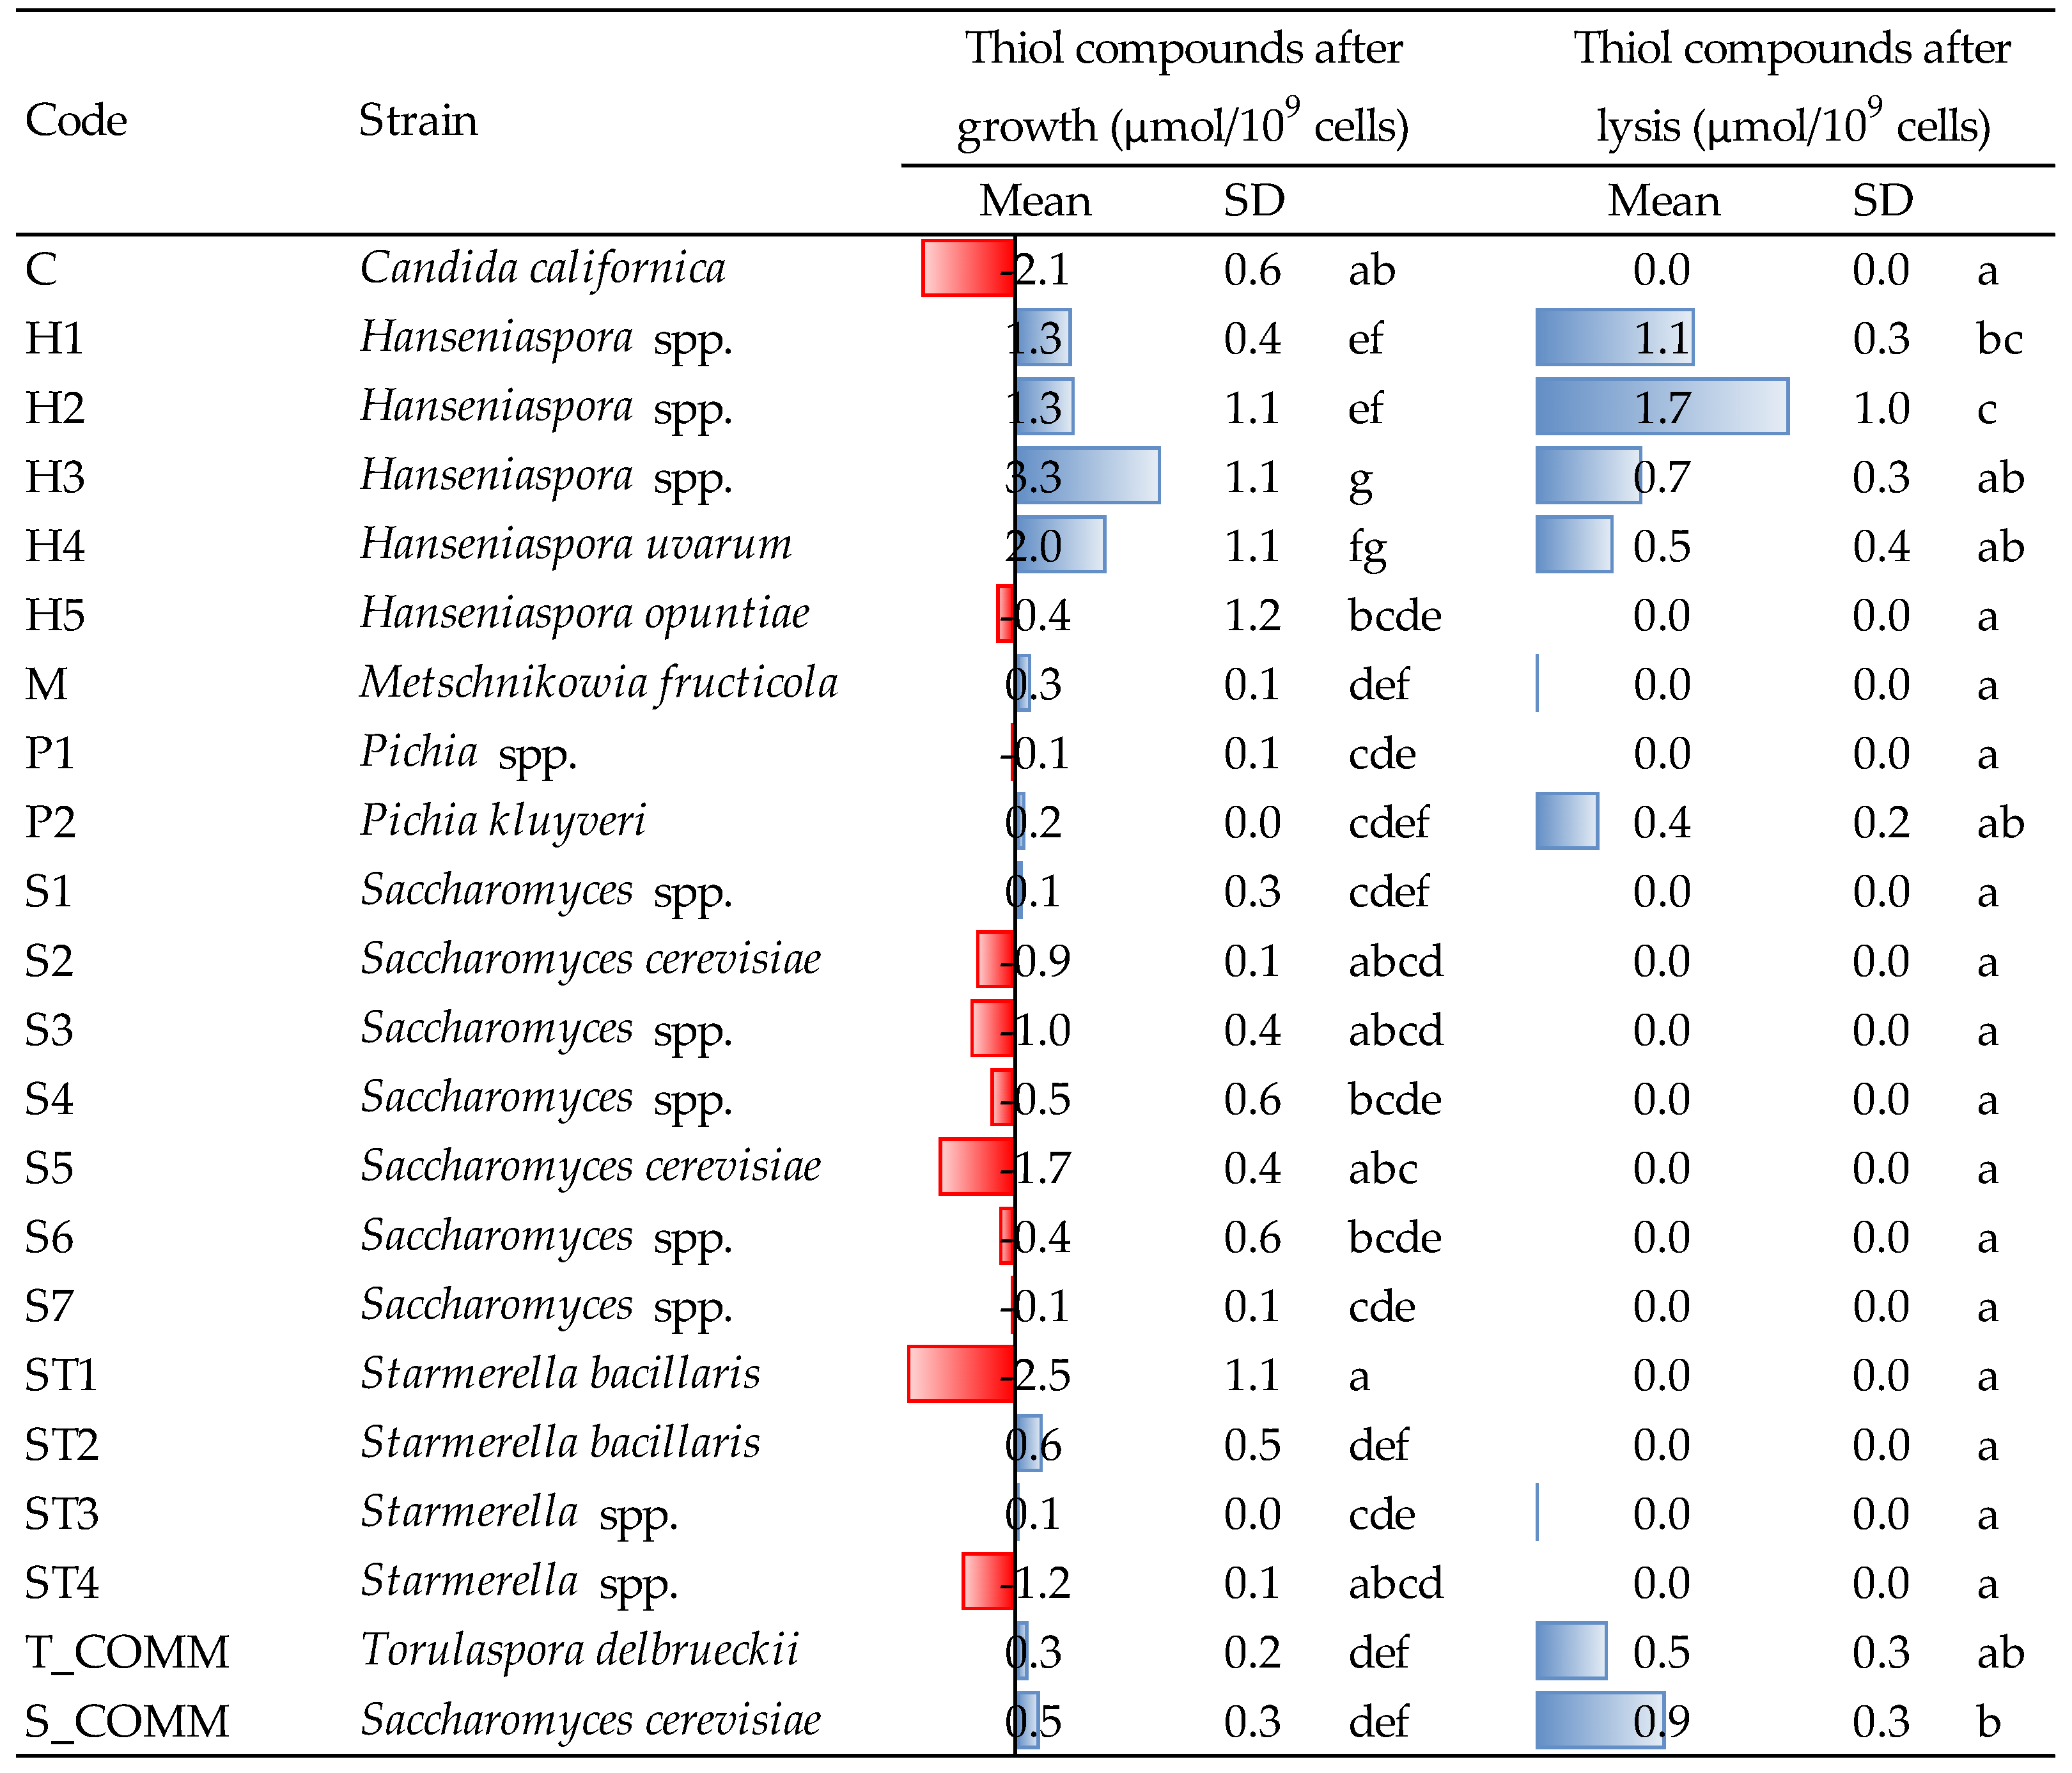
In the present study, the release of GSH and thiol molecules were determined on yeast suspensions after growth and autolysis induced by β-glucanase treatment; results are reported in
Figure 4 and
Figure 5.
Regarding thiols (
Figure 4), the greatest producers of such molecules during growth were the strains of the genus
Hanseniaspora, in particular H3, whose production (3.3 μmol/10
9 cells) was statistically higher than that of most other yeasts. H4 was the second strain in terms of capacity to release thiols during growth, with an amount of 2.0 μmol/10
9 cells. All the other yeasts produced concentrations ranging from 0.1 to 0.6 μmol/10
9 cells, even if, many of them (especially
Saccharomyces,
Candida and
Starmerella ST1 and ST4) showed the tendency to consume thiols—presumably glutathione and cysteine—in the growing conditions of the experiment. For
Saccharomyces and
Starmerella, this trend was confirmed by a non-negligible capacity to consume GSH during growth, while strains H1 and H2 were confirmed to also be major GSH producers, even if without statistical relevance (
Figure 5).
Hanseniaspora spp. was the greatest thiol producer even after cell lysis: strains H1 and H2, in particular, showed the highest concentration of thiol compounds, with an amount of 1.1 and 1.7 μmol/10
9 cells, respectively, being the latter significantly different from all the other yeasts (
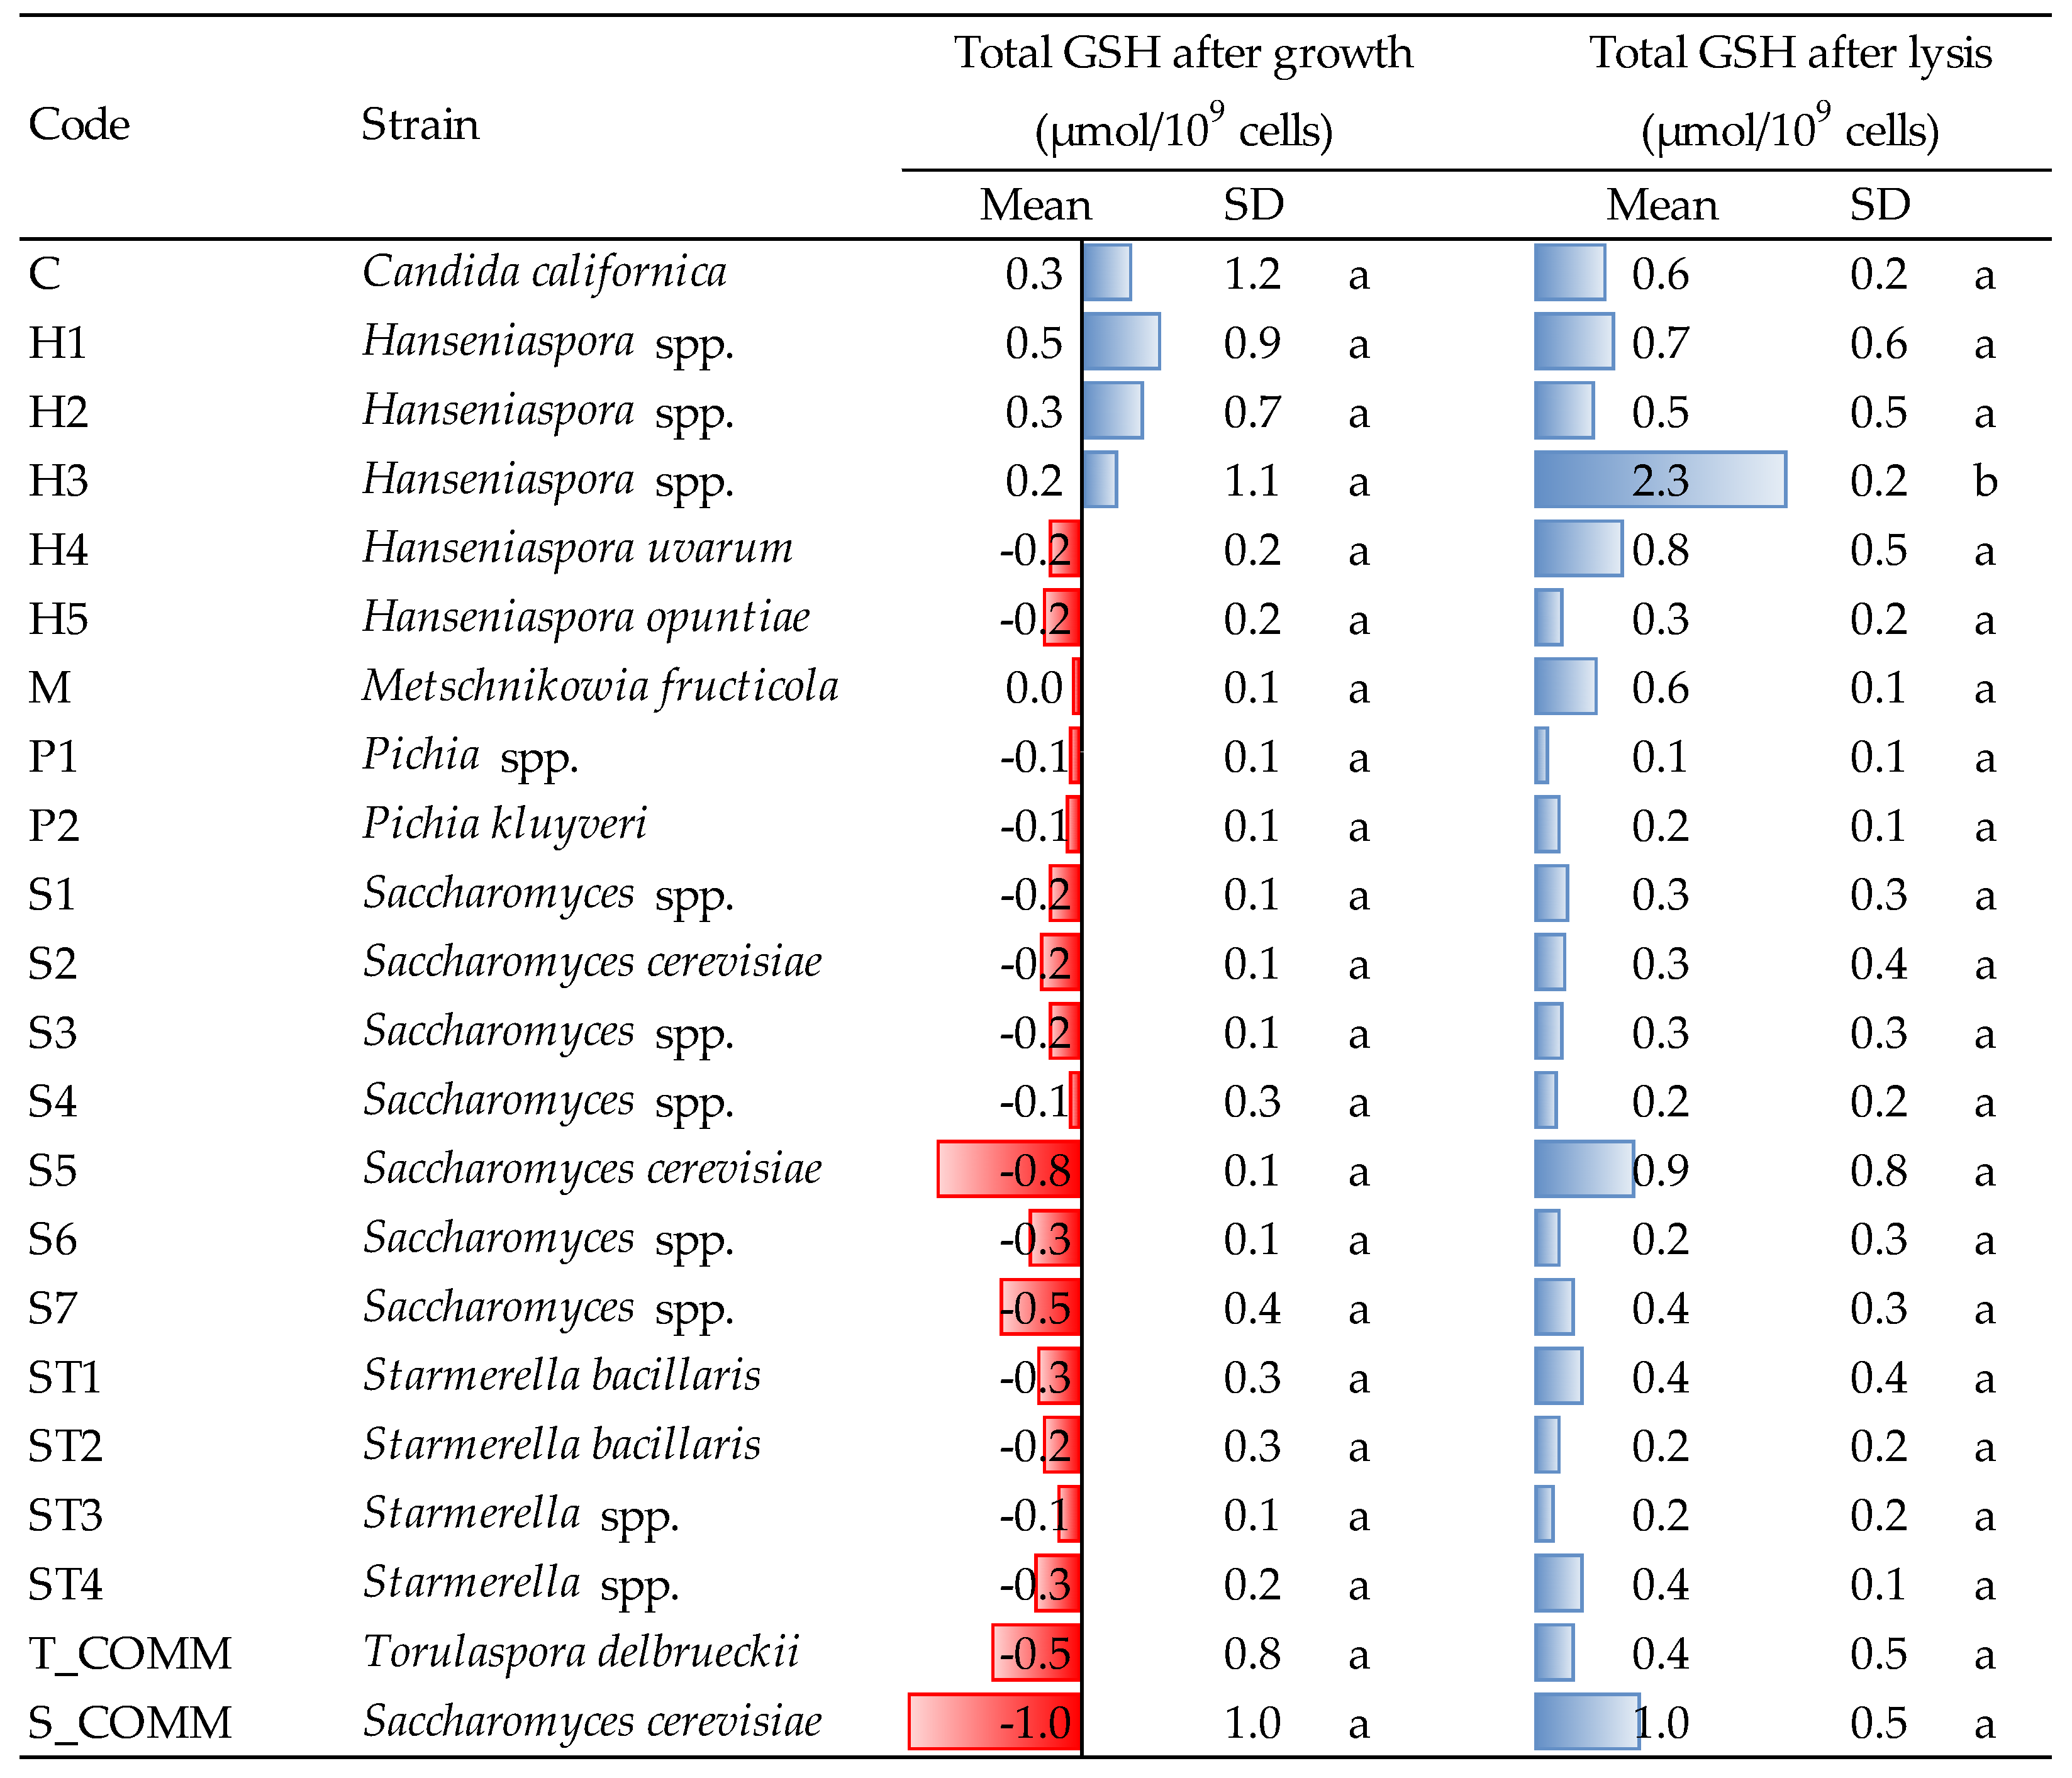
Figure 4). Moreover, GSH was also released in the highest amounts after cell lysis of
Hanseniaspora yeasts (
Figure 5). In fact, even if a more or less intense liberation of intracellular GSH was observed after lysis for all the strains tested, H3 was the greatest GSH producer (2.3 μmol/10
9 cells), differing significantly from all the others. Thus, averagely,
Hanseniaspora spp. was the genus with the highest capacity to produce antioxidant molecules within the strains under evaluation.
It is well known that yeasts produce various antioxidant compounds, such as glutathione and other thiols [
17,
31]. The capacity to release antioxidants is an interesting feature for wine yeasts, but up to now, it was mainly investigated in
S. cerevisiae, poorly considering NSY. Lemos Junior and co-workers [
19] observed that some strains of
Lachancea thermotolerans,
Starmerella bacillaris and
Metschnikowia spp. were able to produce good levels of GSH during growth under aerobic conditions and the release was higher at the end of the exponential phase. They also described how yeast strains, medium composition (synthetic or grape must) and fermentation conditions (single or sequential fermentation with
S. cerevisiae) may influence the content of intracellular GSH. Finally, in another study carried out by the same research group, it was noticed that the use of NSY in sequential fermentation led to an increase of the GSH released into the wine, in comparison to the control samples fermented only with
S. cerevisiae [
32].
It is interesting to note that, comparing the values detected for thiol compounds with those obtained for glutathione, the ability of some strains to release GSH does not always correspond to a comparable production of thiols (e.g., strain C or H4). This might be connected to different factors. First, the enzymatic method used for evaluating GSH [
24] determines total GSH, i.e., both reduced (GSH) and oxidized (GSSG), but only the former is detectable as a thiol by reaction with DTDP. Second, besides GSH, yeasts are able to produce also other thiol molecules, such as cysteine and certain cysteine-containing proteins [
31]. In agreement with these considerations, all strains were able to release GSH, including those that did not liberate thiols after lysis.
4. Conclusions
Within the NSY evaluated in this study, Hanseniaspora spp. showed a good aptitude to produce and release polysaccharides, amino acids and antioxidant compounds during growth and autolysis, with a production of biomass and cell viability comparable with those of the commercial ADYs used as reference. Further investigations are needed in order to assess this ability under winemaking conditions, both during fermentation and aging on lees.
The present study, further contributes to elucidating the role that NSY strains may play during wine production and aging. Indeed, fermentation lees contain a non-negligible amount of NSY cells (both viable and not) and, if sulfur dioxide is not used before alcoholic fermentation, their overall concentration may be close to that of
Saccharomyces yeasts [
33]. The capacity of NSY to improve wine quality, when used as starters in mixed or sequential fermentation is well known; however, the relevant content of GSH and thiol molecules detected for some of these strains may represent an interesting tool to improve and enhance the protection of wine against oxidation, not only at the end of alcoholic fermentation, but also during wine aging.


