Article

Optimized Operating Conditions for a Biological Treatment Process of Industrial Residual Process Brine Using a Halophilic Mixed Culture

1
Institute for Chemical, Environmental and Bioscience Engineering, TU Wien, Gumpendorfer Straße 1a, 1060 Vienna, Austria
2
Competence Center CHASE GmbH, Altenbergerstraße 69, 4040 Linz, Austria
*
Author to whom correspondence should be addressed.
Fermentation 2022, 8(6), 246; https://doi.org/10.3390/fermentation8060246
Submission received: 29 April 2022 / Revised: 16 May 2022 / Accepted: 22 May 2022 / Published: 25 May 2022
(This article belongs to the Special Issue Process Intensification in Microbial Biotechnology)

Abstract

:
Residual process brine is a sustainable raw material for chlor-alkali electrolysis processes. This study investigates the influence of critical process parameters on the performance of a continuous treatment process for residual process brine using halophilic microorganisms. The goal of the bioprocess is an efficient degradation of the organic impurities formate, aniline, phenol, and 4,4′-methylenedianline from this residual stream. It was shown that formate could be degraded with high efficiencies (89–98%) during the treatment process. It was observed that formate degradation was influenced by the co-substrate glycerol. The lowest residual formate concentrations were achieved with specific glycerol uptake rates of 8.0–16.0 × 10⁻³ g L−1 h−1 OD600−1. Moreover, a triple-nutrient limitation for glycerol, ammonium, and phosphate was successfully applied for continuous cultivations. Furthermore, it was shown that all aromatic impurities were degraded with an efficiency of 100%. Ultimately, this study proposed optimized operating conditions, allowing the efficient degradation of organics in the residual process brine under various process conditions. Future optimization steps will require a strategy to prevent the accumulation of potential intermediate degradation products formed at high aniline feed concentrations and increase the liquid dilution rates of the system to achieve a higher throughput of brines.

1. Introduction

The chlor-alkali industry uses brines for the electrolytic production of chlorine gas, sodium hydroxide, and hydrogen [1,2,3]. The products sodium hydroxide and chlorine gas are especially widely used in various industries [1,4]. Membrane cell technology is seen as the best available technology among chlor-alkali electrolysis processes [2,4]. Brines comprise the raw material for the membrane cell process and can be derived from seawater desalination plants or industrial production chains [5,6]. However, there are high quality requirements for brines used as a raw material in membrane cell processes to ensure an efficient process [4]. For instance, organic contaminations in brines negatively affect chlor-alkali membrane process performance [7,8,9,10]. Moreover, inorganic impurities such as Mg2+, Ca2+, or nitrogen can also decrease the membrane cell process [7,10,11]. Thus, a pre-treatment of industrial result process brines (RPB) is necessary. So far, biological treatment processes are seen as a cost-effective alternative for residual water treatment, compared to physical or chemical treatment approaches [12]. Moreover, several studies have already shown the applicability of halophilic bioprocesses for saline residual water treatment [13,14,15,16,17,18,19].
In this study, a biological process for the treatment of an RPB is characterized for its integration into an industrial production chain. The RPB is derived from the industrial production process of 4,4′-methylenedianiline (MDA), which serves as a substrate in the production of methylene diphenyl diisocyanate (MDI) and, ultimately, of polyurethanes [20,21,22]. After the separation of the organic phase containing the product MDA and the aqueous phase, the RPB comprises four organic impurities (formate, aniline, phenol, and MDA) and high concentrations of sodium chloride (10–15%) [23,24,25]. Thus, the organic matter present in the RPB has to be removed if the RPB is reused as raw material for a membrane cell CAE process. As previously reported, RPB from industrial MDA-production can be successfully treated with a continuous retentostat bioprocess using halophilic microorganisms [13,16].
During the production of MDA, process conditions might be varied, which ultimately leads to changes in organic impurity concentrations between different RPB batches. However, the effects of such changes in the raw material attributes (RMA), such as the organic impurity concentrations on the degradation efficiency of the investigated biological treatment process, are not known. Still, the degradation efficiency of organic contaminants is one major process performance variable, if the RPB shall serve as a raw material for a chlor-alkali-electrolysis step. Besides RMA, other critical process parameters such as bioprocessing parameters (dilution rate, retention rate, or biomass concentration) and media components (different nutrient concentrations) might also influence the process performance.
Therefore, the goal of this study is to determine the effect of critical process parameters on the process performance of a halophilic biological process for the treatment of an industrial RPB. This process understanding shall be used to propose optimized operating conditions where process parameters should be controlled in a way in which high process performance is achieved. Moreover, the industrial integration of bioprocesses requires cost-effective processing. Thus, this study is aimed at the reduction of operational costs, achieved by reducing media supplementation but maintaining high degradation efficiencies at the same time.
To do so, critical process parameters were identified and their influence on the process performance was investigated. In that way, the question should be answered of whether process performance variables need to be known before the bioprocess step, or if it is sufficient to set process parameters within the control space, to obtain sufficient degradation performance. To that end, a total of three continuous cultivation experiments were performed and analyzed. It was shown, for the first time in a biological RPB treatment process, that the degradation of the main organic contaminant formate is dependent on the specific uptake rate of the co-substrate glycerol and the consumption yield of ammonium to glycerol. Thus, pre-defined settings for the glycerol uptake rate keep formate degradation high, even at large concentration changes in the RPB. Moreover, for the first time, this study showed the successful application of a triple-nutrient limitation (carbon, nitrogen, and phosphorus source) in a continuous bioprocess.

2. Materials and Methods

2.1. Strain and Medium

The microbial culture used in this study was a novel halophilic mixed culture first found in a biological MDA residual water treatment process [16]. The culture mainly consists of strains from the three halophilic genera Halomonas and Aliifodinibius, and a small part of Oceanobacillus strains.
The RPB was supplemented with mineral salts and contained (g L−1): FeCl3 0.005; MgCl2 ·6 H2O 1.3; MgSO4 7 H2O 1.1; CaCl2 2 H2O 0.55; KCl 1.66; Trace elements solution 1 mL [(g L−1): FeSO4 7 H2O 1.39; CuSO4 5 H2O 1.0; CoCl2 2 H2O 0.62; ZnSO4 7 H2O 0.86; Manganese stock 1 mL [(g L−1): and MnCl2 ·4 H2O 0.18. However, concentrations of MgCl2 6 H2O, MgSO4 7 H2O, and CaCl2 2 H2O were altered as indicated. The pH value of the RPB medium was adjusted to pH 4, using 37% HCl.
The substrate glycerol was added in concentrations of 0.3–4.0 g L−1, as indicated. As a nitrogen source, ammonium chloride (NH4Cl) was added in concentrations of 0.1–1 g L−1. As the phosphorus source, potassium dihydrogen phosphate (KH2PO4) was used in concentrations of 0.05–0.15 g L−1. The macronutrients, consisting of carbon, nitrogen, and phosphorus sources were either added to the RPB or combined in a separate supplement feed, as indicated. To the supplement feed, NaCl in a concentration of 100 g L−1 (10%) was added and the pH was adjusted to 7. Shake-flask experiments were performed in 500 mL shake flasks filled with 100 mL medium additionally supplemented with 20 g L−1 MOPS, 5 g L−1 glycerol, 1 g L−1 NH4Cl, and 0.15 g L−1 KH2PO4.

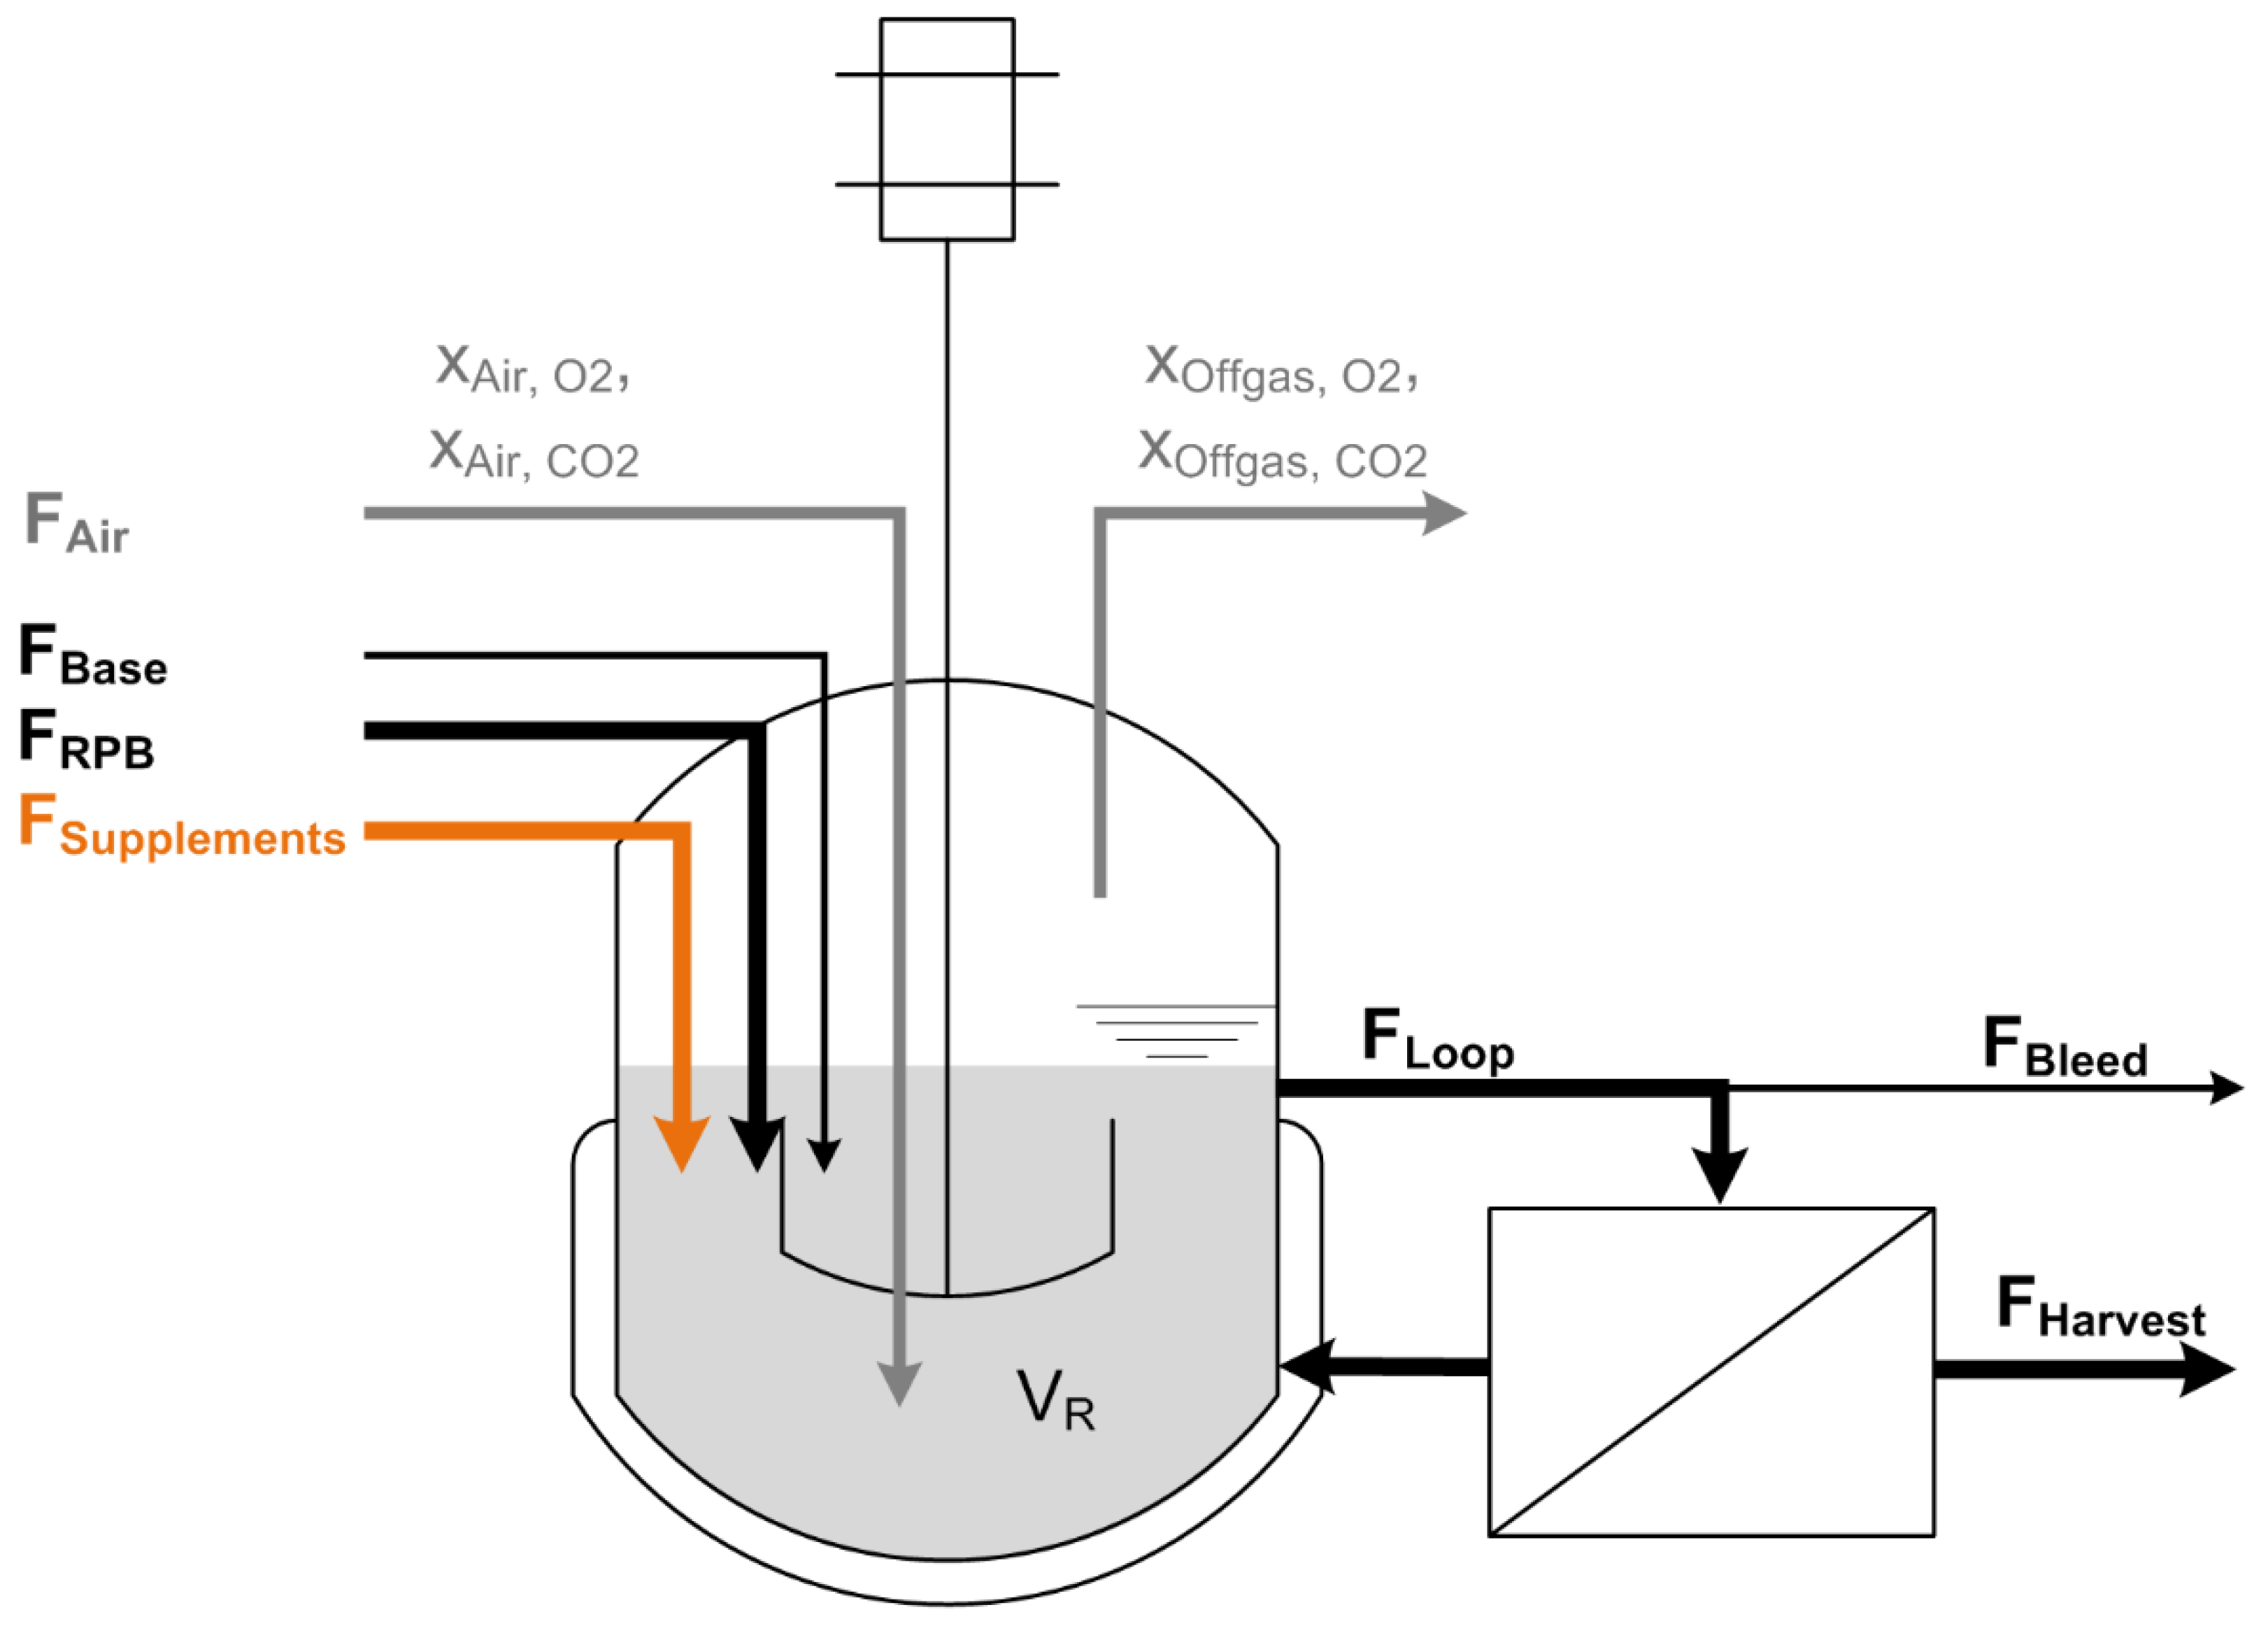
2.2. Bioreactor Setup—Continuous Stirred-Tank Reactor

A schematic diagram of the experimental setup is shown in Figure 1. Continuous cultivations with cell retention were performed in a corrosion-resistant stirred tank reactor with a working volume of 2.3 L (PEEK Labfors bioreactor, Infors, Bottmingen, Switzerland), equipped with a 420 cm2 microfiltration unit (model: CFP-2-E-4A, polysulfone membrane, 0.2 µm pore size, GE Healthcare, Chicago, IL, USA), as described previously [13]. Peristaltic pumps were used for circulating cell broth in the loop line (Ecoline, Ismatec, Wertheim, Germany), for the addition of feed (industrial residual brine) and base (peristaltic pump installed at the Infors bioreactor tower), as well as for bleed and harvest withdrawal (Lambda Preciflow, Lambda Instruments, Switzerland). The dilution rate D was kept constant at 0.1 h−1 for all experiments. The pH was measured using an Easyferm probe (Hamilton, Bondaduz, Switzerland) and adjusted using 0.5 M NaOH via the integrated dosing system of the Labfors system. The reactor volume was kept constant at 1 ± 0.05 L. The reactor volume, feed (industrial residual brine), and base consumption were continuously monitored using laboratory scales with 0.1 g resolution (Mettler Toledo, Columbus, OH, USA).
This setup was altered for one continuous fermentation experiment, two separated feeds were used. One feed contained industrial residual brine containing organic contamination and micronutrients. The flow for the residual brine was set to 90 mL min−1. The pH of the residual water feed was adjusted to values around 4, using hydrochloric acid. The second feed contained the carbon, nitrogen, and phosphorus source. The salt content of the second feed was adjusted to 10% NaCl and the pH was 7. The second feed was pumped by the feed pump installed at the Infors bioreactor tower (peristaltic pump) and the flow was set to 10 mL min−1. This resulted in a combined feed flow of 100 mL min−1, leading to a D of 0.1 h−1.
The inlet airflow was kept constant at 100 mL min−1 using a mass flow controller (Brooks Instrument, Hatfield, PA, USA). Dissolved oxygen was measured using an Oxyferm probe (Hamilton, Switzerland) and kept above 20% to maintain aerobic conditions in the reactor. Oxygen transfer was adjusted through variation of stirrer speed between 400 and 560 rpm. The off-gas composition was determined using a BlueSens gas analyzer system (BCP O2 and CO2, BlueSens, Herten, Germany). To reduce the water content, the off-gas passed a countercurrent condenser before entering the gas analyzer system. Online data-monitoring and process control were executed using a process information management system (Lucullus, SecureCell, Switzerland).

2.3. Calculations

All calculations in this study were performed using Matlab R2019b (Mathworks, Natick, MA, USA).

2.3.1. Steady-State Cultivation

Continuous cultivation experiments were performed, and steady-state conditions were assumed, as each experimental setpoint was performed for at least 96 h. During the experiments, the substrate glycerol was completely consumed; thus, changes in concentrations in the bioreactor were zero over time according to:
d c i d t = 0 ,
Hence, the specific substrate uptake rate for glycerol under steady-state conditions was calculated using Equation (2):
q S = D ( c i , F e e d c i , H a r v e s t ) / O D 600 ,
where i indicates substrate components. D denotes for the liquid dilution rate and is calculated based on Equation (3):
D = F R P B + F S u p p l e m e n t s + F B a s e V R = F F e e d V R = 1 H R T ,
R = F H a r v e s t F F e e d ,
µ = ( 1 R ) D ,
where FFeed is the sum of input flows FRPB, FSupplements, and FBase; FRPB is the RPB feed flow rate; FSupplements is the supplement feed flow; FBase is the flow of the base; and VR is the bioreactor volume. The dilution rate D can also be denoted as the reciprocal value of The Hydraulic Residence Time (HRT). The retention rate R is calculated based on flows of the RPB feed FFeed and the cell-free harvest FHarvest. Once steady-state conditions are reached, the growth rate µ of the microbial system can be calculated based on the retention rate R and the dilution rate D (Equation (5)).

2.3.2. Multiple Linear Regression

For the investigation of effects of one or more predictor variables on one outcome (target variable) a multiple linear regression (MLR) model can be used [26,27]. The relation between the outcome Y and the predictor variables Xk (k = 1,2,…,p–1) is described in Equation (6):
y i = β 0 + β 1 x 1 + β 2 x 2 + + β p 1 x p 1 + ε i ,
where βk (k = 1, 2, …, p – 1) represents the regression coefficients to the representing predictor variables. To estimate the coefficients, the least squares criterion is applied where βk is chosen to minimize the sum of squared errors of the observed Y and the fitted model y ^ :
i = 1 n ( y i ^ ( β 0 + β 1 x 1 + β 2 x 2 + + β p 1 x p 1 + ε i ) ) 2 ,
To test if regression coefficients and the regression model are significant, several statistical tests can be evaluated. The hypothesis H0 that the regression coefficients βk (k = 1, 2, …, p – 1) are equal to zero is verified if the corresponding p-value is above 0.05 and the F-value is larger than the reference statistic:
p > 0.05 ,
F > F 1 α ( k , n p ) ,
where α is the significance interval (in this case, 0.05), p is the number of regression parameters, and n is the number of samples. During this study, two different predictor variables were tested: the consumption yield of ammonium, and phosphate per consumed glycerol (YNH4+/glycerol and YPO43-/glycerol) in mmol mmol−1. The chosen predictor variables were not correlated. As response variables, the residual formate concentration, and the residual amount of US2 were used. Linear regression was performed using the Matlab function regress.

2.4. Analytical Procedures

2.4.1. HPLC Analysis

Substrate quantification for glycerol and formate in the feed and harvest samples was conducted as described previously [28], using HPLC (Vanquish UHPLC systems, Thermo-Fisher, Waltham, MA, USA) with an Aminex HPX-87H column (Bio-Rad, Hercules, CA, USA) at 60 °C and an isocratic eluent of 4 mM sulfuric acid in Milli-Q water with a flow of 0.6 mL min−1, followed by UV detection at 210 nm and RI detection (ERC RefractoMax 520, Thermo Scientific, Waltham, MA, USA). In short, samples and calibration standards were prepared by mixing 450 μL cell-free supernatant with 50 μL of 40 mM H2SO4. For analysis, a 10 μL sample was injected to the column and 5-point calibration curves were used for quantification. The samples were analyzed for residual formate and glycerol, as well as the formation of organic acids. The standards, used for quantifications were prepared in the same way as the samples and diluted with 40 mM sulfuric acid [16].
The quantification of aromatic compounds in feed and harvest samples was performed using a reversed-phase HPLC measurement method (Vanquish UHPLC systems, Thermo-Fisher, Waltham, MA, USA) with an AcclaimTM PolarAdvantage column (Thermo Scientific, USA, C16, 3 µm, 120 Å, 4.6 × 150 mm) at 30 °C [13,16]. Aromatic compounds were detected using a UV detector at 210 nm. The flow was 0.6 mL min−1 and a gradient system was used: 0–5 min: 5% A, 95% B; 5–10 min: 25% A, 75% B; 10–33 min: linear increase of A from 25% to 70%, rest B; 33–35 min: 70%A, 30%B; 35–40 min: linear decrease of A from 70% to 5%, rest B; 40–45 min: 5% A, 95% B. The eluents were: (A) acetonitrile and (B) Milli-Q water. The samples were centrifuged before analysis and 10 µL undiluted supernatant was injected for HPLC analysis. The quantification of aromatic compounds in feed and harvest samples for cultivation experiment 1 was performed as described previously [16].

2.4.2. Media Composition Analysis

The determination of ammonium and phosphate was conducted in a Cedex Bio HT Analyzer (Roche, Basel, Switzerland), where enzymatic assays were used and combined with photometric measurements. For these measurements, the limits of detection (LOD) of the analyzer were 0.238 mmol L−1 for ammonium and 0.1 mmol L−1 for phosphate.

2.4.3. Determination of the Chloride Ion Concentration

The determination of the chloride ion concentration in residual process brine samples was performed using the titration method as described previously (Fajans). The method is based on titration with AgNO3 and dichlorfluorescein (2%) as an indicator [29]. Together with chloride ions, silver ions form a poorly soluble precipitation of silver chloride:
Ag + + Cl AgCl
Before starting the titration, a AgNO3 solution was prepared and standardized with a NaCl solution of known concentration. According to the titration of this known NaCl solution, the AgNO3 solution had a concentration of 163.9 mmol L−1. The pH of the samples was adjusted to pH 7, either by adding hydrochloric acid or sodium hydroxide. To avoid precipitation of the silver chloride colloidal solution, 10 mL of chlorine-free dextrin solution (1%) was added to 2 mL of sample, resulting in a yellow color. Upon titration of the prepared sample with a AgNO3 solution, the color of the liquid sharply turned to pink at the equivalence point, indicating the end of the titration.

3. Results and Discussion

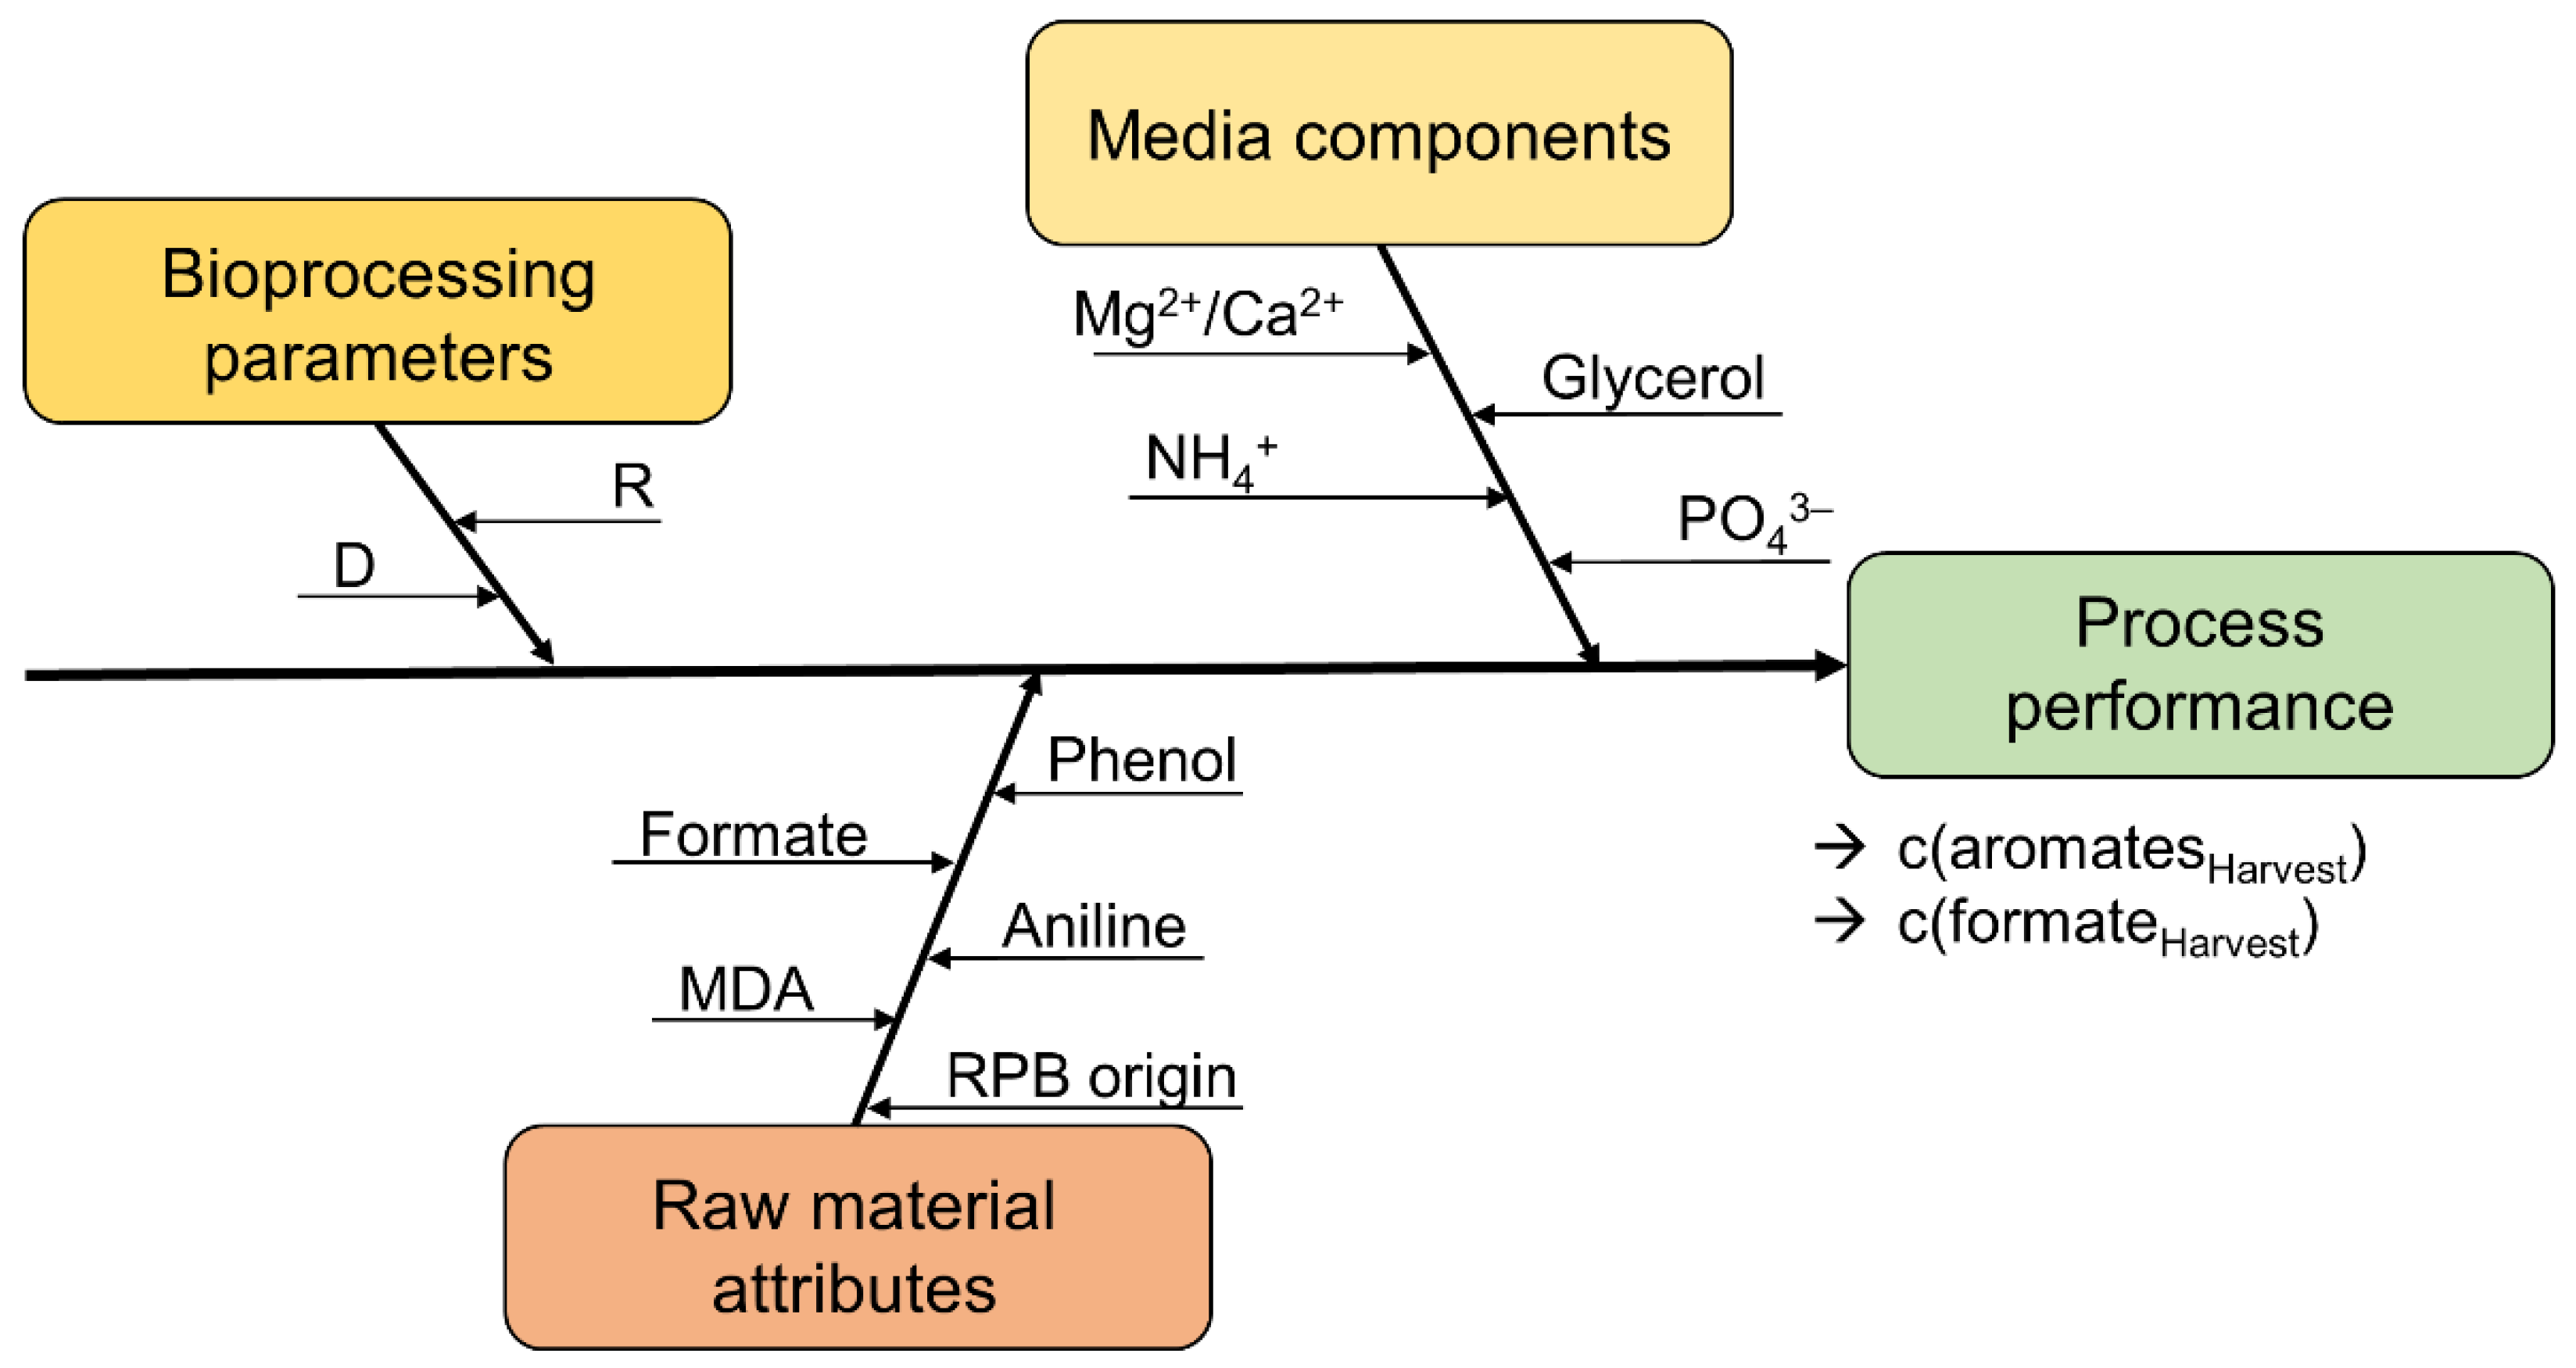
3.1. Definition of Process Performance Variables and Critical Process Parameters

The goal of this study was to propose optimized operating conditions, used for the control strategy of a biological treatment process to reduce organic impurities in an industrial RPB. To do so, potential factors which influence the degradation efficiency of bioprocesses have to be identified (see Figure 2). To measure the degradation efficiency of the four organic impurities in the biological treatment process, the following process performance variables were defined:
  • the residual aromatic concentration in the harvest c(aromatesHarvest) [mg L−1];
  • the residual formate concentration in the harvest c(formateHarvest) [g L−1];
As other process parameters might also influence the process efficiency, critical process parameters were defined and analyzed during this study (see Table 1):
  • Bioprocess parameters (dilution rate, retention rate, and the biomass concentration (indicated by the optical density));
  • Media components (glycerol, ammonium, phosphate, magnesium, and calcium feed concentrations);
  • Raw material attributes (RPB origin, formate, aniline, phenol, and 4,4′-MDA feed concentrations).
To investigate the influence of the critical process parameters on the process performance variables, three different continuous cultivation experiments were performed. In each cultivation experiment, different settings of critical process parameters were tested. For simplification the cultivation experiments are indicated as cultivation 1, 2 and 3 (Table 2).
During this study, continuous cultivation experiments were performed in a 16L pilot-scale bioreactor system (cultivation 1) and in a 1L lab-scale bioreactor system (cultivation 2 and 3). For the experiments, RPBs from three different MDA production sites were used and compared for their impact on the process performance of the biological treatment process. The RPB origins are numbered with RPB1, RPB2, and RPB3. Cultivation experiments 1 and 2 only used RBP1. For cultivation 3, RPBs from three different MDA production sites were used and compared (RPB1–3). Moreover, for cultivation 3, a two-feed system was applied, where feed 1 consisted of the RPB, and with feed 2, glycerol was supplied to decouple glycerol feeding from RPB feeding.

3.2. Influence of Critical Raw Material Attributes on Process Performance

3.2.1. RPB Origin

In previously performed shake-flask experiments, the potential effects of the RPB origin on the microbial growth rate and the degradation efficiency of organic impurities were investigated. Shake-flask experiments showed no differences in the specific growth rates and organic degradation efficiency for medium prepared from RPB1, 2, and 3 (data not shown). As previously reported, potential changes in the NaCl concentration in the RPB might occur and influence microbial growth rates [16]. Therefore, specific growth rates of the novel halophilic mixed culture at different NaCl concentrations were determined in shake flasks (Figure 3). The growth rates stayed constant at NaCl concentrations between 50 and 100 g L−1, whereas a decline in the growth rates was observed at NaCl contractions of 150 and 200 g L−1. Hence, NaCl concentrations for the different RPB origins were determined (RPB1: 100.1 ± 0.6 g L−1, RPB2: 83.0 ± 0.6 g L−1, RPB3: 82.9 ± 0.7 g L−1). In conclusion, the determined growth rates indicated that the halophilic mixed culture is suitable for growth in the RPB as the NaCl concentration was measured between 80 and 100 g L−1. NaCl concentrations higher than 100 g L−1 lower the growth rate to 0.04 h−1 at 200 g L−1. Furthermore, the results of the bioreactor cultivation experiments indicated no influence of the RPB origin on the degradation efficiency of formate or aromatic compounds.

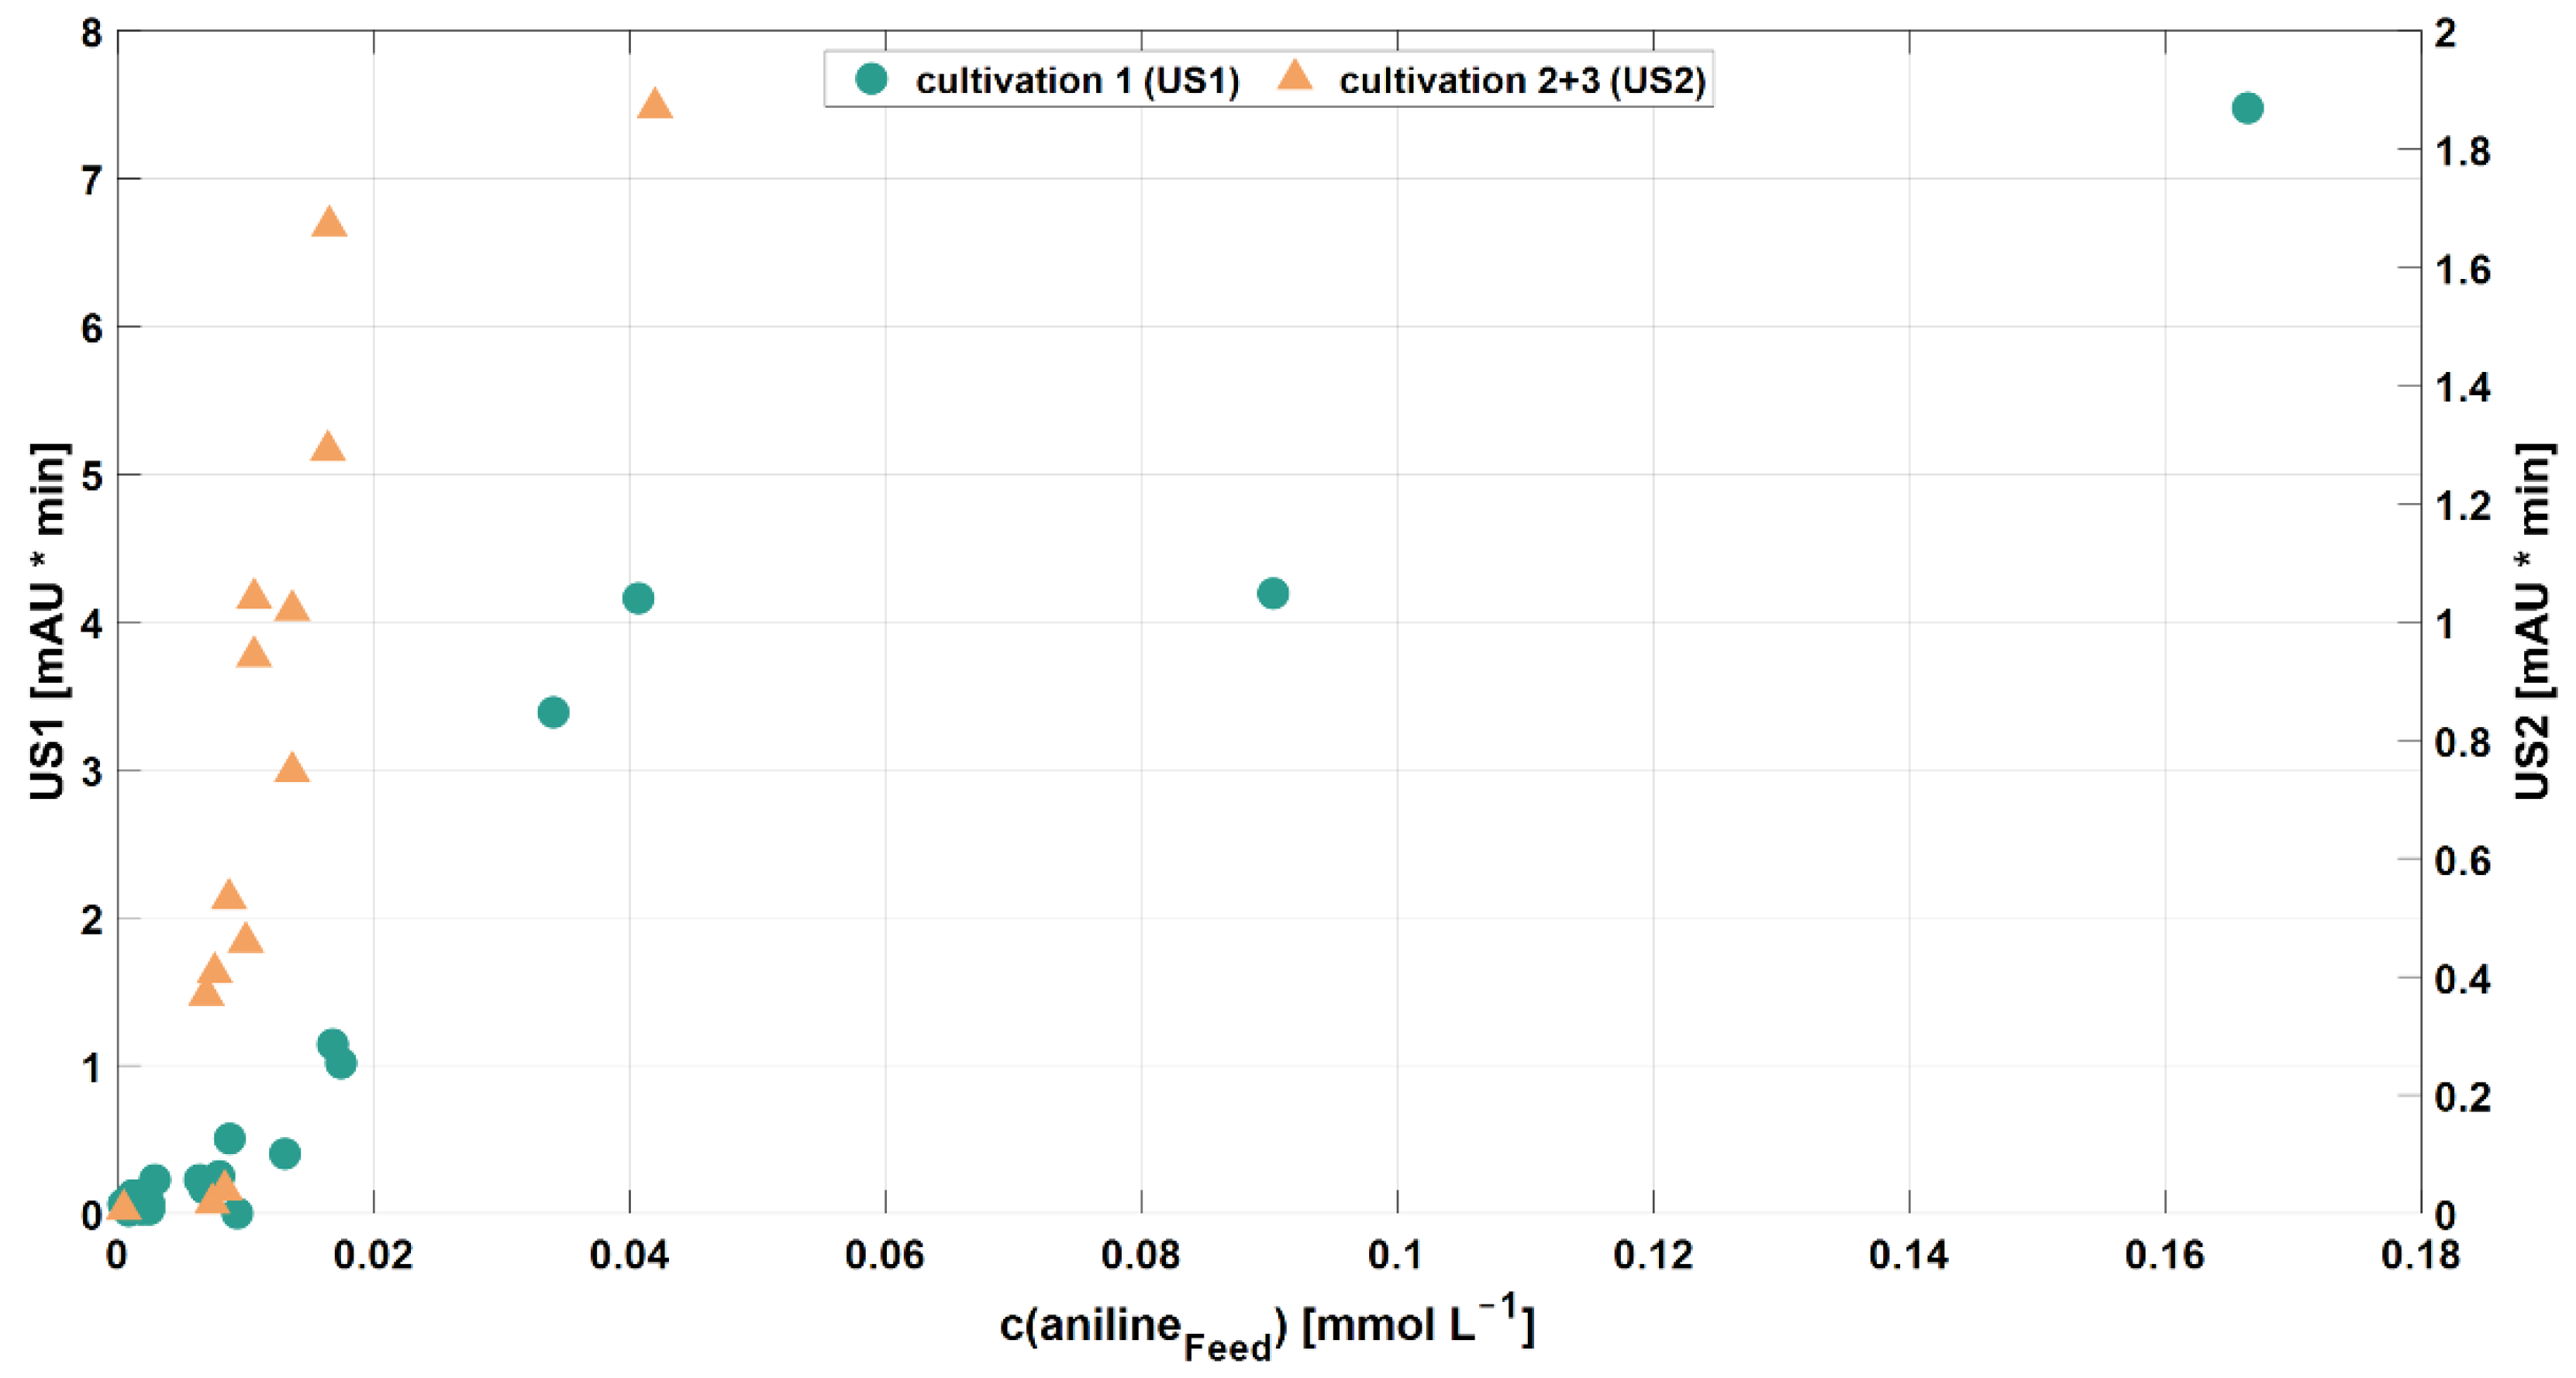
3.2.2. Aromatic Compounds
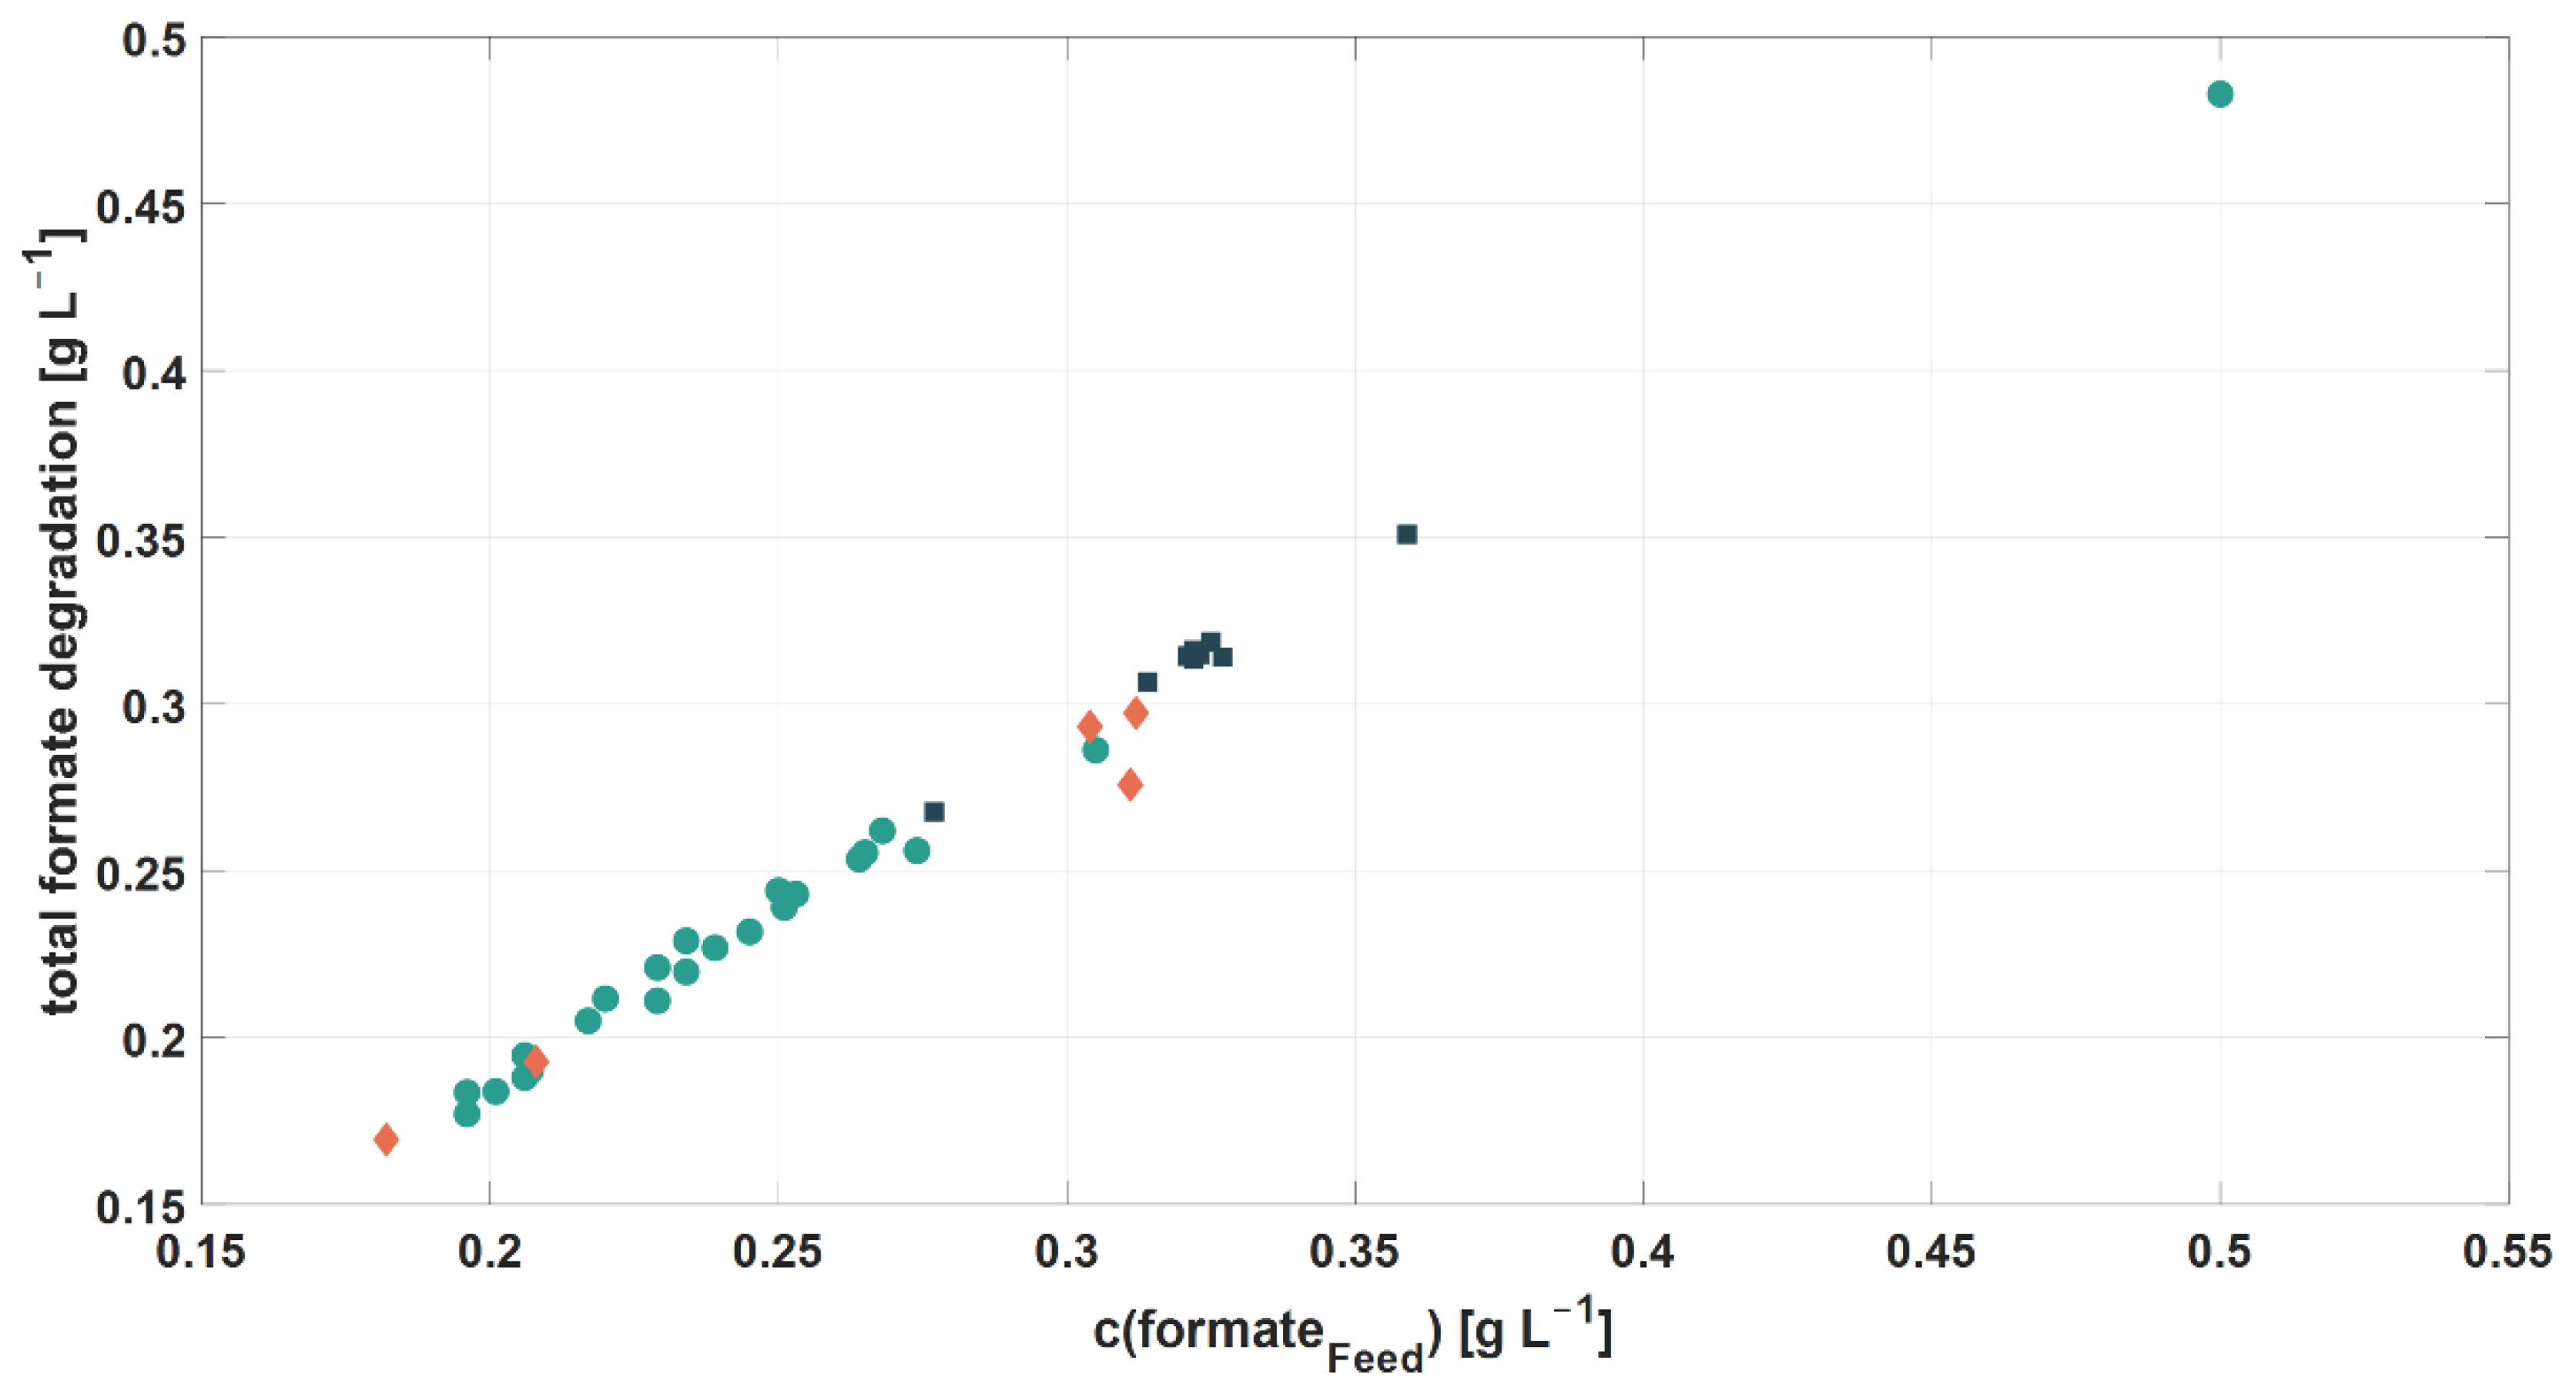
The concentrations of aromatic contaminants might change between different RPB batches, caused by variations in the production process of MDA. The concentrations of aromatic compounds in the used RPB batches varied from 0.02–15.5 mg L−1 (Table 3). The effects of changing the concentrations of aromatics in the RPB feeds were analyzed during this study. High degradation efficiencies of aromatic impurities (100%) were achieved during all continuous cultivation experiments.
Although all aromatic compounds from the RPB feeds were degraded with a 100% efficiency during the bioprocess, potential intermediates in the aromatic degradation pathways were discovered during HPLC analyses of the bioreactor samples. In the bioreactor samples of all continuous cultivation experiments, yet unidentified peaks were observed in HPLC chromatograms. However, such unidentified peaks were not present in the RPB feed samples. In cultivation 1 a different HPLC method for the detection of aromatic compounds was used than for cultivation 2 and 3. Therefore, the unidentified substance found during cultivation 1 was indicated as unknown substance 1 (US1), while the substance found during cultivations 2 and 3 was indicated as unknown substance 2 (US2).
During the microbial degradation of aromatic compounds such as aniline and phenol, catechol is one of the first intermediate substances [30,31,32,33]. Afterwards, catechol is de-graded via two main pathways (the meta- and ortho-cleavage pathways) and ultimately transformed into CO2 via the TCA cycle [31,32]. For a more detailed view, we encourage reading of the cited review literature about aromatic degradation pathways [30,31,32,33].
However, US1 and US2 could not be identified as catechol (data not shown). Still, the peak areas of the two unidentified, potential intermediates US1 and US2 increased with an increasing aniline concentration in the RPB feed (Figure 4). In contrast, accumulation of these unidentified compounds did not correlate with phenol and 4,4′-MDA concentrations. In addition to the aniline feed concentration, no other critical process parameters were found to influence the accumulation of the unidentified substances.

3.2.3. Formate

Generally, in RPB derived from MDA production, formate is the main organic impurity and showed a concentration range of 0.17–0.50 g L−1 in the used RPB batches. During the cultivation experiments, formate was degraded with an efficiency of 89–98%. Formate is usually oxidized to CO2 via enzymes, which are classified into two different groups [34]. The first group consists of metal-independent but NAD+-dependent formate dehydrogenases, which oxidize formate according to Equation (7) [35,36]:
HCOOH +   NAD +   CO 2 + NADH
The second group are metal-containing formate hydrogen lyases, which have molybdenum- or tungsten-containing components (Equation (8)) [34,37,38]:
HCOOH   CO 2 + H + + 2 e
Among halophiles, the halophilic bacterium Halomonas sp. MA-C was reported to degrade formate. However, less than 5% of formate was incorporated into the biomass, as shown by experiments using 14C-labeled formate.
It was shown that the total amount of degraded formate and the formate concentration in the RPB feed were linearly correlated (Figure 5). This linear trend was consistent within all three cultivation experiments. Nevertheless, formate was not completely degraded, as residual formate was still measured in harvest samples (2–11% of the original formate concentration). However, residual formate concentrations could not be linked to the corresponding formate concentration in the RPB feed. Therefore, further investigations of influential factors on formate degradation were carried out (see Section 3.3.2).

3.3. Influence of Media Components on Process Performance

3.3.1. Ammonium and Phosphate
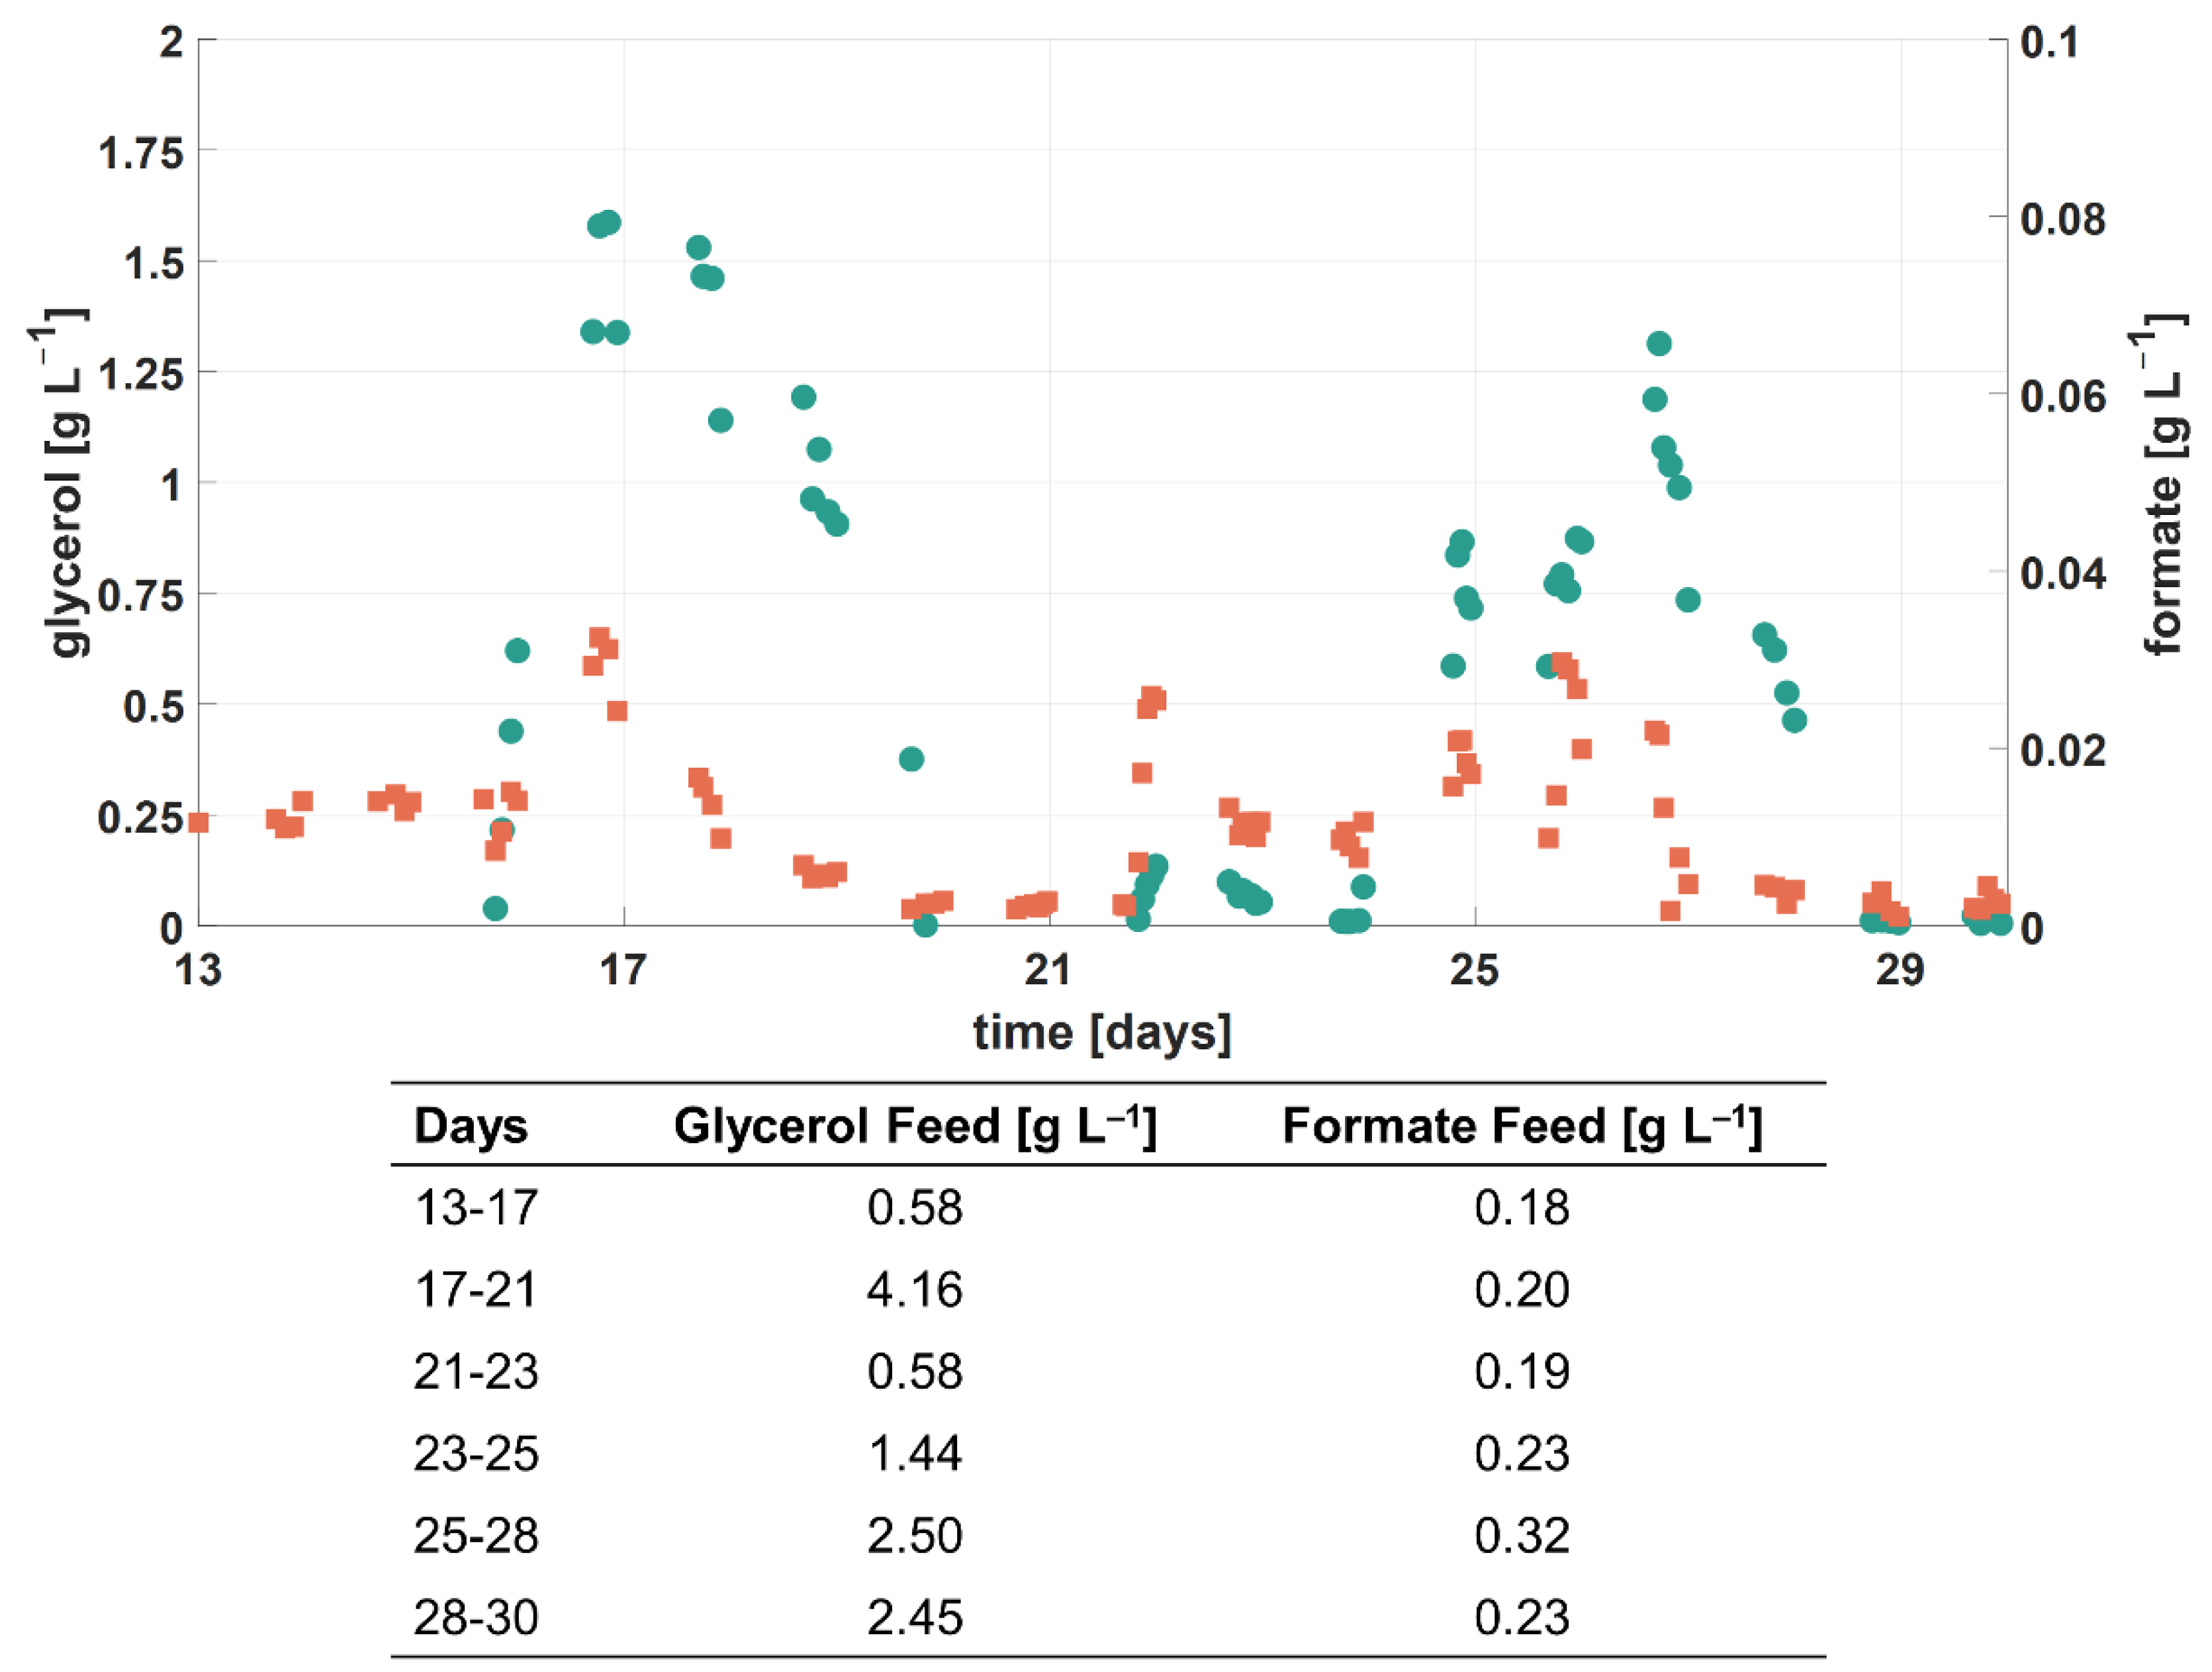
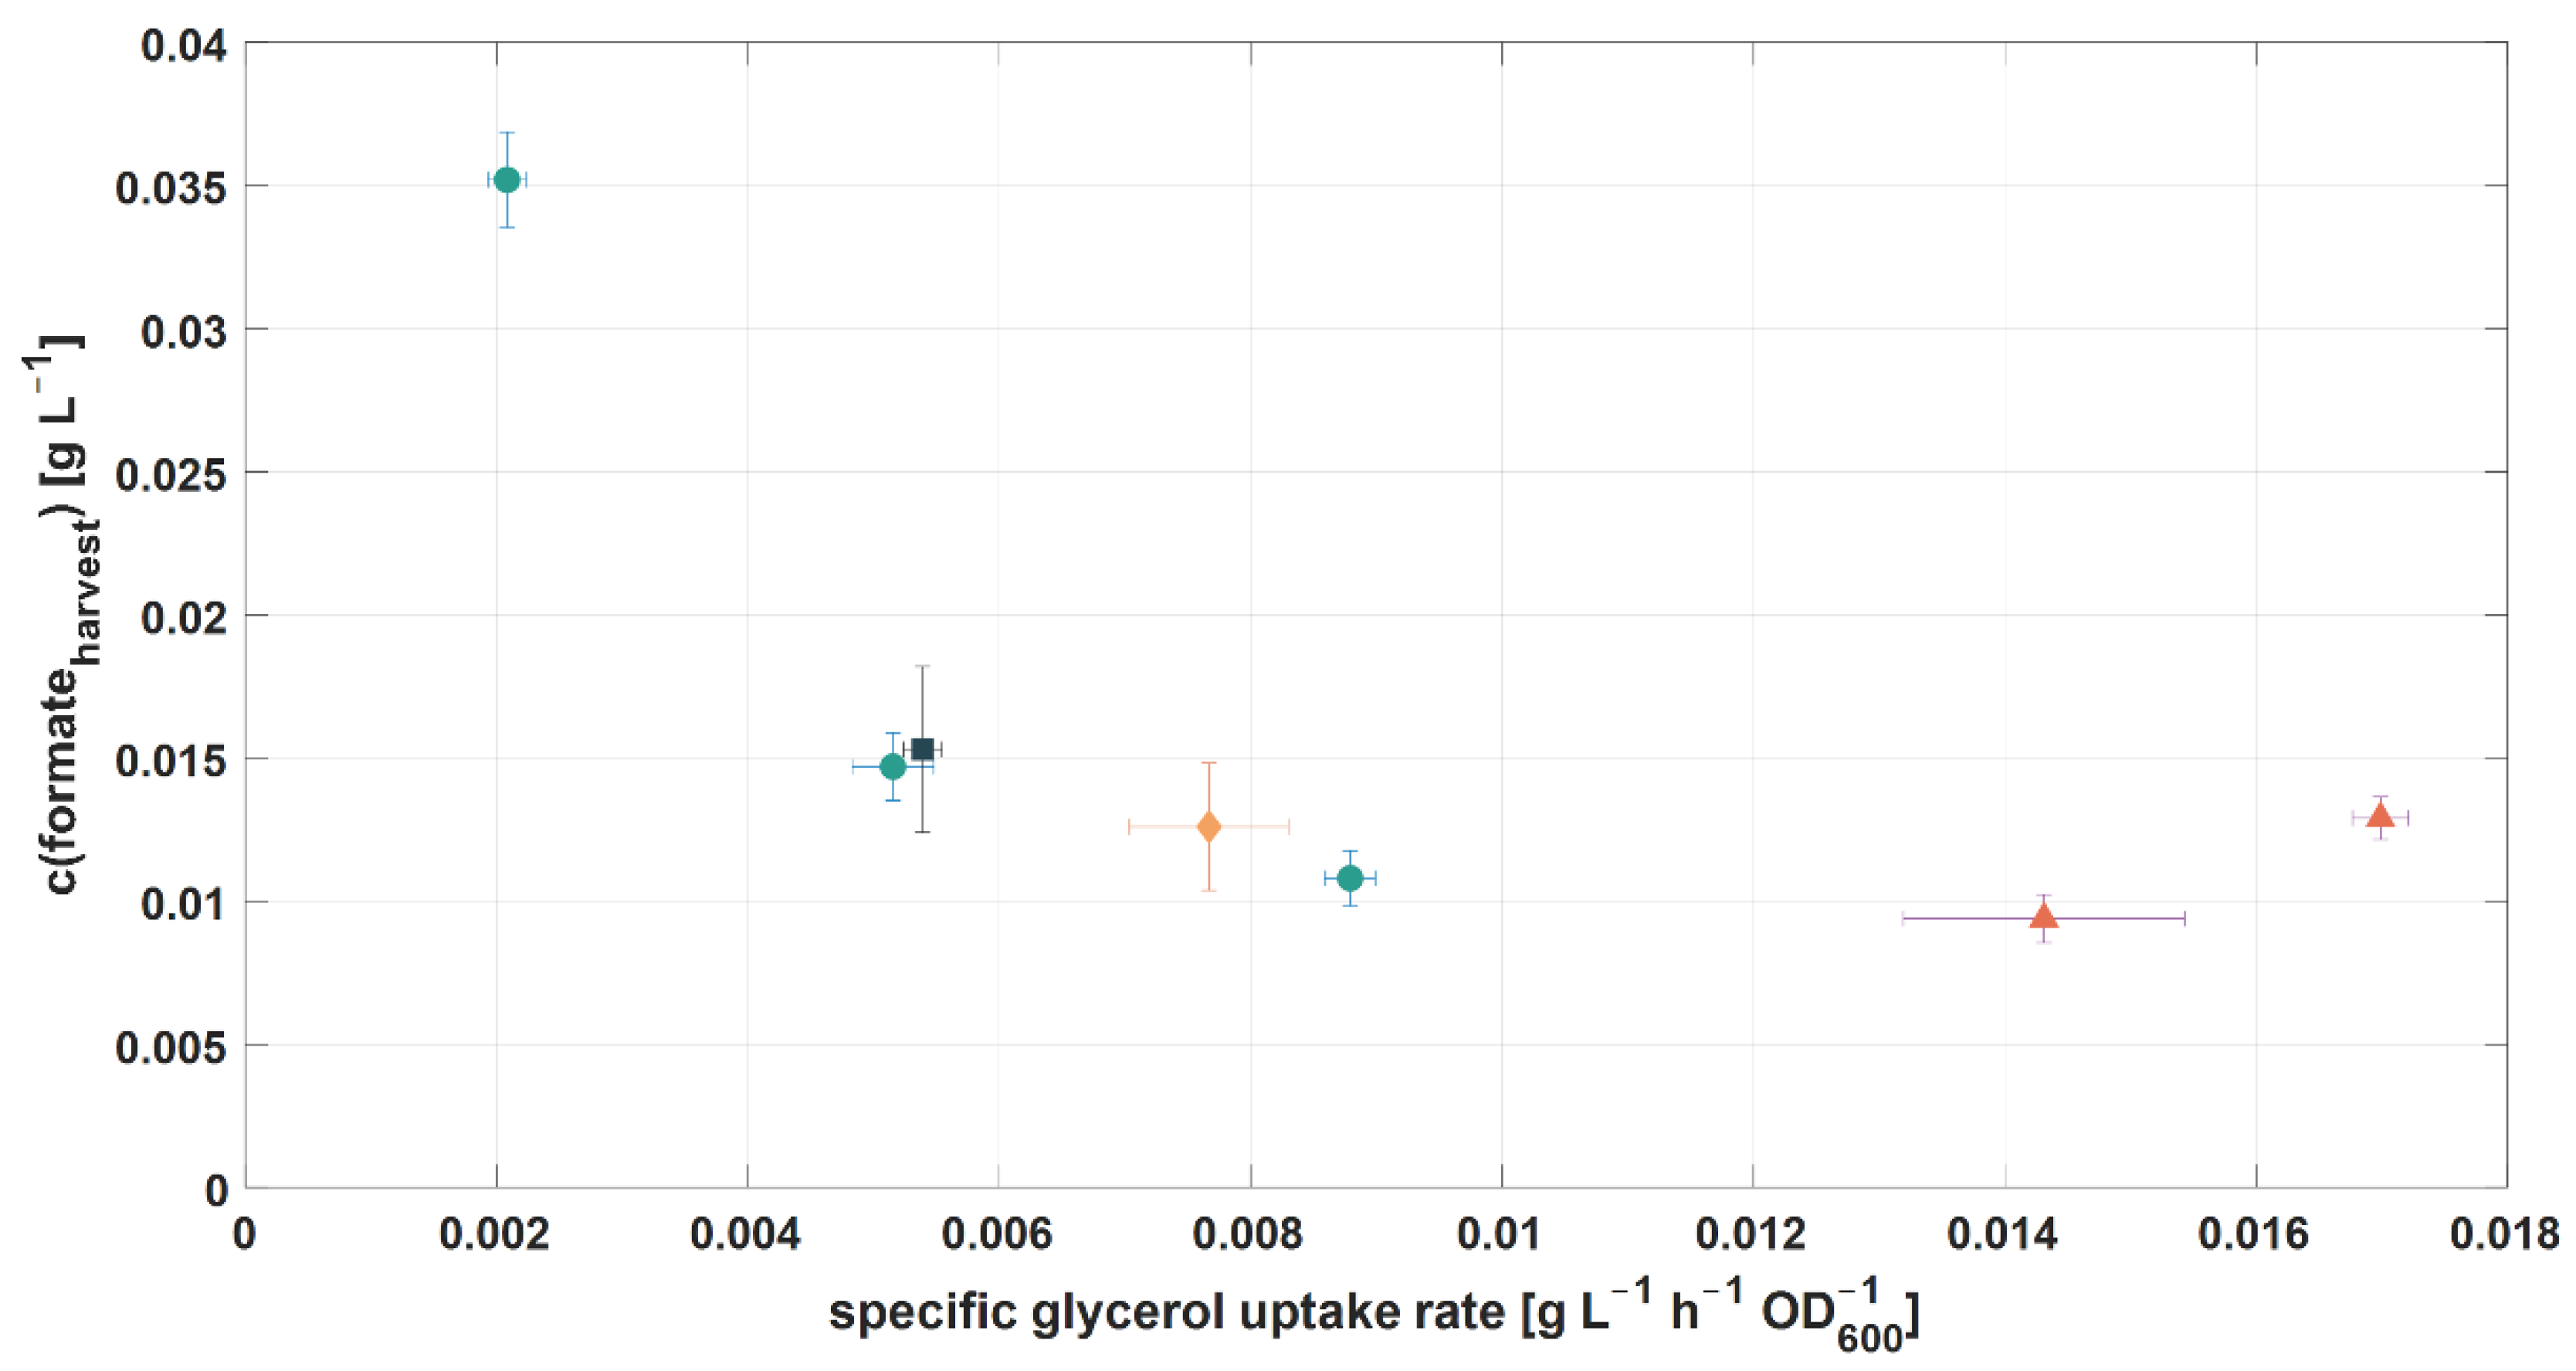
In addition to low organic levels, RPB—used as a raw material in a membrane-cell chlor-alkali electrolysis—has to be free of any ammonium or organic nitrogen species, as explosive nitrogen trichloride (NCl3) can be formed [7]. For microorganisms that require nitrogen for growth and protein biosynthesis, ammonium was supplied in the cultivation medium as a nitrogen source. However, to meet the raw material specifications for chlor-alkali electrolysis, the ammonium concentration in the feed medium must be low enough to allow for complete degradation by the microbial culture, but still high enough to ensure sufficient process performance.
In addition to ammonium, phosphate also plays a crucial role for microbial growth, as it plays a major part in several cellular processes such as DNA synthesis and is a part of the energy molecule ATP. In contrast to ammonium species, it was not known to the authors that phosphate could negatively affect the chlor-alkali process when it is present in brines. However, the reduction in the used phosphate source is of interest in terms of the operational cost of the process. Thus, the addition of phosphate should be limited to a minimum, so that successful degradation of organic compounds is still ensured but no residual phosphate is measured in the harvest samples.
Therefore, during cultivation 2, the influence of ammonium and phosphate consumption on the process performance variables was investigated. To do so, the ammonium and phosphate concentrations in the RPB feeds were varied to compare the degradation efficiency of organic compounds in limiting and non-limiting conditions for either ammonium, phosphate, or both (see Table 4). In all experiments, glycerol-limiting conditions were applied. All used RPB feeds originated from RPB1. Successful application of a triple-nutrient limitation (glycerol, ammonium, and phosphate) was achieved, and sufficient degradation of organic impurities was maintained. The results also showed that the lowest c(formateHarvest) was reached with phosphate-limiting but not nitrogen-limiting conditions (see Table 4, experiment 2.5–2.7). In addition, ammonium and phosphate consumption did not show an effect of the accumulation of US2.
Based on the results, the hypothesis of a significant influence of the consumed ammonium and phosphate on c(formateHarvest) was tested by performing multiple linear regression (MLR). To do so, the predictor variables YNH4+/glycerol and YPO43-/glycerol were applied for the target variable c(formateHarvest). Among the tested predictor variables, only YNH4+/glycerol showed a significant effect in the model for the c(formateHarvest). Therefore, a second linear regression with YNH4+/glycerol as the only predictor variable and c(formateHarvest) as target variable was performed.
The results indicated a linear correlation between YNH4+/glycerol and c(formateHarvest) (Supplementary Figure S1), as the p-value was below 0.05 (p-value = 0.044). However, the results also showed that residual formate concentrations for all experiments were below 10 mg L−1, which equals a theoretical TOC of less than 3 mg L−1; this is below the specification level of 10 ppm required for chlor-alkali processes [7]:
TOC theor .   = M C atom M formate c formate = 12   g   mol 1 46.03   g   mol 1 10   mg   L 1 = 2.61   mg   L 1
Hence, a feeding strategy for ammonium and phosphate was successfully applied in a way in which both substrates are consumed completely, to ensure less downstream efforts before the chlor-alkali-electrolysis step. Such a strategy could, for example, be linked to the glycerol consumption rate and, thus, to the glycerol feeding strategy. It should be mentioned that ammonium concentrations in the feed should not exceed the ratio of 0.4 molN molgly−1, in order to avoid residual ammonium. A preferable ratio for ammonium to glycerol would be in the range of 0.20–0.22 molN molgly−1, which ensures nitrogen-limiting conditions and reduces the cost for ammonium supplementation. As no effect of the consumption of phosphate on formate degradation could be observed, a ratio of phosphate addition based on glycerol consumption was proposed to be 0.003–0.004 molP molgly−1.
Nutrient-limiting conditions frequently occur in natural habitats such as marine eco-systems, and include co-limitations of N and P [39,40]. For instance, co-limitations of Zn/C, Ni/N, or Fe/light were reported in bioprocesses with phytoplankton biomass [41,42,43,44]. So far, dual-nutrient limitations of the carbon, nitrogen, and/or phosphate source are known for fed-batch and continuous cultivations [45,46,47,48,49,50,51]. Nutrient limitations are mostly applied for biological production processes of secondary metabolites such as polyhydroxybutyrate or polyhydroxyalkanoates [51,52,53]. However, an effect of dual- or triple-nutrient limitations on degradation efficiencies in biological residual water treatment processes has not yet been investigated.
The results show that a robust continuous cultivation with a halophilic microbial system and an efficient degradation of organic contaminants in a RPB is successful at triple-limiting conditions for the nutrients glycerol, ammonium, and phosphate. The limitation of these compounds did not decrease the growth rate or significantly reduce the degradation efficiency. This not only allows for a reduction in operational costs, but also ensures that the specifications of additional substances in brines used for membrane-based chlor-alkali electrolysis are met.

3.3.2. Glycerol

In addition to ammonium and phosphate, glycerol was added to each RPB feed as the main growth substrate. During cultivation 1, it was shown that a suitable feeding strategy for glycerol is crucial. The overfeeding of glycerol resulted in a decreased degradation of formate, indicated by an increased c(formateHarvest) and residual glycerol in the harvest (see Figure 6). Furthermore, other studies showed that carbon-limited conditions are beneficial for the simultaneous utilization of a growth substrate and other organic compounds [54,55].
Therefore, the data from cultivation experiments 2 and 3 were analyzed for a potential influence of glycerol feeding on formate degradation. Indeed, the results of the cultivation experiments indicated a correlation between the addition of glycerol and the formate degradation efficiency, as well as c(formateHarvest) (see Table 5).
An optimal control space for the specific glycerol uptake rate could, therefore, be located at 8.0–16.0 × 10⁻³ g L−1 h−1 OD600−1, where the lowest c(formateHarvest) (~10 mg L−1) was reached (see Figure 7). Similar values for the specific glycerol uptake rates were tested in other studies (10.2 × 10⁻³ g L−1 h−1 OD600−1 [13] and 11.6 × 10⁻³ g L−1 h−1 OD600−1 [56]) using H. mediterranei. However, in these studies, no effect on the influence of the specific glycerol uptake rate on c(formateHarvest) was reported. Specific glycerol uptake rates below 8.0 × 10⁻³ g L−1 h−1 OD600−1 led to an increase in c(formateHarvest). This is also in line with other studies, which investigated low growth rates of bacteria in retentostats and observed the co-utilization of substrates which are not co-utilized during carbon excess [54,55,57,58]. In contrast, higher specific glycerol uptake rates could not increase formate degradation, but would result in higher process costs due to a higher glycerol consumption. Moreover, it was shown, in cultivation 1, that an excess of the carbon source glycerol led to decreased formate degradation.

3.4. Defining Optimized Operating Conditions

To define the optimized operating conditions for a biological treatment process of RPB from MDA production, critical process parameters which influence the process performance were identified. Among those variables, the specific glycerol uptake rate qS,gly and the consumption yield of ammonium to glycerol YNH4+/glycerol influenced the residual formate concentration c(formateHarvest), whereas the aniline feed concentration was shown to have an influence on the intermediate accumulation.
Additionally, several other process variables were tested and found to have no influence on any process performance variable. The dilution rate D (Equation (3)) varied from 0.036 to 0.2 h−1 in cultivation experiment 1. No influence of the dilution rate on the process performance could be observed. A process can, therefore, be operated with a dilution rate of at least D = 0.2 h−1, which corresponds to a hydraulic residence time (HRT) of 5 h. In other biological processes for the reduction of organic content in wastewater, HRT values of 3–24 h were applied [13,33,59,60,61]. Hence, during this study, a desirable high throughput of RPB was successfully applied. However, in another study, a dilution rate of D = 0.37 h−1 (HRT = 2.7 h) was already shown to be successful for treating RPB from MDA production with H. mediterranei [56]. Thus, the usage of even higher dilution rates should be investigated in future. Nevertheless, the dilution rate also impacts glycerol feeding, which was found to be influential for formate degradation efficiency. It was shown that with a specific glycerol uptake rate of 8.0–16.0 × 10⁻³ g L−1 h−1 OD600−1, the highest formate degradation was achieved.
Furthermore, the retention rate R (Equation (4)) was found to have no influence on the process performance variables and was tested at ranges from 0.70–0.98. A high value of R = 0.98 is beneficial for the process operation costs as fewer, yet unused, waste streams (bleeds) are generated. Another beneficial impact of high retention rates is that cell wash-out can be prevented at high dilution rates and low glycerol concentrations in the feed. In general, the usage of a retention system for the degradation of organic compounds in RPBs can be seen as beneficial, as it allows the application of higher dilution rates D for bioprocesses using slow-growing microorganisms such as extremophiles [62,63]. Moreover, other studies showed that at low growth rates achieved in carbon-limited retentostat cultures, bacteria are prone to co-utilizing substrates which are not co-utilized during carbon excess conditions, including aromatic compounds such as benzoate [57,58].
Moreover, it was shown that the limitation of ammonium and phosphate due to reduced addition in the RPB feed did not negatively affect process performance. Additionally, no negative influence on process performance was observed when the concentration of Mg2+ and Ca2+ ions (in the form of MgCl2 × 6 H2O, MgSO4 × 7 H2O, and CaCl2 × 2 H2O) was reduced to 10% of the original level (data not shown). Usually, magnesium and calcium ions can be removed by using ion-exchange membranes [10]. Nevertheless, a reduction in added magnesium and calcium salts to the growth medium would not only lower the operational costs of the bioprocess, but also reduce the efforts for brine pre-treatment for chlor-alkali electrolysis. During this study, the complete removal of MgCl2 and supply of magnesium, only through the addition of MgSO4, was achieved. Based on the results of this study, potential process parameter ranges for optimized process operating conditions were proposed (Table 6).

4. Conclusions

In this study the influence of critical process parameters (bioprocessing parameters, media components, and raw material attributes) on the degradation efficiency of organic impurities in a biological treatment process was investigated. For the industrial integration of the biological treatment process, the optimized operating conditions of process parameters were proposed, in which a cost-effective process control at high degradation efficiencies was enabled. It was demonstrated that the aromatic impurities of the RPB (aniline, phenol and MDA) were degraded with high efficiencies of 100%. However, during the cultivation experiments, it was observed that high aniline concentrations in residual process brine feeds resulted in an increased accumulation of potential intermediate substances. Therefore, in the next step, the intermediate substances and, thus, the potential degradation pathway, should be identified. Additionally, the main organic impurity formate was degraded with an efficiency of 89–98%. Moreover, it was shown, for the first time, that a triple limitation of the carbon, nitrogen, and phosphorus source could successfully be implemented while, at the same time, maintaining high levels of degradation for organic contaminants. The successful triple limitation not only lowers operational costs, but also reduces further downstream efforts, especially in the case of nitrogen species. Furthermore, in the course of this study, an influence of the ammonium consumption yield and the co-substrate glycerol on the degradation of formate was discovered. In this study, it was shown that higher consumption yields of ammonium to glycerol YNH4+/glycerol led to a slight increase in residual formate concentrations. Therefore, further research on the influence of ammonium on the formate degradation pathway could be beneficial for increased process performance. Likewise, an excess of glycerol led to a decrease in formate degradation. Additionally, it was found that the specific glycerol uptake rate outside the range of 8.0–16.0 × 10⁻³ g L−1 h−1 OD600−1 increased the residual formate concentration. In conclusion, this study shows the robustness of a biological system to continuously treat MDA residual process brine under various process conditions. Optimized operating conditions were proposed, which support the cost-effective control of the biological treatment process, while maintaining high degradation efficiencies. Ultimately, the use of triple-nutrient-limiting conditions shows the potential to improve the cost-effectiveness of biological treatment or production processes towards an industrial scope. Further investigations should be performed regarding higher liquid dilution rates to increase productivity. Moreover, researching further influences on aromatic degradation and nitrogen uptake would be beneficial for knowledge of the process.

5. Patents

Covestro AG has filed patent applications Wo 2018/130510 A1, Wo 2018/037081 A1, EP18160929, WO 2019/121199 A1, 2020P30051WO, comprising the results of this study.

Supplementary Materials

The following supporting information can be downloaded at: https://www.mdpi.com/article/10.3390/fermentation8060246/s1, Figure S1: Results of linear regression with YNH4+/glycerol as predictor variable and c(formateHarvest) as target variable.

Author Contributions

Conceptualization, T.M., and S.P.; methodology, T.M., and S.P.; validation, T.M., and S.P.; formal analysis, T.M.; writing—original draft preparation, T.M., and S.P.; writing—review and editing, T.M., S.P., and C.H.; visualization, T.M.; supervision, S.P., and C.H.; project administration, C.H.; funding acquisition, C.H. All authors have read and agreed to the published version of the manuscript.

Funding

This work was supported by the Austrian Research Promotion Agency (FFG) (grant number: 844608) and within the framework of the Competence Center CHASE GmbH, funded by the Austrian Research Promotion Agency (grant number 868615) as part of the COMET program (Competence Centers for Excellent Technologies) by BMVIT, BMDW, and the Federal Provinces of Upper Austria and Vienna. Additionally, funding was received from Kompetenzzentrum Holz GmbH (Linz, Austria) and Covestro AG (Leverkusen, Germany). Open Access Funding by TU Wien.

Institutional Review Board Statement

Not applicable.

Informed Consent Statement

Not applicable.

Data Availability Statement

Not applicable.

Acknowledgments

The authors are indebted to David Weirathmüller for his excellent technical assistance. The authors acknowledge TU Wien Bibliothek for financial support through its Open Access Funding Program.

Conflicts of Interest

The authors declare no conflict of interest. The funders had no role in the design of the study; in the collection, analyses, or interpretation of data; in the writing of the manuscript, or in the decision to publish the results.

References

  1. Crook, J.; Mousavi, A. The chlor-alkali process: A review of history and pollution. Environ. Forensics 2016, 17, 211–217. [Google Scholar] [CrossRef]
  2. Lakshmanan, S.; Murugesan, T. The chlor-alkali process: Work in progress. Clean Technol. Environ. Policy 2014, 16, 225–234. [Google Scholar] [CrossRef]
  3. Bergner, D. Membrane cells for chlor-alkali electrolysis. J. Appl. Electrochem. 1982, 12, 631–644. [Google Scholar] [CrossRef]
  4. Garcia-Herrero, I.; Margallo, M.; Onandía, R.; Aldaco, R.; Irabien, A. Environmental challenges of the chlor-alkali production: Seeking answers from a life cycle approach. Sci. Total Environ. 2017, 580, 147–157. [Google Scholar] [CrossRef] [Green Version]
  5. Reig, M.; Casas, S.; Aladjem, C.; Valderrama, C.; Gibert, O.; Valero, F.; Centeno, C.M.; Larrotcha, E.; Cortina, J.L. Concentration of NaCl from seawater reverse osmosis brines for the chlor-alkali industry by electrodialysis. Desalination 2014, 342, 107–117. [Google Scholar] [CrossRef]
  6. Muddemann, T.; Bulan, A.; Sievers, M.; Kunz, U. Avoidance of Chlorine Formation during Electrolysis at Boron-Doped Diamond Anodes in Highly Sodium Chloride Containing and Organic-Polluted Wastewater. J. Electrochem. Soc. 2018, 165, J3281–J3287. [Google Scholar] [CrossRef]
  7. Brinkmann, T.; Giner Santonja, G.; Schorcht, F.; Roudier, S.; Delgado Sancho, L. Best Available Techniques (BAT) Reference Document for the Production of Chlor-Alkali; Publications Office of the European Union: Luxembourg, 2014. [Google Scholar]
  8. Keating, J.T.; Behling, K.-J. Brine, Impurities, and Membrane Chlor-Alkali Cell Performance, in Modern Chlor-Alkali Technology; Prout, N.M., Moorhouse, J.S., Eds.; Springer: Dordrecht, The Netherlands, 1990; Volume 4, pp. 125–139. [Google Scholar]
  9. Silva, J.M.; Soloveichik, G.L.; Novak, D. Effects of Organic Impurities on Chloralkali Membrane Electrolyzer Performance. Ind. Eng. Chem. Res. 2008, 48, 983–987. [Google Scholar] [CrossRef]
  10. Thiel, G.P.; Kumar, A.; Gómez-González, A.; Lienhard, V.J.H. Utilization of Desalination Brine for Sodium Hydroxide Production: Technologies, Engineering Principles, Recovery Limits, and Future Directions. ACS Sustain. Chem. Eng. 2017, 5, 11147–11162. [Google Scholar] [CrossRef]
  11. Madaeni, S.; Kazemi, V. Treatment of saturated brine in chlor-alkali process using membranes. Sep. Purif. Technol. 2008, 61, 68–74. [Google Scholar] [CrossRef]
  12. Zhuo, Y.; Sheng, M.; Liang, X.; Cao, G. Treatment of high salinity wastewater using CWPO process for reuse. J. Adv. Oxid. Technol. 2017, 20. [Google Scholar] [CrossRef] [Green Version]
  13. Mainka, T.; Mahler, N.; Herwig, C.; Pflügl, S. Soft Sensor-Based Monitoring and Efficient Control Strategies of Biomass Concentration for Continuous Cultures of Haloferax mediterranei and Their Application to an Industrial Production Chain. Microorganisms 2019, 7, 648. [Google Scholar] [CrossRef] [PubMed] [Green Version]
  14. Castillo-Carvajal, L.C.; Sanz-Martín, J.L.; Barragán-Huerta, B.E. Biodegradation of organic pollutants in saline wastewater by halophilic microorganisms: A review. Environ. Sci. Pollut. Res. Int. 2014, 21, 9578–9588. [Google Scholar] [CrossRef] [PubMed]
  15. Fathepure, B.Z. Recent studies in microbial degradation of petroleum hydrocarbons in hypersaline environments. Front. Microbiol. 2014, 5, 173. [Google Scholar] [CrossRef] [PubMed] [Green Version]
  16. Mainka, T.; Herwig, C.; Pflügl, S. Reducing Organic Load From Industrial Residual Process Brine with a Novel Halophilic Mixed Culture: Scale-Up and Long-Term Piloting of an Integrated Bioprocess. Front. Bioeng. Biotechnol. 2022, 10, 896576. [Google Scholar]
  17. Tan, X.; Acquah, I.; Liu, H.; Li, W.; Tan, S. A critical review on saline wastewater treatment by membrane bioreactor (MBR) from a microbial perspective. Chemosphere 2019, 220, 1150–1162. [Google Scholar] [CrossRef]
  18. Al-Shaikh, A.J.; Jamal, M.T. Bioaugmentation of halophilic consortia for the degradation of petroleum hydrocarbons and petroleum wastewater treatment. Int. J. Adv. Res. Biol. Sci. 2020, 7, 97–112. [Google Scholar]
  19. Jamal, M.T.; Pugazhendi, A. Degradation of petroleum hydrocarbons and treatment of refinery wastewater under saline condition by a halophilic bacterial consortium enriched from marine environment (Red Sea), Jeddah, Saudi Arabia. 3 Biotech 2018, 8, 276. [Google Scholar] [CrossRef]
  20. Kreye, O.; Mutlu, H.; Meier, M.A.R. Sustainable routes to polyurethane precursors. Green Chem. 2013, 15, 1431–1455. [Google Scholar] [CrossRef]
  21. Boros, R.Z.; Koós, T.; Wafaa, C.; Nehéz, K.; Farkas, L.; Viskolcz, B.; Szőri, M. A theoretical study on the phosgenation of methylene diphenyl diamine (MDA). Chem. Phys. Lett. 2018, 706, 568–576. [Google Scholar] [CrossRef]
  22. Schupp, T.; Allmendinger, H.; Boegi, C.; Bossuyt, B.T.A.; Hidding, B.; Shen, S.; Tury, B.; West, R.J. The Environmental Behavior of Methylene-4, 4′-dianiline. In Reviews of Environmental Contamination and Toxicology; Springer: Cham, Germany, 2018; Volume 246, pp. 91–132. [Google Scholar]
  23. Bulan, A.; Weber, R.; Muddemann, T. Process for the Electrochemical Purification of Chloride-Containing Process Solutions. US20190177186A1, 13 June 2019. [Google Scholar]
  24. Merenov, A.S.; Jewell, D.W.; Gillis, P.A.; Jansma, G.I.; Breed, A.W.; Anderson, J.J.; Reed, D.J. Process for the Production of Methylene Diphenyl Diisocyanate Isomer Mixtures with Specific Isomer Distributions and New Products Derived. US9090540B2, 28 July 2015. [Google Scholar]
  25. Thornton, P.G. Process for the Preparation of 4, 4′-Methylenedianiline. US3367969A, 6 February 1968. [Google Scholar]
  26. Eberly, L.E. Multiple Linear Regression; Topics in Biostatistics; Humana Press: Totowa, NJ, USA, 2007; pp. 165–187. [Google Scholar]
  27. Seber, G.A.; Lee, A.J. Linear Regression Analysis; John Wiley & Sons: Hoboken, NJ, USA, 2012. [Google Scholar]
  28. Erian, A.M.; Gibisch, M.; Pflügl, S.; Engineered, E. coli W enables efficient 2,3-butanediol production from glucose and sugar beet molasses using defined minimal medium as economic basis. Microb. Cell Fact. 2018, 17, 190. [Google Scholar] [CrossRef]
  29. Kolthoff, I.M.; Lauer, W.M.; Sunde, C.J. The use of dichlorofluorescein as an adsorption indicator for the argentometric titration of chlorides. J. Am. Chem. Soc. 1929, 51, 3273–3277. [Google Scholar] [CrossRef]
  30. Alva, V.A.; Peyton, B.M. Phenol and Catechol Biodegradation by the Haloalkaliphile Halomonas campisalis: Influence of pH and Salinity. Environ. Sci. Technol. 2003, 37, 4397–4402. [Google Scholar] [CrossRef] [PubMed]
  31. Li, H.; Meng, F.; Duan, W.; Lin, Y.; Zheng, Y. Biodegradation of phenol in saline or hypersaline environments by bacteria: A review. Ecotoxicol. Environ. Saf. 2019, 184, 109658. [Google Scholar] [CrossRef] [PubMed]
  32. Fuchs, G.; Boll, M.; Heider, J. Microbial degradation of aromatic compounds—From one strategy to four. Nat. Rev. Genet. 2011, 9, 803–816. [Google Scholar] [CrossRef]
  33. Mainka, T.; Weirathmüller, D.; Herwig, C.; Pflügl, S. Potential applications of halophilic microorganisms for biological treatment of industrial process brines contaminated with aromatics. J. Ind. Microbiol. Biotechnol. 2021, 48, kuab015. [Google Scholar] [CrossRef]
  34. Niks, D.; Hille, R. Molybdenum-and tungsten-containing formate dehydrogenases and formylmethanofuran dehydrogenases: Structure, mechanism, and cofactor insertion. Protein Sci. 2019, 28, 111–122. [Google Scholar] [CrossRef] [Green Version]
  35. Alpdağtaş, S.; Turunen, O.; Valjakka, J.; Binay, B. The challenges of using NAD+-dependent formate dehydrogenases for CO2 conversion. Crit. Rev. Biotechnol. 2021, 42, 953–972. [Google Scholar] [CrossRef]
  36. Tishkov, V.I.; Popov, V. Protein engineering of formate dehydrogenase. Biomol. Eng. 2006, 23, 89–110. [Google Scholar] [CrossRef]
  37. Maia, L.B.; Moura, I.; Moura, J.J.G. Molybdenum and tungsten-containing formate dehydrogenases: Aiming to inspire a catalyst for carbon dioxide utilization. Inorg. Chim. Acta 2016, 455, 350–363. [Google Scholar] [CrossRef]
  38. Yu, X.; Niks, D.; Mulchandani, A.; Hille, R. Efficient reduction of CO2 by the molybdenum-containing formate dehydrogenase from Cupriavidus necator (Ralstonia eutropha). J. Biol. Chem. 2017, 292, 16872–16879. [Google Scholar] [CrossRef] [Green Version]
  39. Mills, M.M.; Moore, C.M.; Langlois, R.; Milne, A.; Achterberg, E.; Nachtigall, K.; Lochte, K.; Geider, R.J.; La, R.J. Nitrogen and phosphorus co-limitation of bacterial productivity and growth in the oligotrophic subtropical North Atlantic. Limnol. Oceanogr. 2008, 53, 824–834. [Google Scholar] [CrossRef] [Green Version]
  40. Bracken, M.E.S.; Hillebrand, H.; Borer, E.T.; Seabloom, E.W.; Cebrian, J.; Cleland, E.E.; Elser, J.J.; Gruner, D.S.; Harpole, W.S.; Ngai, J.T.; et al. Signatures of nutrient limitation and co-limitation: Responses of autotroph internal nutrient concentrations to nitrogen and phosphorus additions. Oikos 2014, 124, 113–121. [Google Scholar] [CrossRef]
  41. Maldonado, M.; Boyd, P.; Harrison, P.J.; Price, N. Co-limitation of phytoplankton growth by light and Fe during winter in the NE subarctic Pacific Ocean. Deep Sea Res. Part II Top. Stud. Oceanogr. 1999, 46, 2475–2485. [Google Scholar] [CrossRef]
  42. Morel, F.M.M.; Reinfelder, J.; Roberts, S.B.; Chamberlain, C.P.; Lee, J.G.; Yee, D. Zinc and carbon co-limitation of marine phytoplankton. Nature 1994, 369, 740–742. [Google Scholar] [CrossRef]
  43. Price, N.M.; Morel, F.M.M. Colimitation of phytoplankton growth by nickel and nitrogen. Limnol. Oceanogr. 1991, 36, 1071–1077. [Google Scholar] [CrossRef]
  44. Sunda, W.G.; Huntsman, S.A. Interrelated influence of iron, light and cell size on marine phytoplankton growth. Nature 1997, 390, 389–392. [Google Scholar] [CrossRef]
  45. Frank, S.E. Growth Characteristics of Acinetobacter Johnsonii 210A under Single and Dual Nutrient Limitation with Special Reference to Carbon, Nitrogen and Phosphorus; ETH Zurich: Zürich, Switzerland, 1999; p. 146. [Google Scholar]
  46. Egli, T. On multiple-nutrient-limited growth of microorganisms, with special reference to dual limitation by carbon and nitrogen substrates. Antonie van Leeuwenhoek 1991, 60, 225–234. [Google Scholar] [CrossRef]
  47. Egli, T.; Quayle, J.R. Influence of the Carbon: Nitrogen Ratio of the Growth Medium on the Cellular Composition and the Ability of the Methylotrophic Yeast Hansenula polymorpha to Utilize Mixed Carbon Sources. Microbiology 1986, 132, 1779–1788. [Google Scholar] [CrossRef] [Green Version]
  48. Egli, T.; Zinn, M. The concept of multiple-nutrient-limited growth of microorganisms and its application in biotechnological processes. Biotechnol. Adv. 2003, 22, 35–43. [Google Scholar] [CrossRef]
  49. Zinn, M.; Witholt, B.; Egli, T. Dual nutrient limited growth: Models, experimental observations, and applications. J. Biotechnol. 2004, 113, 263–279. [Google Scholar] [CrossRef]
  50. Poblete-Castro, I.; Escapa, I.F.; Jäger, C.; Puchalka, J.; Lam, C.M.C.; Schomburg, D.; Prieto, M.A.; Santos, V.A.P.M.D. The metabolic response of P. putida KT2442 producing high levels of polyhydroxyalkanoate under single- and multiple-nutrient-limited growth: Highlights from a multi-level omics approach. Microb. Cell Fact. 2012, 11, 34. [Google Scholar] [CrossRef] [PubMed] [Green Version]
  51. Karmann, S.; Panke, S.; Zinn, M. Fed-Batch Cultivations of Rhodospirillum rubrum Under Multiple Nutrient-Limited Growth Conditions on Syngas as a Novel Option to Produce Poly(3-Hydroxybutyrate) (PHB). Front. Bioeng. Biotechnol. 2019, 7, 59. [Google Scholar] [CrossRef] [PubMed] [Green Version]
  52. Cavaillé, L.; Albuquerque, M.; Grousseau, E.; Lepeuple, A.-S.; Uribelarrea, J.-L.; Hernandez-Raquet, G.; Paul, E. Understanding of polyhydroxybutyrate production under carbon and phosphorus-limited growth conditions in non-axenic continuous culture. Bioresour. Technol. 2016, 201, 65–73. [Google Scholar] [CrossRef] [PubMed]
  53. Luna, M.F.; Ochsner, A.M.; Amstutz, V.; von Blarer, D.; Sokolov, M.; Arosio, P.; Zinn, M. Modeling of Continuous PHA Production by a Hybrid Approach Based on First Principles and Machine Learning. Processes 2021, 9, 1560. [Google Scholar] [CrossRef]
  54. Rüegg, I.; Hafner, T.; Bucheli-Witschel, M.; Egli, T. Dynamics of Benzene and Toluene Degradation inPseudomonas putida F1 in the Presence of the Alternative Substrate Succinate. Eng. Life Sci. 2007, 7, 331–342. [Google Scholar] [CrossRef]
  55. Duetz, W.A.; Marqués, S.; de Jong, C.; Ramos, J.L.; van Andel, J.G. Inducibility of the TOL catabolic pathway in Pseudomonas putida (pWW0) growing on succinate in continuous culture: Evidence of carbon catabolite repression control. J. Bacteriol. 1994, 176, 2354–2361. [Google Scholar] [CrossRef] [PubMed] [Green Version]
  56. Mahler, N.; Tschirren, S.; Pflügl, S.; Herwig, C. Optimized bioreactor setup for scale-up studies of extreme halophilic cultures. Biochem. Eng. J. 2018, 130, 39–46. [Google Scholar] [CrossRef]
  57. Marozava, S.; Röling, W.F.; Seifert, J.; Küffner, R.; von Bergen, M.; Meckenstock, R.U. Physiology of Geobacter metallireducens under excess and limitation of electron donors. Part II. Mimicking environmental conditions during cultivation in retentostats. Syst. Appl. Microbiol. 2014, 37, 287–295. [Google Scholar] [CrossRef] [Green Version]
  58. Marozava, S.; Röling, W.F.; Seifert, J.; Küffner, R.; von Bergen, M.; Meckenstock, R.U. Physiology of Geobacter metallireducens under excess and limitation of electron donors. Part I. Batch cultivation with excess of carbon sources. Syst. Appl. Microbiol. 2014, 37, 277–286. [Google Scholar] [CrossRef] [Green Version]
  59. Deowan, S.A.; Bouhadjar, S.I.; Hoinkis, J. 5-Membrane bioreactors for water treatment. In Advances in Membrane Technologies for Water Treatment; Basile, A., Cassano, A., Rastogi, N.K., Eds.; Woodhead Publishing: Oxford, UK, 2015; pp. 155–184. [Google Scholar]
  60. Ding, Y.; Guo, Z.; Ma, B.; Wang, F.; You, H.; Mei, J.; Hou, X.; Liang, Z.; Li, Z.; Jin, C. The Influence of Different Operation Conditions on the Treatment of Mariculture Wastewater by the Combined System of Anoxic Filter and Membrane Bioreactor. Membranes 2021, 11, 729. [Google Scholar] [CrossRef]
  61. Cao, S.M.; Fontoura, G.A.T.; Dezotti, M.; Bassin, J.P. Combined organic matter and nitrogen removal from a chemical industry wastewater in a two-stage MBBR system. Environ. Technol. 2016, 37, 96–107. [Google Scholar] [CrossRef] [PubMed]
  62. Lorantfy, B.; Ruschitzka, P.; Herwig, C. Investigation of physiological limits and conditions for robust bioprocessing of an extreme halophilic archaeon using external cell retention system. Biochem. Eng. J. 2014, 90, 140–148. [Google Scholar] [CrossRef]
  63. Doran, P.M. Bioprocess Engineering Principles; Elsevier: Amsterdam, The Netherlands, 1995. [Google Scholar]
Figure 1. Scheme of the cell retention setup: In the first bioreactor setup, a constant feed (FRPB) adds fresh residual brine to the bioreactor broth and supplies the cells with substrate and media components. In a second setup, the feed flow is split up into a residual brine feed (FRPB) containing additional micronutrients and a supplement feed (FSupplements) containing the carbon, nitrogen, and phosphorus source. Base (FBase) is added to hold the pH at a constant level of 7.0. A pump continuously circulates the cell suspension as loop flow (FLoop) through the membrane module to separate cell-free harvest (FHarvest). Bleed flow (FBleed) is continuously removed to eliminate cells and sustain steady state conditions. To guarantee a constant reactor volume (VR), flows for Feed, Base, Harvest and Bleed have to meet the following equation: FRPB + FBase (+FSupplements) = FHarvest + FBleed. Biomass is monitored using a turbidity probe and a soft sensor that is driven by measurements of off-gas composition. Oxygen is supplied with a constant flow of pressurized air FAir. The off-gas composition of oxygen xOffgas,O2, and carbon dioxide xOffgas,CO2 is measured.
Fermentation 08 00246 g001
Figure 2. Potential parameters influencing a biological treatment process to reduce organic content in an MDA production residual brine. Bioprocess parameters, media components, and raw material attributes are summarized as critical process parameters. Parameter D refers to the dilution rate, and R to the retention rate R. The residual aromatic (c(aromatesHarvest)) and formate concentrations (c(formateHarvest)) are defined as process performance variables.
Fermentation 08 00246 g002
Figure 3. Determination of the specific growth rates of the novel halophilic mixed culture, depending on the NaCl concentration in the medium.
Fermentation 08 00246 g003
Figure 4. Accumulation of US1+2 depending on RPB feed concentrations of aniline (: peak area of unknown substance 1, found during cultivation experiment 1; : peak area of unknown substance 2, found during cultivation experiments 2 + 3).
Fermentation 08 00246 g004
Figure 5. Linear correlation of the total amount of degraded formate and the formate concentration in RPB feed (: cultivation 1; : cultivation 2; : cultivation 3).
Fermentation 08 00246 g005
Figure 6. Process performance for cultivation 1 during the second experimental phase. Concentration of glycerol () and formate () in harvest samples. The table gives information about the corresponding feed concentrations [16].
Fermentation 08 00246 g006
Figure 7. Influence of glycerol on process performance. Correlation of the specific glycerol uptake rate and c(formateHarvest) (: cultivation 3, RPB 1; : cultivation 3, RPB 2; : cultivation 3, RPB 3; : cultivation 2, RPB 1).
Fermentation 08 00246 g007
Table 1. Overview of critical process parameters investigated for their influence on process performance.
Critical Process ParameterUnitCritical Process ParameterUnit
Glycerolg L−1Formatemg L−1
Ammonium (NH4+)mmol L−1Anilinemg L−1
Phosphate (PO43−)mmol L−1Phenolmg L−1
Magnesium (Mg2+)g L−14,4′-MDAmg L−1
Calcium (Ca2+)g L−1Optical Density OD600-
Dilution rate Dh−1Retention rate R-
Table 2. Overview of cultivation experiments.
ParameterCultivation 1Cultivation 2Cultivation 3
Reference[16]This studyThis study
Feed systemFeed: RPB and glycerolFeed: RPB and glycerolFeed 1: RPB
Feed 2: glycerol
Reactor volume16 L1 L1 L
Range of D0.06–0.20 h−10.09 h−10.10 h−1
Range of R0.75–0.950.92–0.980.8–0.91
RPB origins111, 2, 3
Cultivation time [days]>2003935
Table 3. Concentration ranges of aromatic contaminants in residual process brine batches. For RPB 1 several batches were used and the range for each aromatic contaminant is shown. RPB 2 and 3 were derived from one batch each.
ContaminantRPB 1 [mg L−1] *RPB 2 [mg L−1]RPB 3 [mg L−1]
Aniline0.04–15.503.910.04
Phenol1.37–7.7115.002.99
4,4′-MDA0.02–0.740.210.06
* 32 different batches of RPB 1 were used. Full range of concentrations are given in the table.
Table 4. Experimental conditions and results of ammonium and phosphate limitation experiments. Concentrations of ammonium, phosphate, and formate in feed and harvest samples are denoted as c((NH4+Feed), c(NH4+Harv.), c(PO43Feed), c(PO43-Harv.), c(formateFeed), and c(formateHarvest). Consumption yields of ammonium and phosphate attributed to glycerol consumption are denoted as YNH4+/Glycerol, and YPO43-/Glycerol.
Exp.c(NH4+Feed) [mM]c(NH4+Harv.) [mM]c(PO43−Feed) [mM]c(PO43−Harv.) [mM]YNH4+/Glycerol [molN molgly.−1]YPO43-/Glycerol [molP molgly]c(formateFeed) [mg L−1]c(formateHarvest) [mg L−1]
2.119.7510.871.110.760.4260.0173147.44
2.219.9012.860.0700.3400.0033238.15
2.34.6301.020.300.1990.0313598.11
2.44.6900.0700.2190.0043228.52
2.59.651.280.3400.4120.0173225.89
2.68.720.920.3700.3900.0193256.40
2.79.750.520.3500.4340.0093216.66
Table 5. Overview of parameters used for glycerol feeding experiments. RPB denotes the origin of the used residual process brine, and qS,gly denotes the specific glycerol uptake rate. Feed concentrations of glycerol, ammonium and phosphate are denoted by c(Gly.Feed), c(NH4+Feed), and c(PO43−Feed).
Exp.RPBD [h−1]R [–]qS,gly [g L−1 h−1 OD600−1]c(Gly.Feed) [g L−1]c(NH4+Feed) [mmol L−1]c(PO43−Feed) [mmol L−1]
2.810.0950.80017.0 × 10−33.745.100.36
2.910.0950.80015.9 × 10−31.794.900.29
3.110.0880.9178.7 × 10−32.075.230.33
3.210.0880.9802.1 × 10−30.300.730.05
3.310.0880.9655.2 × 10−30.571.520.10
3.420.0880.9657.7 × 10−30.581.410.10
3.530.0880.9655.4 × 10−30.591.540.10
Table 6. Optimized operating conditions of process parameters for a control strategy.
ParameterControl ParameterProposed Parameter Values
Specific glycerol uptake rate [g L−1 h−1 OD600−1]-8.0–16.0 × 10⁻³
Ammonium (NH4+) conc. feedRatio to glycerol [molN molgly−1]0.20–0.22
Phosphate (PO43−) conc. feedRatio to glycerol [molP molgly−1]0.003–0.004
Magnesium (Mg2+) conc. feedFeed concentration for:
MgSO4 × 7 H2O [g L−1]
0.26 (equals 2.16 mmol L−1)
Calcium (Ca2+) conc. feedFeed concentration for:
CaCl2 × 2 H2O [g L−1]
0.055 (equals 0.51 mmol L−1)
Dilution rate D [h−1]-0.2
Retention rate R [–]-0.98
NaCl [g L−1]-50–100
Publisher’s Note: MDPI stays neutral with regard to jurisdictional claims in published maps and institutional affiliations.

