Estimation of Forest Carbon Stocks for National Greenhouse Gas Inventory Reporting in South Korea


1
Division of Forest Industry, National Institute of Forest Science, 57 Hoegi-ro, Seoul 02455, Korea
2
Division of Forest Welfare, National Institute of Forest Science, 57 Hoegi-ro, Seoul 02455, Korea
3
Department of Environmental Science and Ecological Engineering, Graduate School, Korea University, 145 Anam-ro, Seoul 02841, Korea
4
Division of Global Forestry, National Institute of Forest Science, 57 Hoegi-ro, Seoul 02455, Korea
*
Author to whom correspondence should be addressed.
Forests 2018, 9(10), 625; https://doi.org/10.3390/f9100625
Submission received: 14 September 2018
/
Revised: 4 October 2018
/
Accepted: 5 October 2018
/
Published: 10 October 2018
(This article belongs to the Special Issue Disturbance Effects on Soil Carbon and Greenhouse Gas Emissions in Forest Ecosystems)
Abstract
:The development of country-specific emission factors in relation to the Agriculture, Forestry, and Other Land Use (AFOLU) sector has the potential to improve national greenhouse gas inventory systems. Forests are carbon sinks in the AFOLU that can play an important role in mitigating global climate change. According to the United Nations Framework Convention on Climate Change (UNFCCC), signatory countries must report forest carbon stocks, and the changes within them, using emission factors from the Intergovernmental Panel on Climate Change (IPCC) or from country-specific values. This study was conducted to estimate forests carbon stocks and to complement and improve the accuracy of national greenhouse gas inventory reporting in South Korea. We developed country-specific emissions factors and estimated carbon stocks and their changes using the different approaches and methods described by the IPCC (IPCCEF: IPCC default emission factors, CSFT: country-specific emission factors by forest type, and CSSP: country-specific emission factors by species). CSFT returned a result for carbon stocks that was 1.2 times higher than the value using IPCCEF. Using CSSP, CO2 removal was estimated to be 60,648 Gg CO2 per year with an uncertainty of 22%. Despite a reduction in total forest area, forests continued to store carbon and absorb CO2, owing to differences in the carbon storage capacities of different forest types and tree species. The results of this study will aid estimations of carbon stock changes and CO2 removal by forest type or species, and help to improve the completeness and accuracy of the national greenhouse gas inventory. Furthermore, our results provide important information for developing countries implementing Tier 2, the level national greenhouse gas inventory systems recommended by the IPCC.
1. Introduction
According to the United Nations Framework Convention on Climate Change (UNFCCC), all parties are obligated to submit annual national greenhouse gas inventory reports for all emissions and removals, including those associated with the Agriculture, Forestry, and Other Land Use sector (AFOLU). Specifically, the Paris Agreement states that “parties shall account for their Nationally Determined Contributions (NDC)” [1]. The mitigation contributions of parties (included in the NDCs) should be accounted for in the context of the Paris Agreement and are expected to be based on greenhouse gas inventory reporting methodology.
All countries have made efforts to improve inventory reporting systems and tier levels given respective national circumstances, in accordance with the principles of Transparency, Accuracy, Consistency, Comparability, and Completeness (TACCC) under the UNFCCC [1,2]. The Intergovernmental Panel on Climate Change (IPCC) guidelines provide three different tier levels for calculating the national greenhouse gas inventory, which relate to the activity data and emission factors in the AFOLU [2,3]. In general, using complementary data and moving to a methodology at higher tiers can improve the accuracy of the inventory and reduce uncertainty [2,3]. Most developing countries, including South Korea, have not been able to report on the carbon stocks from all carbon pools [4,5]. Estimating all carbon pools would represent a major improvement in completeness, which is linked to comparability and accuracy for national greenhouse gas inventory systems, and would also affect the greenhouse gas mitigation targets in NDC.
Dependent upon tree growth rate, forest ecosystems are able to remove CO2 from the atmosphere; as such, they are the largest terrestrial carbon sink [6]. For this reason, Annex I countries under the UNFCCC should report the national emissions and removal of greenhouse gases associated with the forest sector in AFOLU [2,7]. To calculate greenhouse gas emissions and their removal, national forest inventories (NFIs) represent a key source of information [8]. Although relatively few countries carry out NFIs more frequently than every 5 or even 10 years, the national reports normally rely on projected quantities of carbon emissions and removal from forests and land use change for the reporting period [9,10].
Forests cover 64% of the total land area in South Korea, and they play an important role in the mitigation of greenhouse gases through carbon sequestration [11,12]. South Korean forests were a carbon source releasing carbon at a rate of 0.5 Tg C year−1 during 1954–1973; however, they have been acting as carbon sinks with a carbon sequestration rate of 12.6 Tg C year−1 since 1974 [12]. The annual carbon balance of South Korean forests from 1954 to 2012 was 8.3 Tg C year−1 [12]. Studies into forest carbon stocks have been also conducted to establish the greenhouse gas inventory system of the forestry sector in South Korea. The South Korean national greenhouse gas inventory system is based on country-specific emission factors and activity data from NFIs and on official statistics by forest type [5]. To complement the national greenhouse gas inventory system and improve its accuracy, a number of studies have focused on the emission factors in all carbon pools in South Korea [13,14,15,16,17]; a few case studies have also estimated total carbon stocks at the national scale using modeling [12].
Owing partly to a limited range of activity data, previous studies have focused on the above and belowground biomass in South Korean forests [5]. The purpose of this study was to develop country-specific emission factors and to examine the methodology in order to enhance the completeness and accuracy of national greenhouse gas inventory reporting using those factors.
2. Materials and Methods
2.1. Estimating Country-Specific Emission Factors
In order to develop country-specific emission factor for biomass, soil, and litter, we distributed the number of samples in proportion of growing stock by tree species (Figures S1 and S2). The major tree species of Korea were selected and sampled. Red pine (Pinus densiflora Siebold & Zucc.), Oak (Quercus spp.), and Larch (Larix kaempferi (Lamb.) Carrière) were sampled from all over the country; Hinoki-cypress (Chamaecyparis obtuse (Siebold & Zucc.) Endl.), Japanese cedar (Cryptomeria japonica (Thunb. ex L. f.) D. Don), Black pine (Pinus thunbergii Parl.), and other species that are distributed locally, were collected from relevant regions. The carbon emission factors of the carbon pools (biomass, soil, and litter) in Korean forests were estimated from 226 sampling plots during the 2007–2015 period; each sampling plot had an area of 20 × 20 m. In total, 16 tree species were sampled, representing about 77% of the total growing stock in South Korean forests. We measured the height and diameter at breast height of selected sample trees from each plot. These trees were then divided into branches, leaves, twigs, and roots, after which their respective fresh weights were measured. From the 226 sampling plots, we additionally selected 119 plots to estimate soil and litter carbon stocks for eight tree species across South Korea. Litter samples included humus, fallen leaves, and twigs (smaller than 10 cm in diameter) [18]. Soil pits were dug at each sampling plot, and soil was sampled at depths of 0–10, 10–20, 20–30, and 30–50 cm [18]. Biomass, litter, and soil samples were brought to the laboratory for further analysis.
The dry mass of biomass and litter samples was measured after oven-drying at 85 °C at a constant weight. Soil samples from depths of 0–10 cm, 10–20 cm, 20–30 cm, and 30–50 cm were passed through a 2-mm sieve to remove coarse fragments and roots. Soil bulk density was estimated as the proportion of the dry mass of all mineral soils to the volume of the corer, while the coarse fregments content was estimated as the ratio between the dry mass of coarse fregments to mineral soils, both of which were based on the mass remaining after oven-drying at 105 °C. The carbon concentrations of the litter and mineral soil were determined using an elemental analyzer (vario Macro, Elementar Analysensysteme GmbH, Langenselbold, Germany). Biomass emission factors such as basic wood density (WD), biomass expansion factors (BEF), and the root to shoot ratio (R) were calculated using the dry mass, fresh mass, and volume. The WD was calculated as the ratio of dry-weight to fresh volume using the water displacement method [18]. The BEF was calculated as the ratio of aboveground biomass (stem, branches, leaves, and twigs) to the stem biomass. The R was calculated as the ratio of root biomass to aboveground biomass [18]. Litter carbon stocks (C ton/ha) were calculated using the dry mass multiplied by carbon concentration, and mineral soil carbon stocks (C ton/ha) were calculated as the sum of each soil depth multiplied by bulk density, coarse fregments content, and carbon concentration [18]. However, the country-specific emission factors for deadwood carbon stocks were calculated as the volume of the residences and tree mortality from the NFI data, multiplied by carbon conversion factors from previous studies in South Korea [19,20]. Uncertainty analysis was calculated using the error propagation equation from the IPCC guidelines [3];
where is the width of the 95% confidence interval and μ is the mean value following the IPCC methodology [3]. Emission factors of other coniferous forest and other deciduous forest except for deadwood carbon stocks were calculated by weighted average using the growing stock proportions in South Korean forest.
2.2. Estimating Carbon Stocks in Biomass, Soil, and Dead Organic Matter
We adopted three different approaches for estimating carbon stocks. The first approach (IPCCEF) was applied according to IPCC default emission factors, where it is assumed that soil and dead organic matter do not change with forest management, forest type, or disturbance regime. The second approach (CSFT) was applied according to country-specific emission factors in regard to forest type, while the third approach (CSSP) was applied according to country-specific emission factors for tree species (Table 1).
In the case of IPCCEF and CSFT, forest areas and growing stocks were taken from national greenhouse gas inventory reports [5], after which the carbon stocks in above and belowground biomass, soil, litter, and deadwood were calculated using IPCC default emission factors for coniferous species (WD: 0.49, BEF: 1.30, and R: 0.32), deciduous species (WD: 0.58, BEF: 1.40, and R: 0.26), and carbon fraction (0.50) [3], along with country-specific emission factors developed by this study. If there was no country-specific emission factor by tree species, we applied emission factors of other coniferous or deciduous forests by tree species.
On the other hand, NFI data was used for CSSP because official statistics for the growing stocks of tree species do not currently exist. The NFI provides data on merchantable growing stocks and the number of points for each tree species, while data on whole-tree biomass is needed to estimate biomass carbon pools. Specifically, we used data from the 5th and 6th NFI, which were conducted between 2006–2010 and 2011–2015, respectively, and included a nationally consistent sampling frame and plot design (Figure 1). In reference to the 6th NFI, 149 plots were not resampled at the original plots from the 5th NFI; however, 430 new plots were established for sampling. In order to estimate the area of forest types and tree species, we used the proportions of the sub-points in the specific stand for each species, multiplied by the known land area:
where Ah is the total area by tree species; A is the forest area on the basis of the official statistics of the Korea Forest Service (KFS) and Greenhouse Gas Inventory and Research Center of Korea (GIR) [5,21,22]; is the proportion of points that are of h; n is the number of total points for forest types; is the number of points for ; and is the tree species. The area of mixed forest was divided into ‘other coniferous’ and ‘other deciduous’ forests. The total growing stocks of each species was calculated using the growing stocks per ha and the species area, while the total growing stock was stratified by random sampling of each species.
Total carbon stocks in biomass were calculated using area, growing stocks, biomass expansion factors, basic wood density, and the root to shoot ratio; total carbon stocks in soil and dead organic matter were calculated as the area multiplied by their carbon stocks (C ton/ha) developed by this study [3]. Annual changes in biomass, soil, and dead organic matter were estimated using the IPCC stock changes method [3]. Specifically, the IPCC stipulates that the activity data for soil and dead organic matter have a transition period of 20 years [3]; in other words, the forest area for estimated carbon stocks should remain constant over a 20-year period. As the forest area in our study has decreased since 1970, we assumed that the forest area in the base year was equal to that of 20 years ago. Uncertainty was calculated using the error propagation equation in accordance with IPCC guidelines [3]. The uncertainty in tree growing stocks from official statistics assumes 0.05% from the previous study, while the uncertainty in IPCC default values is assumed to be 50% [3,11]. All statistical analyses were conducted using the proc GLM procedures of the SAS 9.4 software. And Tukey’s HSD test was used to identify the significantly different means (p < 0.05).
3. Results
3.1. Estimation of Country-Specific Emission Factors
Emission factors for each carbon pool are shown in Table 2 and Table 3. The biomass, calculated as basic wood density (WD, expressed in t dry matter/m3), ranged from 0.35 to 0.50 for coniferous species and from 0.46 to 0.83 for deciduous species. Deciduous species generally had higher basic wood density than coniferous species (Table 2). Basic wood density was highest for Q. acuta, a deciduous species, and lowest for C. japonica, a coniferous species (Table 2). Biomass expansion factors (BEF) ranged from 1.31 to 1.74 for coniferous species, and from 1.24 to 1.70 for deciduous species. The root to shoot ratio (R) ranged from 0.20 to 0.36 for coniferous species and from 0.19 to 0.48 for deciduous species (Table 2).
Coniferous species generally had higher litter carbon stocks than deciduous species (P < 0.05), while mineral soil carbon stocks were lower in coniferous forest than in deciduous forest (P > 0.05; Table 3). However, there was no difference in deadwood carbon stocks between coniferous forest and deciduous forest (Table 3).
Uncertainty in emission factors for biomass ranged from 2% to 12% for WD, 4% to 16% for BEF, and 6% to 33% for R, respectively. Uncertainty for carbon stocks in soil, litter, and deadwood ranged from 27% to 41%, 16% to 27%, and 8% to 1211%, respectively. Soil and dead organic matter had higher uncertainties than biomass; in particular, the uncertainty in deadwood had a large variation owing to lack of NFI sampling points for some tree species.
3.2. Estimation of Forest Area and Growing Stock by Tree Species
The estimated forest areas and growing stocks from the 5th NFI and 6th NFI are shown in Table 3. The estimated forest areas (1000 ha) in 2010 were 2581 for coniferous forest, 1865 mixed forest, and 1719 for deciduous forest; the estimated forest areas (1000 ha) for 2015 were 2339 for coniferous forest, 1706 for mixed forest, and 2029 for deciduous forest. Coniferous and mixed forests were converted to deciduous forest, with conversion rates of 9.36% and 8.53%, respectively. The conversion rate of forest area comprised of coniferous species was highest for P. rigida, followed by P. densiflora (Gangwon), and L. kaempferi (Table 3). The growing stock showed increases for all forest types, despite the reduction in forest area over the last five years. The estimated growing stock increased from 832 to 970 M m3 during the research period (2010–2015), while according to official statistics, South Korean forests increased from 800 to 925 M m3 during the same period (Table 4). The change in growing stock ranged from −6 M m3 (P. rigida) to 15 M m3 (P. densiflora [Jungbu]) for coniferous species, and from 0.07 M m3 (Q. acuta) to 62 M m3 (other deciduous forest) for deciduous species (Table 4).
3.3. Estimation of Carbon Stocks and Their Changes in Biomass, Litter, Deadwood, and Soil
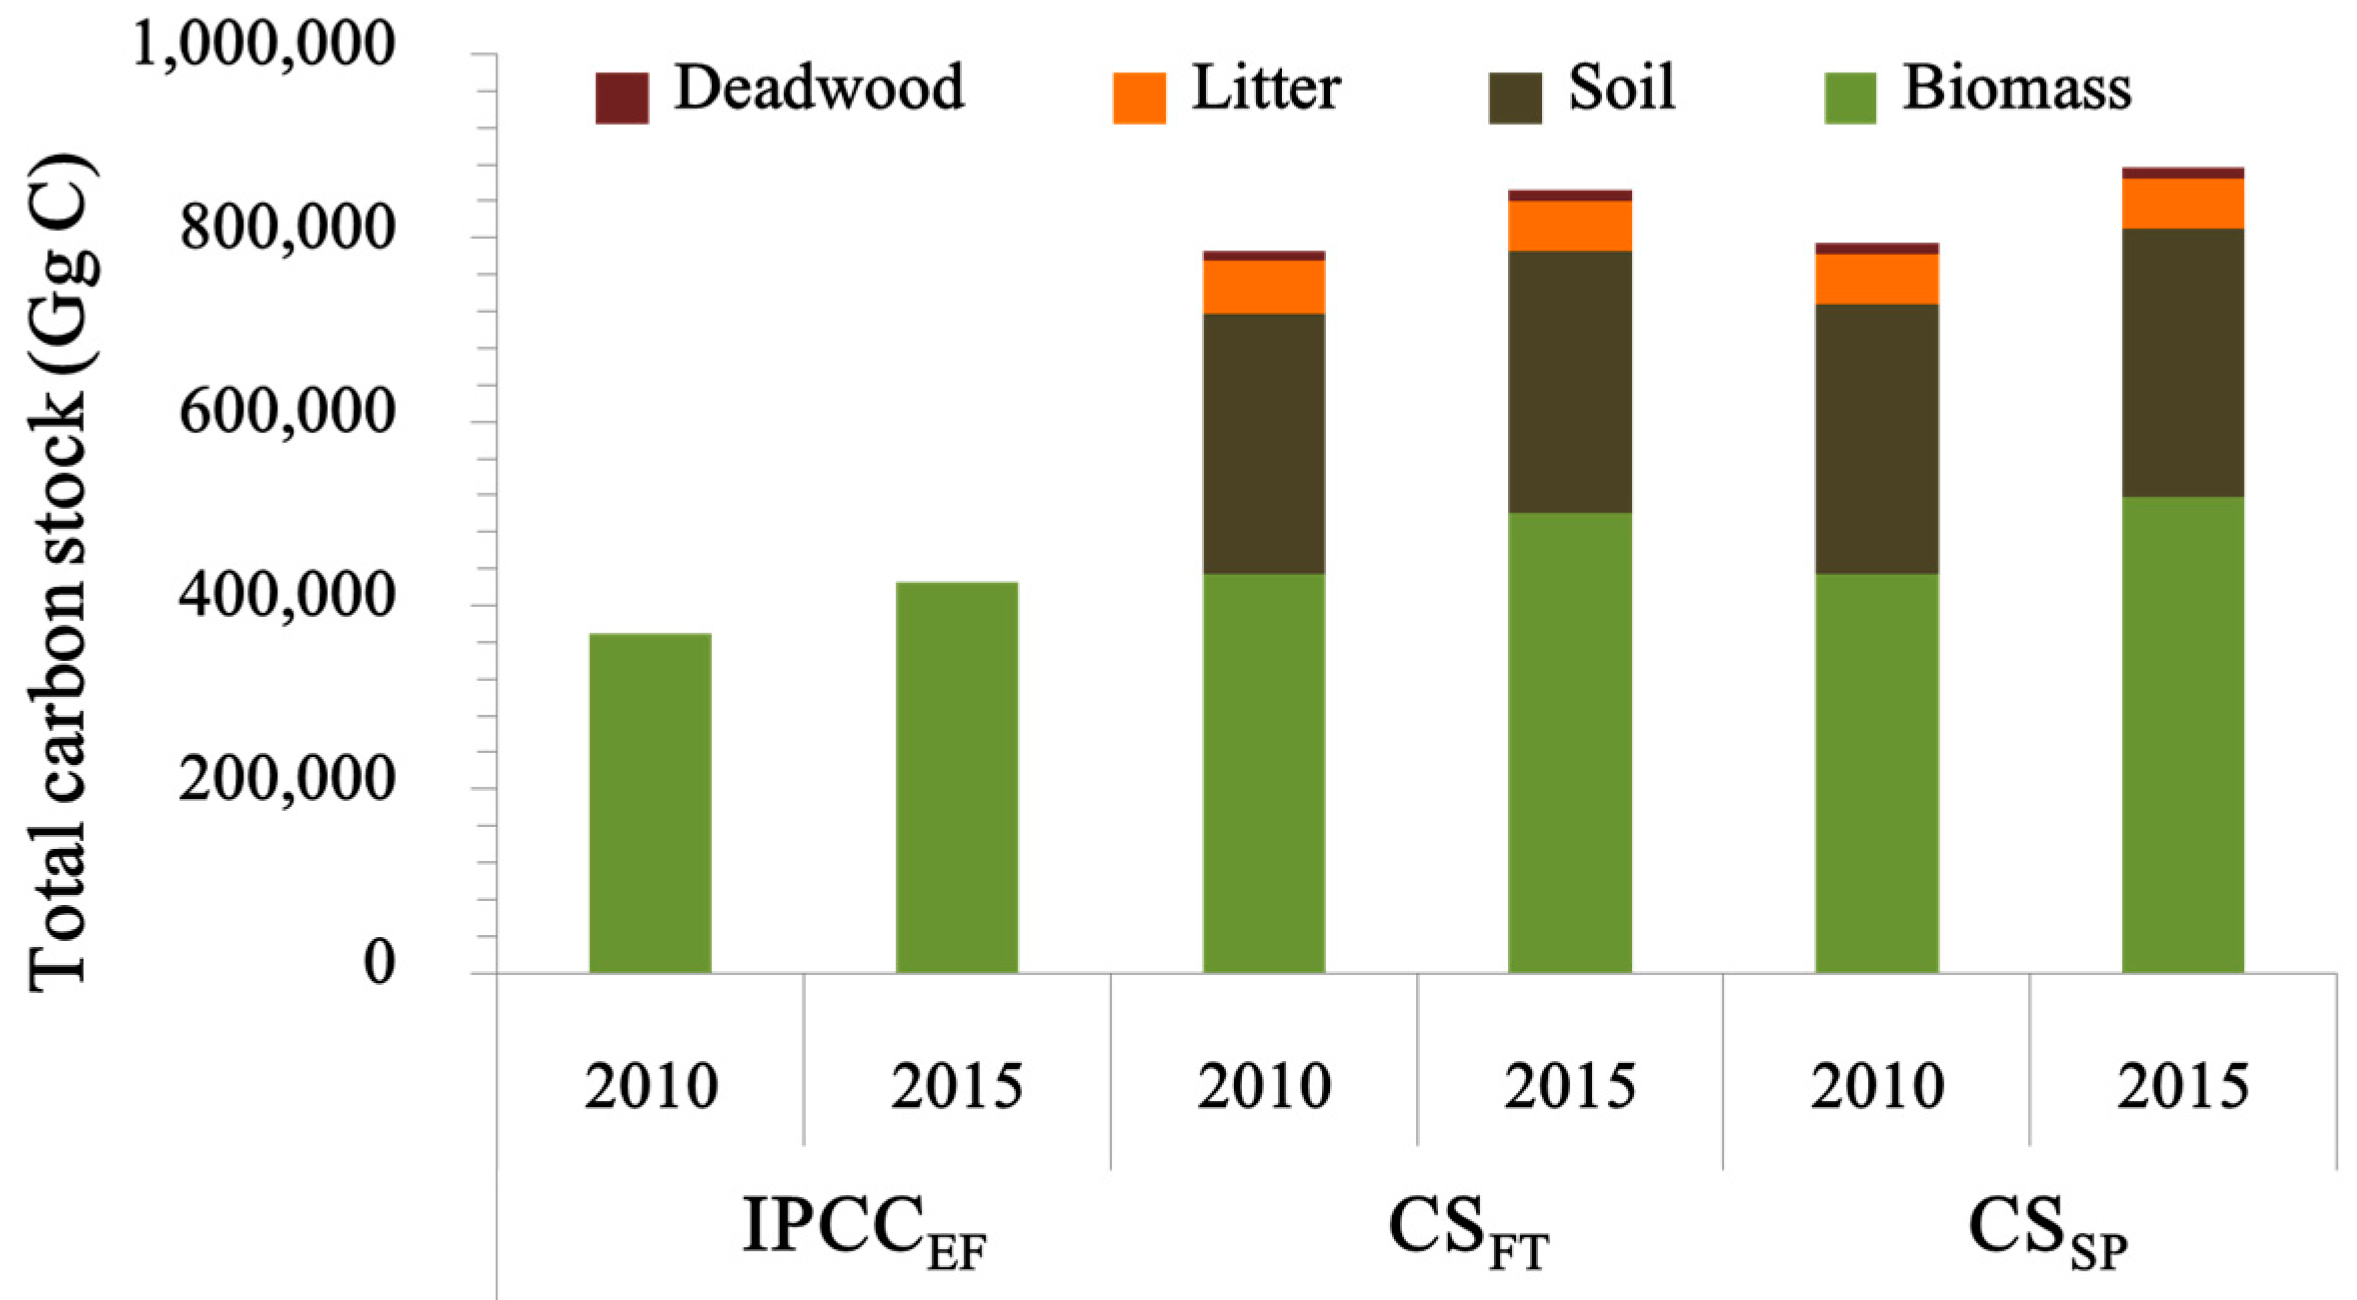
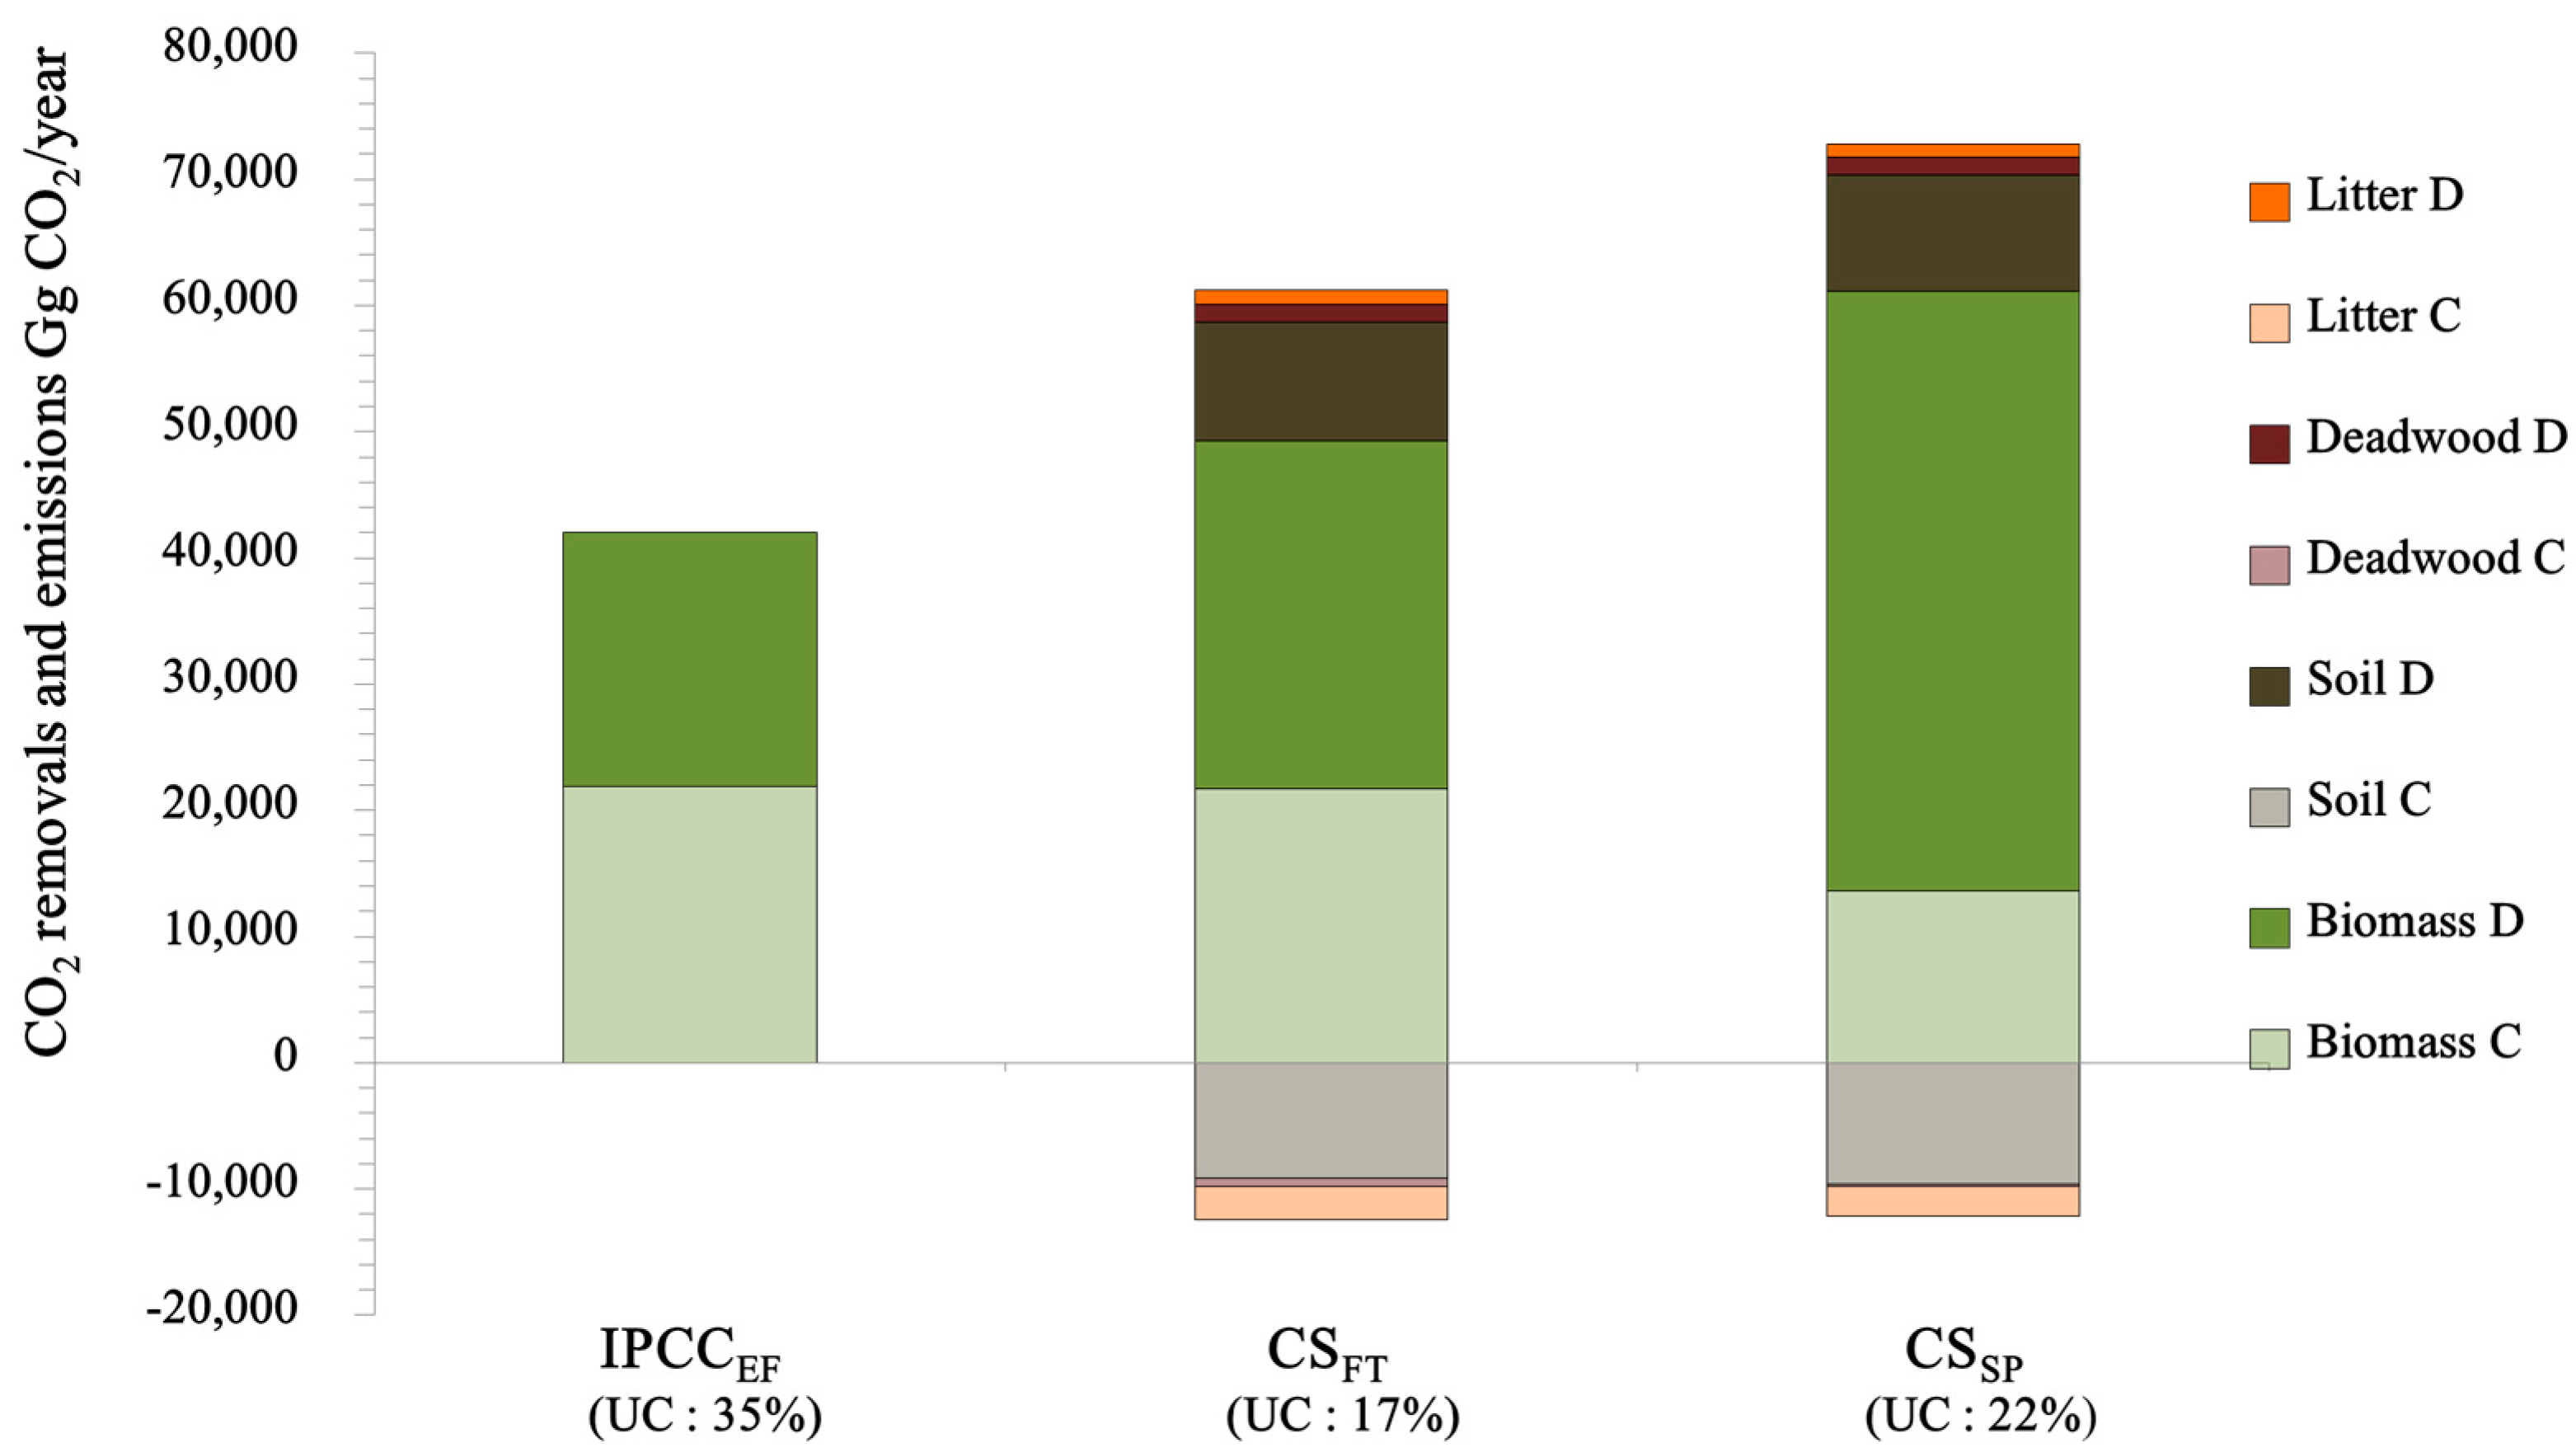
The estimated carbon stocks and their changes from 2010 to 2015 are shown in Figure 2. Applying IPCC default emission factors (IPCCEF) demonstrated that carbon stocks increased by 57,363 Gg C (15.99%) from 2010 to 2015, with an increase of 15.55% in deciduous forests and 15.11% in coniferous forests (Figure 2). Our estimation of CO2 removal was 42,067 Gg CO2 per year, with an uncertainty of 35%. Furthermore, in applying IPCC default emission factors, we assumed that the soil and dead organic matter did not change [3]. Applying country-specific emission factors by forest type (CSFT), total carbon stocks increased by 66,569 Gg C (8.47%) from 2010 to 2015, with increases of 15.48%, 0.13%, and 9.32% for biomass, soil, and deadwood, respectively, and a decrease of 3.65% for litter. Additionally, the estimation of CO2 removal was 48,817 Gg CO2 per year with an uncertainty of 17% (Figure 3); this CO2 removal value was about 1.16 times that of IPCCEF, which only estimates biomass using the IPCC default emission factors.
In terms of country-specific emission factors by tree species (CSSP), total carbon stocks were increased by 82,702 Gg C (10.41%) from 2010 to 2015 (Figure 2). The carbon pools in biomass and dead wood increased by 19.20% and 14.67%, respectively, while those in litter and soil decreased by 3.17% and 0.21%, respectively. These results indicated a higher total carbon stock than CSFT, despite the reduction of carbon stocks in litter and soil with CSSP. The total carbon stocks of the tree species increased, with the exception of P. densiflora (Gangwon), P. densiflora (Jungbu), P. rigida, and L. kaempferi in coniferous forests, and Q. mongolica in deciduous forests. The CO2 removal for CSSP was 60,648 Gg CO2, with an uncertainty of 22% (Figure 3). Estimated by species (CSSP), CO2 removal value was about 1.24 times greater than that estimated by forest type (CSFT).
4. Discussion
4.1. Development and Implications of Country-Specific Emission Factors
Using country-specific emission factors can complement other methods of national greenhouse gas inventory reporting and thereby offer improved accuracy. The IPCC [3] report a basic wood density (D) that ranges from 0.31 to 0.49 for coniferous species and 0.35 to 0.58 for deciduous species; however, our results yielded a basic wood density for deciduous forest that ranged from 0.46 to 0.83. Similarly, Kim et al. [23] found that the basic wood density of deciduous species ranged from 0.58 to 0.88 in Korean forests. Past studies have consistently found that basic wood density is higher in deciduous forests than in coniferous forests [3,23,24]. In the IPCC guidelines, the BEF ranges from 1.15 to 4.2 for coniferous species and from 1.15 to 3.2 for deciduous species in temperate regions. Although the IPCC and some other studies have found that BEF can depend on stand age and structure [3,24,25,26], we did not consider stand age in this study because other researchers have reported that BEF is not dependent upon stand age, but instead reflects stand density, which affects crown density [27,28]. Our results for R were also similar to those from previous studies at global and regional scales [3,23,28]. Additionally, the IPCC [3] report R ranges of 0.23–0.46 for coniferous species and 0.24–0.45 for deciduous species.
The IPCC guidelines do not stipulate default values in regard to the carbon stock of soil and dead organic matter, which do not change in the Tier 1 method; therefore, comparison with our results was not possible. The litter carbon stock was similar to the ranges indicated by previous studies focused on Korean forests; for example, Kim et al. [29] reported that the litter carbon stock (Mg C/ha) in Korean forests ranges from 6.7 to 8.5 for pine forests, 4.6 to 5.0 for oak forests, and 6.5 to 7.0 for larch forests [29]. Other studies have reported litter carbon stocks of 7.2 for coniferous forests and 4.8 for deciduous forests at the national scale [11], as litter carbon stocks are generally given to be higher for coniferous species than for deciduous species [11,29]. Furthermore, the literature shows that litter carbon stock is influenced by the varying composition and decomposition rates of different species [30,31]. Our study showed that litter carbon stock was highest for P. densiflora (Jungbu) in coniferous species. Moreover, we found that there was a large degree of variation between forests in terms of soil and deadwood carbon stocks. Another study focusing on L. kaempferi reported that carbon stocks (t C/ha) ranged from 45.43 to 165.48 in soil and from 0.1 to 3.4 in deadwood [32]; another study reported that soil carbon stocks were 83.2 t C/ha in deciduous forests and 59.1 t C/ha in coniferous forests at the national scale [11]. Although there was a large degree of variation in the carbon stock values for soil and dead organic matter, our results are nevertheless within the range of results from previous studies. Furthermore, our results have been verified by GIR for the period 2013 to 2017, except for carbon stocks in deadwood, and this implies that the results are appropriate for use as country-specific emission factors in South Korea.
Most of the uncertainty levels for the emission factors of each carbon pool, except for deadwood, were estimated to be in the range of 10 to 40%, which is consistent with findings from previous studies [3,33]. The uncertainty levels for the deadwood were high in Q. acuta due to small sampling plots from NFI as Q. acuta occupied a small area in South Korea. In the EU, most countries use emission factors constructed from country-specific studies, although other countries continue to apply international studies or IPCC default emission factors. This trend is promising, as country-specific studies lead to more accurate estimations of carbon stocks in comparison with the use of IPCC default emission factors [34]. Additionally, it is difficult to estimate uncertainty when using IPCC default emission factors, due to the lack of statistical information. However, if country-specific emission factors are used, the uncertainty surrounding emission factors can be estimated. Therefore, it is considered good practice that countries use country-specific emission factors for national greenhouse gas inventory reporting [3].
4.2. Carbon Stocks and Their Changes for Use in National Greenhouse Gas Inventory Reporting
In this study, we estimated the carbon stocks in biomass, soil, litter, and deadwood for use in national greenhouse gas inventory reporting. The removal amount (expressed in Gg CO2) varied from 42,067 to 60,648 per year, depending upon which of the three approaches was used. These results—specifically the increase of total carbon stocks in biomass and deadwood, which accounted for more than 50% of forest carbon storage—have shown that South Korean forests have stored carbon and absorbed CO2. According to the NFI survey period, the age class was found to have increased [35], which would have affected the carbon stocks of biomass and deadwood, consistent with findings from studies based on forests in China and the US [36,37]. Large stocks of woody debris commonly occur in mature forests that have a large amount of living biomass [38]. However, forest age is also expected to affect the amount of woody debris at the local scale, and often a greater amount of woody debris is found in young growth stands than in other stands [39].
The CO2 removal based on the CSFT was about 1.16 times higher than that based on the IPCCEF. The application of country-specific emission factors would reflect national circumstances [2] and improve accuracy over IPCC default emission factors, despite differences in previously reported CO2 removal rates (48,507 Gg CO2 per year) for forests [5]. These differences are due to the estimate of all carbon pools when estimating carbon stocks in Korean forests. We estimated soil and dead organic matter using the country-specific emission factors and NFI data as a way to improve the completeness of the national greenhouse gas inventory system for the forest sector. In terms of methodology, this difference might be due to using three year moving average data [2,3,5] in contrast to this study, which used single year data.
The application of country-specific emission factors for each species (CSSP) yielded different results from the application of country-specific emission factors for forest type (CSFT). These differences were reflected in changes of area for each species and differences in their carbon stocks from NFI data. In particular, the total growing stock for P. rigida has decreased during last five years, consistent with reporting that area of P. rigida has decreased owing to age [40]. The species also has high biomass emission factors, which would have an effect on the overall amount of CO2 removal (Table 2).
According to the IPCC, the CSFT and CSSP approaches represent higher-level inventory reporting systems than the IPCCEF, which lacks the accuracy and completeness of CSFT and CSSP. The CSFT estimate reflects a simple difference between two forest types, whereas the CSSP is based on several consecutive change estimates from permanent plots by species. The use of CSSP would improve accuracy in regard to growing stock, as in the case of Finland [9]. Most EU countries could use their NFIs, which provide information on aboveground biomass [34]. Aboveground biomass is derived from growing stock, which is collected by NFIs. Additionally, other carbon pools may also be based on the data collected in NFIs.
The CS approach has lower uncertainty that does the IPCC approach. While the CSSP approach has higher uncertainty that does the CSFT approach, the uncertainty is in regard to precision rather than accuracy [3,41]. The total uncertainty of net CO2 removal was high owing to the high uncertainty of soil and dead organic matter despite the low uncertainty in biomass. The CSSP, which appears to be a more complementary and accurate estimation method, includes the estimation of carbon stock changes by tree species. With increasing coverage of the inventory, there is increasing accuracy in terms of the estimated total greenhouse gas emissions, even though the precision of estimated of net emissions might decrease [41].
In order to achieve accuracy and completeness, Annex I countries should also report CO2 removals and emissions for all carbon pools using country-specific emission factors and models [9,42]. The results of this study are applicable to the improvement of greenhouse gas inventory systems in regard to domestic forests; furthermore, they provide information in regard to greenhouse gas inventory methodology to countries that do not yet have country-specific emission factors. However, it is also necessary to review the Tier 3–level reporting detailed in the UNFCCC report. In addition, an annual land-use change matrix should be established to improve the accounting of changes in carbon stocks for national greenhouse gas inventory systems.
5. Conclusions
The purpose of this study was to examine the methodology for enhancing the completeness and accuracy of national greenhouse gas inventory reporting using Korean forest survey data. The application of country-specific emission factors gave an estimated CO2 removal value that was 1.2 times greater than for the IPCC default emission factors. In order to improve completeness and accuracy, we estimated CO2 absorption by all carbon pools and each tree species, which gave a result of 60,648 Gg CO2 per year with 22% uncertainty. Despite the reduction in total forest area, forests still store carbon and absorb CO2 owing to differences in the carbon storage capacities of several species. Our results will aid in the development of South Korea’s greenhouse gas inventory systems—or those of countries without country-specific emission factors—by improving the calculation of carbon stocks and CO2 removal by species. However, it would be necessary to construct a land use change matrix, after which our study would be useful for the implementation of Tier 2–level national greenhouse gas inventory systems, as recommended by the IPCC.
Supplementary Materials
The following are available online at https://www.mdpi.com/1999-4907/9/10/625/s1, Figure S1: Location of studied sites for emission factor in biomass, soil, and litter by coniferous species; Figure S2: Location of studied sites for emission factor in biomass, soil, and litter by deciduous species.
Author Contributions
S.J.L., Y.M.S., Y.S., and R.K. conceived and designed the study; S.J.L. J.S.Y., and R.K. analyzed the data; S.J.L. and R.K. wrote the paper.
Funding
This research was funded by Korea Forest Service (Korea Forestry Promotion Institute), grant number (2017044C10-1819-BB01).
Acknowledgments
This study was carried out with support from the R&D Program for Forest Science Technology (Project No. 2017044C10-1819-BB01) provided by the Korea Forest Service (Korea Forestry Promotion Institute).
Conflicts of Interest
The authors declare no conflict of interest.
References
- UNFCCC. The Paris Agreement. 2015. Available online: https://unfccc.int/process-and-meetings/the-paris-agreement/the-paris-agreement (accessed on 28 September 2018).
- IPCC. IPCC Guidelines for National Greenhouse Gas Inventory; IPCC/IGES: Hayama, Japan, 2006. [Google Scholar]
- IPCC. Good Practice Guidance for Land Use, Land-Use Change and Forestry; IPCC/IGES: Hayama, Japan, 2003. [Google Scholar]
- FAO (Food and Agriculture organization). Estimating Greenhouse Gas Emissions in Agriculture; FAO: Rome, Italy, 2015. [Google Scholar]
- GIR (Greenhouse Gas Inventory and Research Center of Korea). National Greenhouse Gas Inventory Report 2017; GIR: Seoul, Korea, 2017. [Google Scholar]
- Pan, Y.; Birdsey, R.A.; Fang, J.; Houghton, R.; Kauppi, P.E.; Kurz, W.A.; Phillips, O.L.; Shvidenko, A.; Lewis, S.L.; Canadell, J.G.; et al. A large and persistent carbon sink in the world’s forests. Science 2011, 333, 988–993. [Google Scholar] [CrossRef] [PubMed]
- UNFCCC. COP 15 2009. Available online: https://unfccc.int/meetings/copenhagen_dec_2009/session/6262/php/view/decisions.php (accessed on 28 September 2018).
- Baritz, R.; Strich, S. Forests and the national greenhouse gas inventory of Germany. Biotechnol. Agron. Soc. Environ. 2000, 4, 265–271. [Google Scholar]
- Statistics Finland. Greenhouse Gas Emissions in Finland 1990∼2013; Statistics Finland: Helsinki, Finland, 2015. [Google Scholar]
- Federal Environment Agency. Submission under the United Nations Framework Convention on Climate Change and the Kyoto Protocol 2015; Federal Environment Agency: Dessau, Germany, 2015. [Google Scholar]
- KFS (Korea Forest Service); Kofpi (Korea Forestry Promotion Institute). Assessment of the Korea’s Forest Resource; Kopfi: Seoul, Korea, 2013. [Google Scholar]
- Lee, J.; Yoon, T.K.; Han, S.; Kim, S.; Yi, M.J.; Park, G.S.; Kim, C.; Son, Y.M.; Kim, R.; Son, Y. Estimating the carbon dynamics of South Korean forests from 1954 to 2012. Biogeoscience 2014, 11, 4637–4650. [Google Scholar] [CrossRef] [Green Version]
- Son, Y.M.; Kim, R.H.; Kang, J.T.; Lee, K.S.; Kim, S.W. A practical application and development of carbon emission factors. J. Korean For. Soc. 2014, 103, 593–598. [Google Scholar] [CrossRef]
- Son, Y.M.; Kim, R.H.; Lee, K.H.; Pyo, J.K.; Kim, S.W.; Hwang, J.S.; Lee, S.J.; Park, H. Carbon Emission Factors and Biomass Allometric Equations by Species in Korea; KFRI: Seoul, Korea, 2014. [Google Scholar]
- Lee, S.J.; Yim, J.S.; Kang, J.T.; Kim, R.; Son, Y.; Park, G.W.; Son, Y.M. Application and development of carbon emissions factors for deciduous species in Republic of Korea—Robinia pseudoacacia, Betula platyphylla, and Liriodendron tulipifera. J. Clim. Chang. Res. 2017, 8, 393–399. [Google Scholar] [CrossRef]
- Pyo, J.K.; Son, Y.M.; Lee, K.H.; Kim, R.H.; Kim, Y.H.; Lee, Y.J. Estimating the uncertainty and validation of basic wood density for Pinus densiflora in Korea. J. Korean For. Soc. 2010, 99, 929–933. [Google Scholar]
- Pyo, J.K.; Son, Y.M.; Jang, G.M.; Lee, Y.J. Uncertainty assessment of emission fators for Pinus densiflora unsung Monte Carlo simulation technique. J. Korean For. Soc. 2013, 102, 477–483. [Google Scholar] [CrossRef]
- KFRI (Korea Forest Research Institute). Survey Manual for Biomass and Soil Carbon; KFRI: Seoul, Korea, 2010. [Google Scholar]
- Yoon, T.K.; Chung, H.; Kim, R.H.; Noh, N.J.; Seo, K.W.; Lee, S.K.; Jo, W.; Son, Y. Coarse woody debris mass dynamics in temperate natural forests of Mt. Jumbong, Korea. J. Ecol. Field Biol. 2011, 34, 115–125. [Google Scholar] [CrossRef]
- KFS (Korea Forest Service). Improvement of Forest Carbon Accounting System for Post 2020 Climate Change Regime; KFS: Daejeon, Korea, 2016. [Google Scholar]
- KFS (Korea Forest Service). Statistical Yearbook of Forest; KFS: Daejeon, Korea, 2016. [Google Scholar]
- KFS (Korea Forest Service). Statistical Yearbook of Forest; KFS: Daejeon, Korea, 2011. [Google Scholar]
- Kim, H.; Kim, H.J.; Lee, K.H.; Son, Y.M.; Lee, K.S.; Lee, S.H. Biomass conversion factors for tree species and verification of applicability for national factors in Korea. J. Korean Soc. Appl. Biol. Chem. 2011, 54, 758–762. [Google Scholar] [CrossRef]
- Lehtonen, A.; Mäkipää, R.; Heikkinen, J.; Sievänen, R.; Liski, J. Biomass expansion factor (BEFs) for Scote pine, Norway spruce and birch according to stand age for boreal forests. For. Ecol. Manag. 2004, 188, 211–224. [Google Scholar] [CrossRef]
- Van Camp, N.; Walle, I.V.; Mertens, J.; De Neve, S.; Samson, R.; Lust, N.; Lemeur, R.; Boeckx, P.; Lootens, P.; Beheydt, D.; et al. Inventory-based carbon stock of Flemish forests: A comparison of European biomass expansion factors. Ann. For. Sci. 2004, 61, 677–682. [Google Scholar] [CrossRef]
- Seo, Y.O.; Lee, Y.J.; Pyo, J.K.; Kim, R.; Son, Y.M.; Lee, K.H. Uncertainty analysis of stem density and biomass expansion factor for Pinus rigida in Korea. J. Korean For. Soc. 2011, 100, 149–153. [Google Scholar]
- Kim, C.; Lee, K.S.; Son, Y.M.; Cho, H.S. Allometric equations and biomass expansion factors in and age-sequence of black pine (Pinus thunbergii) stands. J. Korean For. Soc. 2013, 102, 543–549. [Google Scholar] [CrossRef]
- Noh, N.J.; Son, Y.; Kim, J.S.; Kim, R.; Seo, K.Y.; Seo, K.W.; Koo, J.W.; Kyung, J.H.; Park, I.H.; Lee, Y.J.; et al. A study on estimation of biomass, stem density and biomass expansion factor for stand age class of Japanese larch (Larix leptolepis) stands in Gapyeong area. J. Korean For. Environ. 2006, 25, 1–8. [Google Scholar]
- Kim, S.; Kim, C.; Han, S.H.; Lee, S.T.; Son, Y. A multi-site approach toward assessing the effect of thinning on soil carbon contents across temperature pine, oak, and larch forests. For. Ecol. Manag. 2018, 424, 62–70. [Google Scholar] [CrossRef]
- Berg, B. Litter decomposition and organic matter turn-over in northern forest soils. For. Ecol. Manag. 2000, 133, 13–22. [Google Scholar] [CrossRef]
- Schulp, C.J.E.; Nabuurs, G.; Verburg, P.H.; Waal, R.W. Effect of tree species on carbon stocks in forest floor and mineral soil and implication for soil carbon inventories. For. Ecol. Manag. 2008, 256, 482–490. [Google Scholar] [CrossRef]
- Ko, S. Influence of Thinning on Carbon Storage in Soil, Forest Floor and Coarse Woody Debris of Larix kaempferi Stands in Korea; Korea University: Seoul, Korea, 2013. [Google Scholar]
- FAO (Food and Agriculture organization). Global Forest Resource Assessment 2005; FAO: Rome, Italy, 2006. [Google Scholar]
- Cienciala, E.; Tomppo, E.; Snorrason, A.; Broadmeadow, M.; Colin, A.; Dunger, K.; Exnerova, Z.; Lasserre, B.; Petersson, H.; Privitzer, T.; et al. Preparing emission reporting from forests: Use of national forest inventories in European countries. Silva Fennica 2007, 42, 73–88. [Google Scholar] [CrossRef]
- KFS (Korea Forest Service); Kofpi (Korea Forestry Promotion Institute). Assessment of the Korea’s Forest Resources; Kofpi: Seoul, Korea, 2017. [Google Scholar]
- Woodall, C.W.; Balters, B.F.; Oswalt, S.N.; Domke, G.M.; Toney, C.; Gray, A.N. Biomass and carbon attributes of downed woody materials in forests of the United States. Forest. Ecol. Manag. 2013, 305, 48–59. [Google Scholar] [CrossRef]
- Zhu, J.; Hu, H.; Tao, S.; Chi, X.; Li, P.; Jiang, L.; Ji, C.; Zhu, J.; Tang, Z.; Pan, Y.; et al. Carbon stocks and changes of dead organic matter in China’s forests. Nat. Commun. 2017, 8, 151. [Google Scholar] [CrossRef] [PubMed]
- Smith, J.E.; Heath, L.S.; Skog, K.E.; Birdsey, R.A. Methods of Calculating Forest Ecosystem and Harvested Carbon with Standard Estimates for Forests Types of the United State; USDA: Newtown Square, PA, USA, 2006. [Google Scholar]
- Coomes, D.A.; Allen, R.B. Effect of size, competition and altitude on tree growth. J. Ecol. 2007, 95, 1084–1097. [Google Scholar] [CrossRef]
- Seo, Y.O.; Jung, S.C.; Lee, Y.J. Estimation of carbon storage for Pinus rigida stands in Muju. Korean J. Environ. Ecol. 2016, 30, 399–405. [Google Scholar] [CrossRef]
- Monni, S.; Peltoniemi, M.; Palosuo, T.; Lehtonen, A.; Mäkipää, R.; Savolainen, I. Uncertainty of forest carbon stock changes—Implications to total uncertainty of GHG inventory of Finland. Clim. Chang. 2007, 81, 391–413. [Google Scholar] [CrossRef]
- Swedish Environmental Protection Agency. National Inventory Report 2015 Sweden; Swedish Environmental Protection Agency: Stockholm, Sweden, 2015.
Figure 1.
Permanent sample plots in the South Korean National Forest Inventory (NFI).

Figure 2.
Total carbon stock in each approach. IPCCEF: Intergovernmental Panel on Climate Change (IPCC) default emission factors, CSFT: country-specific emission factors by forest type, CSSP: country-specific emission factors by species.
Figure 2.
Total carbon stock in each approach. IPCCEF: Intergovernmental Panel on Climate Change (IPCC) default emission factors, CSFT: country-specific emission factors by forest type, CSSP: country-specific emission factors by species.

Figure 3.
CO2 removals (+) and emissions (−), and their uncertainty (UC) in each approach. C: coniferous forest, D: deciduous forest, IPCCEF: Intergovernmental Panel on Climate Change (IPCC) default emission factors, CSFT: country-specific emission factors by forest type, CSSP: country-specific emission factors by species.


Table 1.
Three approaches for carbon stock estimation.
| Resolution | Forest Type | Species | |
|---|---|---|---|
| Approach | IPCCEF | CSFT | CSSP |
| Biomass | E | E | E |
| Litter | NE | E | E |
| Soil | NE | E | E |
| Deadwood | NE | E | E |
IPCCEF: Intergovernmental Panel on Climate Change (IPCC) default emission factors, CSFT: country-specific emission factors by forest type, CSSP: country-specific emission factors by species, E: estimated, NE: not estimated.
Table 2.
Country-specific emission factors for biomass by tree species.
| Forest Type | Species | WD (t dry matter/m3) | BEF | R |
|---|---|---|---|---|
| Coniferous forest | Chamaecyparis obtusa | 0.43 (4%) fg | 1.35 (9%) cd | 0.20 (33%) e |
| Cryptomeria japonica | 0.35 (4%) h | 1.31 (6%) cd | 0.23 (12%) de | |
| Larix kaempferi | 0.45 (6%) efg | 1.34 (8%) cd | 0.29 (15%) bcde | |
| Pinus densiflora (Gangwon) | 0.42 (12%) fg | 1.48 (12%) abcd | 0.26 (14%) cde | |
| P. densiflora (Jungbu) | 0.47 (4%) efg | 1.41 (6%) bcd | 0.25 (6%) cde | |
| P. koraiensis | 0.41 (6%) hg | 1.74 (13%) a | 0.28 (14%) cde | |
| P. rigida | 0.50 (4%) de | 1.33 (12%) cd | 0.36 (29%) bcd | |
| P. thunbergii | 0.48 (6%) ef | 1.52 (13%) abcd | 0.29 (19%) bcde | |
| Other coniferous forest | 0.46 (6%) | 1.43 (8%) | 0.27 (13%) | |
| Deciduous forest | Betula platyphylla | 0.55 (4%) d | 1.30 (6%) cd | 0.29 (16%) bcde |
| Liriodendron tulipifera | 0.46 (10%) efg | 1.24 (6%) d | 0.23 (27%) de | |
| Quercus acuta | 0.83 (5%) a | 1.70 (16%) ab | 0.19 (20%) e | |
| Q. acutissima | 0.72 (6%) b | 1.45 (6%) abcd | 0.31 (26%) bcde | |
| Q. mongolica | 0.66 (3%) bc | 1.60 (8%) abc | 0.39 (23%) abc | |
| Q. serrata | 0.66 (5%) bc | 1.55 (8%) abcd | 0.43 (21%) ab | |
| Q. variabilis | 0.72 (2%) b | 1.34 (4%) cd | 0.32 (15%) bcde | |
| Robinia pseudoacacia | 0.64 (11%) c | 1.47 (8%) abcd | 0.48 (17%) a | |
| Other deciduous forest | 0.68 (3%) | 1.51 (7%) | 0.36 (20%) |
WD: basic woody density, BEF: Biomass expansion factor, R: root to shoot ratio. Values with different letters indicate significant differences among tree species at p < 0.05 and with those in parenthesis representing uncertainty (%).
Table 3.
Carbon stocks in soil and dead organic matter
| Forest Type | Species | Litter (C ton/ha) | Soil (C ton/ha) | Deadwood (C ton/ha) | |
|---|---|---|---|---|---|
| 5th NFI | 6th NFI | ||||
| Coniferous forest | Chamaecyparis obtusa | - | - | 1.59 (108%) | 3.26 (156%) |
| Cryptomeria japonica | - | - | 4.37 (90%) | 3.50 (179%) | |
| Larix kaempferi | 7.01 (27%) ab | 46.71 (36%) | 2.98 (25%) | 2.63 (32%) | |
| Pinus densiflora (Gangwon) | 9.03 (16%) ab | 53.16 (41%) | 1.97 (20%) | 2.46 (28%) | |
| P. densiflora (Jungbu) | 11.85 (27%) a | 37.83 (28%) | 1.82 (14%) | 1.98 (12%) | |
| P. koraiensis | 7.36 (26%) ab | 37.77 (29%) | 2.78 (31%) | 1.51 (57%) | |
| P. rigida | 7.95 (25%) ab | 36.35 (40%) | 1.99 (24%) | 3.73 (37%) | |
| P. thunbergii | 2.18 (28%) | 1.94 (38%) | |||
| Other coniferous forest | 11.25 (25%) | 38.75 (32%) | 2.11 (38%) | 1.90 (55%) | |
| Deciduous forest | Betula platyphylla | - | - | 1.11 (290%) | 0.71 |
| Liriodendron tulipifera | - | - | 0.13 | ||
| Quercus acuta | - | - | 6.49 (1211%) | 0.19 | |
| Q. acutissima | 5.07 (19%) b | 64.30 (27%) | 1.55 (33%) | 1.27 (38%) | |
| Q. mongolica | 7.30 (20%) ab | 64.02 (34%) | 1.55 (15%) | 2.48 (21%) | |
| Q. serrata | - | - | 0.76 (41%) | 1.83 (37%) | |
| Q. variabilis | 6.49 (20%) ab | 57.09 (35%) | 1.43 (21%) | 1.56 (19%) | |
| Robinia pseudoacacia | - | - | 2.14 (50%) | 2.42 (37%) | |
| Other deciduous forest | 6.63 (20%) | 55.68 (33%) | 1.60 (11%) | 2.20 (8%) | |
Values with different letters indicate significant differences among tree species at p < 0.05 with those in parenthesis representing uncertainty (%).
Table 4.
Estimated areas and growing stocks by tree species.
| Forest Type | Species | Area (1000 ha) | Growing Stock (1000 m3) | ||
|---|---|---|---|---|---|
| 2010 | 2015 | 2010 | 2015 | ||
| Coniferous forest | Chamaecyparis obtusa | 19 (0.2%) | 25 (0.3%) | 2377 ± 320 | 3898 ± 433 |
| Cryptomeria japonica | 14 (0.2%) | 14 (0.2%) | 3680 ± 346 | 4850 ± 367 | |
| Larix kaempferi | 200 (2.5%) | 173 (2.1%) | 38,062 ± 1036 | 41,528 ± 1075 | |
| Pinus densiflora (Gangwon) | 363 (4.5%) | 312 (3.9%) | 62,836 ± 1244 | 62,316 ± 1271 | |
| P. densiflora (Jungbu) | 1315 (4.5%) | 1176 (14.5%) | 199,213 ± 2261 | 213,985 ± 2363 | |
| P. koraiensis | 126 (16.3%) | 116 (1.4%) | 16,844 ± 727 | 20,835 ± 841 | |
| P. rigida | 267 (1.6%) | 200 (2.5%) | 41,126 ± 1009 | 34,642 ± 946 | |
| P. thunbergii | 173 (3.3%) | 177 (2.2%) | 20,083 ± 870 | 25,959 ± 1072 | |
| Other coniferous forest | 104 (2.2%) | 146 (1.8%) | 12,649 ± 679 | 19,425 ± 958 | |
| Mixed forest | 1865 (28.9%) | 1706 (29.1%) | 246,042 ± 2033 | 274,331 ± 2064 | |
| Deciduous forest | Betula platyphylla | 6 (0.1%) | 6 (0.1%) | 160 ± 18 | 348 ± 34 |
| Liriodendron tulipifera | - | 1 (0.0%) | - | 82 ± 32 | |
| Quercus acuta | 1 (0.0%) | 1 (0.0%) | 177 ± 27 | 244 ± 18 | |
| Q. acutissima | 66 (1.5%) | 78 (1.6%) | 6301 ± 281 | 9544 ± 346 | |
| Q. mongolica | 472 (10.7%) | 415 (8.6%) | 62,721 ± 698 | 64,431 ± 714 | |
| Q. serrata | 31 (0.7%) | 38 (0.8%) | 3248 ± 207 | 4783 ± 259 | |
| Q. variabilis | 221 (5.0%) | 235 (4.9%) | 32,085 ± 602 | 40,607 ± 685 | |
| Robinia pseudoacacia | 58 (1.3%) | 59 (1.2%) | 5306 ± 233 | 7254 ± 299 | |
| Other deciduous forest | 865 (19.6%) | 1196 (24.8%) | 78,913 ± 960 | 141,146 ± 1363 | |
| Total | 6165 (100%) | 6074 (100%) | 831,821 ± 3463 | 970,210 ± 3473 | |
Values indicate the mean and standard error of stratified random sampling.
© 2018 by the authors. Licensee MDPI, Basel, Switzerland. This article is an open access article distributed under the terms and conditions of the Creative Commons Attribution (CC BY) license (http://creativecommons.org/licenses/by/4.0/).
Share and Cite
MDPI and ACS Style
Lee, S.J.; Yim, J.S.; Son, Y.M.; Son, Y.; Kim, R. Estimation of Forest Carbon Stocks for National Greenhouse Gas Inventory Reporting in South Korea. Forests 2018, 9, 625. https://doi.org/10.3390/f9100625
AMA Style
Lee SJ, Yim JS, Son YM, Son Y, Kim R. Estimation of Forest Carbon Stocks for National Greenhouse Gas Inventory Reporting in South Korea. Forests. 2018; 9(10):625. https://doi.org/10.3390/f9100625
Chicago/Turabian StyleLee, Sun Jeoung, Jong Su Yim, Yeong Mo Son, Yowhan Son, and Raehyun Kim. 2018. "Estimation of Forest Carbon Stocks for National Greenhouse Gas Inventory Reporting in South Korea" Forests 9, no. 10: 625. https://doi.org/10.3390/f9100625
Note that from the first issue of 2016, this journal uses article numbers instead of page numbers. See further details here.