Article

Low Nitrogen Retention in Soil and Litter under Conditions without Plants in a Subtropical Pine Plantation

1
Research Institute of Tropical Forestry, Chinese Academy of Forestry, Guangzhou 510520, China
2
Qianyanzhou Ecological Station, Key Laboratory of Ecosystem Network Observation and Modeling, Institute of Geographic Sciences and Natural Resources Research, Chinese Academy of Sciences, Beijing 100101, China
3
Key Laboratory for Cyclic Economy, School of Urban Planning and Design, Shenzhen Graduate School, Peking University, Shenzhen 518055, China
4
College of Forestry, Jiangxi Agricultural University, Nanchang, 330045, China
*
Authors to whom correspondence should be addressed.
Forests 2015, 6(7), 2387-2404; https://doi.org/10.3390/f6072387
Submission received: 22 April 2015 / Revised: 26 June 2015 / Accepted: 30 June 2015 / Published: 15 July 2015

Abstract

:
Soil acts as a major sink for added nitrogen (N) in forests, but it remains unclear about the capacity of soil to immobilize N under conditions without plant roots and whether added N interacts with ecosystem N to affect N retention. We added 15NH415NO3 to in situ soil columns (with leaching) and leaf litter (without leaching) of two tree species in a subtropical Pinus elliottii plantation. Soil and litter were collected three or eight months after N addition to measure concentrations of indigenous and exogenous N. About 70% of exogenous N was retained in soil three months after N addition, of which 65.9% were in inorganic forms. Eight months after N addition, 16.0% of exogenous N was retained in soil and 9.8%–13.6% was immobilized in litter. N addition increased the mineral release and nitrification of soil indigenous N. Loss of litter indigenous N was also increased by N addition. Our results suggest that N deposition on lands with low root activities or low soil carbon (C) contents may lead to increased N output due to low N immobilization. Moreover, the effects of added N on ecosystem indigenous N may decrease the capacity of soil and litter in N retention.

1. Introduction

Human activities have greatly increased the inputs of atmospheric nitrogen (N) to the Earth’s land surface globally through agricultural fertilization and combustion of fossil fuel [1,2,3]. Rates of N deposition have leveled off or stabilized in the US and Europe since the late 1980s or early 1990s [4], while they have been increasing continuously since the 1980s in China [5]. Because plant growth is limited by N availability in most terrestrial ecosystems [6,7,8], inputs from atmospheric deposition can increase carbon (C) storage by increasing primary production and C accumulation within plants [9,10]. However, increased N deposition can result in N saturation when it exceeds the biotic demand, leading to increased rates of N cycling and losses of nitrate, soil and water acidification, plant nutrient imbalances and even forest decline [11,12,13]. Therefore, the fate of deposited N in forest ecosystems and the capacity of ecosystems to store deposited N have been investigated extensively since the 1990s [14,15,16].
Soil has been suggested to be the major sink of deposited N in forests. A meta-analysis of 15N tracer studies across global forests showed that the mean 15N tracer recovery from soil (organic and mineral layer) was around 80% for short-term (<1 week) and 65% for long-term (3–18 months) periods following N addition [16]. 15N-tracer studies in nine temperate forests receiving 0.4–5.8 g·N·m−2·year−1 of N deposition showed that an average of 70% of applied tracers were recovered from soil after 1–3 years of N addition [17]. Microbial N immobilization and abiotic N assimilation in soil organic matter (SOM) have been proposed as the mechanism of N retention in soil [18,19,20]. Within just hours to days of being introduced to soil in reactive mineral forms, N is incorporated in soil organic molecules [21,22], with a substantial portion of 40% staying stable in SOM for at least one year [23]. However, plant assimilation of deposited N and the subsequent leaf or root litter turnover have also been suggested to be a major pathway of N retention in the forest soil [15,24]. Most previous studies were conducted under conditions with plant uptake and turnover occurring simultaneously with soil microbial N immobilization and abiotic N assimilation. The capacity of soil and litter in retaining deposited N under conditions without plant activities was not usually quantified and remains unclear.
The capacity of soil in N retention may be affected by the interaction of added N and soil indigenous N. Studies generally showed that N addition increases most of the measured fluxes, concentrations or pools of the bulk soil N, which include both indigenous N and added N [25,26,27]. However, there were cases of net soil N loss (N retention was minus) as evidenced by decreased soil N pool after N addition [27,28]. This suggests that added N might accelerate the cycling of soil indigenous N and lead to net N loss. However, few studies quantified effects of N addition on the behavior and cycling of the indigenous N in forests, although effects of fertilizer N on soil indigenous N have been intensively investigated in agricultural ecosystems [29,30,31]. Studies conducted in agroecosystems showed that N fertilization generally releases more soil native N than un-fertilized treatments, and the phenomenon was termed priming effect or added N interaction [29].
To explore the capacity of soil and litter in N retention under conditions without plant activities and effects of added N on the behavior of native N in forests, we conducted an experiment in a slash pine (Pinus elliottii Engelm.) plantation. Pine plantations account for a substantial portion of total plantation area in subtropical China and slash pine is an important member of planted pines due to its fast growth characteristic [32]. We hypothesized that (1) exogenous N immobilization would be low in soil and litter, and most of the added N would be in inorganic forms because there is no plant uptake and no root-C-fueled microbial immobilization; (2) the exogenous N content in the soil profile would decrease rapidly due to low immobilization and exposure of inorganic N to leaching and gaseous loss; and (3) N addition would alter behaviors of indigenous N in soil and litter such as mineral release, ammonification and nitrification due to a stimulated effect of added N on native N availability [29]. To test the hypotheses, we added inorganic N at a rate similar to the ambient N deposition rate in a subtropical slash pine plantation to in situ soil columns and litter, in which 15NH415NO3 (99 atom %) was applied to partition the behaviors of exogenous N and indigenous N in soil and litter.

2. Materials and Methods

2.1. Site Description

The study was conducted in an evergreen slash pine (Pinus elliottii) plantation (26°44′ N, 115°03′ E, elevation 102 m) at Qianyanzhou Ecological Research Station in subtropical China. This even-aged pine plantation was established in 1985 on vegetation-degraded hill land, which had suffered severe soil erosion. There are also a few native Liquidambar formosana trees that have emerged spontaneously since plantation. The soil, weathered from red sandstone and mudstone, is common for subtropical China and classified as a Typic Dystrudepts by the soil taxonomy of United States Department of Agriculture. Soil texture was sandy loam with 68% sand and 15% clay. C and N concentrations in the upper 0–40 cm soil layer are shown in Table 1, and P concentration of the 0–20 cm soil layer was 0.02%. This area was characterized by a humid monsoon climate, with a meanair temperature of 17.9 °C, rainfall amounts of 1542 mm·year−1 [33]. A seasonal drought usually occurs between July and December and about 30% of rainfall occurred in the dry season [34].
Table 1. Initial C and N concentrations in soil and litter before N addition (mean ± standard error (se); n = 8 for soil and n = 4 for litter).
Soil or LitterC (%)N (%)atom % 15N of Total NNO3 (mg N·kg−1)NH4 (mg·N·kg−1)
Control N AdditionControl N AdditionControl N AdditionControl N AdditionControl N Addition
0-5 cm soil1.83 (0.2)1.88 (0.2)0.12 (0.0)0.12 (0.0)0.37 (0.0)0.37 (0.0)13.7 (2.8)10.3 (2.1)16.0 (1.7)17.3 (4.3)
5–10 cm soil0.82 (0.1)0.82 (0.1)0.07 (0.0)0.07 (0.0)0.37(0.0)0.37 (0.0)6.61 (0.8)7.05 (1.1)9.49 (0.6)13.6 (3.3)
10–20 cm soil0.61 (0.1)0.60 (0.1)0.06 (0.0)0.06 (0.0)0.37 (0.0)0.37 (0.0)4.92 (0.5)4.92 (0.8)7.82 (0.4)7.78 (0.6)
20–40 cm soil0.45 (0.1)0.44 (0.0)0.04 (0.0)0.04 (0.0)0.37 (0.0)0.37 (0.0)2.82 (0.4)3.50 (0.5)8.94 (2.7)7.00 (1.0)
P. elliottii litter51.2 (0.1)0.41 (0.0)0.36 (0.0)7.9 (2.9 )18.5 (4.1)
L. formosana litter44.8 (0.2)1.13 (0.0)0.36 (0.0)11.3 (4.6 )21.2 (4.3)

2.2. Experimental Design

In late October 2012, eight pairs of intact soil columns (20 cm in diameter and 40 cm in depth) were established by digging away the soil around, and then the columns were fitted into a polyvinyl chloride (PVC) tube (20 cm in diameter and 60 cm in length), leaving 20 cm of the tubes above ground to prevent the lateral flow exchanges between within and outside soil columns. The litter layer (Oi) on the surface of soil columns was removed. Plants emerging in the columns during the experiment were pulled out days after appearance. Each pair consisted of two soil columns with a distance of 20–30 cm between them, and the pairs were about 2 m away from each other. For each paired columns, one was assigned as the control and the other was assigned as N addition treatment. There were eight replicated columns for the control and N addition treatment. We observed from the soil profiles that most roots were distributed in the upper 30 cm, and there were few fine roots below 40 cm in this plantation. Therefore we believe that root uptake of the added N from soil columns was excluded in our study. N addition occurred on two dates with equal amounts, the first on 21 October and the second on 21 November. Each N-addition soil column received 0.22 g·N (7 g·N·m−2) in the form of 15NH415NO3 (99 atom %), corresponding to 14 mg·kg−1 soil and 2.5% of total N in each 40 cm soil column. We added N by evenly dropping 10 ml of N solution on the soil surface with a dropper followed with 10 ml of de-ionized water. The application rate was comparable to the maximal N deposition rate (6.2 g·N·m−2·year−1) in central Southern China (including our study area) in 2003, mostly in the form of wet deposition [35,36]. The control soil columns received the same amount of de-ionized water.
Leaf litter of P. elliottii was collected from the plantation and L. formosana litter was collected from a L. formosana plantation nearby. Leaf litter was collected with litter traps in the September and early October of 2012, air-dried for two weeks before use. Eight litterbags (20 cm × 20 cm, 2 mm mesh) of P. elliottii and L. formosana litter, respectively, were constructed, with 18 g (dry-weight) intact litter in each bag. Initial C and N concentrations of P. elliottii litter and L. formosana litter are shown in Table 1. The quantity of litter in bags (450 g·m−2) was slightly lower than the annual leaf litter production of this plantation, which is 550–609 g·m−2 (unpublished data). Two 1.5 m × 1.5 m tree-free plots were established in the P. elliottii plantation, one as the control and the other the N addition treatment. We realized that one plot for each treatment posed an issue of pseudoreplication. Since no evidence has shown that N retention in litter is related to the soil beneath litter, the issue of pseudoreplication might have a minor effect on our results. Shrubs and grasses inside the plots were pulled out with roots. Edges of the plots were dug down to 40 cm depth and wrapped with a piece of iron sheet to prevent the root growth of plants outside plots. The iron sheets were kept 40 cm in soil depth and 20 cm aboveground to prevent the lateral flow exchanges between within and outside plots. Each plot was placed with four bags of P. elliottii and four bags of L. formosana, and there were four replicated litterbags for each treatment (control or N addition) of each litter species. N addition to litter occurred on the same dates as those for soil. Each litterbag in the N-treated plot received 0.28 g·N (7 g·N·m−2) with the same dropping method as that for N addition to soil. Each litterbag in the control plot received the same amount of de-ionized water. To estimate the mineral release of litter indigenous inorganic N, a shelter was placed 20 cm above each of the plots to prevent leaching. A volume of 75 L water (mimic 60 mm rainfall, the average amount of rainfall within two weeks) was added to each plot biweekly to keep the soil moist. Litterbags were taken out of plots before water addition and were placed back to plots after water penetrated into the soil completely. We realize that the litter inside litterbags might receive less moisture than the surrounding environment, which might decrease microbial activities and N immobilization. However, litter moisture should be more constant in the litterbags than in the surrounding environment because the shelter (20 cm above litterbags) slowed down water evaporation and sheltered them from direct sunshine. The relatively more constant moisture in litterbags should favor microbial activities. Therefore, microbial activities might not be greatly affected by sheltering litterbags from rainfall and adding water to the soil beneath litterbags.

2.3. Sampling, Measurements and Calculations

Soil samples were taken three months and eight months after N addition (from the first application date) with a corer (3 cm in diameter). Holes after the first sampling were inserted with caped PVC tubes (3 cm in diameter) to prevent further disturbance. Each of the 20-cm-diameter soil columns was sampled at four soil layers: 0–5 cm, 5–10 cm, 10–20 cm and 20–40 cm. The sample of each soil layer was composed of three 3-cm-diameter soil cores. Soil samples of the 0–5 cm layer consisted of both organic (Oe + Oa, 5 millimeters thick) and mineral soil. All eight pairs of soil columns were sampled three months after N addition and only five pairs of soil columns were sampled eight months after N addition due to an accident that destroyed the other three pairs. In addition, two 3-cm-diameter soil cores were taken from each of the 20-cm-diameter soil columns to 40 cm depth before N addition to measure the initial soil C and N concentrations, and holes after sampling were filled with 3-cm-diameter soil cores taken from the outside of 20-cm-diameter columns. The filled holes were avoided from soil sampling by marking the center of each filled hole with a small stick. All litterbags were retrieved eight months after N addition for analysis.
Sub-samples of soil and litter were extracted with 2M (mol L−1) KCl followed by filtration. The filtrate was measured for concentrations of total inorganic N (exogenous plus indigenous) with an auto analyzer (Bran Lubee AA3, Braunschweig, Germany). The 15N abundance (atom%) of NH4+ and NO3 was determined by producing N2O for isotopic analysis with an automated continuous-flow gas-phase isotope-ratio mass spectrometer (IRMS) (Thermo Fisher Finnigan MAT253, Waltham, MA, USA) [37,38]. For measuring 15N abundance of NH4+, MgO was added to a sub-sample of the filtrate to release NH3 from NH4+, and the NH3 was absorbed in diluted H2SO4 and transformed into (NH4)2SO4. The (NH4)2SO4 was then oxidized with NaOBr (with the molarity of NaOH adjusted to 10 M) to produce N2O for isotopic analysis. For measuring 15N abundance of NO3, the NO2 in samples was removed by NH2SO3H and then NO3 in samples was reduced into NO2 and NH2OH by Cd–Cu complex. The reaction between NO2 and NH2OH produced N2O for isotopic analysis. Sub-samples of oven-dried soil and litter were ground into powder for measurements of concentrations of total C and N using an elemental analyzer (Elementar Analysensysteme GmbH Vario EL, Hanau, Germany), and 15N abundance of total N with an isotope-ratio mass spectrometer (Thermo Fisher Finnigan MAT253, Waltham, MA, USA). The amplifiers in the IRMS (Finnigan MAT253) have a linear dynamic range of 50 voltage, and each channel can be equipped with computer switchable amplifier gain, implemented by switchable feedback resistors. When measuring highly enriched samples, the feedback resistor (and thus amplifier gain) of the 15N-ion collector was lowered by a factor of 10 to make the ion current signal detectable.
Concentrations of indigenous and exogenous N (NH4+, NO3or total N) in soil or litter from the N addition treatment were calculated according to mass balance equations:
Cind + Cexo = Cwhole
Cind × atom%15Ncontrol + Cexo × atom %15Nexo = Cwhole × atom %15Nwhole
where Cind, Cexo and Cwhole are the concentrations of indigenous N, exogenous N and indigenous plus exogenous N, respectively; atom %15Ncontrol is the percent of 15N in soil N or litter N of the control; atom %15Nexo is the percent of 15N in added N; atom %15Nwhole is the percent of 15N in the whole soil N or litter N from the N-added treatment.
For the control, N remaining in litter was calculated using N concentrations and litter dry weights before and after experiment, because no exogenous N was added. For the N addition treatment, N remaining was calculated with two methods, which had different meanings: 15N data were used to calculate the remaining of litter indigenous N according to the above-mentioned equations; N concentrations and litter dry weights before and after experiment were used to calculate the remaining of total initial N (indigenous plus exogenous).

2.4. Statistical Analyses

Differences of soil indigenous and total (indigenous plus exogenous) NO3 and NH4+concentrations between the control and N addition treatment and among soil layers were determined by two-way analysis of variance (ANOVA). Differences of soil exogenous NO3 and NH4+concentrations among soil layers were determined by one-way ANOVA. The data were tested for normality and homogeneity before ANOVA, and log or square-root transformations were applied when necessary. Differences of litter N remaining between the control and N addition treatment were compared by independent-samples t-tests at 0.05 level.

3. Results

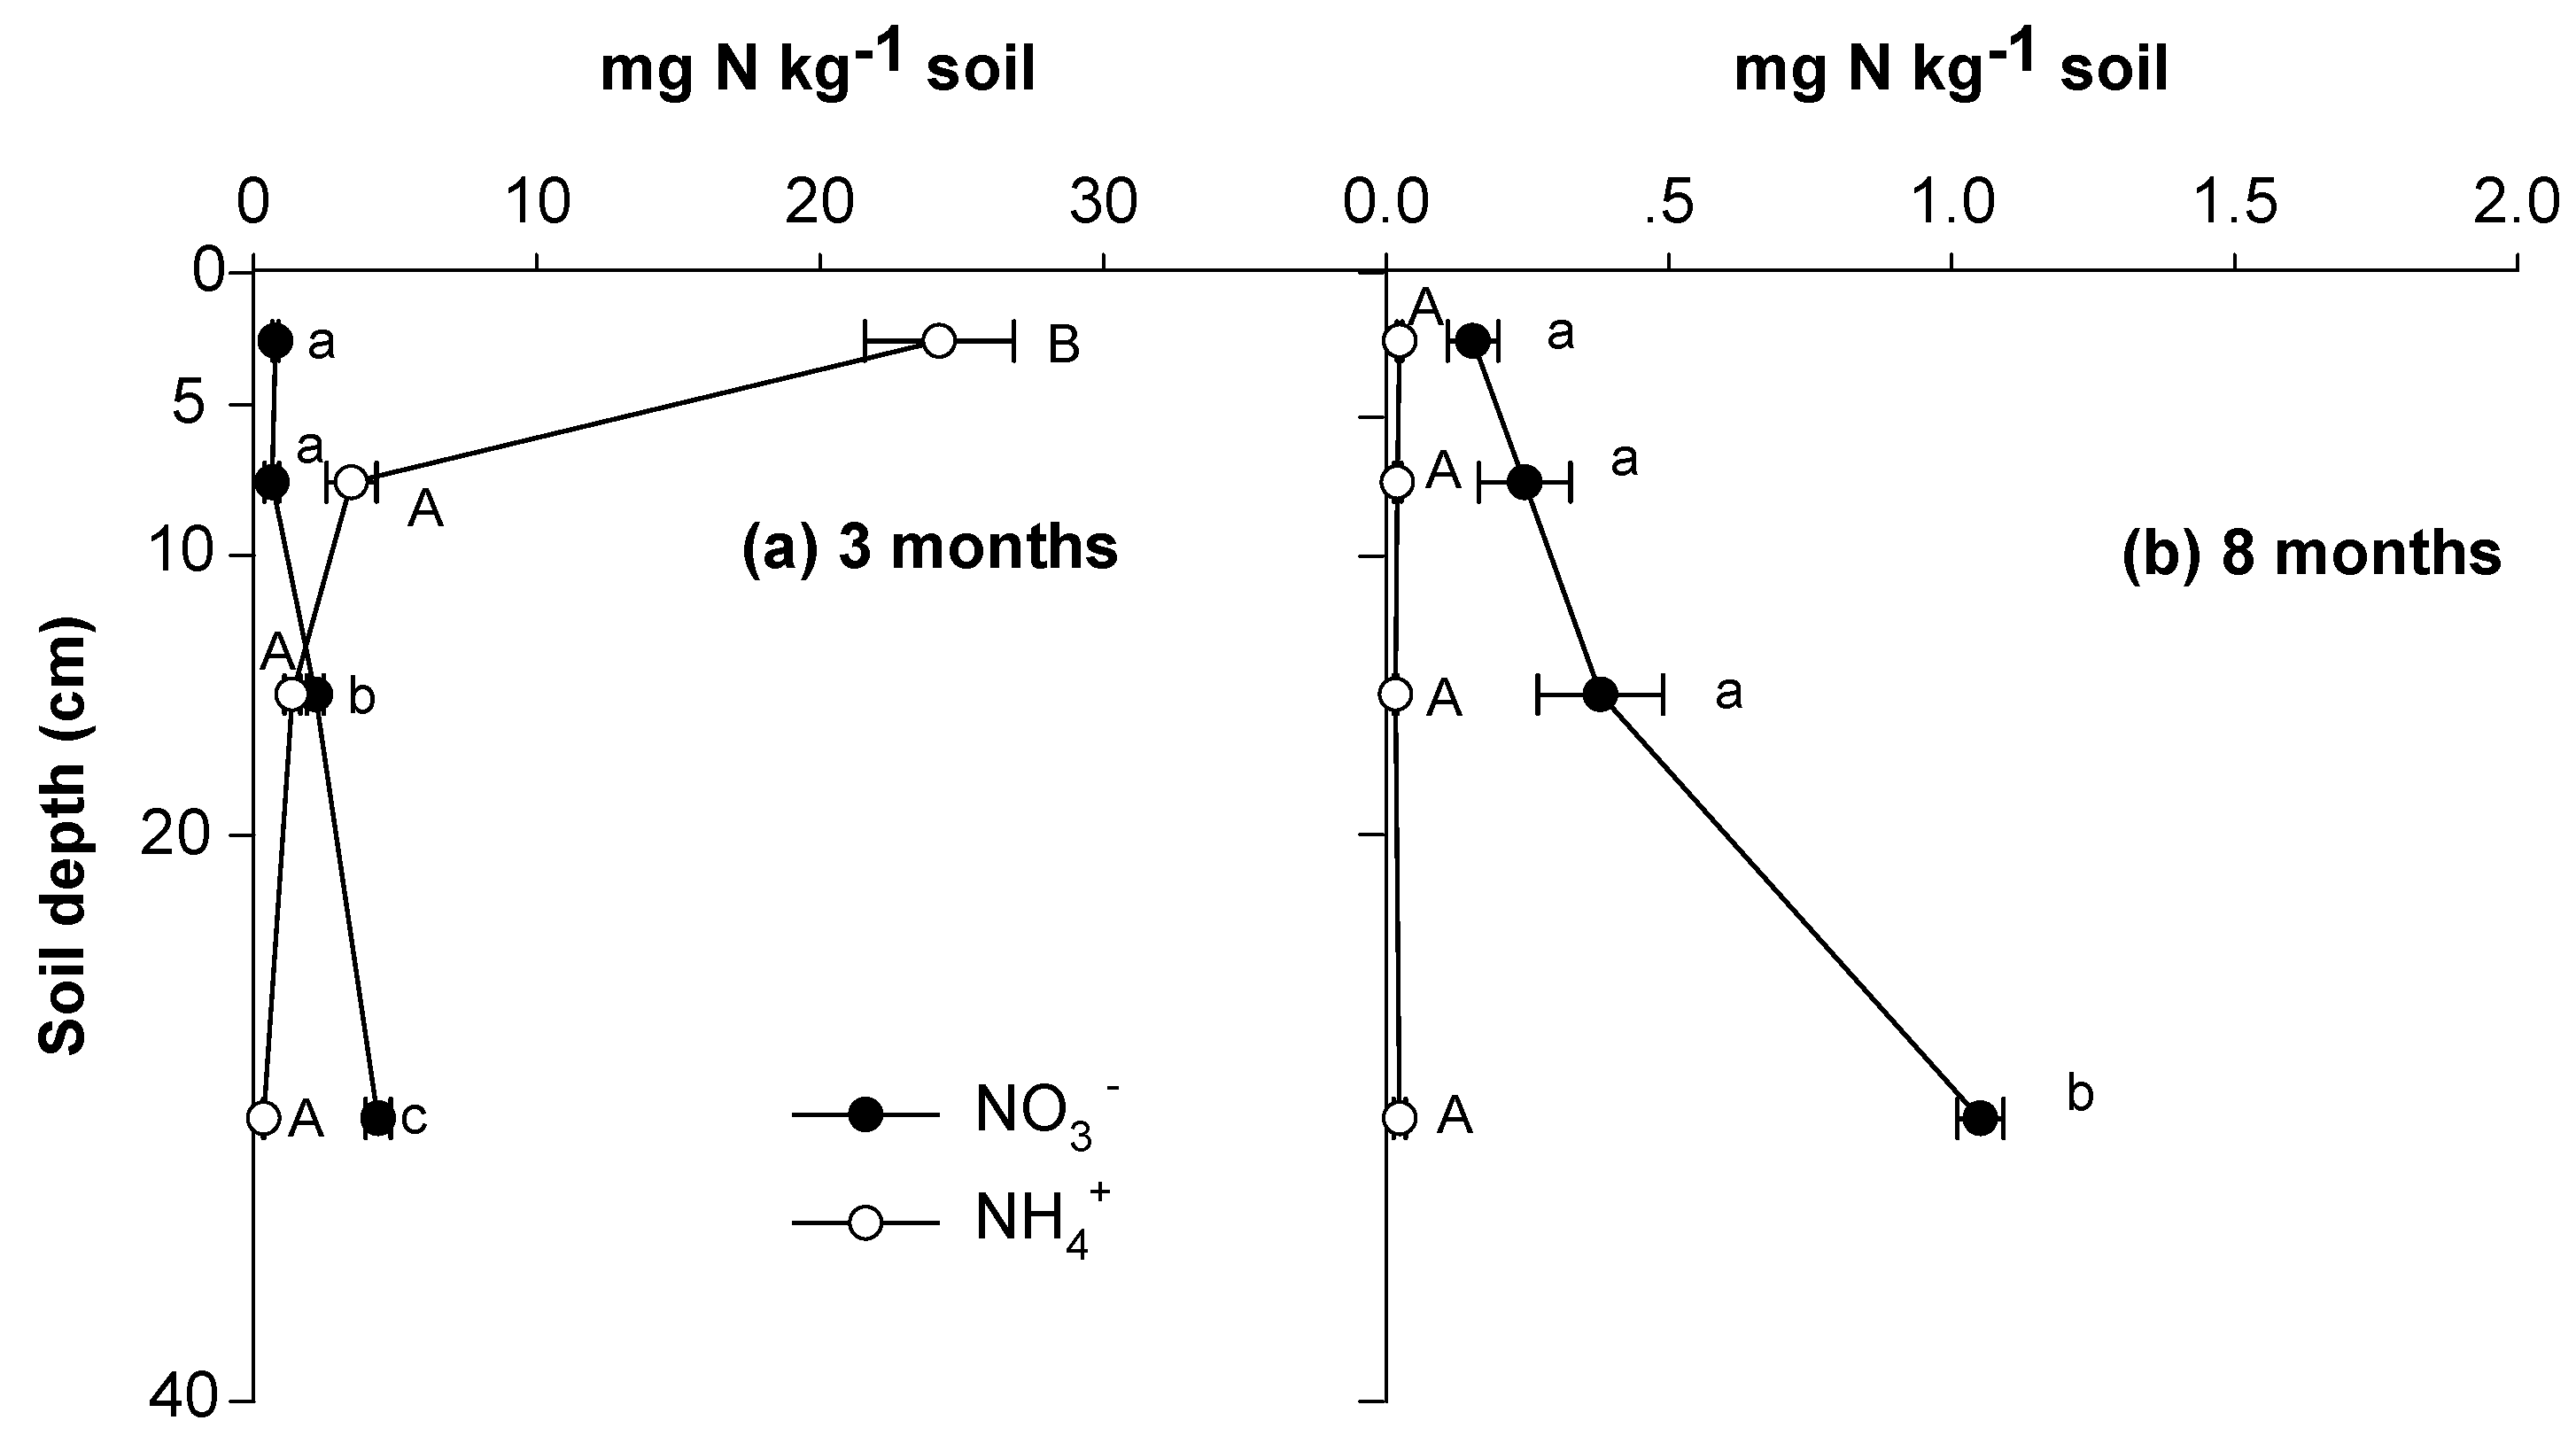
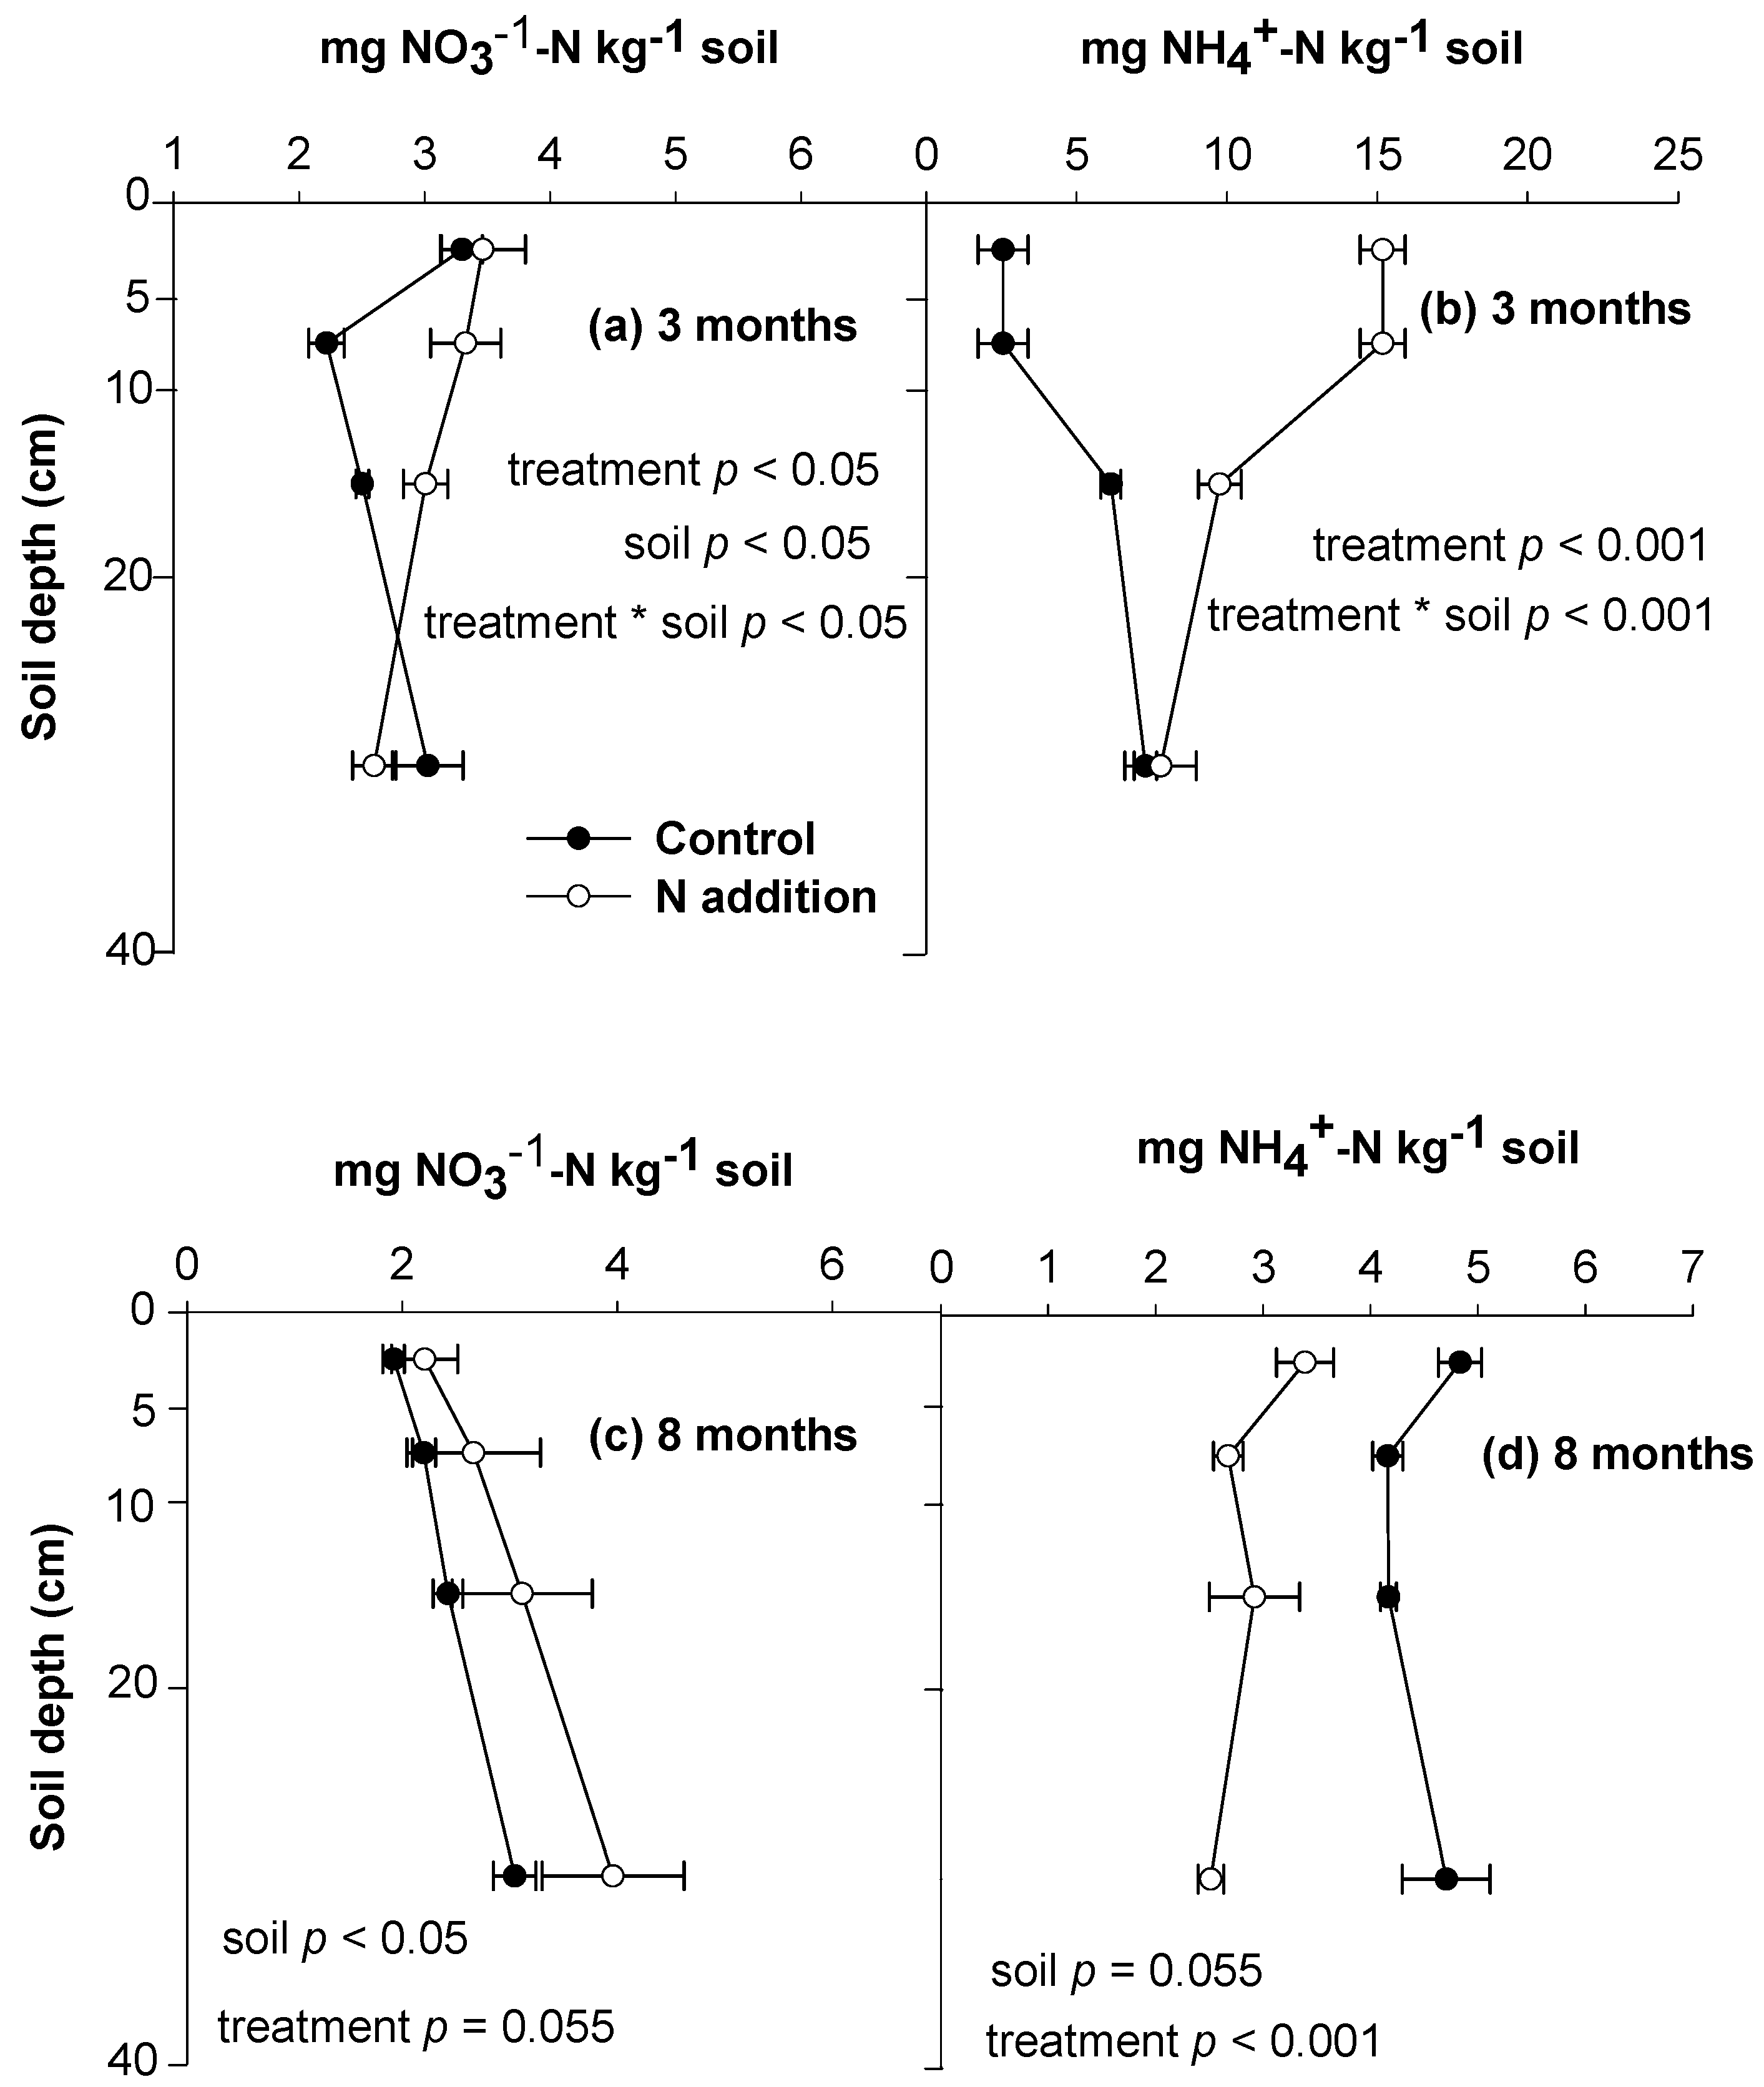
3.1. Soil N Retention and Behaviors of Soil Exogenous and Indigenous N

About 4.90 g·m−2 of exogenous N (70.0% of added N) was retained in the 0–40 cm soil layers three months after N addition (Table 2) under conditions with leaching, and the value decreased to 1.11 g·m−2 (16.0% of added N) after eight months (Table 2). The 0–5 cm layer (including Oe + Oa layer) received the largest portion (40%–50%) of the retained exogenous N and the 20–40 cm layer received the second largest portion (~30%) (Table 2 and Table 3). Among the retained exogenous N in soil three months after N addition, 65.9% was in inorganic forms (Table 2). The retained inorganic exogenous N decreased to 10% (from 3.23 g·m−2 to 0.30 g·m−2) while organic exogenous N decreased to 48% (from 1.67 g·m−2 to 0.80 g·m−2) over the following five months (Table 2 and Table 3).
Table 2. Contents and 15N abundances in soil N pools of the N addition treatment three months after N addition (mean ± standard error (se); n = 8).
Soil LayerTotal N (g·m−2)Total NH4+ (g·m−2)Total NO3(g·m−2)Atom% 15N of Total NAtom% 15N of Total NH4+Atom% 15N of Total NO3Exogenous N (g·m−2)Exogenous NH4+ (g·m−2)Exogenous NO3 (g·m−2)Exogenous Organic N (g·m−2)Exogenous (NH4++NO3)/Exogenous N (%)
0–5 cm61.4 (2.9)2.00 (0.2)0.22 (0.0)3.51 (0.3)60.1 (2.0)19.2 (2.6)1.96 (0.2)1.23 (0.13)0.04 (0.01)0.69 (0.1)64.8 (4.4)
5–10 cm47.0 (2.2)1.76 (0.1)0.26 (0.0)1.91 (0.2)27.1 (3.6)15.7 (5.1)0.74 (0.2)0.23 (0.06)0.05 (0.02)0.46 (0.1)37.8 (3.4)
10–20 cm62.7 (4.5)1.43 (0.1)0.67 (0.1)1.67 (0.2)11.9 (1.7)40.9 (3.2)0.78 (0.1)0.18 (0.04)0.28 (0.04)0.32 (0.0)59.0 (5.6)
20–40 cm100.4 (4.0)1.85 (0.1)1.80 (0.1)1.81 (0.1)4.91 (0.8)62.0 (2.3)1.42 (0.1)0.09 (0.00)1.13 (0.11)0.20 (0.0)85.9 (2.3)
Whole 0–40 cm271 (11) 7.04 (0.4)2.95 (0.2 ) 4.90 (0.3)1.73 (0.13 )1.5 ( 0.10)1.67 (0.2)65.9 (2.4)
Table 3. Contents and 15N abundances in soil N pools of the N addition treatment eight months after N addition (mean ± standard error (se); n = 5).
Soil LayerTotal N (g·m−2)Total NH4+ (g·m−2)Total NO3 (g·m−2)Atom% 15N of Total NAtom% 15N of Total NH4+Atom% 15N of Total NO3Exogenous N (g·m−2)Exogenous NH4+ (g·m−2)Exogenous NO3 (g·m−2)Exogenous Organic N (g·m−2)Exogenous (NH4++NO3)/Exogenous N (%)
0–5 cm56.7 (3.8)0.18 (0.0)0.012 (0.00)1.33 (0.0)1.05 (0.1)6.47 (1.0)0.54 (0.0)0.001 (0.00)0.008 (0.00)0.53 (0.0)1.6 (0.6)
5–10 cm46.6 (3.6)0.19 (0.0)0.019 (0.00)0.68 (0.0)1.07 (0.2)8.24 (1.5)0.15 (0.0)0.001 (0.00)0.017 (0.01)0.13 (0.0)11.9 (3.8)
10–20 cm69.6 (4.1)0.38 (0.0)0.045 (0.00)0.54 (0.0)0.76 (0.0)10.6 (2.0)0.12 (0.0)0.002 (0.00)0.049 (0.01)0.07 (0.0)41.8 (8.7)
20–40 cm112.2 (9.8)1.21 (0.1)0.123 (0.03)0.63 (0.1)1.27 (0.3)16.8 (3.2)0.30 (0.1)0.006 (0.00)0.216 (0.05)0.07 (0.0)73.9 (4.3)
Whole 0–40 cm285 (17)1.96 (0.2)0.199 (0.03) 1.11 (0.2)0.010 (0.00)0.288 (0.05)0.80 (0.0)26.9 (6.9)
Concentrations of soil inorganic N did not differ between treatments before N addition (Table 1). Three months after N addition, soil total (indigenous plus exogenous) NO3 and NH4+ were significantly higher in the N addition treatment than in the control (p < 0.001; Figure 1a,b). Eight months after N addition, the concentration of soil total NO3 was significantly higher in the N addition treatment (p < 0.01) but soil total NH4+ was significantly lower in the N addition treatment than in the control (p < 0.001) (Figure 1c,d).
Figure 1. (a) Concentration of soil total (indigenous + exogenous) NO3 (mean ± standard error (se); n = 8) three months after N addition. (b) Concentration of soil total (indigenous + exogenous) NH4+ (mean ± se; n = 8) three months after N addition. (c) Concentration of soil total (indigenous + exogenous) NO3 (mean ± se; n = 5) eight months after N addition; (d) Concentration of soil total (indigenous + exogenous) NH4+ (mean ± se; n = 5) eight months after N addition. Data are graphed at the mid-point of our soil sampling depths.
Forests 06 02387 g001
Soil exogenous NH4+ and NO3 showed different patterns of distribution with soil depth. Three months after N addition, the concentrations of exogenous NO3increased with soil depth, whereas the concentrations of exogenous NH4+ decreased with soil depth (p < 0.01; Figure 2a). Eight months after N addition, the concentrations of soil exogenous NO3 still showed an increasing pattern with soil depth (p < 0.01), whereas concentrations of NH4+ was close to zero and did not differ among soil layers (Figure 2b).
Figure 2. (a) Concentrations of soil exogenous NO3 and NH4+ (mean ± standard error (se); n = 8) three months after N addition. (b) Concentrations of soil exogenous NO3 and NH4+ (mean ± se; n = 5) eight months after N addition. Note: Differences of NO3 among soil layers are indicated by different lowercase letters. Differences of NH4+ among soil layers are indicated by different uppercase letters. Data are graphed at the mid-point of our soil sampling depths.
Forests 06 02387 g002
Concentrations of soil indigenous NH4+ and NO3 were significantly higher in the N addition treatment than the control three months after N addition (p < 0.05 or p < 0.001; Figure 3a,b). The difference was especially marked for NH4+, being four times higher in the N addition treatment than the control (Figure 3b). The concentration of soil indigenous NH4+ + NO3 did not differ between treatments eight months after N addition, but NH4+ and NO3 showed the opposite trends. Soil indigenous NO3 tended to be higher in the N addition treatment (p = 0.055; Figure 3c), but indigenous NH4+ was significantly lower in the N addition treatment than the control (p < 0.001; Figure 3d).

3.2. Litter N Retention and Behaviors of Litter Indigenous and Exogenous N

Eight months after decomposition, no net N loss was found in the control of both litter species under conditions without leaching, but substantial portions of initial N (indigenous or indigenous plus exogenous) were lost in the N addition treatment (Table 4). About 23.0% and 20.7% of the exogenous N remained in P. elliottii and L. formosana litter, respectively, eight months after N addition (Table 4). Among the exogenous N remaining in litter, half was organic (immobilized), with 13.6% and 9.8% of added N immobilized in P. elliottii litter and L. formosana litter, respectively (Table 4). Litter indigenous NH4+and NO3 in P. elliottii and L. formosana litter was 21 and 13 times higher, respectively, in the N addition treatment than in the control (p < 0.001; Table 4).
Figure 3. (a) Concentration of soil indigenous NO3 (mean ± standard error (se); n = 8) three months after N addition. (b) Concentration of soil indigenous NH4+ (mean ± se; n = 8) three months after N addition. (c) Concentration of soil indigenous NO3 (mean ± se; n = 5) eight months after N addition. (d) Concentration of soil indigenous NH4+ (mean ± se; n = 5) eight months after N addition. Data are graphed at the mid-point of our soil sampling depths.
Forests 06 02387 g003
Table 4. Contents and 15N abundances in litter N pools at the initiation of N addition and eight months after N addition (mean ± standard error (se); n = 4).
Litter SpeciesTreatmentsInitial Exogenous N (g·m−2)Initial Indigenous N (g·m−2)Total N RemainingAtom% 15N of Total N RemainingExogenous N RemainingIndigenous N RemainingExogenous N ImmobilizationNH4+ (g·m−2)NO3 (g·m−2)Atom% 15N of NH4+Atom% 15N of NO3Exogenous NH4+ (g·m−2)Exogenous NO3 (g·m−2)Exogenous (NH4++NO3)/exogenous N (%)Indigenous NH4+ (g·m−2)Indigenous NO3 (g·m−2)
(g·m−2) (%)(g·m−2) (%)(g·m−2) (%)(g·m−2) (%)
P. elliottiiControl01.841.85 (0.0)101 (1.9) a *0.36 (0.0) 1.85 (0.0) a101 (1.9) a 0.005 (0.00)0.001 (0.00)0.36 (0.0)0.36 (0.0) 4.56 (0.78) a0.53 (0.09) a
N addition7.001.843.02 (0.1)34.2 (1.7) b54.9 (2.2)1.67 (0.1)23.0 (1.5)1.35 (0.0) b73.4 (3.0) b0.95 (0.1)13.6 (1.6)0.59 (0.05)0.24 (0.04)84.3 (1.6)92.4 (1.0)0.496 (0.04)0.226 (0.04)43.2 (2.7)585 (55) b242 (43) b
L. formosanaControl05.085.33 (0.1)105 (2.1) a0.36 (0.0) 5.33 (0.1) a105 (2.1) a 0.010 (0.00)0.001 (0.00)0.36 (0.0)0.36 (0.0) 10.38 (1.21) a1.30 (0.13) a
N addition7.005.085.36 (0.3)44.4 (2.5) b28.3 (2.2)1.50 (0.1)20.7 (1.1)3.86 (0.2) b76.0 (5.1) b0.69 (0.12)9.8 (1.7)0.48 (0.08)0.48 (0.10)70.3 (1.8)96.8 (0.6)0.340 (0.06)0.472 (0.11)54.1 (8.1)478 (77) b481 (111) b
*: Different lowercase letters in the same column of the same species denote significant difference between treatments at 0.05 level. Exogenous N immobilization indicates the portion of exogenous N present in organic forms.

4. Discussion

4.1. Low N Retention in the Soil Profile and Litter

As expected in the second hypothesis, exogenous N in the 0–40 cm soil profile decreased steeply from 100% of addition at the initiation to 70% three months after addition and further to 16% eight months after N addition (Table 3) under conditions with leaching. About 21%–23% of the exogenous N was retained in litter eight months after N addition under conditions without leaching (Table 2), suggesting that the added N experienced strong gaseous loss on the surface of litter. We believe that only the immobilized organic portion (9.8%–13.6%) of exogenous N could be retained in litter under field conditions with leaching, because the inorganic portion could be readily leached out from litter and subsequently leached through soil. Similarly, Micks et al. [39] showed that litter retained only 6%–7% of N tracers over two years under elevated N inputs (5 g·N·m−2·year−1) in the field. Therefore, the N retention rate in litter plus soil was estimated as 28% eight months after N addition in our study. Except for the extremely low 15N recovery (2.54%–7%) found in Zak et al. [15] and Zogg et al. [21], the N retention rate we observed was at the lower end of the reported range of 20%–87% in previous N addition (5–22.4 g·N·m−2·year−1) studies using 15N tracers with experimental durations ranging from 1 year to 10 years [17,24,40,41,42,43,44].
The low soil N retention rate we observed might be mainly due to the absence of plants in soil columns. Under conditions without plant uptake and root-C-driven microbial N immobilization, a large fraction of added N existed in inorganic forms (Table 2) as expected in the first hypothesis and was exposed to leaching and gaseous loss. The plant-soil-microbial interactions have been suggested to play an important role in soil N retention [15,45], because carbon inputs from roots may enhance soil microbial N immobilization [46]. Retention of deposited inorganic N was dominated by rapid immobilization and turnover through microbial biomass in the short term (weeks), and transfer from microbial biomass into plant pools and subsequently incorporated into soil through leaf and root litter in the long term (months to years) [45]. In this study, intact soil columns without plants were used and we added a considerable amount of N at the beginning of the experiment. Soil columns were also used to measure soil N retention rate in subtropical forests in Huang et al. [47] and Pan et al. [48], and only 57%–84% of 15N tracer was found one month after 15N tracer addition, suggesting a rapid loss of 15N tracer from these soil columns.
The low soil N retention rate we observed should also be due in part to the thin litter (around 1cm) and soil organic layer (millimeters of Oe + Oa layer), because litter and soil organic layer have been shown to be an important sink of deposited N in temperate and boreal forests [49,50]. Furthermore, the relatively low soil C concentration (1.8% at 0–5 cm) in our study might also be a reason, because larger soil C pools may promote greater soil N storage by C-fueled microbial N immobilization and abiotic reactions between mineral N and aromatic compounds [23]. Abiotic immobilization of nitrate has been proposed as a mechanism of soil N retention in some forests [19,20], but the contribution of abiotic immobilization to soil N retention in our study could not be determined under our experimental settings.
Strong leaching should be the primary driver of N loss in this subtropical area with an annual rainfall amount of 1542 mm. The soil N2O emission for this plantation was estimated at 0.93 kg N2O ha−1·year−1 (i.e., 59 mg·N·m−2·year−1), and N addition of 4 g·m−2·year−1 and 12 g·m−2·year−1 increased the N2O emission by 403% and 762%, respectively [51]. Calculated by the linear relation between N2O emission and N addition rate found in Wang et al. [51], the N loss through N2O emission in our study (N addition of 7 g·m−2·year−1) was estimated as 0.08 g·N·m−2 and 0.2 g·N·m−2 within three months and eight months, respectively. The estimated N loss through N2O emission contributed only 3.8% and 3.4% of the unaccounted exogenous N of 2.10 g·m−2 and 5.89 g·m−2 three and eight months after N addition, respectively (Table 2 and Table 3). This suggests that most of the unaccounted exogenous N was lost by leaching and N2 emission. Strong leaching was evidenced by the contrast in patterns of exogenous NH4+and NO3 distribution with soil depth (Figure 2). The concentration of soil exogenous NH4+ decreased with soil depth because NH4NO3 was added on the soil surface and NH4+ has a poor mobility in soil. However, the concentration of exogenous NO3 increased with soil depth, which was due to solution leaching because NO3 has a strong mobility with water flow [1]. A large portion of soil NH4+ might have been transformed into NO3 and lost by leaching due to enhanced nitrification by N addition. This was confirmed by the enhanced nitrification by N addition (Figure 1c and Figure 3c) and the near zero exogenous NH4+ eight months after N addition in spite of a poor mobility (Figure 2b). This result supports the view that tropical and subtropical soils display little delay in nitrification in response to N additions [52]. Therefore, N deposition in tropical or subtropical areas in forms of either NO3 or NH4+ may have similar effects on N leaching loss because added NH4+ is nitrified after addition and exposed to leaching. Consistent with our results, hydrologically driven leaching was also considered as an important reason for N loss in a subtropical forest in China [28].
Our results suggest that in subtropical areas with strong leaching, N deposition on barren or vegetation degraded lands with low plant activities and low soil C contents may lead to increased N output due to low N immobilization in soil and litter, and result in environmental consequences such as air NOx pollution, water acidification and eutrophication.

4.2. N Addition Altered the Behaviors of Indigenous N in Soil and Litter

N addition stimulated the mineral release of soil and litter indigenous N. This was confirmed by the higher concentrations of soil and litter indigenous NO3 and NH4+ in the N addition treatment than in the control (Figure 3; Table 4). Our result was consistent with previous studies, which showed a priming effect (stimulating effect) of added N on the availability of soil native N [30,53]. An apparent priming effect could be induced by pool substitution or displacement reactions [29,54]. Pool substitution is the process by which added N stands proxy for native N that would otherwise have been removed from that pool [29]. Microbial immobilization and denitrification of added inorganic N instead of the exiting pool of soil indigenous inorganic N are the typical forms of pool substitution. Displacement reaction refers to any process involving the displacement of soil N from a “bound” pool by exogenous N (e.g., displacement of NH4+ fixed in clay minerals by added NH4+) [29]. A real priming effect could be induced by increased mineralization of soil organic N by inorganic N addition [29]. Since gross N mineralization was not measured in this study, it remains unclear whether the stimulated mineral release of soil and litter indigenous N was induced by a real or apparent priming effect.
N addition altered the relative intensity of ammonification and nitrification of indigenous N and total N, as expected in the third hypothesis. Concentrations of soil total and indigenous NH4+ were lower in the N addition treatment than in the control eight months after N addition (p < 0.001; Figure 1d and Figure 3d). However, soil total and indigenous NO3 were higher in the N addition treatment (p < 0.01 or p = 0.055; Figure 1c and Figure 3c). This indicates that soil nitrification was enhanced by N addition to a greater extent than ammonification, leading to a depletion of NH4+ [55]. Enhanced nitrification is expected to increase the potential of N loss through denitrification and leaching because NO3 is the substrate of denitrification and is more mobile than NH4+ [1,52]. Indeed, increased loss of litter indigenous N by N addition has occurred in our study as evidenced by the lower remaining rate of litter indigenous N in the N addition treatment than in the control (p < 0.05; Table 4).

5. Conclusions

By applying 15N labeled inorganic N at a rate similar to ambient N deposition to intact soil columns and litter, we evaluated the capacity of soil and litter in N retention without plants. Moreover, we partitioned exogenous and indigenous N to examine the interactions between added N and ecosystem intrinsic N. We showed that most of the exogenous N added to soil existed in inorganic forms three months after N addition, and the exogenous inorganic N experienced a much faster loss than exogenous organic N over the following five months. Only 28% of the added N was retained in litter plus 0–40 cm soil profile eight months after N addition, which was possibly due to low N immobilization and thus exposure to leaching and gaseous loss in our study. Our results suggest that N deposition on barren or vegetation degraded lands with low plant activities and low soil C contents may lead to increased N output due to low N immobilization in soil and litter. Furthermore, N addition stimulated the mineral release and nitrification of indigenous N in soil and litter, further increasing the potential of N loss and decreasing the capacity of soil and litter in N retention. Therefore, vegetation status and interactions between added N and ecosystem intrinsic N should be taken into consideration in further studies in evaluating soil N retention.

Acknowledgments

We thank Yacheng Cao and Xi Wang for lab analysis of soil and litter 15N and Guigang Lin and Zhengxia Chen for their assistance in the field. This work was funded by the Natural Science Foundation of China (No. 31200405) and the National Basic Research Program of China (No. 2012CB416903).

Author Contributions

Yanmei Xiong, Xingliang Xu and Dali Guo conceived and designed the experiment. Yanmei Xiong carried out the experiment and data analysis. Yanmei Xiong, Xingliang Xu and Fusheng Chen prepared the manuscript. Hui Zeng and Huimin Wang contributed materials and analysis tools.

Conflicts of Interest

The authors declare no conflict of interest.

References

  1. Galloway, J.N.; Townsend, A.R.; Erisman, J.W.; Bekunda, M.; Cai, Z.C.; Freney, J.R.; Martinelli, L.A.; Seitzinger, S.P.; Sutton, M.A. Transformation of the nitrogen cycle: Recent trends, questions, and potential solutions. Science 2008, 320, 889–892. [Google Scholar] [CrossRef] [PubMed]
  2. Gruber, N.; Galloway, J.N. An earth-system perspective of the global nitrogen cycle. Nature 2008, 451, 293–296. [Google Scholar] [CrossRef] [PubMed]
  3. National Atmospheric Deposition Program. National Atmospheric Deposition Program Annual Data Summary: Precipitation Chemistry in the United States; NADP Program Office: Champaign, IL, USA, 2000; Available online: http://nadp.sws.uiuc.edu/lib/data/2000as.pdf (accessed on 1 July 2015).
  4. Schlesinger, W.H. On the fate of anthropogenic nitrogen. Proc. Natl. Acad. Sci. USA 2009, 106, 203–208. [Google Scholar] [CrossRef] [PubMed]
  5. Liu, X.; Duan, L.; Mo, J.; Du, E.; Shen, J.; Lu, X.; Zhang, Y.; Zhou, X.; He, C.; Zhang, F. Nitrogen deposition and its ecological impact in China: An overview. Environ. Poll. 2011, 159, 2251–2264. [Google Scholar] [CrossRef] [PubMed]
  6. Vitousek, P.M.; Howarth, R.W. Nitrogen limitation on land and in the sea: How can it occur? Biogeochemistry 1991, 13, 87–115. [Google Scholar] [CrossRef]
  7. LeBauer, D.S.; Treseder, K.K. Nitrogen limitation of net primary productivity in terrestrial ecosystems is globally distributed. Ecology 2008, 89, 371–379. [Google Scholar] [CrossRef] [PubMed]
  8. Xu, X.; Wanek, W.; Zhou, C.; Richter, A.; Song, M.; Cao, G.; Ouyang, H.; Kuzyakov, Y. Nutrient limitation of alpine plants: Implications from leaf N: P stoichiometry and leaf δ15N. J. Plant Nutr. Soil Sci. 2014, 177, 378–387. [Google Scholar] [CrossRef]
  9. Xia, J.Y.; Wan, S.Q. Global response patterns of terrestrial plant species to nitrogen addition. N. Phytol. 2008, 179, 428–439. [Google Scholar] [CrossRef] [PubMed]
  10. Thomas, R.Q.; Canham, C.D.; Weathers, K.C.; Goodale, C.L. Increased tree carbon storage in response tonitrogen deposition in the US. Nat. Geosci. 2010, 3, 13–17. [Google Scholar] [CrossRef]
  11. Aber, J.D.; McDowell, W.H.; Nadelhoffer, K.J. Nitrogen saturation in temperateforest ecosystems—Hypothesis revisited. BioScience 1998, 48, 921–934. [Google Scholar] [CrossRef]
  12. Gundersen, P.; Emmett, B.A.; Kjønaas, O.J.; Koopmans, C.J.; Tietema, A. Impact of nitrogen deposition on nitrogen cycling in forests: A synthesis of NITREX data. For. Ecol. Manag. 1998, 101, 37–55. [Google Scholar] [CrossRef]
  13. Fang, Y.; Yoh, M.; Koba, K.; Zhu, W.; Takebayashi, Y.; Xiao, Y.; Lei, C.; Mo, J.; Zhang, W.; Lu, X. Nitrogen deposition and forest nitrogen cycling along anurban-rural transect in southern China. Glob. Chang. Biol. 2011, 17, 872–885. [Google Scholar] [CrossRef]
  14. Nadelhoffer, K.J.; Downs, M.; Fry, B.; Aber, J.D.; Magill, A.H.; Melillo, J.M. The fate of 15N-labeled nitrate additions to a northern hardwood forest in eastern Maine, USA. Oecologia 1995, 103, 292–301. [Google Scholar] [CrossRef]
  15. Zak, D.R.; Pregitzer, K.S.; Holmes, W.E.; Burton, A.J.; Zogg, G.P. Anthropogenic N deposition and the fate of 15NO3—In a northern hardwood ecosystem. Biogeochemistry 2004, 69, 143–157. [Google Scholar] [CrossRef]
  16. Templer, P.H.; Mack, M.C.; Chapin, F.S.; Christenson, L.M; Compton, J.E.; Crook, H.D.; Currie, W.S.; Curtis, C.J.; Dail, D.B.; D’Antonio, C.M.; et al. Sinks for nitrogen inputs in terrestrial ecosystems: A meta-analysis of 15N tracer field studies. Ecology 2012, 93, 1816–1829. [Google Scholar] [CrossRef] [PubMed] [Green Version]
  17. Nadelhoffer, K.J.; Emmett, B.A.; Gundersen, P.; Kjønaas, O.J.; Koopmans, C.J.; Schleppi, P.; Tietema, A.; Wright, R.F. Nitrogen deposition makes a minor contribution to carbon sequestration in temperate forests. Nature 1999, 398, 145–148. [Google Scholar] [CrossRef]
  18. Corre, M.D.; Brumme, R.; Veldkamp, E.; Beese, F.O. Changes in nitrogen cycling and retention processes insoils under spruce forests along a nitrogen enrichmentgradient in Germany. Glob. Chang. Biol. 2007, 13, 1509–1527. [Google Scholar] [CrossRef]
  19. Bryan Dail, D.; Davidson, E.A.; Chorover, J. Rapid abiotictransformation of nitrate in an acid forest soil. Biogeochemistry 2001, 54, 131–146. [Google Scholar] [CrossRef]
  20. Davidson, E.A.; Chorover, J.; Dail, D.B. A mechanism of abiotic immobilization of nitrate in forest ecosystems: The ferrous wheel hypothesis. Glob. Chang. Biol. 2003, 9, 228–236. [Google Scholar] [CrossRef]
  21. Zogg, G.P.; Zak, D.R.; Pregitzer, K.S.; Burton, A.J. Microbial immobilization and the retention of anthropogenic nitrate in a northern hardwood forest. Ecology 2000, 81, 1858–1866. [Google Scholar] [CrossRef]
  22. Morier, I.; Schleppi, P.; Siegwolf, R.; Knicker, H.; Guenat, C. 15N immobilization in forest soil: A sterilization experiment coupled with 15CPMAS NMR spectroscopy. Eur. J. Soil Sci. 2008, 59, 467–475. [Google Scholar] [CrossRef] [Green Version]
  23. Lewis, D.B.; Castellano, M.J.; Kaye, J.P. Forest succession, soil carbon accumulation, and rapid nitrogen storage in poorly remineralized soil organic matter. Ecology 2014, 95, 3687–2693. [Google Scholar] [CrossRef]
  24. Nadelhoffer, K.J.; Colman, B.P.; Currie, W.S.; Magill, A.; Aber, J.D. Decadal-scale fates of 15N tracers added to oak and pine stands under ambient and elevated N inputs at the Harvard Forest (USA). For. Ecol. Manag. 2004, 196, 89–107. [Google Scholar] [CrossRef]
  25. Corre, M.D.; Beese, F.O.; Brumme, R. Soil nitrogen cycle in high nitrogen deposition forest: Changes under nitrogen saturation and liming. Ecol. Appl. 2003, 13, 287–298. [Google Scholar] [CrossRef]
  26. Vourlitis, G.L.; Zorba, G. Nitrogen and carbon mineralization of semi-arid shrublandsoil exposed to long-term atmospheric nitrogen deposition. Biol. Fertil. Soils 2007, 43, 611–615. [Google Scholar] [CrossRef]
  27. Lu, M.; Yang, Y.; Luo, Y.; Fang, C.; Zhou, X.; Chen, J.; Yang, X.; Li, B. Responses of ecosystem nitrogen cycle to nitrogen addition: A meta-analysis. N. Phytol. 2011, 189, 1040–1050. [Google Scholar] [CrossRef] [PubMed]
  28. Fang, Y.; Gunderse, P.; Mo, J.; Zhu, W. Input and output of dissolved organic and inorganic nitrogenin subtropical forests of South China under high air pollution. Biogeosciences 2008, 5, 339–352. [Google Scholar] [CrossRef]
  29. Jenkinson, D.S.; Fox, R.H.; Rayner, J.H. Interactions between fertilizernitrogen and soil nitrogen: The so-called “priming” effect. J. Soil Sci. 1985, 36, 425–444. [Google Scholar] [CrossRef]
  30. Woods, L.E.; Cole, L.K.; Porter, L.K.; Coleman, D.C. Transformations of added and indigenousnitrogen in gnotobiotic soil: A comment on the priming effect. Soil Biol. Biochem. 1987, 19, 673–678. [Google Scholar] [CrossRef]
  31. Azam, F. Added nitrogen interaction in the soil-plant system—A review. Pak. J. Agron. 2002, 1, 54–59. [Google Scholar]
  32. Wang, Y.; Wang, H.; Ma, Z.; Dai, X.; Wen, X.; Liu, Y.; Wang, Z.L. The litter layer acts as a moisture-induced bidirectional buffer for atmospheric methane uptake by soil of a subtropical pine plantation. Soil Biol. Biochem. 2013, 66, 45–50. [Google Scholar] [CrossRef]
  33. Huang, K.; Wang, S.; Zhou, L.; Wang, H.; Liu, Y.; Yang, F. Effects of drought and ice rain onpotential productivity of a subtropicalconiferous plantation from 2003 to 2010 based on eddy covariance flux observation. Environ. Res. Lett. 2013, 8, 035021. [Google Scholar] [CrossRef]
  34. Wen, X.F.; Wang, H.M.; Yu, G.R.; Sun, X.M. Ecosystem carbon exchange of a subtropical evergreen coniferous plantation subjected to seasonal drought, 2003–2007. Biogeosciences 2010, 7, 357–369. [Google Scholar] [CrossRef]
  35. Lü, C.; Tian, H. Spatial and temporal patterns of nitrogen deposition in China: Synthesis of observational data. J. Geophys. Res. 2007, 112, D22S05. [Google Scholar] [CrossRef]
  36. Du, E.; Liu, X. High rates of wet nitrogen deposition in China: Asynthesis. In Nitrogen Deposition, Critical Loads and Biodiversity; Sutton, M.A., Mason, K.E., et al., Eds.; Springer: Dordrecht, The Netherlands, 2014; pp. 49–56. [Google Scholar]
  37. Stevens, R.J.; Laughlin, R.J. Determining nitrogen-15 in nitrite ornitrate by producing nitrous oxide. Soil Sci. Soc. Am. J. 1994, 58, 1108–1116. [Google Scholar] [CrossRef]
  38. Laughlin, R.J.; Stevens, R.J.; Zhuo, S. Determining nitrogen-15 inammonium by producing nitrous oxide. Soil Sci. Soc. Am. J. 1997, 61, 462–465. [Google Scholar] [CrossRef]
  39. Micks, P.; Downs, M.R.; Magill, A.H.; Nadelhoffer, K.J.; Aber, J.D. Decomposing litter as a sink for 15N-enriched additions to an oak forest and a red pine plantation. For. Ecol. Manag. 2004, 196, 71–87. [Google Scholar] [CrossRef]
  40. Heilman, P.E.; Dao, T.; Cheng, H.H.; Webster, S.R.; Christensen, L. Comparison of fall and spring applications of 15N-labeled urea to Douglas-fir: II. Fertilizer nitrogen recovery in trees and soil after 2 years. Soil Sci. Soc. Am. J. 1982, 46, 1300–1304. [Google Scholar] [CrossRef]
  41. Nason, G.E. Dynamics of Fertilizer and Native Nitrogen in a Douglas-fir Ecosystem. Ph.D. Thesis, University of Alberta, AB, Canada, 1989. [Google Scholar]
  42. Tietema, A.; Emmett, B.A.; Gundersen, P.; Kjønaas, O.J.; Koopmans, C.J. The fate of 15N-labelled nitrogen deposition in coniferous forest ecosystems. For. Ecol. Manag. 1998, 101, 19–27. [Google Scholar] [CrossRef]
  43. Preston, C.M.; Marshall, V.G.; McCullough, K.; Mead, D.J. Fate of 15N-labelled fertilizer applied on snow at two forest sites in British Columbia. Can. J. For. Res. 1990, 20, 1583–1592. [Google Scholar] [CrossRef]
  44. Mead, D.J.; Chang, S.X.; Preston, C.M. Recovery of 15N-urea 10 years after application to a Douglas-fir pole standin coastal British Columbia. For. Ecol. Manag. 2008, 256, 694–701. [Google Scholar] [CrossRef]
  45. Perakis, S.S.; Hedin, L.O. Fluxes and fates of nitrogen in soil of an unpolluted old-growth temperate forest, Southern Chile. Ecology 2001, 82, 2245–2260. [Google Scholar] [CrossRef]
  46. Kuzyakov, Y.; Xu, X. Competition between roots and microorganisms for nitrogen: Mechanisms and ecological relevance. N. Phytol. 2013, 198, 656–669. [Google Scholar] [CrossRef] [PubMed]
  47. Huang, Z.; Xu, Z.; Blumfield, T.J.; Chen, C.; Bubb, K. Soil nitrogen mineralization and fate of (15NH4)2SO4 in field-incubated soil in a hardwood plantationof subtropical Australia: The effect of mulching. J. Soils Sediments 2008, 8, 389–397. [Google Scholar] [CrossRef]
  48. Pan, K.; Xu, Z.; Blumfield, T.J.; Tutua, S.; Lu, M. Application of (15NH4)2SO4 to study N dynamics in hooppine plantation and adjacent native forest of subtropicalAustralia: The effects of injection depth and litter addition. J. Soils Sediments 2009, 9, 515–525. [Google Scholar] [CrossRef]
  49. Buchmann, N.; Gebauer, G.; Schulze, E.D. Partitioning of 15N-labeled ammonium and nitrate among soil, litter, below- and above-ground biomass of trees and understory in a 15-year-old Piceaabies plantation. Biogeochemistry 1996, 33, 1–23. [Google Scholar] [CrossRef]
  50. Sheng, W.P.; Yu, G.R.; Fang, H.J.; Jiang, C.M.; Yan, J.H.; Zhou, M. Sinks for inorganic nitrogen deposition in forest ecosystems with low and high nitrogen deposition in China. PLoS ONE 2014, 9, e89322. [Google Scholar] [CrossRef] [PubMed]
  51. Wang, Y.; Cheng, S.; Fang, H.; Yu, G.; Xu, M.; Dang, X.; Li, L.; Wang, L. Simulated nitrogen deposition reduces CH4 uptake and increases N2O emission from a subtropical plantation forest soil in southern China. PLoS ONE 2014, 9, e93571. [Google Scholar] [CrossRef] [PubMed]
  52. Matson, P.A.; McDowell, W.H.; Townsend, A.R.; Vitousek, P.M. The globalization of N deposition: Ecosystem consequences in tropical environments. Biogeochemistry 1999, 46, 67–83. [Google Scholar] [CrossRef]
  53. Azam, F.; Asharf, M.; Lodhi, A.; Sajjad, M.I. Fate and interaction with native soil N of ammonium N applied to wetland rice (Oryza sativa L.) grown under saline and non-saline conditions. Biol. Fertil. Soils 1992, 13, 102–107. [Google Scholar] [CrossRef]
  54. Lin, S.; Dittert, K.; Wu, W.L.; Sattelmacher, B. Added nitrogen interaction as affected by soil nitrogen pool size and fertilization-significance of displacement of fixed ammonium. J. Plant Nutr. Soil Sci. 2004, 167, 138–146. [Google Scholar] [CrossRef]
  55. Ochoa-Hueso, R.; Maestre, F.T.; de los Ríos, A.; Valea, S.; Theobald, M.R.; Vivanco, M.G.; Manrique, E.; Bowker, M.A. Nitrogen deposition alters nitrogen cycling and reduces soil carboncontent in low-productivity semiarid Mediterranean ecosystems. Environ. Poll. 2013, 179, 185–193. [Google Scholar] [CrossRef] [PubMed]

