Article

Detection and Analysis of Forest Clear-Cutting Activities Using Sentinel-2 and Random Forest Classification: A Case Study on Chungcheongnam-do, Republic of Korea

1
Forest ICT Research Center, National Institute of Forest Science, 57, Hoegi-ro, Dongdaemun-gu, Seoul 02455, Republic of Korea
2
Department of Forestry, Environment and Systems, Kookmin University, 77, Jeongneung-ro, Seongbuk-gu, Seoul 02707, Republic of Korea
*
Author to whom correspondence should be addressed.
Forests 2024, 15(3), 450; https://doi.org/10.3390/f15030450
Submission received: 6 February 2024 / Revised: 23 February 2024 / Accepted: 25 February 2024 / Published: 27 February 2024

Abstract

:
This study provides the methodology for the development of sustainable forest management activities and systematic strategies using national spatial data, satellite imagery, and a random forest machine learning classifier. This study conducts a regional province-scale approach that can be used to analyze forest clear-cutting in South Korea; we focused on the Chungcheongnam-do region. Based on spatial information from digital forestry data, Sentinel-2 satellite imagery, random forest (RF) classifier, and digital forest-type maps (DFTMs), we detected and analyzed the characteristics of clear-cut areas. We identified forest clear-cut areas (accounting for 2.48% of the total forest area). The methodology integrates various vegetation indices and the RF classifier to ensure the effective detection of clear-cut areas at the provincial level with an accuracy of 92.8%. Specific leaf area vegetation index (SLAVI) was determined as the most important factor for accurately detecting clear-cut areas. Moreover, using a DFTM, we analyzed clear-cutting characteristics in different forest types (including private, national, natural, and planted forests), along with age class and diameter-at-breast-height class. Our method can serve as a basis for forest management and monitoring by analyzing tree-cutting trends in countries with forest areas, such as Republic of Korea.

1. Introduction

Forests provide important basic provisional, ecosystem, and socioeconomic services that are essential for life at the global scale [1,2,3]. Forests also act as significant sinks for atmospheric carbon dioxide and play an important role in mitigating climate change. Hence, there is growing global recognition of the importance of forests, with respect to adapting to climate change and the effective regulation of atmospheric carbon dioxide concentrations. With respect to adapting to climate change, the importance of forest management has been increasingly emphasized. In response, various strategies have been deployed to monitor and assess forest management while exploring its role in environmental sustainability [4]. Globally, forests cover 4.06 billion ha, accounting for 31% of the total land area, and the area with forest management plans significantly increased from 233 million ha in 2000 to 2.05 billion ha by 2020 [5]. Generally, forest management activities follow a cyclical process of afforestation, forest tending, tree-cutting (harvesting), and reforestation (to produce forest products) to maintain the health of the forest ecosystem. Among forest management activities, tree-cutting is closely related to carbon emissions on a global scale, and regionally, it is deeply related to timber use and income. Therefore, tree-cutting should be performed comprehensively, while considering the forest’s carbon sequestration and its economic and commercial situation. Furthermore, strategically implemented tree-cutting can ensure the sustained effectiveness of forests as carbon sinks. However, there is a global trend of increasing illegal tree-cutting. Therefore, quantitative tracking of tree-cutting at the national and regional levels is required to manage carbon emissions and conserve forest ecosystems.
Previous studies analyzed the impact of tree-cutting on carbon dioxide emissions and assessed the effectiveness of reforestation efforts at the regional and national scales. Such studies were conducted globally using remote sensing (RS) because RS is useful for large-scale detection and monitoring. These studies used multispectral sensors from MODIS, Landsat, and Sentinel-2 satellite imagery at moderate and finer spatial resolutions (100 m, 30 m, 10 m) to detect tree-cutting areas [6,7,8,9,10,11,12], used very-high-spatial-resolution imagery (e.g., WorldView-4 ~0.3 m, Pleiades’ (1A/1B) ~0.5 m, and Quick bird ~1 m) to detect small-scale or selective tree-cutting, and applied methods to detect forest cover changes by classifying land use changes using multispectral bands or vegetation indices (VIs). The application of remote sensing to derive VIs, including the normalized difference vegetation index (NDVI) and enhanced vegetation index (EVI), is the most commonly adopted method for monitoring forest change. These studies confirmed that tree-cutting patterns can be accurately detected with high accuracy using multispectral bands; this is mainly because in a temporal image dataset, this type of cover change in forested land is generally expressed as a large spectral contrast [6,7]. In addition, clear-cutting studies that cover large geographical areas and are based on relatively dense and freely available multispectral imagery [13]. Recent studies focus on integrating VIs with machine-learning techniques to achieve accurate land use and forest change detection [14,15,16,17,18]. Machine learning techniques have attracted considerable interest from multidisciplinary fields, especially the field of remote sensing, because these techniques provide a high classification accuracy and are robust to noise [19,20,21,22,23,24]. Maximum likelihood, random forest (RF), deep learning, artificial neural networks (ANNs), conventional neural networks, and fuzzy classification are used to analyze forest and land cover changes. Among these classifiers, RF has gained attention and evolved due to its improved accuracy using training data, efficiency, and comparatively low computational process [16]. Therefore, the RF classifier has frequently been applied in forest distribution attribution algorithms; in general, it includes a suite of predictor variables to optimize the classification results. Notably, RF classification has proven to be a successful and powerful method for separating classes [25]. Moreover, the RF classifier is a popular ensemble method used for various remote sensing applications, e.g., vegetation mapping. The basic concept of an ensemble classifier is that a combination of multi-base classifiers can provide better prediction results than a single classifier; RF classifiers have been successfully applied for various classifications, using remote sensing data [19]. To achieve successful classification using RF, it is important to have sufficient and accurate data for training. Previous studies have only used ground truth data from areas where tree-cutting has occurred, identified through Google Earth, visual interpretation, and small size of field data [11,16,17,19,26,27]. The collection of ground truth data can help to calibrate other sources of data, such as remote sensing data, using geographic information systems (GISs), and also support the interpretation and analysis of satellite imagery and aerial photography, among other methods of remote data collection [28]. In the Republic of Korea, ground base national spatial data that can be used for training data to detect tree clear-cutting are collected. Therefore, using such spatial data would enable the accurate detection of clear-cutting.
The Republic of Korea shares the Yellow Sea with the People’s Republic of China to the west and the East Sea and Korean Straits with Japan to the east and the south (125°04′ and 131°52′ E longitude, 38°27′ N latitude). The Republic of Korea’s total forest area is 6.29 million ha, accounting for 62.2% of the country’s land area; thus, the country requires robust forestry and effective activities to manage forest resources. Recently, in the Republic of Korea, with the increasing emphasis on the importance of the role of forests in climate change and the need for sustainable management, the country has initiated a policy shift toward environmentally sustainable harvesting methods and is currently discussing sustainable forest management to achieve carbon neutrality and the nationally determined contribution (NDC) targets. In the Republic of Korea, 67% of forests are privately owned [29], making the active participation of private forest owners essential for the effective implementation of related policies. However, most owners prefer clear-cutting to maximize profits. Therefore, a systematic approach is necessary to manage the cyclical system of clear-cutting, reforestation, and utilization for sustainable forest management. The Korea Forest Service implements a system to collect and manage spatiotemporal management information from local governments. As a national business, they have performed projects such as construction of Digital Forestry (DF) data, which spatializes information on forest management activities conducted in private forests. However, it has yet to be able to be used as a national data source due to large variations in collection rates by region. Local governments are responsible for permitting and managing tree-cutting activities in private forests; the collection and management of data on this level are insufficient, resulting in a lack of comprehensive data on tree-cutting in national spatial data. Therefore, collecting systematic data is necessary to manage carbon sink and establish sustainable forest management policies at the national level. Furthermore, the government should attempt to mediate and change forest management activities by arranging consultations with the aim of developing and promoting effective and sustainable forest management activities and policies.
The purpose of this study was to provide a methodology to detect and analyze clear-cut areas used by national spatial data (DF data) and VIs from Sentinel-2 imagery and an RF classifier. Furthermore, we aimed to understand forest management activities and support policymaking by identifying the characteristics of clear-cut areas through integration with DFTMs.

2. Materials and Methods
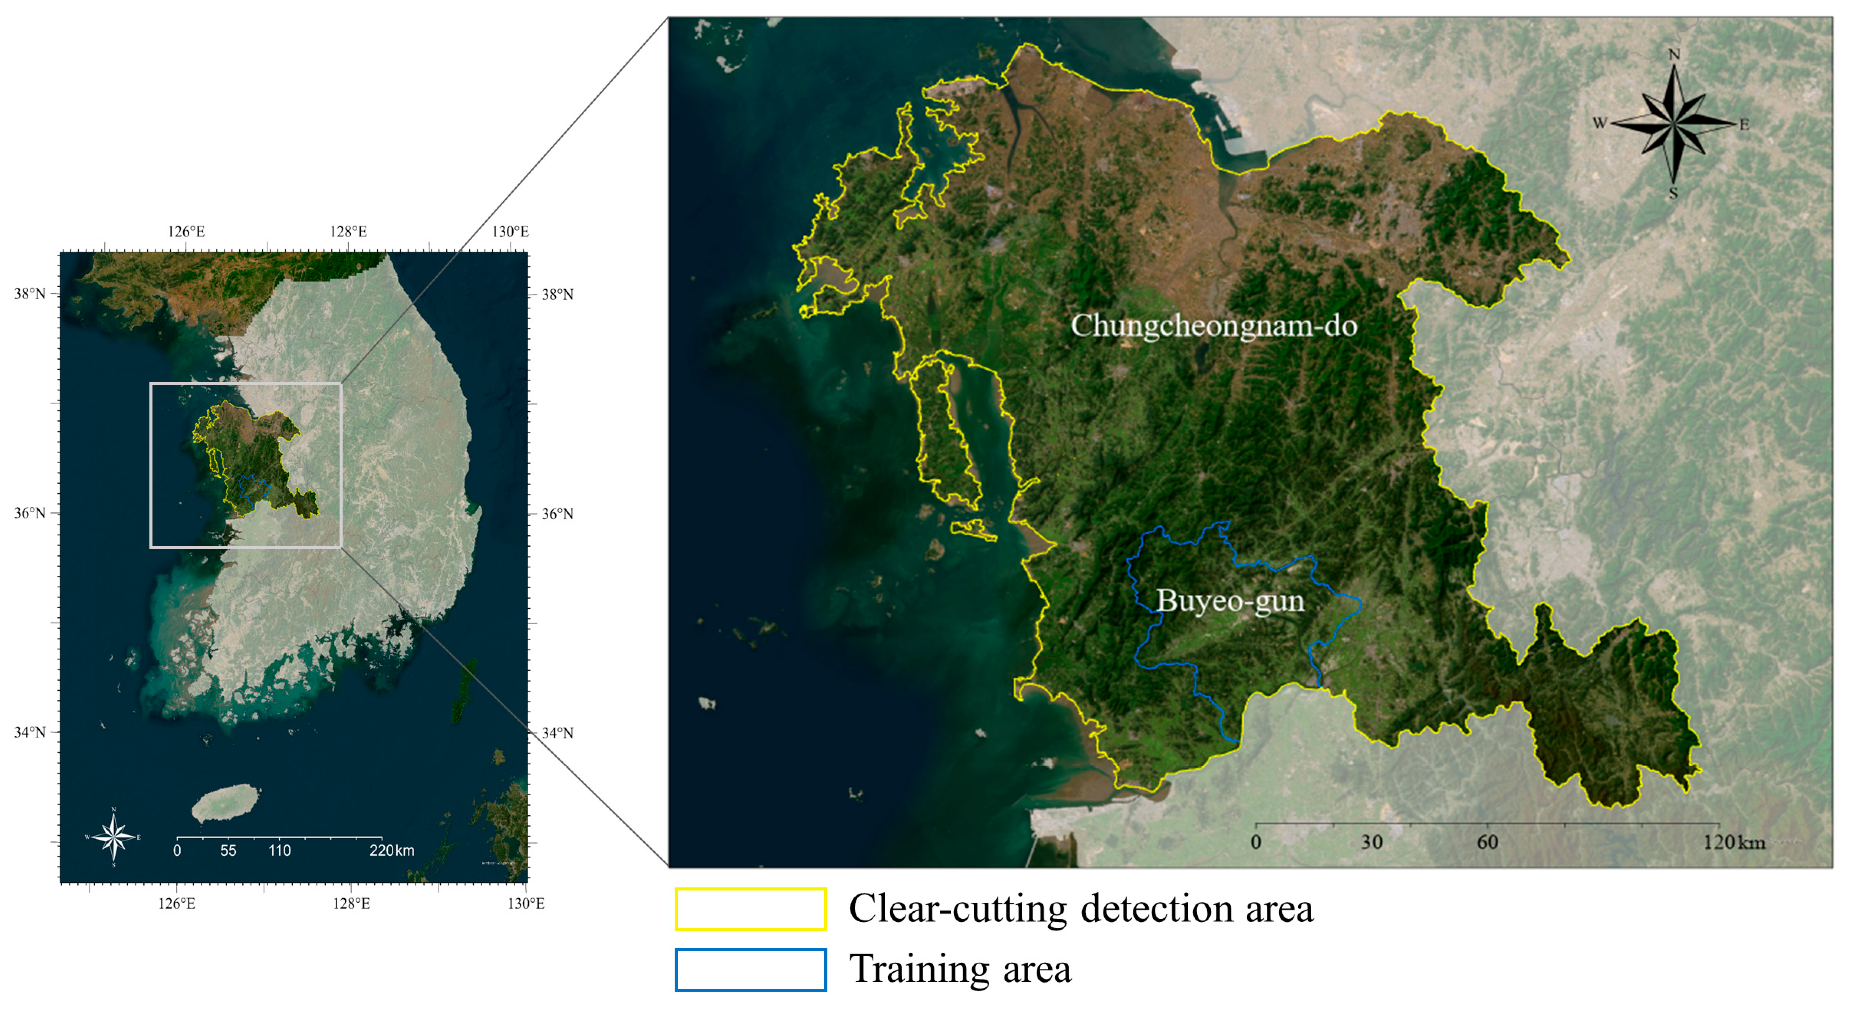
2.1. Study Area

In this study, the detection of tree-cutting was conducted in Chungcheongnam-do, and the training area for the RF was Buyeo-gun, a regional unit within Chungcheongnam-do. Chungcheongnam-do is one of the 17 provinces in the Republic of Korea, located in the west of the country’s center (latitude: 35°59′02″–37°04′19″ N; longitude: 126°06′39″–127°37′23″ E), with a total forest area of 404,927 ha, accounting for 6.4% of the Republic of Korea’s total forest area. In Chungcheongnam-do’s forests, deciduous forests represent 37.0%, coniferous forests 46.0%, and mixed forests 12.3%. Medium-sized trees represent 66.0% of the tree size class, small-sized trees 24.0%, saplings 9.0%, and large-sized trees 1.0%. In addition, 87.0% of the forests in Chungcheongnam-do are privately owned, leading to various activities being performed to gain income from forests. Chungcheongnam-do was selected as the study area because it has a relatively large amount of Digital Forestry (DF) data (data constructed from spatial data between 2015 and 2022 that contains all aspects of forestry information at the local and national levels in the Republic of Korea and provides forest management activity information) containing information on forest management activities in the Republic of Korea compared to other provinces. Therefore, sufficient training and validation data can be used for RF.
The training area, Buyeo-gun (latitude: 36°16′35″ N; longitude: 126°54′40″ E), covers a land area of 62,450 ha, which amounts to 8% of the total land area of Chungcheongnam-do; 31,964 ha (47%) of land in Buyeo-gun is forested. Buyeo-gun was selected for its efficiency in running the RF classifier, as it had the highest amount of DF data per forest area within Chungcheongnam-do (Figure 1).
By using this scale-up method, it will be possible to detect tree-cutting in larger areas with only small amounts of data from field surveys or small-scale regions, thereby providing local governments and others with valuable data on clear-cut areas.
We performed the detection process in areas where the forest area in digital forest- type maps (DFTMs) overlapped with the forest land in cadastral maps (CDMs). In the Republic of Korea, forest areas have different definitions based on the land cover and land use concept, resulting in the construction of different spatial datasets. In DFTMs, using the land cover concept, forests are defined as covered forests if they cover areas of at least 0.5 ha, or plantation forests if they cover an area of more than 0.1 ha of trees [29]. However, CDMs, using the concept of land use and management, define forests as areas that contain trees, including rocky areas and small-scale residential areas within forest boundaries [30]. Forest management activities in the Republic of Korea are conducted based on CDMs. However, within CDMs, there are areas where the actual land cover is not forested, which can lead to the false detection of tree-cutting in these areas. Therefore, in this study, based on these two spatial datasets, we selected the areas that were uniquely classified as “forests”. This approach ensures an accurate analysis of clear-cutting and avoids potential misclassifications of urban areas or other non-forested areas as clear-cut areas, thereby increasing the accuracy and relevance of the results. Table 1 presents the data considered for setting the spatial range for this study.
The details of the forest areas considered in this study and their characteristics within the spatial data range in Chungcheongnam-do are shown in Table 2. The total forest area covers 329,042 ha, with national forests accounting for 40,275 ha and private forests accounting for 288,789 ha, with the latter accounting for 88% of the total forest area.

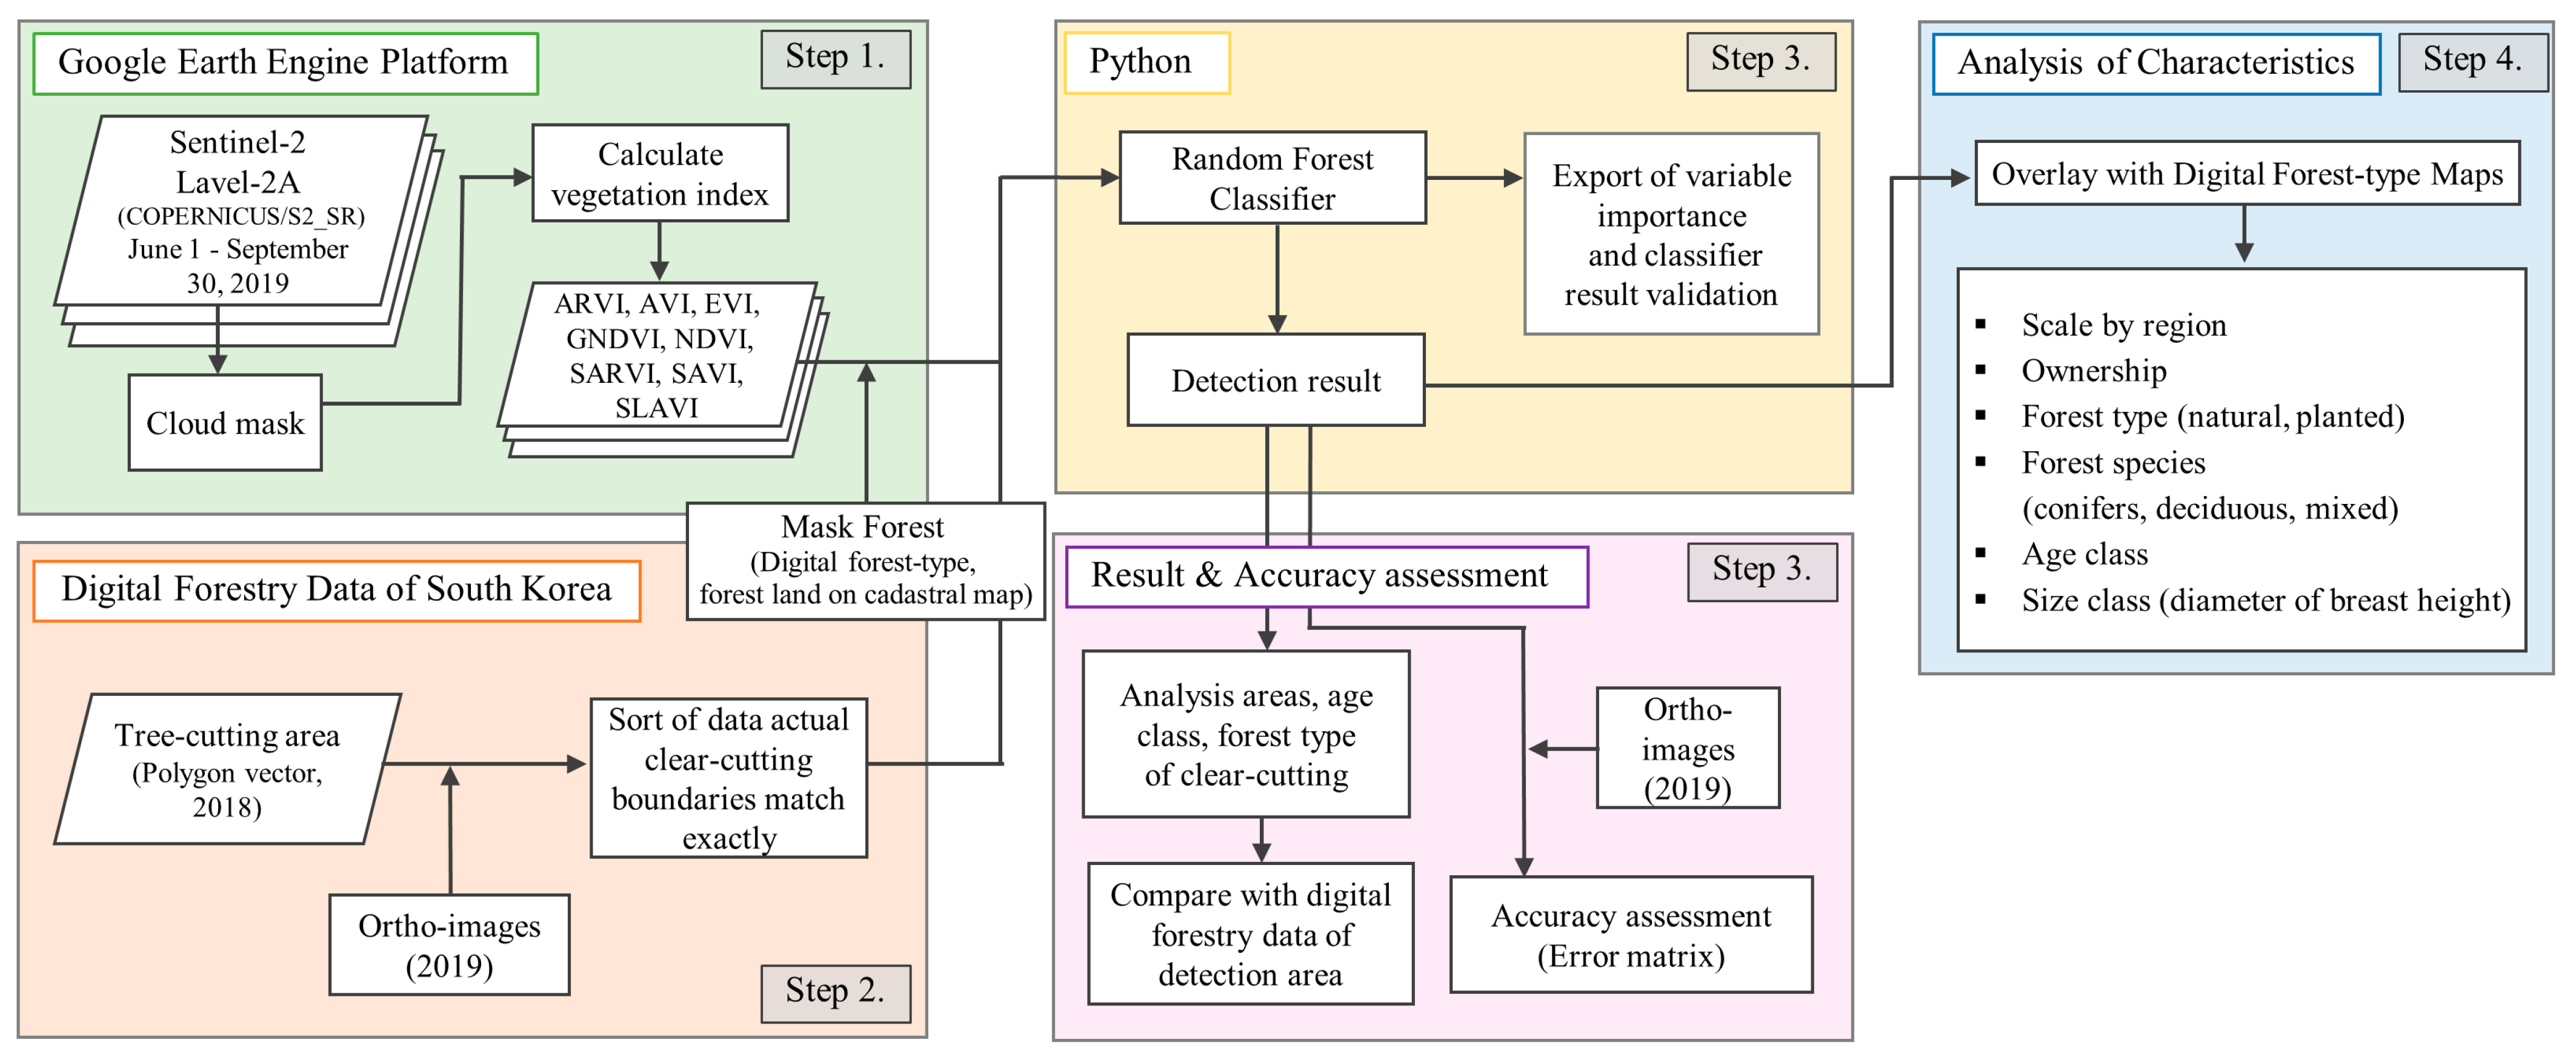
2.2. Workflow Overview

The workflow consisted of the following steps: (1) obtaining vegetation indices, (2) acquiring the training and validation datasets from the vegetation index values that were calculated based on DF data for clear-cut areas (for RF classification), (3) detecting the clear-cut areas with RF and validating the detection results through accuracy assessment, and (4) analyzing the characteristics of the clear-cut areas using DFTMs (Figure 2).

2.3. Data Collection

2.3.1. Vegetation Indices (VIs)

VIs were used to train the RF classifier to ensure the accurate detection of clear-cut areas. In this study, VIs were based on different wavelength reflectance in the electromagnetic spectrum for each target, achieved using both active and passive sensors [26]. These indices were designed to highlight specific properties of vegetation [27]. We used the VIs that minimized the effects of the atmosphere and soil, i.e., atmospherically resistant vegetation index (ARVI), advanced vegetation index (AVI), soil and atmospherically resistant vegetation index (SARVI), and soil-adjusted vegetation index (SAVI). Several previous studies developed VIs to minimize the effects of atmospheric aerosols and soil reflectance [28,29,30,31,32]. In addition, we used the green normalized difference vegetation index (GNDVI), normalized difference vegetation index (NDVI), enhanced vegetation index (EVI), and specific leaf area vegetation index (SLAVI), which are widely used to assess biomass and vegetation density [33,34]. We used these eight indices to determine the ones that were the most suitable for analyzing the areas affected by clear-cutting. The VIs were computed using the spectral bands of Sentinel-2 on the Google Earth Engine (GEE) platform (Table 2). Sentinel-2 data, which have a high spatial resolution of 10 m for bands in the visible and near-infrared spectra, allowed for the detection of changes in smaller areas and the identification of individual clear-cutting events; GEE provided the fundamental calculation functions for the raster and vector data, along with the application programming interfaces (APIs) for JavaScript and Python [35]. We calculated the VIs using the spectral bands of Sentinel-2 Level-2A (COPERNICUS/S2_SR) in the GEE. Level-2A processing included corrections for atmospheric gases, aerosols, and Rayleigh scattering effects, thus significantly improving the data quality. This enhanced quality was beneficial to accurately computing the VIs. The VIs were computed using the Level-2A images from 1 June 2019 to 30 September 2019, when the cloud cover was less than 10%. We used the median values of these indices from the images collected for the analysis. Table 3 presents the details of the VIs calculated for this study using Sentinel-2 data.

2.3.2. Training and Validation Dataset

The training and validation datasets were obtained from the Republic of Korea’s DF data for 2018. This dataset consisted of polygonal spatial data containing information on forest management, e.g., afforestation, tending, and harvest-cutting in national, public, and private forests. The purpose of the data collection was to systematically analyze and manage the forest management activities in the Republic of Korea, including the identification of target areas and prevention of duplication of forest-management activities. To detect clear-cutting in the Republic of Korea, we used the available Sentinel-2 satellite imagery. However, due to the spatial resolution limitations of the satellite images (10 m), detecting selective logging and forest thinning activities proved challenging. Therefore, our study focused on detecting clear-cutting. However, the spatial information for clear-cutting in this dataset is not well-detailed, because the data are based on forestland registers and the cadastral numbers of areas where forest management activities were conducted. To address this issue, we compared the DF data with orthoimages acquired from National Geospatial-Intelligence Platform (https://map.ngii.go.kr/, accessed on 24 December 2023) to identify the areas for which clear-cutting and spatial information matched exactly. In the Republic of Korea, clear-cutting generally begins after September and lasts for less than six months. The analysis used DF data from 2018, which is earlier than the acquisition time of the Sentinel-2 satellite imagery in 2019. From the 533 original data polygons collected for Buyeo-gun (the target area for training), we used 127 polygons as the training data.

2.4. Detection of Clear-Cut Areas Using Random Forest Classifier

We used an RF classifier that has been successfully applied for various classifications using remote sensing data [19]. The RF algorithm generates and combines multiple decision tree classifiers for classification and prediction and is known for its immunity to overfitting (relative to other models), making it a robust choice for such analyses. In addition, RF provides a simple method for evaluating the importance of each variable in the prediction process. This feature was used to identify the relevant spectral bands or derive the indices that were important for detecting the areas of change. The RF algorithm was used with VIs from the training datasets (based on DF data) to classify the clear-cut areas. The DF data were divided into an 80% training set and 20% validation set for processing. A five-fold cross-validation method was used within the training set to ensure robustness. The performance of the RF classifier was evaluated using various metrics, such as accuracy, precision, recall, and F1 score. The variable importance of VIs were evaluated using the mean decrease in impurity (MDI) importance method. This method measures the importance of each feature in a decision tree. The process is used to determine the importance of different features based on the decrease in data impurities. MDI importance is often used in tree-based machine learning models because it provides an intuitive understanding and straightforward interpretation of feature importance. Therefore, in this study, MDI was used to analyze the importance of VIs and determine the indices that should be prioritized when analyzing clear-cut areas. In this study, clear-cut areas were identified by the overlapping spatial extent of forest land in CDMs and DFTMs, thereby setting the detection area. Note that we excluded results for areas smaller than 0.5 ha. This exclusion was based on the regulatory context in the Republic of Korea, wherein clear-cutting activities within small areas (<0.5 ha) do not require national or local government permission. This exclusion was essential because data for smaller areas were generally not included in the dataset, leading to an increase in the error and inaccuracy of the study results.

2.5. Accuracy Assessment

To assess the accuracy of the RF classifier in detecting clear-cut areas, a confusion matrix was constructed using validation samples. This matrix was used to calculate the overall accuracy and kappa coefficients of the classifier. The process of constructing the confusion matrix included a comparative analysis of the 2019 orthoimages, focusing on sampled points within both clear-cut and non-clear-cut areas.
Visual interpretation methods were used for comparison. Clear-cut areas were primarily identified by specific land cover, e.g., grassland and the presence of harvested trees in rows (which are characteristic indicators of clear-cutting activities). The sample size for accuracy assessment was determined by random selection from each class (clear-cut and non-clear-cut areas). This sample size was determined while achieving a 95% confidence level and 3% sampling error for each pixel count, resulting in 1100 sample points for each class of more than 1068 clear-cut area and 1063 non-clear-cut area samples, respectively.

2.6. Characteristics Analysis of the Clear-Cut Areas

In this study, we used DFTMs to analyze the detection results. The maps included the spatial distribution and detailed attributes of forests in the Republic of Korea, e.g., tree species, types, age class (age classes are classified in 10-year intervals), and diameter at breast height (DBH) class. These data provide an understanding of the characteristics of the clear-cut areas identified by the RF classifier, e.g., ownership type (national or private forest), forest composition (natural or planted forest), age class, and DBH class. Thus, our study can serve as a foundation for the development of systematic management strategies for future clear-cutting activities in the Republic of Korea.

3. Results

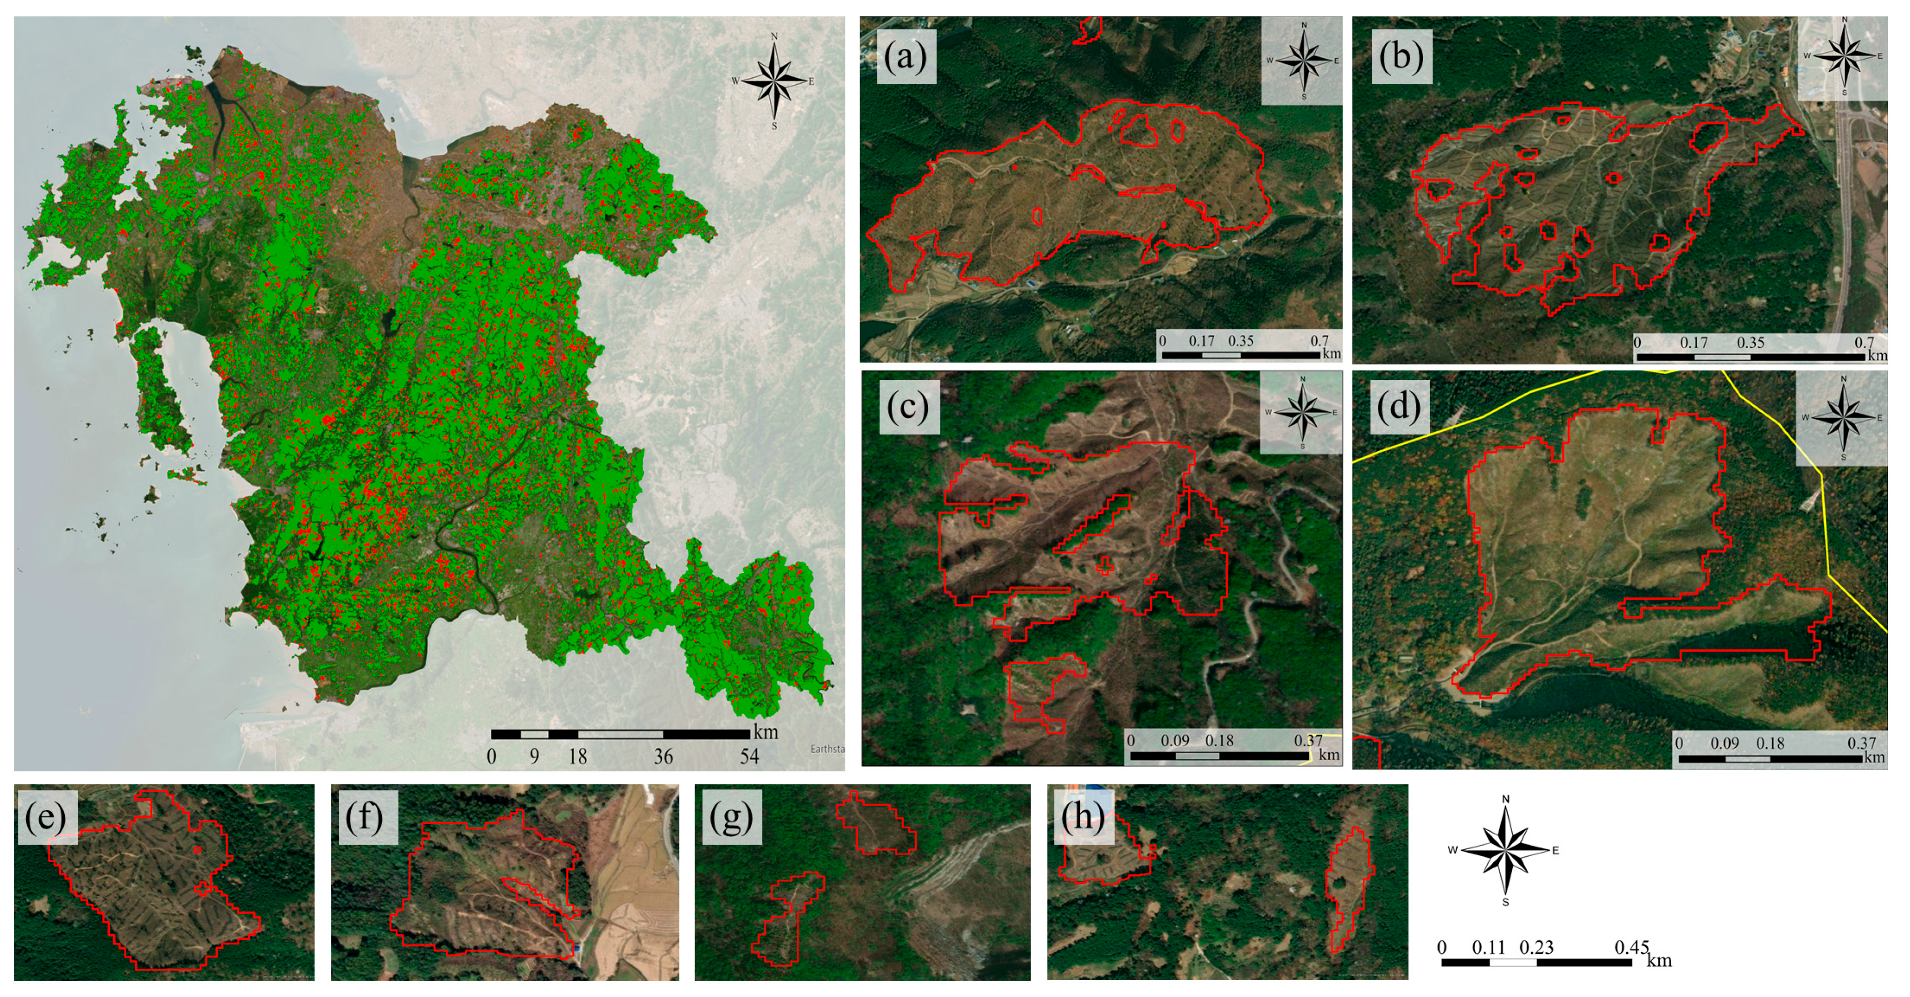
3.1. Detection of Clear-Cut Areas

The analysis of clear-cut areas in Chungcheongnam-do (conducted using the RF classifier) detected that the total clear-cut area was 8164.0 ha, accounting for 2.5% of the total forested area (Figure 3). Compared to national and DF data statistics, our result indicates a more extensive coverage of clear-cut areas in Chungcheongnam-do. The area of clear-cutting detected by the RF classifier exceeded the estimations of 7300.6 ha reported in the DF data and those of 6456.0 ha reported in national statistical data [41].
For Chungcheongnam-do, the analysis of clear-cutting detection results at the regional level indicated that the total clear-cut area composed of areas of 1 to 4 ha in scale was 3806.1 ha, accounting for 46.6% of the total clear-cut area in Chungcheongnam-do, the highest ratio. In the Republic of Korea, forest management tasks are directly managed by local governments. As a result, local governments are responsible for authorizing clear-cutting activities and providing related data to the government. However, they do not provide sufficient data on areas where clear-cutting is performed. Therefore, this study analyzed the characteristics of clear-cutting in various regions of Chungcheongnam-do. The results showed that large-scale clear-cut areas, ranging from 30 ha to 60 ha, were observed in Cheongyang-gun (119.0 ha), Gongju-si (85.2 ha), and Seosan-gun (32.4 ha). In particular, Gongju-si contained the highest clear-cut area (1470.0 ha) and Gyeryong-si had the smallest total clear-cut area (45.8 ha) (Table 4). This result has confirmed that there are differences in the scale of clear-cutting among the various regions of Chungcheongnam-do. Areas where large-scale clear-cutting has been conducted, as well as regions with relatively large clear-cut areas, have been identified. Furthermore, this result enables targeted management and supervision within the province for those areas that require it.

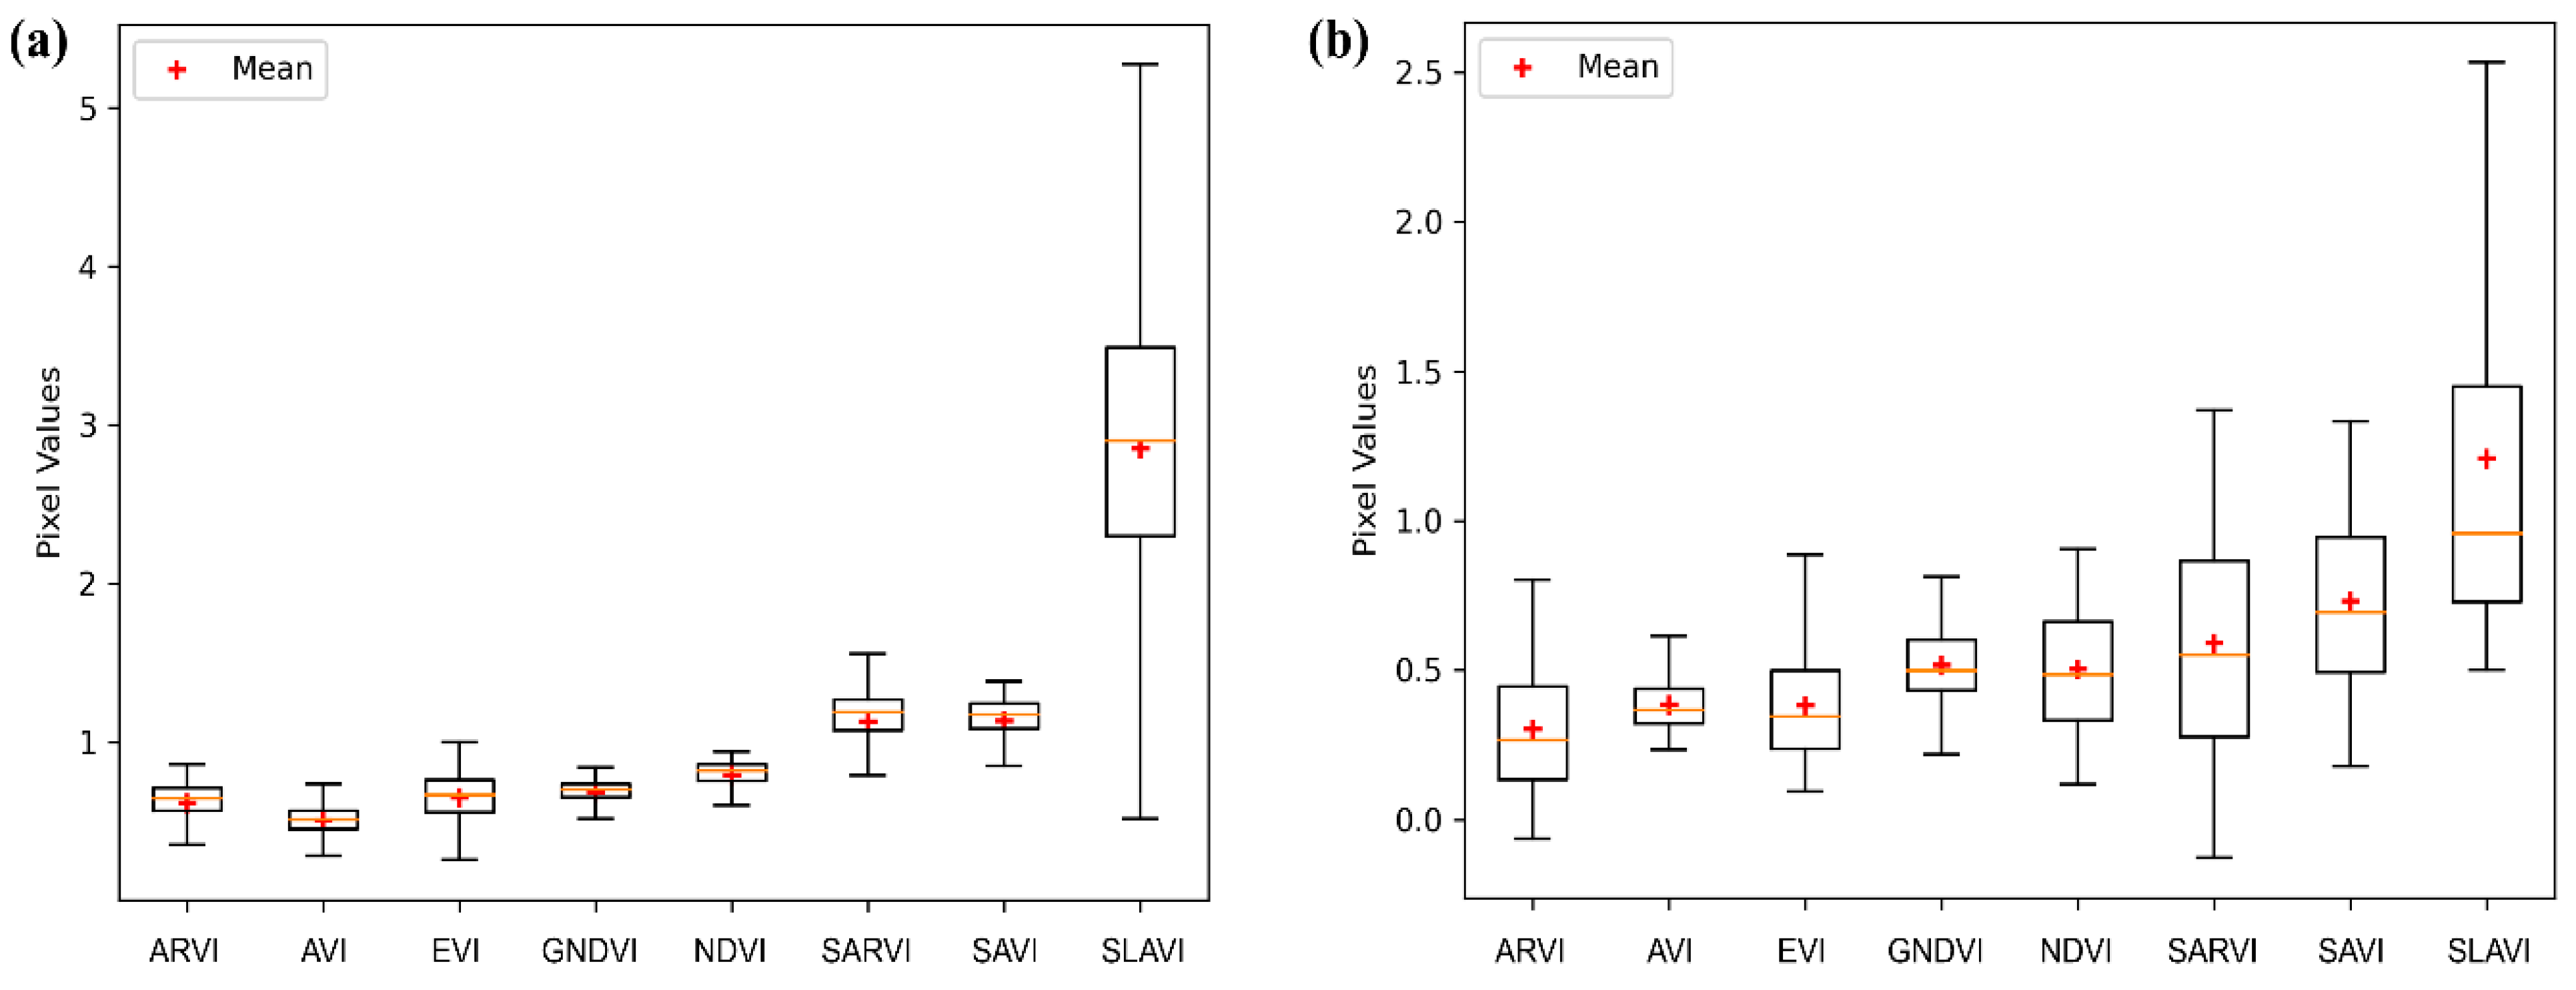
3.2. Accuracy Assessment, Variable Value, and Importance

With respect to the performance of the RF classifier for Buyeo-gun, the accuracy metrics indicated high precision and effectiveness. The classifier achieved precision, recall, and F1 scores of 1.0, indicating perfect classification accuracy. In the case of clear-cut area class detection accuracy, the precision, recall, and F1 score were 0.99, 0.76, 0.86, respectively. The overall average for both clear-cut area and forest area classes was impressive, with a precision of 0.99, a recall of 0.88, and an F1 score of 0.93. Furthermore, the accuracy assessment for detecting clear-cut areas in Chungcheongnam-do using the error matrix showed an overall accuracy of 92.8% and a kappa coefficient of 85.6%. These results indicated an “almost perfect” level of accuracy in the classifier’s performance. In detail, the producer’s accuracy for clear-cut areas was 91.2% and the user’s accuracy was 90.9%. For non-clear-cut areas, the producer and user accuracies were 94.5 and 94.7%, respectively. These results demonstrate the robustness and reliability of the RF classifier in detecting clear-cut and non-clear-cut forest areas.
The differences in VIs between clear-cut and non-clear-cut areas in Buyeo-gun were statistically verified. In non-clear-cut forest areas, the mean values of ARVI, AVI, EVI, GNDVI, and NDVI were 0.5–0.8, with standard deviations of 0.08–0.1. For SARVI and SAVI, the mean was 1.1, with a standard deviation of 0.2. The mean value of SLAVI was 2.8, with a standard deviation of 0.87 (Figure 4a). In clear-cut areas, the mean values of ARVI, AVI, and EVI were 0.3–0.4, with standard deviations of 0.1–0.2. The GNDVI and NDVI had mean values of 0.5, with standard deviations of 0.1 and 0.2, respectively. The SARVI and SAVI had mean values of 0.6 and 0.7, respectively, with standard deviations of 0.3, respectively. The mean SLAVI value was 1.2, with a standard deviation of 0.7 (Figure 4b).
When assessing the importance of the variables within the model, SLAVI was ranked as the most important index, whereas EVI and AVI were ranked as the least important indices. This difference may be attributed to SLAVI’s wide range of values compared to other VIs and its clear differentiation between values, specifically for the clear-cut areas. In contrast, EVI and AVI received lower importance scores because of the minor differences between values for clear-cut and non-clear-cut areas. The results indicate the effectiveness of SLAVI in identifying clear-cut areas; we conclude that it is an effective vegetation index for forest management monitoring. Table 5 presents the variable importance of the eight variables considered in this study based on the mean decrease in impurity (MDI) method.

3.3. Characteristics of Clear-Cut Areas

The results obtained using the RF classifier and analyzed using the DFTMs demonstrated the effectiveness of the proposed method for characterizing clear-cut areas. In Chungcheongnam-do, 2.4% of privately owned forests and 0.1% of national forests were clear-cut areas relative to the total forest area. The analysis showed that within national forests, clear-cut areas were more prominent in natural forests than in planted forests, with the most extensive clear-cut areas observed in age class V (Figure 5a). In private forests, larger clear-cut areas were observed in age classes IV, V, and I, compared to those observed in other age classes. Furthermore, within privately owned forests, clear-cut areas were more extensive in natural forests than in planted forests (Figure 5b). However, the results of clear-cut areas divided by natural and planted forests in Chungcheongnam-do show that, in private forests, the proportion of clear-cut areas in planted forests was 3.4% of the total planted forest area, while the proportion of clear-cut areas in natural forests was 1.9% of the total natural forest area (Table 6). Moreover, the total clear-cut area in planted forests was higher, at 3.5%, than the area in natural forests, at 2.1%. The reason for this is that although natural forests represent 71.4% of the total forest area in Chungcheongnam-do, the proportion of the actual clear-cut area is lower than that of planted forests.
In planted forests, clear-cutting mainly occurred in age class I, with deciduous species being cut more frequently than coniferous species. The largest clear-cut area in planted forests was observed in age class I deciduous species; we noted a decreasing trend in clear-cut areas in older age classes. In coniferous forests, age class IV experienced the most extensive clear-cutting activities, followed by classes I and V (Figure 5c). In natural forests, the highest clear-cutting occurred in age classes IV and V, with deciduous and coniferous species undergoing clear-cutting mainly in age classes IV and class V, respectively (Figure 5d). However, the ratio of clear-cut trees by species was found to be similar, at 1.8% for conifers and 1.6% for deciduous trees, and the ratio of harvested area by species was found to be the highest, at 4.0%, for age class Ⅵ conifers in planted forests. In natural forests, conifers and deciduous trees underwent clear-cutting at a similar rate of 0.9%, with the highest rate of clear-cutting at 1.9% for age class I deciduous trees (Table 7).
With respect to DBH class in clear-cut areas in planted and natural forests, a higher proportion of clear-cut areas was found in classes with medium-diameter trees (18–29 cm), accounting for 40 and 80.5% of planted and natural forests, respectively (Figure 5e,f).
According to DBH class, the highest proportion of clear-cut areas in planted forests was found for small-diameter trees, which accounted for 4.1%, followed by large-diameter trees, at 3.2%. In natural forests, the highest proportion of young growth reproduction was found to be 2.4%, followed by 2.1% in the medium-diameter tree class (Table 8). The result of clear-cutting trends obtained through overlay analysis with DFTMs shows that while there are differences between natural and planted forests in terms of area and tree species when considering the composition of forests within Chungcheongnam-do, a higher rate of clear-cutting is observed in planted forests compared to natural forests. The rates of clear-cutting are highest in age classes V and Ⅵ, and tree species are clear-cut relatively similarly. Additionally, in terms of DBH class results, clear-cutting occurred prominently in young growth reproduction, followed by higher rates in larger diameter classes.

4. Discussion

4.1. Discussion of Result

This study used spatial data on forest management from the Republic of Korea to detect and analyze clear-cut areas at the provincial level. VIs from Sentinel-2 imagery and an RF classifier were applied to achieve this. Overlay analysis with DFTMs further identified clear-cutting characteristics, enhancing our understanding of forest management’s spatial dynamics.
Although the RF classifier in this study was highly accurate, it detected discrepancies of 863.4 ha and 1708.0 ha in clear-cut areas in Chungcheongnam-do when compared to national statistics and DF data, respectively. As indicated by Ham et al. [42], these discrepancies may be due to inconsistencies between spatial and management registry data. National statistical data on forest management in the Republic of Korea are based on cadastral registry data, which may not be consistent with spatially focused data. In a scenario wherein accurate registry data on forest management activities are unavailable, DF data are generally based on the area of cadastral parcels, resulting in discrepancies from the actual areas of activities. Registry data and spatial discrepancies indicate potential variances in actual forest management activities. The significance of a well-defined training dataset is critical in machine learning models, affecting model accuracy and reliability. Therefore, for accuracy and consistency, obtaining precise spatial and location information through comparative analysis with remote sensing results [42,43], as shown in this study, is important. Enhancing the accuracy of national statistics and detection outcomes necessitates boosting DF data collection rates and ensuring precise field and spatial data gathering. The RF classifier’s accuracy is significantly influenced by training data characteristics, such as sample size, class proportions, and spatial autocorrelation. Utilizing a larger training sample has been shown to reduce both out-of-bag and independent assessment errors. Therefore, larger training sample sizes are recommended to enhance RF classifier accuracy and stability [44]. This underscores the importance of extensive field data collection and the continuous enhancement of digital forest management resources. Such data collection and processing advancements facilitate more precise and reliable assessments and can support effective forest management and policymaking.
This study detected clear-cut areas effectively using VIs. The importance of the variables in the RF classifier was demonstrated. Compared to previous studies, which primarily relied on NDVI and EVI, we included additional indices to reduce soil and atmospheric effects, improving accuracy [45,46,47,48,49,50]. These VIs enhanced land cover classification for forests and other land types. Including diverse datasets broadened the spectral signatures for RF classifier training, enhancing classification accuracy with training data variability [51,52]. Among the eight VIs evaluated, SLAVI, which reflects changes in plant leaf surface and photosynthetic activity, was the most important. Morcillo-Pallarés et al. [53] confirmed the effectiveness of SLAVI in identifying vegetation conditions, as it has a positive correlation with NIR and SWIR bands and a negative correlation with the red band. SLAVI’s design also makes it unaffected by cloud shadows, providing reliable detection capabilities [54]. Bolyn et al. [55] and Boonprong et al. [56] noted the critical role of SWIR in mapping forest species and monitoring forest regeneration, with SLAVI being the only index to include the SWIR band. Although EVI and AVI were useful for evaluating vegetation productivity and coverage, SLAVI was found to be superior in detecting vegetation presence and reducing soil reflectance effects, making it ideal for identifying sparse vegetation areas [40]. Future research should focus on exploring SLAVI’s applicability in detecting clear-cutting.
In the analyzing of characteristics, the majority of clear-cutting was noted in age classes III–V, which corresponded to the legal harvest age. However, we noted a considerable amount of clear-cutting of deciduous species within age class I in planted forests. Related to these age class results, it was also found that the rate of clear-cut areas with a DBH class of less than 6 cm is high. These results are considered to be errors due to limitations in detecting clear-cut areas due to the resolution and time-series of satellite imagery, where areas already afforested as age class Ⅰ do not appear to have a dense tree cover. These errors may also be related to the update cycle of DFTMs. In the Republic of Korea, attribute information for areas with forest management activities is updated annually. For other areas, attribute information is updated for one region per year, and it takes up to five years for the entire dataset to be updated. Therefore, future research should consider the regional update cycles of DFTMs to detect and analyze the characteristics of clear-cut areas more accurately. Using additional data from afforestation areas can help identify clear-cutting characteristics more accurately.
As a result, the detection, verification, and characteristics analysis of clear-cut areas require the use of data with more accurate information. To improve data precision and provide more meaningful and officially usable results at the national level, it is essential to construct data on forest management activities in a complementary approach, as was performed in this study, through the analysis of field or administrative records (documents or spatial data) and remote sensing data.

4.2. Limitation

This study has limitations. First, detection was limited to a single period, which may have caused discrepancies with national statistics. Previous research has shown the effectiveness of the RF classifier in detecting land use change and forest dynamics [16,57,58]; however, these studies have been limited to single-period analysis. This approach may include areas where clear-cutting occurred just before the base year of 2018, such as in 2017 or 2016, without reforestation. Therefore, time-series analysis is needed to accurately identify clear-cut areas over time [6,7,26,59,60,61]. Our study encountered limitations in conducting a time-series analysis due to the beginning of clear-cutting data construction in 2018 DF data, with no previous data. Future studies should focus on time-series analysis starting in 2018 to detect clear-cut areas.
Second, in this study, while high-accuracy detection was achieved through the RF classifier, this study identified false positives in areas with lower forest density and exposed ground, such as rocky areas and forest roads. Therefore, it is possible to identify a more suitable machine learning approach for detecting clear-cut areas through comparative analysis with other methods (e.g., CNNs, U-net, AdaBoost, K-NN, ANN). These machine learning methods can effectively learn high-dimensional features, improve generalization abilities, and iteratively refine training results for enhanced detection accuracy. Therefore, future research should compare these machine learning approaches to evaluate their utility and accuracy. Additionally, our result indicates the necessity of incorporating ancillary data, such as land cover and forest road network maps, in future research to enhance detection accuracy.
Third, the spatial resolution limitations of remote sensing data can impact the accuracy of the detected boundaries and areas. The detectable size of clear-cut areas varies with the resolution of remote sensing data. Junaid et al. [16] detected large tree-cutting areas at a 50 m resolution and identified smaller areas at a 20 m resolution. Sentinel-2 imagery offers meaningful information at the national and regional scales, as supported by various studies [17,62,63,64]. In this study, we detected small clear-cut areas, but spatial resolution may have led to inaccuracies in boundary detection, especially at the edges. These discrepancies can be rectified with higher-resolution aerial imagery. If high-resolution remote sensing imagery is used, it is useful to combine a RF classifier with texture analysis [65]. Clear-cut areas reveal the ground surface, which differs in characteristics from areas with grassland and shrubbery or regions with rocks. This integration can help reduce the false positives associated with resolution and provide a more accurate analysis by including additional factors related to the object’s characteristics.

4.3. Implications

Integrating remote sensing imagery and RF classifier detection results with spatial datasets is a powerful approach for collecting comprehensive data for analyzing and managing clear-cut areas. Forests are characterized by diverse activities and varying ownership, covering extensive areas. Collecting data on forest management activities can be challenging due to regional diversity. Integrating remote sensing clear-cutting detection with spatial data containing forest characteristics information (DFTMs) provides valuable insights into forest land use and cover. Additionally, analyzing ancillary spatial data such as forest roads, elevation, and slope can provide insights into clear-cutting practices and help identify illegal clear-cut areas. This methodology can provide deeper insights into forest conditions and management practices and enhance our understanding of the management status of clear-cutting at the regional and national levels for forest management decision-making. This approach improves our understanding of forest dynamics and aids in developing sustainable management strategies that balance ecological, economic, and social needs, ensuring the preservation of forest ecosystems. It is a methodology that can be adapted to different regions and countries to enhance forest management and detect areas targeted by REDD+ (reducing emissions from deforestation and forest degradation plus) in various countries.

5. Conclusions

In this study, we analyzed clear-cut areas in the Chungcheongnam-do region in the Republic of Korea. We accurately detected clear-cut areas by integrating spatial forest management data (DF data) with high-resolution Sentinel-2 satellite imagery using an RF classifier. The proposed approach, which combined various VIs and machine learning techniques, proved effective in detecting and analyzing clear-cut areas at the regional and provincial levels. We identified clear-cutting patterns in different forest types and age classes using DFTMs. Furthermore, we verified the importance of specific VIs, particularly SLAVI, for accurately detecting clear-cut areas. However, the results portrayed a greater extent of clear-cutting than that reported in national statistics. This discrepancy may be related to limitations and inaccuracies in national and spatial data. The discrepancies between spatial and registry data and the limitations associated with single-period analyses may be the causes of this issue. However, these limitations provide opportunities for future studies. Notably, our study confirms the importance of conducting time-series analyses, including additional ancillary data, and considering spatial resolution when detecting clear-cut areas in forests.
Our study offers an effective methodology for monitoring and analyzing clear-cutting activities, thus contributing to forest management. This study presents an effective methodology for continuous data collection for forest clear-cut areas. The collected data can be used for the establishment of forest policies at the regional and national levels. Monitoring clear-cut areas is important for improving the efficiency of national forest restoration projects and establishing sustainable forest management strategies. The insights from our study can support policymaking and the development and implementation of sustainable and systematic forest management strategies at the national and regional levels. Notably, our method can serve as a basis for forest management and monitoring by analyzing tree-cutting trends in countries with complex forest conditions, such as Republic of Korea. Furthermore, this methodology could usefully be applied in identifying target areas for carbon reduction, such as REDD+.

Author Contributions

Conceptualization and methodology, S.-E.C., J.P. and S.L. (Sunjeoung Lee); investigation and analysis, S.-E.C. and S.L. (Suyeon Lee); writing, S.-E.C. and J.P.; review and editing, S.L. (Sunjeoung Lee) and J.Y.; funding acquisition, S.L. (Sunjeoung Lee); and supervision, J.K. All authors have read and agreed to the published version of the manuscript.

Funding

This study was funded by the R&D Program for Forest Science Technology (Project No. FM0200-2023-01-2023), provided by the National Institute of Forest Science.

Data Availability Statement

Data are contained within the article.

Conflicts of Interest

The authors declare no conflicts of interest.

References

  1. Potapov, P.; Yaroshenko, A.; Turubanova, S.; Dubinin, M.; Laestadius, L.; Thies, C.; Aksenov, D.; Egorov, A.; Yesipova, Y.; Glushkov, I.; et al. Mapping the World’s intact forest landscapes by remote sensing. Ecol. Soc. 2008, 13, 51. [Google Scholar] [CrossRef]
  2. Food and Agriculture Organization of the United Nations (FAO). Global Forest Resources Assessment 2010; Food and Agriculture Organization of the United Nations (FAO): Rome, Italy, 2010. [Google Scholar]
  3. Hansen, M.C.; Potapov, P.V.; Moore, R.; Hancher, M.; Turubanova, S.A.; Tyukavina, A.; Thau, D.; Stehman, S.V.; Goetz, S.J.; Loveland, T.R.; et al. High-Resolution Global Maps of 21st-Century Forest Cover Change. Science 2013, 342, 850–853. [Google Scholar] [CrossRef]
  4. Agrawal, A.; Hajjar, R.; Liao, C.; Rasmussen, L.V.; Watkins, C. Editorial overview: Forest governance interventions for sustainability through information, incentives, and institutions. Curr. Opin. Environ. Sustain. 2018, 32, A1–A7. [Google Scholar] [CrossRef]
  5. Food and Agriculture Organization of the United Nations (FAO). Global Forest Resources Assessment 2020; Food and Agriculture Organization of the United Nations (FAO): Rome, Italy, 2020. [Google Scholar]
  6. Olsson, H. Changes in satellite-measured reflectances caused by thinning cuttings in boreal forest. Remote Sens. Environ. 1994, 50, 221–230. [Google Scholar] [CrossRef]
  7. Nilson, T.; Olsson, H.; Anniste, J.; Lükk, T.; Praks, J.; Change, T.-C. Thinning-caused change in Reflectance of ground vegetation in boreal forest. Int. J. Remote Sens. 2001, 22, 2763–2776. [Google Scholar] [CrossRef]
  8. Bucha, T.; Stibig, H.J. Analysis of MODIS imagery for detection of clear cuts in the boreal forest in North-West Russia. Remote Sens. Environ. 2008, 112, 2416–2429. [Google Scholar] [CrossRef]
  9. Santoro, M.; Pantze, A.; Fransson, J.E.S.; Dahlgren, J.; Persson, A. Nation-wide clear-cut mapping in Sweden using ALOS PALSAR strip images. Remote Sens. 2012, 4, 1693–1715. [Google Scholar] [CrossRef]
  10. Cohen, W.B.; Healey, S.P.; Yang, Z.; Stehman, S.V.; Brewer, C.K.; Brooks, E.B.; Gorelick, N.; Huang, C.; Hughes, M.J.; Kennedy, R.E.; et al. How similar are forest disturbance maps derived from different landsat time series algorithms? Forests 2017, 8, 98. [Google Scholar] [CrossRef]
  11. Palaiologou, P.; Essen, M.; Hogland, J.; Kalabokidis, K. Locating forest management units using remote sensing and geostatistical tools in north-central Washington, USA. Sensors 2020, 20, 2454. [Google Scholar] [CrossRef] [PubMed]
  12. Chen, X.; Zhao, W.; Chen, J.; Qu, Y.; Wu, D.; Chen, X. Mapping large-scale forest disturbance types with multi-temporal CNN framework. Remote Sens. 2021, 13, 5177. [Google Scholar] [CrossRef]
  13. Xie, Y.; Sha, Z.; Yu, M. Remote sensing imagery in vegetation mapping: A review. J. Plant Ecol. 2008, 1, 9–23. [Google Scholar] [CrossRef]
  14. Wang, S.; Yang, D.; Li, Z.; Liu, L.; Huang, C.; Zhang, L. A global sensitivity analysis of commonly used satellite-derived vegetation indices for homogeneous canopies based on model simulation and random forest learning. Remote Sens. 2019, 11, 2547. [Google Scholar] [CrossRef]
  15. Ferchichi, A.; Ben Abbes, A.B.; Barra, V.; Farah, I.R. Forecasting vegetation indices from spatio-temporal remotely sensed data using deep learning-based approaches: A systematic literature review. Ecol. Inform. 2022, 68, 101552. [Google Scholar] [CrossRef]
  16. Junaid, M.; Sun, J.; Iqbal, A.; Sohail, M.; Zafar, S.; Khan, A. Mapping, LULC Dynamics and its potential implication on forest cover in malam Jabba region with landsat time series imagery and random forest classification. Sustainability 2023, 15, 1858. [Google Scholar] [CrossRef]
  17. Ma, T.; Hu, Y.; Wang, J.; Beckline, M.; Pang, D.; Chen, L.; Ni, X.; Li, X. A novel vegetation index approach using Sentinel-2 data and random forest algorithm for estimating forest stock volume in the Helan Mountains, Ningxia, China. Remote Sens. 2023, 15, 1853. [Google Scholar] [CrossRef]
  18. Potić, I.; Srdić, Z.; Vakanjac, B.; Bakrač, S.; Đorđević, D.; Banković, R.; Jovanović, J.M. Improving forest detection using machine learning and remote sensing: A Case study in Southeastern Serbia. Appl. Sci. 2023, 13, 8289. [Google Scholar] [CrossRef]
  19. Saini, R. Integrating vegetation indices and spectral features for vegetation mapping from multispectral satellite imagery using AdaBoost and random forest machine learning classifiers. Geomat. Environ. Eng. 2023, 17, 57–74. [Google Scholar] [CrossRef]
  20. Liu, J.; Feng, Q.; Gong, J.; Zhou, J.; Liang, J.; Li, Y. Winter wheat mapping using a random forest classifier combined with multi-temporal and multi-sensor data. Int. J. Digit. Earth 2018, 11, 783–802. [Google Scholar] [CrossRef]
  21. Adam, E.; Mutanga, O.; Odindi, J.; Abdel-Rahman, E.M. Land-use/cover classification in a heterogeneous coastal landscape using RapidEye imagery: Evaluating the performance of random forest and support vector machines classifiers. Int. J. Remote Sens. 2014, 35, 3440–3458. [Google Scholar] [CrossRef]
  22. Tigges, J.; Lakes, T.; Hostert, P. Urban vegetation classification: Benefits of multitemporal RapidEye satellite data. Remote Sens. Environ. 2013, 136, 66–75. [Google Scholar] [CrossRef]
  23. Micheletti, N.; Foresti, L.; Robert, S.; Leuenberger, M.; Pedrazzini, A.; Jaboyedoff, M.; Kanevski, M. Machine learning feature selection methods for landslide susceptibility mapping. Math. Geosci. 2014, 46, 33–57. [Google Scholar] [CrossRef]
  24. Saini, R.; Ghosh, S.K. Crop classification in a heterogeneous agricultural environment using ensemble classifiers and single-date Sentinel-2A imagery. Geocarto Int. 2021, 36, 2141–2159. [Google Scholar] [CrossRef]
  25. Stahl, A.T.; Andrus, R.; Hicke, J.A.; Hudak, A.T.; Bright, B.C.; Meddens, A.J.H. Automated attribution of forest disturbance types from remote sensing data: A synthesis. Remote Sens. Environ. 2023, 285, 113416. [Google Scholar] [CrossRef]
  26. Grabska, E.; Hostert, P.; Pflugmacher, D.; Ostapowicz, K. Forest stand species mapping using the Sentinel-2 time series. Remote Sens. 2019, 11, 1197. [Google Scholar] [CrossRef]
  27. Nasiri, V.; Hawryło, P.; Janiec, P.; Socha, J. Comparing Object-Based and Pixel-Based Machine Learning Models for Tree-Cutting Detection with Planetscope Satellite Images: Exploring Model Generalization. Int. J. Appl. Earth Obs. Geoinf. 2023, 125, 103555. [Google Scholar] [CrossRef]
  28. Abdollahnejad, A.; Panagiotidis, D.; Bílek, L. An Integrated GIS and Remote Sensing Approach for Monitoring Harvested Areas from Very High-Resolution, Low-Cost Satellite Images. Remote Sens. 2019, 11, 2539. [Google Scholar] [CrossRef]
  29. Korea Forest Service (KFS). Basic Statistics of Forest; Korea Forest Service (KFS): Deajeon, Republic of Korea, 2023. [Google Scholar]
  30. Ministry of Land Infrastructure and Transport (MLIT). Cadastral Statistical Annual Report; Ministry of Land Infrastructure and Transport (MLIT): Sejong, Republic of Korea, 2021. [Google Scholar]
  31. Xue, J.; Su, B. Significant remote sensing vegetation indices: A review of developments and applications. J. Sens. 2017, 2017, 1353691. [Google Scholar] [CrossRef]
  32. Hatfield, J.L.; Prueger, J.H.; Sauer, T.J.; Dold, C.; O’Brien, P.; Wacha, K. Applications of vegetative indices from remote sensing to agriculture: Past and future. Inventions 2019, 4, 71. [Google Scholar] [CrossRef]
  33. Huete, A.R. A soil-adjusted vegetation index (SAVI). Remote Sens. Environ. 1988, 25, 295–309. [Google Scholar] [CrossRef]
  34. Kaufman, Y.J.; Tanre, D. Atmospherically resistant vegetation index (ARVI) for EOS-MODIS. IEEE Trans. Geosci. Remote Sens. 1992, 30, 261–270. [Google Scholar] [CrossRef]
  35. Huete, A.R.; Didan, K.; van Leeuwen, W.J.D.; Vermote, E.F. Global-scale analysis of vegetation indices for moderate resolution monitoring of terrestrial vegetation. Remote Sens. Earth Sci. Ocean. Sea Ice Appl. 1999, 3863, 141–151. [Google Scholar] [CrossRef]
  36. Rikimaru, A.; Roy, P.S.; Miyatake, S. Tropical forest cover density mapping. Trop. Ecol. 2002, 43, 39–47. [Google Scholar]
  37. Hu, Y.; Dong, Y.; Batunacun, B. An automatic approach for land-change detection and land updates based on integrated NDVI timing analysis and the CVAPS method with GEE support. ISPRS J. Photogramm. 2018, 146, 347–359. [Google Scholar] [CrossRef]
  38. Gitelson, A.A.; Kaufman, Y.J.; Merzlyak, M.N. Use of a green channel in remote sensing of global vegetation from EOS-MODIS. Remote Sens. Environ. 1996, 58, 289–298. [Google Scholar] [CrossRef]
  39. Pettorelli, N.; Vik, J.O.; Mysterud, A.; Gaillard, J.M.; Tucker, C.J.; Stenseth, N.C. Using the satellite-derived NDVI to assess ecological responses to environmental change. Trends Ecol. Evol. 2005, 20, 503–510. [Google Scholar] [CrossRef]
  40. Lymburner, L.; Beggs, P.J.; Jacobson, C.R. Estimation of canopy-average surface-specific leaf area using landsat TM data. Photogramm. Eng. Remote Sens. 2000, 66, 183–192. [Google Scholar]
  41. Korea Forest Service (KFS). Statistical Yearbook of Forestry; Korea Forest Service (KFS): Deajeon, Republic of Korea, 2020. [Google Scholar]
  42. Ham, B.; Song, C.; Park, E.; Choi, S.-E.; Lee, W.-K. Development of forest activity data and forest management rate for national greenhouse gas inventory in the forest sector. J. Clim. Chang. Res. 2020, 11, 53–63. [Google Scholar] [CrossRef]
  43. Kim, D.; Lim, C.H.; Lee, W.-K.; Song, C. A study on the improvement of evaluation system for implementation of national forest management. J. Korean For. Soc. 2015, 104, 640–648. [Google Scholar] [CrossRef]
  44. Millard, K.; Richardson, M. On the importance of training data sample selection in random forest image classification: A case study in peatland ecosystem mapping. Remote Sens. 2015, 7, 8489–8515. [Google Scholar] [CrossRef]
  45. Wibowo, A.; Salleh, K.O.; Frans, F.T.R.S.; Semedi, J.M. Spatial temporal land use change detection using google earth data. IOP Conf. Ser. Earth Environ. Sci. 2016, 47, 012031. [Google Scholar] [CrossRef]
  46. Rwanga, S.S.; Ndambuki, J.M. Accuracy assessment of land use/land cover classification using remote sensing and GIS. Int. J. Geosci. 2017, 08, 611–622. [Google Scholar] [CrossRef]
  47. Ayala-Izurieta, J.E.; Márquez, C.O.; García, V.J.; Recalde-Moreno, C.G.; Rodríguez-Llerena, M.V.; Damián-Carrión, D.A. Land cover classification in an Ecuadorian mountain geosystem using a random forest classifier, spectral vegetation indices, and ancillary geographic data. Geosciences 2017, 7, 34. [Google Scholar] [CrossRef]
  48. Ehsan, S.; Kazem, D. Analysis of land use-land covers changes using Normalized Difference Vegetation Index (NDVI) differencing and classification methods. Afr. J. Agric. Res. 2013, 8, 4614–4622. [Google Scholar] [CrossRef]
  49. Da Silva, V.S.; Salami, G.; da Silva, M.I.O.; Silva, E.A.; Monteiro Junior, J.J.; Alba, E. Methodological evaluation of vegetation indexes in land use and land cover (LULC) classification. Geol. Ecol. Landsc. 2020, 4, 159–169. [Google Scholar] [CrossRef]
  50. Shishir, S.; Tsuyuzaki, S. Hierarchical classification of land use types using multiple vegetation indices to measure the effects of urbanization. Environ. Monit. Assess. 2018, 190, 342. [Google Scholar] [CrossRef] [PubMed]
  51. Maschler, J.; Atzberger, C.; Immitzer, M. Individual tree crown segmentation and classification of 13 tree species using airborne hyperspectral data. Remote Sens. 2018, 10, 1218. [Google Scholar] [CrossRef]
  52. Immitzer, M.; Neuwirth, M.; Böck, S.; Brenner, H.; Vuolo, F.; Atzberger, C. Optimal input features for tree species classification in Central Europe based on multi-temporal Sentinel-2 data. Remote Sens. 2019, 11, 2599. [Google Scholar] [CrossRef]
  53. Morcillo-Pallarés, P.; Rivera-Caicedo, J.P.; Belda, S.; De Grave, C.; Burriel, H.; Moreno, J.; Verrelst, J. Quantifying the robustness of vegetation indices through global sensitivity analysis of homogeneous and forest leaf-canopy radiative transfer models. Remote Sens. 2019, 11, 2418. [Google Scholar] [CrossRef]
  54. Trier, Ø.D.; Salberg, A.B.; Kermit, M.; Rudjord, Ø.; Gobakken, T.; Næsset, E.; Aarsten, D. Tree species classification in Norway from airborne hyperspectral and airborne laser scanning data. Eur. J. Remote Sens. 2018, 51, 336–351. [Google Scholar] [CrossRef]
  55. Bolyn, C.; Michez, A.; Gaucher, P.; Lejeune, P.; Bonnet, S. Forest mapping and species composition using supervised per pixel classification of Sentinel-2 imagery. Biotechnol. Agron. Soc. Environ. 2018, 22, 172–187. [Google Scholar] [CrossRef]
  56. Boonprong, S.; Cao, C.; Chen, W.; Bao, S. Random forest variable importance spectral indices scheme for burnt forest recovery monitoring—Multilevel RF-VIMP. Remote Sens. 2018, 10, 807. [Google Scholar] [CrossRef]
  57. Khelifi, L.; Mignotte, M. Deep learning for change detection in remote sensing images: Comprehensive review and meta-analysis. IEEE Access 2020, 8, 126385–126400. [Google Scholar] [CrossRef]
  58. Talukdar, S.; Singha, P.; Mahato, S.; Shahfahad; Pal, S.; Liou, Y.A.; Rahman, A. Land-Use Land-Cover Classification by Machine Learning Classifiers for Satellite Observations—A Review. Remote Sens. 2020, 12, 1135. [Google Scholar] [CrossRef]
  59. Wilson, E.H.; Sader, S.A. Detection of forest harvest type using multiple dates of landsat TM imagery. Remote Sens. Environ. 2002, 80, 385–396. [Google Scholar] [CrossRef]
  60. Franklin, S.E.; Moskal, L.M.; Lavigne, M.B.; Pugh, K. Interpretation and classification of partially harvested forest stands in the fundy model forest using multitemporal landsat TM digital data. Can. J. Remote Sens. 2000, 26, 318–333. [Google Scholar] [CrossRef]
  61. Brooks, E.B.; Wynne, R.H.; Thomas, V.A.; Blinn, C.E.; Coulston, J.W. On-the-fly massively multitemporal change detection using statistical quality control charts and landsat data. IEEE Trans. Geosci. Remote Sens. 2014, 52, 3316–3332. [Google Scholar] [CrossRef]
  62. Alonso, L.; Picos, J.; Armesto, J. Forest land cover mapping at a regional scale using multi-temporal Sentinel-2 imagery and RF models. Remote Sens. 2021, 13, 2237. [Google Scholar] [CrossRef]
  63. Nink, S.; Hill, J.; Stoffels, J.; Buddenbaum, H.; Frantz, D.; Langshausen, J. Using landsat and Sentinel-2 data for the generation of continuously updated forest type information layers in a cross-border region. Remote Sens. 2019, 11, 2337. [Google Scholar] [CrossRef]
  64. Salgueiro Romero, L.S.; Marcello, J.; Vilaplana, V. Super-resolution of Sentinel-2 imagery using generative adversarial networks. Remote Sens. 2020, 12, 2424. [Google Scholar] [CrossRef]
  65. Feng, Q.; Liu, J.; Gong, J. UAV Remote Sensing for Urban Vegetation Mapping Using Random Forest and Texture Analysis. Remote Sens. 2015, 7, 1074–1094. [Google Scholar] [CrossRef]
Figure 1. Map portraying clear-cut areas in the Republic of Korea, with the location and forest cover.
Forests 15 00450 g001
Figure 2. Flowchart portraying the methodology of this study. Abbreviations: atmospherically resistant vegetation index (ARVI), advanced vegetation index (AVI), soil and atmospherically resistant vegetation index (SARVI), soil-adjusted vegetation index (SAVI), enhanced vegetation index (EVI), green normalized difference vegetation index (GNDVI), normalized difference vegetation index (NDVI), specific leaf area vegetation index (SLAVI).
Forests 15 00450 g002
Figure 3. Detection result of clear-cut areas in Chungcheongnam-do province using a random-forest (RF) classifier. Scale of clear-cut areas: (a,b) 30 ha; (c,d) 10 to 29 ha; (e,f) 5 to 9 ha; (g,h) 1 to 4 ha.
Forests 15 00450 g003
Figure 4. Vegetation index (VI) statistics for non-clear-cut (a) and clear-cut areas (b) in the training dataset. Abbreviations: atmospherically resistant vegetation index (ARVI), advanced vegetation index (AVI), soil and atmospherically resistant vegetation index (SARVI), soil-adjusted vegetation index (SAVI), enhanced vegetation index (EVI), green normalized difference vegetation index (GNDVI), normalized difference vegetation index (NDVI), specific leaf area vegetation index (SLAVI).
Forests 15 00450 g004
Figure 5. Characteristics of clear-cut areas in the study region obtained using digital forest-type maps. Characteristics of natural and planted forests by (a) national and (b) privately owned forests. Tree species and age class in (c) planted and (d) natural forests. Tree species and DBH class in (e) planted and (f) natural forests.
Forests 15 00450 g005
Table 1. Data considered for setting the spatial range for our analysis.
DataDescriptionSourceData TypeYear
Digital Forest-type Maps
(scale: 1:5000)
Republic of Korea’s forest information
constructed from digitizing orthoimages
Forest Geospatial Information System
(http://fgis.forest.go.kr,
accessed on 3 December 2023)
Vector2018
Forest land category in Cadastral MapsMap dividing the national land into
28 categories, according to land use and status
National Spatial Infrastructure Portal
(https://www.vworld.kr/dtna/dtna_guide_s001.do, accessed on 3 December 2023)
Vector2018
Table 2. Characteristics of forest area in Chungcheongnam-do Province *.
(Unit: ha)
DivisionConiferDeciduousMixedTotal
National ForestsPlanted54871903877476
Natural878918,356562232,767
Subtotal14,27620,259570840,243
Private ForestsPlanted51,33333,572161086,515
Natural70,34198,12833,813202,284
Subtotal121,674131,70035,423288,798
Total135,950151,96041,132329,042
* The forest areas were analyzed for overlapping areas in digital forest-type (DFTMs) maps and cadastral maps (CDMs).
Table 3. Vegetation indices (VIs) calculated based on Sentinel-2 data.
Vegetation IndicesRemarksFormulaReferences
Atmospherically Resistant Vegetation Index (ARVI)Minimizes the impact of atmospheric scattering from aerosols A R V I = N I R     2   ×   R e d   +   B l u e N I R   +   2   ×   R e d   +   B l u e [36]
Advanced Vegetation Index (AVI)Provides vegetation cover by using the infrared spectral band to sensitively assess vegetation density A V I = ( N I R × 1 R e d × N I R R e d ) 1 3 [36]
Enhanced Vegetation Index (EVI)Corrects for atmospheric effects and soil background E V I = 2.5 × N I R     R e d N I R   +   6   ×   R e d     7.5   ×   B l u e   +   1 [37]
Green Normalized Difference Vegetation Index (GNDVI)More sensitive to changes in chlorophyll content than NDVI G N D V I = N I R     G r e e n N I R   +   G r e e n [38]
Normalized Difference
Vegetation Index (NDVI)
Presents vegetation cover ratio and vegetation characteristics such as biomass and chlorophyll content N D V I = N I R     R e d N I R   +   R e d [39]
Soil and Atmospherically
Resistant Vegetation Index (SARVI)
Minimizes the effect of atmospheric aerosols and reduces the influence of soil S A R V I = N I R     ( R e d     1   ×   B l u e     R e d ) N I R   +   ( R e d     1   ×   ( B l u e     R e d ) ) × ( 1 + 0.5 ) [34]
Soil-Adjusted Vegetation
Index (SAVI)
Minimizes spectral reflection variations based on soil types S A V I = 1.5 × ( N I R     R e d N I R   +   R e d   +   0.5 ) [35]
Specific Leaf Area Vegetation Index (SLAVI)Estimates the leaf area ratio within a forest S L A V I = N I R N I R   +   S W I R [40]
Abbreviations: For the Sentinel-2 satellite, near-infrared (NIR) corresponds to band 8 (842 nm), ‘Red’ to band 4 (665 nm), ‘Blue’ to band 2 (490 nm), ‘Green’ to band 3 (560 nm), and short-wave infrared (SWIR) to band 11 (1610 nm) and band 12 (2190 nm).
Table 4. Scale and extent of clear-cut areas in different regions of Chungcheongnam-do Province.
(Unit: ha)
Region<1ha1~4 ha5~9 ha10~29 ha30~60 haTotal
Asan-si6418810311-366
Boryeong-si10240017367-742
Buyeo-gun224580173314-1291
Cheongyang-gun13041223489119984
Dangjin-si942394750-431
Cheonan-si97341123132-692
Geumsan-gun5618512084-444
Gongju-si208578315283851470
Gyeryong-si181414--46
Hongseong-gun762063922-344
Nonsan-si621547745-339
Seocheon-gun55155725-241
Seosan-si53148721932325
Taean-gun506430--145
Yesan-gun631425048-304
Total13543806157711902378164
Table 5. Variable importance as determined by the mean decrease in impurity (MDI) method.
VariablesImportance
SLAVI0.261940
SARVI0.193277
NDVI0.171838
ARVI0.136113
SAVI0.079224
GNDVI0.064720
EVI0.049265
AVI0.043622
Abbreviations: Atmospherically resistant vegetation index (ARVI); advanced vegetation index (AVI); soil and atmospherically resistant vegetation index (SARVI); soil-adjusted vegetation index (SAVI); enhanced vegetation index (EVI); green normalized difference vegetation index (GNDVI); normalized difference vegetation index (NDVI); specific leaf area vegetation index (SLAVI).
Table 6. Ratio of clear-cut area to total area of planted and natural forests by age class in Chungcheongnam-do.
(Unit: %)
DivisionRatio to Total Area
PlantedNational forest0.10.10.20.10.20.00.1
Private forest4.23.32.82.83.34.43.4
Total4.33.53.02.93.54.43.5
NaturalNational forest0.10.00.10.10.20.00.1
Private forest2.01.71.91.82.30.71.9
Total2.11.72.01.92.50.82.1
Table 7. Ratio of clear-cut area to total area by tree species and age class in Chungcheongnam-do.
(Unit: %)
DivisionRatio to Total Area
PlantedConiferous1.40.31.12.73.54.01.8
Deciduous2.73.11.90.20.00.31.6
Mixed0.10.10.00.00.00.00.1
Total4.33.53.02.93.54.43.5
NaturalConiferous0.10.20.40.71.40.60.9
Deciduous1.91.21.20.90.70.10.9
Mixed0.00.20.40.30.50.00.4
Total2.11.72.01.92.50.82.1
Table 8. Ratio of clear-cut area to total area by tree species and DBH class in Chungcheongnam-do.
(Unit: %)
Division<6 cm6~17 cm18~29 cm>29 cmRatio to Total Area
PlantedConiferous1.30.92.50.71.7
Deciduous2.61.60.62.41.5
Mixed0.10.00.00.00.1
Total4.12.53.13.23.3
NaturalConiferous0.10.40.90.90.8
Deciduous2.31.00.80.10.8
Mixed0.00.30.30.10.3
Total2.41.82.01.12.0
Disclaimer/Publisher’s Note: The statements, opinions and data contained in all publications are solely those of the individual author(s) and contributor(s) and not of MDPI and/or the editor(s). MDPI and/or the editor(s) disclaim responsibility for any injury to people or property resulting from any ideas, methods, instructions or products referred to in the content.

