
The Application of Geographic Information System in Urban Forest Ecological Compensation and Sustainable Development Evaluation
1
College of Agriculture, Inner Mongolia Minzu University, Tongliao 028000, China
2
College of Life Science, Baicheng Normal University, Baicheng 137000, China
*
Authors to whom correspondence should be addressed.
Forests 2024, 15(2), 285; https://doi.org/10.3390/f15020285
Submission received: 3 January 2024
/
Accepted: 19 January 2024
/
Published: 2 February 2024
(This article belongs to the Special Issue Forest/Urban Forest Systems under Climate Change: Carbon Dynamics, Ecological Functions, and Sustainable Management)
Abstract
:Urban forests can alleviate the urban heat island effect, improve air quality, and improve residents’ mental health. By studying urban forests, these resources can be better used and managed to create more livable urban environments. Therefore, the urban forest in the Taishan region is taken as the research object, and the ecological compensation and sustainable development of urban forest in Tai’an City are deeply analyzed by GIS. It divided the area into forest land, water bodies, wetlands, grasslands, and shrubs as the basic ecosystem types. And through secondary interpretation and combination, a complete urban forest information database was established. To evaluate the comprehensive benefits of urban forests, the analytic hierarchy process was utilized to establish a corresponding evaluation index system. Based on the assessment outcomes of the comprehensive benefits of urban forests in the area, a standard accounting method for urban forest ecological compensation was proposed. The results showed that each index of the comprehensive benefits of urban forests and the random consistency ratio were both less than 0.1. This indicated that the matrix calculation results of various indicators of urban forest comprehensive benefits had good consistency. At the target level, the comprehensive evaluation score of urban forests in the study area was 7.69. At the factor level, the weight value of the urban forest landscape structure was 0.675, and the comprehensive score was 7.62. The weight value of urban forest comprehensive benefits was 0.325, and the comprehensive score was 7.82. The quantitative weight value of urban forest greening in the study area was 0.6138, with a comprehensive score of 7.57. Based on the analysis of the issues in urban forests and ecological compensation in the research area of Tai’an City, corresponding ecological compensation strategies have been proposed. It is of great value to study the urban forest of Tai’an city, which can help to formulate more effective urban planning and sustainable development strategies. The research results can also provide a valuable reference and inspiration for the improvement of urban forest ecological environment and biodiversity protection in other areas.
1. Introduction
In recent years, environmental issues have received widespread attention, and ecological protection has become a key task [1]. Under the guidance of landscape design concepts in the new era, it is imperative to construct urban forests [2]. Urban forests have ecological, economic, and social functions. Scientific comprehensive benefit evaluation and ecological compensation research on urban forests are of great significance for maintaining the balance of urban ecosystems [3]. Comprehensive benefit evaluation is an effective way to reflect the overall level of urban forests, and evaluation indicators are the basic elements that reflect the current situation of urban forest construction [4]. Urban forest research usually includes a variety of methods and techniques, some of the main methods include ecological investigation, remote-sensing technology, geographic information system analysis, and socioeconomic investigation. Chukwuka Af et al. used remote-sensing technology and geographic information systems to conduct an in-depth study of a forest reserve from 1985 to 2017 to assess the dynamic changes in the landscape of the area [5]. In this study, a three-way Markov chain model was used to predict the future forest cover. The results showed that the number of woodland patches in the study area decreased while the average patch size increased. This trend is further confirmed by the reduction in ladder diversity and uniformity in the overall landscape. In addition, this study also validates the validity and application potential of remote-sensing data and GIS in urban forest data measurement. Lacerda Lidi et al. explored the effectiveness of urban planning tools in mitigating urban forest loss by using geographic information systems and drew detailed images through changes in land use and land cover [6].The study explored patterns, traces, and hot-spot characteristics of urban expansion and forest cover loss, and the accuracy of the results was high, with an average of about 91%. Chen Jianchao and other experts have conducted in-depth comparative studies on the effective and intelligent management methods of urban street trees [7]. A database for the management of roadside trees was created by using GIS technology. Based on basic tree survey data, the researchers integrated digital information to build a more comprehensive tree management system. The results show that the detection accuracy of the visual database retrieval system based on GIS can reach more than 95%, and it can be applied to address the symptoms of urban ecological forestry analysis. However, these research methods also have some limitations, such as possible difficulties in data acquisition, uncertain factor estimation, and the impact of model simplification on the actual situation. In addition, in urban settings, the impact of urbanization on urban forests is an important consideration that needs to be studied and evaluated in greater depth. In order to better understand the overall picture and effective management of urban forests, a combination of different methods and continuous improvement are needed to address the relevant limitations of urban forest research.
Currently, domestic and foreign scholars have established different evaluation indicators due to differences in research regions, historical backgrounds, and construction conditions. Sun Y and other researchers analyzed the static and dynamic benefits of returning farmland to forests and ecological compensation [8]. The use of data-mining technology was proposed and Bayesian networks were introduced to test ecosystem data. The research shows that the prediction accuracy of the model can reach more than 90%, which can be used in practice to build the standard model. Scholars such as Enzai D U conducted a detailed analysis of the spatial pattern and ecological effects of nitrogen deposition in urban forests based on observation and experimental research [9]. The study showed that the chemical composition of nitrogen deposition also shifted between the urban, suburban, and rural gradient, and the influence weight of nitrogen deposition on urban forests was higher (0.638). Maur í cio L F et al. compared nutrient cycling and litter decomposition between mixed litter and single-species litter (i.e., eucalyptus) to understand the significance of using eucalyptus trees in urban parks [10]. Research has shown that in the urban forests of São Paulo, mixed litter exhibited a greater dry mass loss and nutrient cycling.
The main idea of the urban forest ecological compensation system is a system that aims at the long-term effective play of ecological functions, takes economic means as the main adjustment mode, compensates stakeholders, and arouses enthusiasm for ecological protection. The uses of the urban forest ecological compensation system mainly include six points, namely, protecting and restoring the ecological environment, maintaining biodiversity, improving the quality of the ecological environment, improving the quality of life of citizens, balancing the relationship between urban construction and the natural environment, and promoting the development of the tourism economy. At present, the United States and Germany have initially established the policy framework of ecological service payment, forming a relatively complete theoretical system and realization mechanism of ecological compensation [11]. The United Kingdom and France adopt special preferential policies such as tax exemption for state-owned forests to enhance their ecosystem service functions [12]. However, domestic research on the ecological compensation of urban forest is still in its infancy. In addition, urban forest ecological compensation also has many limitations; for example, urban forest ecological compensation often requires a lot of funds and resources. With limited budgets and resources, the effective implementation of compensation measures may be difficult. Measuring the effectiveness of compensation measures is often difficult because the value of ecosystem services is not easily quantified. Ecosystems in different regions have different characteristics and needs. Compensation strategies in one area may not work in another. Overall, it is precisely because of the complexity and diversity of urban forests that most research results do have significant differences in the results obtained by different accounting methods. This also affects the effective implementation of ecological compensation measures for urban forests due to the lack of consistent data and evaluation criteria. GIS technology can provide spatial analysis and data visualization, so as to more objectively reflect the current development process of urban forests and the spatial relationship with other urban elements. A more comprehensive consideration of these factors in the study will help to provide a more accurate basis for urban forest management and planning. The approach to the division of urban forests varies due to their conceptual diversity and is influenced by ecological function and administrative considerations. In order to make effective definitions, on the one hand, the ecological function of urban forests is emphasized, taking into account their social function and economic function, and the green space with the above functions is summarized as an urban forest. On the other hand, we should break the territorial contradiction in management and undertake overall management from the regional perspective, so that the division of the urban forest scope can better coordinate the interests of all parties. The ecological environment in the southern mountain area of Tai’an City is good. The highest point is Motianling at the border of Tai’an City. Most of the mountains in the area are less than 500 m above sea level, and the forest coverage rate is high, which is an extremely important part of the urban ecosystem [13]. Therefore, the study takes the urban forest in the region as the research object, uses geographic information system (GIS) technology, and uses remote-sensing images modified in 2021 as the data source to establish an urban forest information database. And an innovative evaluation index system for the comprehensive benefits of urban forests in the region is established using the analytic hierarchy process (AHP). Based on the theory of an urban forest ecological compensation system, a standard accounting method for ecological compensation is proposed. In this study, the evaluation method is innovated, and the forest ecological service value evaluation method is established which is suitable for the characteristics of an urban environment. To explore how multi-subject governance models can jointly participate in the construction and implementation of the forest ecological compensation system, through the analysis of the current situation of the urban forest ecological compensation system, the effective implementation path of the urban forest ecological compensation system is obtained, and certain scientific basis is provided for maintaining forest ecological environment, stabilizing urban carbon cycle and protecting biodiversity.
2. Materials and Methods
To evaluate the comprehensive benefit of the ecological compensation of urban forests in Tai’an city, an evaluation system based on the analytic hierarchy process and geographic information system was established. Based on the comprehensive benefit evaluation of urban forests in the research area, corresponding calculation standards and methods for ecological compensation were proposed. Finally, by analyzing the problems of urban forests and ecological compensation in the area, strategies for ecological compensation and sustainable development are proposed.
2.1. Construction of an Urban Forest Information Database Based on GIS
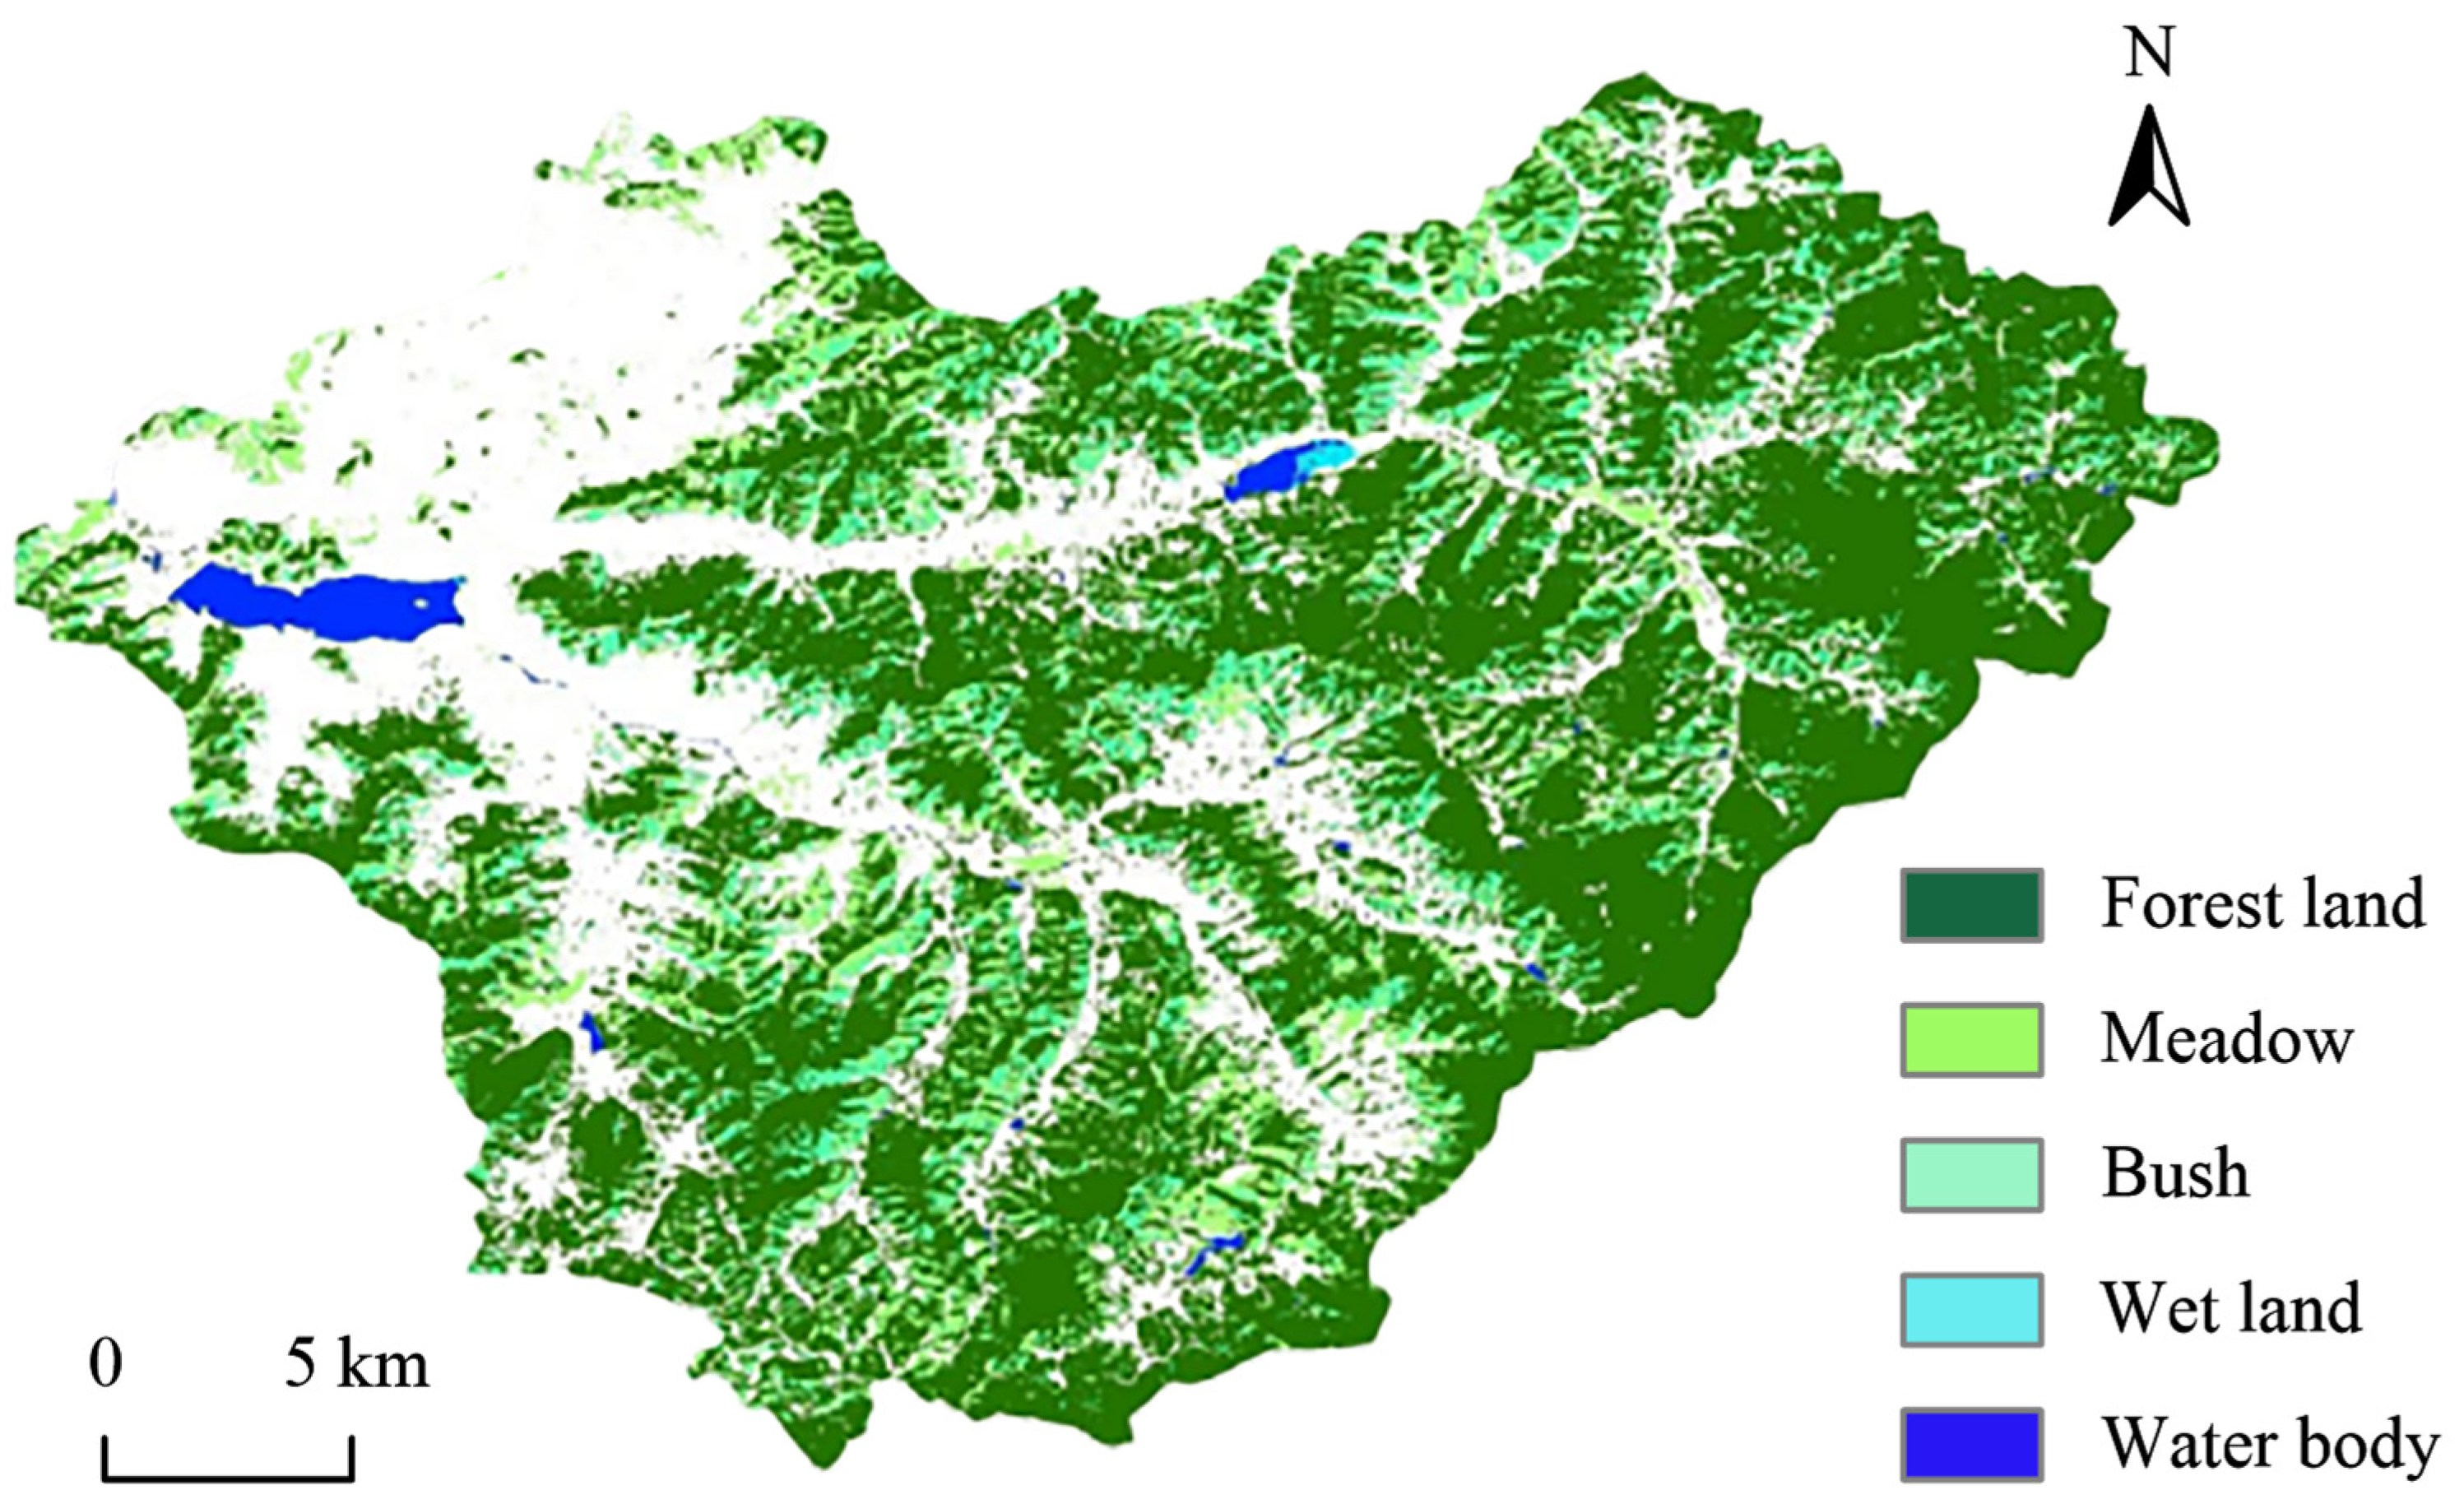
Tai’an City is a prefecture level city located in the central part of Shandong Province. It borders the provincial capital Jinan to the north, Jining to the south, Linyi to the east, and the Yellow River to the west, with a total area of 7762 km2. Tai’an City is named after Mount Taishan. It is built near the mountain and integrates the mountain and the city. The study area is located in the margin of Mount Taishan and in the east of North China Plain, covering an area of 571.39 km2 [14]. Mount Taishan is a typical area where the double layered structure of the basement and caprock of the North China platform outcrops well. The terrain of Mount Taishan is significantly different, and the terrain fluctuates greatly. The main peak Yuhuangding is 1545 m above sea level, and within a horizontal distance of less than 10 km, its relative height difference with the piedmont plain is more than 1300 m. Mount Taishan has obvious geomorphic boundaries, various geomorphic types, and well-developed erosion geomorphology [15]. The research area is located in the northern warm temperate climate zone, and due to the influence of terrain, there are significant differences in vertical gradient, horizontal distribution, and climate characteristics. The annual average humidity is 63%, and the annual average relative humidity range is 39%.The southwest wind and the northeast wind prevail at the top of Mount Taishan and in the urban area, respectively, with an annual average wind speed of 6.5 m/s and 2.5 m/s, respectively. This area belongs to the North China flora, and due to the influence of the Yellow Sea and Bohai Sea, it has abundant rainfall and is a transitional zone between dry and wet conditions. The vegetation is rich, divided into forests, shrubs, shrubland meadows, meadows, and other types, with a forest coverage rate of over 80% [16]. The abundant water source and complex terrain provide good conditions for various animals to forage and inhabit [17,18]. GIS technology is used to interpret remote sensing images of the area. On this basis, the Clip command is utilized to trim the study area and correct its atmospheric and radiation effects [19]. The comprehensive information of urban forests in the study area is denoted in Figure 1.
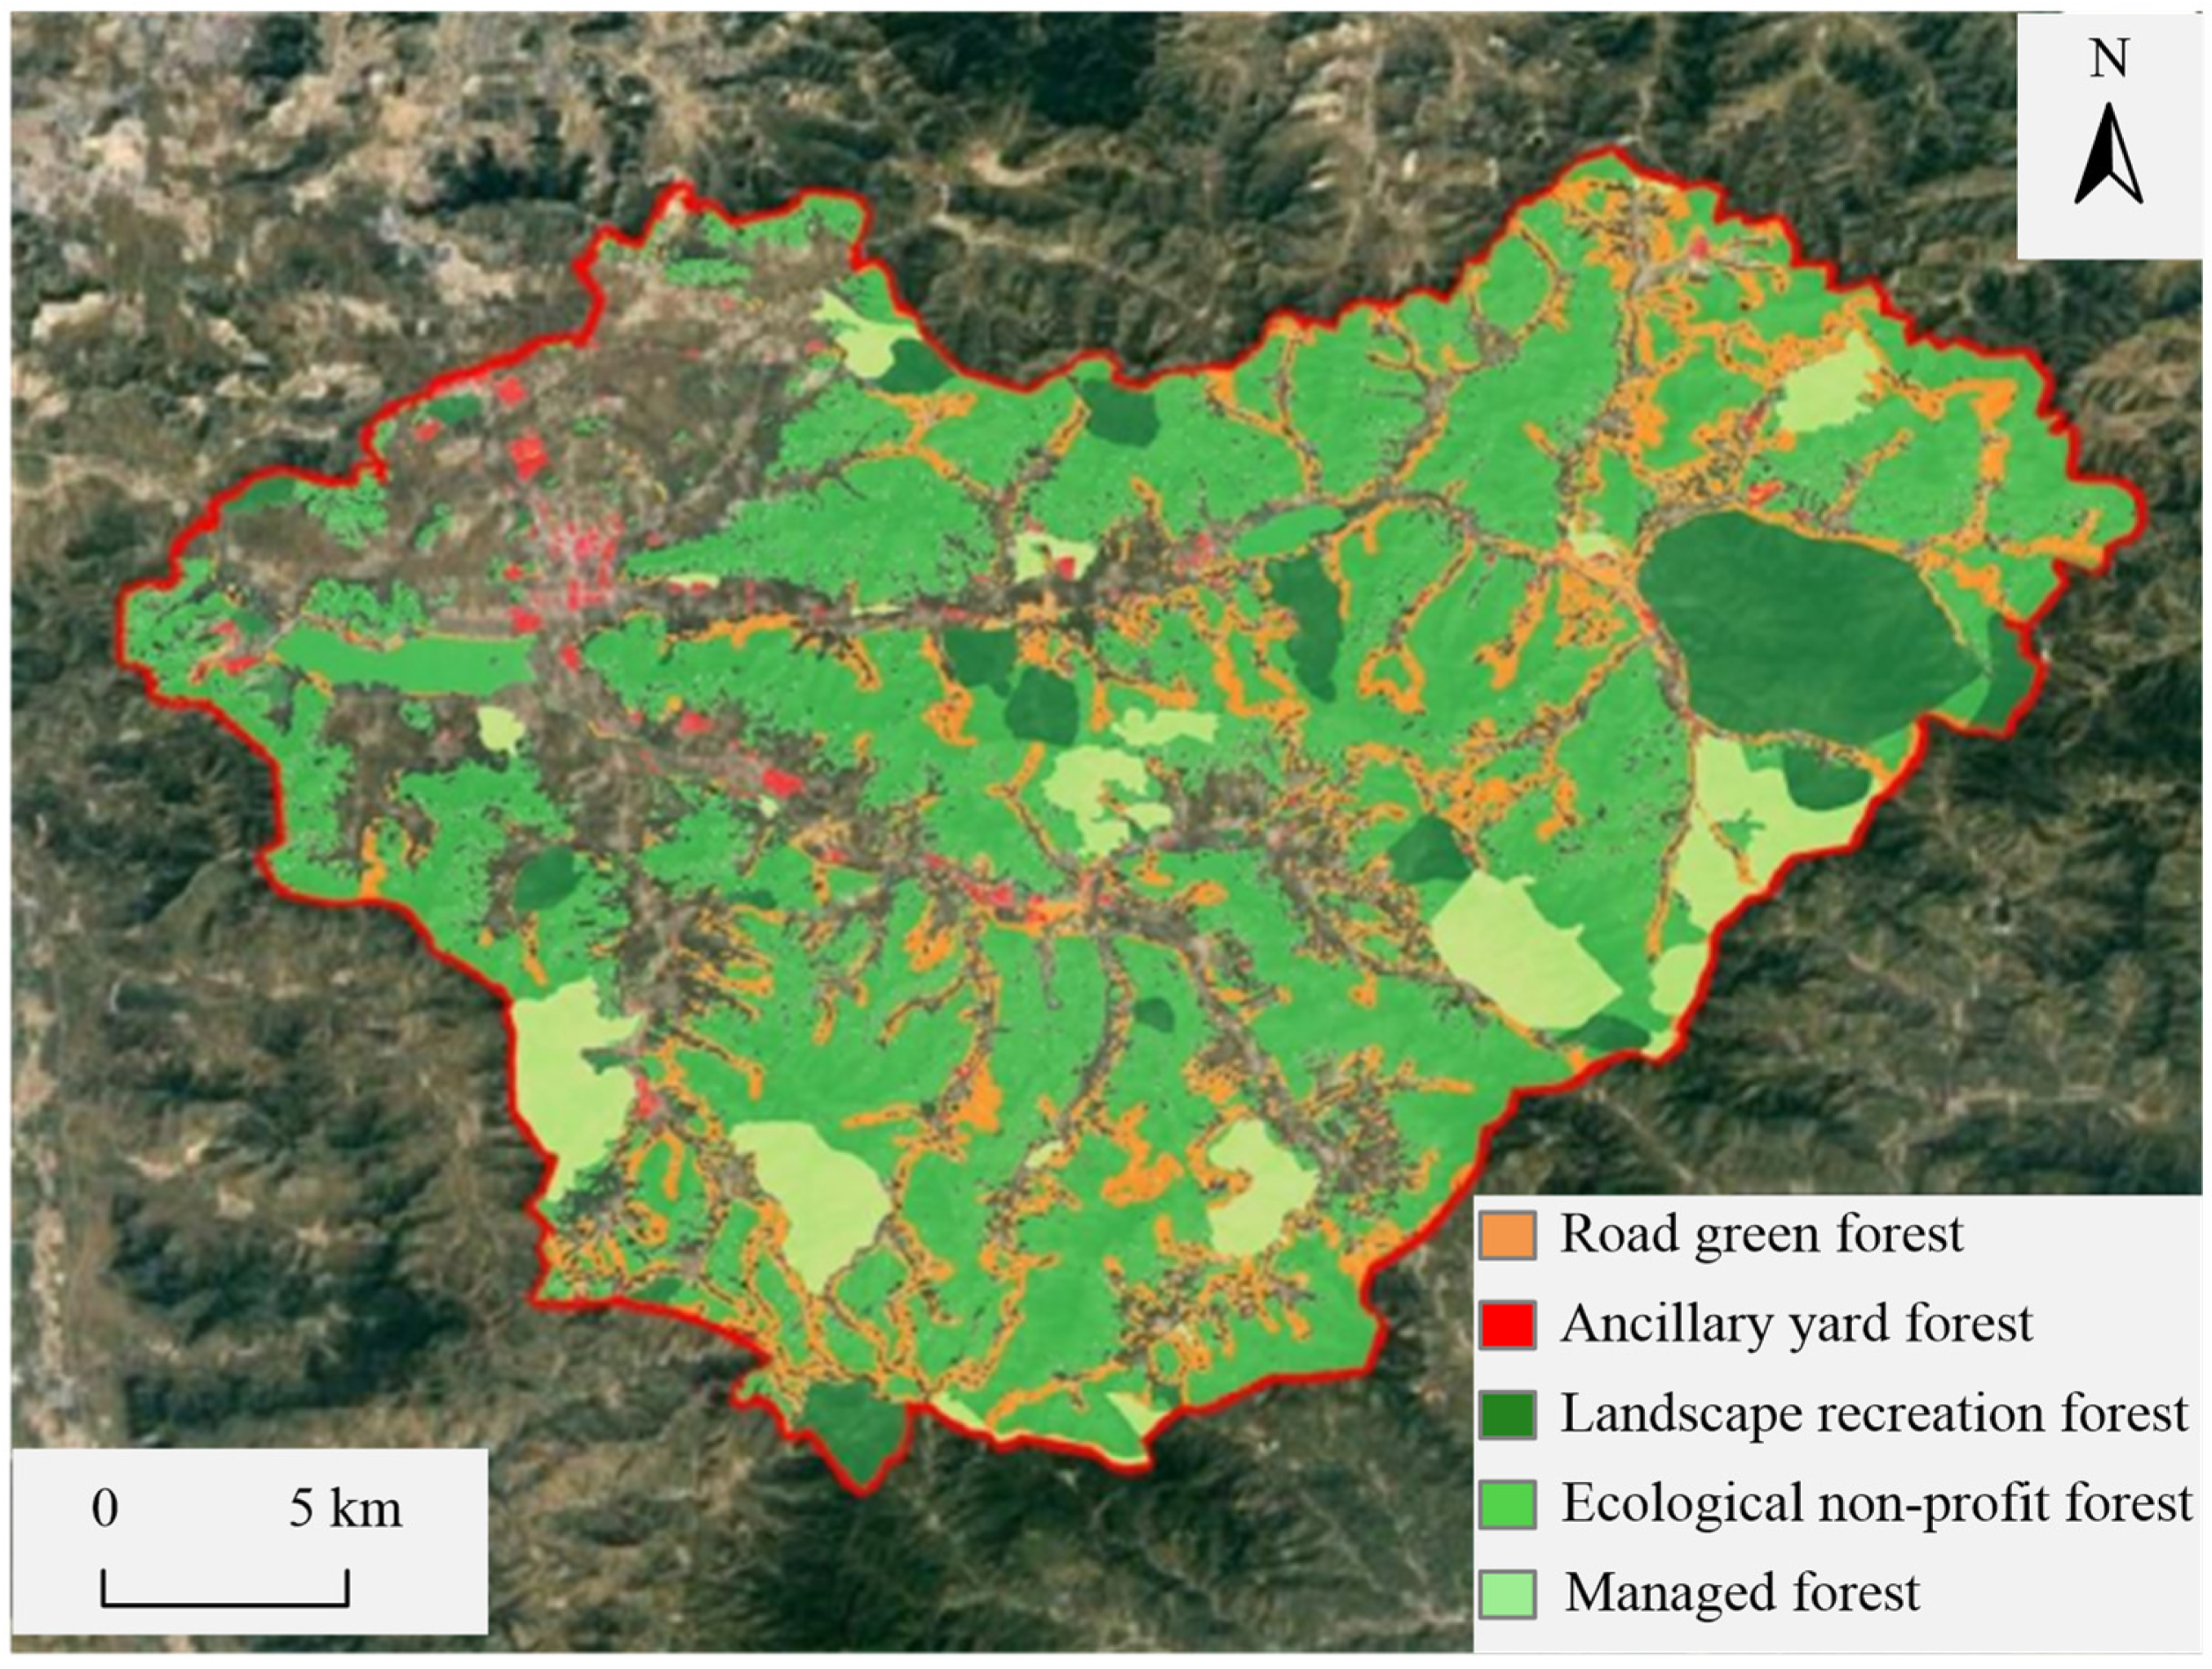
The building in Figure 1 presents a regular gray image with clear edges and shadows. Through research on the study area and analysis of relevant topographic maps, it is found that the distribution of the five ecosystem types in the area is relatively uniform. On this basis, the comprehensive information of urban forests obtained is interpreted and classified using remote-sensing images. Considering the needs of urban residents, they are segmented to meet the corresponding urban forest evaluation standards. The urban forest classification information of the study area is shown in Figure 2.
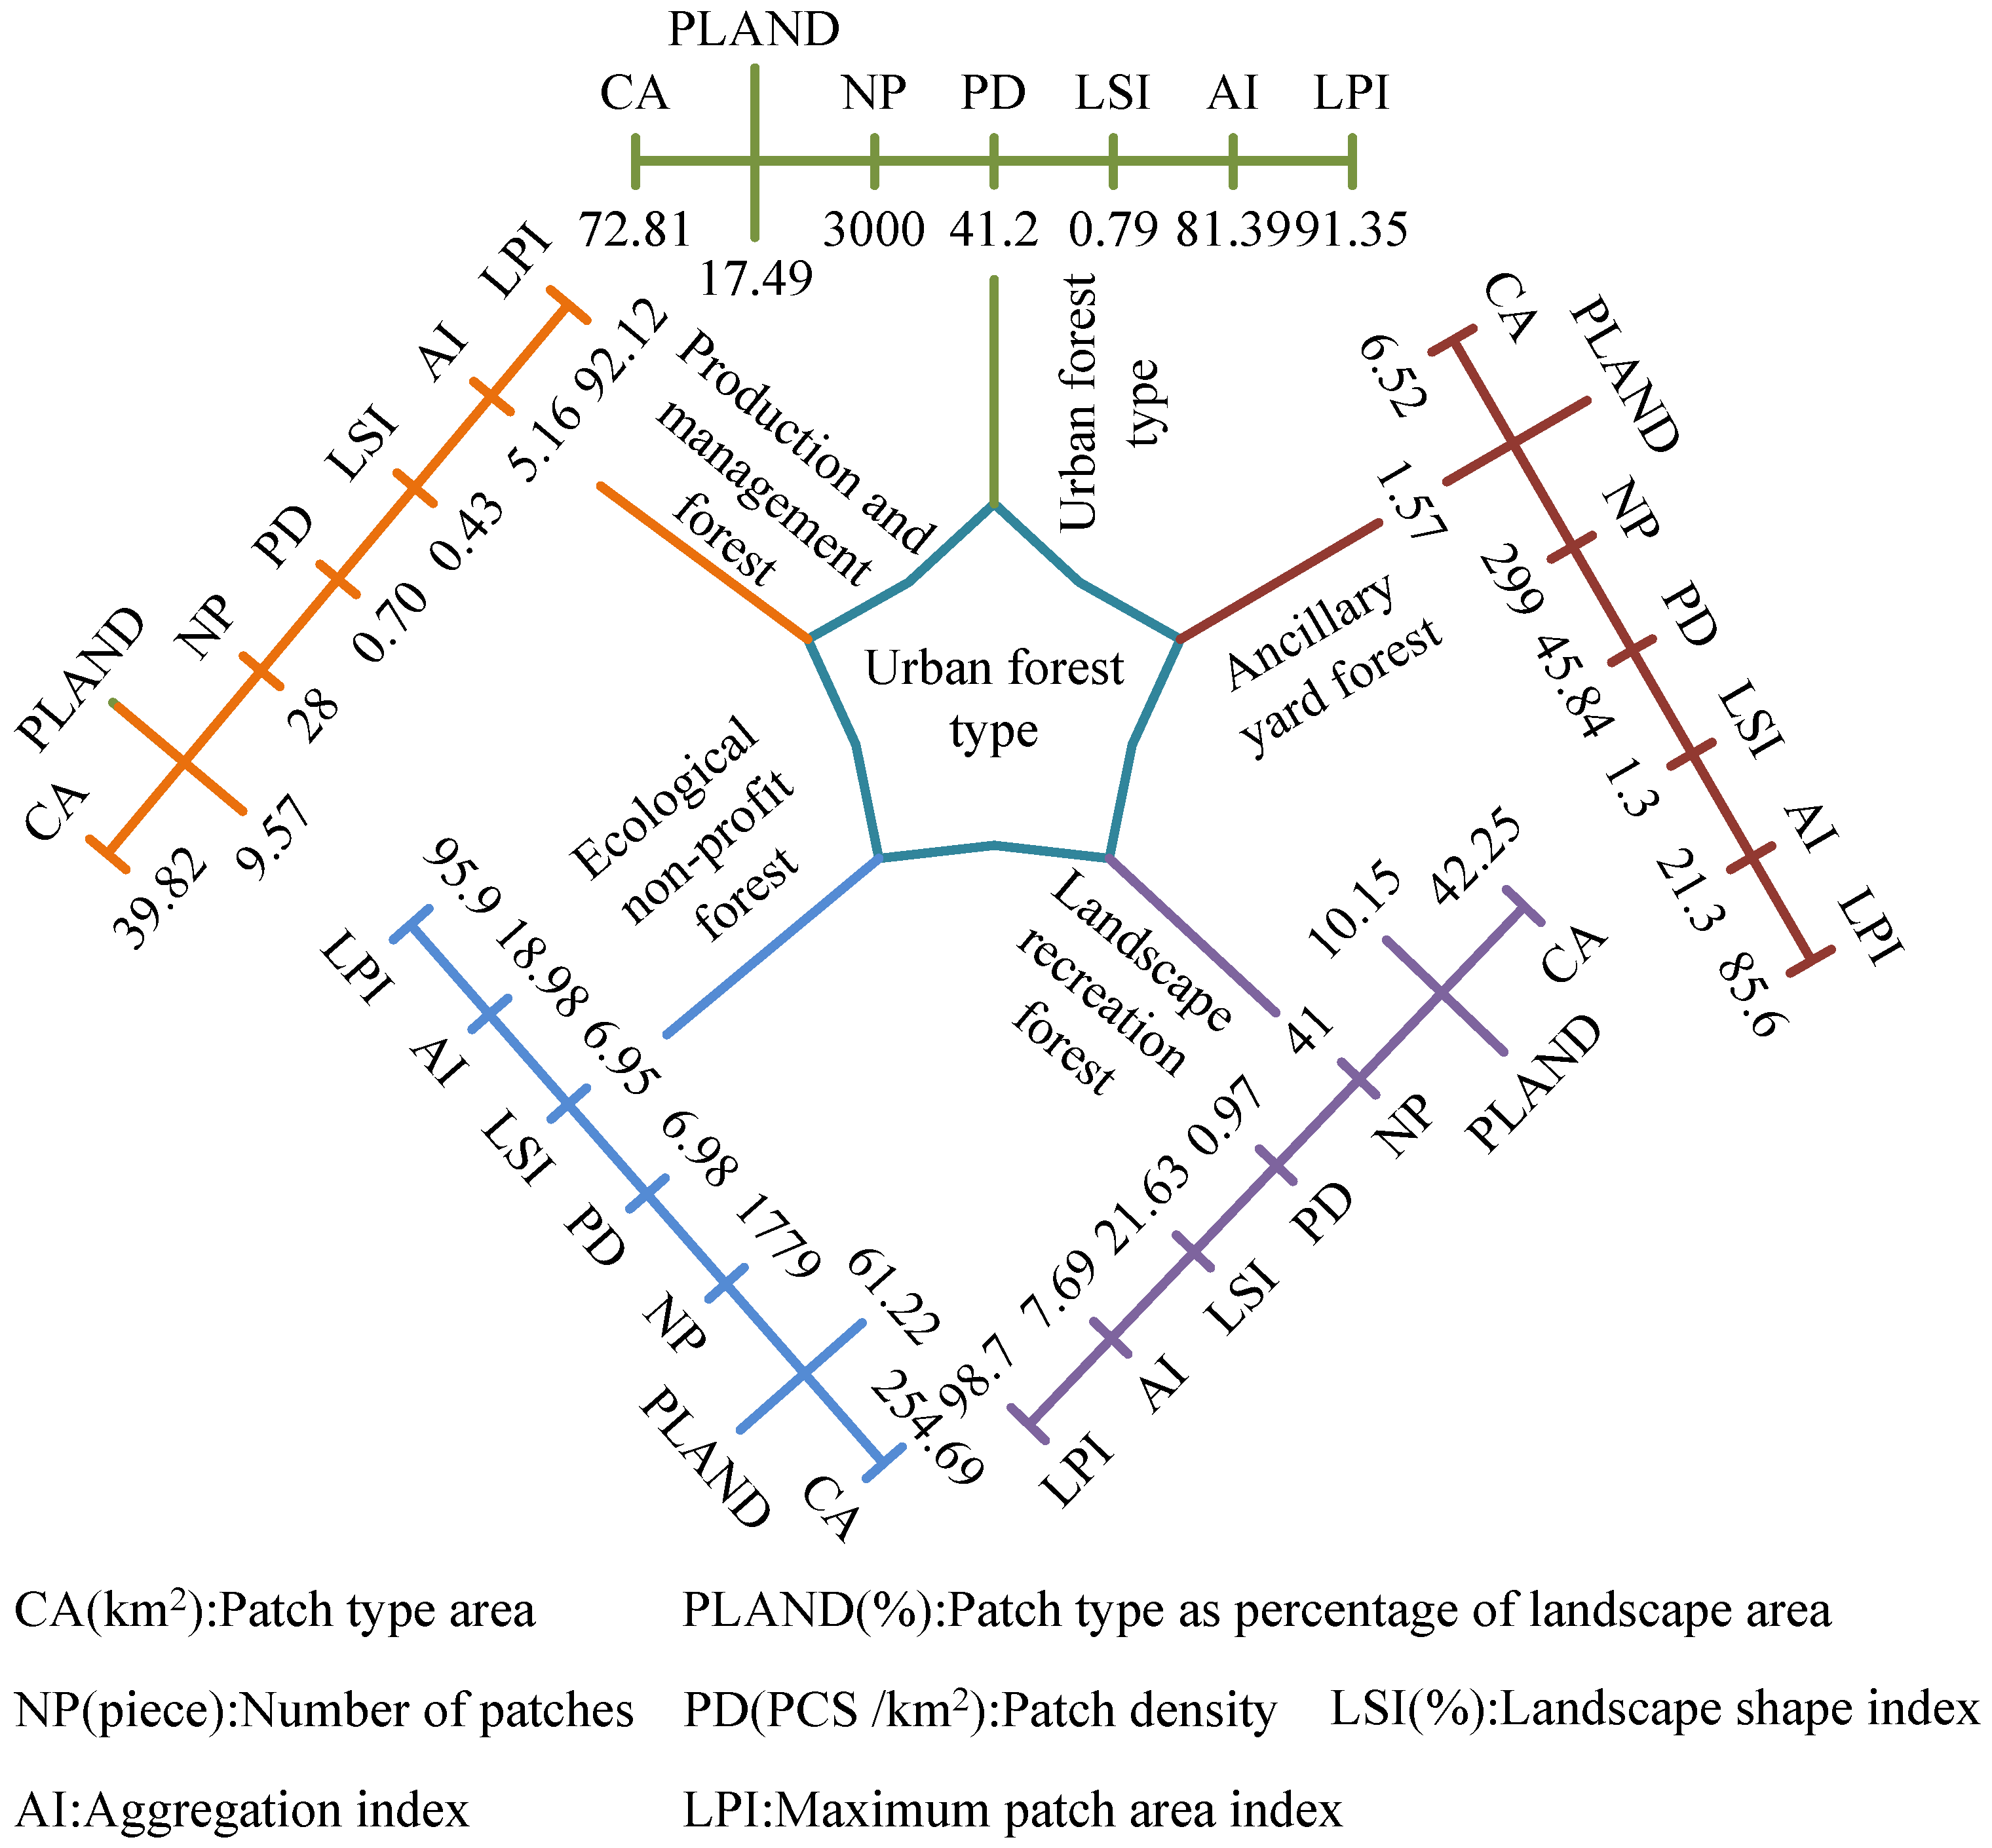
The urban forest area in Figure 2 can be interpreted into five types, namely industrial management forest, ecological public welfare forest, landscape and recreational forest, affiliated courtyard forest, and road greening forest. By supervised classification of its remote-sensing images, quantitative information of urban forests is obtained. And after processing the interpretation results, the forest map database and attribute library of the city in the area are obtained. Quantitative calculations are conducted on different types of urban forest landscape indicators using Fragstats 4.2 software, and the data are collected to obtain the classified patch landscape of urban forests. At the same time, data quantification processing is conducted on the overall landscape index of the urban forest [20]. The landscape classification and indicators of the urban forest classification patch level in the study area are indicated in Figure 3.
After interpreting the remote-sensing images of the study area through a GIS (Latest version, Redlands, CA, USA), the forest land, grassland, shrubs, and wetlands are extracted and integrated into urban forests, which are divided into five types as shown in Figure 3. Then, the corresponding forest information database is established to collect, integrate, and manage multi-dimensional data related to urban forests, so as to better understand and evaluate the status quo and changing trend of urban forests. It includes indicators such as the maximum patch area index, aggregation index, landscape shape index, patch density, amount of patches, percentage of patch type to landscape area, and patch type area, as shown in Figure 3. The patches of road greening forests are large and have a high connectivity. The amount of patches in the affiliated courtyard forest is relatively small, the landscape fragmentation is relatively small, and it has good morphological characteristics. The number of recreational forests is relatively small, mainly composed of large patches, with a low level of landscape fragmentation and uneven distribution of patches. Ecological public welfare forests account for the largest proportion in urban forests, with a moderate density and high fragmentation. The landscape morphology is relatively complex and has a good uniformity. The characteristic aspect of forest production is its low density and scattered patch distribution.
2.2. Construction of Comprehensive Benefit Evaluation Index System for Urban Forests
After obtaining comprehensive information on urban forests in the study area using GIS, a comprehensive benefit evaluation index system is constructed. When selecting evaluation indicators, it needs to fully consider the characteristics of urban forests. To fully showcase the entire urban forest landscape, four basic principles should be followed. Firstly, it needs to follow the scientific principle that the selected indicators should meet the requirements of urban forest development and objectively reflect the functional characteristics of the ecosystem. Secondly, it is necessary to meet the systematic principle, which comprehensively considers the ecological, economic, and social benefits of urban forests, as well as various factors such as structural characteristics and landscape patterns. It needs to conduct a comprehensive evaluation of the construction status of various indicators, while also reflecting the interrelationships between various subsystems, that is, select representative indicator factors to avoid overlapping evaluation content. Finally, it is necessary to follow the principle of operability to ensure that the operational process is practical and feasible, and to ensure that the data collection and calculation of evaluation indicators are feasible. Based on the above principles and combined with the comprehensive information of urban forests obtained from GIS, the indicator hierarchical structure model established is shown in Figure 4.
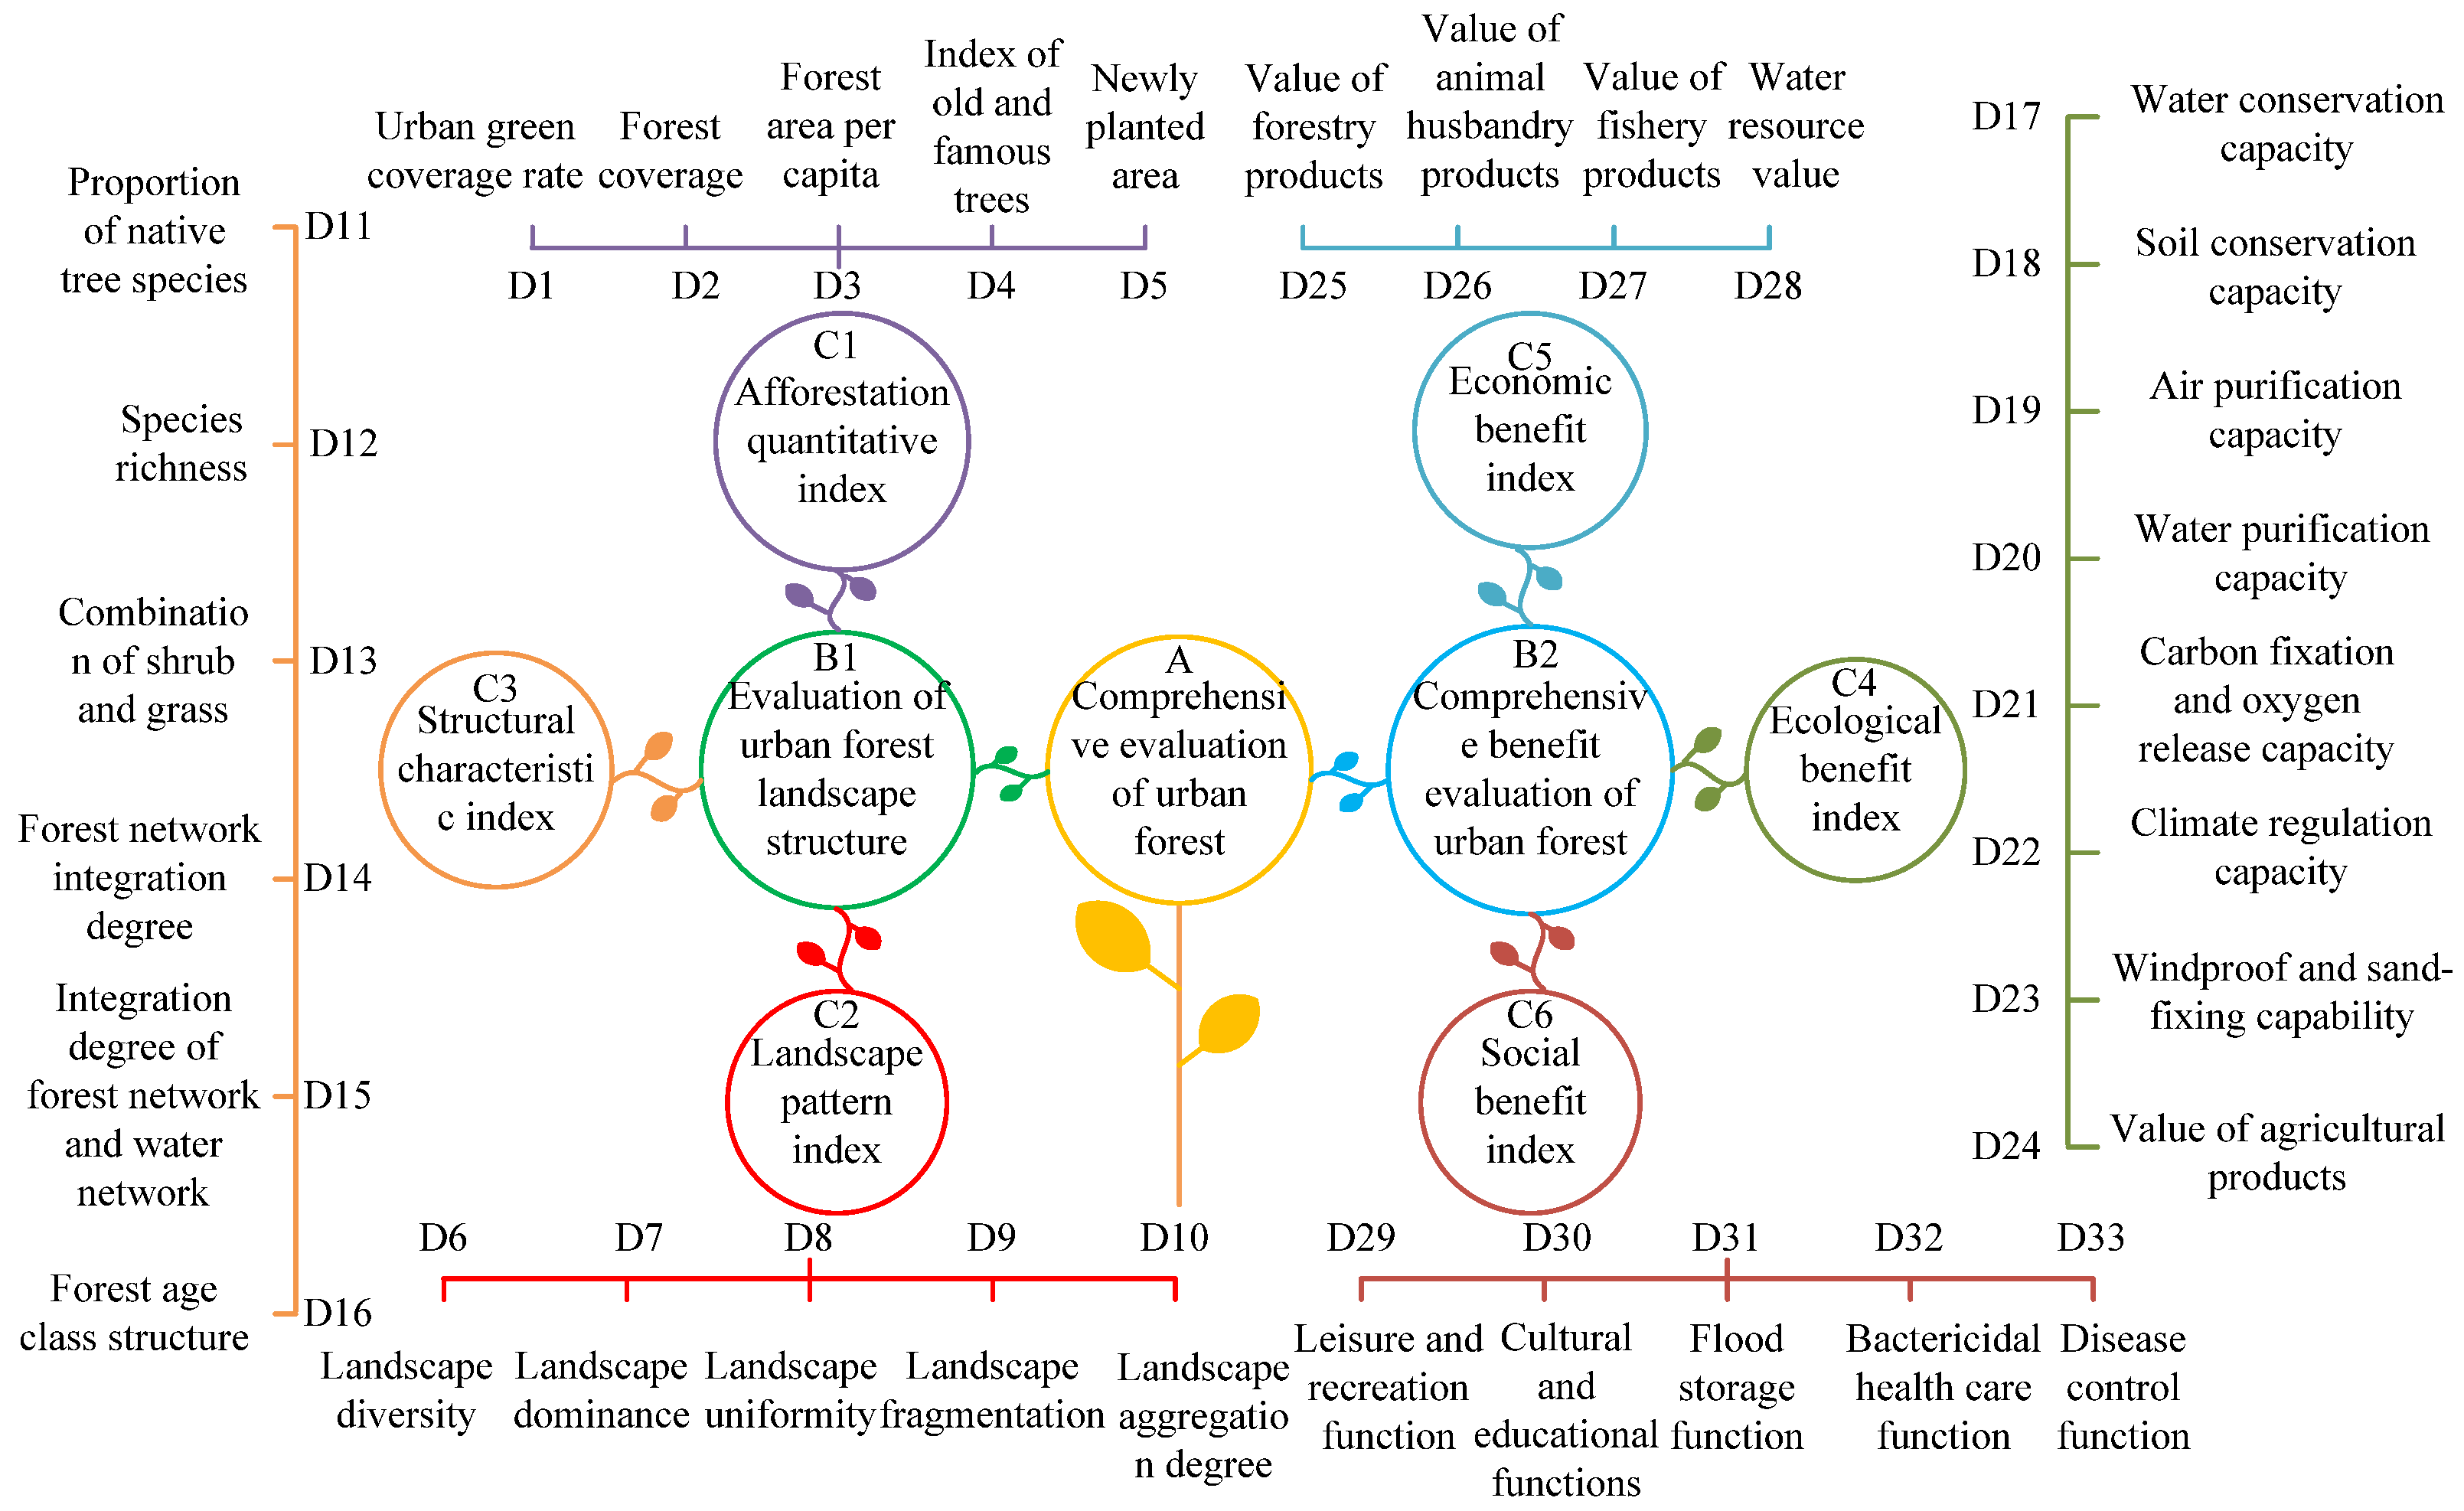
The study classifies and layers complex problems, and fully considering the current construction status of urban forests in the study area, a hierarchical model of the indicator system is constructed. The model is mainly divided into four layers as shown in Figure 4. After selecting supporting indicators that can provide support for the development status of the region, the Delphi expert evaluation method is used to invite relevant experts to score each indicator. Finally, by combining qualitative and quantitative methods, a comprehensive evaluation index system for urban forest quality in the region can be obtained, as shown in Figure 5.
In Figure 5, the study divides the comprehensive evaluation of urban forests into four indicator levels and selects 33 evaluation indicators. The target layer set for this research evaluation is the urban forest landscape structure evaluation index (B1) and the urban forest comprehensive benefit evaluation index (B2). In the factor layer, the evaluation indicators for B1 include C1~C3, and the evaluation indicators for B2 include C4~C6. In the quasi measurement layer, the evaluation indicators for C1 are D1~D5. The evaluation indicators for C2 are D6~D10. The evaluation indicators for C3 are D11 to D16. The evaluation index set for C4 is D17, D18, D19, D20, D21, D22, and D23. The evaluation index set for C5 is D24, D25, D26, D27, and D28. The evaluation index set for C6 is D29, D30, D31, D32, and D33. In addition, the study will use the Delphi method and AHP to assign weights to evaluation indicators [21]. Experts and scholars in the field are invited to compare each indicator before assigning weights. Using mathematical statistics methods, it conducts statistical analysis on the results of expert evaluations. By constructing a comparison matrix and using the assignment method, the importance of each element within the same level is compared. On this basis, various elements are combined with the urban forest index evaluation system for subjective evaluation. And the 1–9 scale method is utilized to quantify it. The proportional scale of the relative importance of elements is shown in Table 1.
The normalization summation method is used to solve the eigenvector and the maximum eigenvalue . Firstly, it normalizes the column vectors of the judgment matrix, and the calculation expression is shown in Equation (1).
Vectors in each row are added to obtain Equation (2).
It normalizes the vector again to obtain the weight vector, as shown in Equation (3).
From Equations (1) to (3), the vector can be obtained, which is the weight vector. Finally, the maximum eigenvalue of the judgment matrix is calculated, as denoted in Equation (4).
In Equation (4), represents the element of , and represents the order. Calculation by specialized mathematical software can ensure the accuracy of weighting. This study uses MATLAB software (R2022a version, Natick, MA, USA) to solve the maximum characteristic root of the matrix . In the actual calculation, some comparative averages may not fully achieve consistency, but to some extent, they can still be considered consistent. Equation (5) is the consistency testing formula [22].
In Equation (5), means the average random consistency indicator. means the consistency ratio. When , consistency testing is acceptable, otherwise the judgment matrix will be corrected. The fuzzy comprehensive evaluation method is based on quantitative data as support and combined with the subjective consciousness of the evaluatorto conduct a comprehensive evaluation of the target from multiple perspectives. The steps are as follows: Firstly, determine the set of evaluation indicators. Secondly, determine the evaluation level. Next, determine the fuzzy relationship between each evaluation objective from to through Equation (6).
In Equation (6), represents the frequency distribution of the factor on the comment . The factors in usually satisfy for the membership relationship of grade in . Finally, combining the weight of the indicator with the fuzzy relationship matrix , the overall evaluation vector of the indicator is determined [23].
2.3. Construction of Evaluation Index System for Urban Forest Ecological Compensation Standards
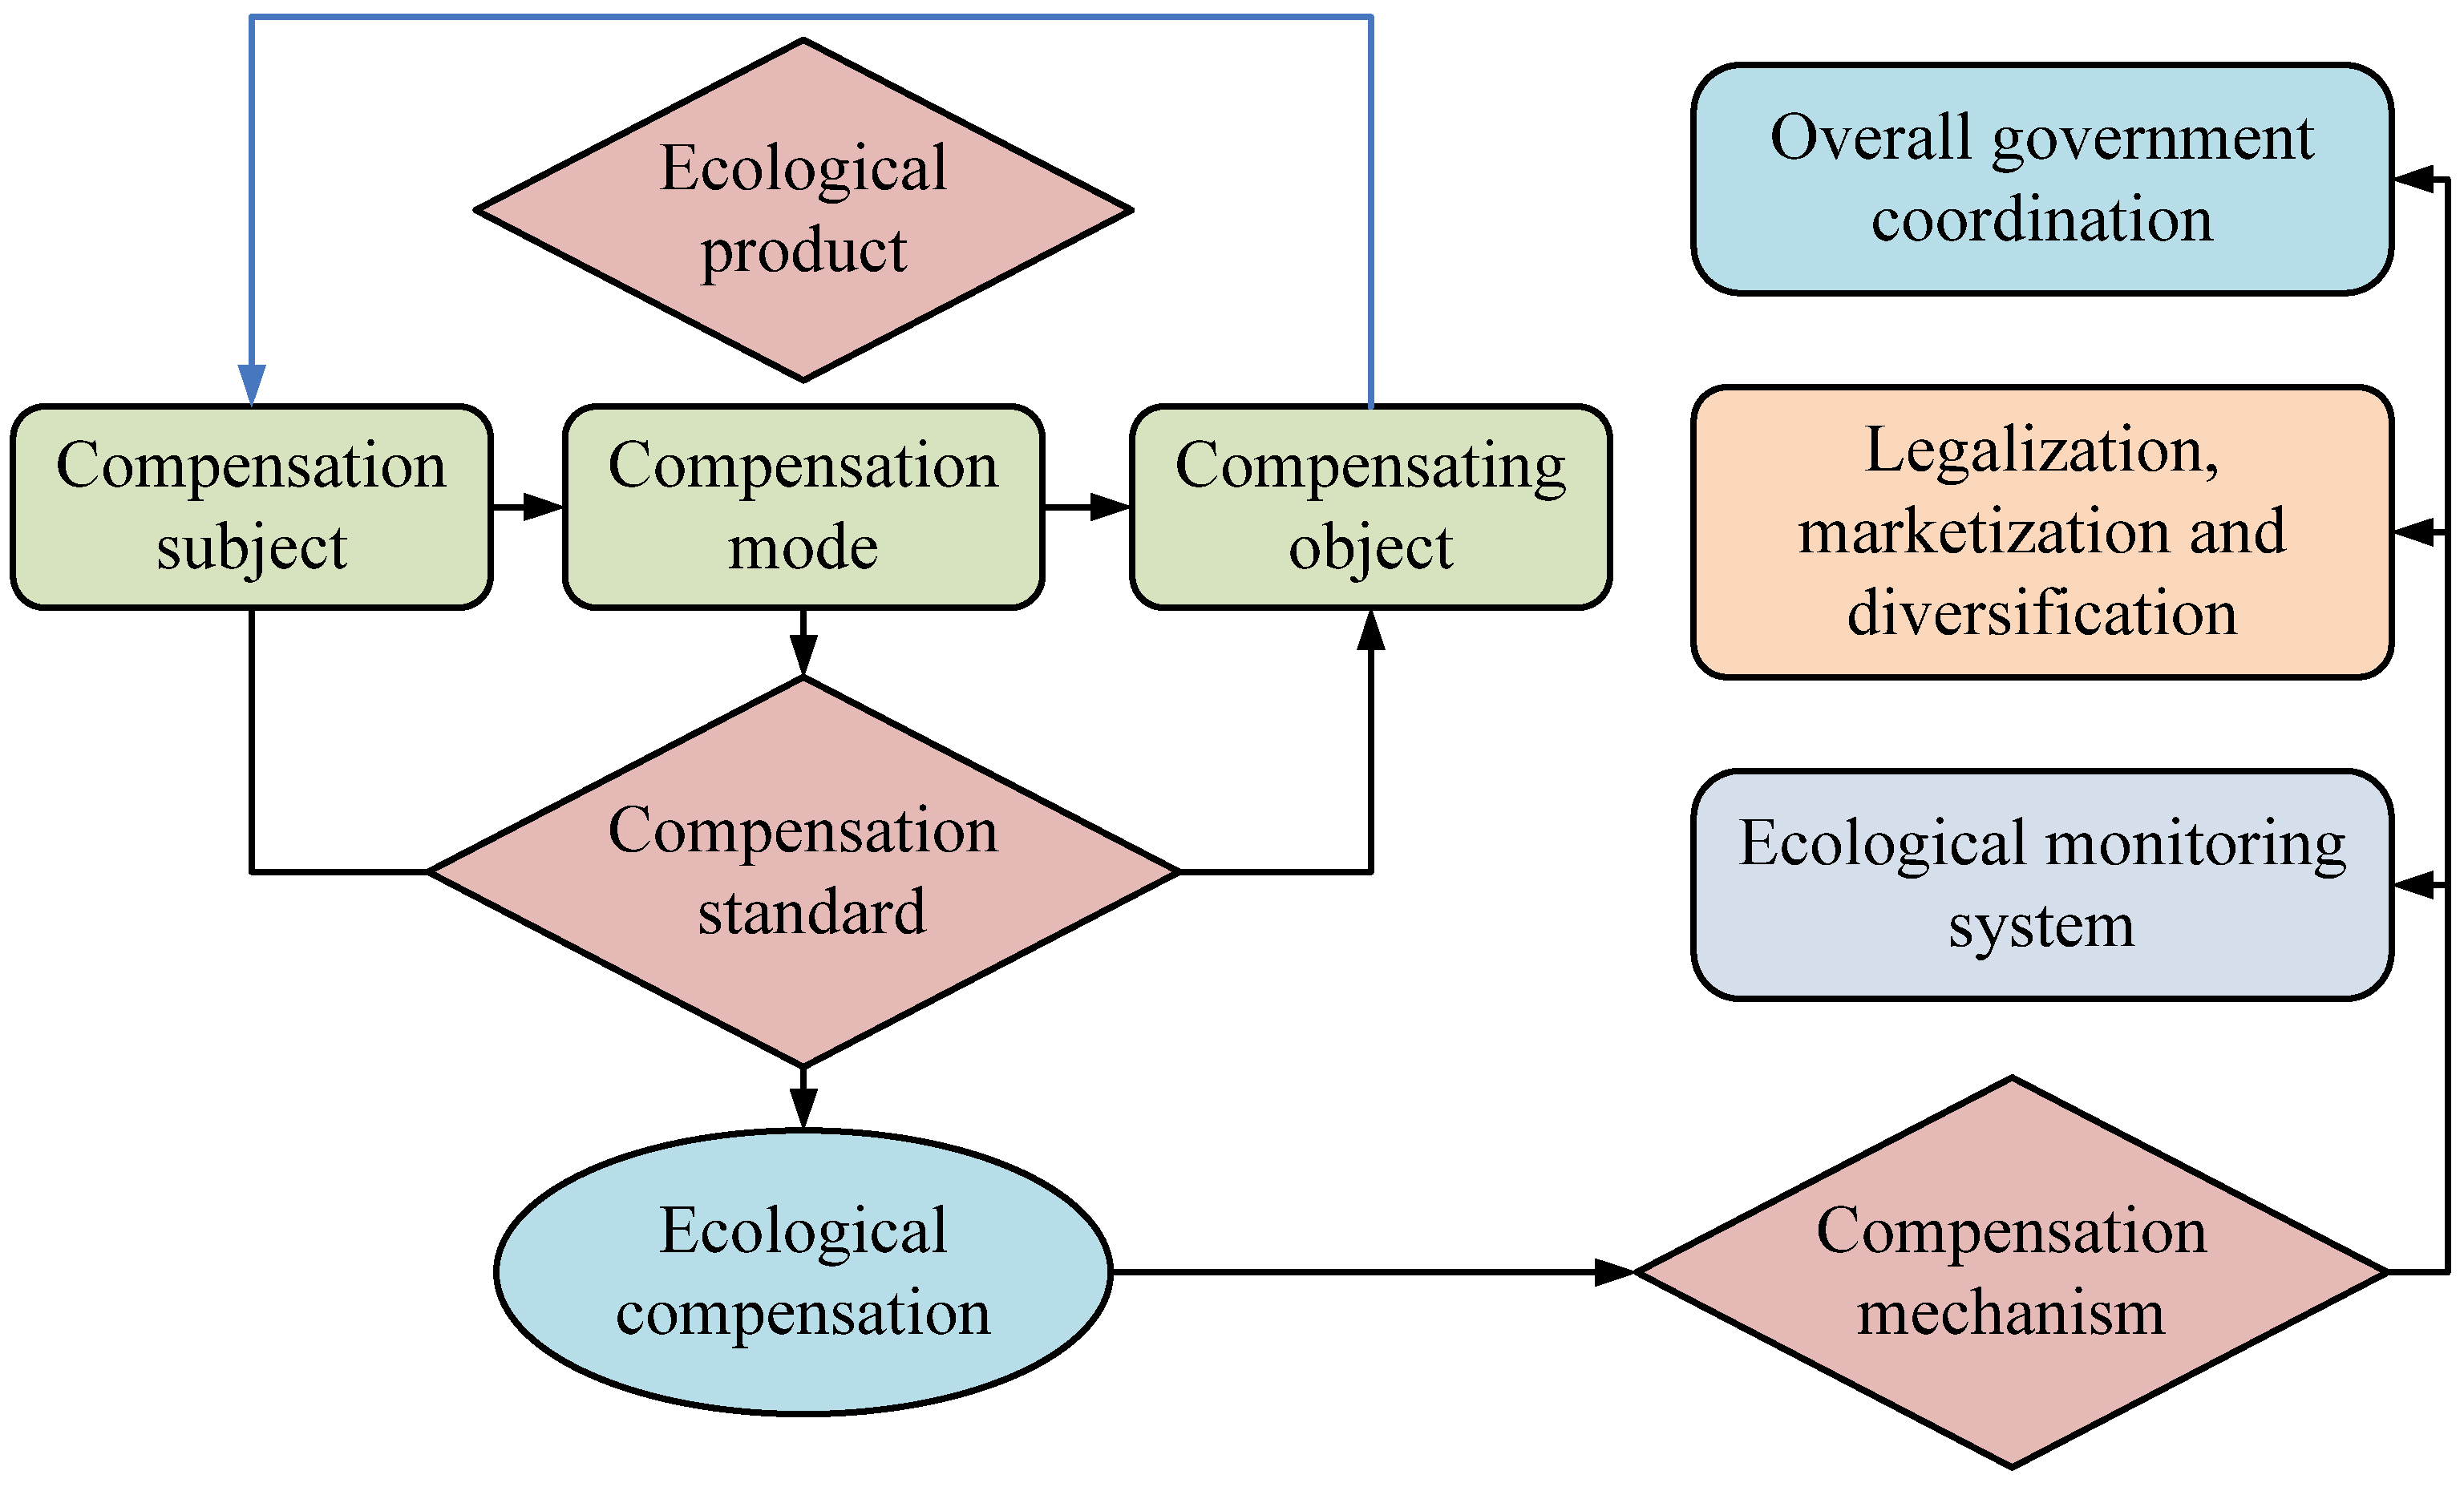
The ecological compensation mechanism is an important guarantee for fully utilizing the ecological service function of urban forests. The research is based on the basic theory of ecological compensation and provides corresponding accounting methods, providing a theoretical basis for ecological compensation strategies in the region [24]. Figure 6 shows the overall framework of the ecological compensation mechanism.
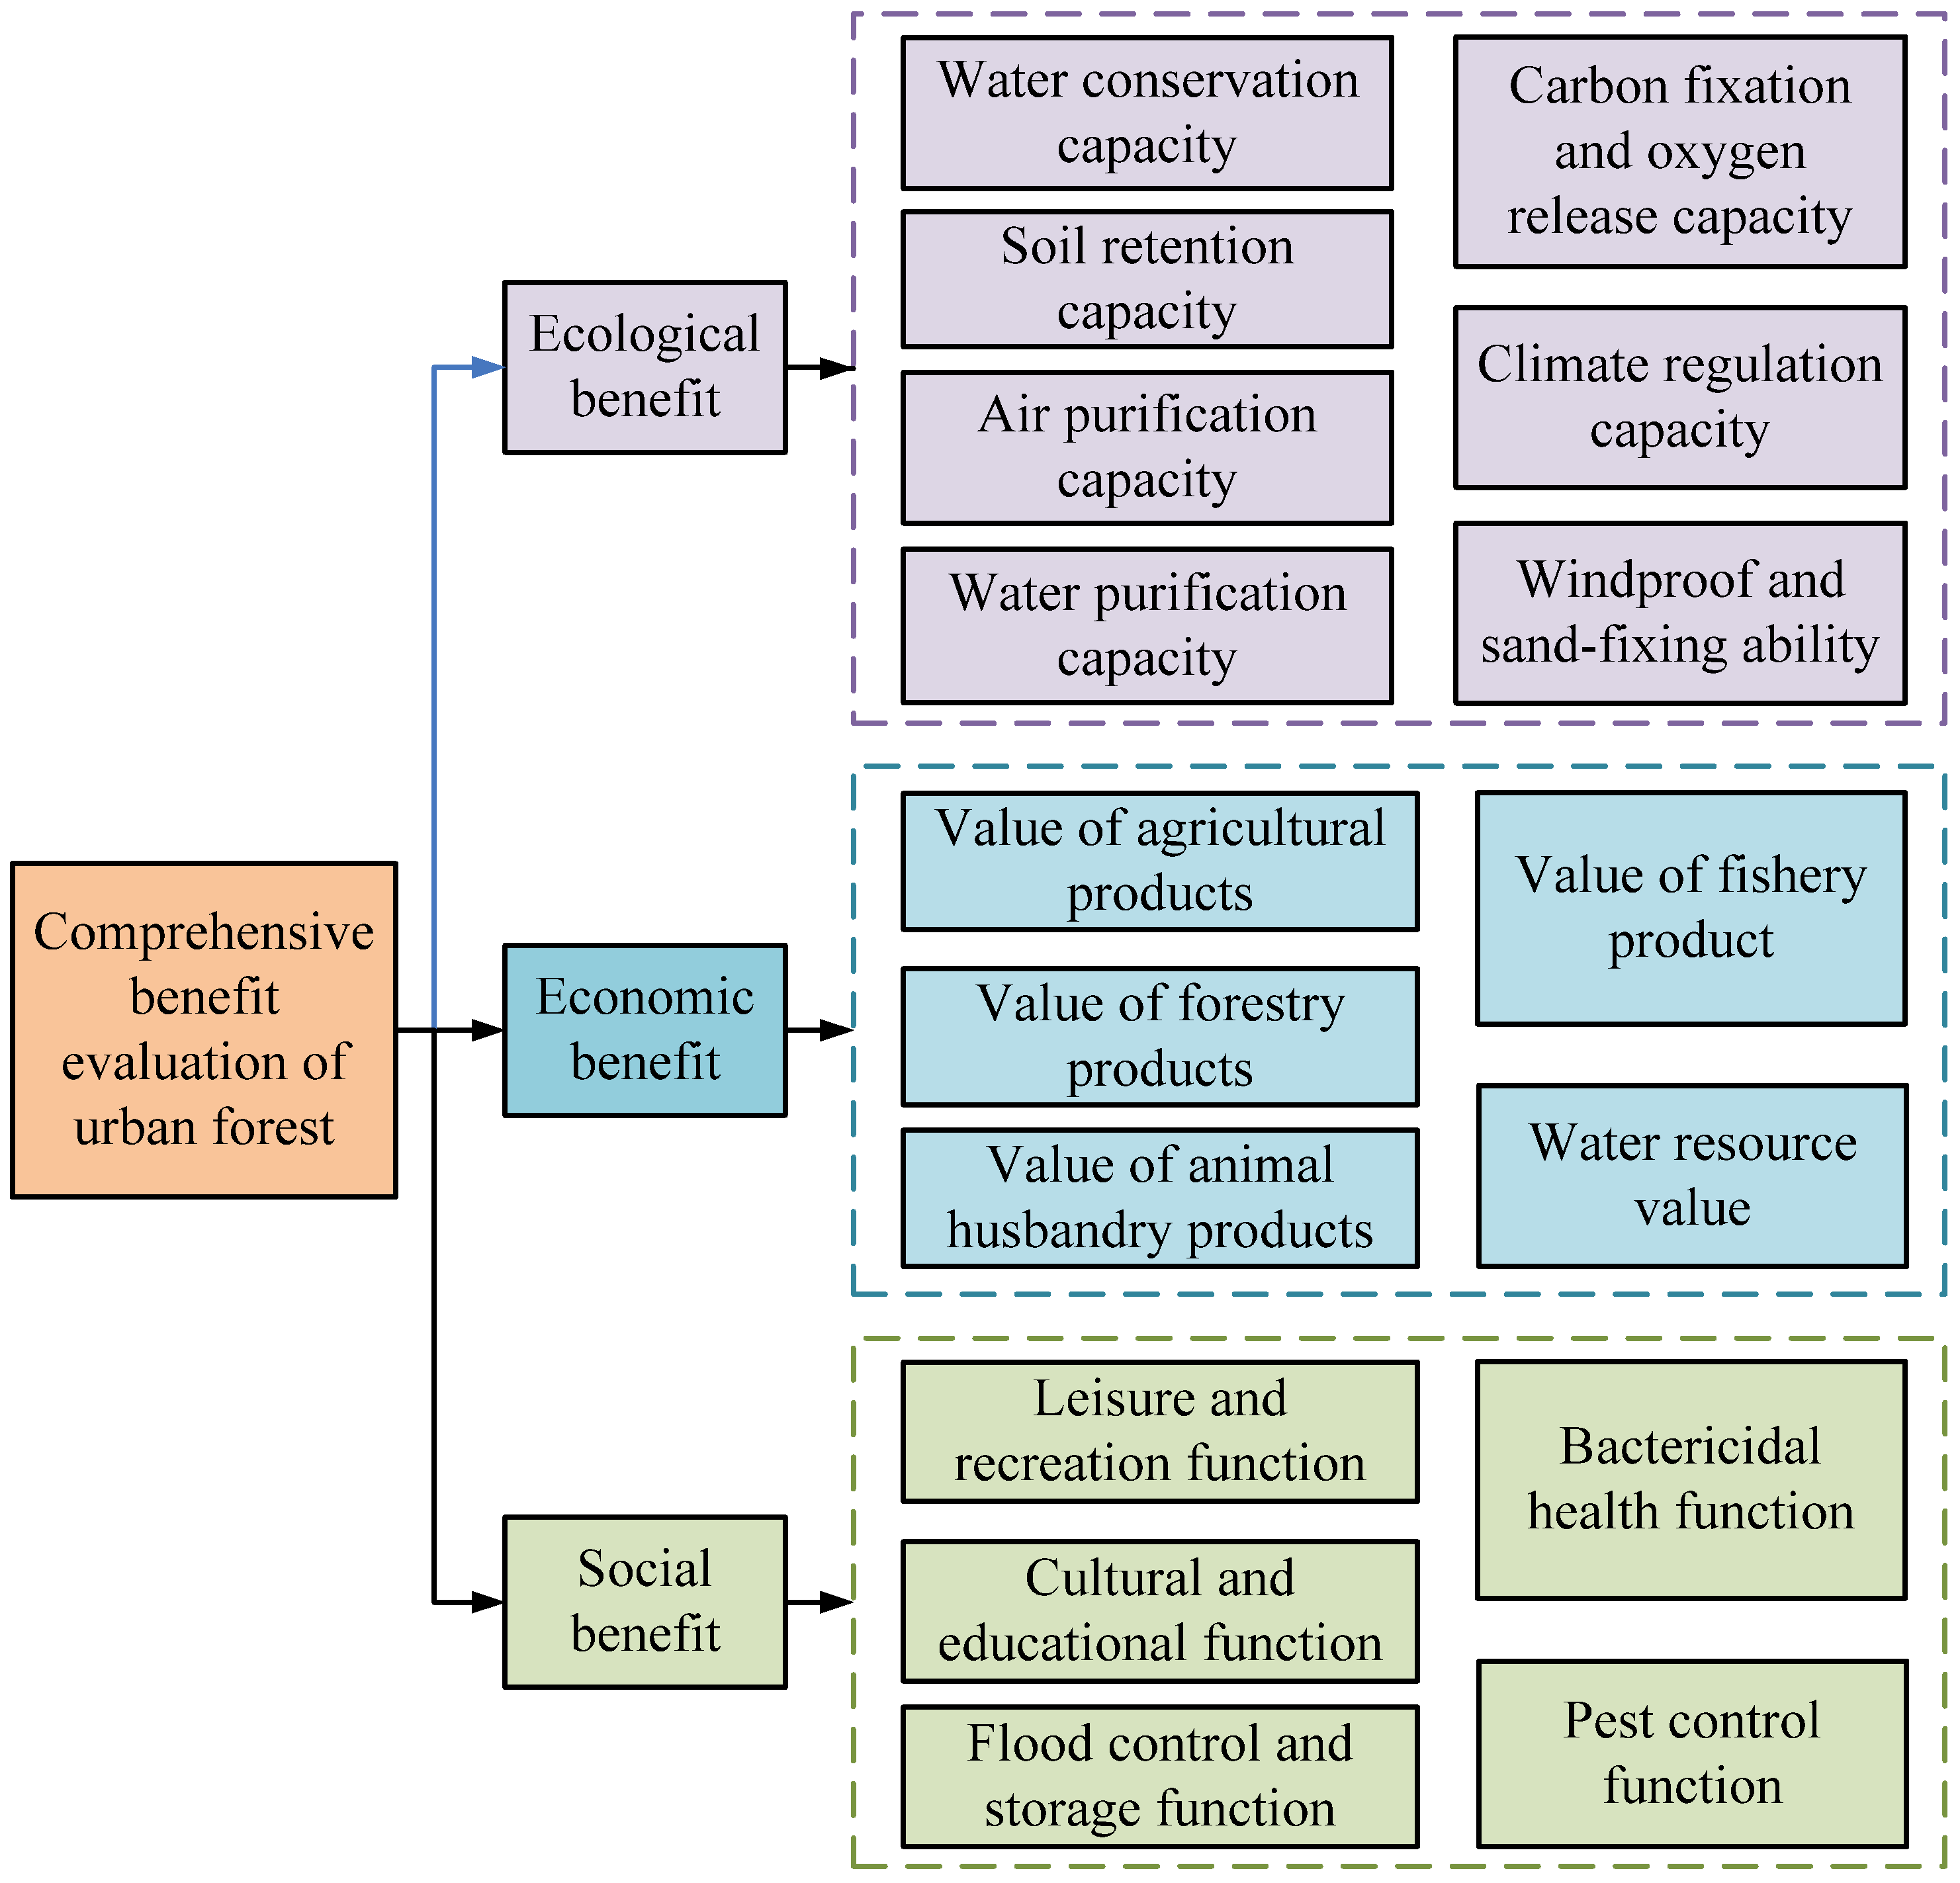
In Figure 6, the subject of ecological compensation is Tai’an City, and the subject of compensation is the research area. Based on international practical experience in ecological compensation, diversified approaches to ecological compensation have been proposed. At present, the main means of ecological compensation are mainly government financial transfers, supplemented by other means. In addition, further progress is needed in marketization [25]. The ecosystem service function refers to the various benefits provided by the ecosystem to humans, including various supply services, such as carbon sequestration and oxygen release, air purification, and climate regulation services. Ecosystem services closely integrate the relationship between humans and nature, and the gross ecosystem product (GEP) denotes the sum of the values of various goods and services provided by ecosystems to humans. By establishing a GEP accounting system, it is possible to evaluate the gross domestic product of various ecosystems [26,27]. Based on the above theory, the urban forests’ comprehensive benefits are composed of ecological, economic, and social benefits. Figure 7 shows the evaluation index system for urban forest ecological compensation standards constructed through research.
In Figure 7, ecological benefits are mainly reflected in water source conservation, soil conservation, air purification, water quality purification, carbon sequestration and oxygen release, climate regulation, wind and sand fixation, and other aspects [28]. The connotation of water conservation capacity is mainly reflected in two aspects: regulating water quantity and purifying water quality. The main connotation of soil and water conservation capacity is water and fertilizer conservation. The air purification capacity is evaluated based on the absorption of gaseous pollutants, delayed TSP, PM10, and PM2.5. The meaning of water quality purification capacity is the removal amount of COD, the purification of total nitrogen, and the purification of total phosphorus [29]. The ability to fix carbon and release oxygen is measured by the fixation of carbon dioxide and the production of oxygen. The energy consumption of vegetation transpiration and surface evaporation is the main connotation of its climate control ability, and the ability to prevent wind and fix sand is measured by the amount of sediment deposition as an indicator of its sand blocking ability. The indicators of economic benefits include agriculture, forestry, animal husbandry, fisheries, and the value of water resources. The indicator connotation of the agricultural product value is the yield and output value of agricultural products. The indicator connotation of the forestry product value is the yield and output value of forestry products. The connotations of other indicators are respectively described in Figure 7. The distributed accounting model for urban forest ecological compensation standards is shown in Figure 8.
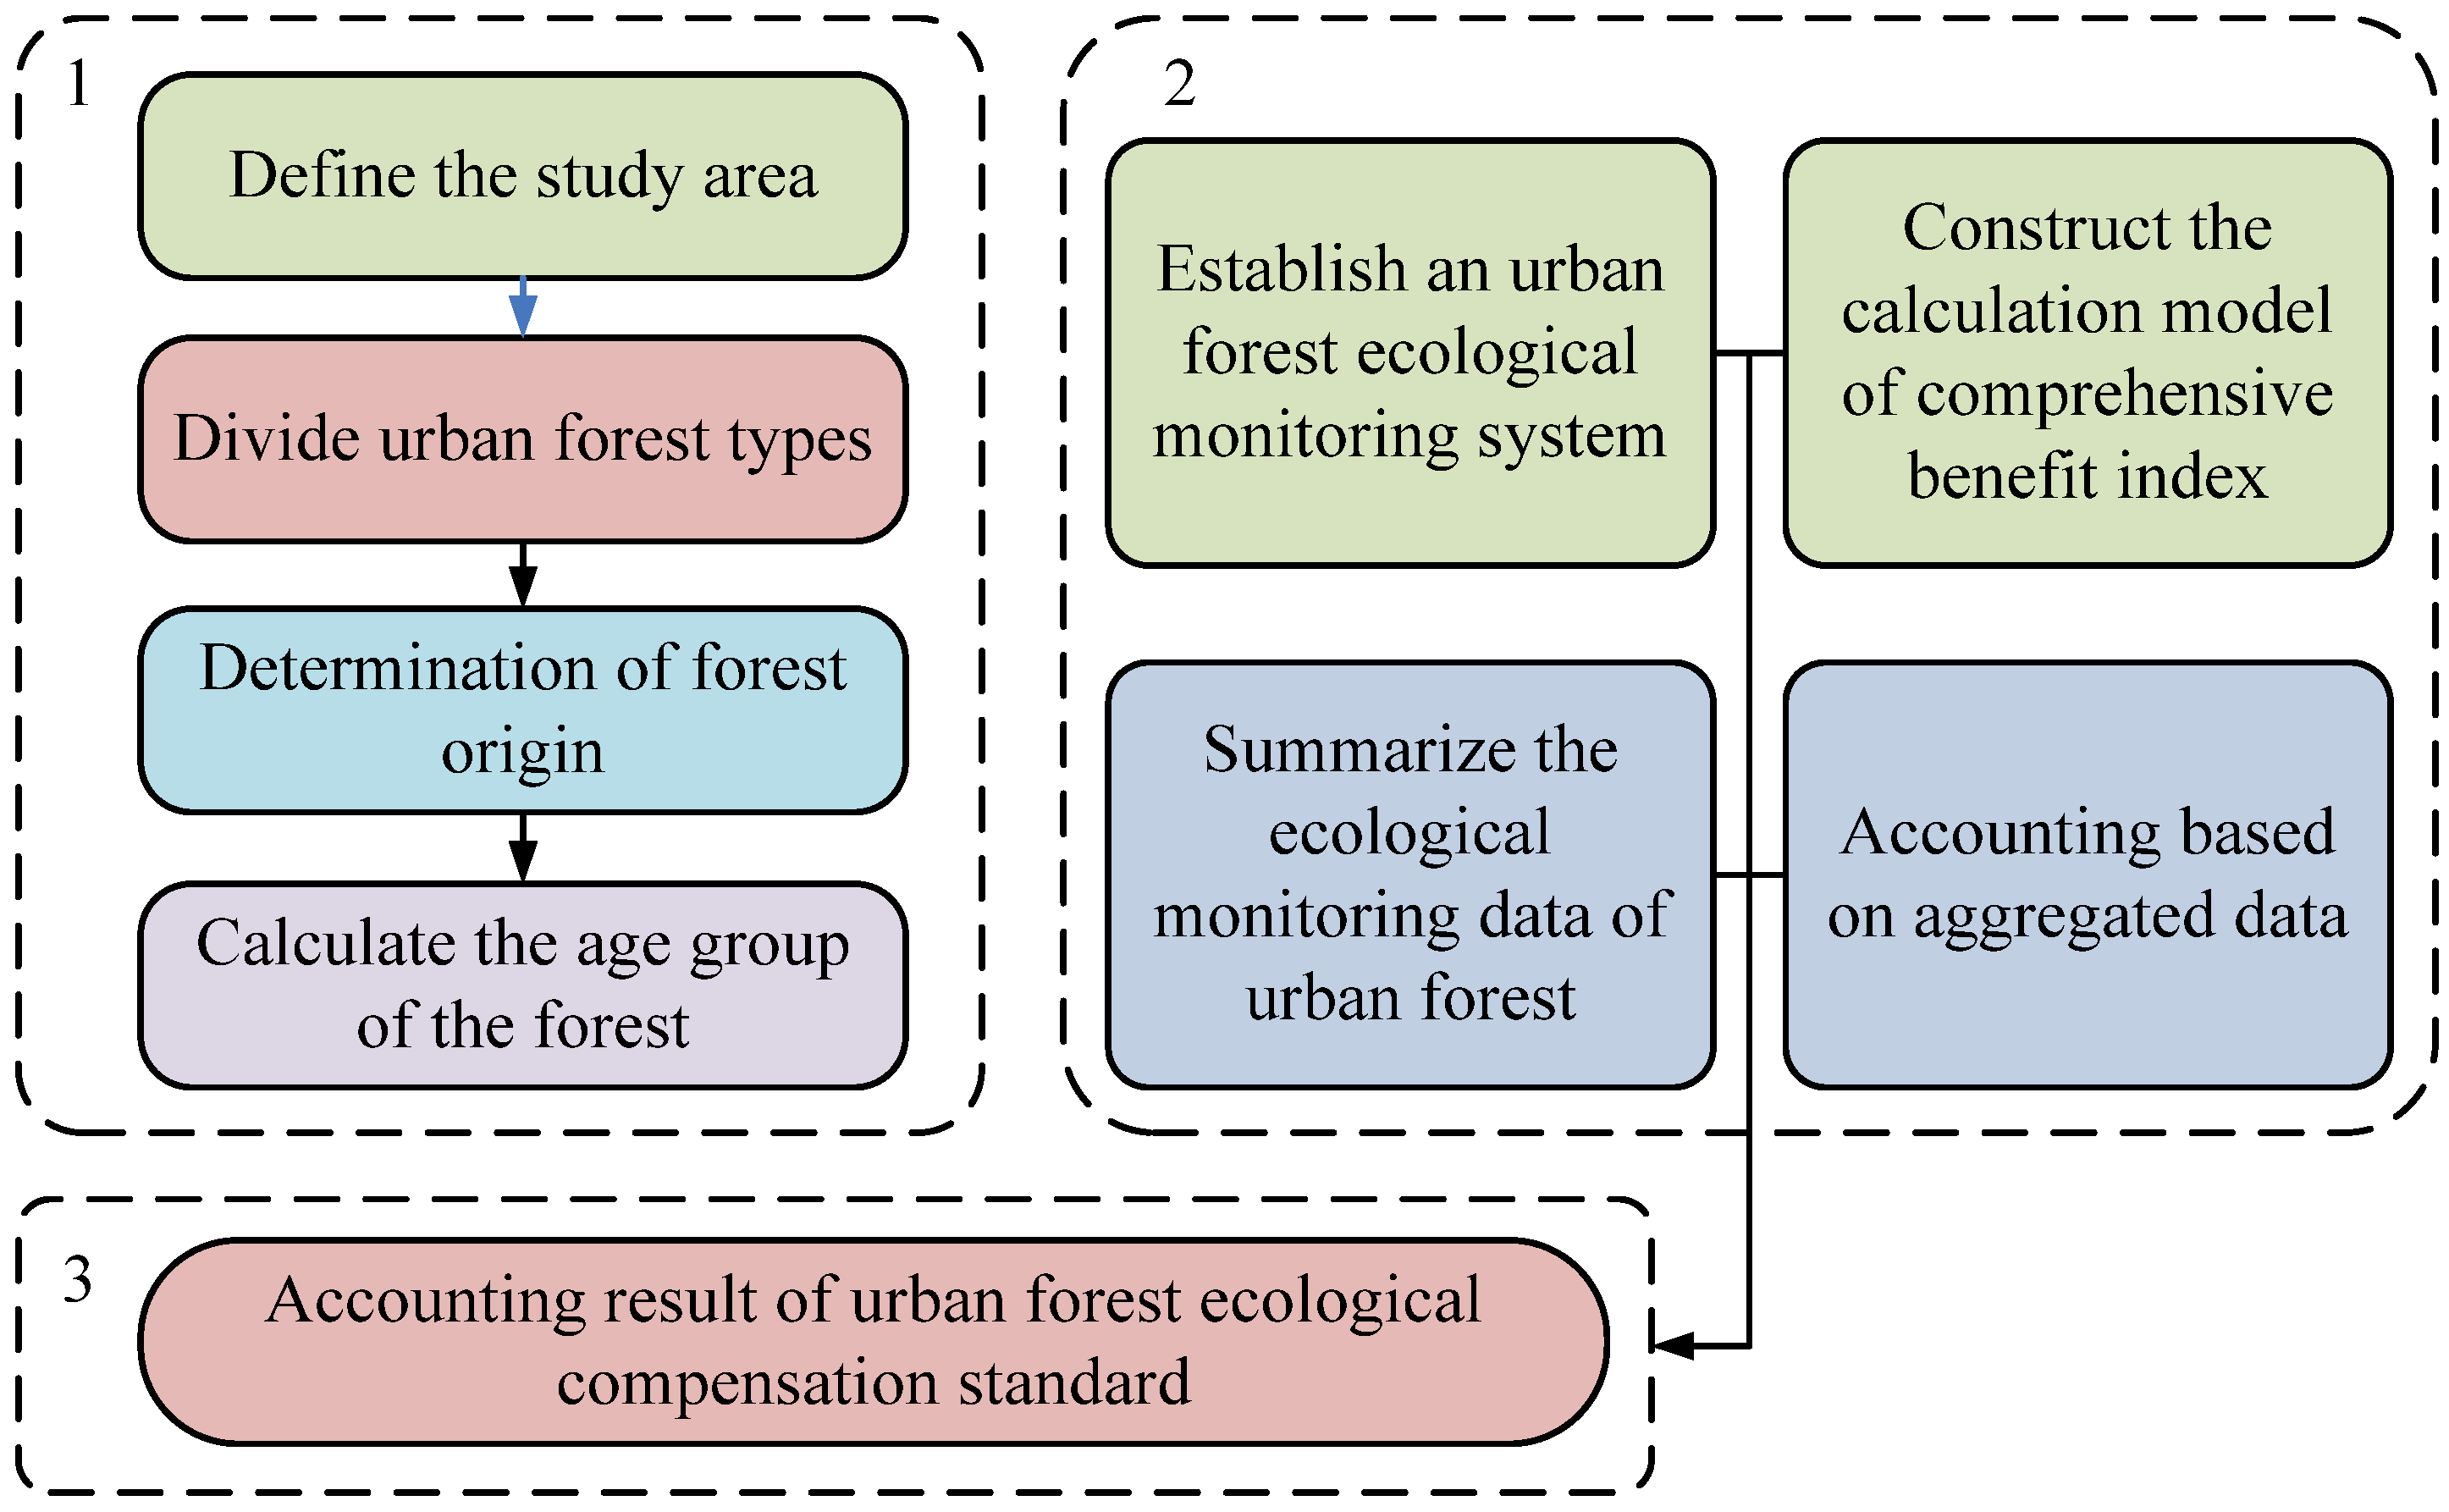
In Figure 8, the distributed measurement method first partitions heterogeneous urban forests and divides them into several levels. And according to different types of urban forests, they are divided into several secondary measurement units [30]. Secondly, the original forest is divided into two three-layer units, namely the natural forest and artificial forest. According to the age of the forest, it is divided into four levels of measurement units: young, medium-aged forest, near-mature forest, mature forest, and over-mature forest. On this basis, an ecosystem service function evaluation index system is established. In the calculation of ecological compensation standards, the calculation expression of the value of regulating water volume for water source conservation capacity is shown in Equation (7) [31].
In Equation (7), is used to evaluate the annual adjusted water volume of the forest stand, and is the buying and selling price of the water resource market. The calculation of the soil consolidation value in the soil retention capacity is shown in Equation (8) [32].
In Equation (8), is the soil capacity. is used to evaluate the annual soil conservation of forest stands. represents the cost of earthwork excavation and handling per unit volume. The calculation of the value of absorbing gas pollutants in the air purification capacity index is shown in Equation (9) [33].
In Equation (9), represents the annual absorption of SO2 by the evaluated forest, and represents the management cost of SO2. represents the annual fluoride absorption of the evaluated forest, while represents the cost of fluoride treatment. represents the annual absorption of nitrogen oxides by the evaluated forest, and represents the cost of fluoride treatment. The calculation for the value of dust retention is shown in Equation (10) [34].
In Equation (10), represents the value of the annual overdue TSP of the evaluated forest stand. represents the value of annual late payment PM10 in the assessed forest stand. represents the value of evaluating the annual overdue PM2.5 of the forest stand. The calculation of the water purification value is shown in Equation (11) [35].
In Equation (11), represents the annual water purification amount of the evaluated forest, and represents the water purification cost. In terms of carbon sequestration and oxygen release capacity, the calculation of the carbon sequestration value is shown in Equation (12) [36].
In Equation (12), is the carbon sequestration price. represents the assessment of potential annual carbon sequestration in forest ecosystems. The calculation of the oxygen release value is shown in Equation (13) [37].
In Equation (13), is used to evaluate the annual oxygen release content of the forest. is the price of oxygen. In terms of climate regulation capacity, the calculation of the climate regulation value is shown in Equation (14) [38].
In Equation (14), is the annual climate regulation potential evaluation of the forest ecosystem. represents the cost of climate adjustment. The calculation of the wind and sand fixation value in the wind and sand fixation capacity index is shown in Equation (15) [39].
In Equation (15), represents the cost of wind prevention and sand fixation. represents the evaluation of the quality of forest windbreak and sand fixation materials. In the indicators of cultural and educational functions, the calculation of the value of cultural and educational functions is shown in Equation (16) [40].
In Equation (16), represents the value of urban forest tourism, the leisure industry, and popular science education. In the indicators of sterilization and health functions, the calculation of the value of sterilization and health functions is shown in Equation (17).
In Equation (17), represents the sterilization cost. represents the annual bactericidal capacity of the evaluated forest stand.
3. Results
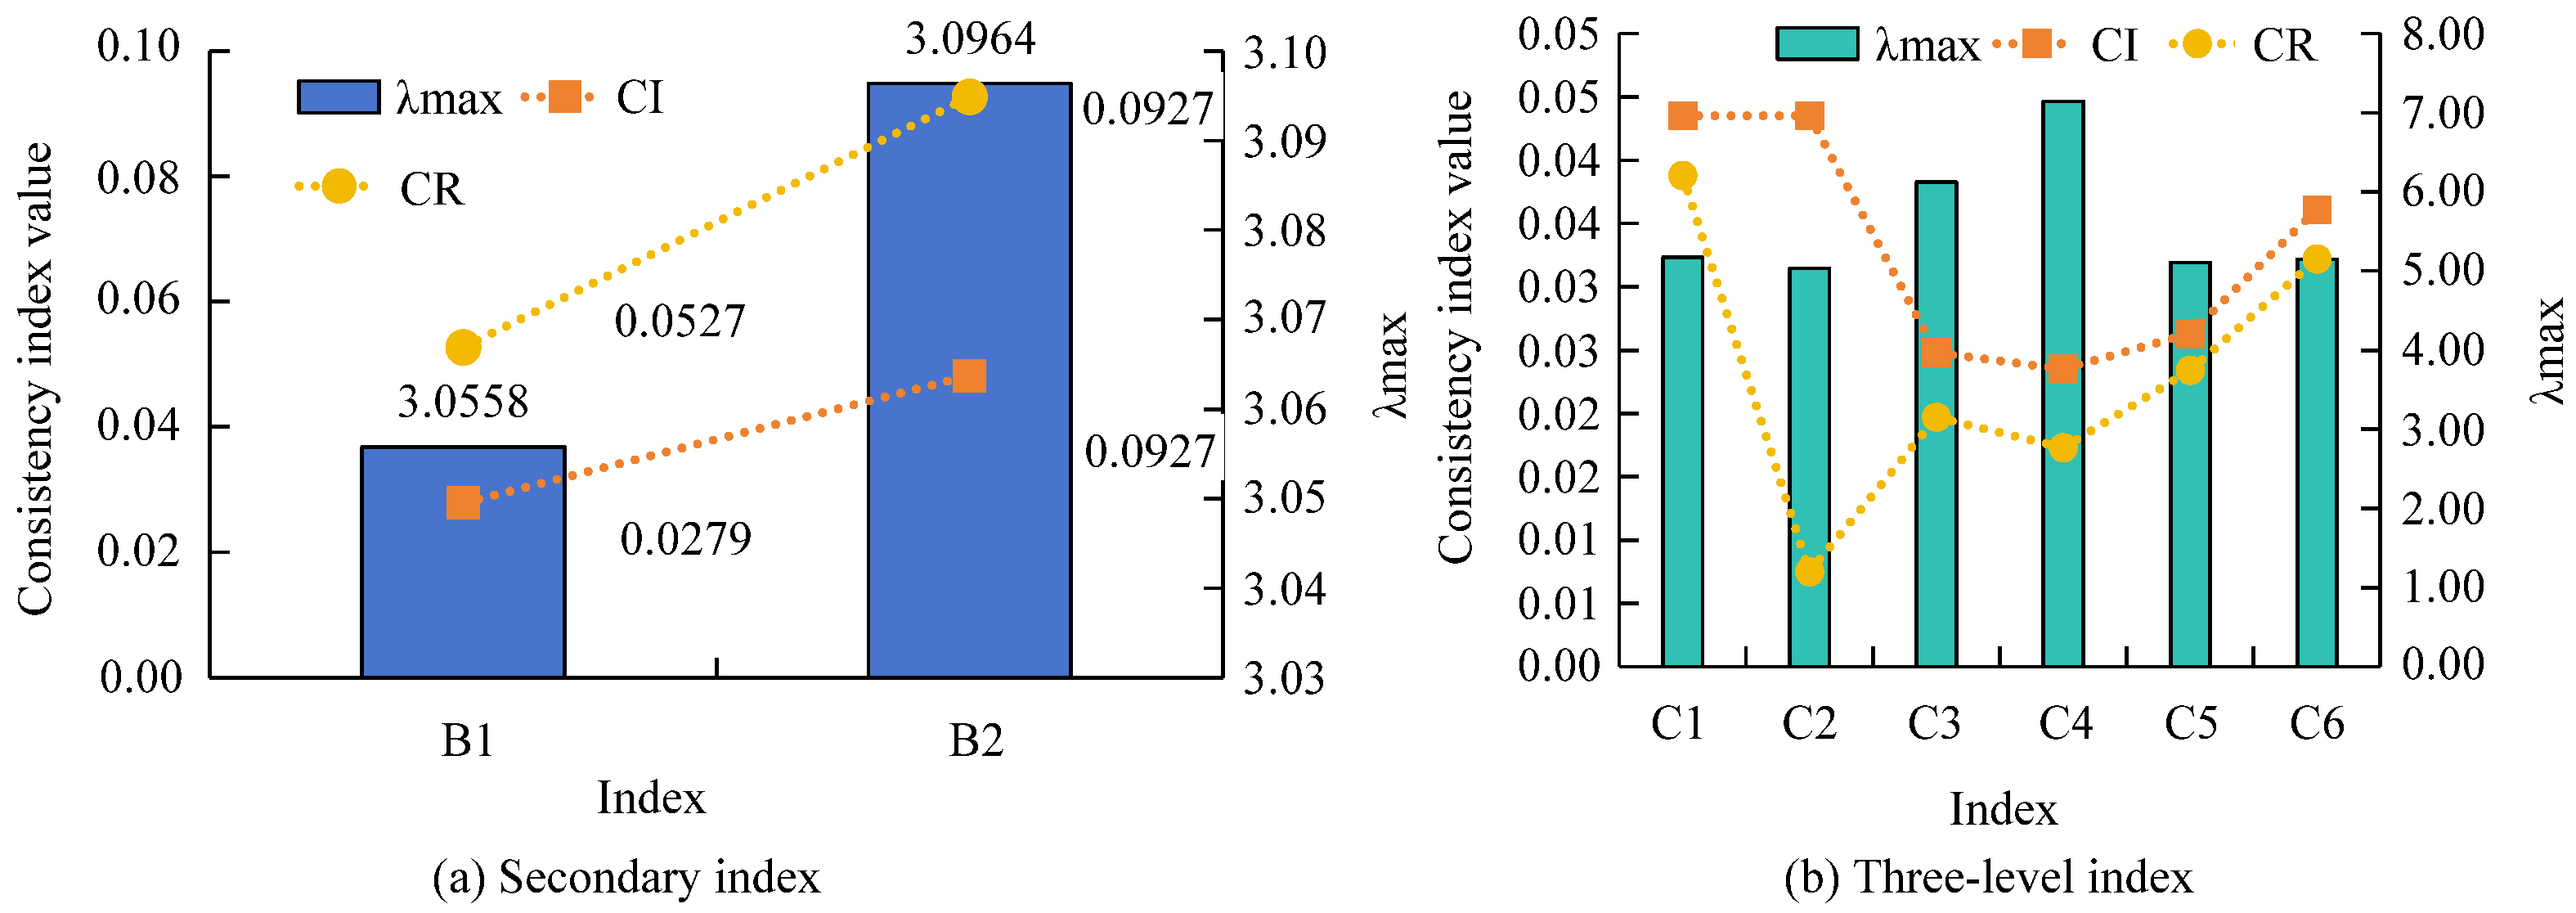
The experiment used expert evaluation and fuzzy comprehensive evaluation methods to assess the comprehensive benefits of urban forests in the study area. In total, 40 industry experts independently evaluated various evaluation indicators of urban forests in the research area. It determined each indicator as a 10-point-scale score. The results of the fuzzy comprehensive evaluation and weighted results were taken as the final basis. The study introduced consistency testing to determine the rationality of the weights. In this equation, can be obtained from Table 2. In general, when , it indicated that the matrix had passed the consistency check. Otherwise, a new comparison was required. Then, MATLAB software (R2022a version, Natick, MA, USA)was utilized to calculate and obtain the maximum eigenvalue of the judgment matrix . The values for the matrix orders 1–10 are shown in Table 2.
AHP was utilized to calculate the weights of indicators and construct a judgment matrix. Before verifying consistency, it was necessary to obtain consistency indicators. The consistency index calculation results of each indicator are shown in Figure 9.
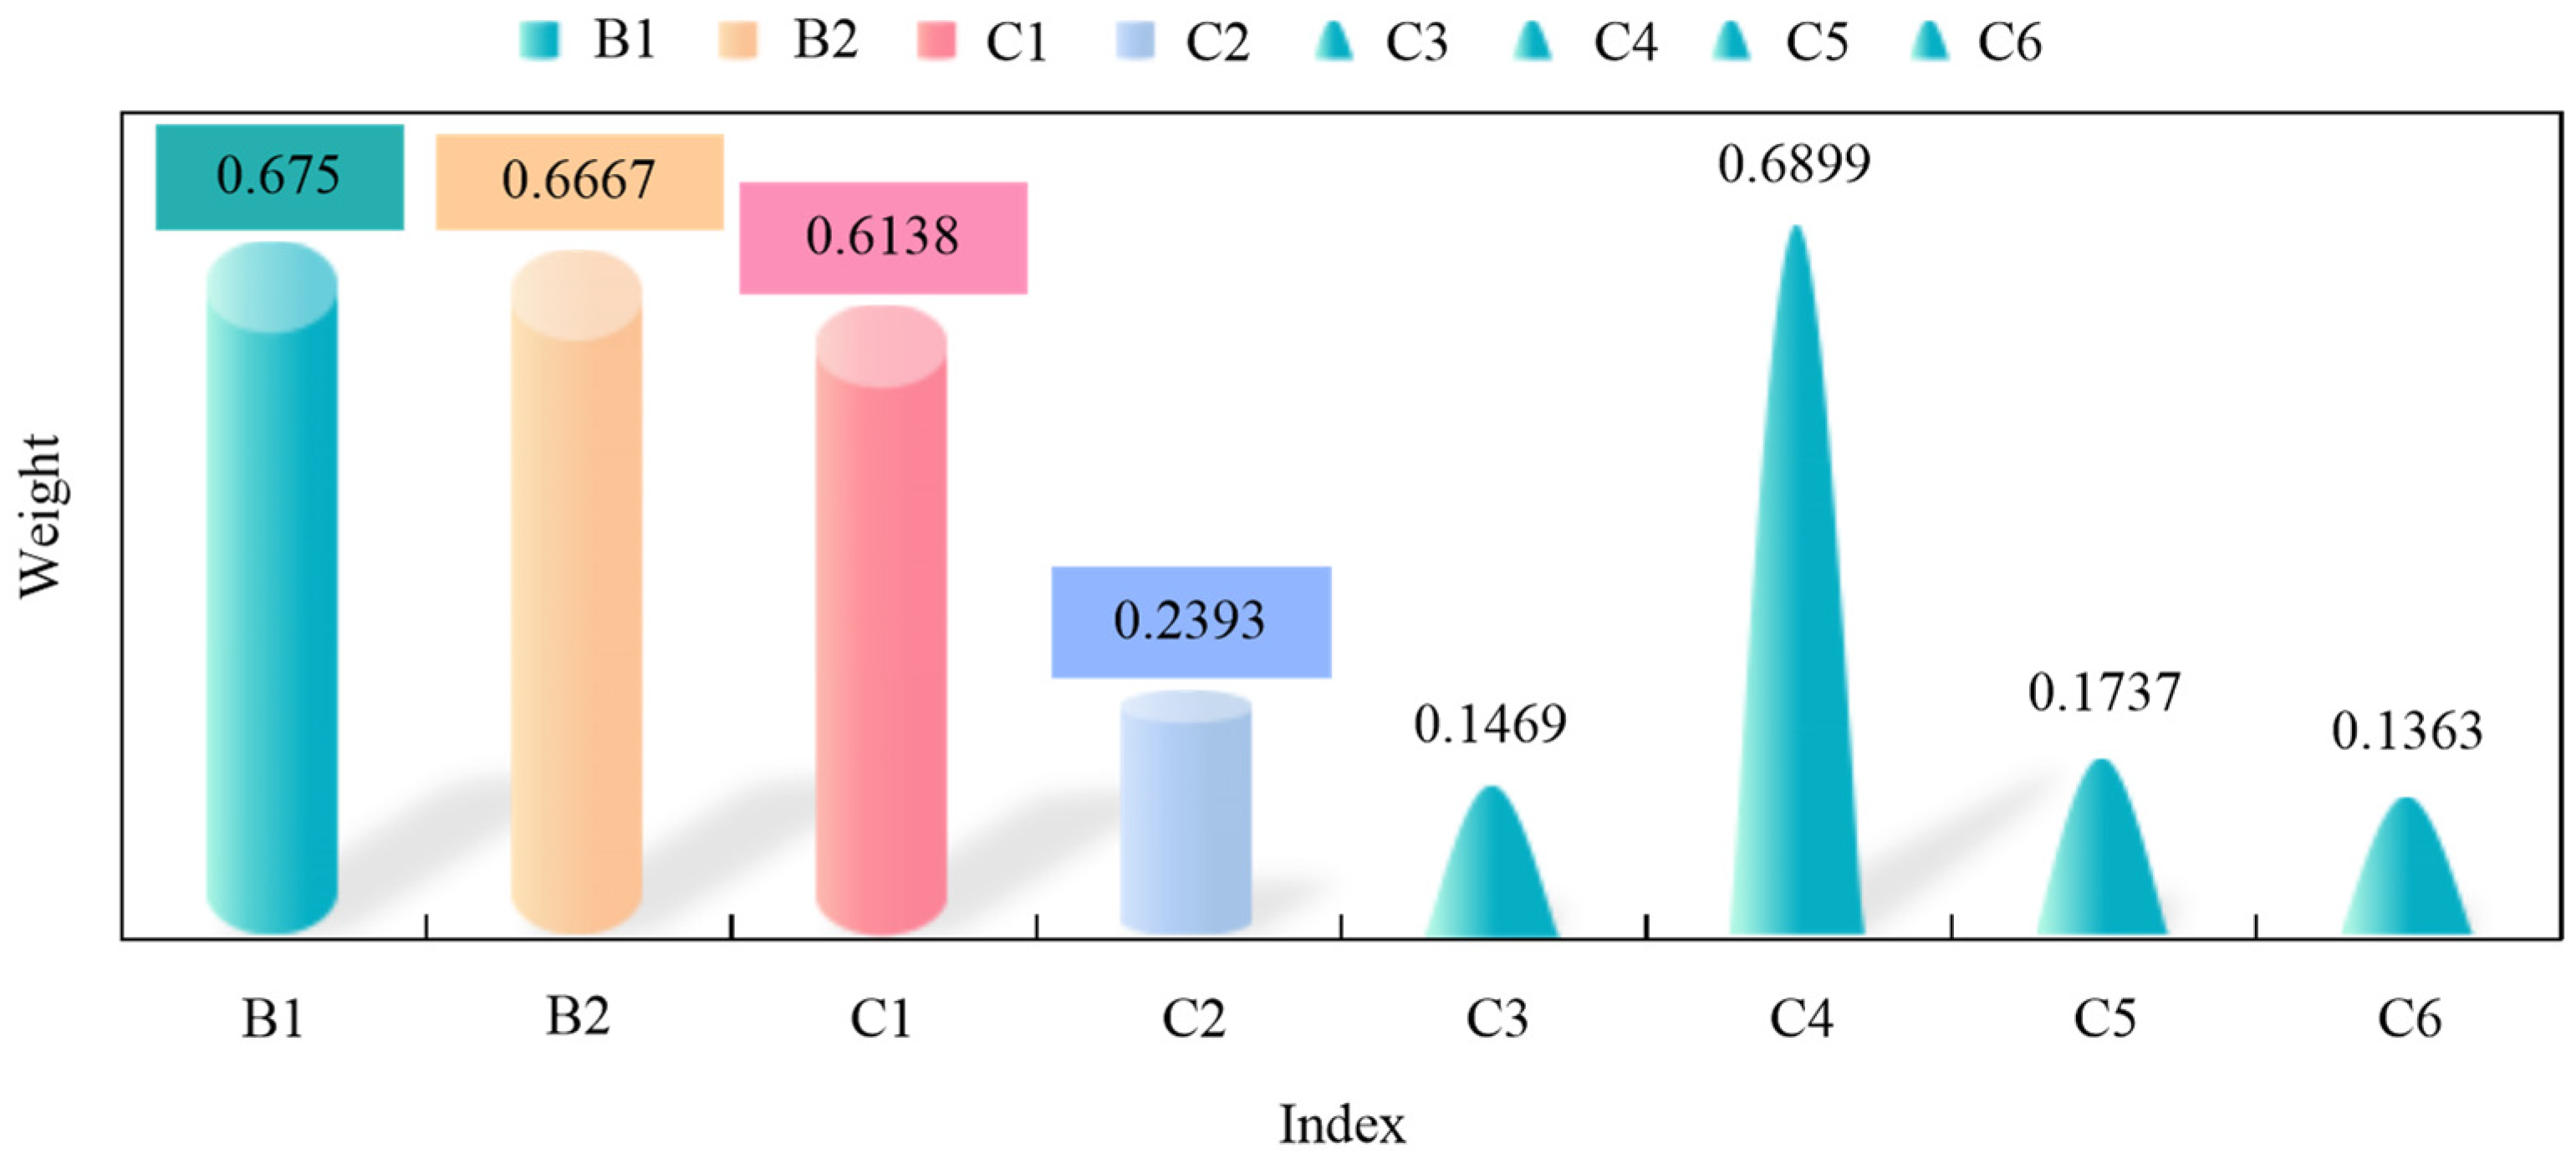
In Figure 9, the consistency index of various indicators of urban forest comprehensive benefits was less than 0.1, and the random consistency ratio in the calculation was also less than 0.1. From this, the matrix calculation results of various indicators of urban forest comprehensive benefits had a good consistency. The study obtained the weights of each level by calculating the factor level, criterion level, and indicator level. The concept of composite weights was proposed. This method involves multiplying the weights of indicators at each level to reflect the weighted relationship between indicators at each level. The weights of the factor layer and the criterion layer are shown in Figure 10.
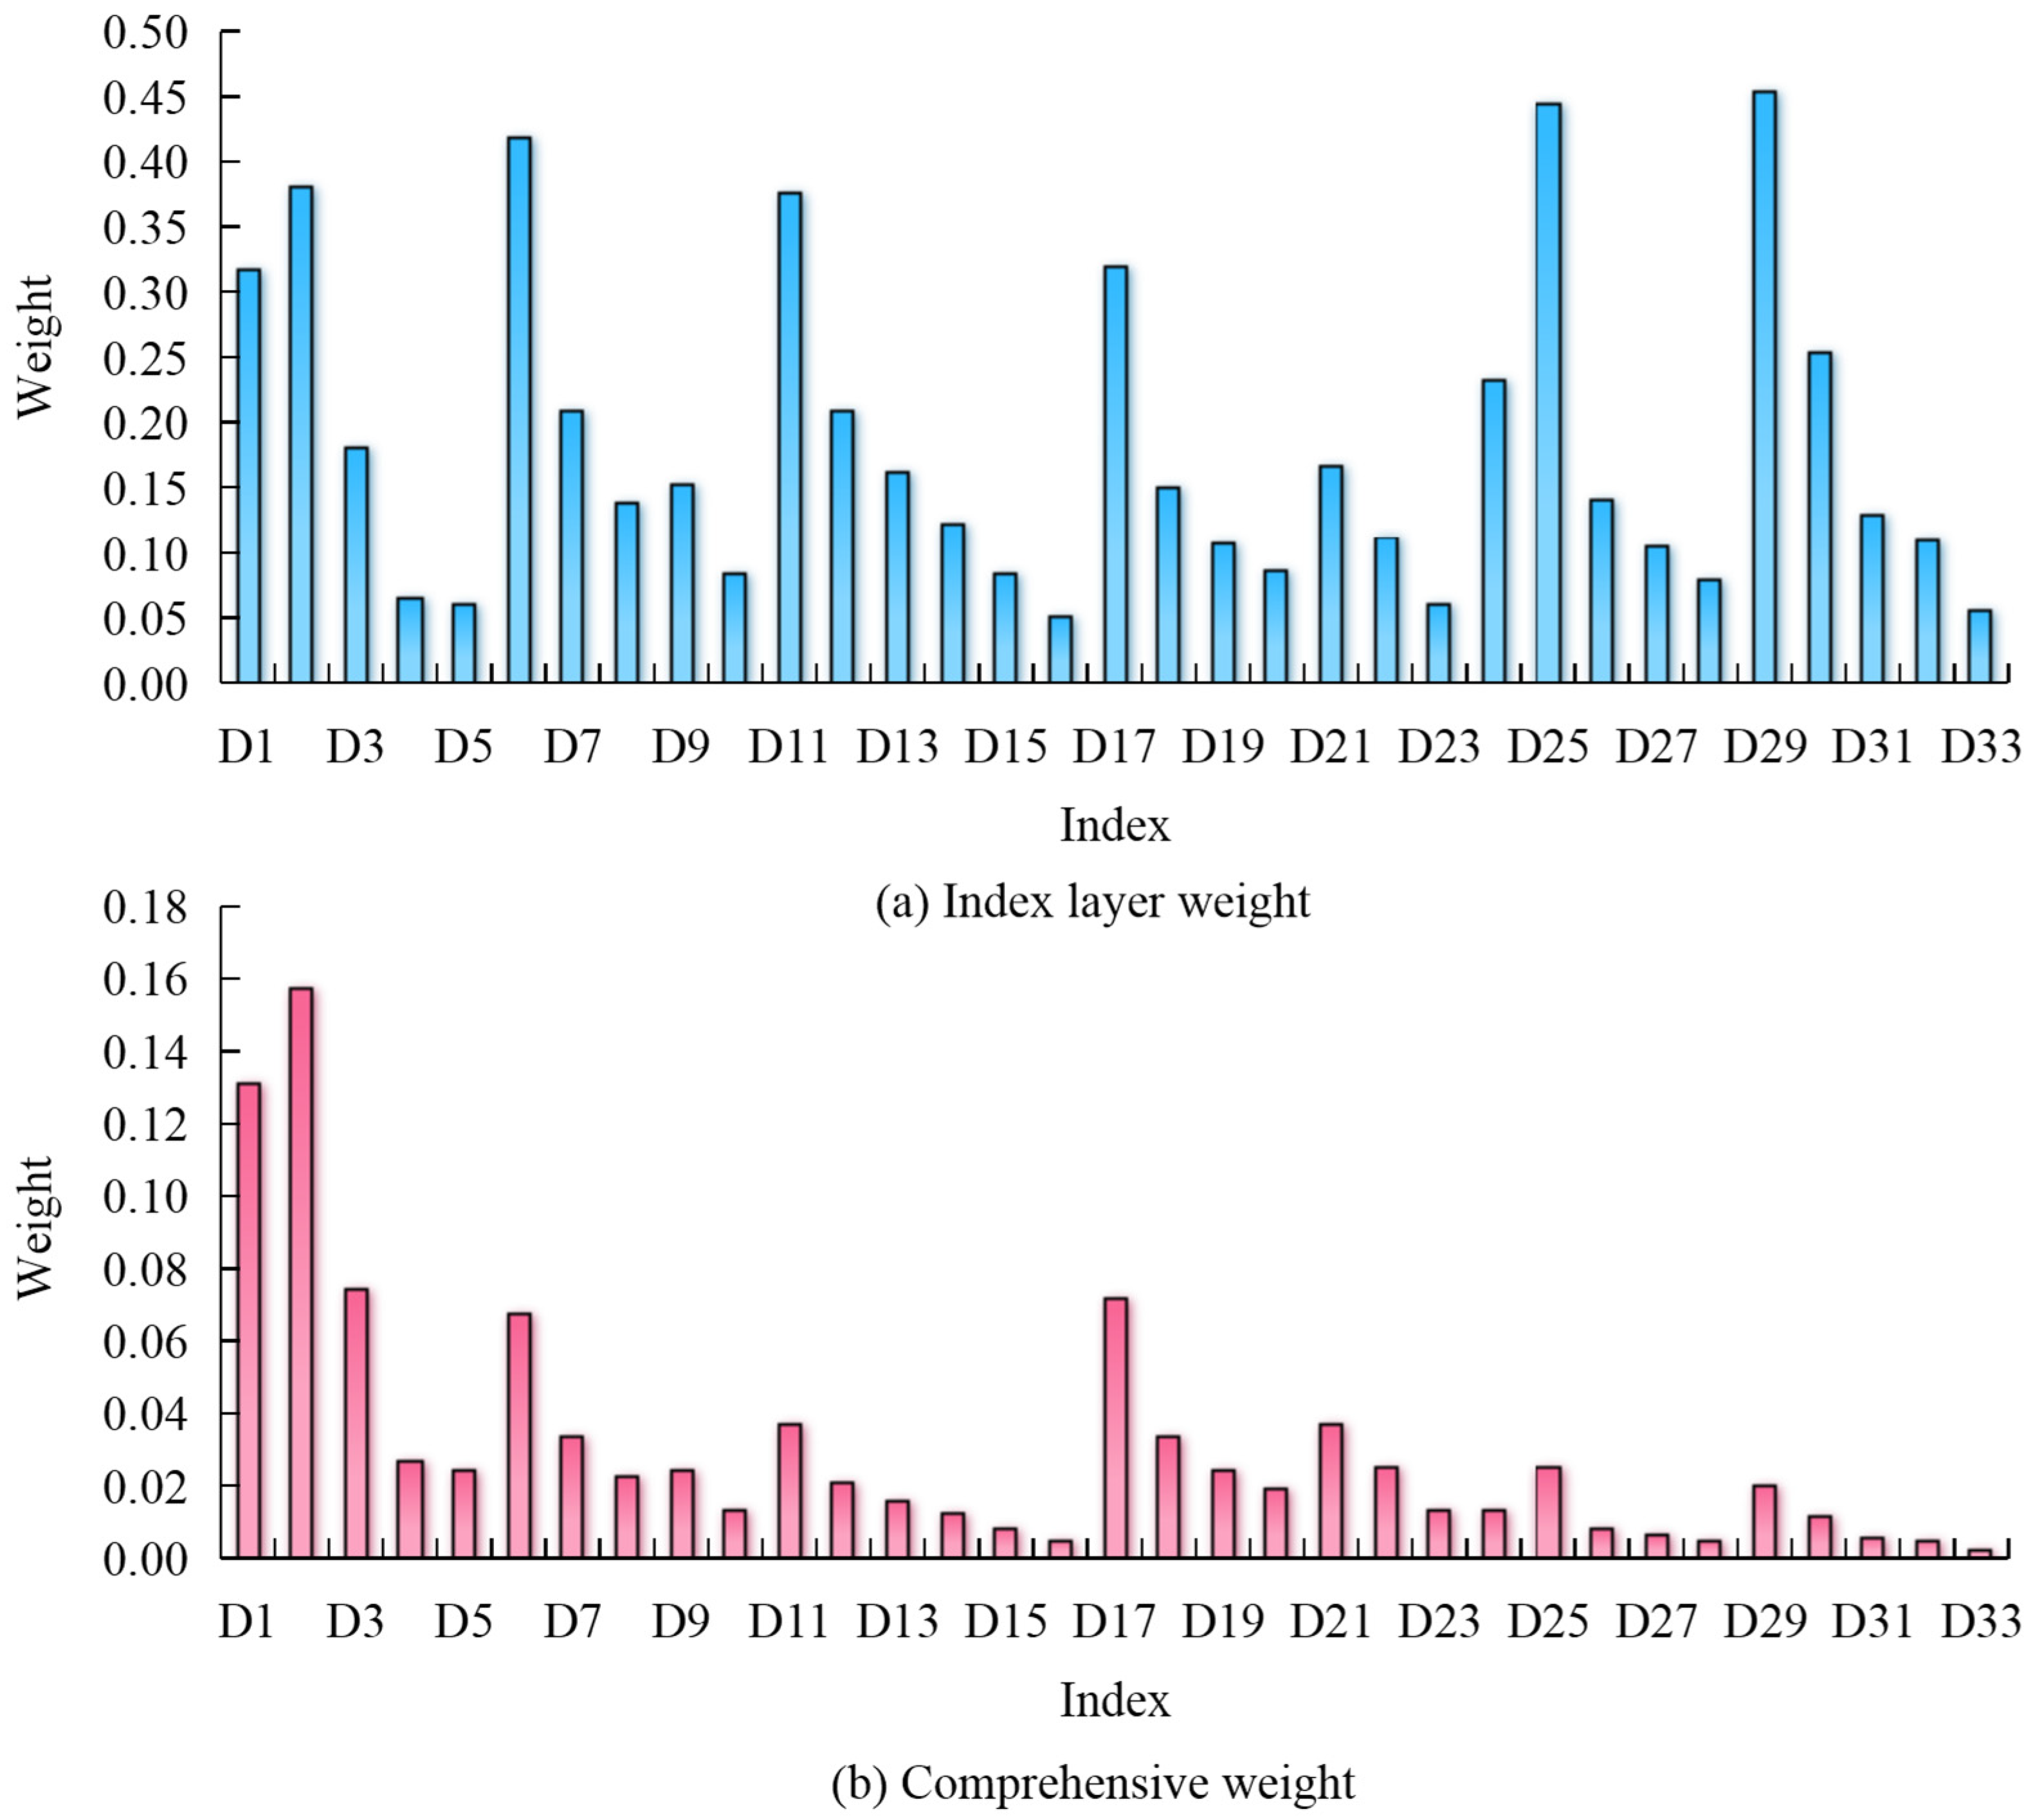
In Figure 10, in the factor layer, the weights of B1 and B2 were 0.675 and 0.6667, respectively. In the criterion layer, the urban forest ecological efficiency index had the highest proportion of weight, with a weight value of 0.6899. The urban forest social benefit indicator with the smallest weight proportion had a weight value of 0.1363. The weights and comprehensive weights of the indicator layer are shown in Figure 11.
As shown in Figure 11, among the quantitative indicators of urban forest greening, the forest coverage index had the highest weight value, with a weight value of 0.3796. The new afforestation area index had the lowest weight value. This indicated that the urban green coverage rate in the study area was relatively high, but the forest coverage rate needed to be improved. In the indicators of the urban forest landscape pattern, the indicators with the highest and lowest weight values were landscape diversity indicators and landscape aggregation indicators, respectively. This indicated that the forest landscape had a high degree of fragmentation, and the distribution of forest landscapes in various types of cities was uneven. Among the urban forest structure characteristic indicators, the proportion of local tree species accounted for the highest weight value, with a weight value of 0.3748, while the forest age level structure indicator accounted for the lowest weight value. This indicated that the richness of forest tree species in the city was insufficient, and the vegetation structure was relatively single. It was necessary to improve the age structure of urban forests. Among the ecological benefits indicators of urban forests, the water conservation capacity indicator had the highest weight value, while the wind prevention and sand fixation capacity indicator had the lowest weight ratio of 0.0595. The overall ecological benefits of the forest in this area were good, but its role in wind prevention and sand fixation has not been fully utilized. Among the economic benefits indicators of urban forests, the forestry product value indicator had the highest weight value, while the water resource value indicator had the lowest weight value. This indicated the low level of forestry economic development, backward industrial development, and weak market competitiveness in the research area. Among the social benefits indicators of urban forests, the leisure and recreational function indicator had the highest weight value, with a weight value of 0.4531. The lowest weight value was the disease and pest control function index, which was 0.0557. The results showed that leisure and recreational functions had an advantage in urban forests, but the disease and pest control functions were insufficient, and the ecological isolation system was lacking. As shown in Figure 12, the results of fuzzy comprehensive evaluation were summarized into the weight results of each indicator.
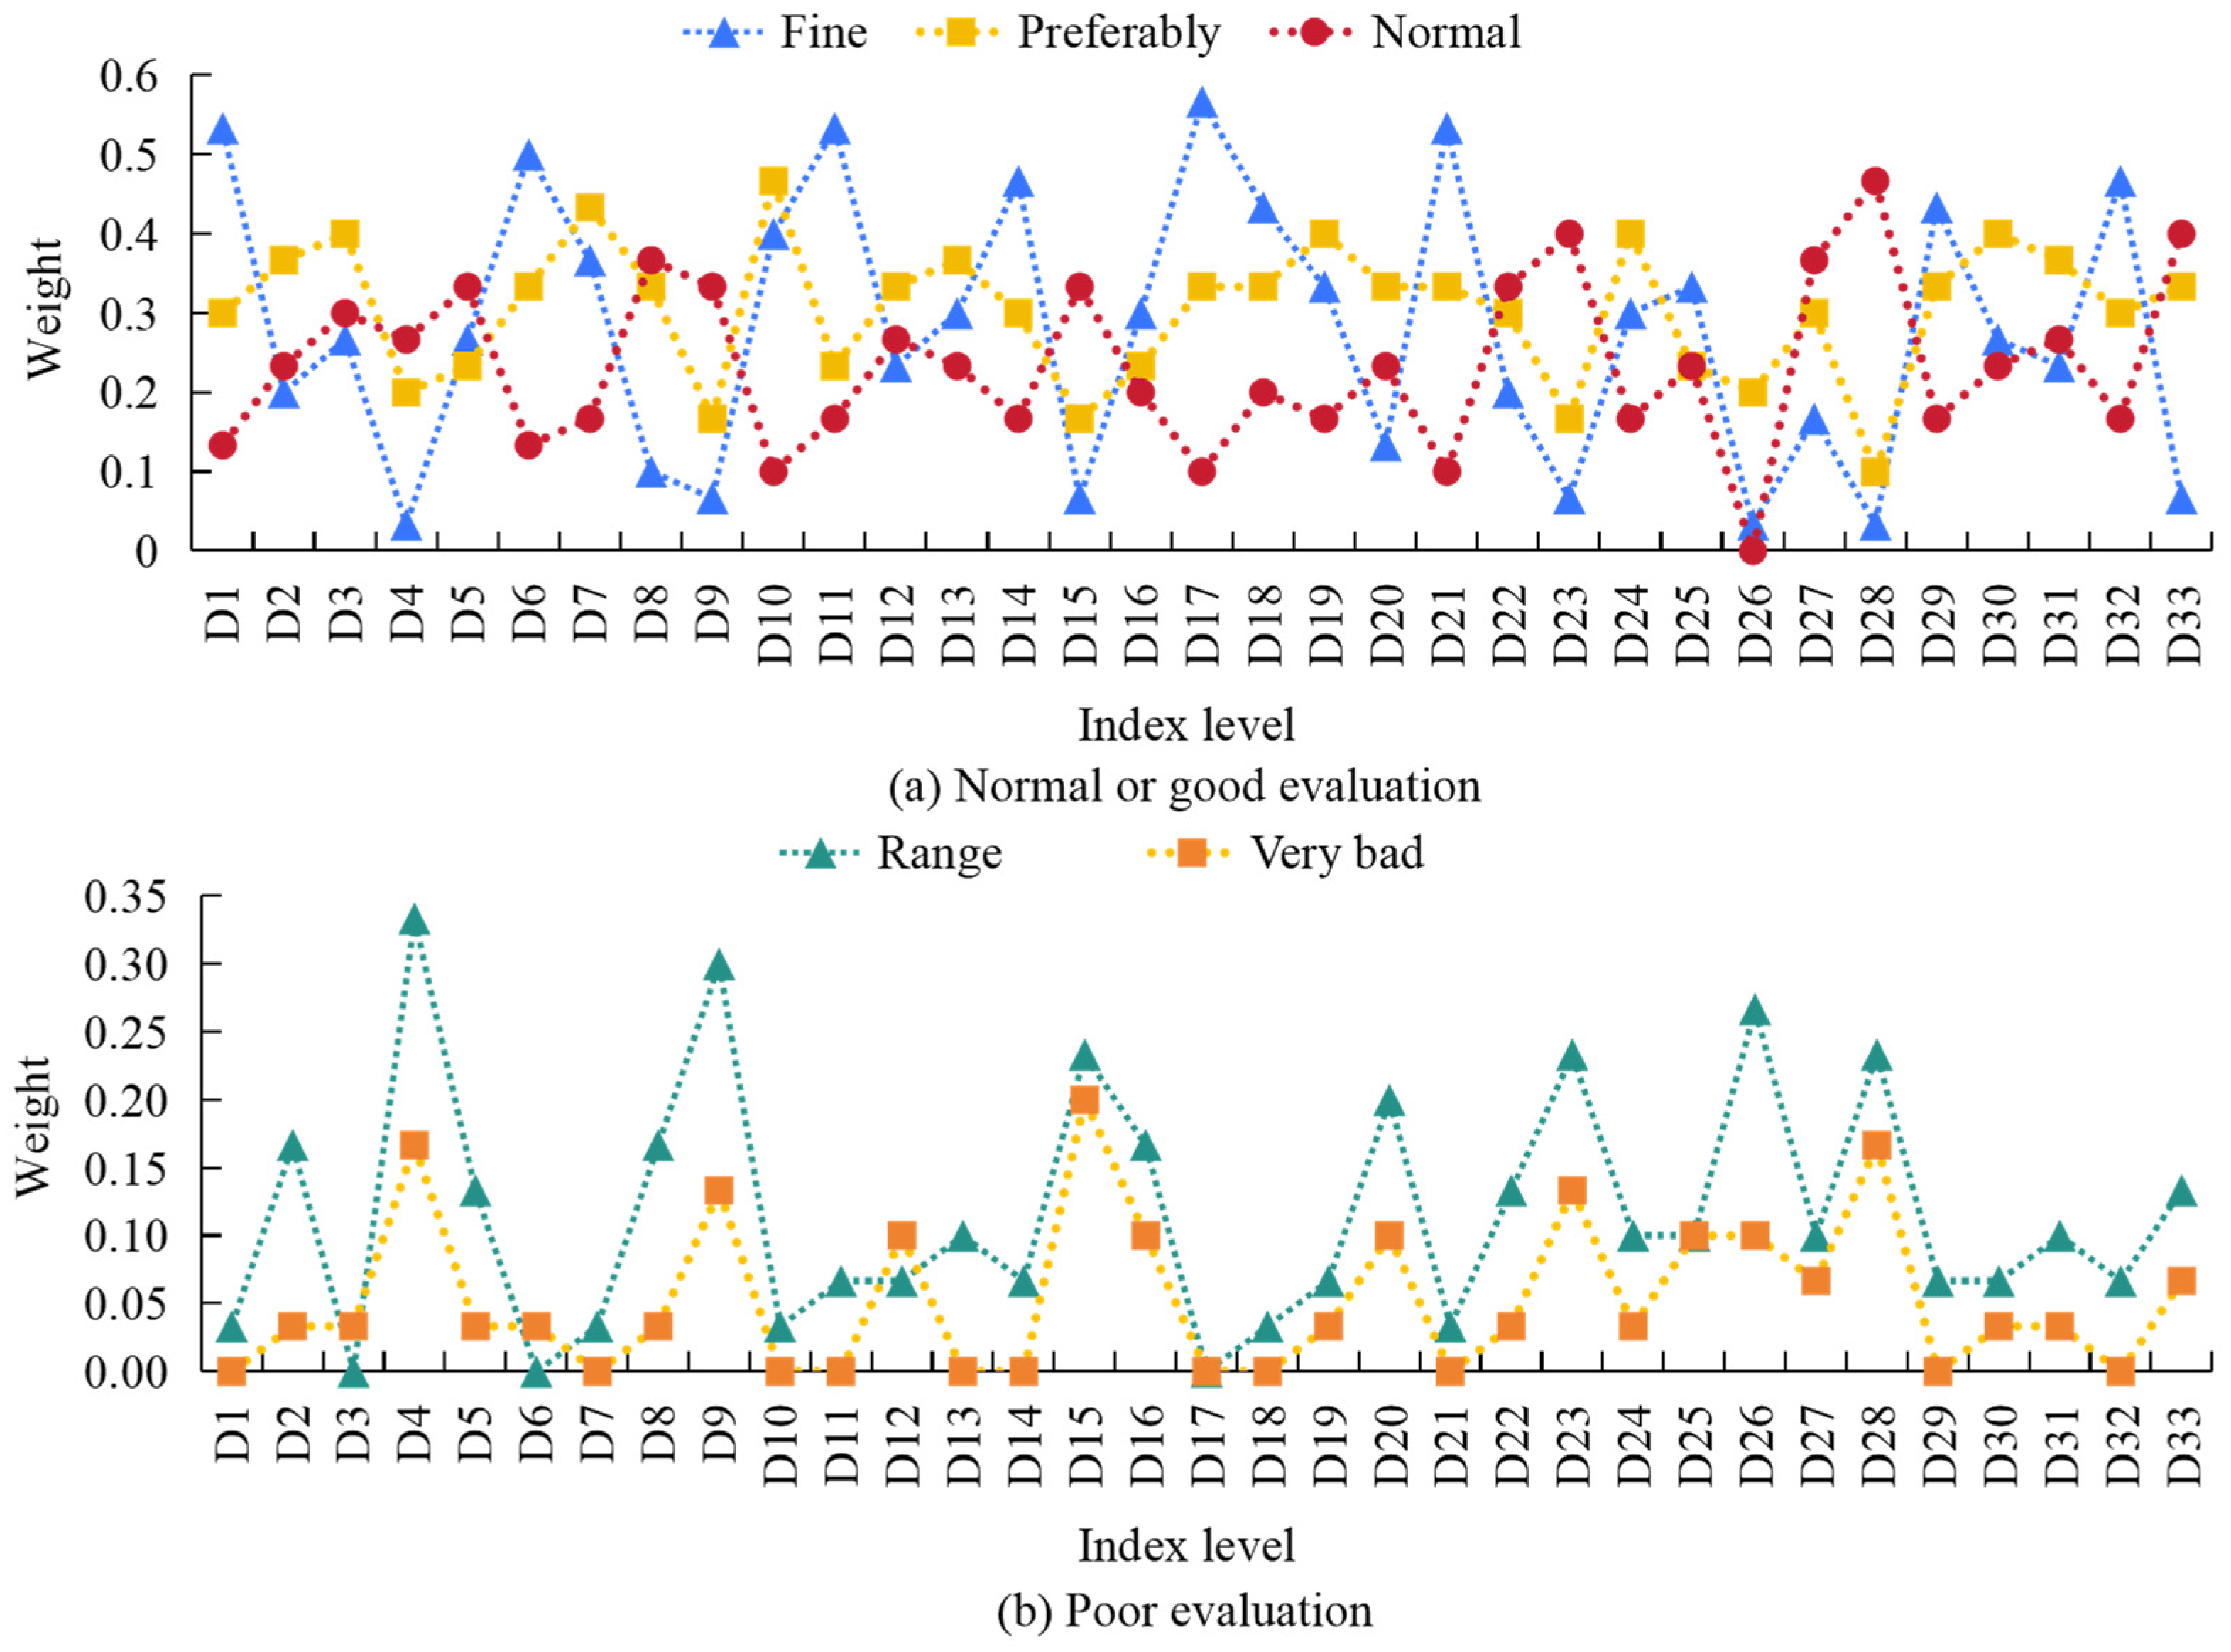
From Figure 12, the proportion of respondents who evaluated urban forests in the study area as good and poor was 34.19% and 3.44%, respectively. The proportion of respondents who evaluated the urban forest landscape structure as good and poor was 32.78% and 3.47%, respectively. The proportion of respondents who evaluated the comprehensive benefits of urban forests, quantitative urban forest greening, and urban forest landscape pattern in the study area as good was 37.12%, 31.09%, and 34.25%, respectively. The proportion of respondents who evaluated the structural characteristics of urban forests in the study area as good and poor was 37.44% and 4.25%, respectively. The proportion of respondents who evaluated the ecological benefits of urban forests in the study area as good and poor was 40.80% and 2.39%, respectively. The proportion of respondents who evaluated the economic benefits and social benefits of urban forests in the study area as good was 24.26% and 34.87%, respectively. In summary, the evaluation of the urban forest ecological benefits had the highest proportion of respondents who gave good evaluations, followed by the evaluation of the urban forest structural characteristics. This indicated that the ecological environment and structure of the region were relatively complete and have achieved good ecological benefits. The study adopted a 10-point scoring model, with five levels given 10, 8, 6, 4, and 2 points, respectively. The above fuzzy comprehensive evaluation results were weighted to obtain the comprehensive evaluation results of each indicator, as shown in Figure 13.
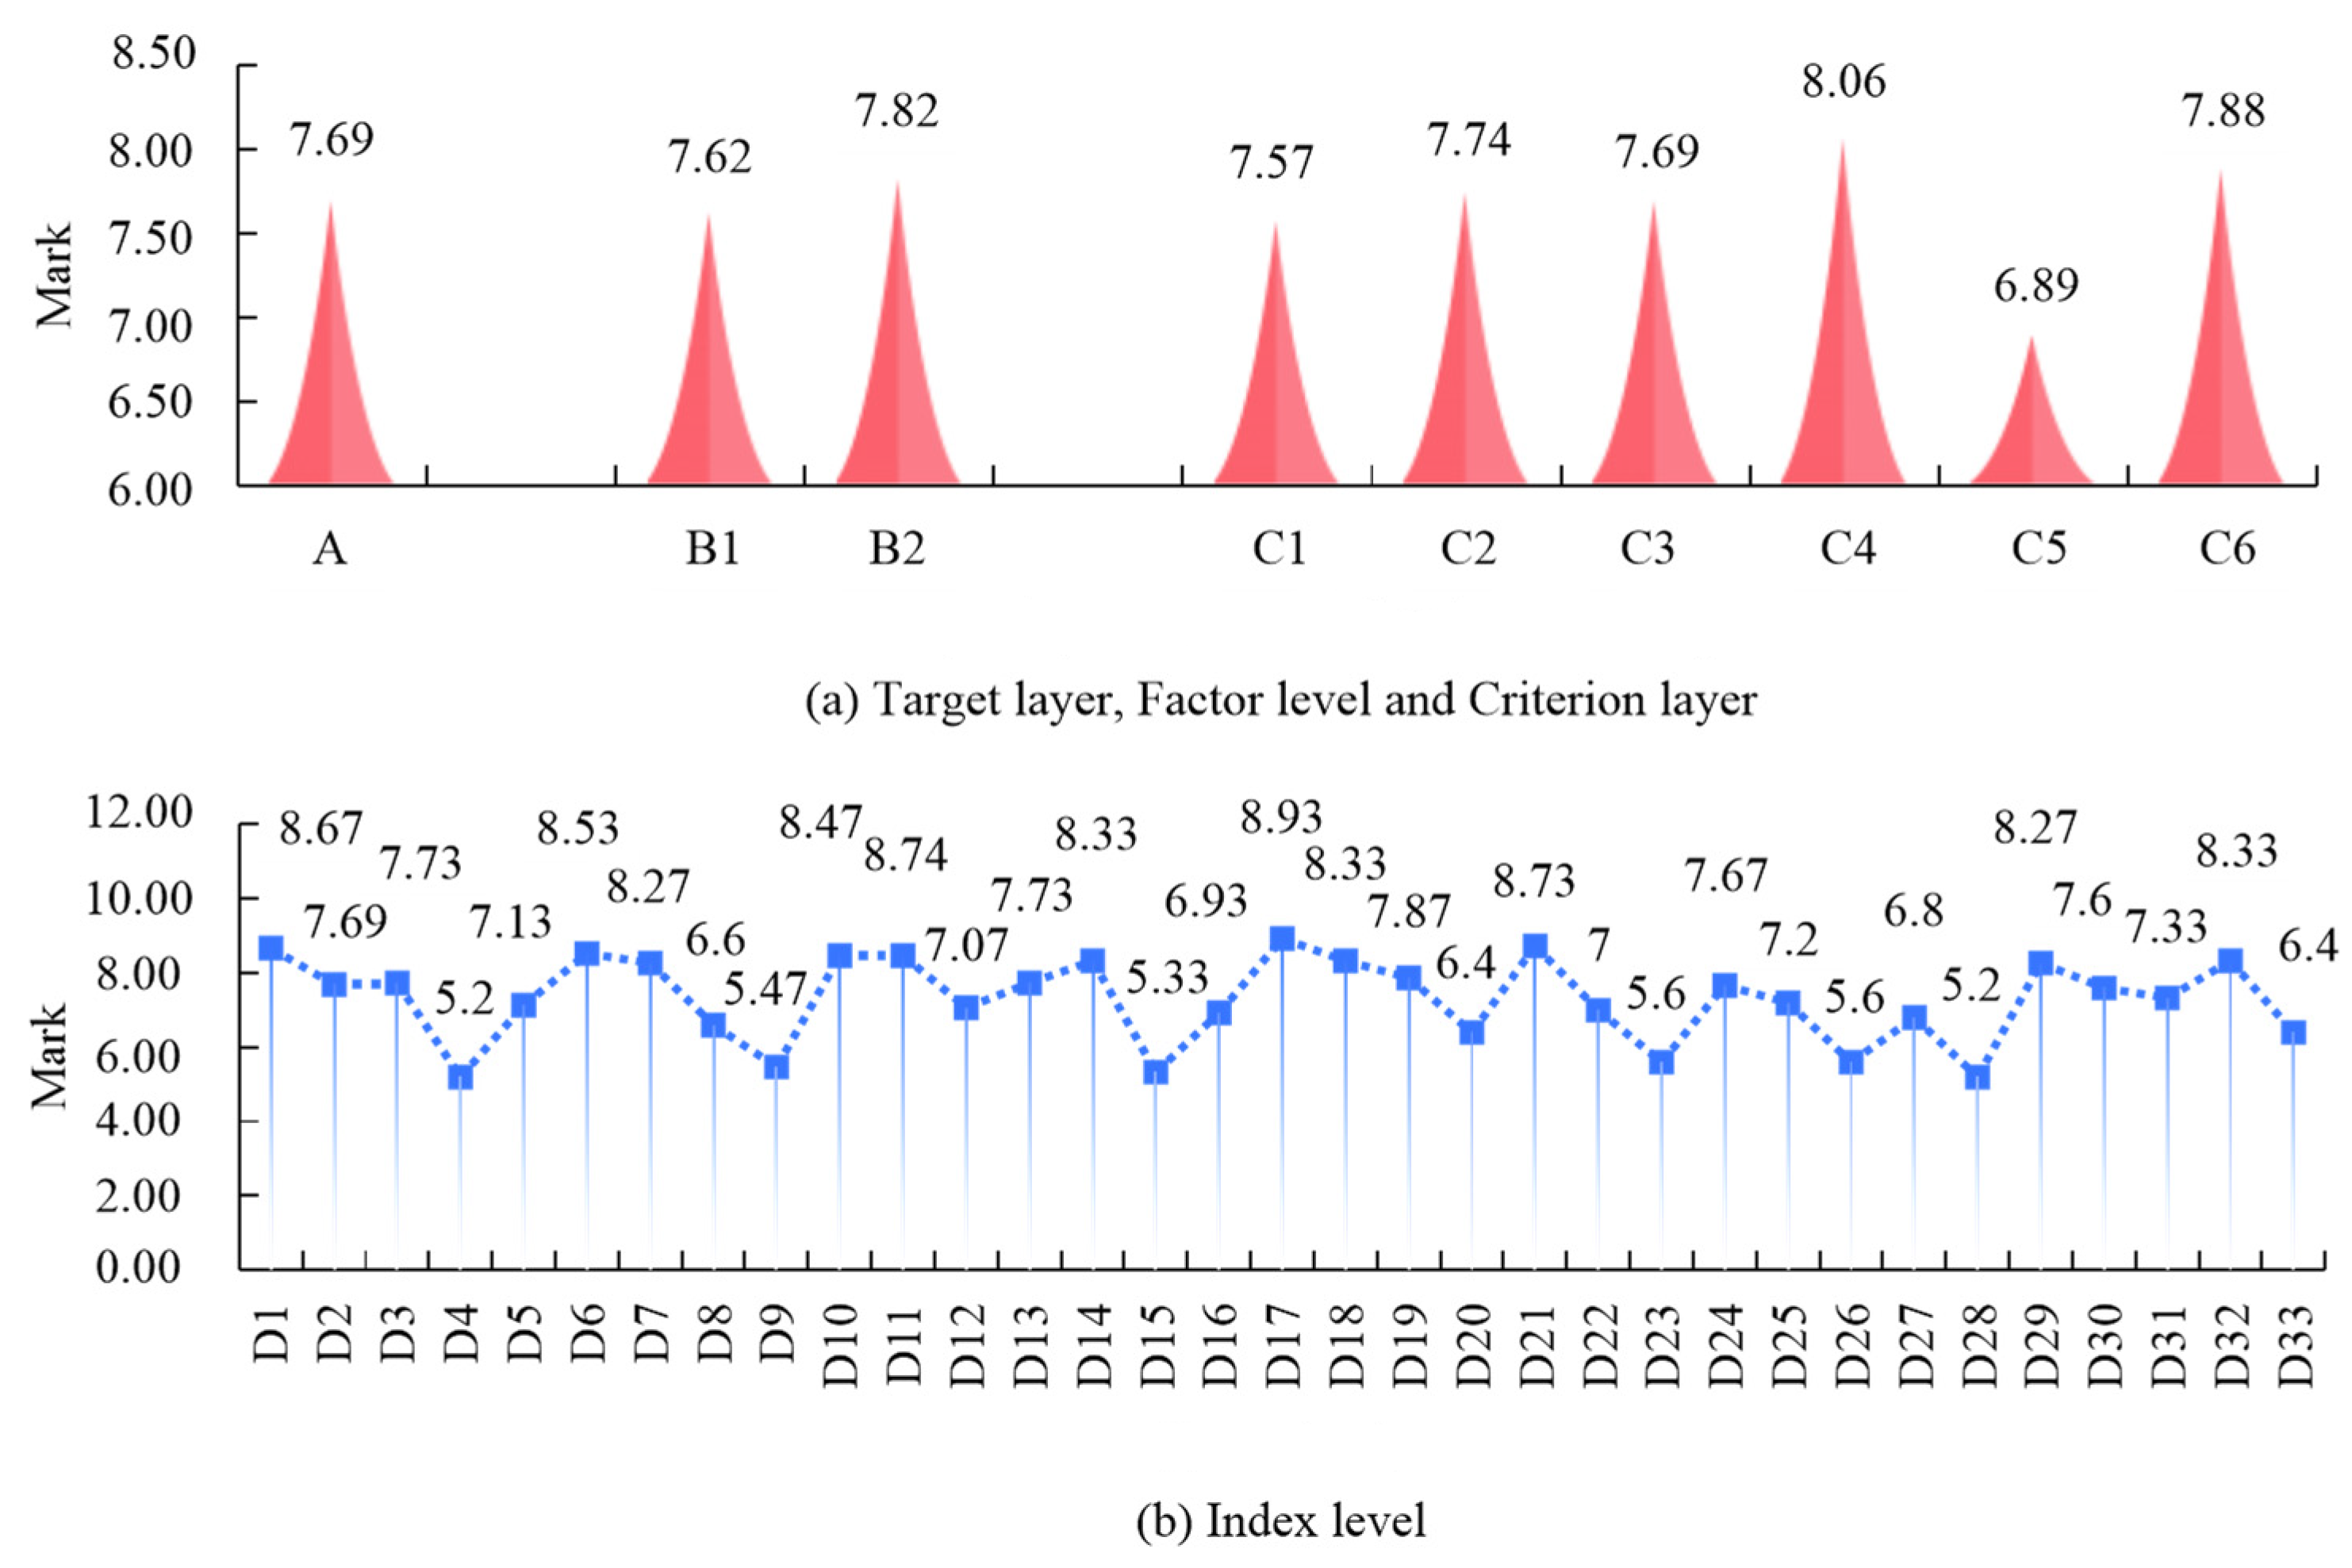
As shown in Figure 13, the comprehensive score of C1 was 7.57. This indicated that the area still maintained a high green coverage rate, but it still needed to be improved. The index of ancient and famous trees was severely lacking, and there was a certain gap in the quantity and quality of new afforestation. The comprehensive score of C2 was 7.74. This indicated that urban forest landscapes had a high fragmentation and strong human disturbance, a lack of small and medium-sized patches, and an unevenness of different types of forest landscapes. The comprehensive score of C3 was 7.69. This indicated that there were relatively few plant species in the region, and the plant species were relatively single. The comprehensive score of C4 was 8.06, with a comprehensive score of 8.93 for D17 and 8.33 for D18. The comprehensive score of D19 was 7.87, while the comprehensive score of D20 was 6.40. The comprehensive score of D21 was 8.73, and the comprehensive score of D22 was 7.00. The comprehensive score of D26 was 5.60. The results indicated that the overall ecological benefits of the region were good, mainly manifested in maintaining water sources, fixing carbon, and releasing oxygen. Due to its regulatory effect on climate being far from the average of its ecological benefits indicators, it was unable to effectively play its role in wind prevention and sand fixation. The comprehensive score of C5 was 6.89. Among them, the comprehensive score of D24 was 7.67, and the comprehensive score of D25 was 7.20. The comprehensive score of D26 was 5.60, and the comprehensive score of D27 was 6.80. The comprehensive score of D28 was 5.20. This indicated that the urban forest economy was generally relatively backward, with relatively backward industrial development and weak product competitiveness. Especially for livestock and fishery products, they still remained at the low end of the market. Water resources have been greatly polluted. The comprehensive score of C6 was 7.88. Among them, the comprehensive score of D29 was 8.27, and the comprehensive score of D30 was 7.60. The comprehensive score of D31 was 7.33, and the comprehensive score of D32 was 8.33. The comprehensive score of D33 was 6.40. This indicated that leisure tourism occupied a dominant position in urban forests.
4. Discussion
On the criterion level, the weight value of C1 was 0.6138 and the comprehensive score was 7.57. The main performance is that the urban green coverage rate is high, but the forest coverage rate and the index of old and famous trees are low, and the total amount and quality of new afforestation are insufficient. The weight value of C2 was 0.2393 and the comprehensive score was 7.74. The main characteristics are high landscape fragmentation, a high level of human activities, few patches in medium and large scale, and an uneven spatial distribution of various urban forest lands. The weight value of C3 was 0.1469 and the comprehensive score was 7.69. The results showed that there were less species of plants under the forest, less species of plants under the forest, and a poor combination of forest–net–net under the forest. The weight value of C4 was 0.6889, and the comprehensive score was 8.06. Among them, the ability of soil and water conservation and carbon sequestration and release is good, but the ability of climate regulation is far less than the ecological benefit index, and the function of desertification prevention and control has not been effectively enacted. The weight value of C5 was 0.1737, and the comprehensive score was 6.89. Among them, the added value of animal husbandry and fishery products was still very low, and the pollution of water resources was also relatively serious. The weight value of C6 was 0.1363, and the comprehensive score was 7.88. Among the three types, the recreation function was dominant, and the cultural education and flood control and storage function were strong, while the health preservation value with disinfection and health as the main effect was higher, and the disease and pest prevention and control ability was poor. Firstly, the overall forest quality in urban areas should be improved, and the overall forest area and forest coverage rate should be increased. Scientific planning and improvement of the urban forest landscape should be used to carry out analyses of plant community structure, increase native tree species, create characteristic plant landscape, improve biodiversity, and achieve urban forest ecosystem benefits. At the same time, the ecological benefits of urban forests should be enhanced, ecological weaknesses should be fully replenished, the integration of agriculture and tourism should be promoted, modern agriculture should be developed, and ecological bottom line protection should be enhanced. In addition, there is a need to enhance the social benefits of urban forests, create high-quality natural landscapes, tap local history and culture, and develop advantageous tourism products to enhance the overall social benefits. Through these measures, we can better promote the sustainable use of urban forests and realize the coordinated development of ecology, economy, and society.
5. Conclusions
The study shows that at the target level, the score of the study area A1 was 7.69. On the factor level, the weight value of B1 was 0.675, and the comprehensive score was 7.62. The weight value of B2 was 0.325, and the comprehensive score was 7.82. On the criterion level, the weight value of C1 was 0.6138 and the comprehensive score was 7.57. The weight value of C2 was 0.2393 and the comprehensive score was 7.74. The weight value of C3 was 0.1469 and the comprehensive score was 7.69. The weight value of C4 was 0.6889, and the comprehensive score was 8.06. The weight value of C5 was 0.1737, and the comprehensive score was 6.89. Among them, the added value of animal husbandry and fishery products was still very low, and the pollution of water resources was also relatively serious. The weight value of C6 was 0.1363 and the comprehensive score was 7.88. Studies may be limited to specific time periods and locations, and they may not fully reflect the long-term impacts and trends of urban forests. Secondly, the study may ignore the impact of local socioeconomic factors and cultural characteristics on urban forests, and they may lack a comprehensive perspective. In addition, there may be limitations in observation methods and assessment indicators in their ability to fully and accurately reveal the ecological, social, and economic impacts of urban forests. In view of the above, future work in the field of urban forests requires interdisciplinary cooperation, improved assessment methods, enhanced data monitoring, and enhanced science popularization.
Author Contributions
In this paper, The Application of Geographic Information System in Urban Forest Ecological Compensation and Sustainable Development Evaluation, L.A. proposed issues such as the shortage of funds for urban forest construction, insufficient total urban greening, and imbalanced development. G.L. analyzed the data, and M.H. helped with the constructive discussion. L.A., G.L. and M.H. made great contributions to manuscript preparation. All authors have read and agreed to the published version of the manuscript.
Funding
This research received no external funding.
Data Availability Statement
All data generated or analyzed during this study are included in this published article.
Conflicts of Interest
The authors declare no conflicts of interests.
References
- Han, X.; Zhang, C.; Tang, Y.; Ye, Y. Physical–data fusion modeling method for energy consumption analysis of smart building. J. Mod. Power Syst. Clean Energy 2022, 10, 482–491. [Google Scholar] [CrossRef]
- Ramon, M.; Ribeiro, A.P.; Theophilo, C.Y.S.; Moreira, E.G.; Camargo, P.B.; Bragança, C.A.; Ferreira, M.L. Assessment of four urban forest as environmental indicator of air quality: A study in a brazilian megacity. Urban Ecosyst. 2023, 26, 197–207. [Google Scholar] [CrossRef]
- Akinbobola, A.; Fafure, T. Assessing the impact of urbanization on outdoor thermal comfort in selected local government areas in ogun state nigerian. J. Environ. Sci. Technol. 2021, 5, 120–139. [Google Scholar]
- Ismail, N.; Ouahrani, D. Modelling of cooling radiant cubicle for an office room to test cooling performance thermal comfort and energy savings in hot climates. Energy 2022, 244, 120–139. [Google Scholar] [CrossRef]
- Chukwuka, A.F.; Alo, A.; Aigbokhan, O.J. Remote sensing and GIS forest landscape assessment for sustainable forest management. J. Agric. For. Soc. Sci. 2021, 17, 12–26. [Google Scholar] [CrossRef]
- Lacerda, L.I.D.A.; José, A.R.; Santos, C.A.G.; Silva, R.M.D.; Silva, A.M.; Nascimento, T.V.M.D. Urban forest loss using a GIS–based approach and instruments for integrated urban planning: A case study of João Pessoa, Brazil. J. Geogr. Sci. 2021, 31, 1529–1553. [Google Scholar] [CrossRef]
- Yang, L.; Yan, W. Urban ecological forestry analysis based on FPGA and dynamic image sampling. Microprocess. Microsyst. 2021, 81, 103675. [Google Scholar] [CrossRef]
- Sun, Y.; Li, H. Data mining for evaluating the ecological compensation, static and dynamic benefits of returning farmland to forest. Environ. Res. 2021, 21, 111524. [Google Scholar] [CrossRef]
- Enzai, D.U.; Xia, N.; Guo, Y.; Tian, Y.; Binghe, L.I.; Liu, X. Ecological effects of nitrogen deposition on urban forests: An overview. Front. Agr. Sci. Eng. 2022, 9, 445–456. [Google Scholar]
- Maurício, L.F.; Barbosa, M.F.; Gomes, E.P.C.; Nascimento, A.P.B.D.; Luca, E.F.D.; Silva, K.G.D. Ecological implications of twentieth century reforestation programs for the urban forests of So Paulo Brazil: A study based on litterfall and nutrient cycling. Ecol. Process 2021, 10, 27. [Google Scholar]
- Kadam, P.; Dwivedi, P. Developing a Certification System for Urban Forests in the United States. Urban For. Urban Green. 2021, 62, 127178. [Google Scholar] [CrossRef]
- Trindade, D.; Sartori, R.; Botelho–Silva, M.; Bicalho, L.; Bovini, M.G. Environmental Compensation Used as a Legal Mechanism for the Recovery of an Urban Forest in the State of Rio de Janeiro. Biodiversidade Bras.–BioBrasil 2020, 10, 4–16. [Google Scholar] [CrossRef]
- Xiao, L.I.; Zhao, L.; Liu, Y.; Liu, Y.; Jiang, Z.; Cai, L. Eco–efficiency measurement and spatial–temporal characteristics analysis of county–scale in Shandong Province. World Reg. Stud. 2022, 31, 120–129. [Google Scholar]
- Yan, T.; Zhao, W.; Yu, X.; Li, H.; Yue, J. Evaluating heavy metal pollution and potential risk of soil around a coal mining region of Tai’an City, China. AEJ—Alex. Eng. J. 2022, 61, 2156–2165. [Google Scholar] [CrossRef]
- Santiago, J.L.; Rivas, E. Advances on the Influence of Vegetation and Forest on Urban Air Quality and Thermal Comfort. Forests 2021, 12, 1133. [Google Scholar] [CrossRef]
- Nuo, X.U.; Deng, F.; Liu, B.; Caixia, L.I.; Hancong, F.U.; Yang, H. Changes in the Urban Surface Thermal Environment of a Chinese Coastal City Revealed by Downscaling MODIS LST with Random Forest Algorithm. J. Meteorol. Engl. 2021, 35, 759–774. [Google Scholar]
- Liu, P.F.; Zhang, J.; Zhao, R.R.; Zhou, Q.Q.; Sun, B.M. Fluoxetine combination with metformin enhances neuroprotection in PC12 cell injury model. J. Biol. Regul. Homeost. Agents 2023, 37, 2085–2093. [Google Scholar]
- Benaissi, L.; Tarek, A.; Tobi, A.; Ibouh, H.; Zaid, K.; Elamari, K.; Hibti, M. Geological mapping and mining prospecting in the Aouli inlier (Eastern Meseta, Morocco) based on remote sensing and geographic information systems (GIS). China Geol. 2022, 5, 614–625. [Google Scholar] [CrossRef]
- He, F. Agricultural climate change based on GIS and remote sensing image and the spatial distribution of sports public services. Arab. J. Geosci. 2021, 14, 975. [Google Scholar] [CrossRef]
- Wang, H.; Li, C. Analysis of scale effect and change characteristics of ecological landscape pattern in urban waters. Arab. J. Geosci. 2021, 14, 569. [Google Scholar] [CrossRef]
- Cao, L.; Chen, H. Research on the physiological and psychological ability indexes of coal tunneling workers. J. Contemp. Educ. Res. 2021, 5, 168–173. [Google Scholar] [CrossRef]
- Mohamad, H.M.; Asman, N.S.A.; Mirasa, A.K.; Saad, I.; Siti, N.M. A consistency check of concrete compressive strength using pearson’s correlation coefficient. Ksce. J. Civ. Eng. 2021, 7, 541–548. [Google Scholar] [CrossRef]
- Saeed, M.; Ahmad, M.R.; Rahman, A.U. Refined pythagorean fuzzy sets: Properties, set–theoretic operations and axiomatic results. J. Comput. Cogn. Eng. 2022, 2, 10–16. [Google Scholar] [CrossRef]
- Teymouri, E.; Moradloo, A.J.; Abbasi, S. Seismic analysis of steel tanks subjected to transitional–rotational components of earthquakes. J. Earthq. Eng. 2022, 27, 3153–3179. [Google Scholar] [CrossRef]
- Liu, J.; Liu, J.; Fan, L.; Yi, L.; Song, H.; Zeng, Q. Intelligent building load scheduling based on multi–objective multi–verse algorithm. Energ. Power Eng. 2021, 13, 19–29. [Google Scholar] [CrossRef]
- Song, C.; Ouyang, Z. Gross ecosystem product accounting for ecological benefits assessment: A case study of Qinghai Province. Acta. Ecol. Sin. 2020, 40, 3207–3217. [Google Scholar]
- Deng, L.; Shangguan, Z. High quality developmental approach for soil and water conservation and ecological protection on the loess plateau. Front. Agr. Sci. Eng. 2021, 8, 501–511. [Google Scholar] [CrossRef]
- George, M.; Ngole–Jeme, V.M. Assessment of soil degradation in a palustrine wetland and the implication on its water purification potential. Clean–Soil Air Water 2021, 49, 2100060. [Google Scholar] [CrossRef]
- Mahdiraji, E.A. Fault locating in distributed generation network based on the use of phasor unit measurement in oil and gas industry. J. Chem. Rev. 2021, 3, 147–159. [Google Scholar]
- Wang, Z.; Sun, J.; Du, Y.; Niu, W. Conservation tillage improves the yield of summer maize by regulating soil water, photosynthesis and inferior kernel grain filling on the semiarid Loess Plateau, China. J. Sci. Food Agr. 2021, 102, 2330–2334. [Google Scholar] [CrossRef]
- Sun, J.; Lu, M. Analytical solutions for consolidation of soft soil improved by air–boosted vacuum preloading considering clogging effect. Int. J. Numer. Anal. Met. 2023, 47, 1830–1851. [Google Scholar] [CrossRef]
- Tyovenda, A.A.; Ayua, T.J.; Sombo, T. Modeling of gaseous pollutants (CO and NO2) emission from an industrial stack in kano city, northwestern nigeria. Atmos. Environ. 2021, 253, 118356. [Google Scholar] [CrossRef]
- Tominaga, R.T.; Inutsuka, S.I.; Kobayashi, H. Coagulation instability in protoplanetary disks: A novel mechanism connecting collisional growth and hydrodynamical clumping of dust particles. Astrophys. J. 2021, 923, 34. [Google Scholar] [CrossRef]
- Wang, Q.; Feng, J.; Huang, Y.; Wang, P.; Xie, M.; Wan, H. Dust–retention capability and leaf surface micromorphology of 15 broad–leaved tree species in Wuhan. Acta. Ecol. Sin. 2021, 40, 213–222. [Google Scholar]
- Yadav, R.; Chand, T.; Nautiyal, R. Valuation of water purification service of Renukawetland, India: A Ramsar site. Glas. Sumar. Fak. 2021, 2021, 219–226. [Google Scholar] [CrossRef]
- Ahmadinia, M.; Shariatipour, S.M.; Sciencetechnology, G.G. A study on the impact of storage boundary and caprock morphology on carbon sequestration in saline aquifers. Greenh. Gases 2020, 11, 183–205. [Google Scholar] [CrossRef]
- Zhou, N. Assessment of aerobic exercise capacity in obesity, which expression of oxygen uptake is the best. Sport. Med. Health Sci. 2021, 3, 138–147. [Google Scholar] [CrossRef] [PubMed]
- Yang, W.; Gong, Q.; Lin, Z. Spatio–temporal patterns and driving factors of ecological assets in Beijing’s ecological conservation area. Acta. Ecol. Sin. 2021, 41, 6051–6063. [Google Scholar]
- Wang, Y.; Wang, Y.; Yang, J.; Zhao, T.; Kou, L.; Zhang, D. Forest ecological security rating and its spatio–temporal evolution analysis in the Yellow River Basin. Acta. Ecol. Sin. 2022, 42, 2112–2121. [Google Scholar]
- Koustourakis, G.S.; Spiliopoulou, G.; Asimaki, A.; Lavidas, K. Family cultural activities and educational expectations of day high school students. Int. J. Sociol. Educ. 2020, 9, 93–119. [Google Scholar] [CrossRef]
Figure 1.
Types of urban forest ecosystem based on GIS.

Figure 2.
Urban forest classification information.

Figure 3.
Urban forest classification patch horizontal landscape classification and indicators.

Figure 4.
Multi-level index system model.

Figure 5.
Hierarchical model of urban forest comprehensive evaluation indicators.

Figure 6.
Overall framework of the ecological compensation mechanism.

Figure 7.
Evaluation index system of the urban forest ecological compensation standard.

Figure 8.
Distributed accounting method model of the urban forest ecological compensation standard.

Figure 9.
Calculation results of consistency index of each index of the urban forest comprehensive benefit.
Figure 9.
Calculation results of consistency index of each index of the urban forest comprehensive benefit.

Figure 10.
The weights of factor layer and criterion layer.

Figure 11.
Weight and comprehensive weight of the indicator layer.

Figure 12.
The results of fuzzy comprehensive evaluation are summarized in the form of the proportion of each rating of each indicator.
Figure 12.
The results of fuzzy comprehensive evaluation are summarized in the form of the proportion of each rating of each indicator.

Figure 13.
Scores of urban forest indexes at all levels.


Table 1.
Scale of relative importance of elements.
| Scale | Implication | Scale | Implication |
|---|---|---|---|
| 1 | Both elements are equally important | 9 | The former element is more important than the latter |
| 3 | The former element is slightly more important than the latter | 2, 4, 6, 8 | The ratio of influence between the two elements is between the above two adjacent grades |
| 5 | The former is significantly more important than the latter | 1, 1/2, …, 1/9 | The ratio of influence between the two elements is the reciprocal number of the above scale |
| 7 | In pairwise comparison, the former is more important than the latter |
Table 2.
RI values of matrix order 1–10.
| Rank | Rank | ||
|---|---|---|---|
| 1 | 0.00 | 6 | 1.26 |
| 2 | 0.00 | 7 | 1.36 |
| 3 | 0.52 | 8 | 1.41 |
| 4 | 0.89 | 9 | 1.46 |
| 5 | 1.12 | 10 | 1.49 |
Disclaimer/Publisher’s Note: The statements, opinions and data contained in all publications are solely those of the individual author(s) and contributor(s) and not of MDPI and/or the editor(s). MDPI and/or the editor(s) disclaim responsibility for any injury to people or property resulting from any ideas, methods, instructions or products referred to in the content. |
© 2024 by the authors. Licensee MDPI, Basel, Switzerland. This article is an open access article distributed under the terms and conditions of the Creative Commons Attribution (CC BY) license (https://creativecommons.org/licenses/by/4.0/).
Share and Cite
MDPI and ACS Style
An, L.; Liu, G.; Hou, M. The Application of Geographic Information System in Urban Forest Ecological Compensation and Sustainable Development Evaluation. Forests 2024, 15, 285. https://doi.org/10.3390/f15020285
AMA Style
An L, Liu G, Hou M. The Application of Geographic Information System in Urban Forest Ecological Compensation and Sustainable Development Evaluation. Forests. 2024; 15(2):285. https://doi.org/10.3390/f15020285
Chicago/Turabian StyleAn, Liwei, Guifeng Liu, and Meiling Hou. 2024. "The Application of Geographic Information System in Urban Forest Ecological Compensation and Sustainable Development Evaluation" Forests 15, no. 2: 285. https://doi.org/10.3390/f15020285
Note that from the first issue of 2016, this journal uses article numbers instead of page numbers. See further details here.