


The Dynamics and Potential of Carbon Stocks as an Indicator of Sustainable Development for Forest Bioeconomy in Ghana


1
Department of Forestry Technologies and Constructions, Faculty of Forestry and Wood Sciences, Czech University of Life Sciences Prague, Kamýcka 129, 165 00 Prague, Czech Republic
2
Department of Environmental Management, School of Environmental Sciences, Federal University of Technology, Owerri, P.M.B. 1526, Owerri 460114, Nigeria
3
Department of Soil Science “Luiz de Queiroz”, College of Agriculture, University of São Paulo, 11 Pádua Dias Avenue, Piracicaba 13418-900, SP, Brazil
*
Author to whom correspondence should be addressed.
Forests 2024, 15(2), 256; https://doi.org/10.3390/f15020256
Submission received: 25 December 2023
/
Revised: 24 January 2024
/
Accepted: 25 January 2024
/
Published: 29 January 2024
(This article belongs to the Topic Forest Productivity, Carbon Dynamics and Eco-Environmental Response: Potential, Development and Challenges)
Abstract
:Sustainable forest bioeconomy (SFB), as a multidimensional approach for establishing mutual benefits between forest ecosystems, the environment, the economy, and humans, is a nature-based solution for a promising future. The study aims to evaluate the potential of carbon stocks (Cstocks) and variability for SFB. It is hypothesized that the decrease in Cstocks is related to an increase in population and agriculture, which caused a decrease in forest area and growing stock and consequently affected SFB. Primary and secondary data were collected from the field, national, and international databases, and analyzed using some statistical and geospatial software packages including IBM SPSS 29.0, CANOCO 5.0, and ArcGIS 10.5. The results revealed that large forest areas were converted to arable lands between 2000 and 2020. Across the forest zones, the aboveground and belowground Cstocks varied significantly, with the aboveground biomass being higher than the belowground biomass. The main drivers of Cstocks were politics and governance (57%), population growth (50%), soil degradation practices (50%), and socio-cultural beliefs (45%). Cstocks had significant negative correlation with population growth, carbon emissions, forest growing stock, forest loss, and the use of forest for biofuel. Evergreen forest zones (rainforest and moist) had more Cstocks than the moist deciduous and swamp/mangrove forests. The study demonstrated that the variability in Cstocks over the last three decades is attributed to an increase in population and agriculture, but Cstocks variability between the forest-vegetation belts could be better explained by differences in trees abundance than population. The study also revealed that the increase in Cstocks contributed to the realization of many SDGs, especially SDG 1, 2, 3, 6, 7, 11, 12, 13, and 15, which in turn support a sustainable forest bioeconomy. Future study is necessary to evaluate Cstocks in individual tree species, biodiversity, and other forest ecosystem services to promote SFB in the country.
1. Introduction
Globally, the forest sector is widely known for its vital roles in the global carbon cycle and climate change mitigation [1,2,3,4,5]. Forests have the potential to substantially contribute to the world carbon cycle and climate change mitigation by capturing carbon from the atmosphere and stocking it in the forest ecosystem (such as forest wood-based and non-wood-based products, biomass, and soil) [6,7]. Recent efforts to mitigate global warming have brought the need for atmospheric carbon storage into focus, as many land use practices, such as forestry and integrated agricultural systems, have the potential to absorb (or sequester) carbon dioxide (CO2) from the atmosphere. Estimation of global, regional, national, or local carbon stocks and sources is core content of the Intergovernmental Panel on Climate Change (IPCC) documentations. Countries featuring in the UN Framework Convention on Climate Change (UNFCCC) are involved in presenting national inventories of net GHG emissions, including carbon sources and stocks related with forests, and in reaching their mandates for low emissions under the climate change protocols [8,9].
Carbon stock is the storage of carbon belowground and aboveground in a stable means by the direct and indirect absorbance of atmospheric CO2 [10,11]. Living plants, through photosynthetic processes, transform CO2 to biomass by dissipating the carbon in the atmosphere and reserving it in the plant tissues and soils [12,13]. In agricultural or forest ecosystems, the generated biomass is specifically stocked as aboveground biomass (AGB), belowground biomass (BGB), dead wood, litter, and soil organic matter [14,15,16]. Forest plants and forest ecosystems including soils are key carbon sinks and sources [17,18,19,20,21] and have significant impacts on the realization of many sustainable development goals (SDGs), especially SDG 1, SDG 2, SDG 3, SDG 6, SDG 7, SDG 11, SDG 12, SDG 13, and SDG 15 [22]. Some of the SDGs focus on terrestrial biophysical systems in which soils including SOC play essential roles. For example, zero hunger (SDG 2) relates to the achievement of food security and improved nutrition, and Good Health and Well Being (SDG 3) through sustainable agriculture, and SOC is indispensable for the realization of these goals [23]. An increase in SOC stocks is also vital in climate change mitigation and adaptation (SDG 13), and for the sustenance of life on earth (SDG 17), through carbon-capture approaches such as climate-smart agriculture, integrated forestry–crop–livestock agricultural systems, and others [22,24,25,26,27].
Forests contribute significantly to the processes of carbon stocks and sequestration. Thus, forests have attracted much research on the worldwide carbon fluxes, carbon balance, and climate change [20,28]. The role of forest ecosystems as both a carbon source and a carbon stock is pertinent in regulating the carbon fluxes and carbon balance [19,20,21,29,30]. Studies have revealed that forests are one of the terrestrial ecosystems that accumulate the highest stock of organic carbon, and this value is almost twice that stored in the atmosphere [31,32,33].
To enhance the processes of carbon stocks in the forest ecosystems, certain natural-based solutions (NBS), such as selective logging, zero deforestation [34,35,36], afforestation [37], forest restoration [38], and improved forest management [39,40] are essential approaches to achieving climate change mitigation. This potential notwithstanding, the knowledge gaps regarding the combined impact of future socioeconomic factors, management, and policy changes on forest carbon stocks vis-a-vis CO2 emissions remained unclosed [41,42]. The key gaps include the role of timber demand in carbon fluxes, the influence of climate change policies on forest management and timber production, and the regional variations in carbon and wood product harvest outcomes. To close this gap, the idea of the sustainable forest bioeconomy (SFB) was conceived.
A forest bioeconomy (FB) might be termed as an act that exploits wood and other non-wood products, such as vegetables, snails, fruits, mushrooms, edible insects, and others harnessed from the forests or side streams of forest biomass for domestic, commercial, and industrial purposes for human benefits. In addition, FB commonly encompasses forestry-oriented operations, including mining/logging, transporting, and the production of forest biomass to achieve an effective form of “sustainability” in the environment and forest ecosystem. Sustainability, for instance, in general terms, could be defined as a system approach that interlinks various sectors namely, economic, environmental, and social sectors [43,44], and lately the ideology has been expanded to incorporate spiritualism and culturalism [39]. Therefore, a sustainable forest bioeconomy is the uncompromising stewardship and use of forests and forest ecosystems in a way, and at a rate, that conserves their regeneration, biodiversity, productivity, and naturalness, and their ability to accomplish, both at present and in the future, essential ecological, economic, and socio-cultural services, at local, national, and global levels, without harming other ecosystems [45].
Improved forest management practices and changing environmental conditions (e.g., nitrogen deposition, climate warming and the elevation of atmospheric CO2 concentrations) have increased the carbon sequestration and stocks in sustainably managed forests [46,47,48,49]. In sum, the increasing stock of C in the European forests has been elevated in recent decades relative to the forest area, with an increase of approx. 17.5 million hectares from 1990 to 2015 [46]. The SFB provides security to forest ecosystems and safety throughout their entire environment; however, in most developing countries especially in the SSA, Ghana in particular, the majority have neither heard about SFB nor understood it perfectly, and are less likely to follow its procedures. In the SSA for example, between 2000 and 2005, Sudan lost an average of 117,807 hectares of forest per annum, whereas Nigeria lost 82,000 hectares of forest per annum [50,51]. Most West African countries including Ghana and Nigeria, lost 55.7% of their primary forests between 2000 and 2005, through logging for energy, timber, and agriculture. This accounted for the highest rate of forest loss globally. In this region, particularly Ghana, many forest management projects, including the Reducing Emissions from Deforestation and Forest Degradation (REDD+), are not viable for several reasons, including the following: (i) their benefits are uncompensated environmental services; (ii) there is a high rate of poverty and illiteracy; (iii) there is rapid population growth and increasing demand on forest resources (food, fodder, fiber, arable land, energy, timber) for peoples’ livelihoods; (iv) socio-cultural beliefs; (v) national governments and other local agencies have no strong will to ensure forest management; (vi) there are inadequate finances to undertake conservation activities due to corruption, the diversion of allocated money, or the misappropriation of funds. However, SFB, if well adopted in the region, could support in the development of carbon projects to provide financial aid to government agencies investing in forest conservation. If SFB is embraced, deforestation for any reason will be ameliorated because carbon credits will be established, and both the government and the forest-dependent communities will be adequately compensated. In addition to the economic incentives, zero deforestation will improve the environment. For instance, it is estimated that the total carbon mitigation from avoided deforestation in Africa between 2003 and 2012 could be 615.8 million tCO2 [45]. With effective harvesting in an SFB, woody biomass is transferred from the ecosystem to the technosphere. Wood is harvested to cater for diverse needs namely, construction, energy, hygiene, and communication. Forests and forest-related products have an enormous influence in both the economic, environment, and social sectors, and can thus promote the United Nations Sustainable Development Goals (UN-SDGs) in many areas.
Ghana is one of the countries in tropical Africa with tangible forest areas that could support, or have been indirectly providing, most of the poor masses with substantial livelihoods, but the impact of carbon stocks on the forest bioeconomy is not familiar to the people. This is because no research or training has been made available on this topical issue. Therefore, this work is unique as it helped to close this gap in knowledge about the carbon stock–bioeconomy nexus by evaluating the potential of carbon stock and variability for SFB. The novelty of this study could further be explained by the fact that, at present, in Ghana, it is rare to find any study that has examined the prospects of carbon stocks for SFB in a larger space (i.e., across the vegetational belts) and over a longer timeframe (three decades). To achieve the aim of this work, specific objectives were developed, including the following: (i) the quantification and mapping forest carbon stocks in the forest-vegetation zones of Ghana; (ii) an estimation of the variability and potential of carbon stocks in SFB; (iii) determination of the key drivers of SFB. The study hypothesized that the decrease in carbon stock is related to an increase in population and agriculture, leading to a decrease in forest area and increase in stock with an increase in carbon emissions, which consequently affected the sustainable forest bioeconomy in Ghana.
2. Materials and Method
2.1. Study Area
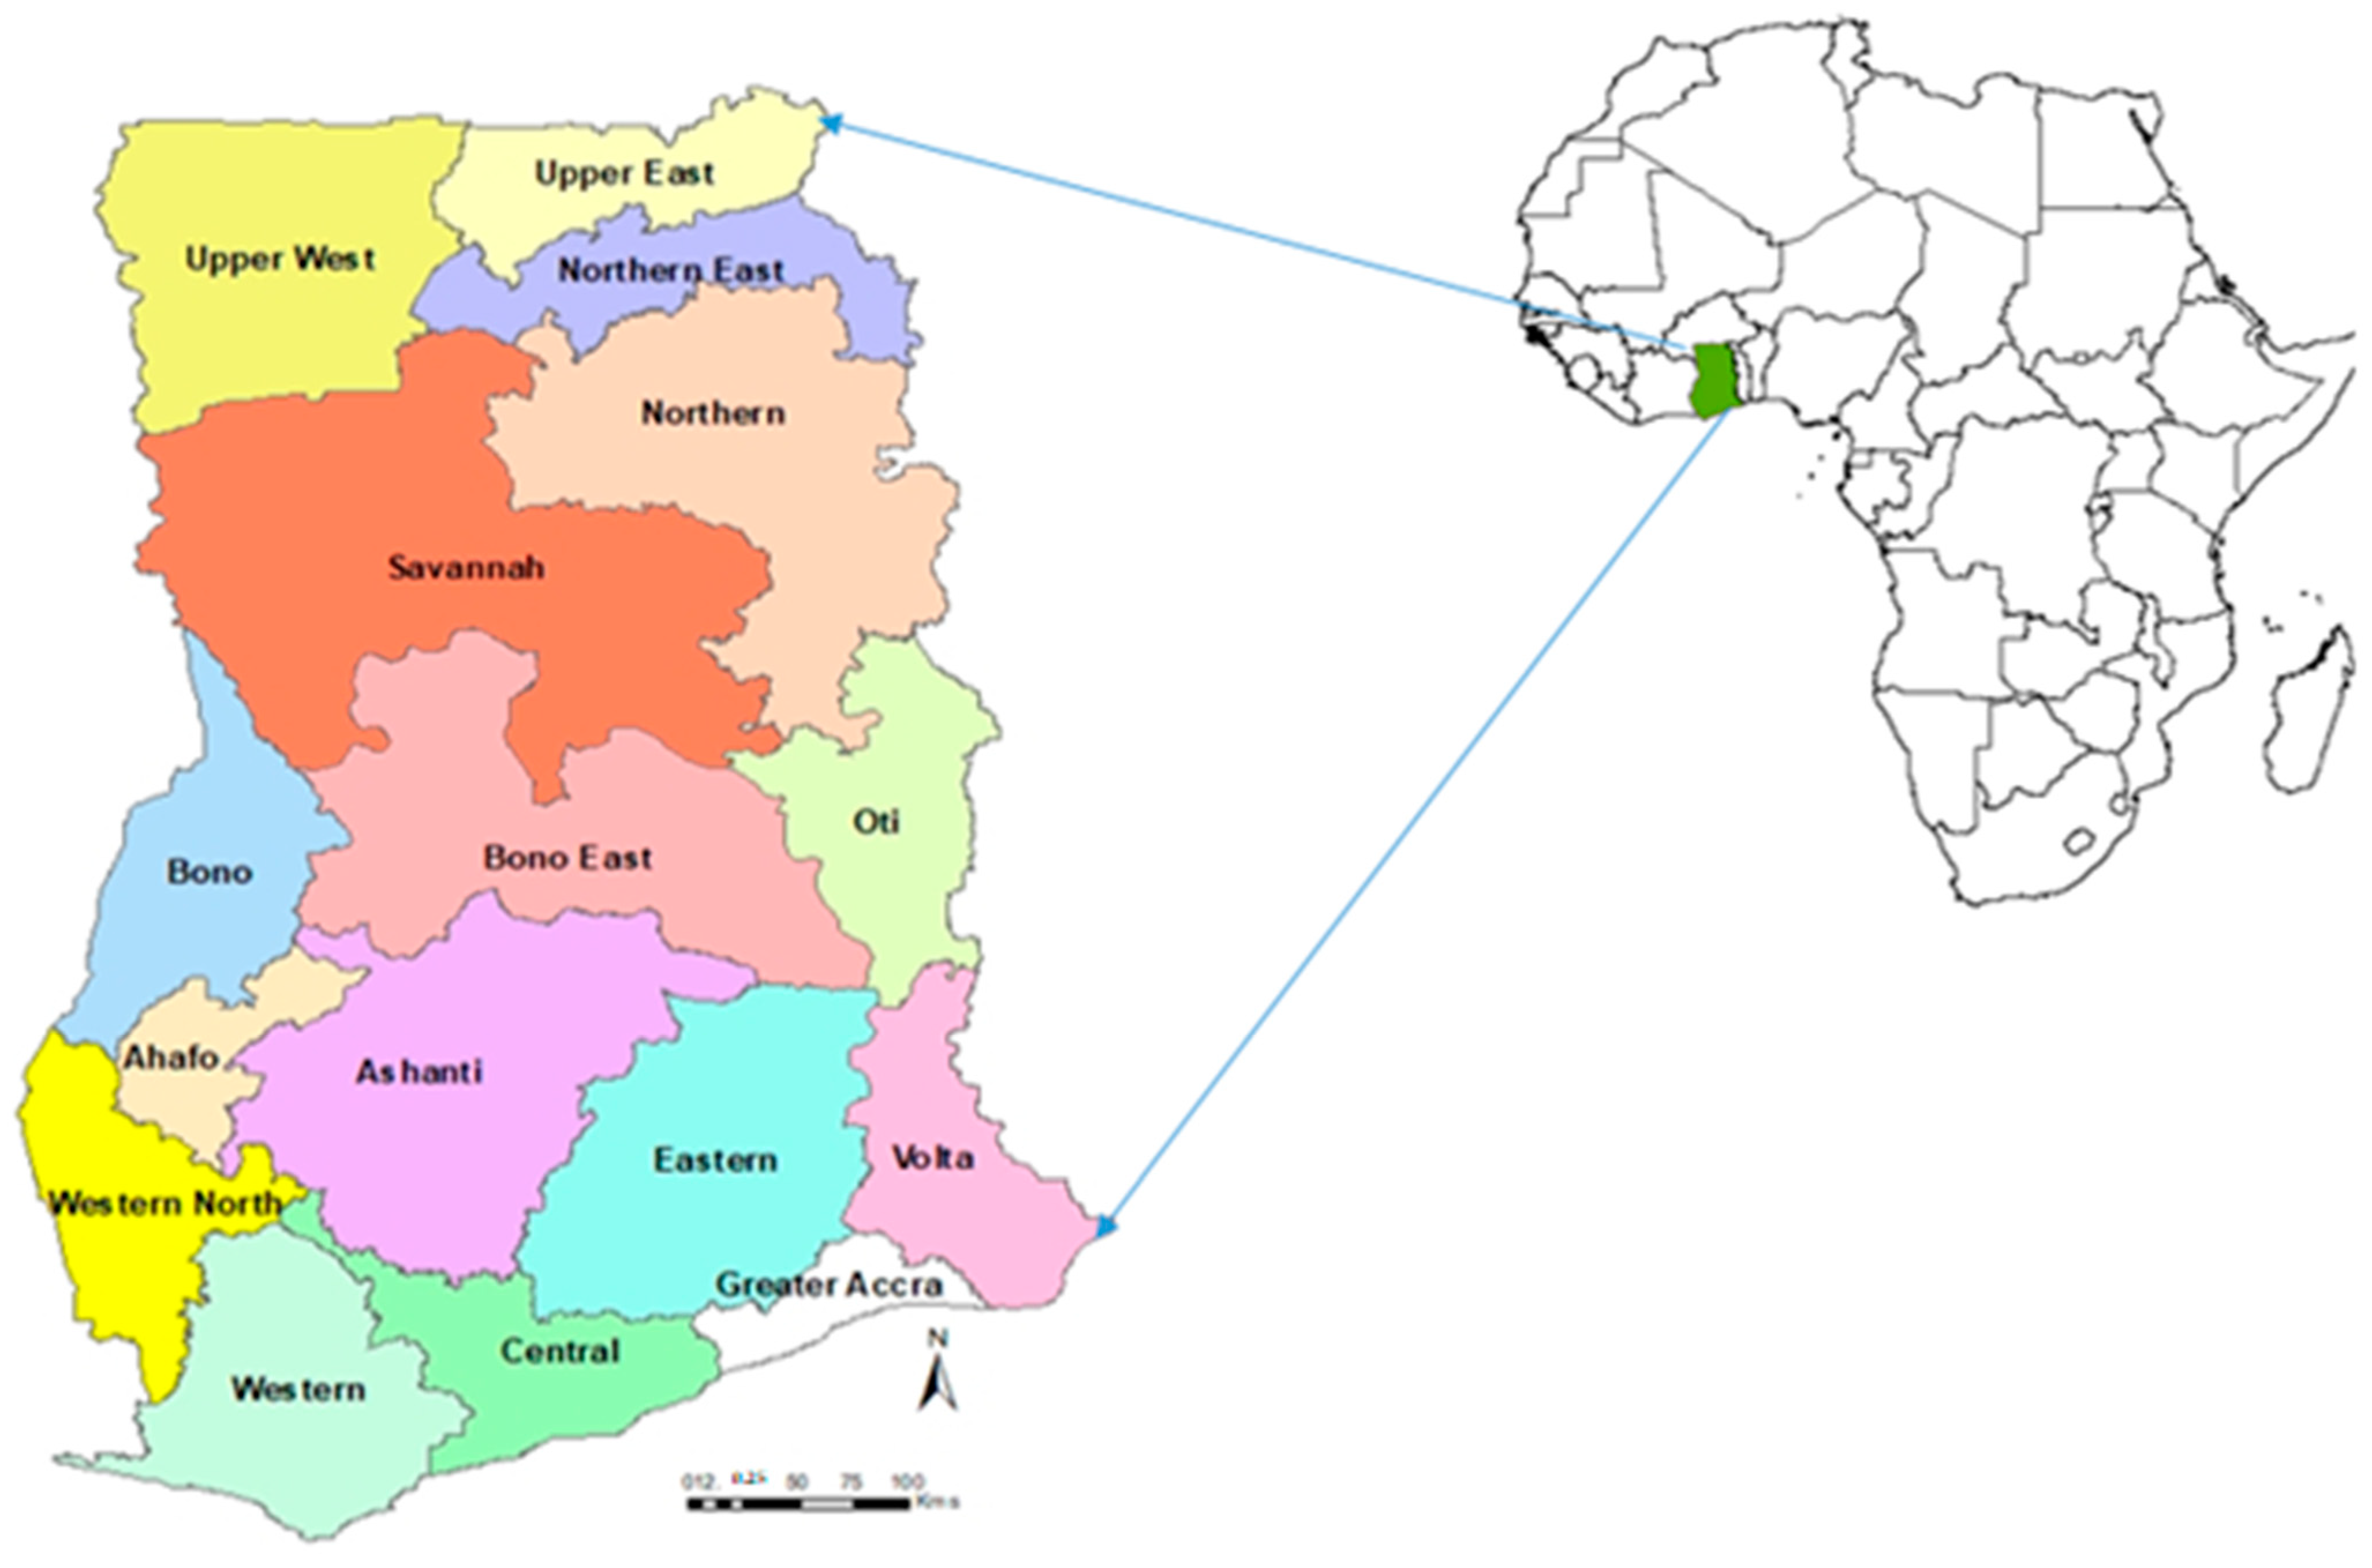
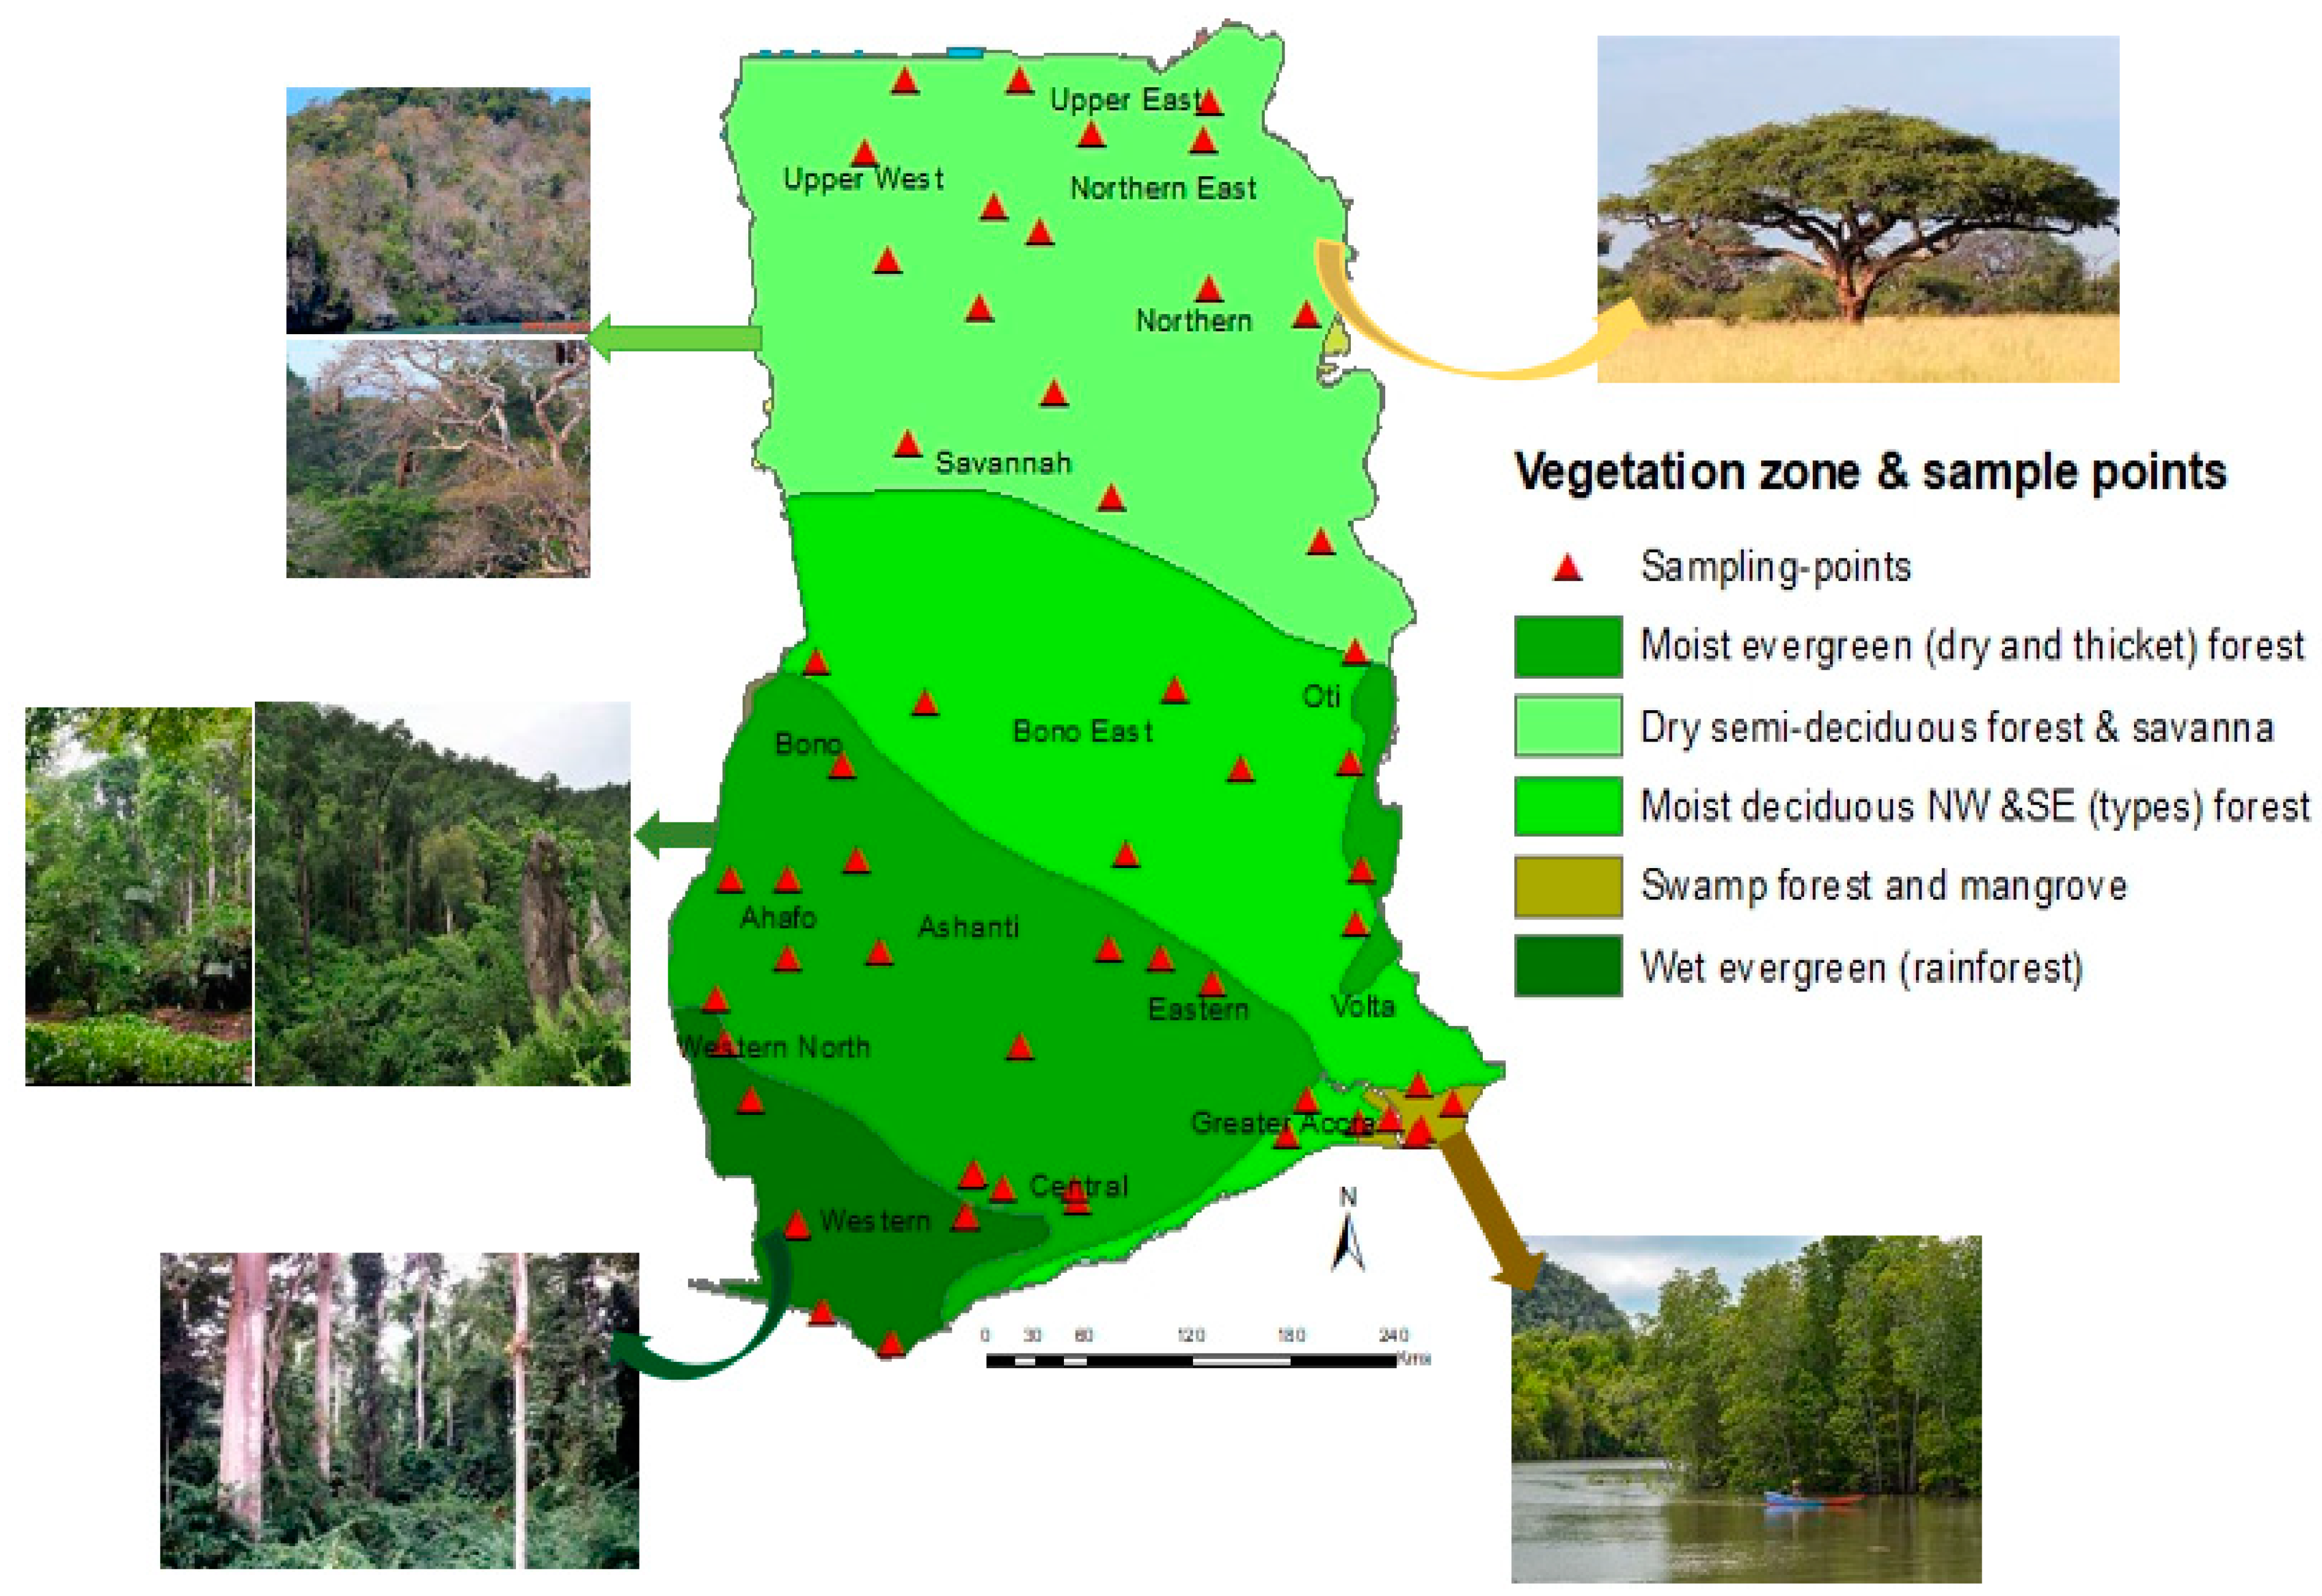
This research was conducted in Ghana. Ghana is in the western part of Africa, between latitudes 4°44′ and 11°15′ N and longitudes 3°15′ W and 1°12′ E, with an aerial coverage of 238,539 sq km2 [52]. Ghana is surrounded by Burkina Fasso, Togo, Ivory Coast, and the Atlantic Ocean in the south. Currently, the population of Ghana is about 30.8 million persons, with a yearly population growth rate of ca. 2.2% [53]. In 2019, Ghana’s regions were increased from ten to sixteen administrative regions (Figure 1). As an African country, Ghana is known for its large hectares of forest areas. There are five dominant forest-vegetation zones, including wet evergreen rainforest, moist evergreen (dry and thick) forest, moist deciduous (NW and SE types) forest, dry semi-deciduous forest and savannah, and swamp forest and mangrove (Figure 2). The wet evergreen rainforest and the moist evergreen (dry and thick) forests are found in the south and south-west, whereas the swamp forest and mangrove vegetation are commonly found in the south-east [54]. On the other hand, the moist deciduous (NW and SE types) forest and the dry semi-deciduous forest and savannah are primarily located in the central and northern regions of the country, respectively (Figure 2). Ghana is one of the African countries facing forest threats due to rapid deforestation. In the year 2020, Ghana’s forest loss estimate was above 14,000 hectares [55]. In 1992, only about 1.5 million hectares were estimated as remaining “intact closed forest” in the country. The country had high net CO2e emissions between 1990 and 1996, although its sinks rapidly decreased in size [56]. The swift decrease in sinks has been associated with deforestation, particularly a rapid increase in wood energy consumption, timber harvesting, agricultural and settlement expansion, and mining, and low rates of reforestation [54,57,58,59].
In terms of climatic conditions, the country is characterized by a tropical climate with different wet and dry seasons [60,61]. Ghana has temporal and spatial temperature variations due to seasonal changes and differences in ecological zone, respectively. The average yearly temperature is generally high and above 24 °C. Average yearly rainfall is about 736.6 mm, and rainfall typically decreases from south to north [56]. Economically, the current GDP growth of Ghana is 3.3%, with an inflation rate of 29.8%, and an unemployment rate of 13.4% [62]. At present, over 3.4 million people in the country are living in acute poverty, with below 1.90 USD per day, with the rural areas accounting for the highest number [63].
2.2. Data Collection and Analyses
The primary and secondary sources of data collection were applied to extract relevant data for the study. For the primary data sources, the researchers identified and classified the forest-vegetation belts in Ghana and performed a field sampling by applying a handheld GPS to identify the sampling sites in each forest-vegetation zone (Figure 2, Appendix A Table A1). Data were collected from a total of 55 sampling points, with at least 5 points from each forest-vegetation zone. The larger the coverage of a land use-cover or the vegetation zone, the higher the number of sampling points. This was carried out to achieve a good, uniform spatial distribution of the sampling sites across the entire study area. For example, the dry semi-deciduous forest and savannah zone (16 sampling points) had the highest number of sampling points, while swamp forest and mangrove (5 points) had the lowest number of sampling points. The sample sites were visited thrice between November 2021 and October 2022. Data on carbon stocks (aboveground and belowground) and other related data on a sustainable forest bioeconomy, such as the common tree species, were collected and estimated. Further, as part of the primary data source, the study also used a structured research questionnaire to collect some field data, especially on the drivers of deforestation, socioeconomic and political factors, and the people’s perception of carbon stocks’ potential to achieve sustainable development. Twenty interviewees were chosen across the five forest-vegetation zones. The respondents’ profiles encompassed researchers in the field, foresters, agronomists, and policy makers and agents from the government and related ministries. All the interviewees were above 30 years old and must have either lived or worked in Ghana for at least 20 years. The secondary data sources included materials from the peer-reviewed literature, and the government and NGOs, established institutions and agencies, including Ghana Statistical Services, Ministry of Food and Agriculture, Commerce, and various industries (Table 1). Other sources of data were United Nations Organizations such as Food and Agricultural Organization (FAO) [64,65,66,67], World Bank [68,69], World Income Inequalities Databases [70], Forest Resources Assessment [71], and United Nations Office for the Coordination of Humanitarian Affairs [72]. Further, data were also extracted from the National Aeronautics and Space Administration [73], where some satellite imagery, including land use-cover changes, were retrieved. These secondary data were collated and reconciled with the field data. Where large discrepancies occurred in the data, for instance, between the country-based institutional data and the international institution-based data, the field data were used where available; otherwise, the data were averaged.
The harmonization and standardization of belowground carbon values were performed following the descriptions from a recent study published by authors from the country [74]. For the estimated carbon stocks, the data were processed following the international standards for field survey and laboratory analysis [75]. The SOC content of the soil samples was determined by Walkley–Black titrimetry (dichromate oxidation). Other data included bulk density (BD) and coarse fragments (CoF) data, which followed a depth interval of 0–30 cm for the entire of Ghana, and were downloaded as grids and/or layers from the ISRIC soil property data repository (soilgrids.org). The values of BD (Mg m−3) and CoF (%) were extracted from the SoilGrids layers at the geographical sampled points [76]. After the field sampling was conducted based on the sampling locations identified using the GPS, as shown in Figure 2, the samples were taken to the laboratory and analyzed. Using the results that were harmonized and reconciled with the other sources of soil data from the soilgrids, the soil (BG) carbon stocks were estimated using the Global Soil Information Facilities (GSIF; Hengl et al. [77] based on a standardized calculation prescribed by Nelson and Sommers [78] (Equation (1)).
where BG or soil-C stock is the belowground carbon stock, SOCD is the soil carbon density (kg m−3), SD is the soil profile depth (30 cm), and CoF is the coarse fragments (%).
BG or soil-Cstock = (SOCD/1000) × (SD/100) × BD × (100 − CoF/100)
Biomass/vegetation (Aboveground carbon): The carbon emission intensity of forest zone types refers to the carbon emissions per unit of land area, which can reflect the change in carbon emissions from forest zones and its correlation. Here, this was calculated following the work by Li et al. [79] and Shoumik and Khan [80], as shown in Equation (2):
where Ce represents the carbon emission intensity of the forest-vegetation zone, Cf is the carbon emissions of the forest-vegetation zone, and Sf is the area of the forest zone.
Ce = ∑ Cf/∑ Sf
The remotely sensed vegetation indices were used to estimate forest carbon using regression analysis. The normalized difference vegetation index (NDVI) was first computed by applying the data from high-spatial-resolution satellite imagery downloaded from NASA (Table 1), covering the study period. The normalized difference vegetation index was first applied by Li et al. [79], and Shoumik and Khan [80], as shown in Equation (3):
NDVI = (NIR − Red)/(NIR + Red)
NDVI is the most common vegetation index and has a range of from −1 to +1. NDVI is computed from the visible and near-infrared light reflected by vegetation. Healthy vegetation absorbs most of the visible light it makes contact with and reflects a large portion of the near-infrared light. Unhealthy or sparse vegetation reflects more visible light and less near-infrared light. The NDVI map of Ghana was generated using the Landsat-7 ETM+ satellite imagery and ArcGIS 10.5. In all vegetation indices computations, we used the red spectral band and the near-infrared band (NIR-1), because NIR-1-derived vegetation indices demonstrated stronger relationship with carbon compared with NIR-2. The NDVI was also used because it has been well documented as a good measure of biomass and vegetation vigor [79,80]. The reflectance in the vegetation indices was extracted from the satellite data using a window with an average size of 15 × 15 pixel (30 × 30 m), centered on the GPS location of each field sampled plot.
The previous literature (from published articles and government institutional documents), as well as foresters and plant ecologists, were consulted for the identification of the tree species and drivers of carbon stocks. Data on most of the investigated socioeconomic variables were derived from secondary sources, yet visits to the people and the forest zones prompted the collection of more relevant data and helped to reconcile the information acquired from the secondary sources.
2.3. Additional Methods Used for Carbon Stock Estimations
The carbon storage and sequestration model (CSSM) developed under the InVEST software was used in the estimation of carbon stock. InVEST was developed by the Natural Capital Project of Stanford University and presents a compilation of theoretical models that allows for the evaluation of several ecosystem services, including carbon stocks and economic values. The InVEST model was used to determine the spatial distribution of carbon stocks in the terrestrial land model [81]. The model estimates carbon stocks for the aboveground, belowground, and total carbon stock of any study area, based on the aggregated carbon values assigned for each land use–land cover (LULC), which included the forest types in our case. The carbon socks (Ci) for LULC type ‘i’ is equal to the sum of aboveground, belowground, dead carbon, and soil carbon for LULC type ‘i’, represented as follows:
Ci(above) + Ci(below) + Ci(dead) + Ci(soil)
The total carbon storage (Ctotal) is equal to the sum of carbon density for LULC type i multiplied by the area (Ai) for LULC type i, with n as the number of LULC types, in the study.
Ctotal = ∑ (i)^n × (Ci + Ai)
It is important to state here that, in the CSSM of InVEST model, the classified images were set as the LULC raster input.
2.4. Forests and Other Land Use Classifications
For the remote-sensing- and geospatial-related data, ArcGIS 10.5 [82] was used to project the data to the same coordinate system (WGS_1984_UTM_Zone_30N). Secondly, the data were reclassified to support LUCC analyses at the regional scale [83]. The land use-cover was classified based on a classification scheme developed by the Food and Agriculture Organization (FAO). The main classes identified during the investigation period included forests, agricultural areas, savannah, mangrove, settlements, open mining areas, wetlands, waterbodies, and others. The secondary data were reconciled with the field data. All the data were averaged, georeferenced, and classified based on the appropriate forest zones, and for the entire country.
2.5. Geospatial and Statistical Analyses
Data were analyzed using IBM SPSS (version 29.0, Armonk, NY, USA), CANOCO (version 5.0, Wageningen, The Netherlands) [84], and ArcGIS (version 10.5, Redlands, CA, USA) [82] software packages. Data were transformed where necessary to meet the requirements and to obtain suitable values for the analyses. For instance, where the units used for soil- or forest-based data varied between data sources, and in years, such data were converted to same units of measurements. The GIS spatial analytical tools were used to model and map the distributions of the forest areas and the carbon stocks in space and time. The multivariate ordination of Canoco 5.0 was used to identify and show the distributional trends of the common forest tree species across the decades and forest belts. To determine the interrelationships among the indicators of sustainable forest bioeconomy and carbon stocks, we used Spearman’s correlation analysis because our data (i) tends to show a non-linear relationship, (ii) has outliers that can influence the result, (iii) and has some variables in the ordinal (e.g., GDP and poverty level). The correlation was performed after the ranking, and at significant levels of 0.01 and 0.05, via IBM SPSS 29.0 (SPSS Inc., Armonk, NY, USA) statistical software.
3. Results and Discussion
3.1. Land Use-Cover Change vs. Carbon Stocks and Emissions
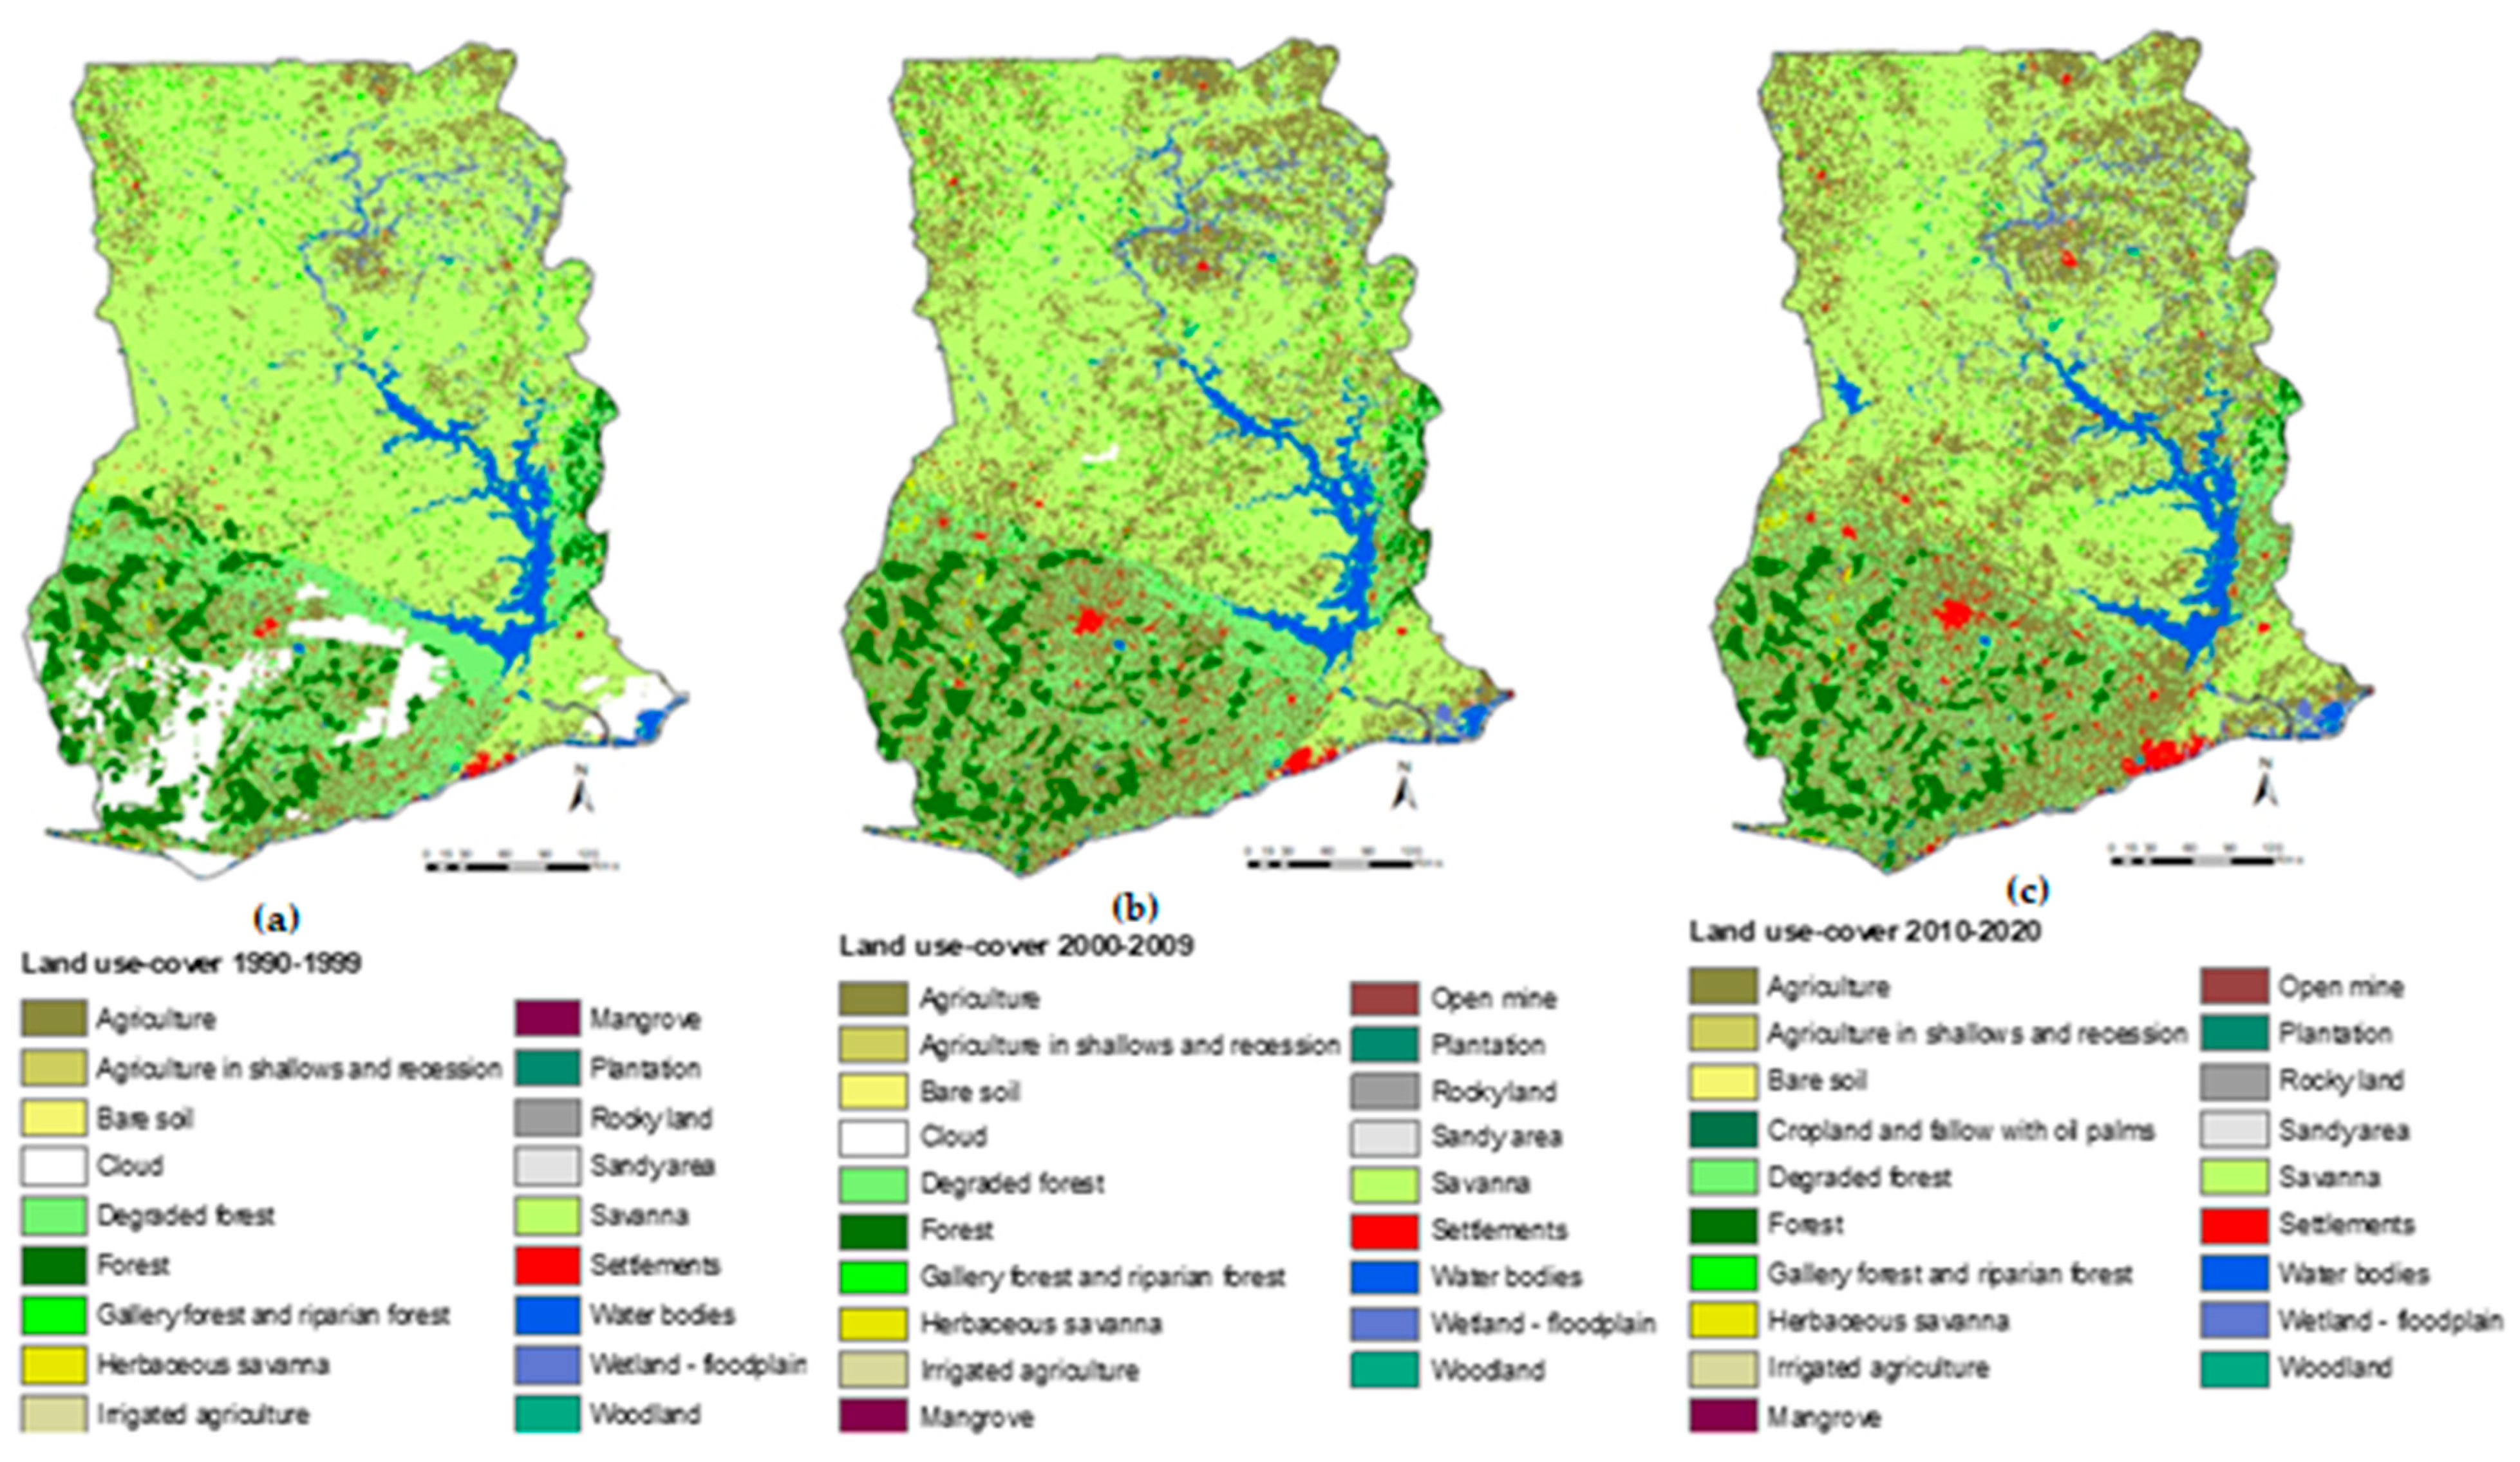
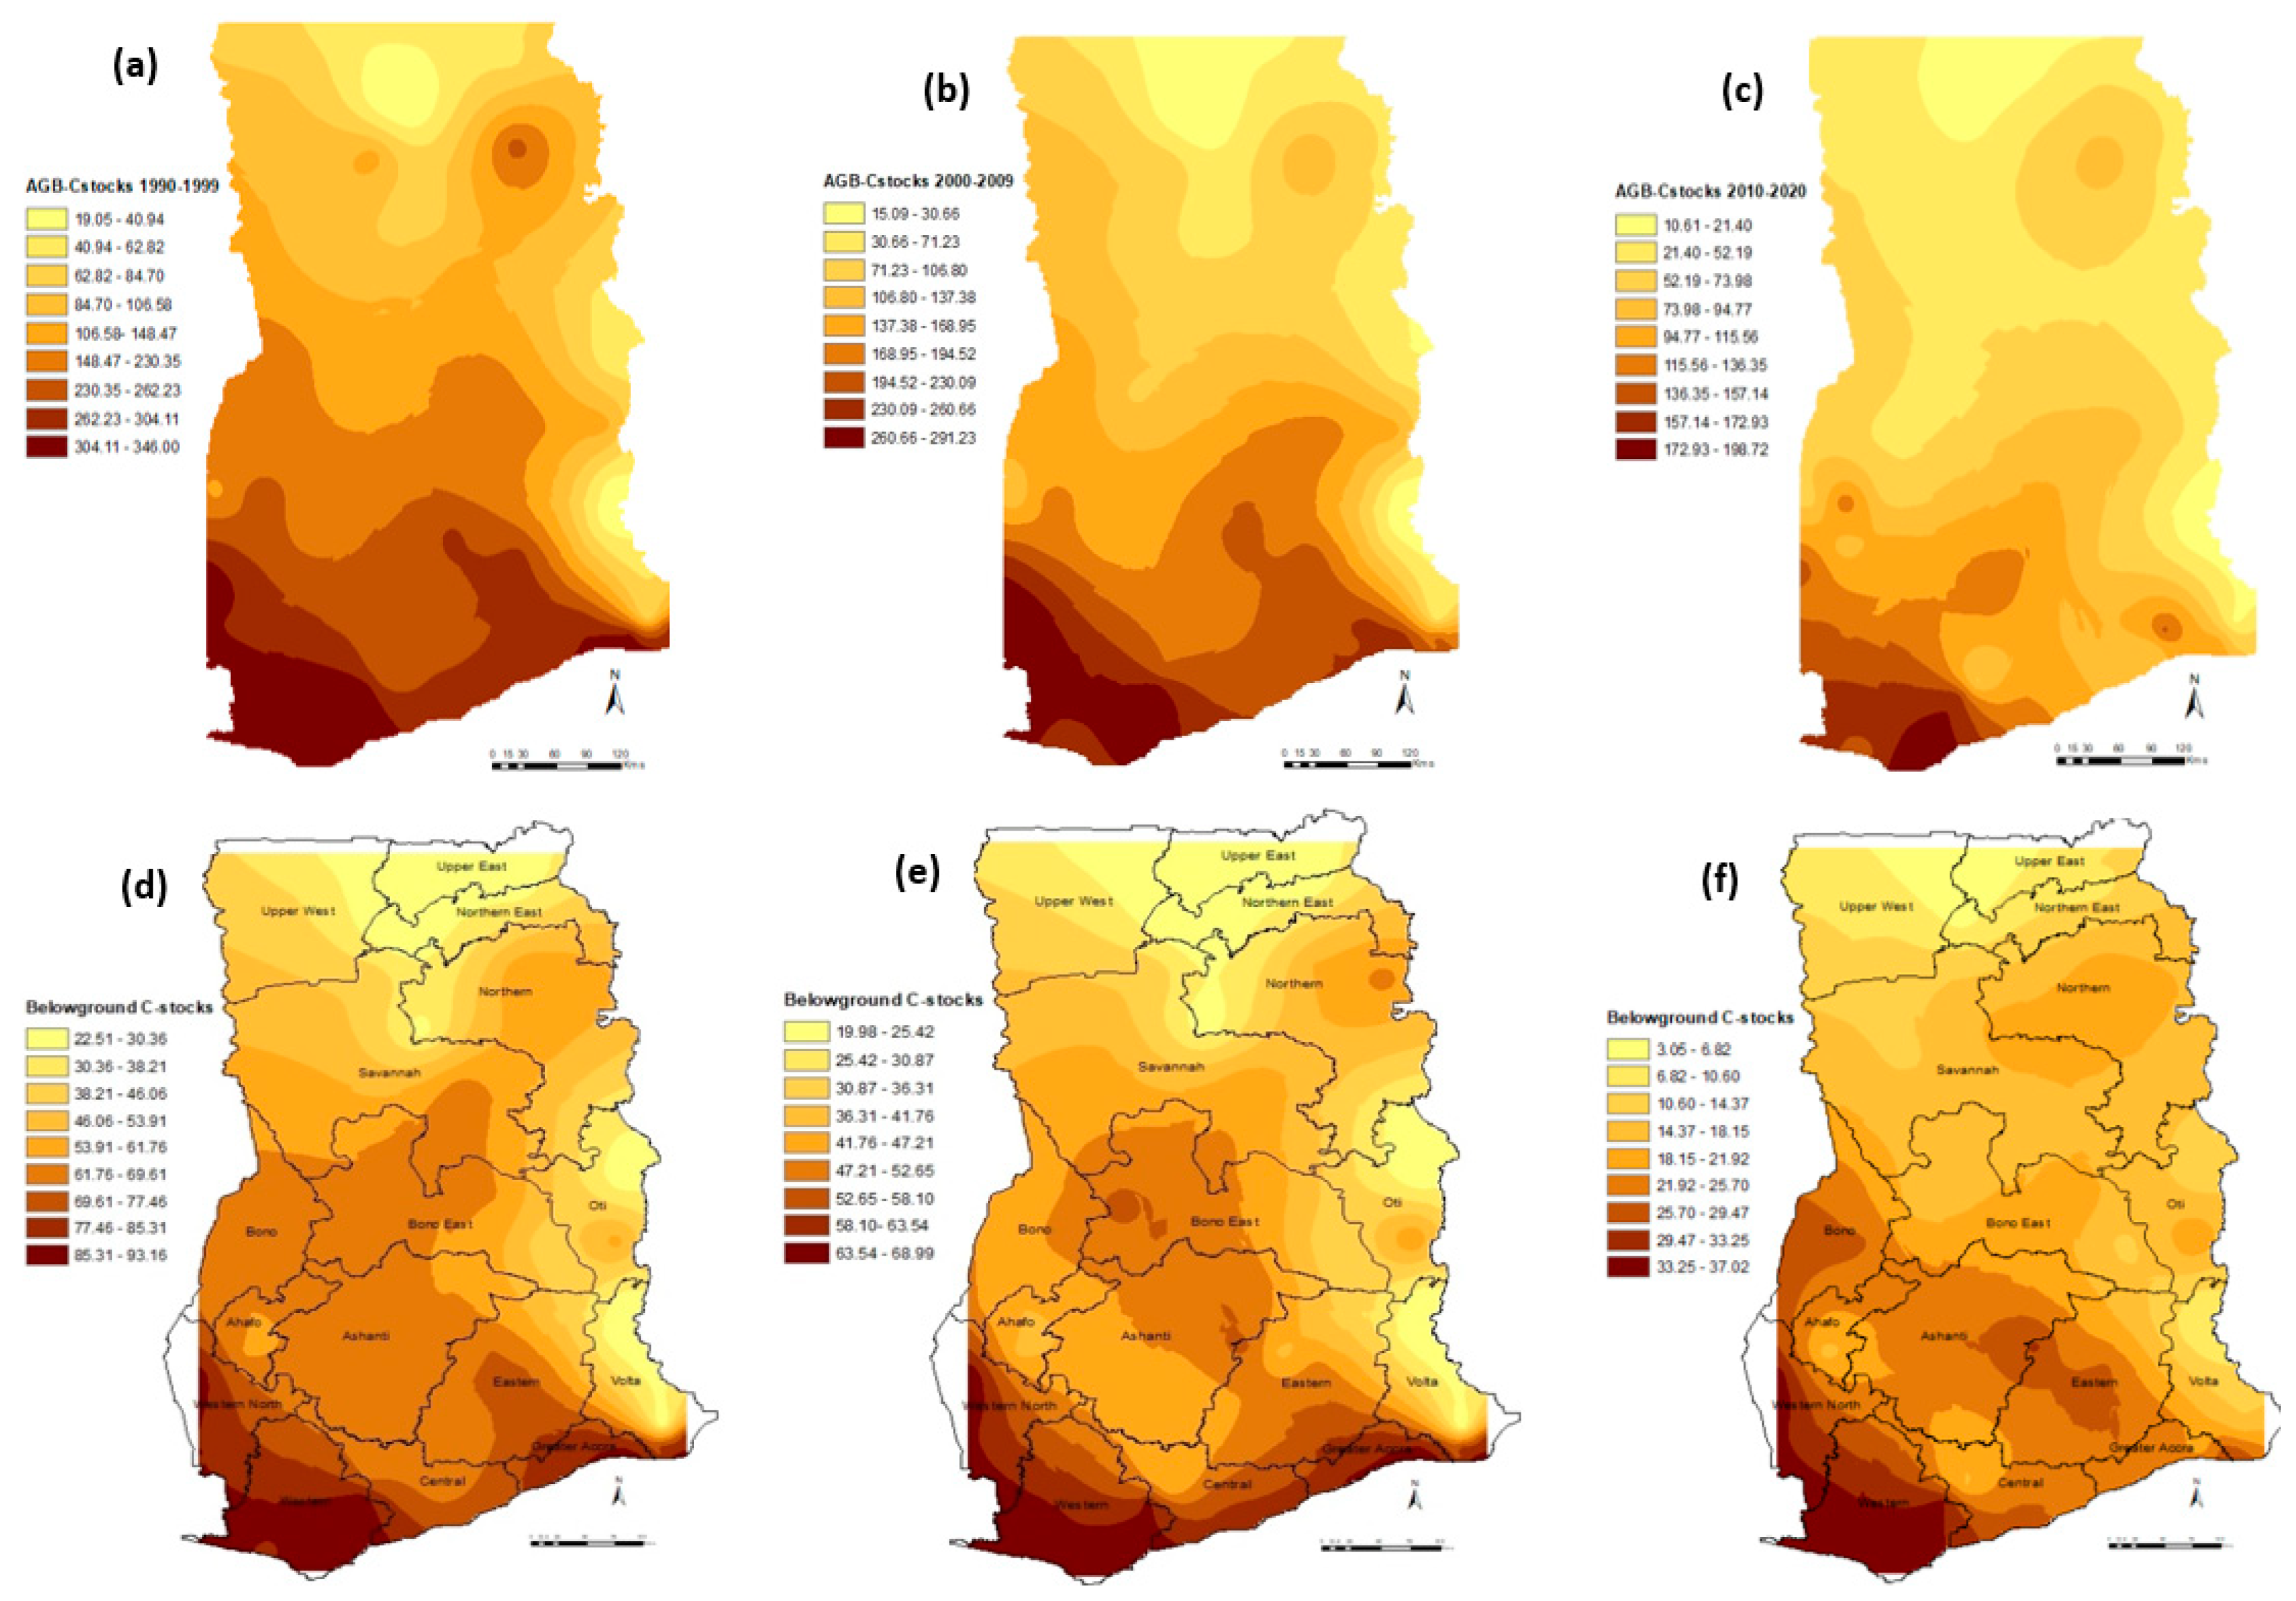
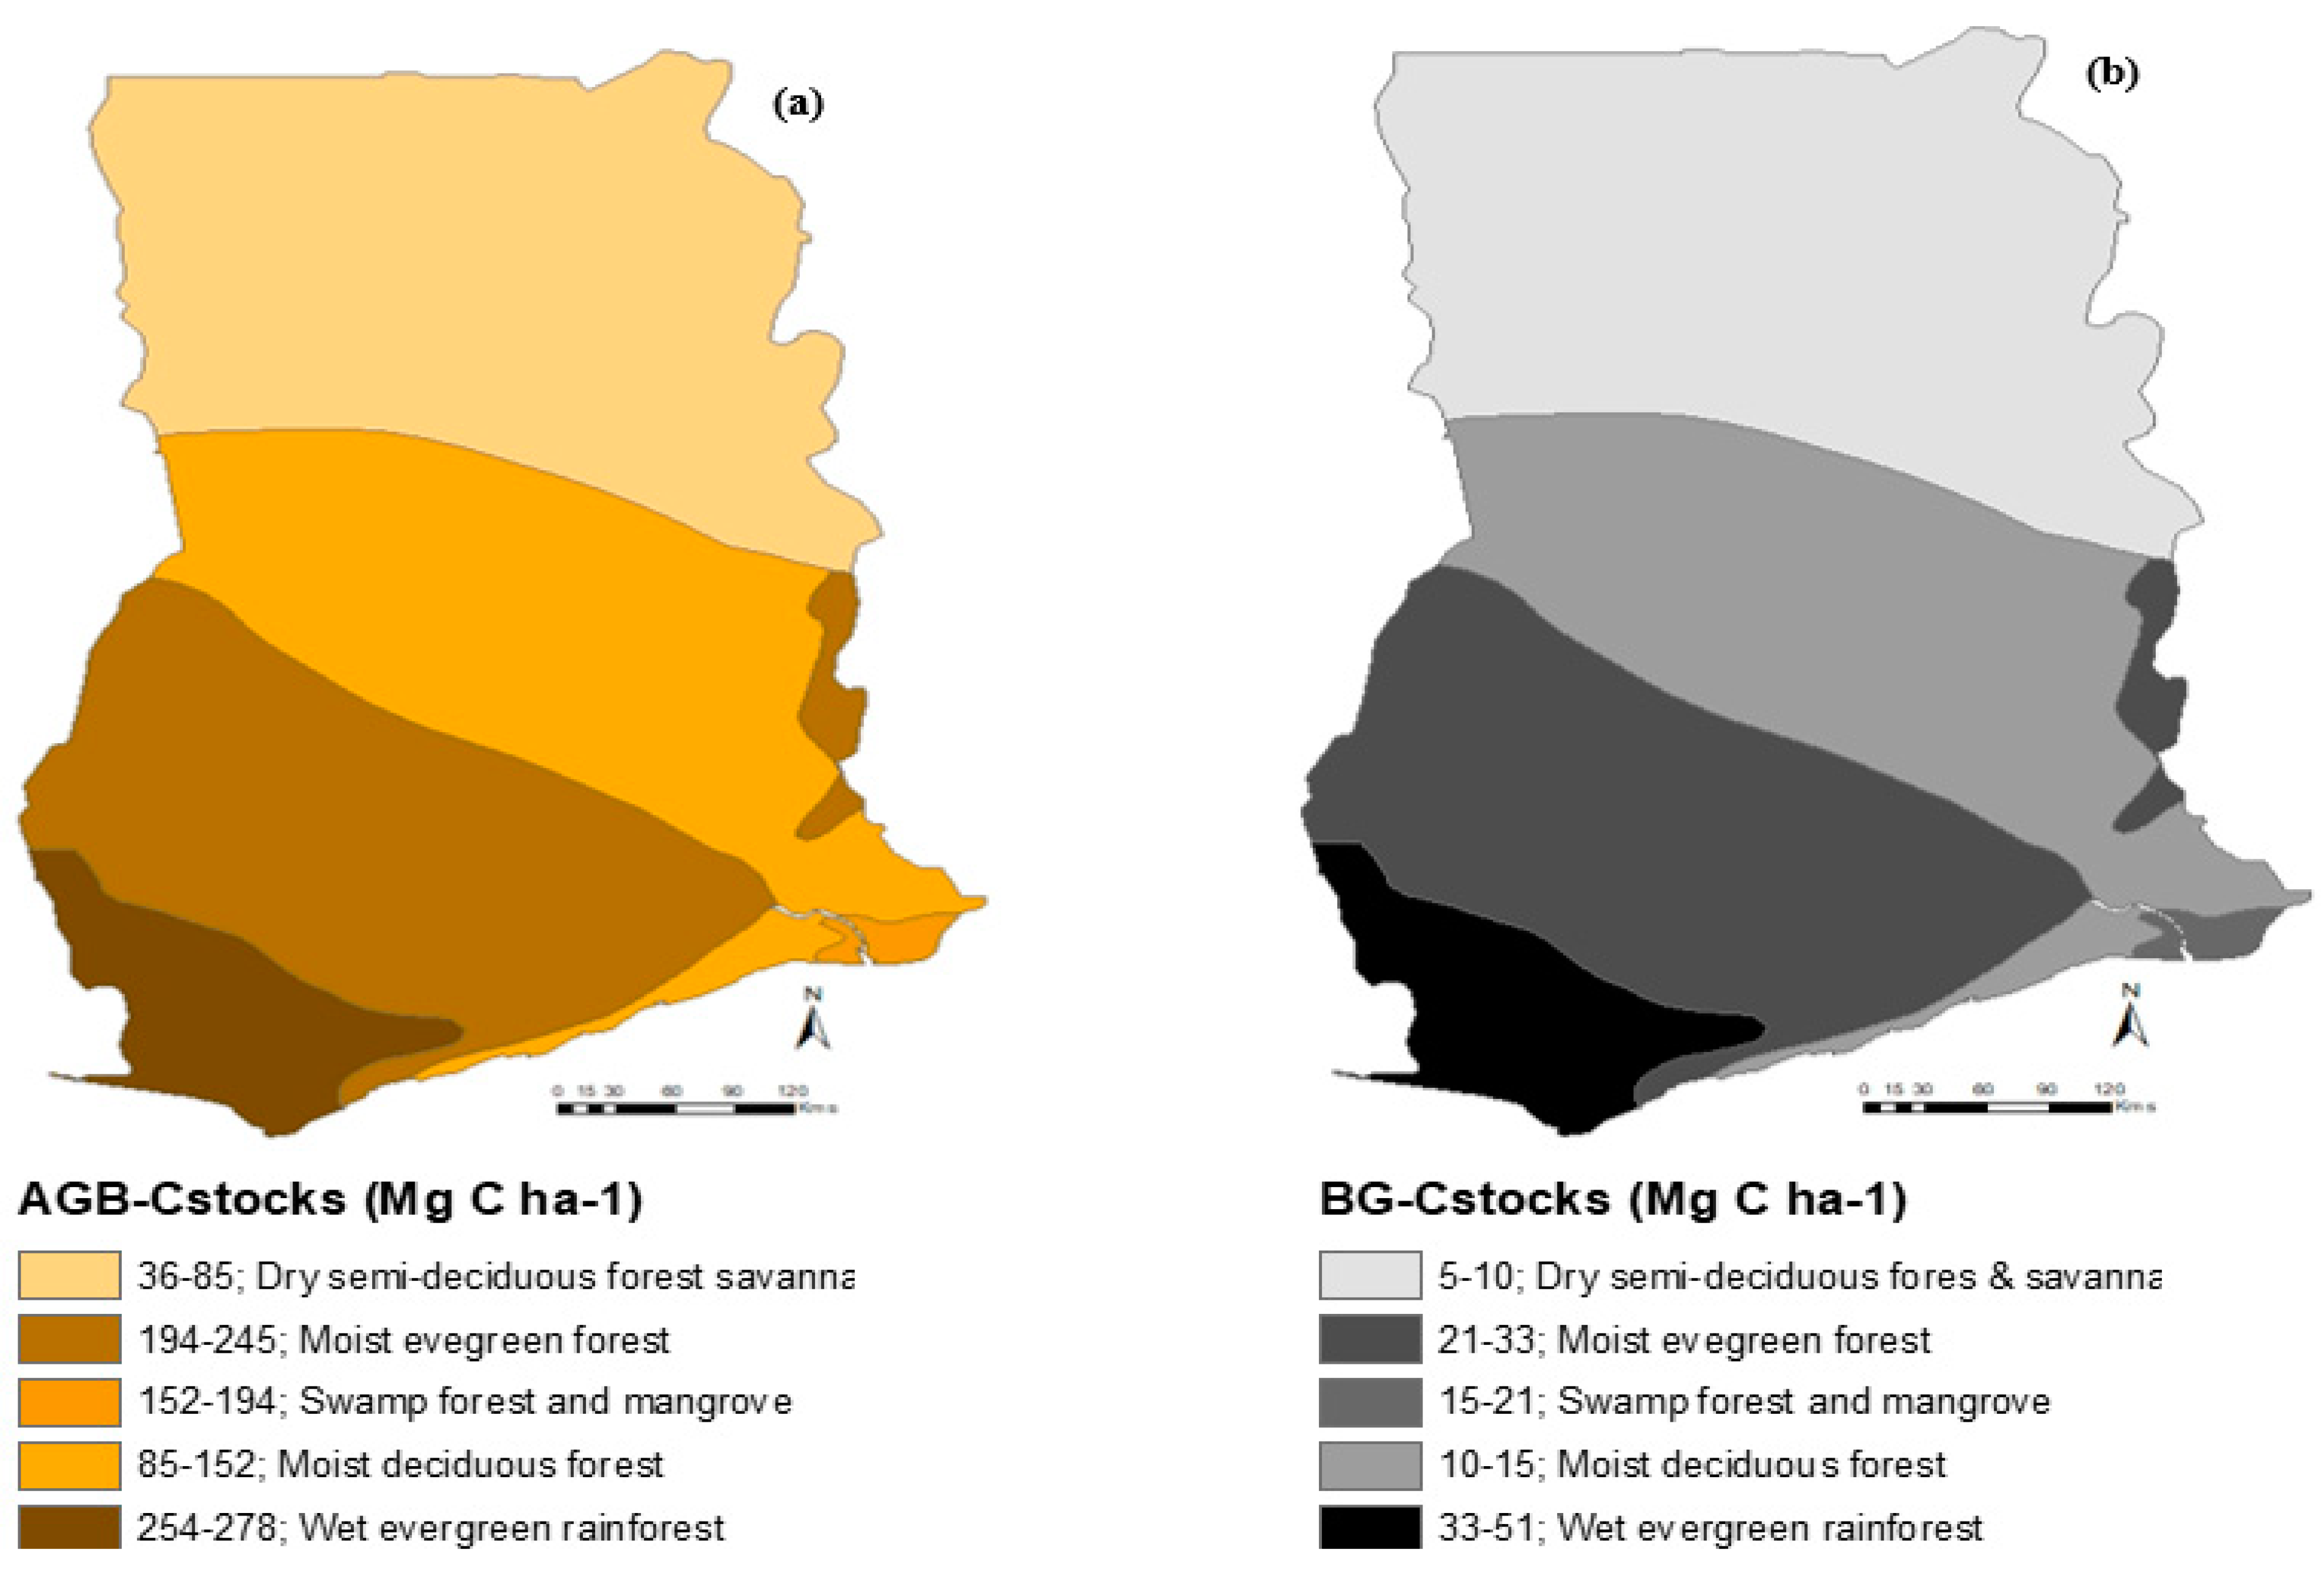
Land use-cover is an essential regulator of C stocks and shifts from one LUC type to another might cause large C fluxes in and out of the terrestrial ecosystem, including forests. Historically, emissions from land have been responsible for a huge percentage of the cumulative human-induced CO2 emissions. However, land use-cover C emissions are no longer prominent as key forms of human perturbation of the C cycle in most regions, except in tropical developing countries like Ghana. It is in this context that this study investigated the land use-cover changes which have shown tangible transformations between 1990 and 2020 (Figure 3). Larger hectares of forest areas were recorded in 1990–1999, decade 1 (Figure 3a), than were found in either 2000–2009, decade 2 (Figure 3b), or 2010–2020, decade 3 (Figure 3c). In contrast, decade 2 and decade 3 accounted for the largest agricultural and settlement areas, which covered at least 60% of the entire area as compared with decade 1. The results from the c-stocks modeling indicated that both the aboveground biomass carbon stocks (AGB-Cstocks) and the belowground(soil) carbon stocks (BG-Cstocks) varied significantly in space and time (Figure 4). For example, the AGB-Cstocks in decade 1 (1990–1999), decade 2 (2000–2009), and decade 3 (2010–2020) ranged from 19.1–346 Mg C ha−1, 15.1–291.2 Mg C ha−1, and 10.6–198.7 Mg C ha−1, respectively (Figure 4a–c). On the other hand, the belowground carbon stocks ranged from 22.5–93.2 Mg C ha−1, 19.9–68.9 Mg C ha−1, and 3.1–37.0 Mg C ha−1 for decade 1, decade 2, and decade 3, respectively (Figure 4d–f). The study further demonstrated that both the AGB-Cstocks and the BG-Cstocks were higher in the moist evergreen and the wet evergreen forest belts relative to the other forest-vegetation belts (Figure 4). Generally, the evergreen forest-vegetation zones had highest carbon stocks; on the other hand, the AGB-Cstocks were higher than the BG-Cstocks, while the values of Cstocks for decade 1 (1990–1999) were higher than those for decade 2 and decade 3. The Cstocks in both the aboveground and belowground decreased every decade. This decrease could be attributed to several reasons, including rapid changes in land use-cover, increases in population, and expansions in agriculture [85,86,87,88]. Consistent with this study, other researchers observed a regular change in land use-cover in recent decades relative to past decades, especially in developing nations [57,89,90,91]. These transitions were attributed to population growth, commercialized agriculture, and unregulated severe deforestation [85,88]. For instance, deforestation was considered the primary cause of land use-cover change in tropical settings, and is typically a consequence of diverse factors, including population growth, urbanization, agricultural expansion, and logging [85]. Another study in Ghana, which aimed to identify the driving forces of land use-cover changes using a mixed-method approach, observed that rural population growth is the main driver of the changes [88]. Similarly, a study performed in the region to investigate the dynamics of LUCC in Burkina Faso between 1999 and 2011 agrees with our findings that more forest areas were found in previous decades, while the present decades have more agricultural areas due to the growing demand for food as the population increases [86]. In the western region of Ghana, which is covered by evergreen forests, Koranteng et al. [88] discovered significant changes in the landscape from 1990 to 2020. They attributed these changes to deforestation through agriculture.
The higher Cstocks found in the moist evergreen and the wet evergreen forest belts relative to the other forest-vegetation belts could be attributed to the dense vegetation prevalence in these evergreen forest zones. Studies reported larger Cstocks in dense vegetations due to the higher pools of carbon that were obtained through increased photosynthetic and organic matter mineralization processes, especially in the tropical regions [92,93,94].
Globally, studies have revealed that carbon stocks are substantially influenced by the changes in land use-cover caused by agriculture, mining, urbanization, and other drivers of deforestation [35,95,96,97,98,99]. For example, Bruinsma [95] reported that the increase in cropping intensification had large effects on soil carbon stocks worldwide. Soil carbon stocks are rapidly released into the atmosphere under constant land use changes, and this has with other environmental implications. Anderson-Teixeira et al. [96] observed that the conversion of forest land to biofuel agriculture resulted in significant carbon loss, an effect that was most pronounced when native forest land was converted to sugar cane agriculture. In Ghana, it was discovered that a corn residue harvest (at 25%–100% removal) consistently resulted in carbon losses averaging 3–8 Mg ha−1 in the top 30 cm of the soil, which is the cropped layer of the soil [99].
3.2. Drivers of Forest Loss and Carbon Fluxes
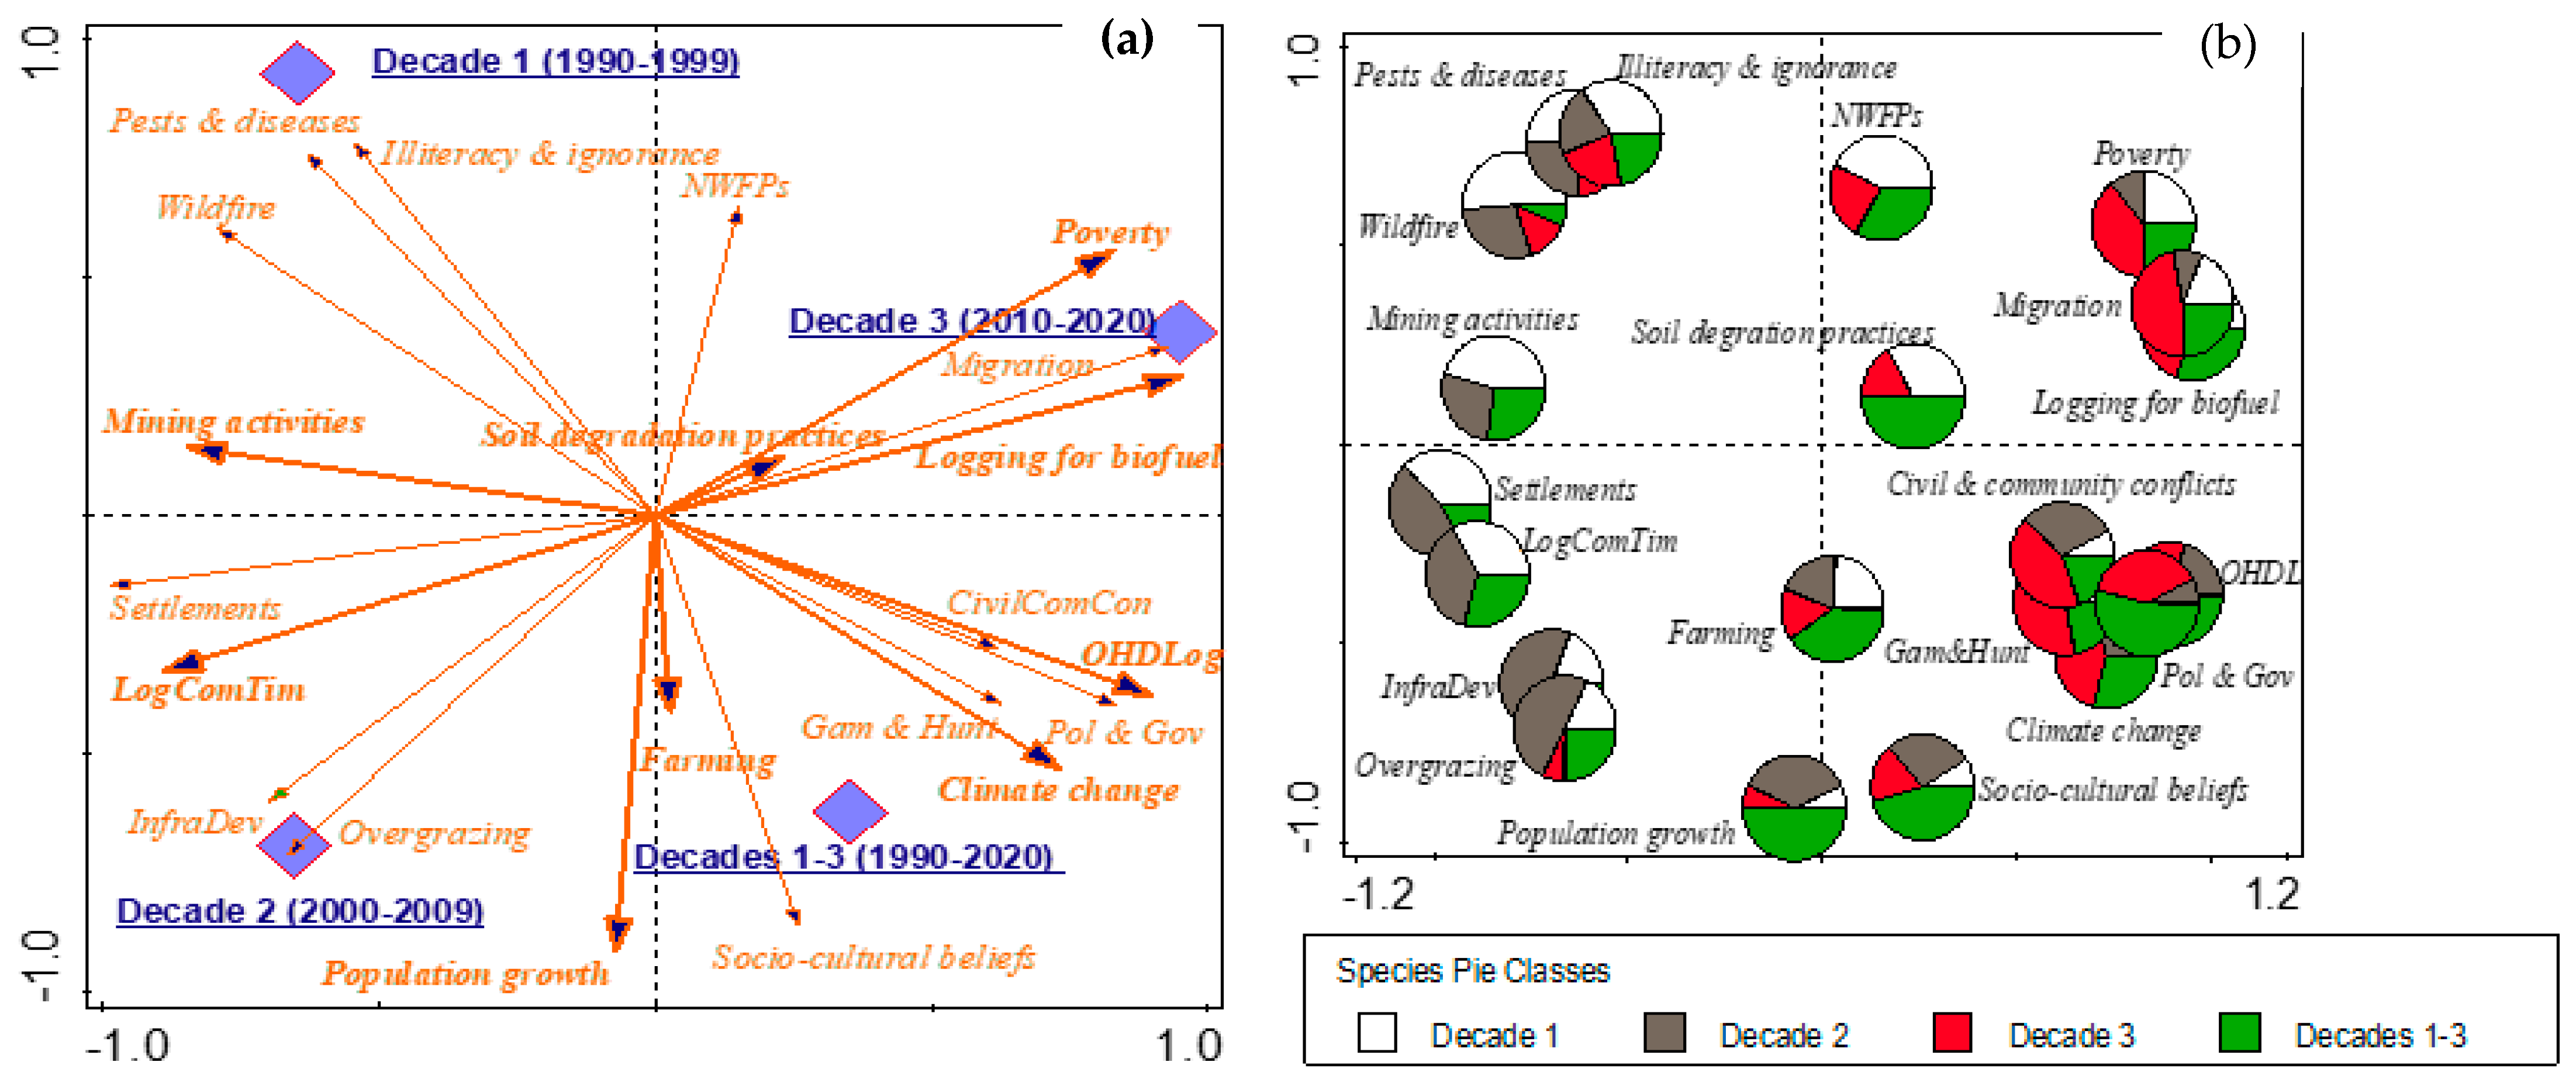
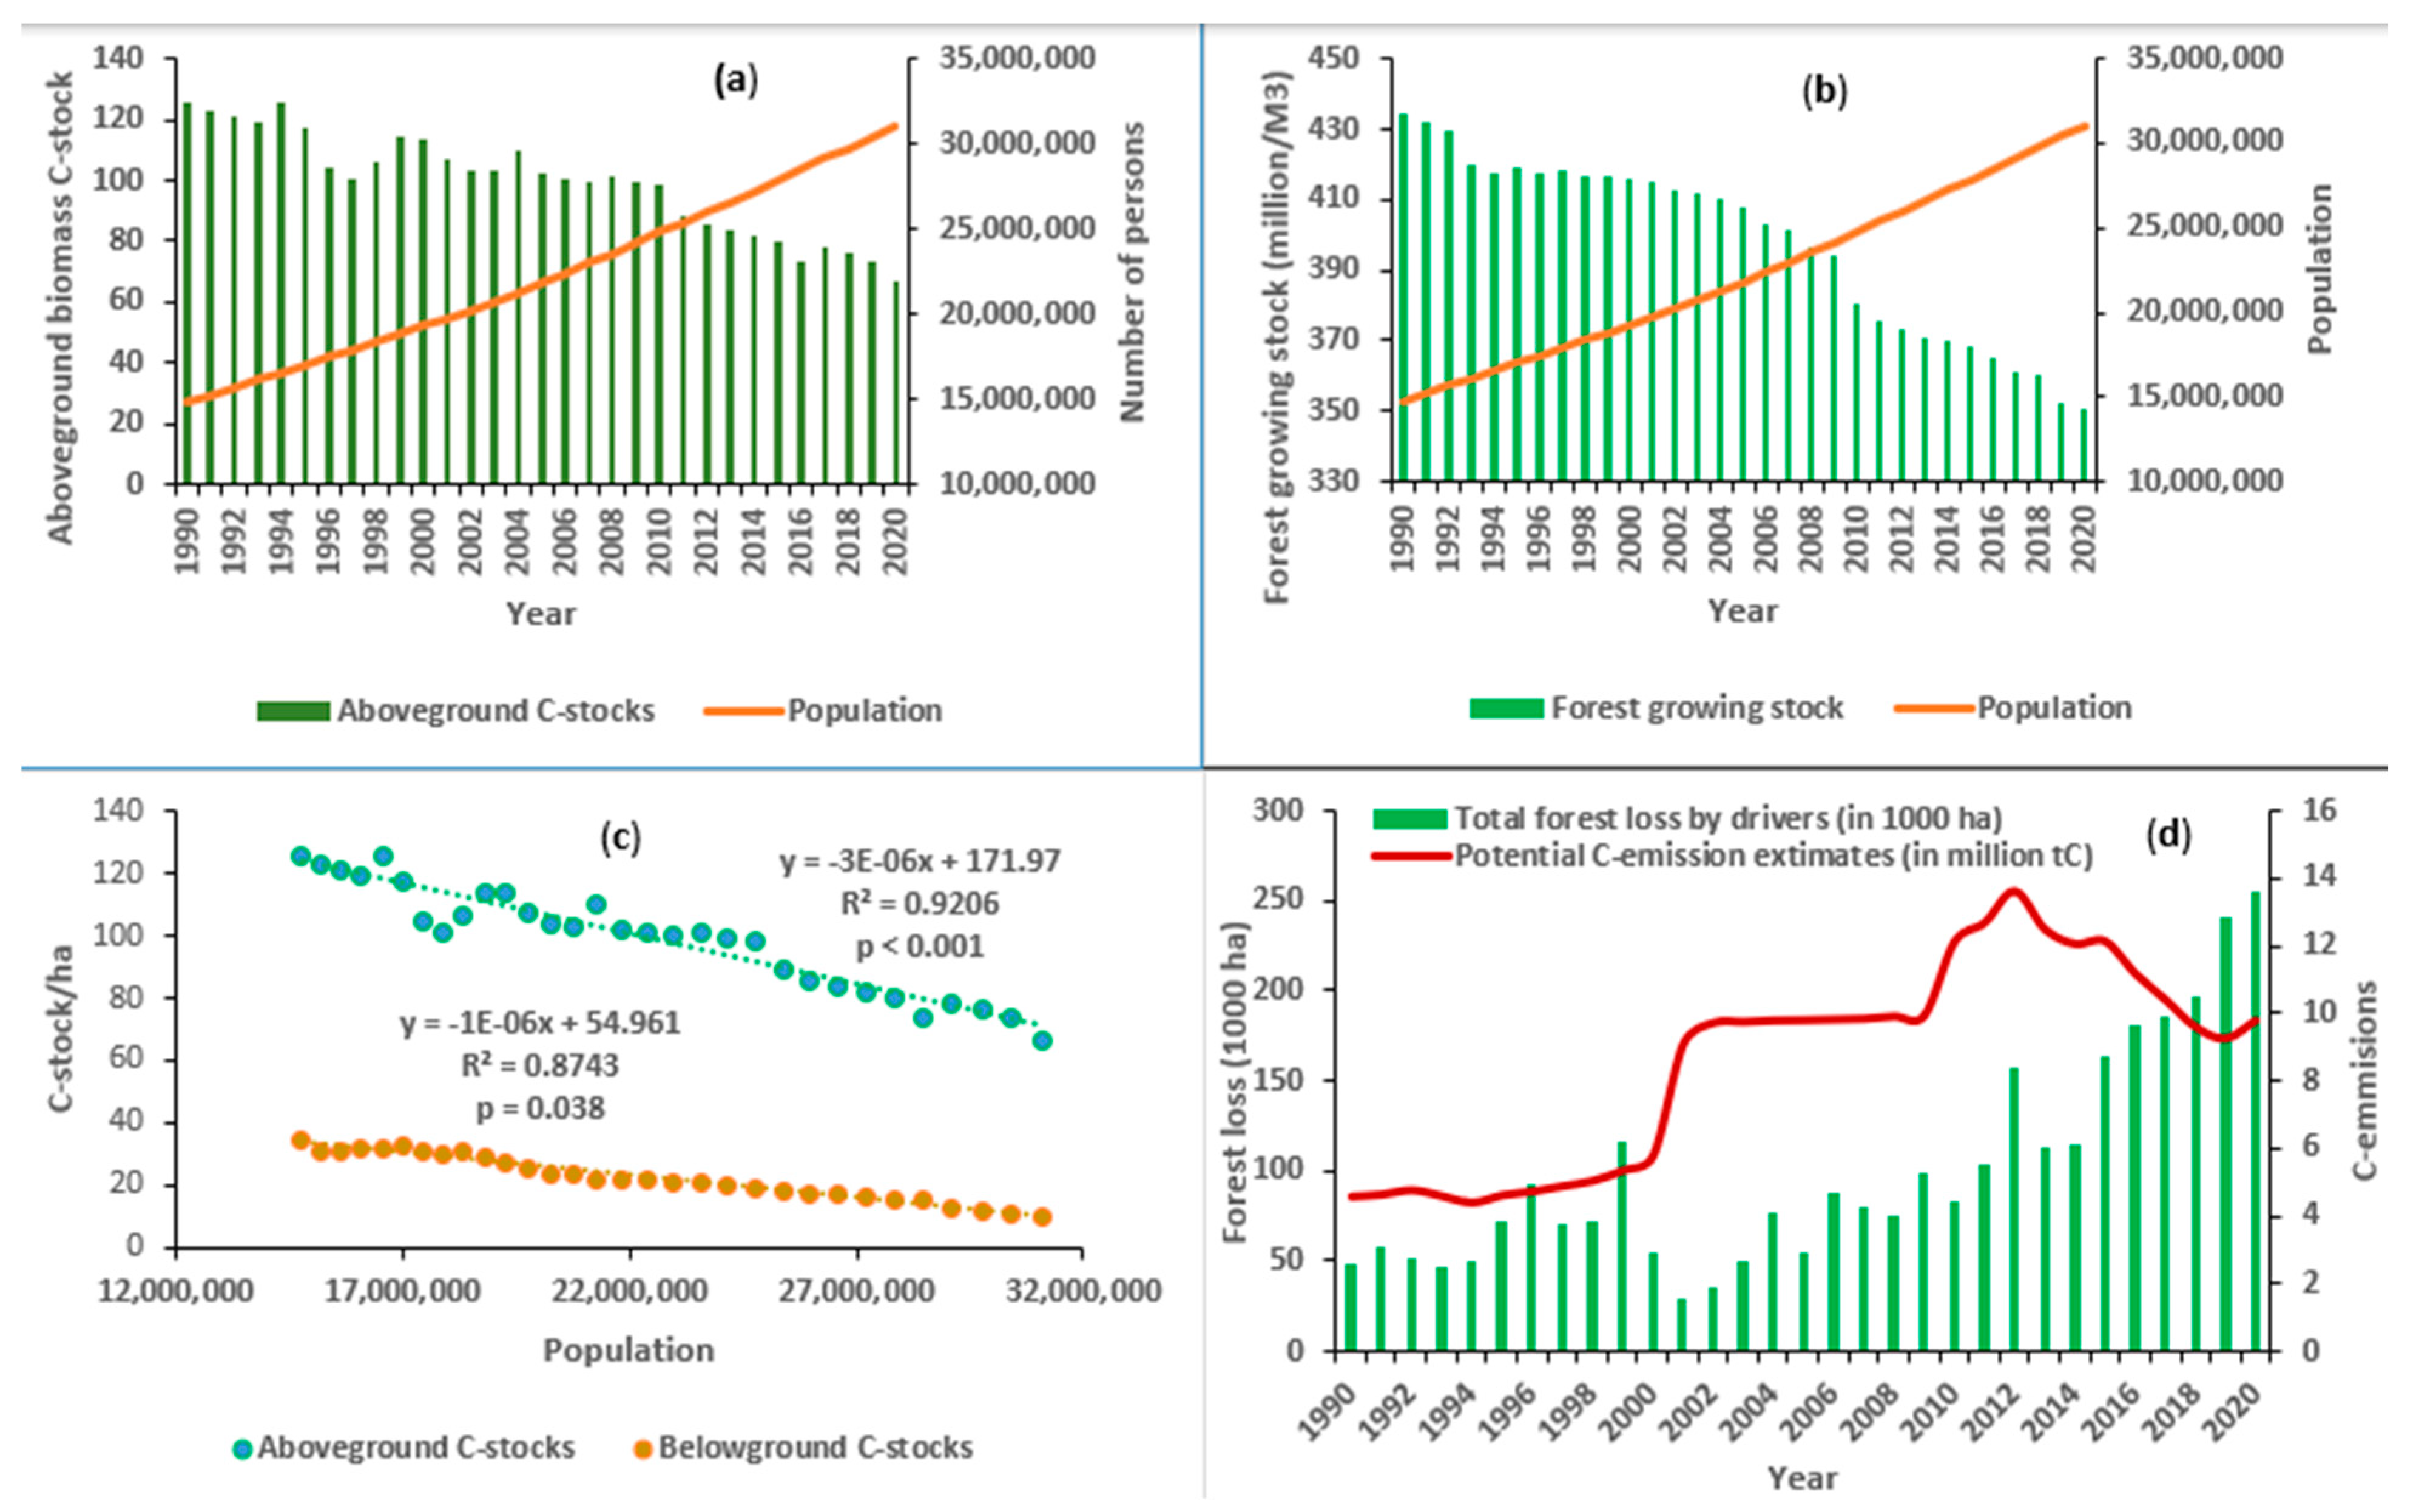
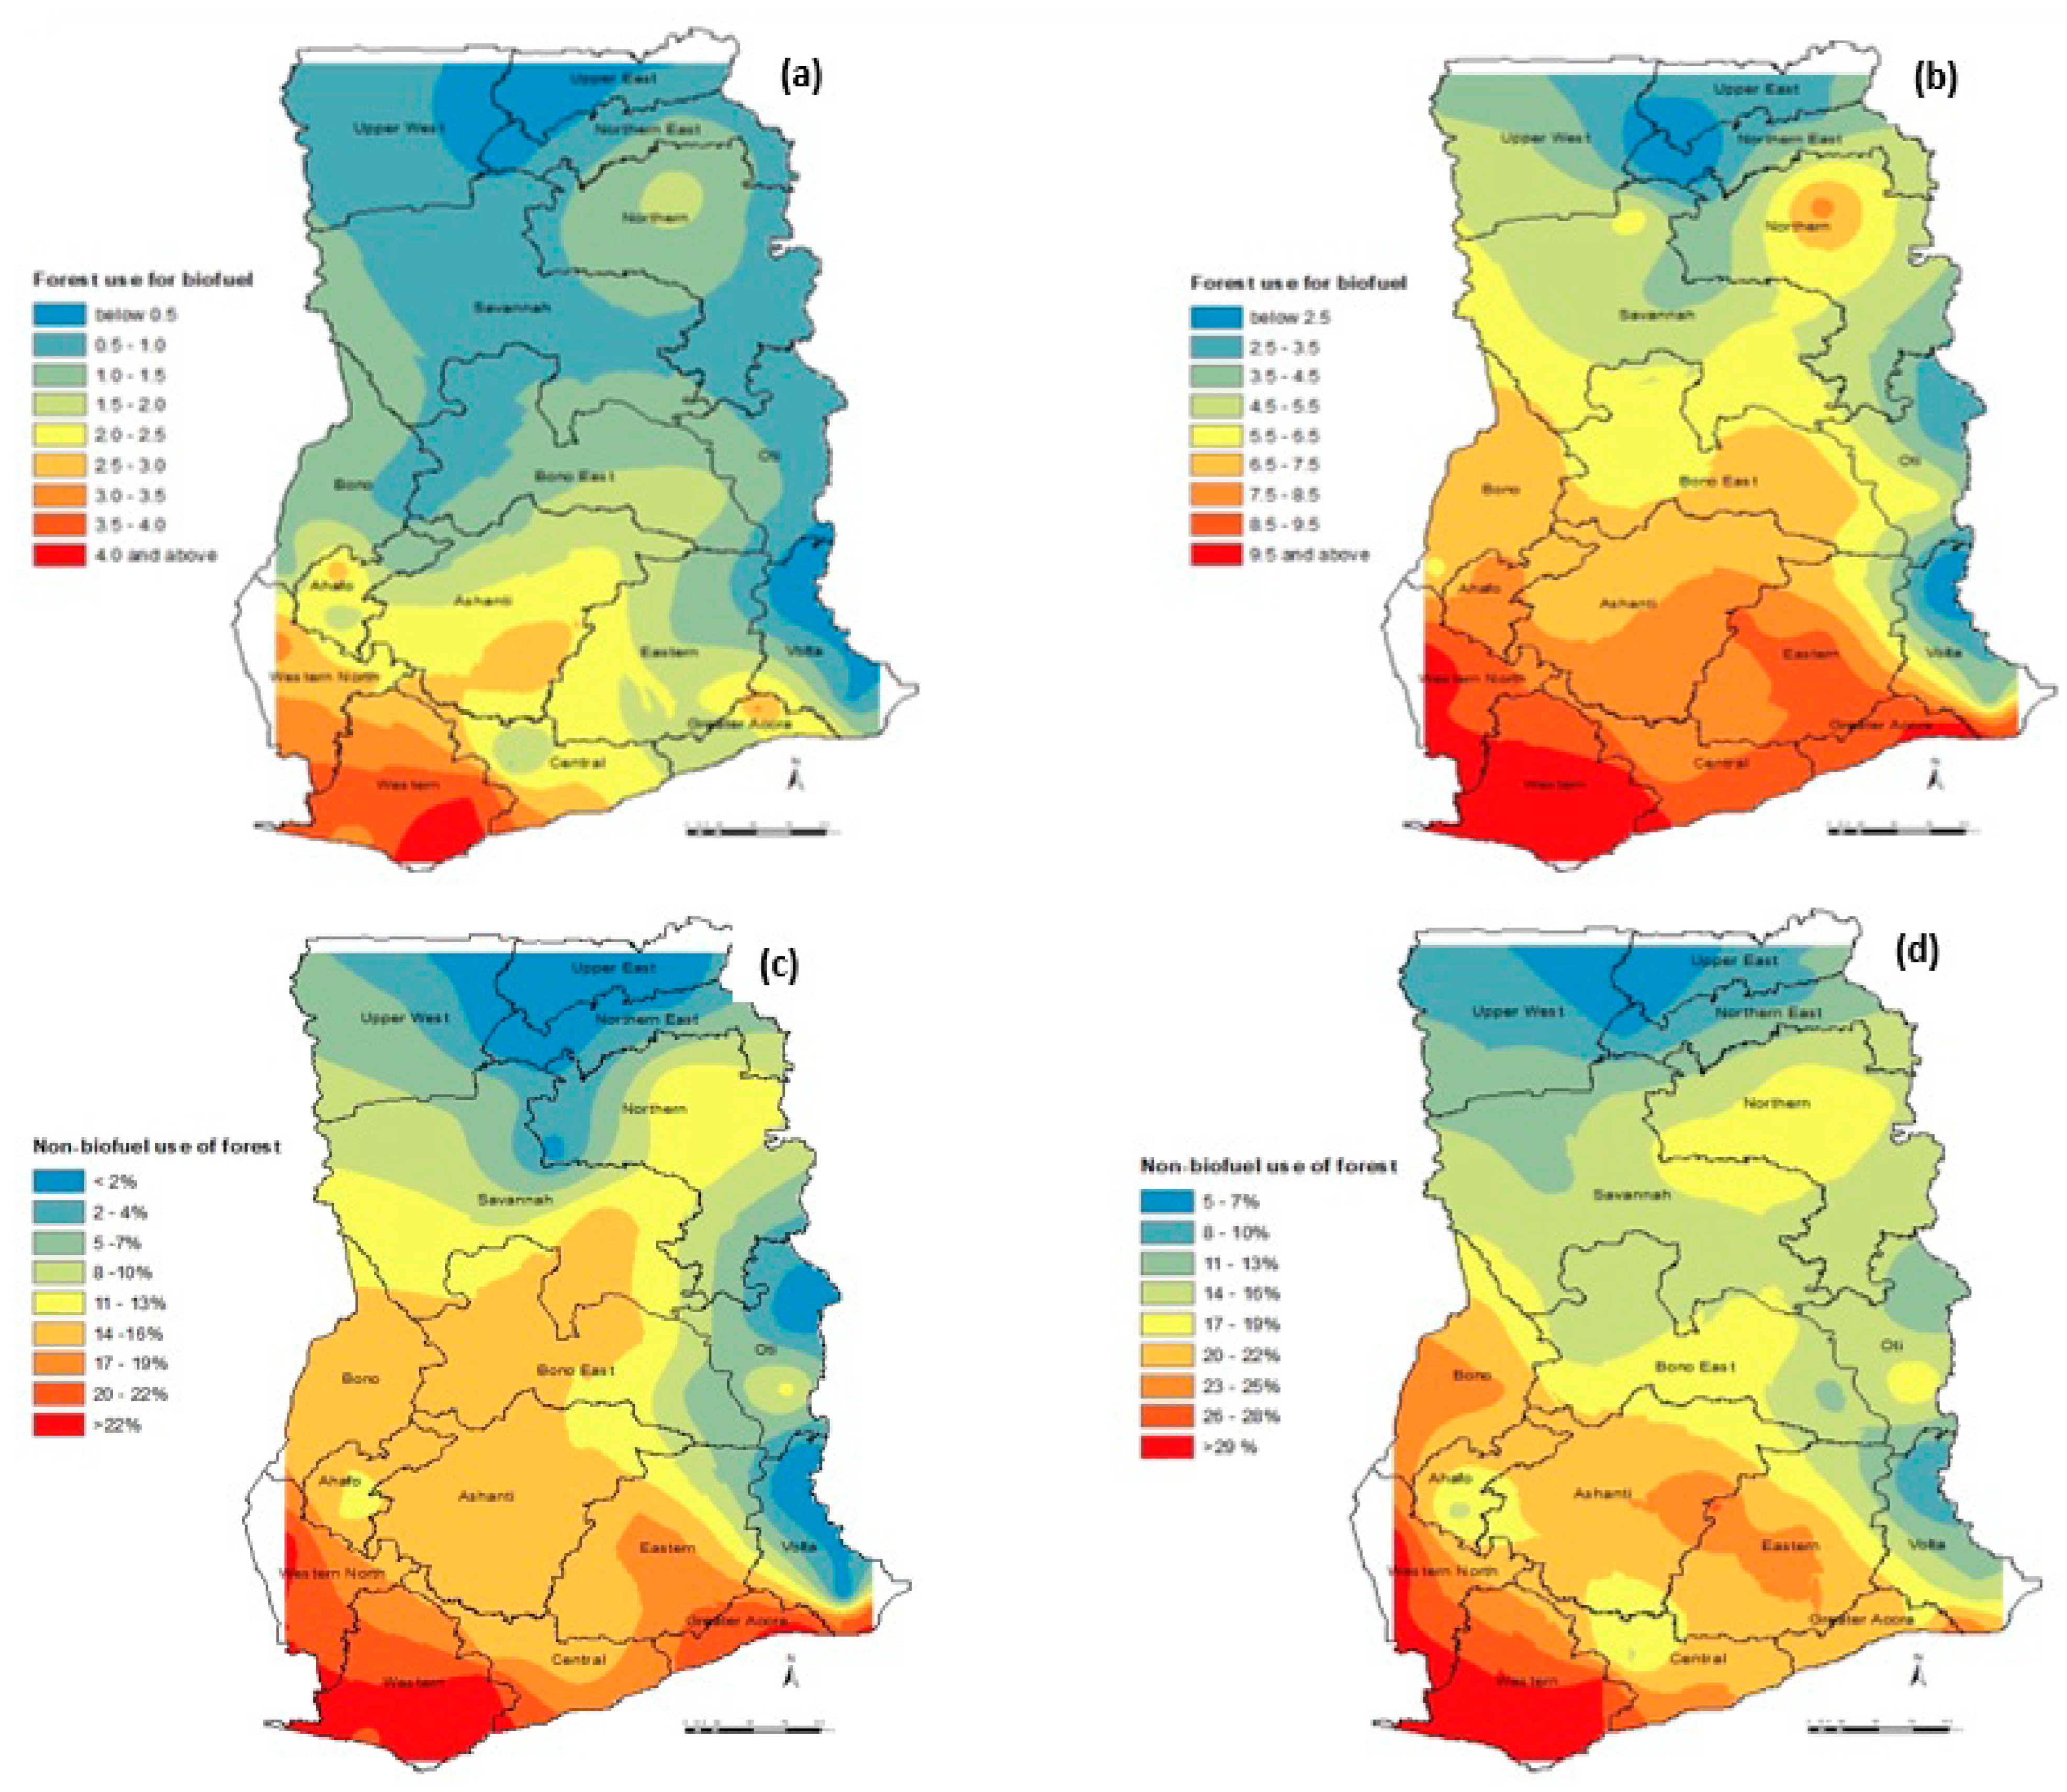
The study discovered that sustainability in the forest bioeconomy has been negatively impacted in Ghana by many drivers of carbon stocks and deforestation during the three decades of investigation (Figure 5). Although all the drivers had significant effects on carbon fluxes, some of the drivers had a higher impact than others. The study found that population growth, climate change, farming, poverty, logging for biofuel, mining activities, logging for timber, soil degradation practices, and forest logging for other household purposes (Figure 5a) had higher impacts on carbon fluxes and forest loss, which consequently affected SFB. Furthermore, the effects of some of these drivers were significant in all three decades. For example, politics and governance accounted for 57% of the impacts in 1990–2020 (decades 1–3), while population growth (50%), soil degradation practices (50%), and socio-cultural beliefs (45%) were other long-term drivers of carbon fluxes (Figure 5b). This finding was supported by subsequent results which indicated that, during the study periods, the forest total carbon stock decreased by about 5 t C ha−1yr−1, forest growing stock decreased by about 2.5 million M−3 yr−1, and the population increased by 2 million persons per year (Figure 6a,b). In addition, significantly strong correlation coefficients were observed between the population and AGB-Cstocks (R2 = 0.921; p < 0.001) and BG-Cstocks (R2 = 0.874; p = 0.038) (Figure 6c). Furthermore, the study revealed that forest loss caused by these drivers increased with an increase in carbon emissions, especially in the last 10 years (i.e., decade 3) (Figure 6d). An increase in the use of forest as a source of biofuel and non-biofuel between 1990 and 2020 might have been one of the primary drivers for forest loss and the increase in carbon emissions (Figure 7). The result showed that the use of forests for biofuel and non-biofuel increased by more than 50% between 1990–1999 and 2010–2020. This has many causes (increase in population, expanded farming, and a higher demand for food, fodder, and energy) and effects (decline in forest area, growing stock, carbon sinks, and an increase in carbon emissions). Globally, several authors have reported a strong relationship between population growth, forest growing stocks, carbon stocks, and carbon emissions [100,101,102,103,104,105,106]. A similar study in Afghanistan reported that the growth in population from 1993 to 2020 caused an increase in the demand for food and fuelwood, which led to an increase in forest loss and carbon emissions but a decrease in carbon stocks [105].
Consistent with our findings, Cui et al. [102] found that the drivers of carbon sources increased by almost threefold (23,983.7 × 104 t) in the Beijing–Tianjin–Hebei (BTH) region from 1990 to 2015, whereas carbon sinks have declined rapidly, to one-eighth of the original amount (84 × 104 t), since 1995. Similarly, another study in China observed that the total quantity of carbon stocks decreases by 0.2% with an increase in the annual carbon emissions due to land use changes induced by drivers of forest loss [107]. In Pakistan, the temporal change in forest cover and carbon stock, and trends in corresponding carbon sequestration and emissions, from 1989 to 2018 were estimated. It was found that forest cover and carbon stocks decreased with an increase in carbon emissions from 1989 to 1999, but after 1999, a change in land use policies promoted forest cover and forest carbon stocks, which, in turn, produced low carbon emissions from 2000 to 2018.
Contrary to our study, a study in rural China by Zhang et al. [106] observed that depopulation (−14 million people yr−1) led to extensive AGB-Cstocks of 0.28 PgC yr−1 between 2002 and 2019. This could be explained by a decrease in the population with good living standards in rural China, while, in Ghana, the rural population grows with the growing rate of poverty, thus leading to deforestation and carbon losses. Similarly, a study in Malaysia concluded that accelerated reforestation and afforestation can enhance carbon stocks and reduce emissions, and, in turn, lead to a sustainable forest bioeconomy [104], but this is difficult to be achieve this in Ghana because of the geometrically growing population.
3.3. Forest Species and Forest-Vegetation Zones
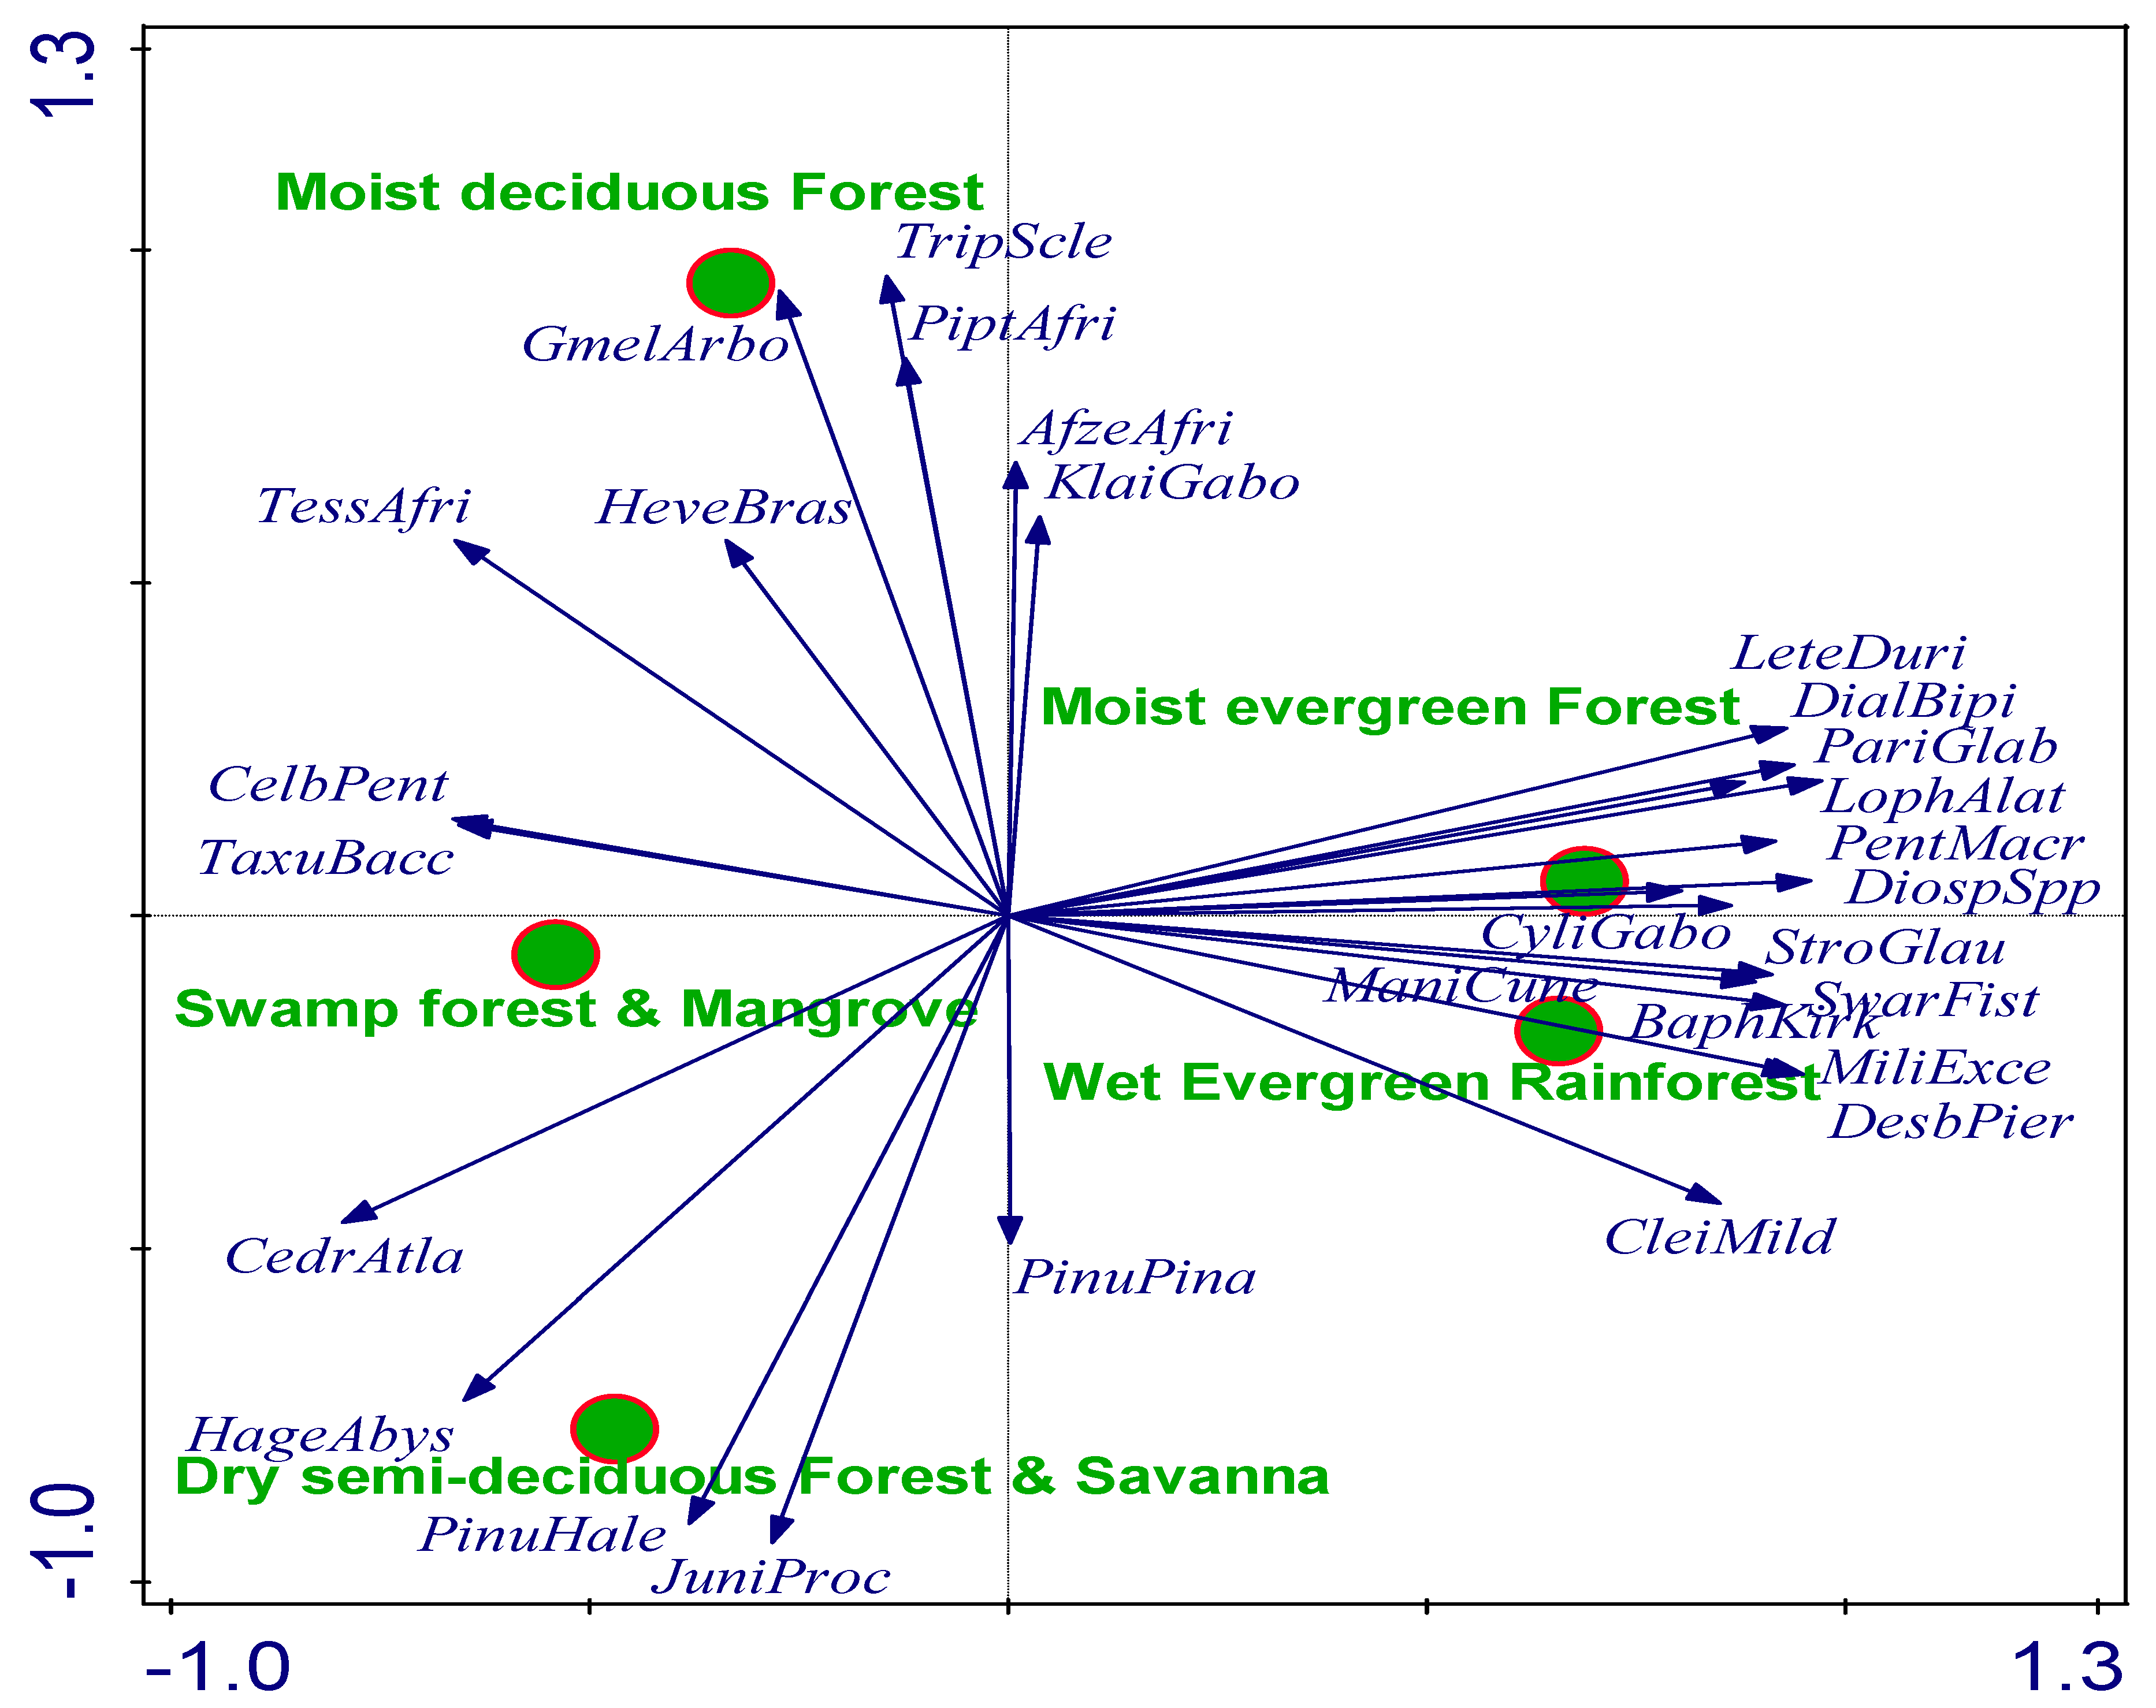
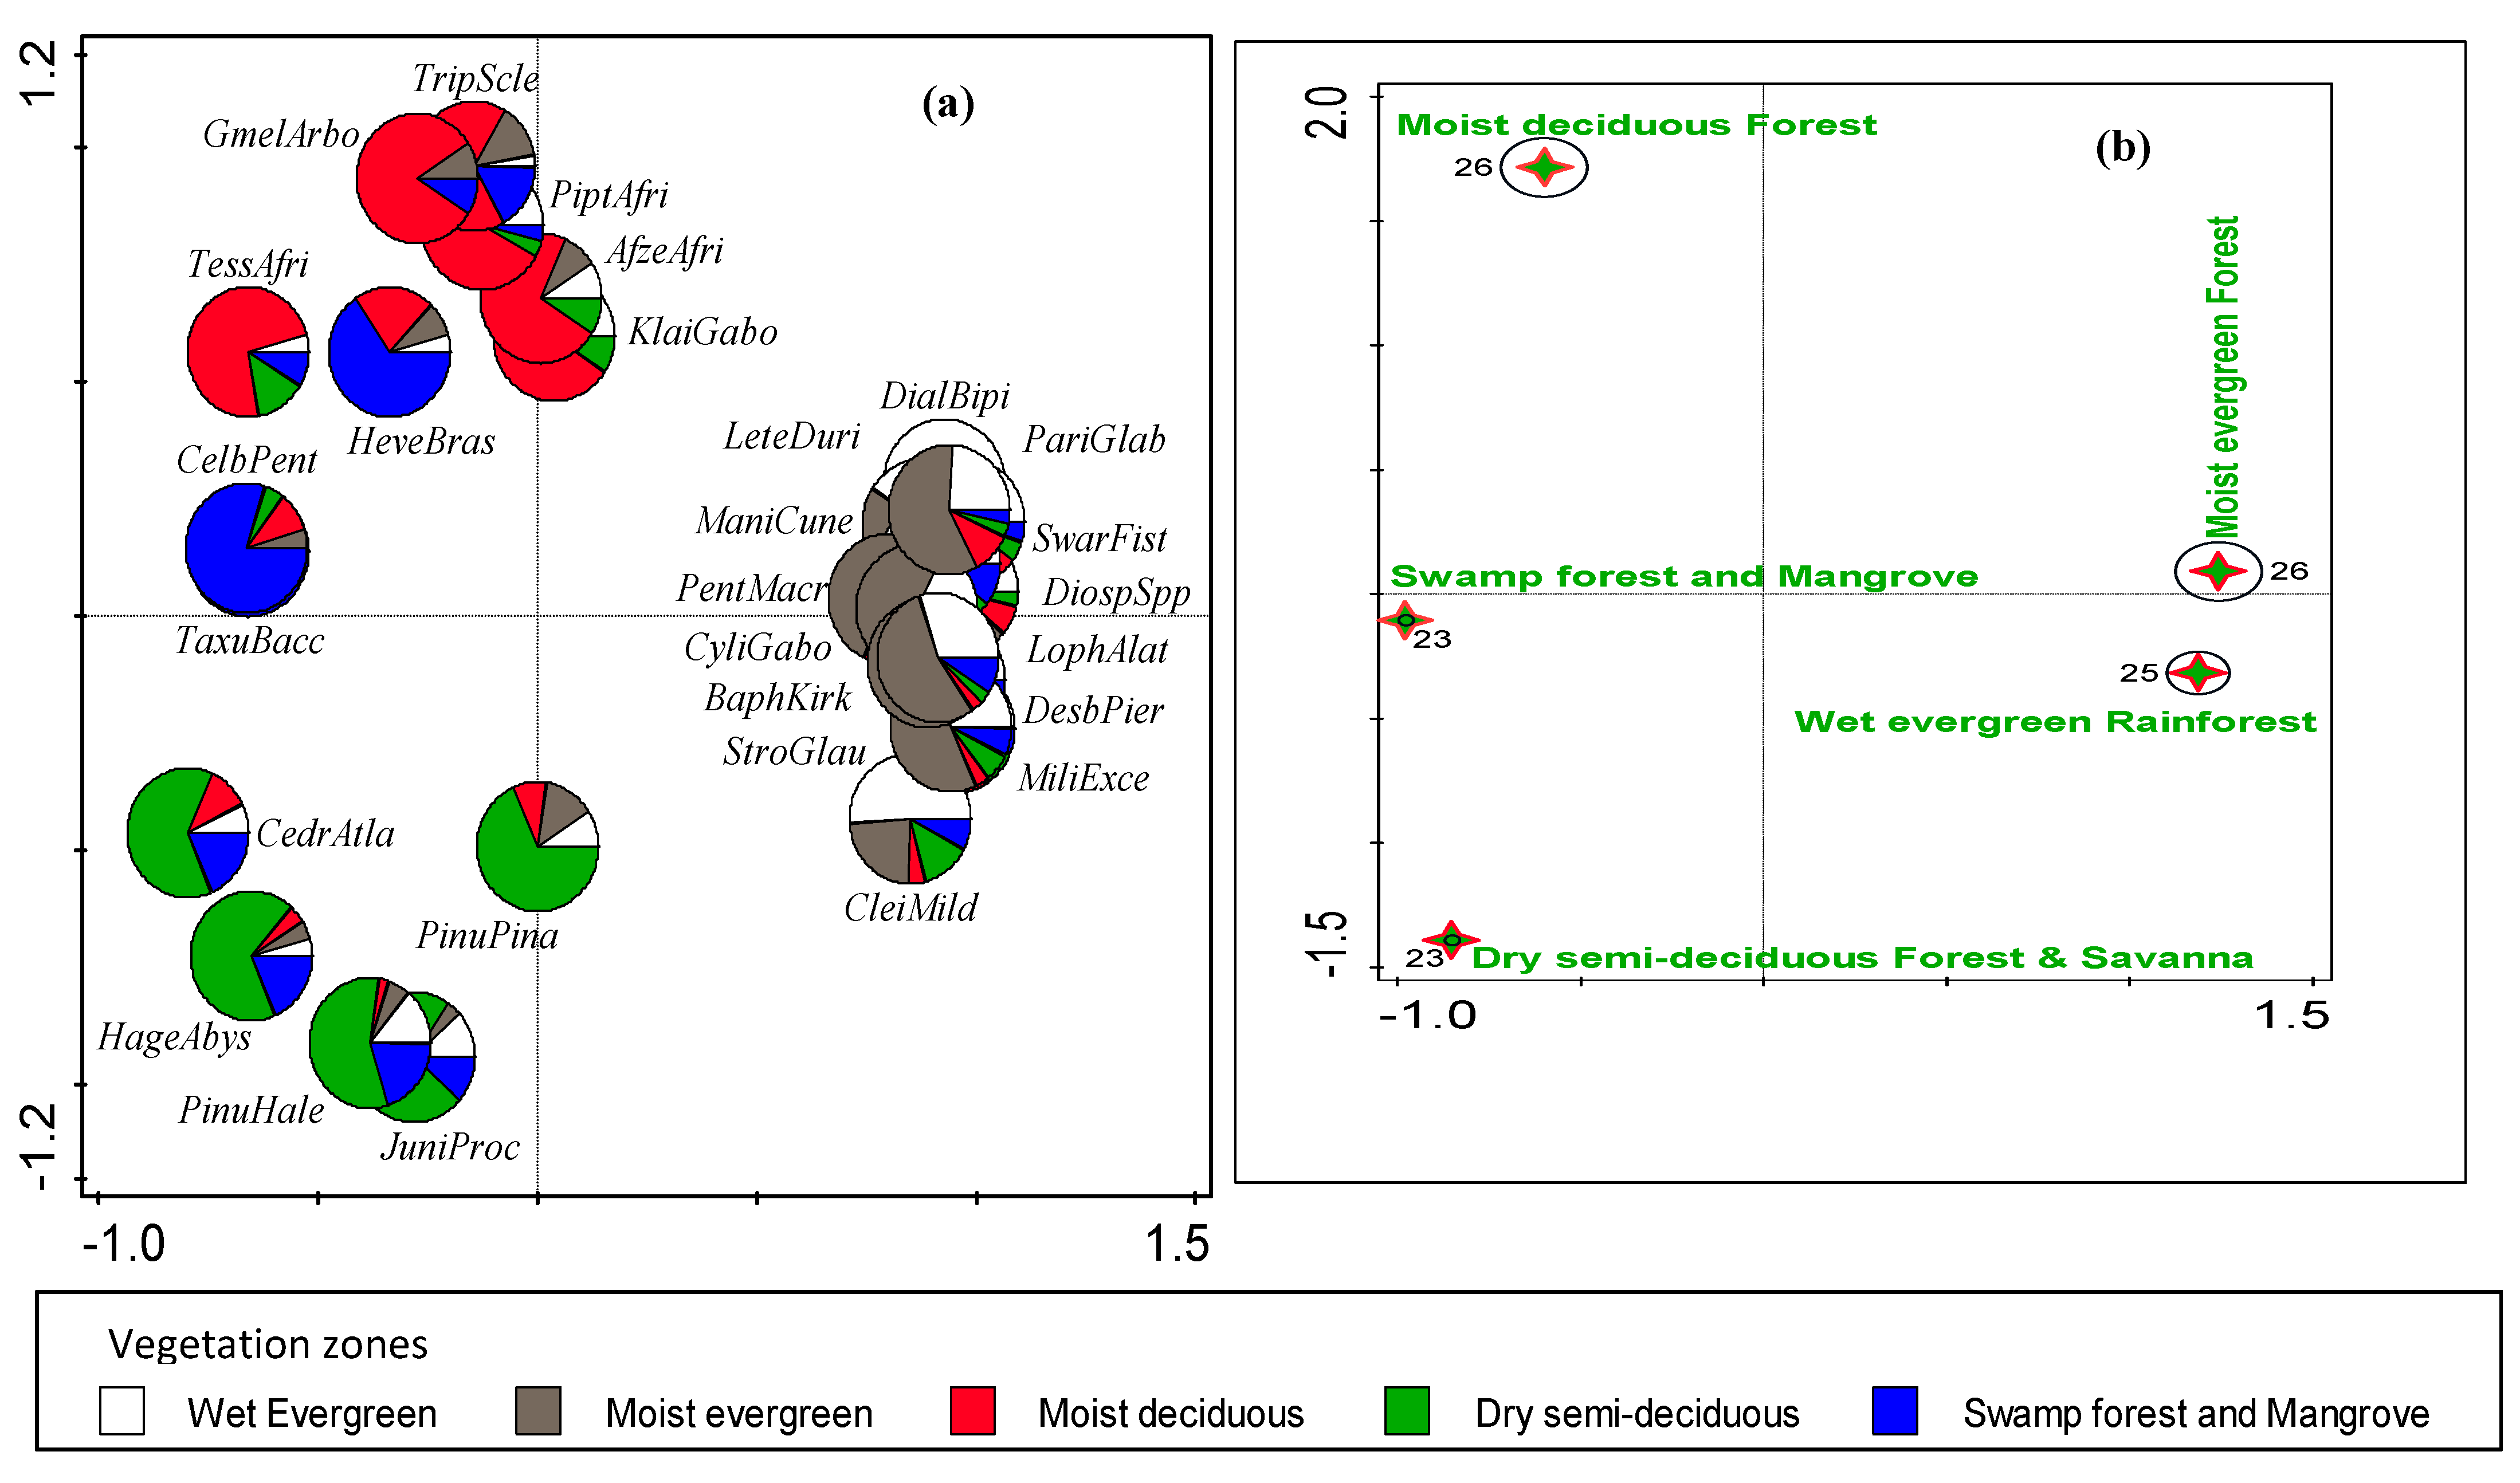
The influence of forest-vegetation zones and forest tree species on forest growing stocks and carbon fluxes is crucial to understanding the forest bioeconomy [36,108]. Our study indicated that the evergreen forests had more tree species than the other forest-vegetation zones that were investigated (Figure 8 and Figure 9a,b). The presence of Dialium bipindense, Diospyros spp., Pentaclethra macrophlla, Letestua durissima, Lophira alata, Milicia excels, Baphia kirkii, Cleistanthus mildbraedii, Cylicodiscus gabonensis, Desbordesia pierreana, Manilkara cuneifolia, Parinari glabra, Strombosia glaucescens, Tessmania africana, Klainedoxa gabonensis, Afzelia Africana spp., and Piptadeniastrum africanum was important. In a recent study, Fleiss et al. [36] identified the relevance of these hardwood species to the forest bioeconomy in Africa because of their potential to increase growing stocks, the provision of reliable biofuel at wet and dry seasons, and their high carbon content [109]. Further, in Cambodia, similar species in the families of Caesalpinaceae, Ebenaceae, and Rosaceae such as Afzelia, Diospyros bejaudi Lecomte, Diospyros crumenata, Diospyros nitida, Diospyros helferi, and Parinarium annamensis were observed to be key determinants of the forest bioeconomy due to their high carbon stocks [100]. The presence of evergreen forests (i.e., the moist evergreen and the wet evergreen), which have more tree species than the other forest-vegetation zones enhanced Cstocks in these forest belts as compared to the savannah, as well as the swamp forest and mangrove belts [94].
A study in Zambia by Pelletier et al. [101] affirmed that the biomass gains and carbon sink were concentrated in several dominant species, including the Fabaceae, which is a subfamily of Caesalpinioideae, although some dominant species showed threats of over-exploitation. In Brazil, Maximo et al. [110] reiterated the importance of the tropical forest species in the production of bioenergy, wood-based textile fiber, lignin-based products, pulp, and paper, which are of great benefit to the SFB of the country.
3.4. Carbon Stocks and Other Variables Associated with Forest Bioeconomy
The result revealed that the average AGB-Cstocks were higher than the BG-Cstocks across the forest-vegetation zones (Figure 10a,b). It was also found that, generally, the carbon stocks decreased from the south and southwest to the north, which is probably attributed to a decrease in rainfall in the southern compared to the northern part of Ghana. This agreed with the findings of a previous work in the country [74]. Our study also showed that a significant positive relationship (R = 0.87; p < 0.001) was recorded between AGB-Cstocks and BG-Cstocks during the study (Table 2). Further, significantly strong negative correlations were recorded between population growth and AGB-Cstocks (R = −0.96) and BG-Cstocks (R = −0.81). The use of forest for biofuel had significant correlations with all the investigated variables of forest bioeconomy. Previous studies have investigated the variability between aboveground biomass carbon and belowground carbon contents in different forms of land use-cover [111,112]. In Malaysia, Raihan et al. [112] reported higher AGB-Cstocks than BG-Cstocks. In support of the findings of this study, Omar et al. [113] and Matthew et al. [114] found higher contents of aboveground carbon than belowground carbon, with net differences of at least 60%.
In contrast to the findings of this study, Xu et al. [111] reported higher carbon stocks belowground when compared with the aboveground content. Many factors, such as vegetation species, altitude, and climatic and land use management, could be the reasons for the discrepancy between the results. In our study, dead woods are often used for domestic energy, instead of being allowed to decompose and enrich the soil with SOM and carbon. Additionally, the non-biofuel use of forests (such as hunts for mushrooms, dye, herbal leaves, saps, barks, and roots) in Ghana limits the accumulation of carbons in the soil. Furthermore, Xu et al. [111] found higher BG-Cstocks than AGB-Cstocks in the Qinghai–Tibet plateau’s temperate semi-arid regions, which were colder and higher in altitude than our study in Ghana. Furthermore, the vegetation species in our study is characterized by evergreen potential, as such liter falls were substantially reduced.
In line with our findings, various studies in different regions have reported correlations between population growth, poverty, forest area, forest growing stocks, the use of forest as biofuel, carbon stocks, and carbon emissions [99,100,101,102,103,104,105,106]. An increase in population, in most cases, leads to poverty, which consequently poses threats to the forest resources and at the long-term influences on the forest ecosystem services and forest bioeconomy.
3.5. Soil Organic Carbon Stocks, Soil Characteristics, and SDGs
In nine of the SDGs that are most related to SOC, the results revealed a significant impact of increased SOC stocks (Table 3). All the respondents reported that an increase in soil organic carbon stocks had significant effects on SDG 2 (Zero Hunger), SDG 3 (Good Health and Well Being), SDG 13 (Climate Action), and SDG 15 (Life on Land). Similarly, at least 60% of the sampled population affirmed that increased soil organic carbon stocks had significant effects on SDG 1 (No Poverty), SDG 6 (Clean Water and Sanitation), SDG 7 (Affordable and Clean Energy), SDG 11 (Sustainable Cities and Communities), and SDG 12 (Responsible consumption and production). It was also indicated that SOC stock significantly impacted soil health and soil biota. Many studies have observed a relationships between SOC stocks and SDGs in different parts of the world [22,23,24,25,26,27]. Though there is no direct link with SOC for most of the SDGs, soils or SOC can promote the attainment of many of the SDGs, especially those related to climate, food, health, land management, and water [22,27], as demonstrated in this current study.
3.6. Limitations of the Study
Notwithstanding that the study achieved its objectives, it is not devoid of some limitations. One of the major limitations of the study was the total number of participants whose opinions were sought. The choice of only 20 interviewees across the five forest-vegetation zones seems to not be a large enough sample size but, because of the financial constraints involved, only 20 persons were interviewed. Further, the sampling locations did not reveal a perfectly even distribution across the study area and within the forest zones. This limitation was primarily caused by the poor geographical terrains of some locations, which made easy mobility and access more difficult. In addition, this study involved biophysical, economic, and social factors, which made it a multidisciplinary issue with many variables that had to be included. Only a few of the variables were included in the study because not all the indicators can be investigated at the same time. An unconsidered variable might, in reality, have a more significant influence on Cstocks, SDGs, and FBe than some of the chosen variables.
4. Conclusions
Due to the increasing population in Ghana, forests are being lost as they are either directly used as sources of energy or income or were converted to other land uses to meet the higher demands for food, settlement, urbanization, and other infrastructures. The variability in AGB-C and BG-Cstocks was also estimated for three decades. Forest loss showed an increase over time, with decade 1 (1990–1999) having larger forest areas than the subsequent decades. Carbon stocks were higher in the south, with a substantial decrease towards the north, which can be attributed to dense forest vegetation due to the more favorable climate, such as the higher rainfall in the moist evergreen and the wet evergreen forest zones relative to the northern part of the country. In addition to the increased population and increase in farming, politics and socio-cultural beliefs were among the long-term drivers of carbon fluxes, which serve as strong determinants of a sustainable forest bioeconomy in the country. This is because, in addition to some peoples’ preference for forest-based resources and the unsustainable exploitation, the government showed a lackadaisical attitude to addressing the situation with stringent actions and policies.
The study demonstrated that the decrease in Cstocks between 1990 and 2020 is related to an increase in population and agriculture, leading to a decrease in forest area, and growing stock, with an increase in carbon emissions, which consequently affects sustainable forest bioeconomy in Ghana.
Although, based on time, population was a key driver of Cstocks, the variability in the quantity of Cstocks between the forest-vegetation zones could be best explained by the richness and density of the plants, rather than either the population or socioeconomic status of the people. The evergreen forest belts had more trees leading to more Cstocks; however, if the moist deciduous forest, the dry semi-deciduous forest and savannah, and the swamp forest and mangrove belts are sustainably managed, their Cstocks will increase over time.
The study also revealed that the increase in Cstocks contributed to the realization of many SDGs, especially SDGs 1, 2, 3, 6, 7, 11, 12, 13, and 15, which, in turn, support a sustainable forest bioeconomy.
Conclusively, this study observed that, during the three decades, the decrease in Cstocks was influenced by the increase in population, which caused a decrease in forest area, and consequently impacted the sustainable forest bioeconomy of the country. The objective of the study was to evaluate the potential of carbon stocks (Cstocks) and variability for SFB, and was satisfactorily achieved. The dynamics of Cstocks were observed across the forest-vegetation zones, as the carbon quantities also demonstrated a temporal variability. The forest zones that have higher Cstocks were found to provide more SDGs, consequently promoting SFB. The work might support the government in enacting and adjusting forests and land use policies, to refine their carbon emission reduction strategies, and to construct and implement better regulations by fully consulting and incorporating the forest-dependent communities. As a large population of people who greatly depend on forests live in rural areas, collaborations (locally, nationally, and multisectoral-based) are necessary. Additionally, economic diversification, and rural education are also needed to promote the awareness, growth, and benefits of carbon stocks as a component of SFB in the country. Furthermore, future research should focus on the comprehensive valuation of individual tree species, carbon stocks, biodiversity, and other forest ecosystem services to improve the competitiveness of preserving forests, thereby promoting SFB in the country. The potential of the most common tree species to achieve the SDGs vis-à-vis SFB will be studied in subsequent research.
Author Contributions
Conceptualization, I.N. and M.H.; methodology, C.N.; software, C.N. and B.E.D.; validation, all authors; formal analysis, C.N.; investigation, I.N. and C.N.; resources, I.N. and C.N.; data curation, C.N. and B.E.D.; writing—original draft preparation, C.N. and I.N.; writing—review and editing, all authors; visualization, all authors; supervision, M.H.; project administration, I.N. and M.H.; funding acquisition, I.N. and M.H. All authors have read and agreed to the published version of the manuscript.
Funding
This work was supported by the Operational Program Research, Development and Education, the Ministry of Education of the Czech Republic, grant no. CZ.02.1.01/0.0/0.0/16_019/0000803.
Institutional Review Board Statement
Not applicable.
Informed Consent Statement
Not applicable.
Data Availability Statement
The data presented in this study are available on request from the corresponding author. The data are not publicly available due to the processing of data relative to different sources—some of them were retrieved throughout extensive interview campaigns and others through institutional databases, while some were from the published literature.
Acknowledgments
The Faculty of Forestry and Wood Sciences, Czech University of Life Sciences is acknowledged. Support from individuals who were interviewed in Ghana is also acknowledged.
Conflicts of Interest
The authors declare no conflicts of interest.
Appendix A

Table A1.
Forest-vegetation belts, regions and the geographical coordinates for the sampling points.
Table A1.
Forest-vegetation belts, regions and the geographical coordinates for the sampling points.
| Forest-Vegetation Belts | Regions | Latitude | Longitude |
|---|---|---|---|
| Wet evergreen rainforest | Western region | 5.39599 | −2.53939 |
| Wet evergreen rainforest | Western region | 4.820614 | −2.0327 |
| Wet evergreen rainforest | Western region | 5.419696 | −1.64301 |
| Wet evergreen rainforest | Western region | 5.418745 | −1.63782 |
| Wet evergreen rainforest | Western region | 4.96286 | −2.39281 |
| Wet evergreen rainforest | Western region | 5.38217 | −2.54018 |
| Wet evergreen rainforest | Western north region | 5.986077 | −2.7766 |
| Wet evergreen rainforest | Western north region | 6.474528 | −2.96298 |
| Wet evergreen rainforest | Western north region | 6.255623 | −2.91215 |
| Moist evergreen (dry and thick) forest | Central region | 5.55462 | −1.44816 |
| Moist evergreen (dry and thick) forest | Central region | 5.495595 | −1.04152 |
| Moist evergreen (dry and thick) forest | Central region | 5.630502 | −1.60065 |
| Moist evergreen (dry and thick) forest | Eastern region | 6.546458 | −0.33025 |
| Moist evergreen (dry and thick) forest | Eastern region | 6.666549 | −0.60226 |
| Moist evergreen (dry and thick) forest | Eastern region | 6.716578 | −0.88435 |
| Moist evergreen (dry and thick) forest | Ahafo region | 6.666549 | −2.58694 |
| Moist evergreen (dry and thick) forest | Ahafo region | 7.046641 | −2.57687 |
| Moist evergreen (dry and thick) forest | Ahafo region | 7.136618 | −2.21418 |
| Moist evergreen (dry and thick) forest | Ashanti region | 6.246104 | −1.34778 |
| Moist evergreen (dry and thick) forest | Ashanti region | 6.696567 | −2.10336 |
| Moist evergreen (dry and thick) forest | Ashanti region | 7.166607 | −0.7836 |
| Moist evergreen (dry and thick) forest | Bono region | 7.056041 | −2.88434 |
| Moist evergreen (dry and thick) forest | Bono region | 8.089444 | −2.42917 |
| Moist evergreen (dry and thick) forest | Bono region | 7.596912 | −2.28934 |
| Moist deciduous (NW and SE types) forest | Bono east region | 7.966366 | −0.52589 |
| Moist deciduous (NW and SE types) forest | Bono east region | 7.581511 | −0.18408 |
| Moist deciduous (NW and SE types) forest | Bono east region | 7.904813 | −1.84654 |
| Moist deciduous (NW and SE types) forest | Oti region | 7.612312 | 0.390794 |
| Moist deciduous (NW and SE types) forest | Oti region | 8.143279 | 0.429637 |
| Moist deciduous (NW and SE types) forest | Oti region | 8.673542 | 0.243193 |
| Moist deciduous (NW and SE types) forest | Volta region | 6.061995 | 0.763683 |
| Moist deciduous (NW and SE types) forest | Volta region | 7.094401 | 0.461256 |
| Moist deciduous (NW and SE types) forest | Volta region | 6.833926 | 0.429637 |
| Dry semi-deciduous forest and savanna | Savannah region | 8.888897 | −0.86903 |
| Dry semi-deciduous forest and savanna | Savannah region | 9.804188 | −1.56147 |
| Dry semi-deciduous forest and savanna | Savannah region | 9.146967 | −1.94689 |
| Dry semi-deciduous forest and savanna | Northern region | 9.771445 | 0.173559 |
| Dry semi-deciduous forest and savanna | Northern region | 9.886262 | −0.3547 |
| Dry semi-deciduous forest and savanna | Northern region | 9.390705 | −1.17107 |
| Dry semi-deciduous forest and savanna | Northern east region | 10.1599 | −1.24719 |
| Dry semi-deciduous forest and savanna | Northern east region | 10.59689 | −0.38406 |
| Dry semi-deciduous forest and savanna | Northern east region | 10.28482 | −1.48202 |
| Dry semi-deciduous forest and savanna | Upper west region | 10.89618 | −1.95801 |
| Dry semi-deciduous forest and savanna | Upper west region | 10.54698 | −2.16744 |
| Dry semi-deciduous forest and savanna | Upper west region | 10.02869 | −2.04686 |
| Dry semi-deciduous forest and savanna | Upper east region | 10.62808 | −0.97429 |
| Dry semi-deciduous forest and savanna | Upper east region | 10.88995 | −1.35509 |
| Dry semi-deciduous forest and savanna | Upper east region | 10.77775 | −0.35233 |
| Swamp forest and mangrove | Great Accra region | 5.883369 | 0.441012 |
| Swamp forest and mangrove | Great Accra region | 5.984483 | 0.161449 |
| Swamp forest and mangrove | Great Accra region | 5.815299 | 0.052582 |
| Swamp forest and mangrove | Great Accra region | 5.847517 | 0.771192 |
| Swamp forest and mangrove | Great Accra region | 5.964303 | 0.941969 |
| Swamp forest and mangrove | Great Accra region | 5.889987 | 0.611088 |
| Swamp forest and mangrove | Great Accra region | 5.815662 | 0.739171 |
References
- Grassi, G.; Monni, S.; Federici, S.; Achard, F.; Mollicone, D. Applying the conservativeness principle to REDD to deal with the uncertainties of the estimates. Environ. Res. Lett. 2008, 29, 035005. [Google Scholar] [CrossRef]
- Friedlingstein, P.; Allen, M.; Canadell, J.G.; Peters, G.P.; Seneviratne, S.L. Comment on the global tree restoration potential. Science 2019, 366, eaay8060. [Google Scholar] [CrossRef] [PubMed]
- IPCC. Global Warming of 1.5 C An IPCC Special Report on the Impacts of Global Warming of 1.5 C Above Pre-Industrial Levels and Related Global Greenhouse Gas Emission Pathways, in the Context of Strengthening the Global Response to the Threat of Climate Change. Sustainable Development, and Efforts to Eradicate Poverty. 2009. Available online: https://www.ipcc.ch/sr15/ (accessed on 30 January 2023).
- Roe, S.; Streck, C.; Obersteiner, M.; Frank, S.; Griscom, B.; Drouet, L. Contribution of the land sector to a 1.5 °C world. Nat. Clim. Change 2019, 9, 817–828. [Google Scholar] [CrossRef]
- Yang, H.; Ciais, P.; Frappart, F.; Li, X.; Brandt, M.; Fensholt, R.; Fan, L.; Saatchi, S.; Besnard, S.; Deng, Z.; et al. Global increase in biomass carbon stock dominated by growth of northern young forests over past decade. Nat. Geosci. 2023, 16, 886–892. [Google Scholar] [CrossRef]
- Leskinen, P.; Cardellini, G.; González-García, S.; Hurmekoski, E.; Sathre, R.; Seppälä, J.; Verkerk, P.J. Substitution effects of wood-based products in climate change mitigation. In Science to Policy 7; European Forest Institute: Joensuu, Finland, 2018. [Google Scholar] [CrossRef]
- Araujo, E.C.G.; Sanquetta, C.R.; Dalla Corte, A.P.; Pelissari, A.L.; Orso, G.A.; Silva, T.C. Global review and state-of-the-art of biomass and carbon stock in the Amazon. J. Environ. Manag. 2023, 331, 117251. [Google Scholar] [CrossRef] [PubMed]
- Cao, M.; Prince, S.D.; Li, K.; Tao, B.O.; Small, J.; Shao, X. Response of terrestrial carbon uptake to climate interannual variability in China. Glob. Change Biol. 2003, 9, 536–546. [Google Scholar] [CrossRef]
- Duguma, L.A.; Minang, P.A.; Watson, C.; Nath, A.J.; Muthee, K.W.; van Noordwijk, M.; Mutune, J.M.; Sileshi, G.W. Agroforestry as a key intervention to achieve nationally determined contribution (NDC) targets. In Agroforestry for Sustainable Intensification of Agriculture in Asia and Africa; Springer Nature Singapore: Singapore, 2023; pp. 641–664. [Google Scholar] [CrossRef]
- van Beek, C.L.; Meerburg, B.G.; Schils, R.L.; Verhagen, J.; Kuikman, P.J. Feeding the world’s increasing population while limiting climate change impacts: Linking N2O and CH4 emissions from agriculture to population growth. Environ. Sci. Policy 2010, 13, 89–96. [Google Scholar] [CrossRef]
- Cox, E.; Beckley, T.M.; de Graaf, M. Carbon sequestration and storage implications of three forest management regimes in the Wabanaki-Acadian Forest: A review of the evidence. Environ. Rev. 2023. [Google Scholar] [CrossRef]
- Ahmedin, A.M.; Bam, S.; Siraj, K.T.; Solomon, R.A.J. Assessment of biomass and carbon sequestration potentials of standing Pongamia pinnata in Andhra University, Visakhapatnam, India. Biosci. Discov. 2013, 4, 143–148. [Google Scholar]
- Haworth, M.; Marino, G.; Materassi, A.; Raschi, A.; Scutt, C.P.; Centritto, M. The functional significance of the stomatal size to density relationship: Interaction with atmospheric [CO2] and role in plant physiological behaviour. Sci. Total Environ. 2023, 863, 160908. [Google Scholar] [CrossRef]
- Cienciala, E.; Seufert, G.; Blujdea, V.; Grassi, G.; Exnerová, Z. Harmonized Methods for Assessing Carbon Sequestration in European Forests; European Commission Joint Research Centre Institute for Environment and Sustainability Luxembourg, Publications Office of the European Union, Luxembourg, Luxembourg; 2010; pp. 3–328. Available online: http://afoludata.jrc.ec.europa.eu/index.php/public_area/Research_projects (accessed on 21 November 2023).
- Bacar, F.F.; Lisboa, S.N.; Sitoe, A. The Mangrove Forest of Quirimbas National Park Reveals High Carbon Stock Than Previously Estimated in Southern Africa. Wetland 2023, 43, 60. [Google Scholar] [CrossRef]
- Erkan, N.; Güner, Ş.T.; Aydın, A.C. Thinning effects on stand growth, carbon stocks, and soil properties in Brutia pine plantations. Carbon Balance Manag. 2023, 18, 6. [Google Scholar] [CrossRef]
- Oertel, C.; Matschullat, J.; Zurba, K.; Zimmermann, F.; Erasmi, S. Greenhouse Gas Emissions from Soils—A Review. Geochemistry 2016, 76, 327–352. [Google Scholar] [CrossRef]
- Wachiye, S.; Merbold, L.; Vesala, T.; Rinne, J.; Räsänen, M.; Leitner, S.; Pellikka, P. Soil greenhouse gas emissions under different land-use types in savanna ecosystems of Kenya. Biogeosciences 2019, 17, 2149–2167. [Google Scholar] [CrossRef]
- Albrich, K.; Seidl, R.; Rammer, W.; Thom, D. From sink to source: Changing climate and disturbance regimes could tip the 21st century carbon balance of an unmanaged mountain forest landscape. For. Int. J. For. Res. 2023, 96, 399–409. [Google Scholar] [CrossRef]
- Ruehr, S.; Keenan, T.F.; Williams, C.; Zhou, Y.; Lu, X.; Bastos, A.; Canadell, J.G.; Prentice, I.C.; Sitch, S.; Terrer, C. Evidence and attribution of the enhanced land carbon sink. Nat. Rev. Earth Environ. 2023, 4, 518–534. [Google Scholar] [CrossRef]
- Grelle, A.; Hedwall, P.O.; Strömgren, M.; Håkansson, C.; Bergh, J. From source to sink–recovery of the carbon balance in young forests. Agric. For. Met. 2023, 330, 109290. [Google Scholar] [CrossRef]
- Lorenz, K.; Lal, R.; Ehlers, K. Soil organic carbon stock as an indicator for monitoring land and soil degradation in relation to United Nations’ Sustainable Development Goals. Land Degrad. Dev. 2019, 30, 824–838. [Google Scholar] [CrossRef]
- Blum, W.E.H. Role of soils for satisfying global demands for food, water, and bioenergy. In Environmental Resource Management and the Nexus Approach; Hettiarachchi, H., Ardakanian, R., Eds.; Springer: Cham, Switzerland, 2016; pp. 143–177. [Google Scholar] [CrossRef]
- Smithwick, E.A. Carbon stocks and biodiversity of coastal lowland forests in South Africa: Implications for aligning sustainable development and carbon mitigation initiatives. Carbon Manag. 2019, 10, 349–360. [Google Scholar] [CrossRef]
- Ahirwal, J.; Sahoo, U.K.; Thangjam, U.; Thong, P. Oil palm agroforestry enhances crop yield and ecosystem carbon stock in northeast India: Implications for the United Nations sustainable development goals. Sustain. Prod. Consum. 2022, 30, 478–487. [Google Scholar] [CrossRef]
- Xu, J.; Renaud, F.G.; Barrett, B. Modelling land system evolution and dynamics of terrestrial carbon stocks in the Luanhe River Basin, China: A scenario analysis of trade-offs and synergies between sustainable development goals. Sustain. Sci. 2021, 17, 1323–1345. [Google Scholar] [CrossRef] [PubMed]
- Keesstra, S.D.; Bouma, J.; Wallinga, J.; Tittonell, P.; Smith, P.; Cerdà, A.; Montanarella, L.; Quinton, J.N.; Pachepsky, Y.; Van der Putten, W.H.; et al. The significance of soils and soil science towards realization of the United Nations Sustainable Development Goals. Soil 2016, 2, 111–128. [Google Scholar] [CrossRef]
- Janzen, H.H. Carbon cycling in earth systems-A soil science perspective. Agric. Ecosyst. Environ. 2004, 104, 399–417. [Google Scholar] [CrossRef]
- Lal, R. Soil carbon sequestration impacts on global climate change and food security. Science 2004, 304, 1623–1627. [Google Scholar] [CrossRef]
- Lal, R. Soil carbon management and climate change. Carbon Manag. 2013, 4, 439–462. [Google Scholar] [CrossRef]
- Haddaway, N.R.; Hedlund, K.; Jackson, L.E.; Kätterer, T.; Lugato, E.; Thomsen, I.K.; Jørgensen, H.B.; Söderström, B. What are the effects of agricultural management on soil organic carbon in boreo-temperate systems? Environ. Evid. 2015, 4, 23. [Google Scholar] [CrossRef]
- Sharma, S.; Ray, R.; Martius, C.; Murdiyarso, D. Carbon stocks and fluxes in Asia-Pacific mangroves: Current knowledge and gaps. Environ. Res. Lett. 2023, 18, 044002. [Google Scholar] [CrossRef]
- Eze, S.; Magilton, M.; Magnone, D.; Varga, S.; Gould, I.; Mercer, T.G.; Goddard, M.R. Meta-analysis of global soil data identifies robust indicators for short-term changes in soil organic carbon stock following land use change. Sci. Total Environ. 2023, 860, 160484. [Google Scholar] [CrossRef]
- Kindermann, G.; Obersteiner, M.; Sohngen, B.; Sathaye, J.; Andrasko, K.; Rametsteiner, E.; Schlamadinger, B.; Wunder, S.; Beach, R. Global cost estimates of reducing carbon emissions through avoided deforestation. Proc. Natl. Acad. Sci. USA 2008, 105, 10302–10307. [Google Scholar] [CrossRef] [PubMed]
- Babu, K.N.; Mandyam, S.; Jetty, S.; Dar, A.A.; Ayushi, K.; Narayanan, A.; Narayanaswamy, P. Carbon stocks of tree plantations in a Western Ghats landscape, India: Influencing factors and management implications. Environ. Monit. Assess. 2023, 195, 404. [Google Scholar] [CrossRef] [PubMed]
- Fleiss, S.; Parr, C.L.; Platts, P.J.; McClean, C.J.; Beyer, R.M.; King, H.; Lucey, J.M.; Hill, J.K. Implications of zero-deforestation palm oil for tropical grassy and dry forest biodiversity. Nat. Ecol. Evol. 2023, 7, 250–263. [Google Scholar] [CrossRef] [PubMed]
- Busch, J.; Engelmann, J.; Cook-Patton, S.C.; Griscom, B.W.; Kroeger, T.; Possingham, H.; Shyamsundar, P. Potential for low-cost carbon dioxide removal through tropical reforestation. Nat. Clim. Change 2019, 9, 463–466. [Google Scholar] [CrossRef]
- Lewis, S.L.; Wheeler, C.E.; Mitchard, E.T.; Koch, A. Restoring natural forests is the best way to remove atmospheric carbon. Nature 2019, 568, 25–28. [Google Scholar] [CrossRef] [PubMed]
- Griscom, B.W.; Adams, J.; Ellis, P.W.; Houghton, R.A.; Lomax, G.; Miteva, D.A.; Schlesinger, W.H.; Shoch, D.; Siikamäki, J.V.; Smith, P.; et al. Natural climate solutions. Proc. Natl. Acad. Sci. USA 2017, 114, 11645–11650. [Google Scholar] [CrossRef] [PubMed]
- Austin, K.G.; Baker, J.S.; Sohngen, B.L.; Wade, C.M.; Daigneault, A.; Ohrel, S.B.; Bean, A. The economic costs of planting, preserving, and managing the world’s forests to mitigate climate change. Nat. Commun. 2020, 11, 5946. [Google Scholar] [CrossRef] [PubMed]
- Forsell, N.; Turkovska, O.; Gusti, M.; Obersteiner, M.; Elzen, M.; Havlik, P. Assessing the INDCs’ land use, land use change, and forest emission projections. Carbon Balance Manag. 2016, 11, 26. [Google Scholar] [CrossRef]
- Popp, A.; Calvin, K.; Fujimori, S.; Havlik, P.; Humpenöder, F.; Stehfest, E.; van Vuuren, D.P. Land-use futures in the shared socio-economic pathways. Glob. Environ. Change 2017, 42, 331–345. [Google Scholar] [CrossRef]
- Karvonen, J.; Halder, P.; Kangas, J.; Leskinen, P. Indicators and tools for assessing sustainability impacts of the forest bioeconomy. For. Ecosyst. 2017, 4, 2. [Google Scholar] [CrossRef]
- Tuomasjukka, D.; Berg, S.; Lindner, M. Managing sustainability of Fennoscandian forests and their use by Law and/or agreement: For whom and which purpose? Sustainability 2013, 6, 18–49. [Google Scholar] [CrossRef]
- MCPEF. Resolution H1. General Guidelines for the Sustainable Management of Forests in Europe. In Proceedings of the Second Ministerial Conference on the Protection of Forests in Europe, Helsinki, Finland, 16–17 June 1993; pp. 1–5. [Google Scholar]
- Forest Europe. The State of Europe’s Forests 2020 Report. 2020. Available online: https://forest.eea.europa.eu/news/the-state-of-europes-forests-2020-report-published (accessed on 17 June 2023).
- Kauppi, P.E.; Stål, G.; Arnesson-Ceder, L.; Sramek, I.H.; Hoen, H.F.; Svensson, A.; Nordin, A. Managing existing forests can mitigate climate change. For. Ecol. Manag. 2022, 513, 120186. [Google Scholar] [CrossRef]
- Rawal, K.; Subedi, P.B. Vegetation structure and carbon stock potential in the community-managed forest of the mid-western hilly region, Nepal. Asian J. For. 2022, 6, 15–21. [Google Scholar] [CrossRef]
- Diao, J.; Liu, J.; Zhu, Z.; Wei, X.; Li, M. Active Forest management accelerates carbon storage in plantation forests in Lishui, southern China. For. Ecosyst. 2022, 9, 100004. [Google Scholar] [CrossRef]
- FAO. Global Forest Resources Assessment 2005, Report on Ghana; FAO: Rome, Italy, 2005; Available online: www.fao.org/docrep/008/a0050e/a0050e11.htm (accessed on 13 December 2023).
- FAOSTAT Online Database, 2007. Available online: https://www.fao.org/faostat/en/#home (accessed on 27 October 2023).
- Armah, F.A.; Odoi, J.O.; Yengoh, G.T.; Obiri, S.; Yawson, D.O.; Afrifa, E.K.A. Food security and climate change in drought-sensitive savanna zones of Ghana. Mitig. Adapt. Strateg. Glob. Change 2011, 16, 291–306. [Google Scholar] [CrossRef]
- Ghana Statistical Service. Ghana—Population and Housing Census 2021. Summary of Final Report; Ghana Statistical Service: Accra, Ghana, 2021. [Google Scholar]
- Acheampong, J.O.; Attua, E.M.; Mensah, M.; Fosu-Mensah, B.Y.; Apambilla, R.A.; Doe, E.K. Livelihood, carbon and spatiotemporal land-use land-cover change in the Yenku forest reserve of Ghana, 2000–2020. Int. J. Appl. Earth Obs. Geoinf. 2022, 112, 102938. [Google Scholar] [CrossRef]
- Mongabay. Deforestation Statistics for Ghana, 2022. Available online: https://rainforests.mongabay.com/deforestation/archive/Ghana.htm (accessed on 7 January 2023).
- Environmental Protection Agency (EPA). National Action Programme to Combat Drought and Desertification; Ghanian Environmental Protection Agency: Accra, Ghana, 2000; Available online: https://knowledge.unccd.int/sites/default/files/naps/ghana-eng2002.pdf (accessed on 7 January 2023).
- Winkler, K.; Yang, H.; Ganzenmüller, R.; Fuchs, R.; Ceccherini, G.; Duveiller, G.; Grassi, G.; Pongratz, J.; Bastos, A.; Shvidenko, A.; et al. Changes in land use and management led to a decline in Eastern Europe’s terrestrial carbon sink. Commun. Earth Environ. 2023, 4, 237. [Google Scholar] [CrossRef]
- Zhang, Y.; An, C.B.; Zhang, W.S.; Zheng, L.Y.; Zhang, Y.Z.; Lu, C.; Liu, L.Y. Drivers of mountain soil organic carbon stock dynamics: A review. J. Soils Sediments 2023, 23, 64–76. [Google Scholar] [CrossRef]
- Nyarko, I.; Nwaogu, C.; Miroslav, H. Forest Bioeconomy in Ghana: Understanding the Potential Indicators for Its Sustainable Development. Forests 2023, 14, 804. [Google Scholar] [CrossRef]
- Frimpong, Y.; Oluwoye, J.; Crawford, L. Causes of delay and cost overruns in construction of groundwater projects in a developing country; Ghana as a case study. Int. J. Proj. Manag. 2003, 21, 321–326. [Google Scholar] [CrossRef]
- Donkor, A.K.; Bonzongo, J.C.; Nartey, V.K.; Adotey, D.K. Mercury in different environmental compartments of the Pra River Basin, Ghana. Sci. Total Environ. 2006, 368, 164–176. [Google Scholar] [CrossRef]
- Awuah, I.B. Report from the Ministry of Employment and Labour Relations of Ghana. In Parliamentarian Review and Address on 10 March 2022; the Ministry of Employment and Labour Relations of Ghana: Accra, Ghana, 2022; Available online: https://www.pulse.com.gh/news/local/ghanas-unemployment-rate-standsat-13-labourminister/x3qykqy# (accessed on 18 May 2023).
- Sasu, D.D. Research Expert Covering Primarily Society and Agricultural Topics for Africa, Particularly Ghana and Nigeria. 2022. Available online: https://www.statista.com/statistics/1245342/number-of-people-living-in-extreme-poverty-in-ghana-by-area (accessed on 15 June 2023).
- Food and Agriculture Organization of the United Nations. Global Forest Resource Assessment 2020—Key Findings; FAO: Rome, Italy, 2020. [Google Scholar] [CrossRef]
- Food and Agriculture Organization of the United Nations. FAOSTAT Inputs/Fertilizers by Nutrient, and FAOSTAT Inputs Land Use. 2020. Available online: http://www.fao.org/faostat/en/?#data (accessed on 2 April 2021).
- Food and Agriculture Organization of the United Nations. Introduction and Status of the Forestry Sector in Ghana. 2022. Available online: http://www.fao.org/3/ab567e/AB567E02.htm (accessed on 2 December 2023).
- Food and Agriculture Organization of the United Nations. Global Forest Resources Assessment. 2021. Available online: https://fra-data.fao.org (accessed on 3 December 2022).
- World Bank. Database on Literacy Rate. 2020. Available online: https://data.worldbank.org/indicator/SE.ADT.LITR.ZS (accessed on 4 January 2023).
- World Bank. World Development Indicators. 2020. Available online: http://data.worldbank.org/datacatalog (accessed on 2 January 2021).
- World Income Inequalities Databases (WID). Available online: https://wid.world/ (accessed on 20 February 2021).
- Forest Resources Assessment (FRA). Report and Database on World Forest Resources. 2020. Available online: https://www.fao.org/3/CA8753EN/CA8753EN.pdf (accessed on 10 February 2023).
- United Nations Office for the Coordination of Humanitarian Affairs (OCHA). Database and Annual Report 2020. Available online: https://www.unocha.org/ (accessed on 7 January 2021).
- National Aeronautics and Space Administration (NASA). Available online: https://www.neo.sci.gsfc.nasa.gov (accessed on 7 January 2021).
- Owusu, S.; Yigini, Y.; Olmedo, G.F.; Omuto, C.T. Spatial prediction of soil organic carbon stocks in Ghana using legacy data. Geoderma 2020, 360, 114008. [Google Scholar] [CrossRef]
- Tan, K.H. Soil Sampling, Preparation, and Analysis; CRC Press: Boca Raton, FL, USA, 2005. [Google Scholar]
- Food and Agriculture Organization. FAOSTAT Database 2018. Available online: http://www.fao.org/faostat/en/#data (accessed on 15 February 2022).
- Hengl, T.; Kempen, B.; Heuvelink, G. GSIF: Global Soil Information Facilities. R Package Version 0.5-3. 2016. Available online: https://CRAN.R-project.org/package=GSIF (accessed on 25 December 2023).
- Nelson, D.W.; Sommers, L.E. Total carbon, organic carbon, and organic matter. In Methods of Soil Analysis. Part 2 Chemical and Microbiological Properties; Page, A.L., Miller, R.H., Keeney, D.R., Eds.; Scientific Research Publishing (SCIRP): Irvine, CA, USA, 1982; pp. 539–579. [Google Scholar]
- Li, Y.; Wang, X.; Chen, Y.; Gong, X.; Yao, C.; Cao, W.; Lian, J. Application of predictor variables to support regression kriging for the spatial distribution of soil organic carbon stocks in native temperate grasslands. J. Soils Sediment 2023, 23, 700–717. [Google Scholar] [CrossRef]
- Shoumik, B.A.A.; Khan, M.Z. Spatio-temporal dynamics of soil organic carbon and total nitrogen: Evidenced from 2000 to 2020 in a mixed ecosystem. Environ. Earth Sci. 2023, 82, 84. [Google Scholar] [CrossRef]
- Tallis, H.T.; Ricketts, T.; Guerry, A.D.; Wood, S.A.; Sharp, R.; Nelson, E.; Chaplin-Kramer, R. InVEST 2.6.0 User’s Guide; The Natural Capital Project, Stanford University: Stanford, CA, USA, 2013. [Google Scholar]
- ESRI. ArcGIS Desktop: Release 10; Environmental Systems Research Institute: Redlands, CA, USA, 2009. [Google Scholar]
- Friedl, M.A.; Sulla-Menashe, D.; Tan, B.; Schneider, A.; Ramankutty, N.; Sibley, A.; Huang, X. MODIS collection 5 global land cover: Algorithm refinements and characterization of new datasets. Remote Sens. Environ. 2010, 114, 168–182. [Google Scholar] [CrossRef]
- Ter Braak, C.J.F.; Smilauer, P. Canoco 5, Windows Release (5.12). Software for Multivariate Data Exploration, Testing, and Summarization; Biometris, Plant Research International: Wageningen, The Netherlands, 2012. [Google Scholar]
- Geist, H.J.; Lambin, E.F. Proximate causes and underlying driving forces of tropical 20 deforestation. BioScience 2002, 52, 143–150. [Google Scholar] [CrossRef]
- Zoungrana, B.J.B.; Conrad, C.; Amekudzi, L.K.; Thiel, M.; Da, E.D.; Forkuor, G.; Löw, F. Multi-temporal landsat images and ancillary data for land use/cover change (LULCC) detection in the Southwest of Burkina Faso, West Africa. Remote Sens. 2015, 7, 12076–12102. [Google Scholar] [CrossRef]
- Kleemann, J.; Baysal, G.; Bulley, H.N.; Fürst, C. Assessing driving forces of land use and land cover change by a mixed-method approach in north-eastern Ghana, West Africa. J. Environ. Manag. 2017, 196, 411–442. [Google Scholar] [CrossRef]
- Koranteng, A.; Zawila-Niedzwiecki, T.; Adu-Poku, I. Remote sensing study of land use/cover change in West Africa. J. Environ. Prot. Sustain. Dev. 2016, 2, 17–31. [Google Scholar]
- Geremew, B.; Tadesse, T.; Bedadi, B.; Gollany, H.T.; Tesfaye, K.; Aschalew, A. Impact of land use/cover change and slope gradient on soil organic carbon stock in Anjeni watershed, Northwest Ethiopia. Environ. Monit. Assess. 2023, 195, 971. [Google Scholar] [CrossRef]
- Nwaogu, C. Landscape Transitions in Space and Time in Diverse Land Use: The Geoinformatics and Statistical Approach. Publikace Neprosla Redkcni Jazykovou Upravou; University of Palacky Press: Olomouc, Czech Republic, 2020. [Google Scholar]
- Geist, H.; McConnell, W.; Lambin, E.F.; Moran, E.; Alves, D.; Rudel, T. Causes and trajectories of land-use/cover change. In Land-Use and Land-Cover Change; Springer: Berlin/Heidelberg, Germany, 2006; pp. 41–70. [Google Scholar]
- Zekeng, J.C.; van Der Sande, M.T.; Fobane, J.L.; Mphinyane, W.N.; Sebego, R.; Ebanga, P.A.; Mbolo, M.M. Environmental, structural, and taxonomic diversity factors drive aboveground carbon stocks in semi-deciduous tropical rainforest strata in Cameroon. Afr. J. Ecol. 2023, 61, 163–175. [Google Scholar] [CrossRef]
- Adu-Poku, A.; Obeng, G.Y.; Mensah, E.; Kwaku, M.; Acheampong, E.N.; Duah-Gyamfi, A.; Adu-Bredu, S. Assessment of aboveground, belowground, and total biomass carbon storage potential of Bambusa vulgaris in a tropical moist forest in Ghana, West Africa. Renew. Energy Environ. Sustain. 2023, 8, 3. [Google Scholar] [CrossRef]
- Mokake, S.E.; Weyi, B.K.; Anyinkeng, N.; Ngoh, L.M.; Berkeley, O.E.; Andrew, E.E. Stand Diversity and Carbon Stock of a Tropical Forest in the Deng Deng National Park, Cameroon. Open J. Ecol. 2023, 13, 461–496. [Google Scholar] [CrossRef]
- Bruinsma, J. World Agriculture: Towards 2015/2030, an FAO Perspective; Earthscan Publications: London, UK, 2003. [Google Scholar]
- Anderson-Teixeira, K.J.; Masters, M.D.; Black, C.K.; Zeri, M.; Hussain, M.Z.; Bernacchi, C.J.; DeLucia, E.H. Altered belowground carbon cycling following land-use change to perennial bioenergy crops. Ecosystems 2013, 16, 508–520. [Google Scholar] [CrossRef]
- Anderson-Teixeira, K.J.; Wang, M.M.; McGarvey, J.C.; Herrmann, V.; Tepley, A.J.; Bond-Lamberty, B.; LeBauer, D.S. For C: A global database of forest carbon stocks and fluxes. Ecology 2018, 99, 1507. [Google Scholar] [CrossRef]
- Anderson-Teixeira, K.J.; Herrmann, V.; Morgan, R.B.; Bond-Lamberty, B.; Cook-Patton, S.C.; Ferson, A.E.; Muller-Landau, H.C.; Wang, M.M. Carbon cycling in mature and regrowth forests globally. Environ. Res. Lett. 2021, 16, 053009. [Google Scholar] [CrossRef]
- Bessah, E. Assessment of Soil Organic Carbon Stocks under Various Land Use/Land Cover Types in the Kintampo North Municipal, Ghana. Master’s Thesis, Department of Geography, Federal University of Technology, Gaga, Nigeria, 2014. [Google Scholar]
- Chheng, K.; Sasaki, N.; Mizoue, N.; Khorn, S.; Kao, D.; Lowe, A. Assessment of carbon stocks of semi-evergreen forests in Cambodia. Glob. Ecol. Conserv. 2016, 5, 34–47. [Google Scholar] [CrossRef]
- Pelletier, J.; Paquette, A.; Mbindo, K.; Zimba, N.; Siampale, A.; Chendauka, B.; Roberts, J.W. Carbon sink despite large deforestation in African tropical dry forests (miombo woodlands). Environ. Res. Lett. 2018, 13, 094017. [Google Scholar] [CrossRef]
- Cui, X.; Wei, X.; Liu, W.; Zhang, F.; Li, Z. Spatial and temporal analysis of carbon sources and sinks through land use/cover changes in the Beijing-Tianjin-Hebei urban agglomeration region. Phys. Chem. Earth Parts A/B/C 2019, 110, 61–70. [Google Scholar] [CrossRef]
- Khan, I.A.; Khan, M.R.; Baig, M.H.A.; Hussain, Z.; Hameed, N.; Khan, J.A. Assessment of forest cover and carbon stock changes in sub-tropical pine forest of Azad Jammu & Kashmir (AJK), Pakistan using multi-temporal Landsat satellite data and field inventory. PLoS ONE 2020, 15, e0226341. [Google Scholar] [CrossRef]
- Rahaman, Z.A.; Kafy, A.A.; Saha, M.; Rahim, A.A.; Almulhim, A.I.; Rahaman, S.N.; Rakib, A. Assessing the impacts of vegetation cover loss on surface temperature, urban heat island and carbon emission in Penang city, Malaysia. Build. Environ. 2022, 222, 109335. [Google Scholar] [CrossRef]
- Teimoory, N.; Sasaki, N.; Abe, I. Estimation of baseline emissions, forest reference emission level, and carbon removals due to forest area changes in Afghanistan between 1993 and 2030. Clean. Prod. Lett. 2022, 2, 100003. [Google Scholar] [CrossRef]
- Zhang, X.; Brandt, M.; Tong, X.; Ciais, P.; Yue, Y.; Xiao, X.; Fensholt, R. A large but transient carbon sink from urbanization and rural depopulation in China. Nat. Sustain. 2022, 5, 321–328. [Google Scholar] [CrossRef]
- Feng, Y.; Chen, S.; Tong, X.; Lei, Z.; Gao, C.; Wang, J. Modeling changes in 2000–2030 carbon stock caused by land use change. J. Clean. Prod. 2020, 252, 119659. [Google Scholar] [CrossRef]
- Bauhus, J.; Kouki, J.; Paillet, Y.; Asbeck, T.; Marchetti, M. How Does the Forest-Based Bioeconomy Impact Forest Biodiversity. Towards a Sustainable European Forest-Based Bioeconomy; European Forest Institute: Joensuu, Finland, 2017; p. 67. Available online: http://www.efi.int/portal/virtual_library/publications/what_science_can_tell_us/wsctu8/ (accessed on 1 December 2023).
- Chandrasekaran, A.; Subbiah, S.; Bartocci, P.; Yang, H.; Fantozzi, F. Carbonization using an Improved Natural Draft Retort Reactor in India: Comparison between the performance of two woody biomasses, Prosopis juliflora and Casuarina equisetifolia. Fuel 2012, 285, 119095. [Google Scholar] [CrossRef]
- Maximo, Y.I.; Hassegawa, M.; Verkerk, M.; Missio, A.L. Forest bioeconomy in Brazil: Potential innovative products from the forest sector. Land 2022, 11, 1297. [Google Scholar] [CrossRef]
- Xu, L.; Yu, G.; He, N.; Wang, Q.; Gao, Y.; Wen, D.; Li, S.; Niu, S.; Ge, J. Carbon storage in China’s terrestrial ecosystems: A synthesis. Sci. Rep. 2018, 8, 2806. [Google Scholar] [CrossRef]
- Raihan, A.; Begum, R.A.; Mohd Said, M.N.; Pereira, J.J. Assessment of Carbon Stock in Forest Biomass and Emission Reduction Potential in Malaysia. Forests 2021, 12, 1294. [Google Scholar] [CrossRef]
- Omar, H.; Chuah, N.M.J.; Parlan, I.; Samah, A.K.A.; Musa, S. Assessing carbon pools in dipterocarp forests of Peninsular Malaysia. J. Trop. Resour. Sustain. Sci. 2015, 3, 214–221. [Google Scholar] [CrossRef]
- Matthew, N.K.; Shuib, A.; Ismail, M.; Mem, E.; Ramachandran., S.; Afandi, S.H.M.; Samdin, Z. Carbon stock and sequestration valuation in a mixed dipterocarp forest of Malaysia. Sains Malays. 2018, 47, 447–455. [Google Scholar]
Figure 1.
African map showing Ghana (the study area), and the current 16 administrative regions.

Figure 2.
Forest-vegetation belts, image of the forest’s features/layers, regions, and sampling locations.
Figure 2.
Forest-vegetation belts, image of the forest’s features/layers, regions, and sampling locations.

Figure 3.
Land use-cover over three decades, 1990–2020, showing average changes between (a) 1990 and 1999, (b) 2000 and 2009, and (c) 2010 and 2020.
Figure 3.
Land use-cover over three decades, 1990–2020, showing average changes between (a) 1990 and 1999, (b) 2000 and 2009, and (c) 2010 and 2020.

Figure 4.
Ordinary kriging model showing the spatial distribution and variability of the forests’ aboveground carbon stocks for (a) 1990–1999, (b) 2000–2009, and (c) 2010–2020, and in the forests belowground carbon stocks for (d) 1990–1999, (e) 2000–2009, and (f) 2010–2020.
Figure 4.
Ordinary kriging model showing the spatial distribution and variability of the forests’ aboveground carbon stocks for (a) 1990–1999, (b) 2000–2009, and (c) 2010–2020, and in the forests belowground carbon stocks for (d) 1990–1999, (e) 2000–2009, and (f) 2010–2020.

Figure 5.
Multivariate analysis showing (a) the main drivers of carbon stock as an indicator of sustainable forest bioeconomy and the magnitude of their influence in the various decades, and (b) the sectoral proportion and the distribution of each driver of carbon stocks during the study periods. Diamond symbols in light blue color represent the decades; the arrows’ size and length indicate the extent to which the driver influenced carbon stocks during the study periods. Description of abbreviations: NWFPs = non-wood forest products; LogComTim = logging for commercial purposes such as timber; InfraDev = infrastructural development such as the building of markets, schools, hospitals, roads, etc.; OHDLog = forest deforestation for other household benefits; CivilComCon = civil–communal conflicts; Gam & Hunt = wildlife gathering for game and hunting; Pol and Gov = political and governance drivers such as unsound policies, weak governance, lack of law enforcements, landlessness, unclear allocation of rights, impoverishments of the rural people, and lack of investments and financial resources.

Figure 6.
Relationships between (a) forest total carbon stocks and population, (b) forest growing stocks and population, (c) aboveground and belowground forest carbon stocks, and (d) the total forest loss caused by the drivers and carbon emission estimates covering the period from 1990 to 2020.
Figure 6.
Relationships between (a) forest total carbon stocks and population, (b) forest growing stocks and population, (c) aboveground and belowground forest carbon stocks, and (d) the total forest loss caused by the drivers and carbon emission estimates covering the period from 1990 to 2020.

Figure 7.
Ordinary kriging model showing the spatial distribution and variability (%) in the use of forest and its resources as (a) biofuel from 1990–1999, (b) biofuel from 2010–2020, (c) non-biofuel from 1990–1999, and (d) non-biofuel from 2010–2020.
Figure 7.
Ordinary kriging model showing the spatial distribution and variability (%) in the use of forest and its resources as (a) biofuel from 1990–1999, (b) biofuel from 2010–2020, (c) non-biofuel from 1990–1999, and (d) non-biofuel from 2010–2020.

Figure 8.
Multivariate ordination plot showing the vegetation zones and their associated common tree species, which promoted carbon fluxes vis-à-vis sustainable forest bioeconomy for each vegetation zone during the study period. Description of the abbreviations are as follows for each species: Dialium bipindense = DialBipi; Diospyros spp.= DiospSpp; Pentaclethra macrophlla = PentMacro; Letestua durissima = LeteDuri; Lophira alata = LophAlat; Milicia excels = MiliExce; Baphia kirkii = BaphKirk; Cleistanthus mildbraedii = CleiMild; Cylicodiscus gabonensis = CyliGabo; Desbordesia pierreana = DesbPier; Manilkara cuneifolia = ManiCune; Parinari glabra = PariGlab; Strombosia glaucescens = StroGlau; Swartzia fistuloides = SwarFist; Tessmania Africana = TessAfri; Klainedoxa gabonensis = KlaiGabo; Afzelia africana spp = AfzeAfri; Piptadeniastrum africanum = PiptAfri; Triplochiton scleraxylon = TripScle; Gmelina arborea = GmelArbo; Juniperus procera = JuniProc; Pinus halepensis = PinuHale; Pinus pinaster = PinuPina; Cedrus atlantica = CedrAtla; Hagenia abyssinica = HageAbys; Taxus baccata = TaxuBacc; Hevea brasiliensis = HeveBras; Celba pentandra = CelbPent.

Figure 9.
Multivariate ordination plot showing (a) the proportion of the major forest tree species that contribute substantially to peoples’ livelihood and the forest bioeconomy, and (b) an ordination plot showing the vegetation zones and the associated common tree species that promote carbon fluxes vis-à-vis sustainable forest bioeconomy for each vegetation zone during the study period. A description of the abbreviations is provided in Figure 8.

Figure 10.
Average carbon stocks in (a) aboveground biomass and (b) belowground (soil) in the forest-vegetation zones from 1990 to 2020.
Figure 10.
Average carbon stocks in (a) aboveground biomass and (b) belowground (soil) in the forest-vegetation zones from 1990 to 2020.

Table 1.
Data sources and variables/measures.
| Indicator/Measure | Sources |
|---|---|
| Administrative regions |
|
| Forest-vegetation zones |
|
| Sampling points |
|
| Land use-cover and changes |
|
| Forest areas and loss |
|
| Forest tree cover and loss |
|
| Forest growing stocks |
|
| Contributions of forest to GDP |
|
| Country’s GDP and poverty rate |
|
| Uses of forests: Farming, mining, bioenergy, timber, NWFPs, etc. |
|
| Biophysical: climate, soil and biomass carbon, and carbon emissions |
|
| Population and settlement |
|
| Forest-based employment, migration, civil/communal conflicts |
|
| Drivers of deforestation, socio-cultural and political views, and stands on deforestation |
|
| Common forest tree species |
|
Table 2.
Summary of the correlation analysis for the variables that are linked to carbon stocks and forest bioeconomy in Ghana (2010–2020).
Table 2.
Summary of the correlation analysis for the variables that are linked to carbon stocks and forest bioeconomy in Ghana (2010–2020).
| Pop Ulation | AGB Cstocks | BG C-Stocks | For CoGDP | C-Emision | For GroStok | For Area | For Loss | Tre CovLoss | Pov Rate | Rainfall | Temp | For Biofuel | ForNon Biofuel | |
|---|---|---|---|---|---|---|---|---|---|---|---|---|---|---|
| Population | 1 | |||||||||||||
| AGB C-stocks | −0.96 * | 1 | ||||||||||||
| BG C-stocks | −0.81 * | 0.87 * | 1 | |||||||||||
| ForCoGDP | −0.76 * | 0.69 * | 0.17 | 1 | ||||||||||
| C-emission | 0.63 * | −0.86 ** | −0.61 | −0.73 * | 1 | |||||||||
| ForGroStok | −0.81 * | 0.95 * | 0.95 * | 0.75 * | −0.41 | 1 | ||||||||
| ForArea | −0.94 ** | 0.89 | 0.87 | 0.61 * | −0.84 ** | 0.91 * | 1 | |||||||
| ForLoss | 0.78 ** | −0.80 * | −0.76 * | −0.53 * | 0.96 * | −0.77 * | −0.60 * | 1 | ||||||
| TreCovLos | 0.89 ** | −0.91 | −0.84 | −0.66 * | 0.75 | −0.94 | −0.84 | 0.83 * | 1 | |||||
| PovRate | 0.63 * | −0.54 | −0.47 | −0.33 | 0.83 * | −0.62 | −0.70 * | 0.67 * | −0.55 | 1 | ||||
| Rainfall | 0 | 0.52 | 0.28 | 0.14 | 0 | 0.78 | 0.67 | −0.02 | 0 | 0 | 1 | |||
| Temp | 0 | 0.45 | 0.32 | 0.02 | 0.01 | 0.4 | 0.51 | 0.16 | −0.03 | 0 | 0.43 | 1 | ||
| ForBiofuel | 0.89 ** | −0.82 * | −0.87 * | −0.71 * | 0.92 ** | −0.86 * | −0.78 * | 0.95 ** | 0.79 * | 0.65 * | −0.07 * | −0.15 * | 1 | |
| ForNonBiofuel | 0.68 * | −0.19 | −0.89 | −0.65 | −0.08 | −0.75 * | 0.59 | 0.06 | −0.49 | 0.58 | −0.31 | −0.24 | 0.57 | 1 |
* = Correlation was significant at the 0.01 p-value; ** = correlation was significant at the 0.05 p-value. Description of the abbreviations: AGB Cstocks = carbon from the trees’ aboveground biomass; BG C-stocks = belowground carbon, which represents soil carbon; ForCoGDP = forest contribution to GDP; C-emission = carbon emissions, mainly from deforestation; ForGroStok = forest growing stocks; ForArea = forest area; ForLoss = forest loss; TreCovLos = tree cover loss; PovRate = poverty rate; Temp = temperature rate; ForBiofuel = forest use as biofuel; ForNonBiofuel = forest use for non-biofuel.
Table 3.
Increased soil organic carbon stocks and their effects on soil characteristics and SDGs.
| Indicators | Very Significant | Significant | No Idea | Insignificant | Very Insignificant |
|---|---|---|---|---|---|
| Soil characteristic | |||||
| Soil health | 11 (55%) | 8 (40%) | 1 (5%) | 0 | 0 |
| Soil biota | 9 (45%) | 9 (45%) | 2 (10%) | 0 | 0 |
| Erosion risk | 0 | 1 (5%) | 4 (20%) | 7 (35%) | 8 (40%) |
| Storage, filtering and transformation | 10 (50%) | 7 (35%) | 3 (15%) | 0 | 0 |
| CO2 sequestration | 6 (30%) | 5 (25%) | 6 (30%) | 2 (10%) | 1 (5%) |
| Water holding capacity | 8 (40%) | 6 (30%) | 4 (20%) | 1 (5%) | 1 (5%) |
| SDGs | |||||
| SDG 1 (No Poverty) | 9 (45%) | 5 (25%) | 4 (20%) | 1 (5%) | 1 (5%) |
| SDG 2 (Zero Hunger) | 12 (60%) | 8 (40%) | 0 | 0 | 0 |
| SDG 3 (Good Health and Well Being) | 11 (55%) | 8 (40%) | 1 (5%) | 0 | 0 |
| SDG 4 (Quality Education) | 0 | 0 | 0 | 0 | 20 (100%) |
| SDG 5 (Gender Equality) | 0 | 0 | 5 (25%) | 7 (35%) | 8 (40%) |
| SDG 6 (Clean Water and Sanitation) | 6 (30%) | 7 (35%) | 5 (25%) | 2 (10%) | 0 |
| SDG 7 (Affordable and Clean Energy) | 5 (25%) | 9 (45%) | 3 (15%) | 2 (10%) | 1 (5%) |
| SDG 8 (Decent Work and Economic Growth) | 4 (20%) | 5 (25%) | 7 (35%) | 3 (15%) | 1 (5%) |
| SDG 9 (Industry Innovation and Infrastructure) | 5 (25%) | 5 (25%) | 6 (30%) | 2 (10%) | 2 (10%) |
| SDG 10 (Reduced inequality) | 0 | 0 | 0 | 0 | 20 (100%) |
| SDG 11 (Sustainable Cities and Communities) | 5 (25%) | 7 (35%) | 5 (25%) | 2 (10%) | 1 (5%) |
| SDG 12 (Responsible consumption and production) | 6 (30%) | 11 (55%) | 2 (10%) | 1 (5%) | 0 |
| SDG 13 (Climate Action) | 12 (60%) | 8 (40%) | 0 | 0 | 0 |
| SDG 14 (Life Below Water) | 0 | 0 | 5 (25%) | 6 | 9 |
| SDG 15 (Life on Land) | 17 (85%) | 3 (15%) | 0 | 0 | 0 |
| SDG 16 (Peace, justice and strong institutions) | 0 | 0 | 0 | 0 | 20 (100%) |
| SDG 17 (Partnerships for the goals) | 0 | 0 | 0 | 0 | 20 (100%) |
Disclaimer/Publisher’s Note: The statements, opinions and data contained in all publications are solely those of the individual author(s) and contributor(s) and not of MDPI and/or the editor(s). MDPI and/or the editor(s) disclaim responsibility for any injury to people or property resulting from any ideas, methods, instructions or products referred to in the content. |
© 2024 by the authors. Licensee MDPI, Basel, Switzerland. This article is an open access article distributed under the terms and conditions of the Creative Commons Attribution (CC BY) license (https://creativecommons.org/licenses/by/4.0/).
Share and Cite
MDPI and ACS Style
Nyarko, I.; Nwaogu, C.; Diagi, B.E.; Hájek, M. The Dynamics and Potential of Carbon Stocks as an Indicator of Sustainable Development for Forest Bioeconomy in Ghana. Forests 2024, 15, 256. https://doi.org/10.3390/f15020256
AMA Style
Nyarko I, Nwaogu C, Diagi BE, Hájek M. The Dynamics and Potential of Carbon Stocks as an Indicator of Sustainable Development for Forest Bioeconomy in Ghana. Forests. 2024; 15(2):256. https://doi.org/10.3390/f15020256
Chicago/Turabian StyleNyarko, Isaac, Chukwudi Nwaogu, Bridget E. Diagi, and Miroslav Hájek. 2024. "The Dynamics and Potential of Carbon Stocks as an Indicator of Sustainable Development for Forest Bioeconomy in Ghana" Forests 15, no. 2: 256. https://doi.org/10.3390/f15020256
Note that from the first issue of 2016, this journal uses article numbers instead of page numbers. See further details here.