

Effects of Ozone Stress on Rhizosphere Soil of Poplar Seedlings

1
School of Eco-Environment, Hebei University, Baoding 071000, China
2
Research Center for Eco-Environmental Sciences, Chinese Academy of Sciences, Beijing 100085, China
*
Authors to whom correspondence should be addressed.
Forests 2024, 15(1), 205; https://doi.org/10.3390/f15010205
Submission received: 3 December 2023
/
Revised: 7 January 2024
/
Accepted: 8 January 2024
/
Published: 19 January 2024
(This article belongs to the Topic Climate Change and Environmental Sustainability, 3rd Volume)
Abstract
:Near-surface O3 has negative effects on plant productivity; however there were few studies on the effects of O3 pollution on the belowground part of the ecosystem. The effect of O3 stress on the belowground parts of poplar is unclear. We investigated the effects of O3 pollution on poplar rhizosphere soil in open-top chambers (OTC). Two kinds of plants with different O3 sensitivity were selected, i.e., high-sensitive poplar clone 546 and low-sensitive poplar clone 107. The control group and high-concentration O3 group were set up: charcoal-filtered air, CF; unfiltered air + 60 ppb O3, NF. Poplar rhizosphere soil was taken after 96 days (15 June to 17 September 2020) of cultivation in OTCs. O3 stress decreased the amplicon sequence variations (ASVs) of microorganisms in poplar 107 and poplar 546 rhizosphere soil, with no significant interspecific difference. The effect of O3 fumigation on the fungal community was greater than that on the bacterial community. The correlation between the bacterial community and rhizosphere soil physicochemical indices was closer than that of the fungal community. Some fungi, such as Clitopilus hobsonii, Mortierella sp., and Minimedusa, might help poplar resist the O3 stress. O3 stress had direct impacts on the pH, nutrients, and enzyme activities of rhizosphere soil, while it had indirect negative impacts on microbial community composition by nutrients. There was no difference in sensitivity between rhizosphere soil response to O3 stress of poplar clone 107 and clone 546, which might take a longer accumulation time to show the effect. This study provides a certain basis for accurately evaluating the ecological effects of O3 pollution.
1. Introduction
Since the 20th century, the concentration of near-surface ozone (O3) has increased sharply due to the rapid development of cities and the gradual completion of industrialization [1,2]. From June to August 2016, ozone replaced PM10 and PM2.5 as the primary pollutant in the three urban agglomerations of Beijing-Tianjin-Hebei, Yangtze River Delta, and Pearl River Delta in China [3]. Many studies have found that near-surface O3 could destroy photosynthetic pigments and damage chloroplasts in plants [4,5], change carbon metabolism [6,7], affect enzyme activities [8,9] and microbial communities [10,11], which might reduce production of crops and trees, and even lead to the degradation of forest ecosystem [12].
As an air pollutant with high toxicity to plants [13,14,15], near-surface O3 might cause plant-soil-microbial changes by disrupting photosynthesis and reducing antioxidant activity, thus adversely affecting plant growth [16]. In recent years, the effects of O3 on these plant processes and aboveground resource allocation have been increasingly studied [4,7,17]. However, the mechanism of how this ubiquitous pollutant changes the nutrient cycle and microbial community in subsurface soil remains to be fully clarified since there were few studies on the effects of O3 on subsurface processes, especially in forest ecosystems [18,19]. In those limited studies, the conclusions were not consistent. In terms of nutrient uptake, Singh et al. [20] found that O3 had a positive effect on the content of total nitrogen and organic matter in the soil of Michelia chapensis, while the study of Dolker et al. [8] showed that O3 had a negative effect on total nitrogen and phosphorus in tropical semi-natural grassland. In terms of enzyme activities, elevated ozone decreased the extracellular enzyme and antioxidant enzyme activities in the rhizosphere soil of L. leucocephala [20], while it increased extracellular enzyme and antioxidant enzyme activities in the rhizosphere soil of Elaeocarpus sylvestris [21]. Under different conditions, O3 increased or decreased soil microbial diversity or had no effect. Elevated O3 elicited changes in soil microbial community structure and decreased fungal diversity in both M. ichangensis and T. chinensis [22]. Elevated O3 significantly decreased bacterial abundance of poplar saplings [23]. However, the overall functional structure of soil microbial communities of wheat Yannong 19 and wheat Yangmai 16 did not significantly change by elevated O3 [24].
The activity of soil extracellular enzymes was closely related to microbial metabolism and the biochemical cycle of nutrients. β-Glucosidase (βG) [25], β-N-acetylglucosaminidase (NAG) [26], cellobiose hydrolase (CBH) [27], leucine aminopeptidase (LAP), and alkaline phosphatase (AKP) [28] were key soil extracellular enzymes. The ability of key extracellular enzymes to respond to the environment was an important potential indicator to evaluate soil microbial quality [29].
More than 98% of forest area in China is threatened by O3 pollution [4]. The fast-growing poplar plantation is the second-largest plantation in China [30]. The production physiology and morphology of poplar have been studied in-depth [31]. At present, the studies on the responses of poplars to O3 stress mainly focused on nutrient content changes in different parts of poplar [6,32,33] and photosynthesis index [4,32,34], etc. However, there were few studies on the changes in belowground parts of poplar under O3 stress. O3 breaks down rapidly when exposed to plants or soil; therefore, it is unlikely that O3 reaches biologically significant depths in the soil. Thus, we hypothesized that the effect of O3 on the belowground part of poplar may be indirect. Therefore, in this study, two poplar genotypes with different sensitivity to O3 were selected as the research objects, and open-top chambers (OTCs) were used to simulate the condition of O3 stress. After 96 days of cultivation, the rhizosphere soil was sampled to determine the soil physicochemical indices and enzyme activities. At the same time, MiSeq sequencing was used to analyze the changes of bacterial and fungal communities in rhizosphere soil, thus fully understanding the response of poplar to O3 stress.
2. Materials and Methods
2.1. Soil Collection and Sample Treatment
The experimental site is located at Yanqing Ozone Research Base in Beijing (40°47′ N, 116°34′ E). Poplars with different sensitivity to O3 but similar leaf morphology and phenological characteristics [33] were selected as poplar clone ‘107’ (Populus. euramericana cv. ‘74/76’, low sensitive type) and poplar clone ‘546’ (P. deltoides cv. ‘55/56’ × P. deltoides cv. ‘Imperial’, high sensitive type). Open-top chambers (OTC) were used for fumigation, and two groups of ozone treatment were set up: charcoal-filtered air, CF; unfiltered air + 60 ppb O3, NF. The average daily O3 concentrations for CF and NF treatments were 22.9 ± 0.72 ppb and 85.1 ± 1.88 ppb, respectively. The four groups of treatments were marked as Y107CF, Y107NF, Y546CF, and Y546NF, respectively. Each group had 3 OTC replicates of 6 saplings. The O3 fumigation time was 10 h per day (8:00–18:00). Poplar saplings were well watered during the trial period (15 June–17 September 2020) as needed.
The root cuttings of poplar clones ‘107’ and ‘546’ were planted for 5 weeks and then moved to round plastic pots filled with natural brown sandy loam. After 10 days of OTCs (12.5 m2, 3.0 m high, covered with toughened glass), they were randomly assigned to OTCs for 96 days of cultivation, and the rhizosphere soil was taken from the poplars after cultivation.
The roots of poplars were taken out from the potted plants and shaken to remove the loose soil at the roots. The soil that remained attached to the roots, about 1 mm thick and defined as the rhizosphere soil [35], was removed with a sterile brush and collected. The rhizosphere soil was placed on ice for transport to the laboratory. The rhizosphere soil was divided into two parts: one was stored at 4 °C for chemical analysis, and the other was stored at −20 °C for molecular analysis.
2.2. Determination of Rhizosphere Soil Physicochemical Indices
Soil water content (SWC) was determined by the drying method. Soil pH was determined by ST3100 soil pH meter (Ohaus, Shanghai, China) (soil water ratio 2.5:1). Soil total nitrogen (TN) and alkali-hydrolyzable nitrogen (AN) were determined by Kjeldahl method and hydrochloric acid standard solution. Soil organic matter (SOM) was determined by oxidation of potassium dichromate-sulfuric acid solution for the fresh soil samples from air drying and sieving (0.25 mm). Soil total phosphorus (TP) and total potassium (TK) were determined according to molybdenum antimony resistance colorimetry and hydrofluoric acid digestion methods. Available phosphorus (AP) and available potassium (AK) were determined by the Mo-Sb colorimetric method and flame photometer, while soil enzyme activities were determined by the microplate fluorescence method, and the selection of soil enzymes and reaction substrates (RHAWN, Shanghai, China) were shown in Table S1.
2.3. 16s rRNA and Fungal ITS Amplification for MiSeq Sequencing
16s rRNA gene of bacteria in V3-V4 region was amplified by primers 338F (5′-ACTCCTACGGGAGGCAGCAG-3′) and 806R (5′-GGACTACHVGGGTWTCTAAT-3′) [36]. The primers ITS1F (5′-CTTGGTCATTTAGAGGAA GTAA-3′) and ITS2R (5′-GCTGCGTTCTTCATCGATGC-3′) were selected to amplify the fungal ITS gene in the ITS1 region [37]. The sequencing was performed by the Illumina MiSeq PE250 sequencing platform by Majorbio Bio-pharm Technology Co., Ltd. (Shanghai, China). The original sequence data has been uploaded to the NCBI SRA database and can be obtained with the accession code PRJNA819584 for bacteria and PRJNA819497 for fungi.
2.4. Data Analysis
Excel 2020 and SPSS (23.0) were used for statistical analysis. The Venn diagram of the ASV table was processed on the I-SANGER http://www.i-sanger.com/ (accessed on 21 August 2021) platform. The box diagram of the microbial diversity index and Mantel test were analyzed and plotted using R language.
A structural equation model (SEM) was used to evaluate the effects of elevated O3 concentration and plant types on soil nutrients, pH, enzyme activities, and microbial community composition. The O3 variable was built by assigning the value 1 to the NF treatment and 0 to the CF treatment. Bacterial and fungal communities were represented by the first axis of their corresponding nonmetric multidimensional scale analysis (NMDS). All variables were standardized by Z transformation (mean = 0, standard deviation = 1) using the “scale” function. The fitting degree of SEM was determined by a non-significant Chi-square test (χ2 < 3, p > 0.05), the goodness of fit index (GFI > 0.80), and root mean square error of approximation (RMSEA < 0.05).
3. Results
3.1. Physicochemical Indices and Enzyme Activities of Rhizosphere Soil
Table 1 showed that there was no significant difference in physicochemical indices of rhizosphere soil among poplar groups except TK, AN, and pH. The content of TK in the NF group was significantly higher than that in the CF group (p = 0.006), while the amount of AN in the NF group was significantly lower than that in the CF group (p = 0.032). The pH of Y107 in the NF group was lower than that in the CF group, while the pH of Y546 in the NF group was higher than that in the CF group, and there was a significant difference in the pH of the CF group with two different poplar genotypes.
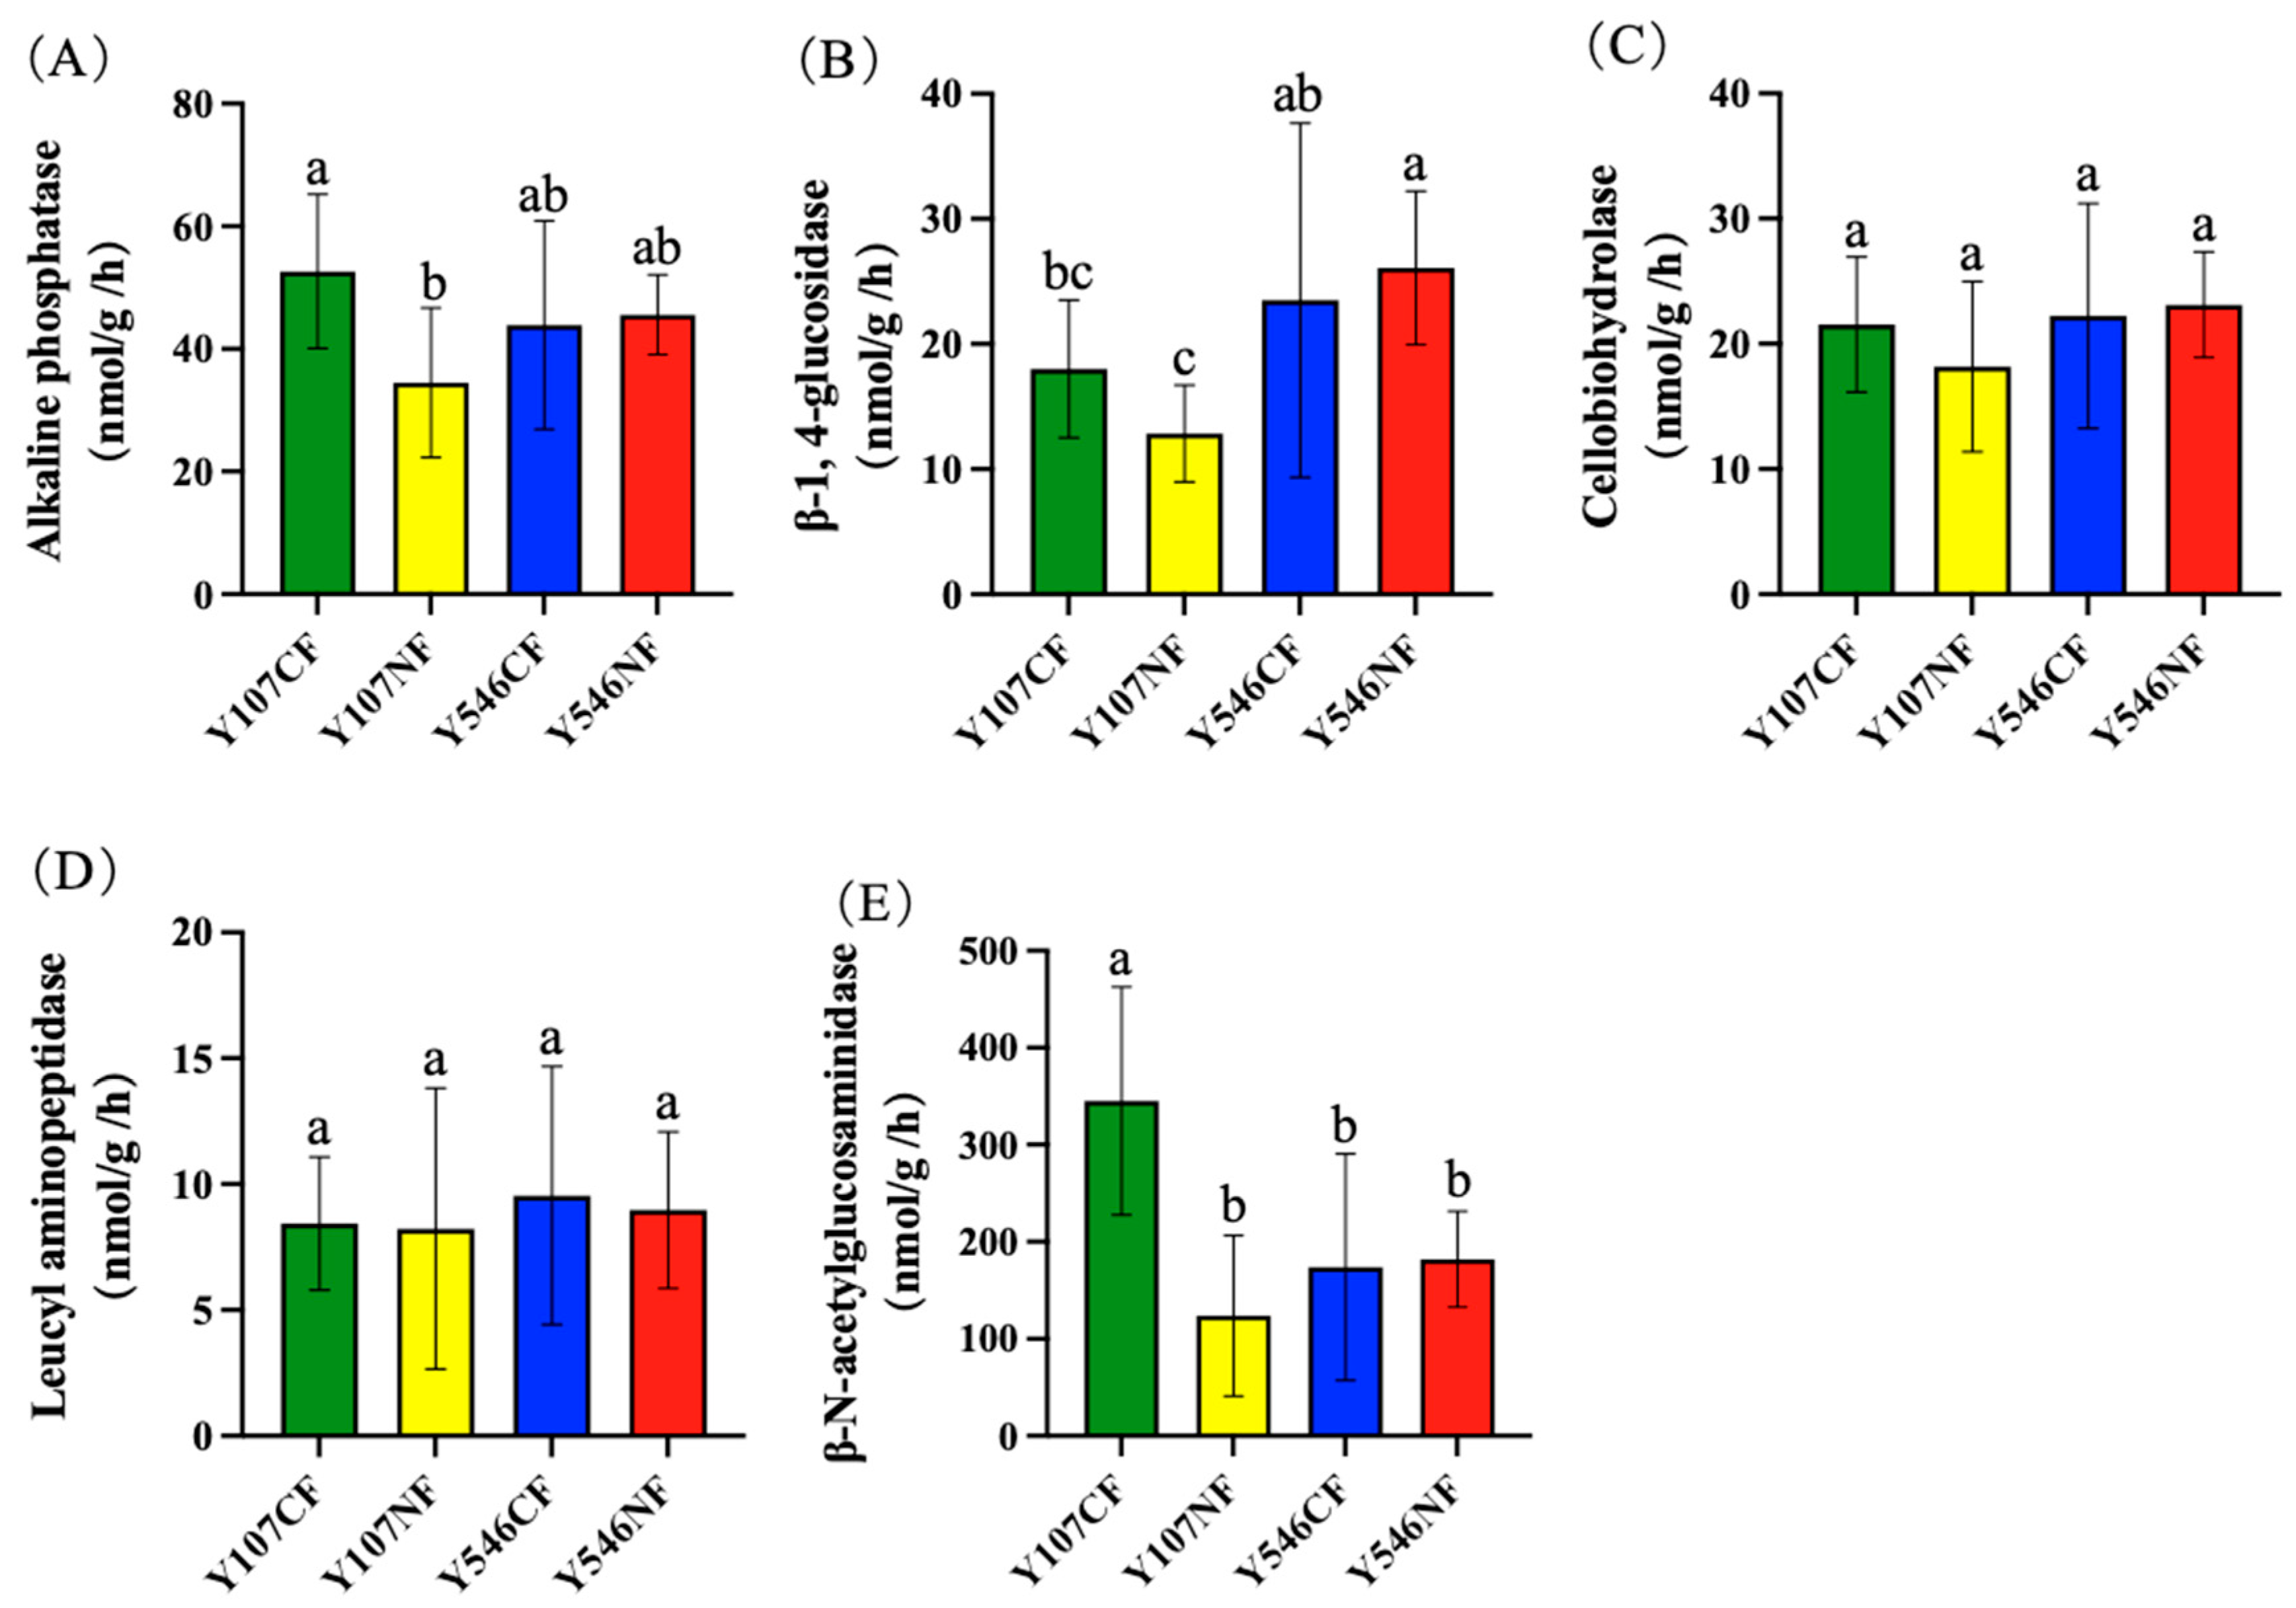
As shown in Figure 1, five rhizosphere soil extracellular enzymes were analyzed in this study, and only the activities of AKP and NAG in Y107NF were significantly lower than those in Y107CF. Among the five enzymes, NAG had the strongest activity, which was as high as 345.32 nmol·g−1·h−1 in Y107CF (Figure 1E). The activities of βG, CBH, and LAP in the rhizosphere soil of Y107NF were also lower than those of the CF group; however, the difference was not significant (Figure 1B–D). The above results indicated that O3 fumigation decreased the enzyme activities in the rhizosphere soil of poplar clone 107. The five enzymes in the rhizosphere soil of poplar clone 546 showed no significant changes, indicating that O3 fumigation had little effect on the enzyme activities in the rhizosphere soil of poplar clone 546.
As illustrated in Table S2, there was a significant negative correlation between LAP and pH (p < 0.05) and a significant positive correlation between NAG and SOM (p < 0.05). There was no significant correlation between the activities of other enzymes and the measured soil physicochemical indices.
3.2. ASV Analysis of Soil Microorganisms
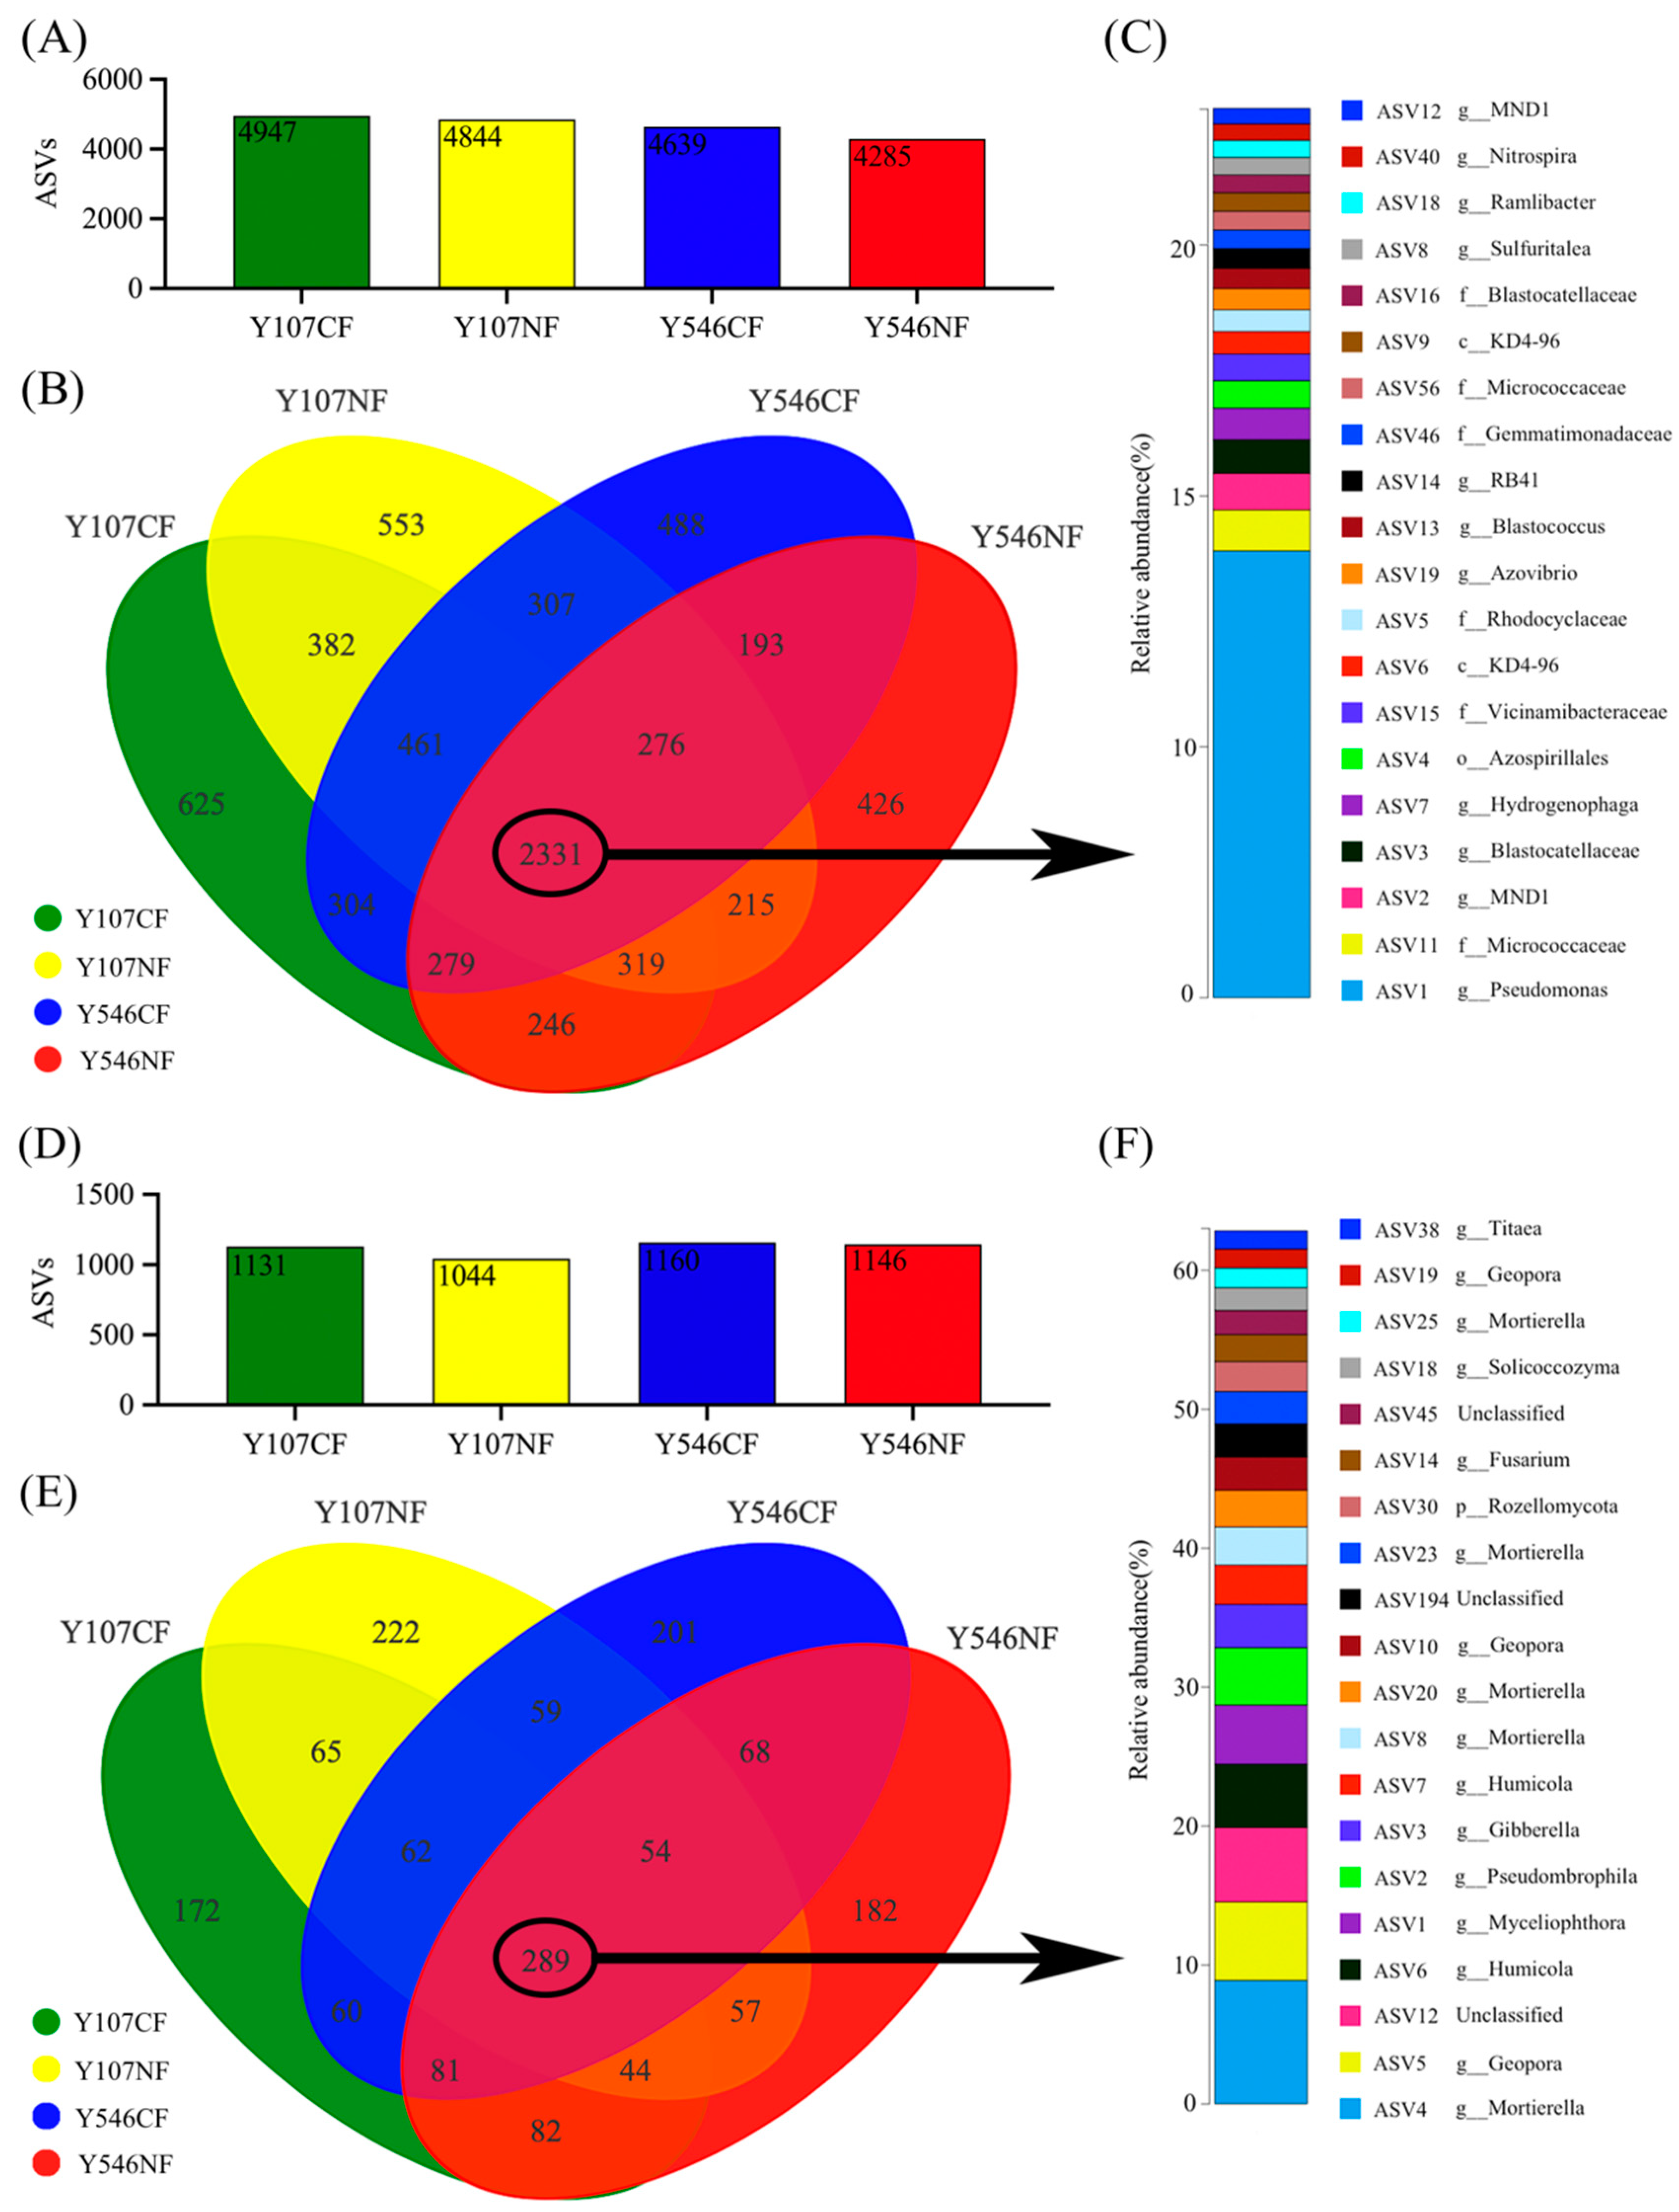
Amplicon sequence variations (ASVs) were widely used as the method for analyzing microbial communities, which could reach a finer classification level [38]. At the ASV level, a total of 7405 ASVs were obtained from bacterial samples after screening and flattening, and the ASVs contained in each group were 4947, 4844, 4639, and 4285, respectively (Figure 2A), while 1698 ASVs were obtained from fungal samples after screening, and the ASVs contained in each group was 1131, 1044, 1160 and 1146 respectively (Figure 2D). This showed that the increase in O3 concentration could reduce the ASVs of poplar rhizosphere soil; however, there was no significant difference. The Venn diagram in Figure 2B showed that the four groups of bacteria shared 2331 ASVs, accounting for 31.48% of the total. The four groups of fungi shared 289 ASVs (Figure 2E), accounting for 17.02% of the total. Those shared bacterial and fungal groups played a key role in maintaining the stability of the microbial community in poplar rhizosphere soil and responding to environmental changes. The proportion of shared bacteria was one time higher than that of fungi, indicating that the effect of high concentration O3 on bacterial community was less than that on fungal community. Among the shared ASVs, the richest 20 bacterial ASVs are shown in Figure 2C. Most of these microbial floras came from Proteobacteria, Actinobacteriota, Acidobacteriota, Gemmatimonadota, and Nitrospirae. The top 20 most abundant fungi ASVs are shown in Figure 2F. The above fungal communities belonged to Ascomycota, Mortierellomycota, Rozellomycota, and Basidiomycota.
3.3. Analysis of Soil Microbial Diversity
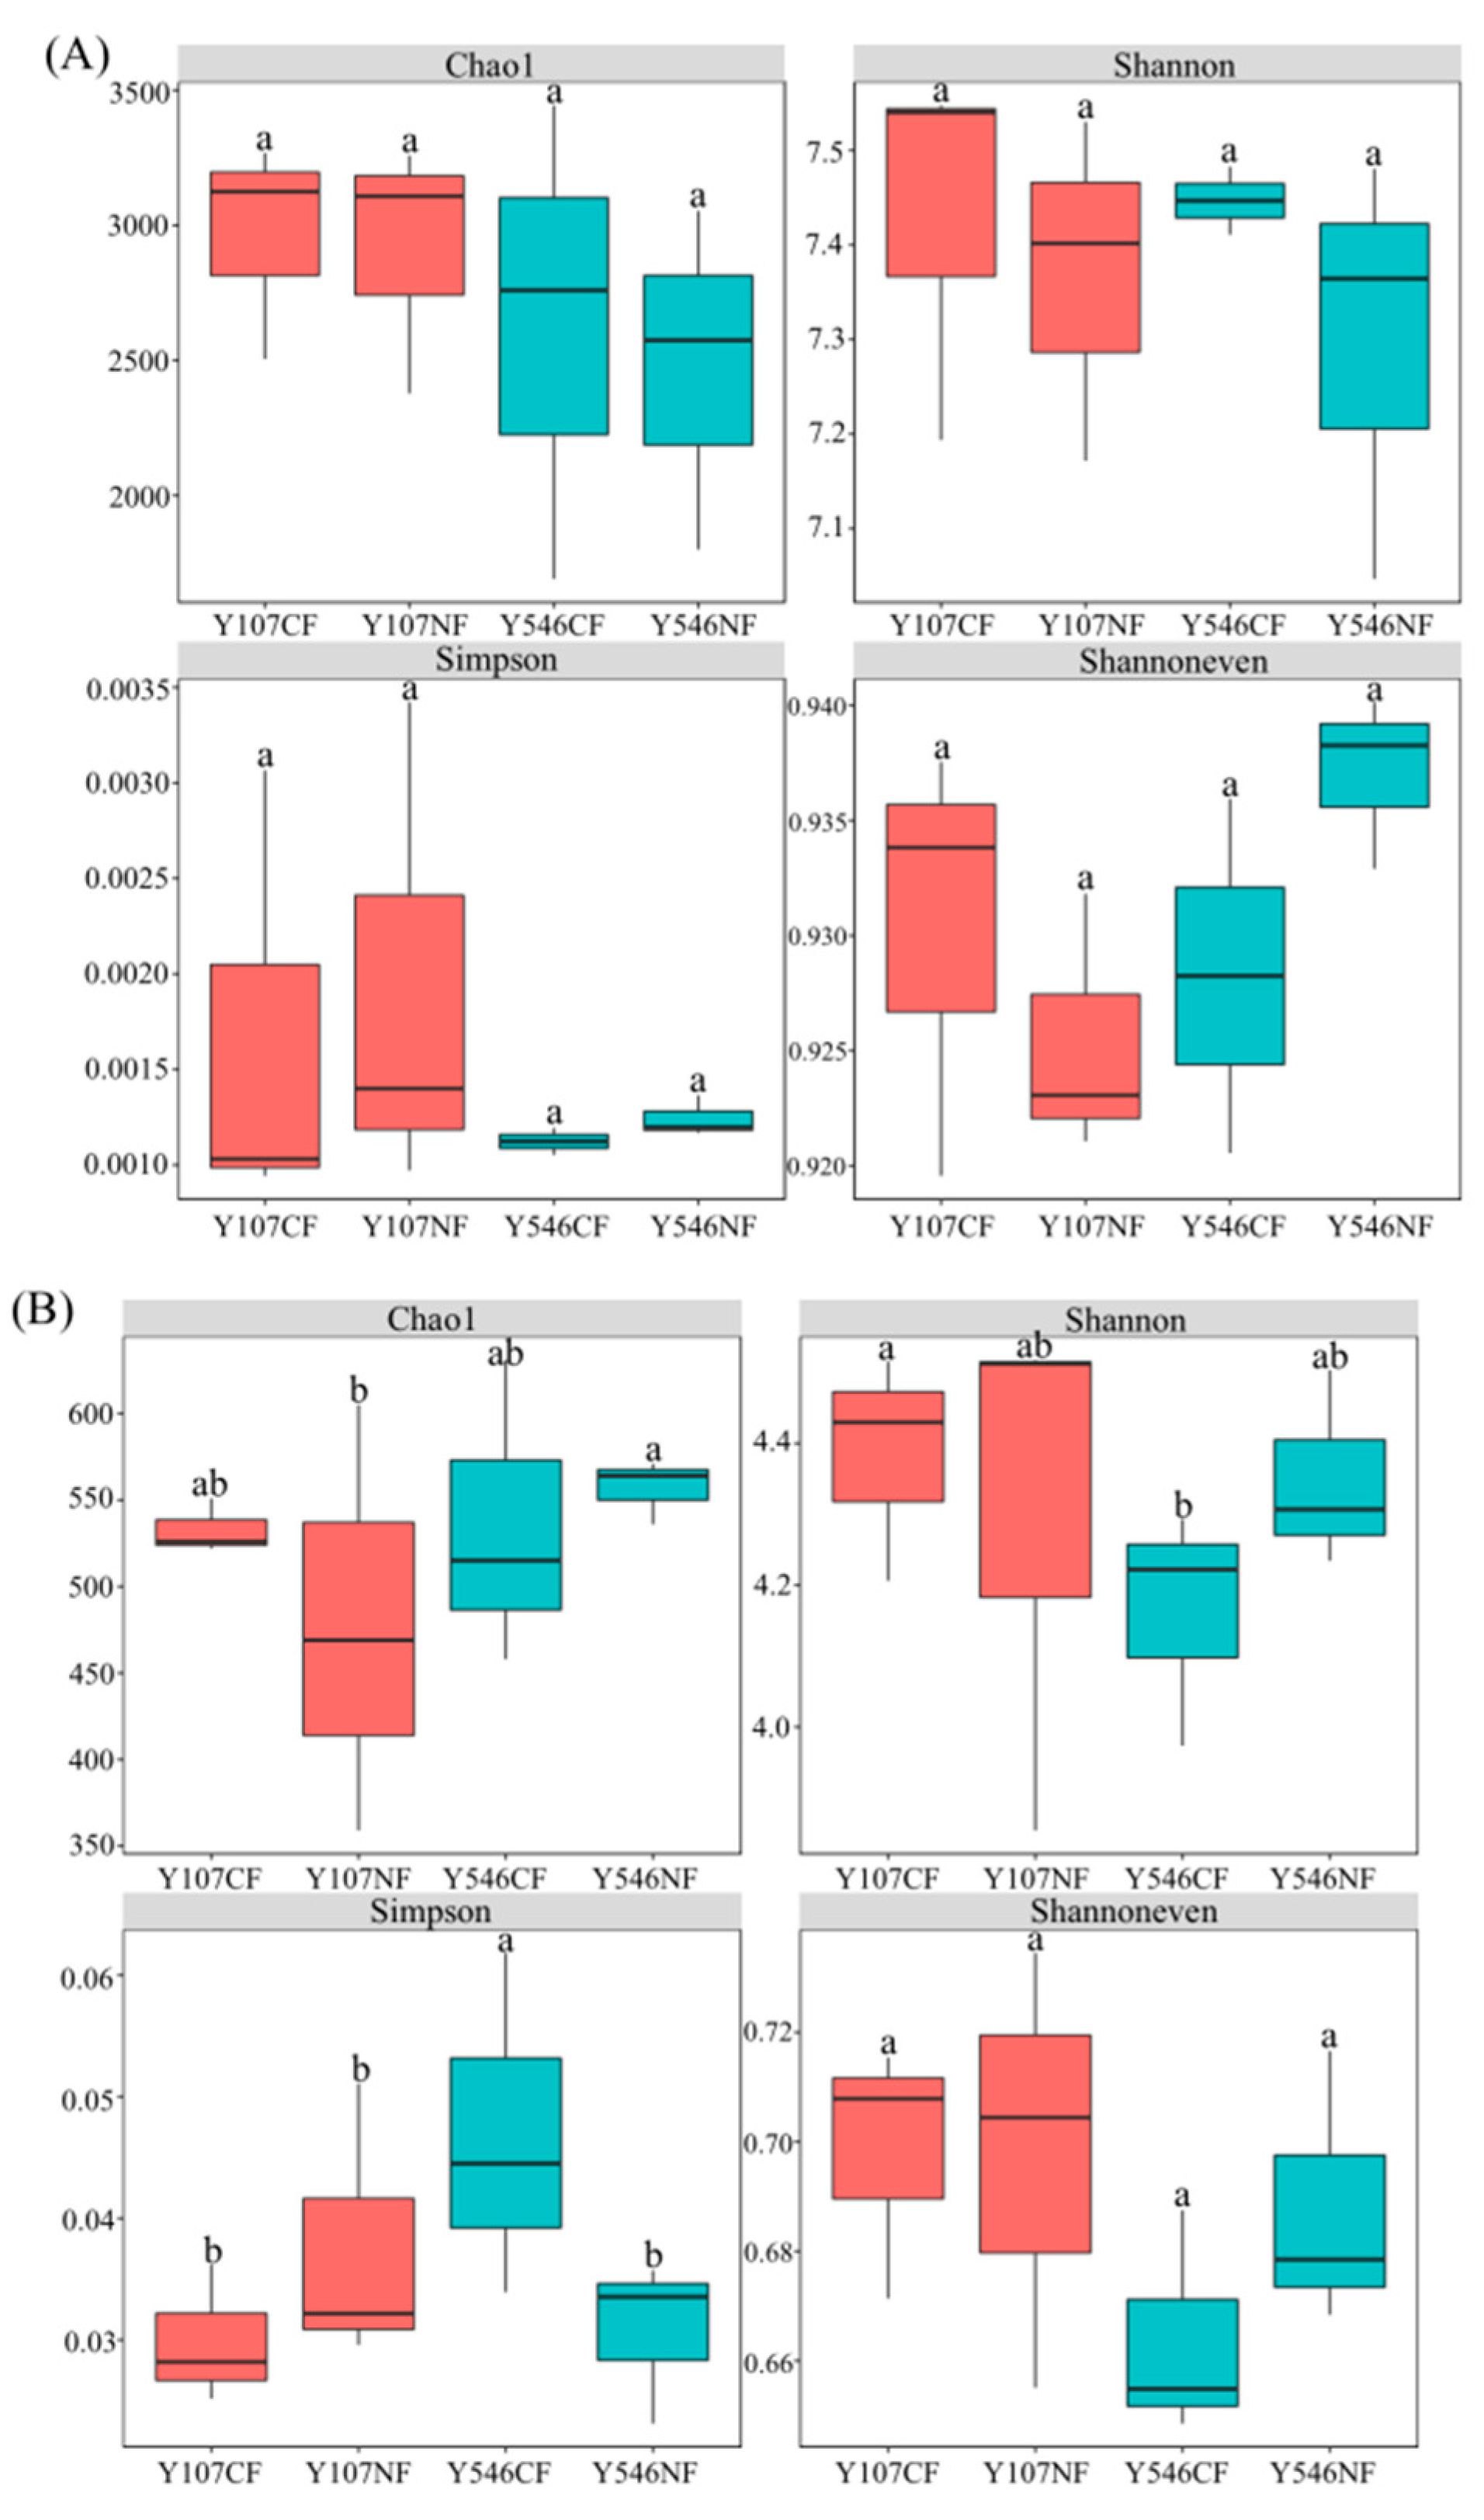
Soil microbial diversity is one of the key factors affecting the structure and function of the belowground ecosystem [39]. The boxplot (Figure 3A) showed that there was no significant difference in the diversity, richness, and evenness of bacteria in poplar rhizosphere soil. The average levels of the Chao1 index and Shannon index of the NF group were lower than those of the CF group, while the Simpson index of the NF group was slightly higher than that of the CF group. The results indicated that the increased O3 concentration caused a decrease in the diversity and richness of bacteria in poplar rhizosphere soil; however, with little effect.
The results of fungal α-diversity indices (Figure 3B) showed that the increase of O3 resulted in a significant difference in the Chao1 index between Y107NF and Y546NF. The increase of O3 concentration significantly decreased the Simpson index of highly sensitive poplar clone 546, indicating that the soil fungal diversity of poplar clone 546 increased significantly. Shannon index also showed a similar trend but with no significant difference in the results. There was no significant difference in the Shannoneven index among the four groups. The results showed that the effect of O3 fumigation on the fungal diversity in poplar rhizosphere soil was greater than that on the bacterial diversity.
3.4. Community Composition and Species Difference of Soil Bacterial Community
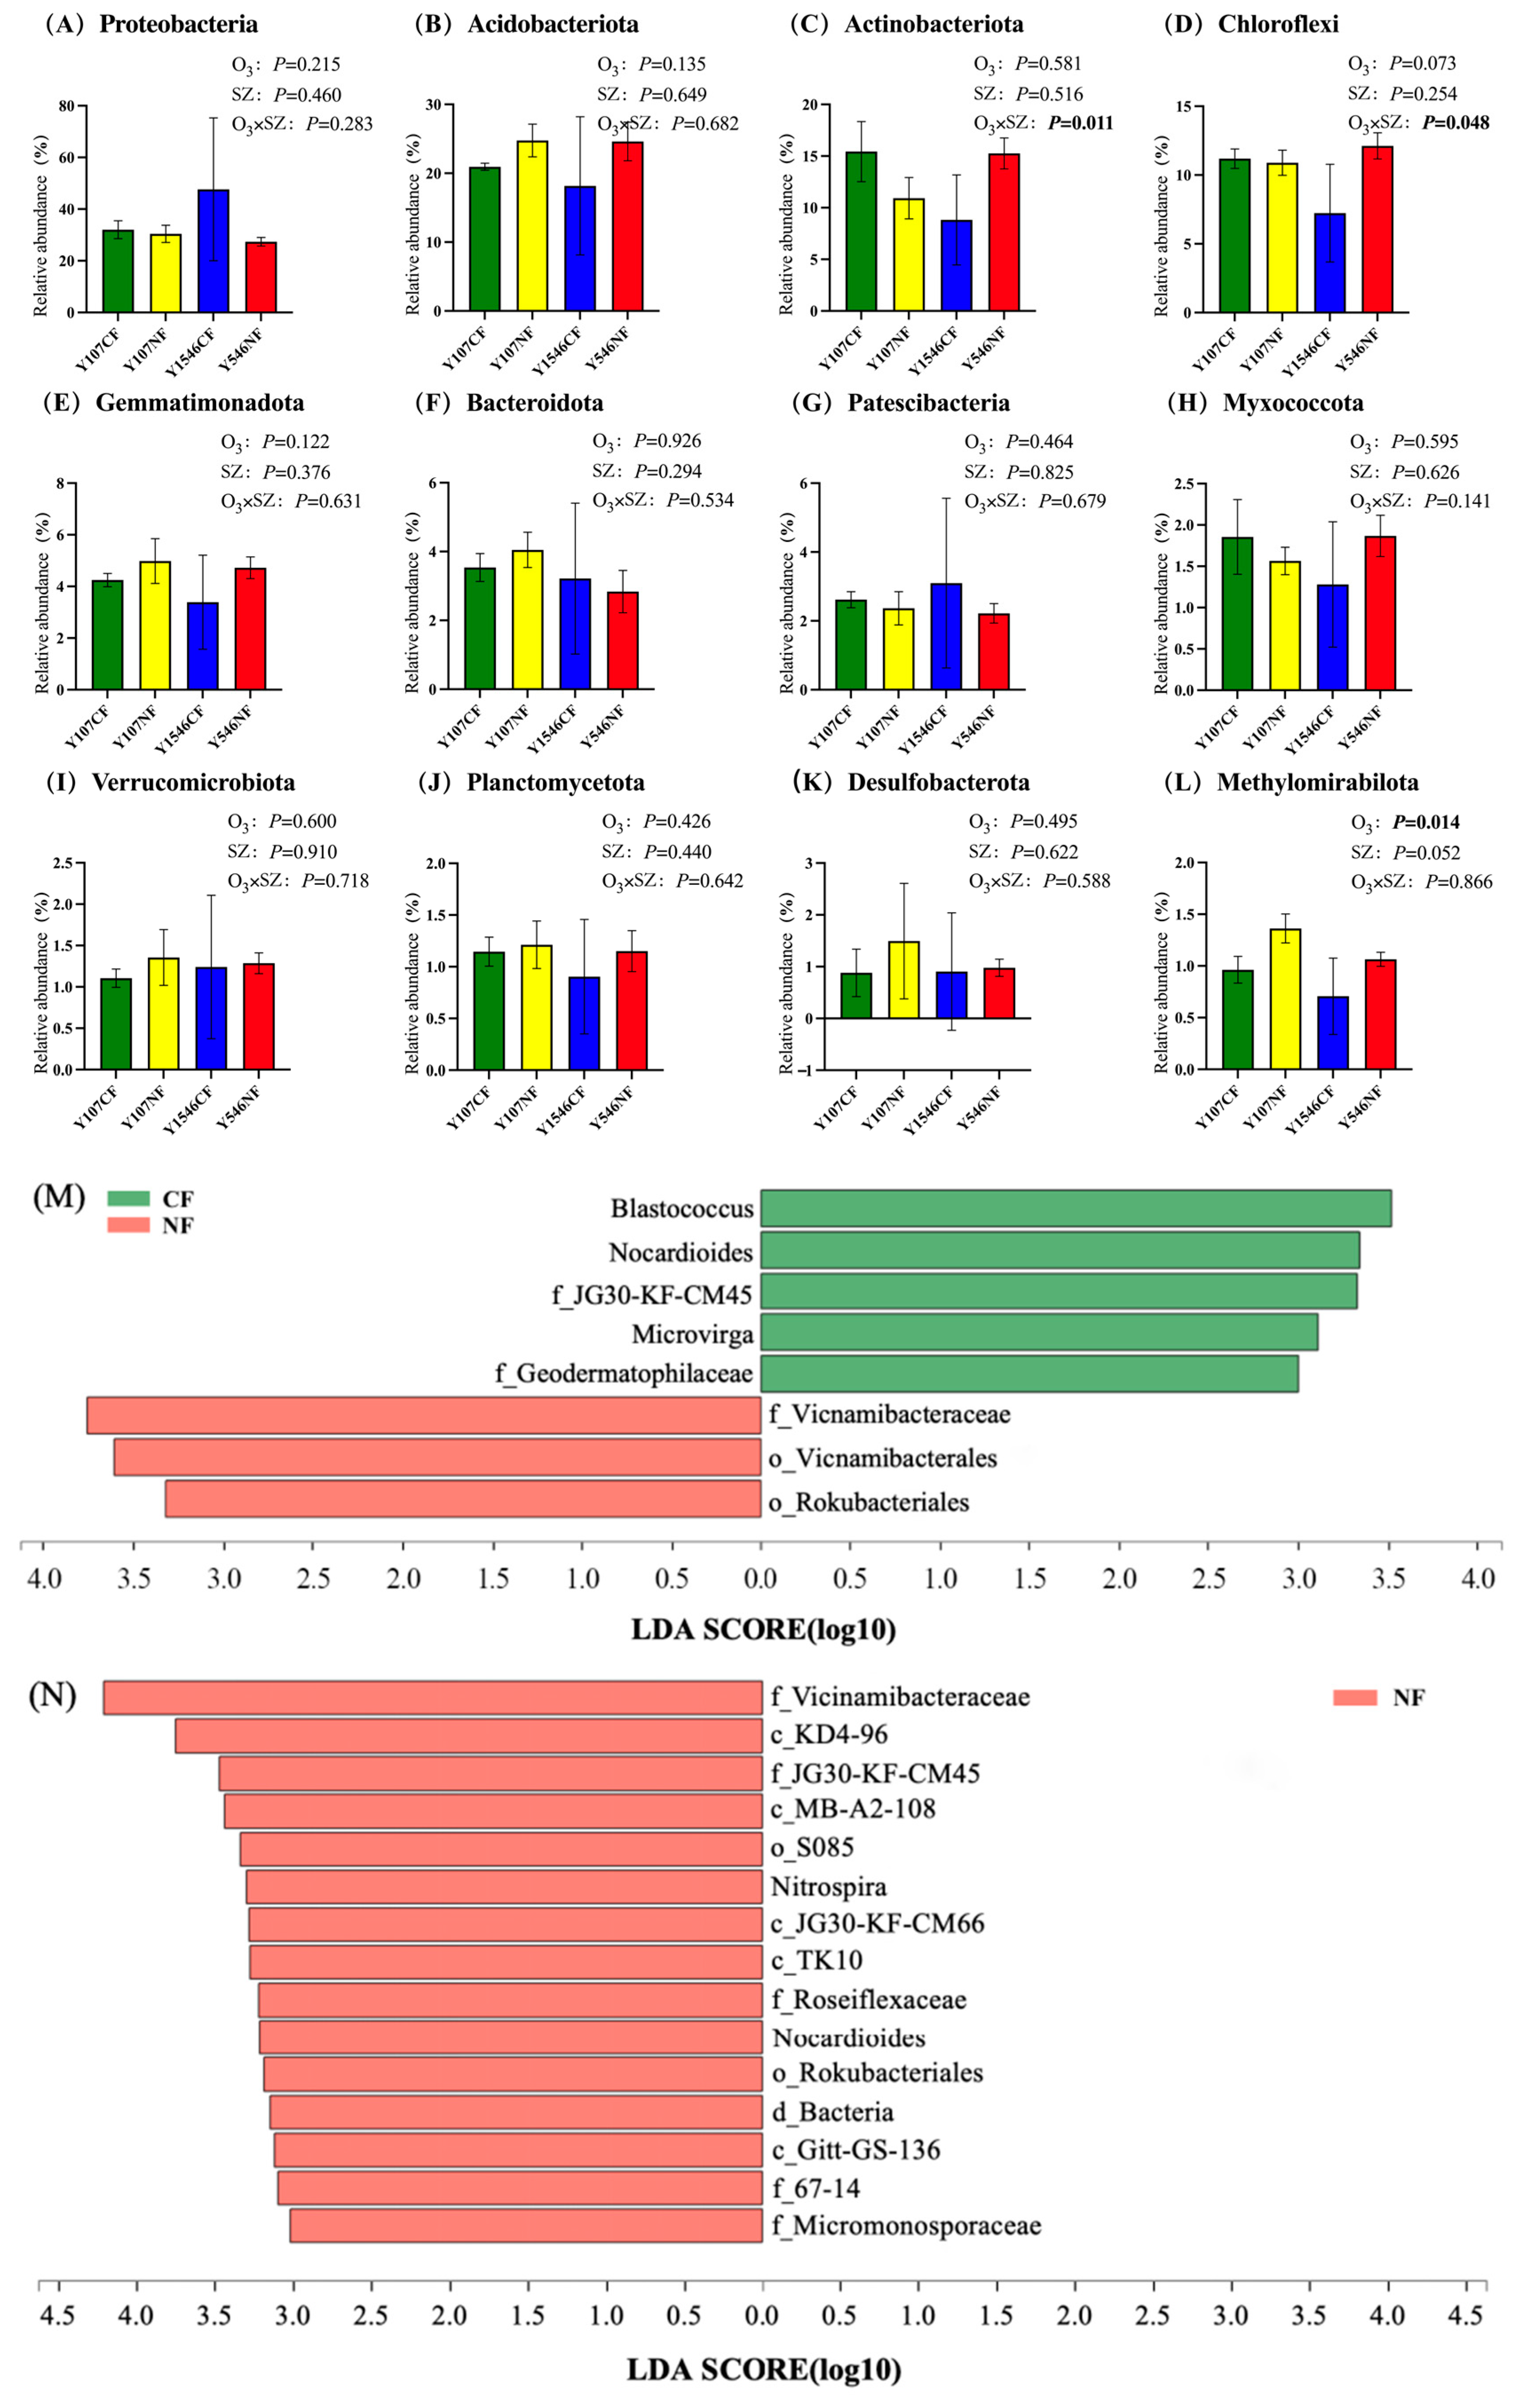
At the phylum level, after averaging the relative abundance of each kind of bacteria in the sample, there were 12 phyla with a relative abundance of more than 1% (Figure 4A–L). Among them, only the relative abundance of Methylomirabilota changed significantly and increased with the increase of O3 concentration (p < 0.05, Figure 4L). Most of the bacteria in Methylomirabilota are related to the nitrogen cycle. The interaction between the changes in tree species and the increase of O3 concentration significantly affected the relative abundance of Actinobacteriota and Chloroflexi (Figure 4C,D). Overall, the O3 concentration had little effect on the relative abundance of bacteria.
At the genus level, LEfSe (linear discriminant analysis effect size) was used to analyze the differences among different treatments. Compared with the CF group, the relative abundances of Vicinamibacteraceae, Vicinamibacterales, and Rokubacteriales in the high-concentration O3 treatment (NF) increased significantly in poplar clone 107 (Figure 4M). In the NF group of poplar clone 546, the relative abundance of Vicinamibacteraceae, KD4-96, JG30-KF-CM45, MB-A2-108, S085, Nitrospira, JG30-KF-CM66, TK10, Roseiflexaceae, Nocardioides, Rokubacteriales, Gitt-GS-136, 67-14, and Micromonosporaceae increased (Figure 4N).
3.5. Community Composition and Species Difference of Soil Fungal Community
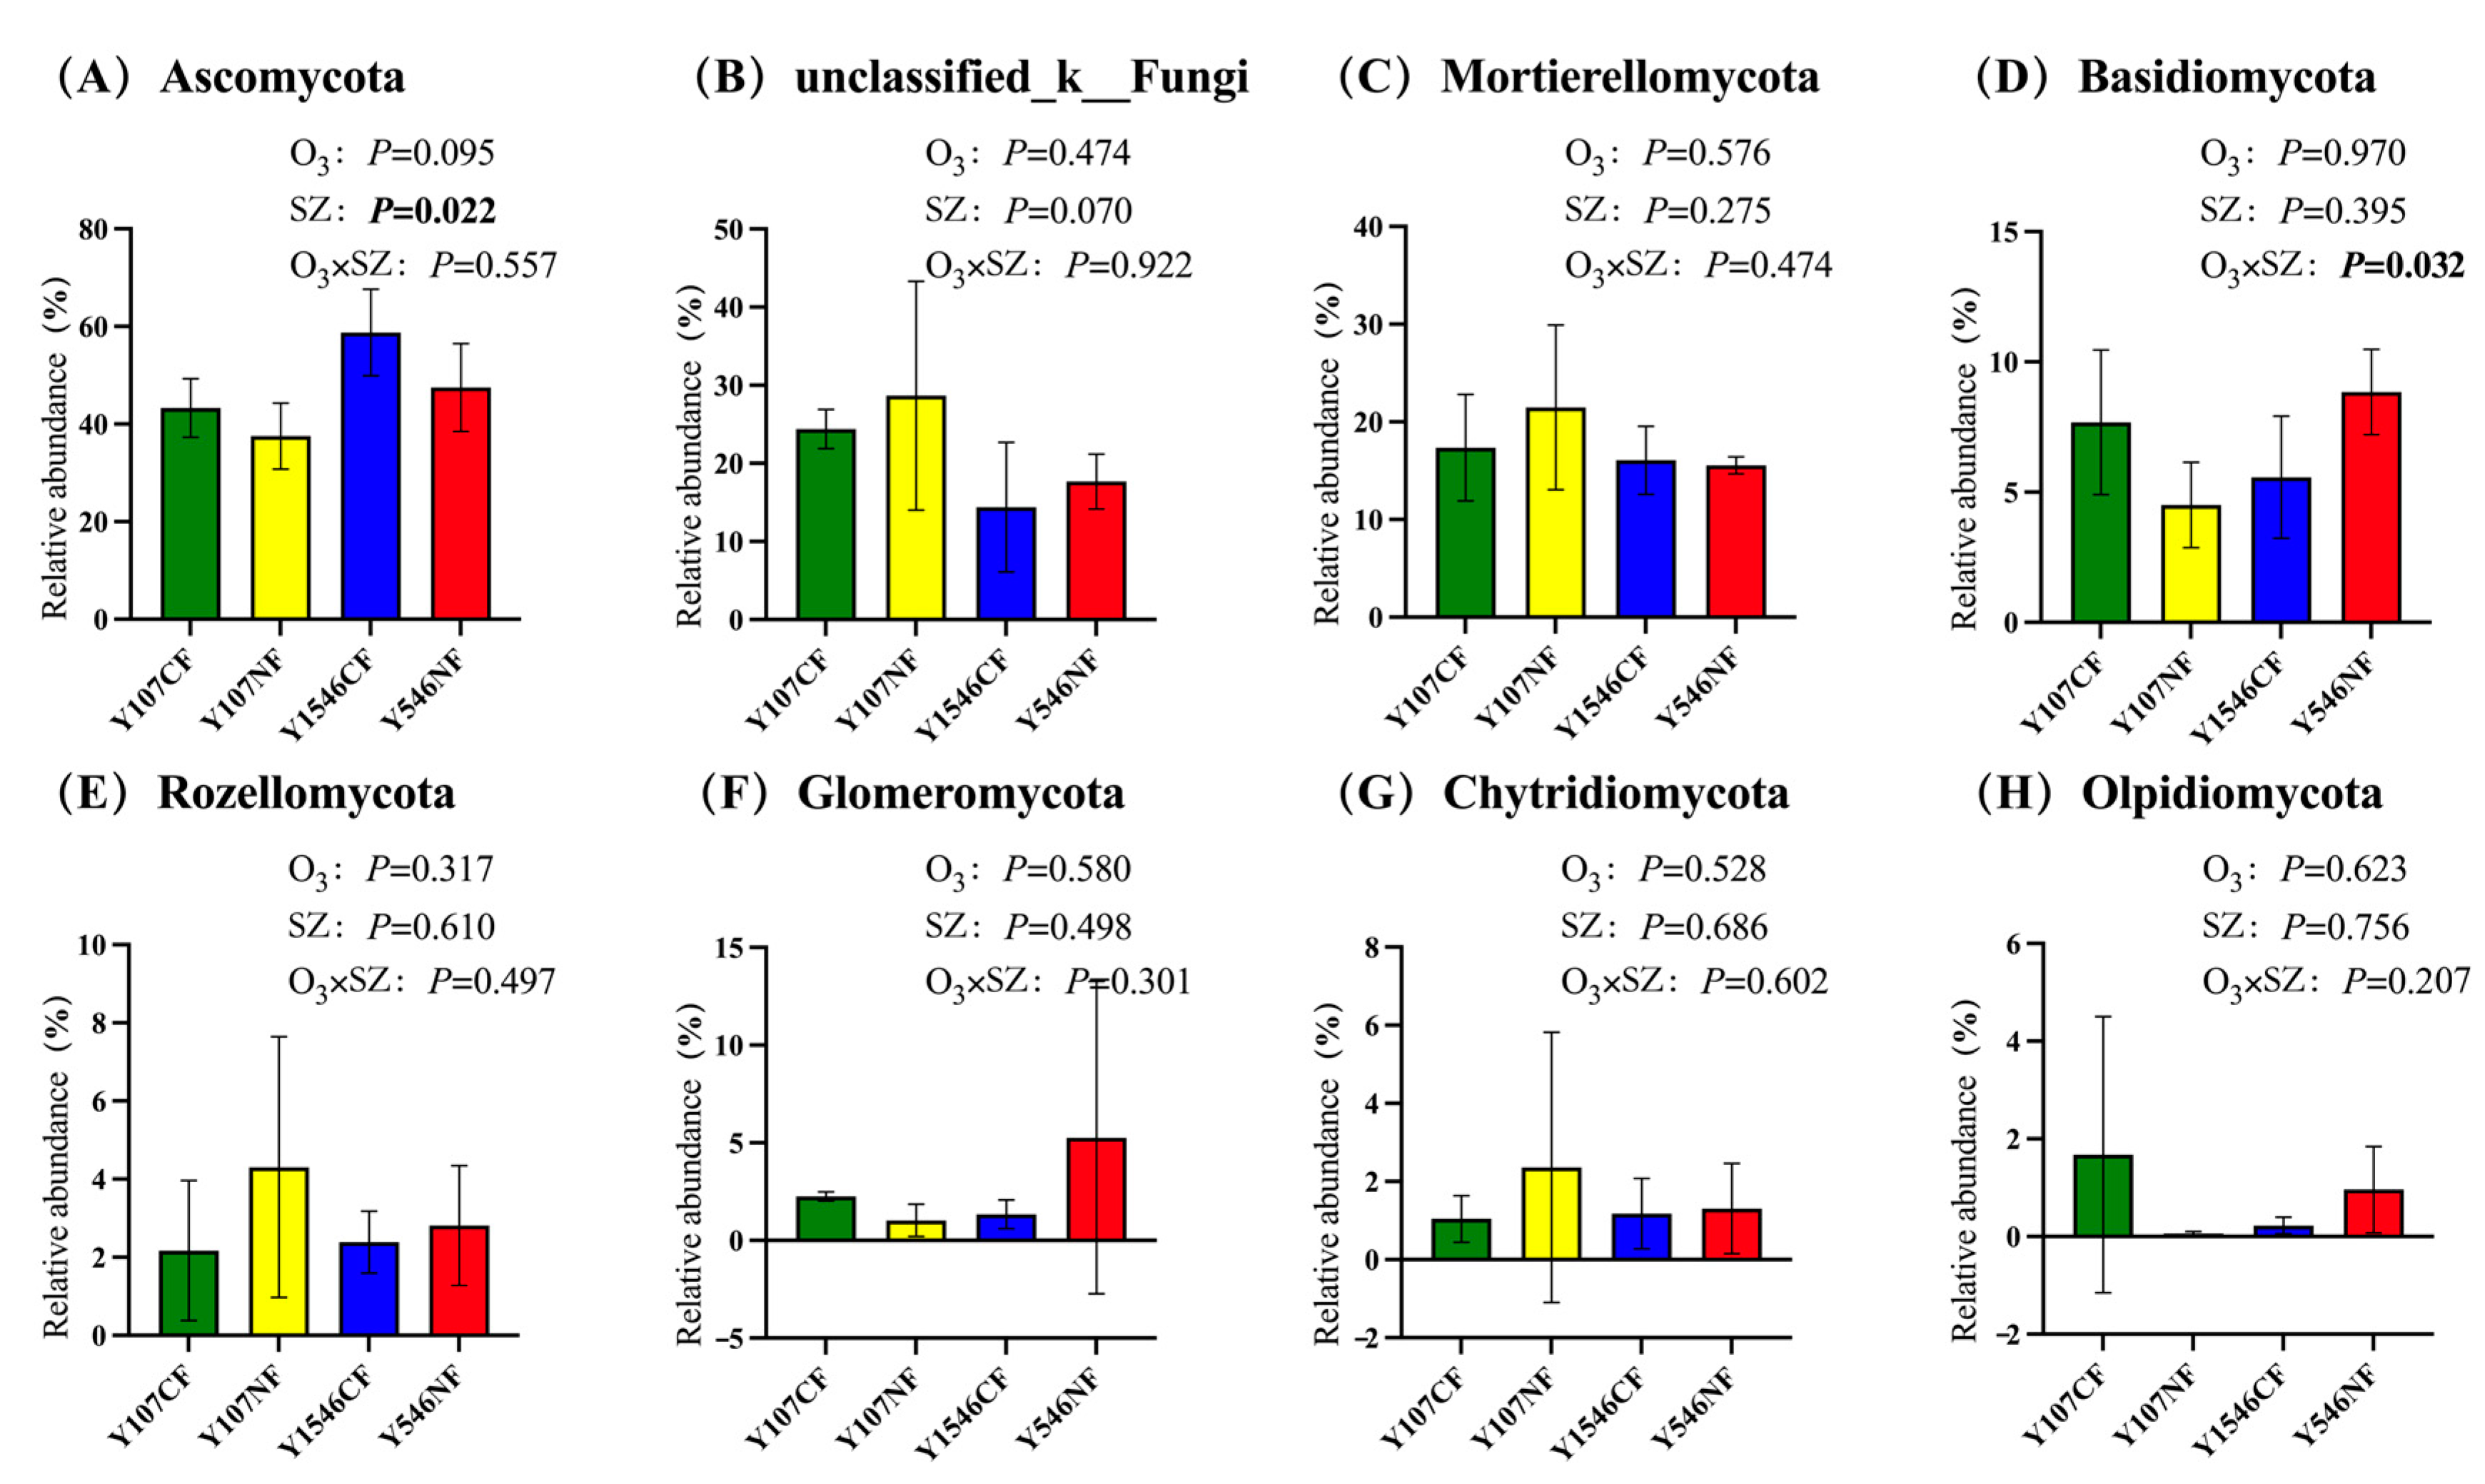
In the phylum level of fungi, there were 8 phyla, which made up more than 90% of the total sequence. The results showed that the relative abundance of Ascomycota in the rhizosphere soil of poplar clone 546 was significantly higher than that of poplar clone 107 (Figure 5A). The relative abundance of Basidiomycota changed significantly with the increase of O3 concentration and different tree species (Figure 5D). However, the O3 concentration change did not cause a significant increase or decrease in these eight fungal phyla (Figure 5A–H), indicating that the increase of O3 concentration had no significant effect on fungi communities at the phylum level in poplar rhizosphere soil.
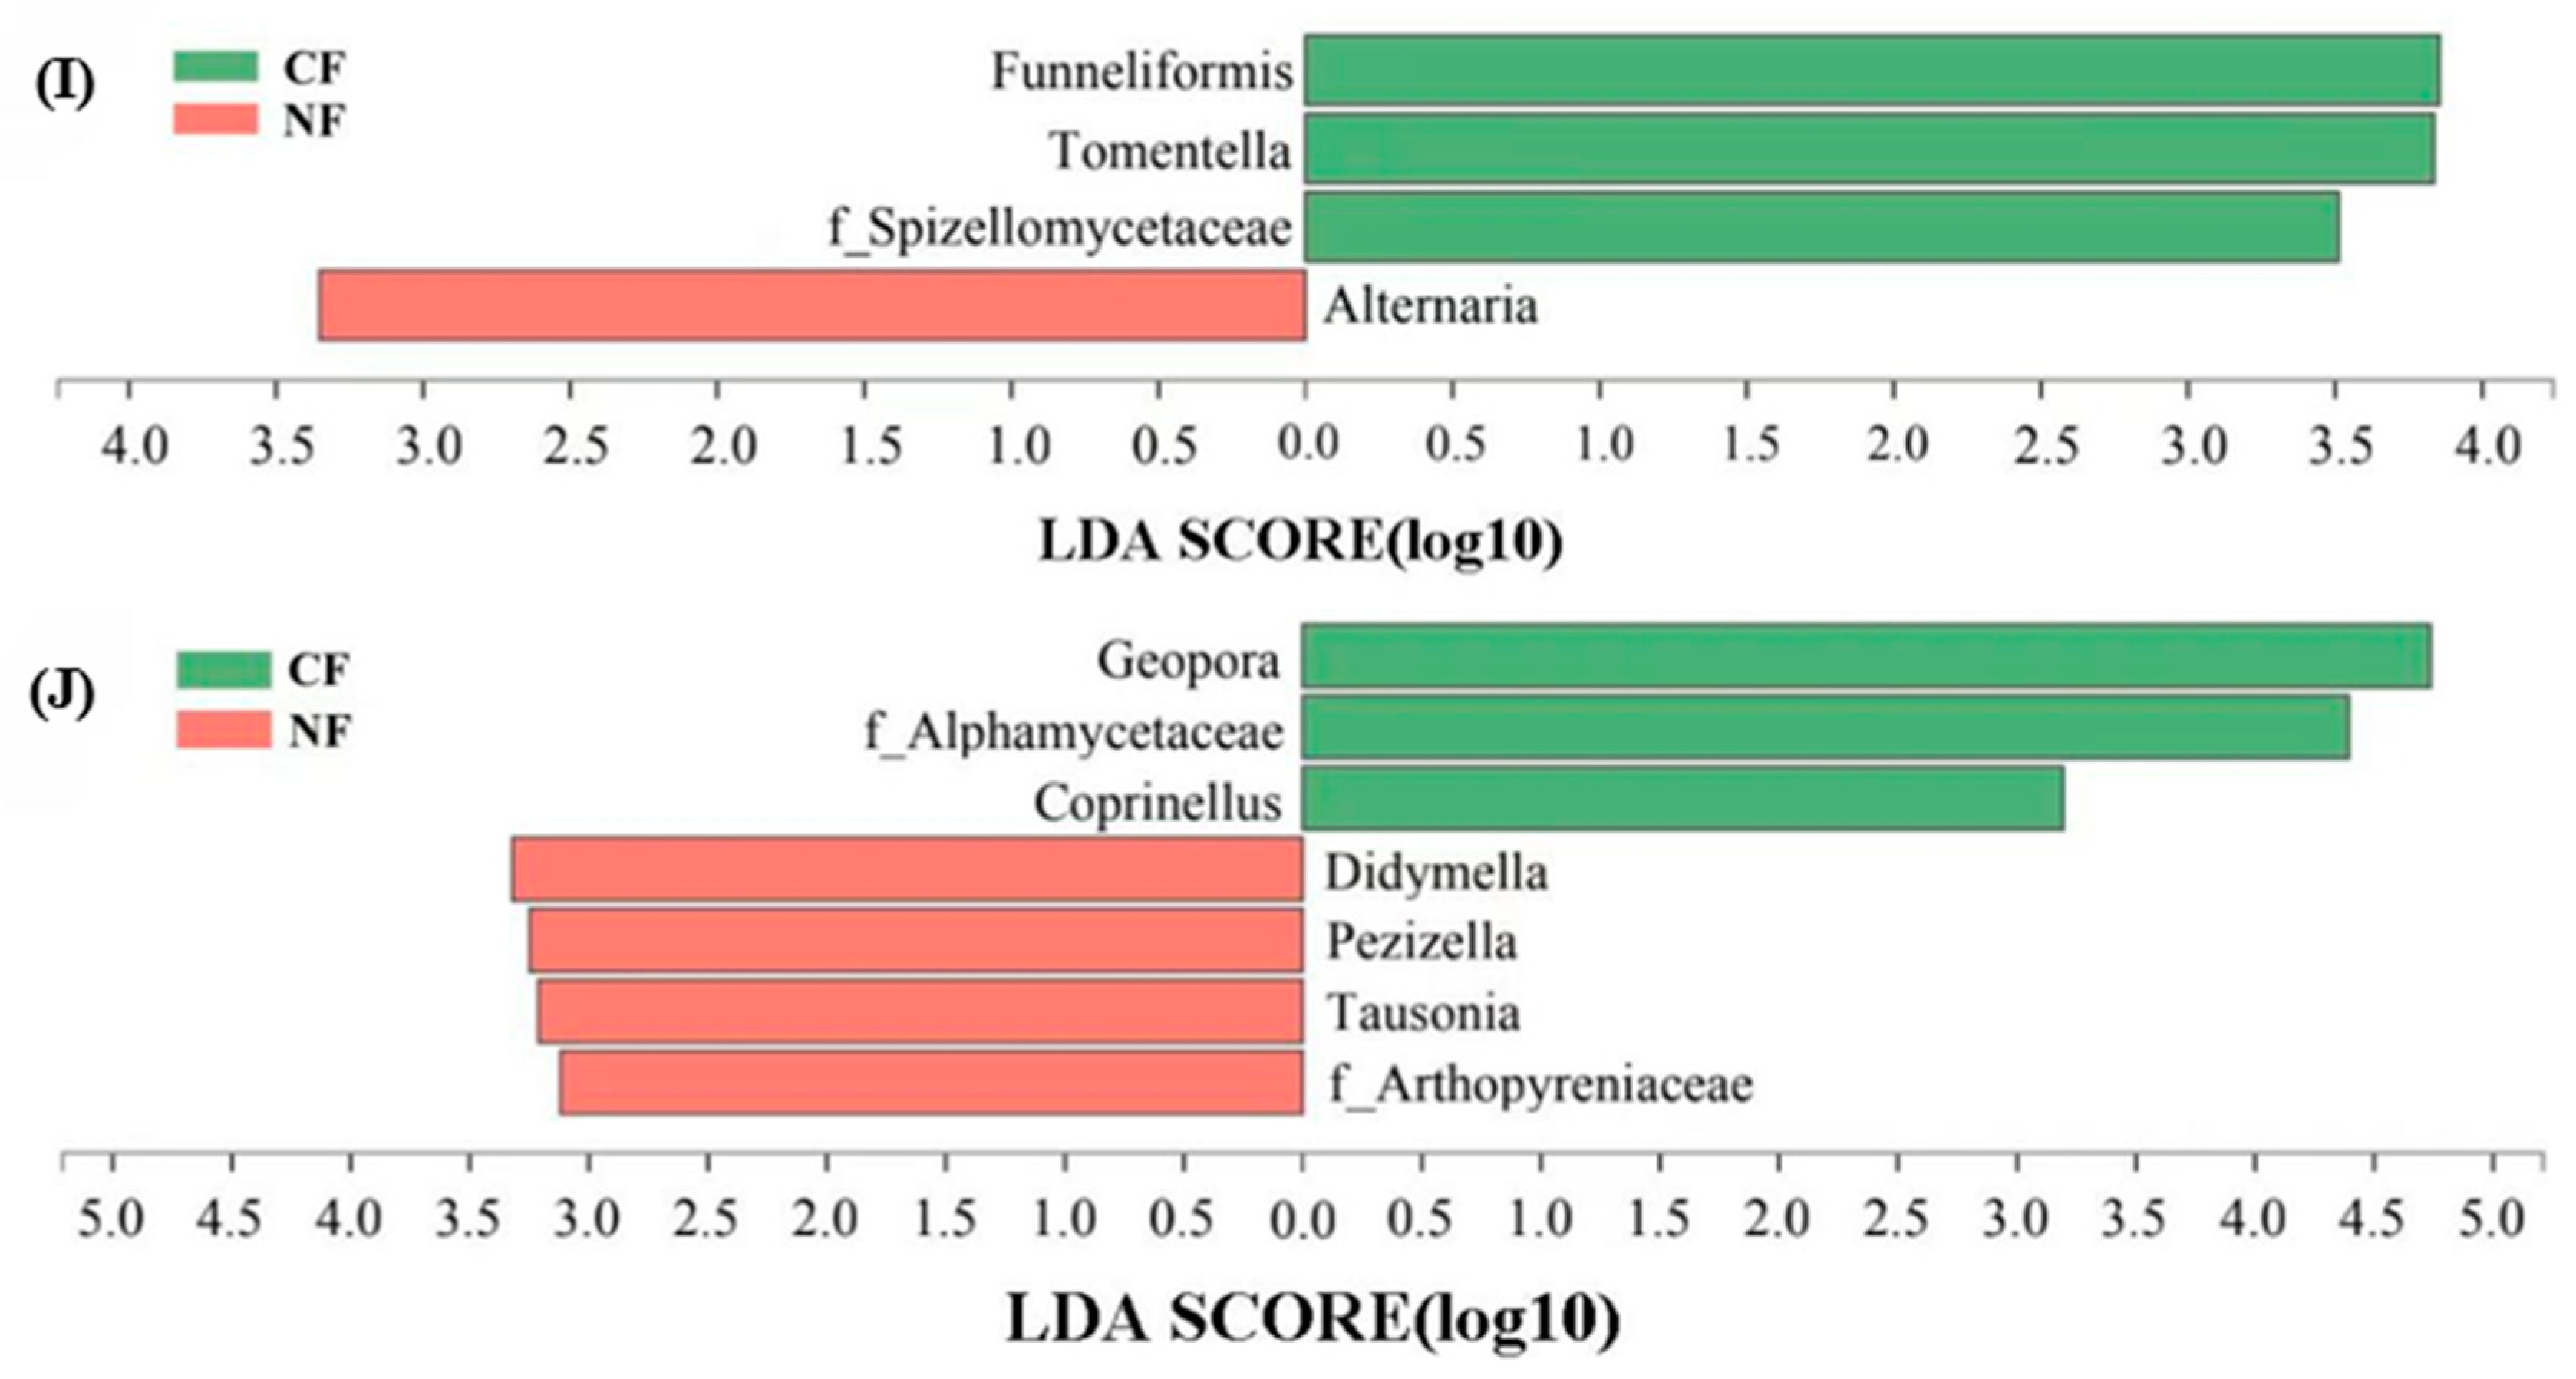
At the fungal genus level, the LEfSe analysis showed that the relative abundance of Alternaria in the NF group of poplar clone 107 increased significantly (Figure 5I), and the relative abundance of Didymella, Pezizella, Tausonia, and Arthopyreniaceae in the NF group of poplar clone 546 also increased significantly (Figure 5J). During the data processing, it was found that the relative abundance of Minimedusa in poplar clone 107 was about 1.97% in the CF group, but it was 0 in the NF group. In addition, Clitopilus has not been detected in the soil of poplar clone 107, but its proportion in the CF group and the NF group of poplar clone 546 was about 1.61% and 1.04%, respectively.
3.6. Correlation Analysis of Soil Indices and Microbial Composition
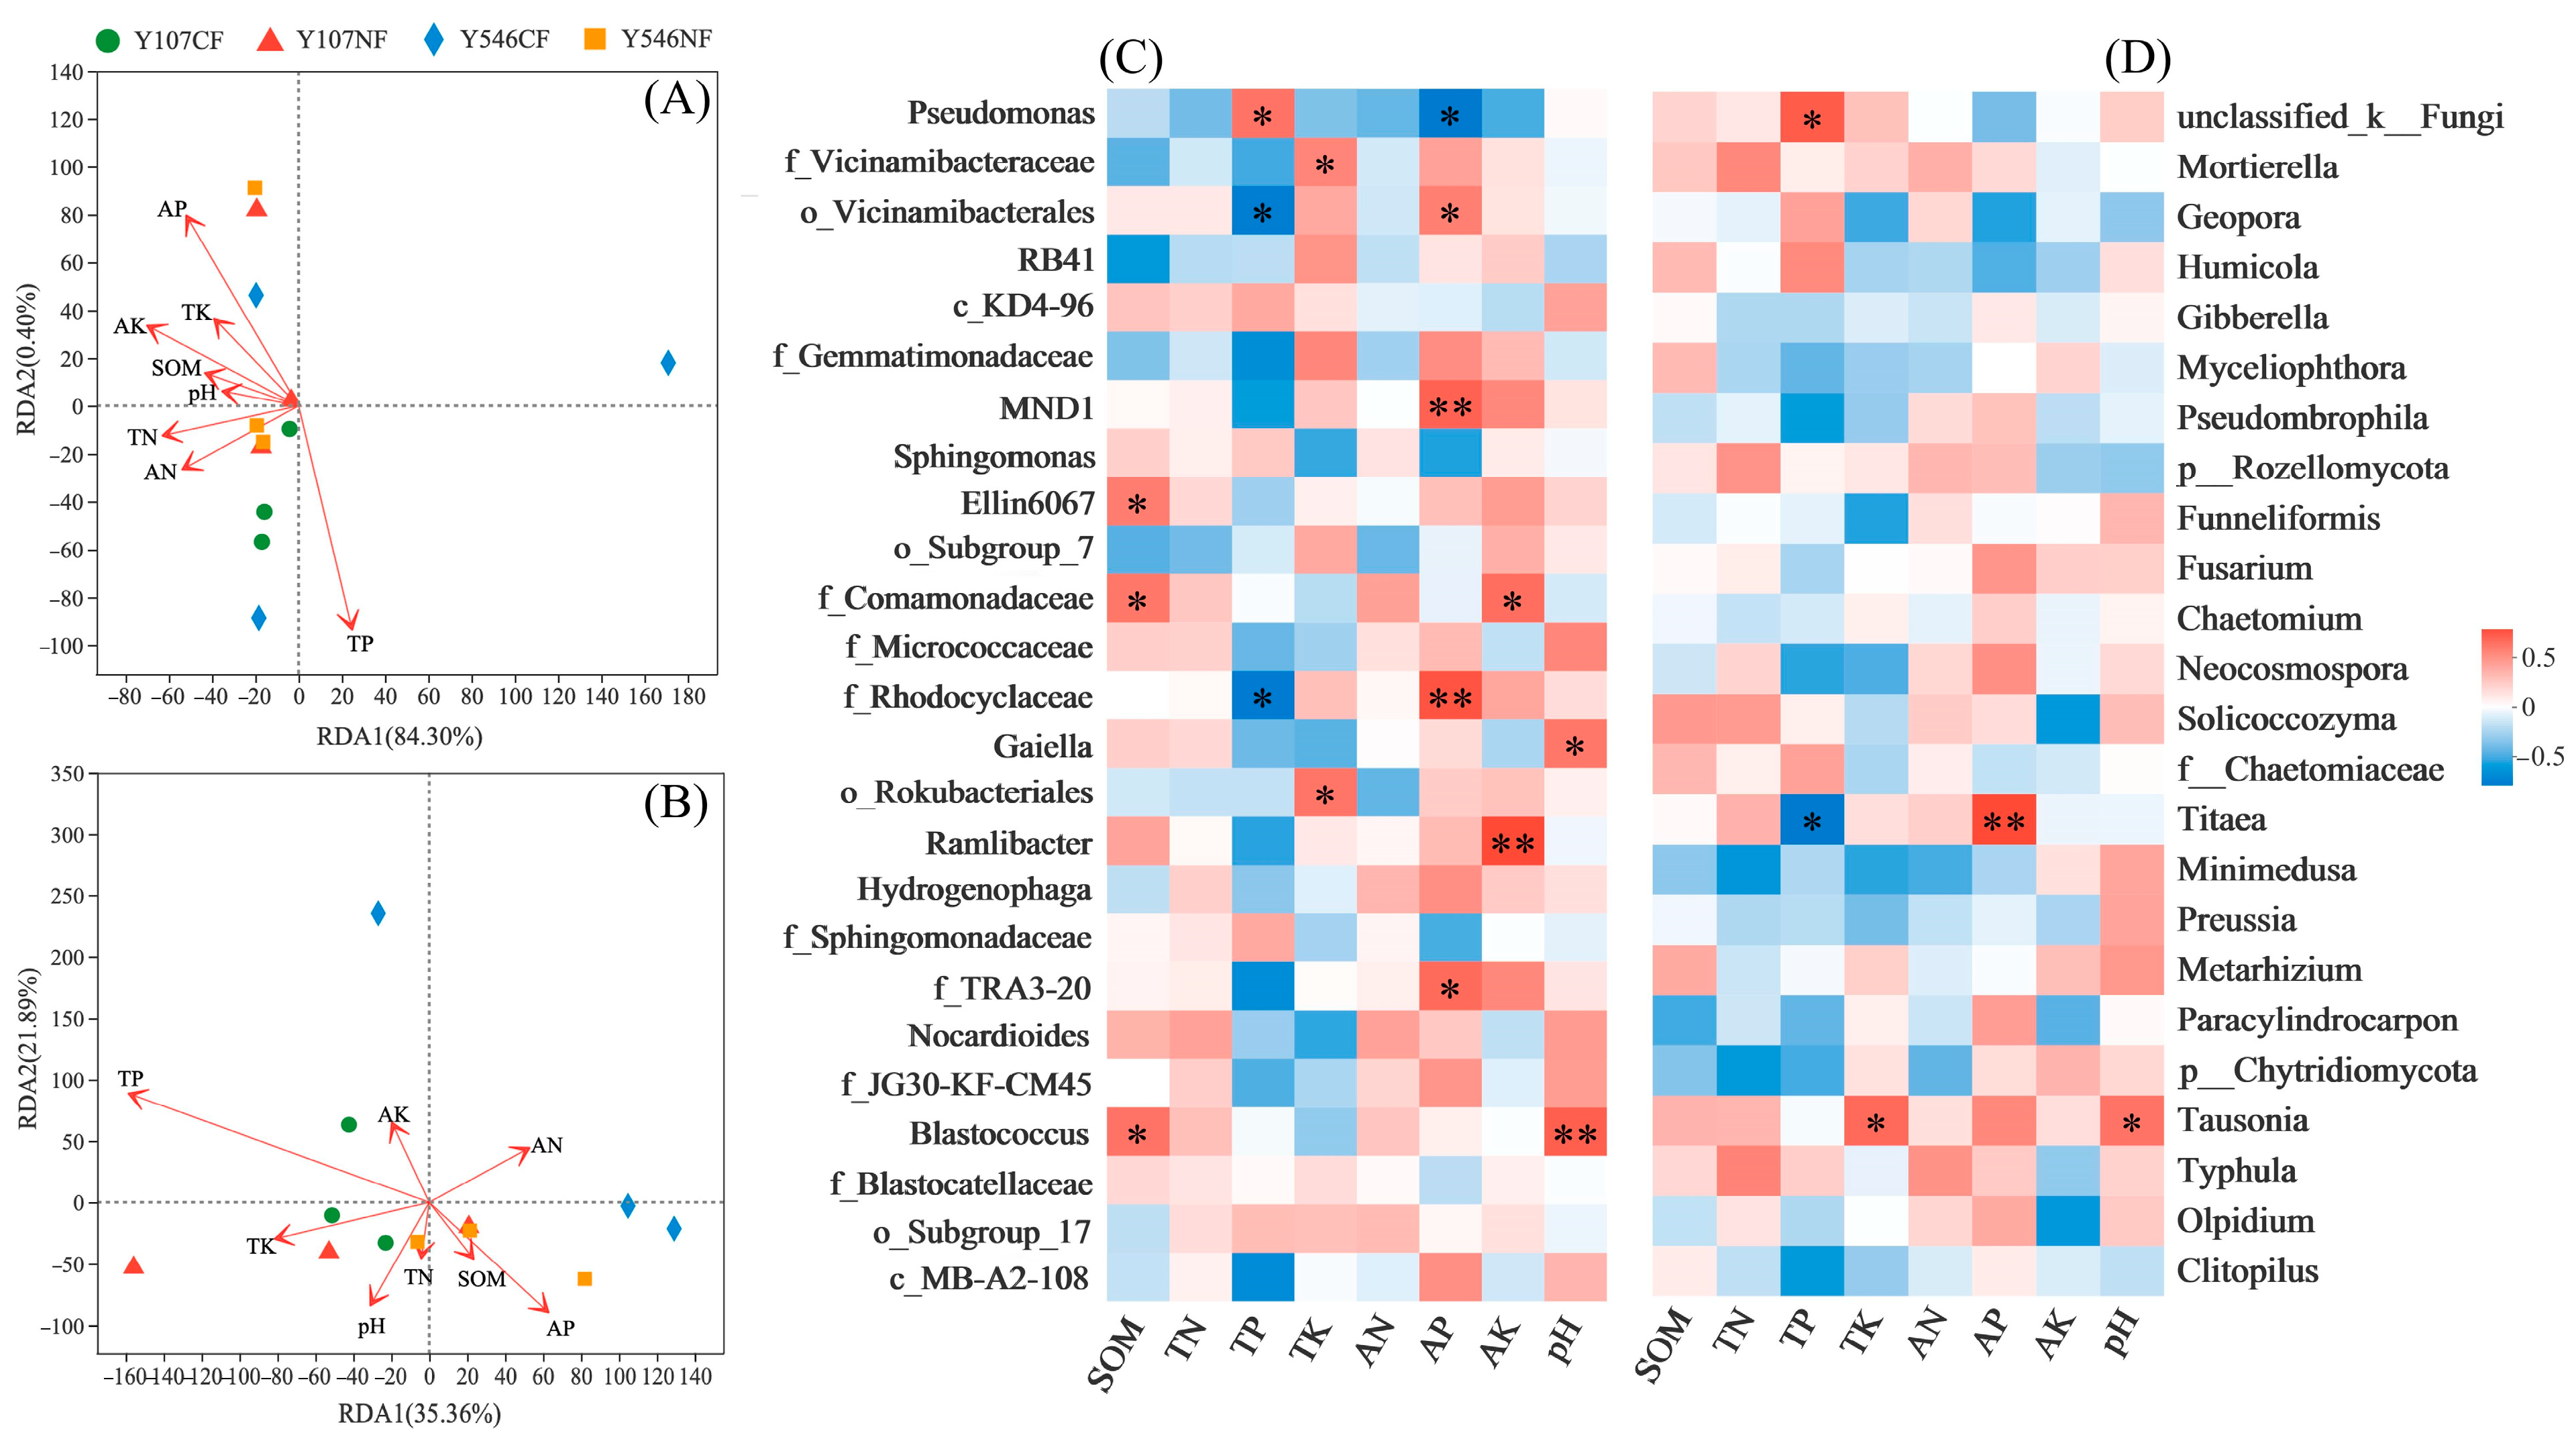
Redundancy analysis (RDA) on the soil indices was carried out at the genus level of bacteria and fungi. The results showed that the first two ranking axes of bacteria explained 84.70% (84.30%, 0.40%, Figure 6A) of the total variance. The main factor affecting the change in bacterial community composition was TP (p = 0.014). The first two ranking axes of fungi explained 57.25% of the total variance (35.36%, 21.89%, Figure 6B), but the soil indices that affected the composition of fungal communities did not change significantly, which was consistent with the results of Mental experiment (Table S3). Spearman’s correlation analysis (Figure 6C) showed that most of the dominant bacterial genera were positively correlated with soil indices, except for TP with Vicinamibacterales and Rhodocyclaceae, while there was a significant negative correlation between AP and Pseudomonas. Among which SOM with Ellin6067 and Comamonadaceae, TP with Pseudomonas and Blastococcus, TK with Vicinamibacteraceae and Rokubacteriales, AP with Vicinamibacterales, MND1, Rhodocyclaceae and TRA3-20, AK with Rmlibacter and Comamonadaceae, pH with Gaiella and Blastococcus, were all positively correlated. In the fungal genuses (Figure 6D), unclassified_k__Fungi with about 20% (14.32%~28.60%) relative abundance had a significant positive correlation with TP, a negative correlation for Titaea with TP and a positive correlation for Titaea with AP, and a positive correlation for Tausonia with TK and pH.
3.7. Structural Equation Model
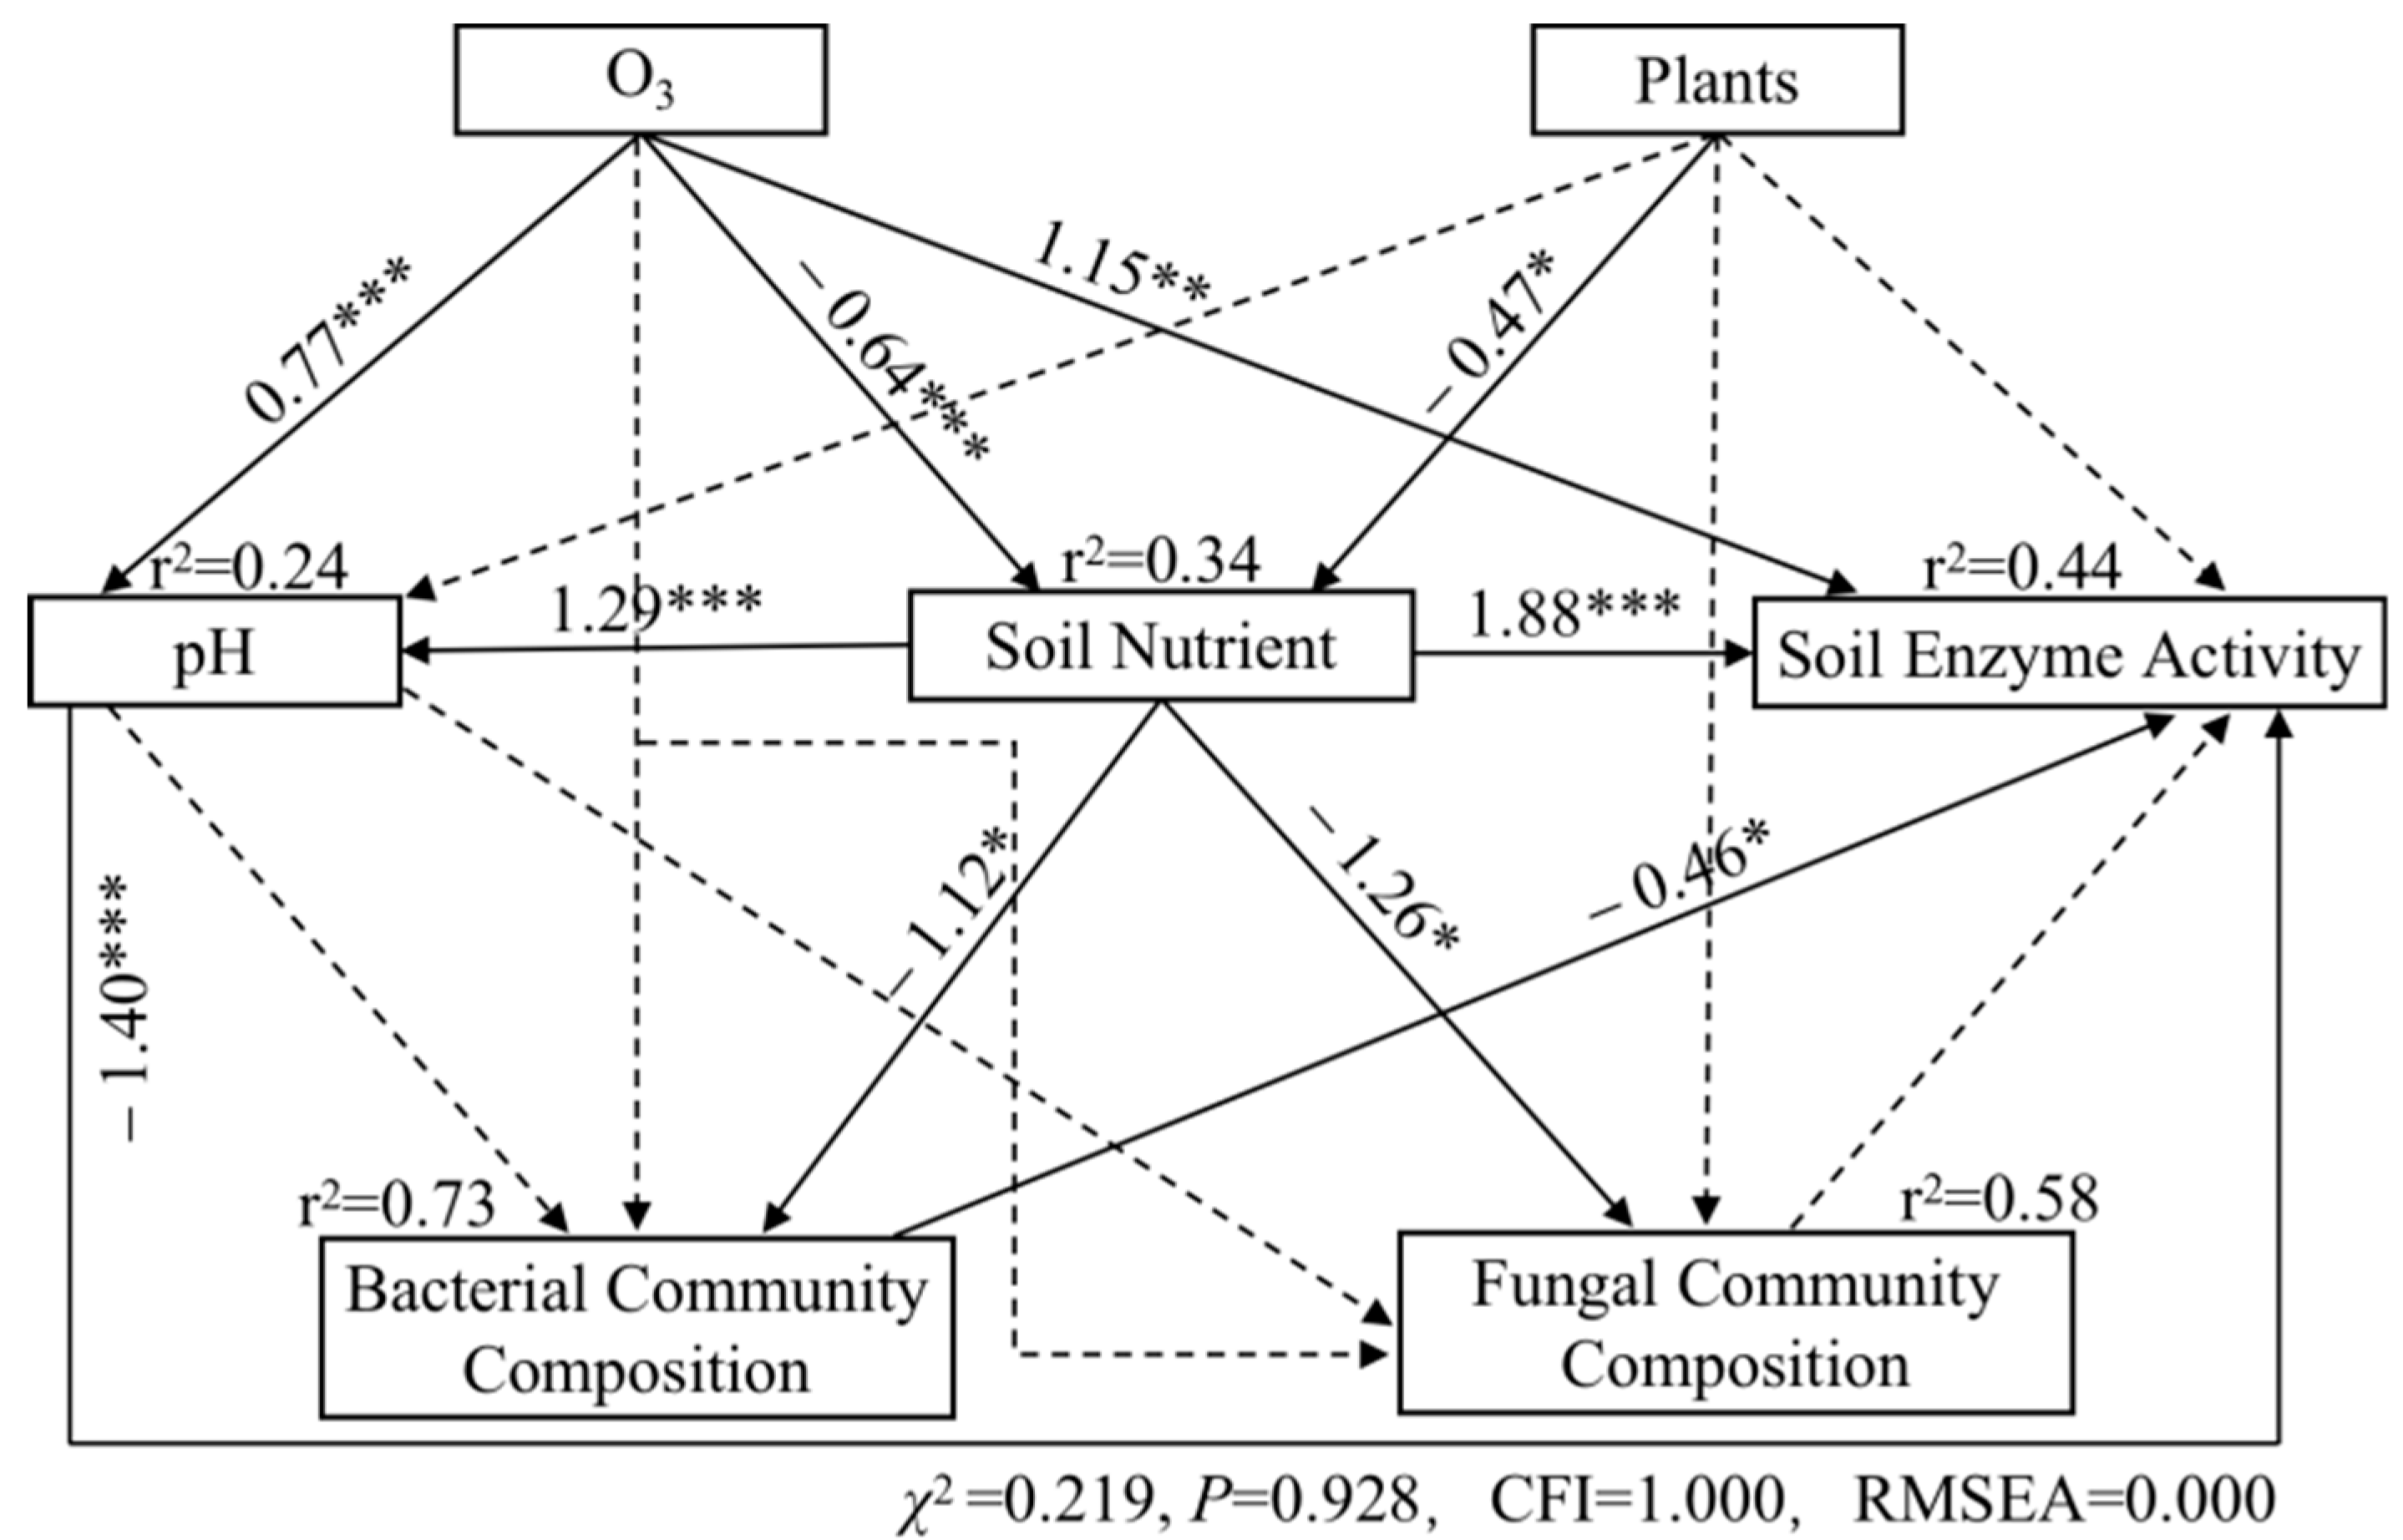
As shown in Figure 7, the increase in O3 pollution had a positive effect on pH (path coefficient = 0.77, p < 0.001) and enzyme activity (path coefficient = 1.15, p < 0.001); however, it had a significantly negative effect on soil nutrients (path coefficient = −0.64, p < 0.001). Soil nutrients had significantly positive effects on pH (path coefficient = 1.29, p < 0.001) and enzyme activity (path coefficient = 1.88, p < 0.001), while pH had significantly negative effects on enzyme activity (path coefficient = −1.40, p < 0.001). Soil nutrients had significantly negative effects on the community composition of bacteria (path coefficient = −1.12, p < 0.05) and fungi (path coefficient = −1.26, p < 0.05). The type of vegetation had a negative effect on soil nutrients (path coefficient = −0.47, p < 0.05), and the composition of the bacterial community had a negative effect on soil enzyme activity (path coefficient = −0.46, p < 0.05).
4. Discussion
4.1. Effects of Ozone on Physicochemical Indices and Enzyme Activities of Rhizosphere Soil
It has been confirmed that O3 significantly reduced the biomass and net photosynthetic rate of poplar clone 107 and clone 546 [40]. In this study, the AN content of the rhizosphere soil of two poplar clones decreased significantly after O3 fumigation (p < 0.05), which was consistent with the results of soil nitrogen dynamics of the studies on T. chinensis [22] and on L. leucocephala [20]. It might be due to the decrease of root biomass and root carbohydrate concentration with the increase of O3 concentration, which resulted in the effect of photosynthate transportation to the belowground part [41]. After the O3 fumigation, the pH changed differently.
The results of enzyme activities showed that the activity of NAG was the highest among the five enzymes, indicating that the content of available nitrogen in the soil was insufficient, and the microorganisms accelerated the decomposition of soil organic nitrogen to meet their needs [42]. The results of βG:NAG (or βG:(NAG + LAP)), βG:AKP measured the enzymatic resources directed towards the acquisition of nitrogen (N) and phosphorus (P) relative to C, reflecting the limitation of C, N, P on microbial survival [43,44]. In this study, although O3 had no significant influence on some enzymes, the ratio of lnβG/ln(LAP + NAG) in soil decreased significantly (p < 0.01), indicating that the increase of O3 could stimulate the production of more enzymes in rhizosphere soil to obtain organic nitrogen [43]. There are relatively few studies on the response of extracellular enzyme activity to the increase of O3 concentration; however, the results are not the same. In the study of poplar and birch forest ecosystems by [45], it was reported that the increase of O3 had no effect on enzyme activity in the second year of treatment. Ten years later, cellobiohydrolase activity on the forest floor was affected, but N-acetyl-glucosaminidase was still not affected [46]. In addition, Williamson et al. [47] measured the decomposition rate of wetland plants exposed to high concentrations of O3 and found that the response of hydrolase activity to O3 was related to plant species. Therefore, the effects of O3 on extracellular enzymes still need further study.
4.2. Effects of Ozone on Microorganisms in Rhizosphere Soil
According to the SEM analysis, O3 had a significant negative effect on soil nutrients. Soil nutrients also had significant negative effects on the composition of the rhizosphere bacterial and fungal communities. Thus, the elevated O3 had indirect negative effects on bacterial and fungal communities by soil nutrients. The interactions among plants, soils, and microorganisms played a key role in the biogeochemical cycles [48], the soil microorganisms supporting plant fitness and sustainable ecosystems [49]. A recent review by Agathokleous et al. [16] showed that O3 altered plant properties (such as leaf and root litter input, plant secretions, and root turnover) and soil processes (such as soil enzyme activity and decomposition rate). These processes defined plant-soil-microbial interactions and plant-soil feedback, thus threatening the function of soil ecosystems. As shown in Figure 2, the increase of O3 concentration would decrease the ASVs of poplar rhizosphere soil, however, with no significant difference. Some studies have shown that the O3 stress could inhibit the resource allocation of plant roots [50,51], thereby limiting the level of nutrients available to microorganisms to change belowground microbial processes [52,53].
This study also found that the proportion of shared bacteria in rhizosphere soil of low-sensitive poplar clone 107 and high-sensitive poplar clone 546 was one time higher than that of shared fungi before and after O3 fumigation, respectively. There were significant differences in the partial diversity of the fungal community. However, there were no significant differences in bacterial community diversity. Many studies [22,51,54] also found that O3 stress could change microbial diversity. Results in this study indicated that the stability of the bacterial community in poplar rhizosphere soil was very high. The response of the fungal community to O3 stress was greater than that of the bacterial community, which was consistent with the results of Kanerva [55], Li [24], and Phillips [56]. The increase of O3 concentration significantly increased the fungal diversity of high-sensitive poplar clone 546, which might be due to the decrease of soil organic carbon storage caused by O3 exposure [6,24,57], since fungi could assimilate more C into biomass than bacteria [58]. Therefore, the increase in fungal diversity might be a survival strategy to cope with limited carbon resources.
The microorganisms with high relative abundance shared among all samples (Figure 2) were insensitive to the rise of O3 concentration, suggesting that they might play a key role in maintaining community stability and responding to environmental changes. They might promote plant growth through the production of various plant growth-promoting (PGP) molecules (such as siderophores, nitrogenases, hormones, etc.) [59,60] in order to better adapt to environmental stresses. Among them, Pseudomonas of Proteobacteria occupied many ecological niches, and its strains could survive in different environments, which could promote plant growth and improve disease resistance [61]. Strains of Arthrobacter, Blastococcus, and Gaiella of Actinobacteriota played an important role in the direct antagonism of antibiotics against fungal pathogens [60,62,63]. Strains of Methylomirabilota, Azospirillales, Azovibrio, and Sphingomonas participated in the nitrogen cycle and were related to soil nitrogen fixation and denitrification [64,65,66,67,68,69]. In the fungal community, C. hobsonii, a common saprophytic fungus, could promote the development of seedling roots and potassium uptake and accumulation [70]. Mortierella sp. could release a variety of organic acids to dissolve soil phosphorus [71]. After double inoculation with AMF in saline-alkali soil, it could enhance soil phosphatase activity and promote plant growth [72]. Minimedusa could transport nutrients and concentrate trace elements such as N, P, S, K, and Ca from biological origin [73]. Fusarium and Gibberella have been proven to be capable of denitrification [74]. These fungi could help poplars to resist the O3 stress.
The results of SEM (Figure 7) showed that O3 fumigation had direct impacts on pH, nutrients, and enzyme activities of poplar rhizosphere soil, while O3 fumigation had an indirect negative impact on microbial community composition due to the changed nutrients. A study by Li et al. [11] has shown that increasing O3 indirectly affected the microbial communities of plant rhizosphere soil by increasing soil pH rather than by reducing available plant carbon sources. Therefore, the effects of O3 on the composition and structure of microbial communities need to be further explored. In this study, the effects of O3 on rhizosphere soil physicochemical indices and microbial community of low-sensitive poplar clone 107 and high-sensitive poplar clone 546 were not significant, which might be caused by the low O3 fumigation level (such as shorter exposure time). The effect of O3 on plants is a cumulative process, which may take a longer time to verify. The microbial responses to elevated O3 were phylogenetically conserved [75]. Therefore, long-term experimental studies need to be carried out in the future, which is of great significance for the scientific evaluation of the ecological effect of O3 on poplar.
5. Conclusions
In this study, O3 fumigation reduced the ASVs of microorganisms in poplar rhizosphere soil. The response of the fungal community in poplar rhizosphere soil to O3 stress was greater than that of the bacterial community. The stability of the bacterial community was very high. In general, there was no obvious difference in sensitivity between the response of poplar clone 107 and 546 rhizosphere soil to O3 after a high concentration of O3 fumigation for 96 days. In the fungal community, C. hobsonii, Mortierella sp., and Minimedusa might help poplar resist O3 stress. O3 stress had direct impacts on pH, nutrients, and enzyme activities of the rhizosphere soil while having an indirect negative impact on microbial community composition due to the changed nutrient. Therefore, it is of great significance to continue the study of the ecological effects of O3 on plants. This study could provide a scientific basis for the subsequent accumulation process of O3 influence on plants and provide some help for scientific evaluation of the ecological effect of O3 on poplar.
Supplementary Materials
The following supporting information can be downloaded at: https://www.mdpi.com/article/10.3390/f15010205/s1, Table S1: Measured soil enzymes and corresponding substrates. Table S2: Correlation between soil enzyme activities and soil physicochemical indices. Table S3: Mental analysis of the relationship between microbial community composition and soil indices.
Author Contributions
Q.W.: designed the experiment. Q.Y.: completed the biochemical assays, analyzed the data. M.Z.: analyzed the data. J.M.: completed parts of biochemical assays. L.Q.: designed the experiment, ran the OTCs. All authors contributed to completion of the manuscript. All authors have read and agreed to the published version of the manuscript.
Funding
This work was financially supported by the National Key Research and Development Program of China (No. 2017YFE0127700).
Data Availability Statement
Data are available upon request to the corresponding author.
Conflicts of Interest
The authors declare no conflict of interest.
References
- Young, P.J.; Naik, V.; Fiore, A.M.; Gaudel, A.; Guo, J.; Lin, M.Y.; Neu, J.L.; Parrish, D.D.; Rieder, H.E.; Schnell, J.L.; et al. Tropospheric Ozone Assessment Report: Assessment of global-scale model performance for global and regional ozone distributions, variability, and trends. Elem. Sci. Anthr. 2018, 6, 10. [Google Scholar] [CrossRef]
- Ziemke, J.R.; Oman, L.D.; Strode, S.A.; Douglass, A.R.; Olsen, M.A.; McPeters, R.D.; Bhartia, P.K.; Froidevaux, L.; Labow, G.J.; Witte, J.C.; et al. Trends in global tropospheric ozone inferred from a composite record of TOMS/OMI/MLS/OMPS satellite measurements and the MERRA-2 GMI simulation. Atmos. Chem. Phys. 2019, 19, 3257–3269. [Google Scholar] [CrossRef]
- China National Environmental Monitoring Center (CNEMC). Monthly/Quarterly Report of Air Quality of 74 Cities; China National Environmental Monitoring Centre: Beijing, China, 2016. [Google Scholar]
- Feng, Z.; De Marco, A.; Anav, A.; Gualtieri, M.; Sicard, P.; Tian, H.; Fornasier, F.; Tao, F.; Guo, A.; Paoletti, E. Economic losses due to ozone impacts on human health, forest productivity and crop yield across China. Environ. Int. 2019, 131, 104996. [Google Scholar] [CrossRef]
- Li, Q.; Yang, Y.; Bao, X.; Liu, F.; Liang, W.; Zhu, J.; Bezemer, T.M.; van der Putten, W.H. Legacy effects of elevated ozone on soil biota and plant growth. Soil Biol. Biochem. 2015, 91, 50–57. [Google Scholar] [CrossRef]
- Shang, B.; Yuan, X.Y.; Li, P.; Xu, Y.S.; Feng, Z.Z. Effects of elevated ozone and water deficit on poplar saplings: Changes in carbon and nitrogen stocks and their allocation to different organs. For. Ecol. Manag. 2019, 441, 89–98. [Google Scholar] [CrossRef]
- Feng, Z.; Shang, B.; Gao, F.; Calatayud, V. Current ambient and elevated ozone effects on poplar: A global meta-analysis and response relationships. Sci. Total Environ. 2019, 654, 832–840. [Google Scholar] [CrossRef]
- Dolker, T.; Mukherjee, A.; Agrawal, S.B.; Agrawal, M. Responses of a semi-natural grassland community of tropical region to elevated ozone: An assessment of soil dynamics and biomass accumulation. Sci. Total Environ. 2020, 718, 137141. [Google Scholar] [CrossRef]
- Kou, T.J.; Lam, S.K.; Chen, D.L.; Yu, W.W. Soil urease and catalase responses to ozone pollution are affected by the ozone sensitivity of wheat cultivars. J. Agron. Crop Sci. 2018, 204, 424–428. [Google Scholar] [CrossRef]
- Chen, Z.; Wang, X.; Shang, H. Structure and function of rhizosphere and non-rhizosphere soil microbial community respond differently to elevated ozone in field-planted wheat. J. Environ. Sci. 2015, 32, 126–134. [Google Scholar] [CrossRef]
- Li, P.; Yin, R.; Zhou, H.; Yuan, X.; Feng, Z. Soil pH drives poplar rhizosphere soil microbial community responses to ozone pollution and nitrogen addition. Eur. J. Soil Sci. 2022, 73, 13186. [Google Scholar] [CrossRef]
- Ashmore, M.R. Assessing the future global impacts of ozone on vegetation. Plant Cell Environ. 2005, 28, 949–964. [Google Scholar] [CrossRef]
- Mills, G.; Hayes, F.; Simpson, D.; Emberson, L.; Norris, D.; Harmens, H.; Bueker, P. Evidence of widespread effects of ozone on crops and (semi-)natural vegetation in Europe (1990–2006) in relation to AOT40-and flux-based risk maps. Glob. Chang. Biol. 2011, 17, 592–613. [Google Scholar] [CrossRef]
- Sicard, P.; Anav, A.; De Marco, A.; Paoletti, E. Projected global ground-level ozone impacts on vegetation under different emission and climate scenarios. Atmos. Chem. Phys. 2017, 17, 12177–12196. [Google Scholar] [CrossRef]
- Burkey, K.; Agathokleous, E.; Saitanis, C.J.; Mashaheet, A.; Hung, Y.T. Chapter 10: Ozone effects on vegetation: A walk from cells to ecosystems. In Handbook of Environment and Waste Management; World Scientific Publishing Co. Inc.: Singapore, 2020; pp. 357–396. [Google Scholar]
- Agathokleous, E.; Feng, Z.; Oksanen, E.; Sicard, P.; Wang, Q.; Saitanis, C.J.; Araminiene, V.; Blande, J.D.; Hayes, F.; Calatayud, V.; et al. Ozone affects plant, insect, and soil microbial communities: A threat to terrestrial ecosystems and biodiversity. Sci. Adv. 2020, 6, eabc1176. [Google Scholar] [CrossRef] [PubMed]
- Li, P.; Feng, Z.; Catalayud, V.; Yuan, X.; Xu, Y.; Paoletti, E. A meta-analysis on growth, physiological, and biochemical responses of woody species to ground-level ozone highlights the role of plant functional types. Plant Cell Environ. 2017, 40, 2369–2380. [Google Scholar] [CrossRef]
- Kasurinen, A.; Keinanen, M.M.; Kaipainen, S.; Nilsson, L.O.; Vapaavuori, E.; Kontro, M.H.; Holopainen, T. Below-ground responses of silver birch trees exposed to elevated CO2 and O3 levels during three growing seasons. Glob. Chang. Biol. 2005, 11, 1167–1179. [Google Scholar] [CrossRef]
- Matyssek, R.; Wieser, G.; Calfapietra, C.; de Vries, W.; Dizengremel, P.; Ernst, D.; Jolivet, Y.; Mikkelsen, T.N.; Mohren, G.M.J.; Le Thiec, D.; et al. Forests under climate change and air pollution: Gaps in understanding and future directions for research. Environ. Pollut. 2012, 160, 57–65. [Google Scholar] [CrossRef]
- Singh, P.; Tewari, A.; Pandey, V. Changes in growth pattern and rhizospheric soil biochemical properties of a leguminous tree species Leucaena leucocephala under long-term exposure to elevated ozone. 3 Biotech 2022, 12, 152. [Google Scholar] [CrossRef]
- Pan, L.; Lin, W.-q.; Yu, M.; Lie, G.-w.; Xue, L.; Chen, H.-y. Effects of Elevated Ozone Concentrations on Root Characteristics and Soil Properties of Elaeocarpus sylvestris and Michelia chapensis. Bull. Environ. Contam. Toxicol. 2020, 104, 682–688. [Google Scholar] [CrossRef]
- Chen, Z.; Maltz, M.R.; Cao, J.; Yu, H.; Shang, H.; Aronson, E. Elevated O3 alters soil bacterial and fungal communities and the dynamics of carbon and nitrogen. Sci. Total Environ. 2019, 677, 272–280. [Google Scholar] [CrossRef]
- Wang, Q.; Li, Z.; Li, X.; Ping, Q.; Yuan, X.; Agathokleous, E.; Feng, Z. Interactive effects of ozone exposure and nitrogen addition on the rhizosphere bacterial community of poplar saplings. Sci. Total Environ. 2021, 754, 142134. [Google Scholar] [CrossRef] [PubMed]
- Li, X.; Deng, Y.; Li, Q.; Lu, C.; Wang, J.; Zhang, H.; Zhu, J.; Zhou, J.; He, Z. Shifts of functional gene representation in wheat rhizosphere microbial communities under elevated ozone. Isme J. 2013, 7, 660–671. [Google Scholar] [CrossRef]
- Turner, B.L.; Hopkins, D.W.; Haygarth, P.M.; Ostle, N. β-Glucosidase activity in pasture soils. Appl. Soil Ecol. 2002, 20, 157–162. [Google Scholar] [CrossRef]
- Olander, L.P.; Vitousek, P.M. Regulation of soil phosphatase and chitinase activityby N and P availability. Biogeochemistry 2000, 49, 175–190. [Google Scholar] [CrossRef]
- Burke, D.J.; Weintraub, M.N.; Hewins, C.R.; Kalisz, S. Relationship between soil enzyme activities, nutrient cycling and soil fungal communities in a northern hardwood forest. Soil Biol. Biochem. 2011, 43, 795–803. [Google Scholar] [CrossRef]
- Allison, V.J.; Condron, L.M.; Peltzer, D.A.; Richardson, S.J.; Turner, B.L. Changes in enzyme activities and soil microbial community composition along carbon and nutrient gradients at the Franz Josef chronosequence, New Zealand. Soil Biol. Biochem. 2007, 39, 1770–1781. [Google Scholar] [CrossRef]
- Doran, J.W.; Coleman, D.C.; Bezdicek, D.F.; Stewart, B.A.; Dick, R.P. Soil enzyme activities as indicators of soil quality. Soil Sci. Soc. Am. J. 1994, 58, 107–124. [Google Scholar] [CrossRef]
- Fang, S.-Z. Silviculture of poplar plantation in China: A review. Ying Yong Sheng Tai Xue Bao = J. Appl. Ecol. 2008, 19, 2308–2316. [Google Scholar]
- Scarascia-Mugnozza, G.E.; Hinckley, T.M.; Stettler, R.F.; Heilman, P.E.; Isebrands, J.G. Production physiology and morphology of Populus species and their hybrids grown under short rotation. III. Seasonal carbon allocation patterns from branches. Can. J. For. Res. 1999, 29, 1419–1432. [Google Scholar] [CrossRef]
- Shang, B.; Xu, Y.; Dai, L.; Yuan, X.; Feng, Z. Elevated ozone reduced leaf nitrogen allocation to photosynthesis in poplar. Sci. Total Environ. 2019, 657, 169–178. [Google Scholar] [CrossRef]
- Shang, B.; Feng, Z.; Li, P.; Calatayud, V. Elevated ozone affects C, N and P ecological stoichiometry and nutrient resorption of two poplar clones. Environ. Pollut. 2018, 234, 136–144. [Google Scholar] [CrossRef] [PubMed]
- Xu, W.; Shang, B.; Xu, Y.; Yuan, X.; Dore, A.J.; Zhao, Y.; Massad, R.-S.; Feng, Z. Effects of elevated ozone concentration and nitrogen addition on ammonia stomatal compensation point in a poplar clone. Environ. Pollut. 2018, 238, 760–770. [Google Scholar] [CrossRef]
- Edwards, J.; Johnson, C.; Santos-Medellín, C.; Lurie, E.; Podishetty, N.K.; Bhatnagar, S.; Eisen, J.A.; Sundaresan, V. Structure, variation, and assembly of the root-associated microbiomes of rice. Proc. Natl. Acad. Sci. USA 2015, 112, E911–E920. [Google Scholar] [CrossRef] [PubMed]
- Lv, X.C.; Jia, R.B.; Li, Y.; Chen, F.; Chen, Z.C.; Liu, B.; Chen, S.J.; Rao, P.F.; Ni, L. Characterization of the dominant bacterial communities of traditional fermentation starters for Hong Qu glutinous rice wine by means of MALDI-TOF mass spectrometry fingerprinting, 16S rRNA gene sequencing and species-specific PCRs. Food Control 2016, 67, 292–302. [Google Scholar] [CrossRef]
- Adams, I.P.; Miano, D.W.; Kinyua, Z.M.; Wangai, A.; Kimani, E.; Phiri, N.; Reeder, R.; Harju, V.; Glover, R.; Hany, U.; et al. Use of next-generation sequencing for the identification and characterization of Maize chlorotic mottle virus and Sugarcane mosaic virus causing maize lethal necrosis in Kenya. Plant Pathol. 2013, 62, 741–749. [Google Scholar] [CrossRef]
- Schloss, P.D. Amplicon Sequence Variants Artificially Split Bacterial Genomes into Separate Clusters. Msphere 2021, 6, e0019121. [Google Scholar] [CrossRef]
- Yang, Y.; Li, T.; Wang, Y.; Cheng, H.; Chang, S.X.; Liang, C.; An, S. Negative effects of multiple global change factors on soil microbial diversity. Soil Biol. Biochem. 2021, 156, 108229. [Google Scholar] [CrossRef]
- Yin, R.; Hao, Z.; Yuan, X.; Wang, M.; Li, S.; Zhang, X.; Chen, B. Arbuscular mycorrhizal symbiosis alleviates ozone injury in ozone-tolerant poplar clone but not in ozone-sensitive poplar clone. Sci. Total Environ. 2023, 894, 165023. [Google Scholar] [CrossRef]
- Burns, R.G. Enzyme activity in soil: Location and a possible role in microbial ecology. Soil Biol. Biochem. 1982, 14, 423–427. [Google Scholar] [CrossRef]
- Kuzyakov, Y.; Xu, X. Competition between roots and microorganisms for nitrogen: Mechanisms and ecological relevance. New Phytol. 2013, 198, 656–669. [Google Scholar] [CrossRef]
- Sinsabaugh, R.L.; Lauber, C.L.; Weintraub, M.N.; Ahmed, B.; Allison, S.D.; Crenshaw, C.; Contosta, A.R.; Cusack, D.; Frey, S.; Gallo, M.E.; et al. Stoichiometry of soil enzyme activity at global scale. Ecol. Lett. 2008, 11, 1252–1264. [Google Scholar] [CrossRef] [PubMed]
- Waring, B.G.; Weintraub, S.R.; Sinsabaugh, R.L. Ecoenzymatic stoichiometry of microbial nutrient acquisition in tropical soils. Biogeochemistry 2014, 117, 101–113. [Google Scholar] [CrossRef]
- Larson, J.L.; Zak, D.R.; Sinsabaugh, R.L. Extracellular Enzyme Activity Beneath Temperate Trees Growing Under Elevated Carbon Dioxide and Ozone. Soil Sci. Soc. Am. J. 2002, 66, 1848–1856. [Google Scholar] [CrossRef]
- Edwards, I.P.; Zak, D.R. Fungal community composition and function after long-term exposure of northern forests to elevated atmospheric CO2 and tropospheric O3. Glob. Chang. Biol. 2011, 17, 2184–2195. [Google Scholar] [CrossRef]
- Williamson, J.; Mills, G.; Freeman, C. Species-specific effects of elevated ozone on wetland plants and decomposition processes. Environ. Pollut. 2010, 158, 1197–1206. [Google Scholar] [CrossRef] [PubMed]
- Tai, A.P.K.; Martin, M.V.; Heald, C.L. Threat to future global food security from climate change and ozone air pollution. Nat. Clim. Change 2014, 4, 817–821. [Google Scholar] [CrossRef]
- Zhang, K.; Zentella, R.; Burkey, K.O.; Liao, H.-L.; Tisdale, R.H. Microbial community dynamics responding to nutrient allocation associated with soybean cultivar ‘Jake’ ozone adaptation. Sci. Total Environ. 2023, 864, 161008. [Google Scholar] [CrossRef]
- Grantz, D.A.; Gunn, S.; Vu, H.B. O3 impacts on plant development: A meta-analysis of root/shoot allocation and growth. Plant Cell Environ. 2006, 29, 1193–1209. [Google Scholar] [CrossRef]
- Li, P.; Yin, R.; Shang, B.; Agathokleous, E.; Zhou, H.; Feng, Z. Interactive effects of ozone exposure and nitrogen addition on tree root traits and biomass allocation pattern: An experimental case study and a literature meta-analysis. Sci. Total Environ. 2020, 710, 136379. [Google Scholar] [CrossRef]
- Agathokleous, E.; Saitanis, C.J.; Wang, X.; Watanabe, M.; Koike, T. A Review Study on Past 40 Years of Research on Effects of Tropospheric O3 on Belowground Structure, Functioning, and Processes of Trees: A Linkage with Potential Ecological Implications. Water Air Soil Pollut. 2016, 227, 33. [Google Scholar] [CrossRef]
- Andersen, C.P. Source-sink balance and carbon allocation below ground in plants exposed to ozone. New Phytol. 2003, 157, 213–228. [Google Scholar] [CrossRef] [PubMed]
- Ueda, Y.; Frindte, K.; Knief, C.; Ashrafuzzaman, M.; Frei, M. Effects of Elevated Tropospheric Ozone Concentration on the Bacterial Community in the Phyllosphere and Rhizoplane of Rice. PLoS ONE 2016, 11, e0163178. [Google Scholar] [CrossRef] [PubMed]
- Kanerva, T.; Palojarvi, A.; Ramo, K.; Manninen, S. Changes in soil microbial community structure under elevated tropospheric O3 and CO2. Soil Biol. Biochem. 2008, 40, 2502–2510. [Google Scholar] [CrossRef]
- Phillips, R.L.; Zak, D.R.; Holmes, W.E.; White, D.C. Microbial community composition and function beneath temperate trees exposed to elevated atmospheric carbon dioxide and ozone. Oecologia 2002, 131, 236–244. [Google Scholar] [CrossRef] [PubMed]
- Wang, J.; Hayes, F.; Turner, R.; Chadwick, D.R.; Mills, G.; Jones, D.L. Effects of four years of elevated ozone on microbial biomass and extracellular enzyme activities in a semi-natural grassland. Sci. Total Environ. 2019, 660, 260–268. [Google Scholar] [CrossRef]
- Six, J.; Frey, S.D.; Thiet, R.K.; Batten, K.M. Bacterial and Fungal Contributions to Carbon Sequestration in Agroecosystems. Soil Sci. Soc. Am. J. 2006, 70, 555–569. [Google Scholar] [CrossRef]
- Manzanera, M.; Narvaez-Reinaldo, J.J.; Garcia-Fontana, C.; Vilchez, J.I.; Gonzalez-Lopez, J. Genome Sequence of Arthrobacter koreensis 5J12A, a Plant Growth-Promoting and Desiccation-Tolerant Strain. Genome Announc. 2015, 3, e00648-15. [Google Scholar] [CrossRef]
- Barreiro, C.; Martinez-Castro, M. Regulation of the phosphate metabolism in Streptomyces genus: Impact on the secondary metabolites. Appl. Microbiol. Biotechnol. 2019, 103, 1643–1658. [Google Scholar] [CrossRef]
- Jun, S.-R.; Wassenaar, T.M.; Nookaew, I.; Hauser, L.; Wanchai, V.; Land, M.; Timm, C.M.; Lu, T.-Y.S.; Schadt, C.W.; Doktycz, M.J.; et al. Diversity of Pseudomonas Genomes, Including Populus-Associated Isolates, as Revealed by Comparative Genome Analysis. Appl. Environ. Microbiol. 2016, 82, 375–383. [Google Scholar] [CrossRef]
- Zhao, F.; Zhang, Y.; Dong, W.; Zhang, Y.; Zhang, G.; Sun, Z.; Yang, L. Vermicompost can suppress Fusarium oxysporum f. sp. lycopersici via generation of beneficial bacteria in a long-term tomato monoculture soil. Plant Soil 2019, 440, 491–505. [Google Scholar] [CrossRef]
- Gamalero, E.; Bona, E.; Novello, G.; Boatti, L.; Mignone, F.; Massa, N.; Cesaro, P.; Berta, G.; Lingua, G. Discovering the bacteriome of Vitis vinifera cv. Pinot Noir in a conventionally managed vineyard. Sci. Rep. 2020, 10, 6453. [Google Scholar] [CrossRef] [PubMed]
- Zhang, X.; Liao, X.; Huang, L.; Shan, Q.; Hu, A.; Yan, D.; Zhang, J.; Long, X.-E. Soil profile rather than reclamation time drives the mudflat soil microbial community in the wheat-maize rotation system of Nantong, China. J. Soils Sediments 2021, 21, 1672–1687. [Google Scholar] [CrossRef]
- Felizardo, J.P.; Muniz, M.C.; Vezzone, M.; Cardoso, R.P.; Wasserman, J.; Padilla, R.; Migliori, A.; Anjos, R.M. Sources of sedimentary organic matter and assessment of heavy-metal levels in estuarine sediments after Funda similar to o dam breach. Estuar. Coast. Shelf Sci. 2021, 261, 107507. [Google Scholar] [CrossRef]
- Steenhoudt, O.; Vanderleyden, J. Azospirillum, a free-living nitrogen-fixing bacterium closely associated with grasses: Genetic, biochemical and ecological aspects. FEMS Microbiol. Rev. 2000, 24, 487–506. [Google Scholar] [CrossRef] [PubMed]
- Fernandez-Gonzalez, A.J.; Martinez-Hidalgo, P.; Cobo-Diaz, J.F.; Villadas, P.J.; Martinez-Molina, E.; Toro, N.; Tringe, S.G.; Fernandez-Lopez, M. The rhizosphere microbiome of burned holm-oak: Potential role of the genus Arthrobacter in the recovery of burned soils. Sci. Rep. 2017, 7, 6008. [Google Scholar] [CrossRef] [PubMed]
- Patureau, D.; Zumstein, E.; Delgenes, J.P.; Moletta, R. Aerobic Denitrifiers Isolated from Diverse Natural and Managed Ecosystems. Microb. Ecol. 2000, 39, 145–152. [Google Scholar] [CrossRef] [PubMed]
- Xu, J.; Kloepper, J.W.; Huang, P.; McInroy, J.A.; Hu, C.H. Isolation and characterization of N2-fixing bacteria from giant reed and switchgrass for plant growth promotion and nutrient uptake. J. Basic Microbiol. 2018, 58, 459–471. [Google Scholar] [CrossRef]
- Peng, L.; Shan, X.; Yang, Y.; Wang, Y.; Druzhinina, I.S.; Pan, X.; Jin, W.; He, X.; Wang, X.; Zhang, X.; et al. Facultative symbiosis with a saprotrophic soil fungus promotes potassium uptake in American sweetgum trees. Plant Cell Environ. 2021, 44, 2793–2809. [Google Scholar] [CrossRef]
- Walter Osorio, N.; Habte, M. Soil Phosphate Desorption Induced by a Phosphate-Solubilizing Fungus. Commun. Soil Sci. Plant Anal. 2014, 45, 451–460. [Google Scholar] [CrossRef]
- Zhang, H.; Wu, X.; Li, G.; Qin, P. Interactions between arbuscular mycorrhizal fungi and phosphate-solubilizing fungus (Mortierella sp.) and their effects on Kostelelzkya virginica growth and enzyme activities of rhizosphere and bulk soils at different salinities. Biol. Fertil. Soils 2011, 47, 543–554. [Google Scholar] [CrossRef]
- Pinzari, F.; Reverberi, M.; Piñar, G.; Maggi, O.; Persiani, A.M. Metabolic profiling of Minimedusa polyspora (Hotson) Weresub & P.M. LeClair, a cellulolytic fungus isolated from Mediterranean maquis, in southern Italy. Plant Biosyst. 2014, 148, 333–341. [Google Scholar] [CrossRef]
- Guest, R.K.; Smith, D.W. A potential new role for fungi in a wastewater MBR biological nitrogen reduction system. J. Environ. Eng. Sci. 2002, 1, 433–437. [Google Scholar] [CrossRef]
- Yu, Z.; Gao, Q.; Guo, X.; Peng, J.; Qi, Q.; Chen, X.; Gao, M.; Mo, C.; Feng, Z.; Wong, M.H.; et al. Phylogenetic Conservation of Soil Microbial Responses to Elevated Tropospheric Ozone and Nitrogen Fertilization. Msystems 2023, 8, e00721-22. [Google Scholar] [CrossRef] [PubMed]
Figure 1.
Activities of five enzymes in rhizosphere soil of different poplar varieties. (A) AKP, (B) βG, (C) CBH, (D) LAP, (E) NAG. Different lowercase letters in the figure indicate significant differences between groups (p < 0.05). The lines crossing the bars were error lines.
Figure 1.
Activities of five enzymes in rhizosphere soil of different poplar varieties. (A) AKP, (B) βG, (C) CBH, (D) LAP, (E) NAG. Different lowercase letters in the figure indicate significant differences between groups (p < 0.05). The lines crossing the bars were error lines.

Figure 2.
Venn diagrams for distribution of microbial ASV levels and the list of the top 20 ASVs shared in all treatments. (A) The number of bacterial ASVs in each group, (B) the Venn diagram of bacteria, (C) the top 20 ASVs of shared bacterial ASVs, (D) the number of fungal ASVs in each group, (E) the Venn diagram of fungi, (F) the top 20 ASVs of common fungal ASVs.

Figure 3.
The α-diversity indices of soil microbial. (A) bacteria, (B) fungi. Different lowercase letters in the figure indicate significant differences between groups (p < 0.05).
Figure 3.
The α-diversity indices of soil microbial. (A) bacteria, (B) fungi. Different lowercase letters in the figure indicate significant differences between groups (p < 0.05).

Figure 4.
Relative abundance of main bacteria phyla in rhizosphere soil of each group (%) and LEfSe analysis of soil bacterial community at the genus level. SZ in (A–L) represents the tree species. The boldface p values indicate significant treatment effects (p < 0.05) (n = 3 OTCs per treatment group). Error bars denote standard error. (M) poplar clone 107, (N) poplar clone 546. The lines crossing the bars were error lines.

Figure 5.
Relative abundance of main fungal phyla in rhizosphere soil of each group (%) and LEfSe analysis of soil fungal community at the genus level. SZ in (A–H) represents tree species. The boldface p values indicate significant treatment effects (p < 0.05) (n = 3 OTCs per treatment group). Error bars denote standard error. (I) poplar clone 107, (J) poplar clone 546. The lines crossing the bars were error lines.


Figure 6.
Correlation analysis between the rhizosphere soil indices and the microbial composition. (A) RDA analysis for the soil indices and the bacteria, (B) RDA analysis for the soil indices and the fungi, (C) Spearman correlation heatmap for the bacterial community composition and the soil indices, (D) Spearman correlation heatmap for the fungal community composition and the soil indices. * p < 0.05, ** p < 0.01.

Figure 7.
Structural equation model of O3 affected poplar rhizosphere soils. * p < 0.05, ** p < 0.01, *** p < 0.001. Lines illustrate all of the potential variable interactions; solid lines were significant, and dashed were not.
Figure 7.
Structural equation model of O3 affected poplar rhizosphere soils. * p < 0.05, ** p < 0.01, *** p < 0.001. Lines illustrate all of the potential variable interactions; solid lines were significant, and dashed were not.


Table 1.
Physicochemical indices of rhizosphere soil of poplar clones 107 and 546.
| Physicochemical Indices | Poplar Clone 107 CF Y107CF | Poplar Clone 107 NF Y107NF | Poplar Clone 546 CF Y546CF | Poplar Clone 546 NF Y546NF |
|---|---|---|---|---|
| SWC (%) | 22.21% ± 2.75% a | 21.29% ± 3.36% a | 22.54% ± 1.59% a | 19.78% ± 2.03% a |
| SOM (g/kg) | 37.32 ± 1.40 a | 36.74 ± 4.58 a | 35.96 ± 4.49 a | 34.01 ± 2.15 a |
| TN (g/kg) | 1.61 ± 0.10 a | 1.60 ± 0.08 a | 1.58 ± 0.17 a | 1.54 ± 0.09 a |
| TP (g/kg) | 0.97 ± 0.02 a | 0.96 ± 0.04 a | 0.95 ± 0.03 a | 0.91 ± 0.04 a |
| TK (g/kg) | 18.53 ± 0.88 a | 20.53 ± 0.55 b | 18.55 ± 1.03 a | 20.15 ± 0.87 b |
| AN (mg/kg) | 139.72 ± 13.70 a | 129.63 ± 12.50 b | 138.60 ± 17.52 a | 132.62 ± 9.40 b |
| AP (mg/kg) | 6.80 ± 0.92 a | 9.19 ± 4.48 a | 6.48 ± 2.06 a | 8.50 ± 0.48 a |
| AK (mg/kg) | 153.46 ± 29.93 a | 158.25 ± 12.68 a | 147.06 ± 24.60 a | 156.65 ± 19.95 a |
| pH | 7.53 ± 0.02 a | 7.25 ± 0.02 bc | 7.15 ± 0.03 c | 7.40 ± 0.19 ab |
Different lowercase letters in the table indicate significant differences between groups (p < 0.05). Soil Water Content, SWC; Soil Organic Matter, SOM; Total Nitrogen, TN; Total Phosphorus, TP; Total Potassium, TK; Available Nitrogen, AN; Available Phosphorus, AP; Available Potassium, AK; Potential of Hydrogen, pH.
Disclaimer/Publisher’s Note: The statements, opinions and data contained in all publications are solely those of the individual author(s) and contributor(s) and not of MDPI and/or the editor(s). MDPI and/or the editor(s) disclaim responsibility for any injury to people or property resulting from any ideas, methods, instructions or products referred to in the content. |
© 2024 by the authors. Licensee MDPI, Basel, Switzerland. This article is an open access article distributed under the terms and conditions of the Creative Commons Attribution (CC BY) license (https://creativecommons.org/licenses/by/4.0/).
Share and Cite
MDPI and ACS Style
Wang, Q.; Yang, Q.; Zhang, M.; Ma, J.; Qu, L. Effects of Ozone Stress on Rhizosphere Soil of Poplar Seedlings. Forests 2024, 15, 205. https://doi.org/10.3390/f15010205
AMA Style
Wang Q, Yang Q, Zhang M, Ma J, Qu L. Effects of Ozone Stress on Rhizosphere Soil of Poplar Seedlings. Forests. 2024; 15(1):205. https://doi.org/10.3390/f15010205
Chicago/Turabian StyleWang, Qin, Qingqing Yang, Meng Zhang, Jianwei Ma, and Laiye Qu. 2024. "Effects of Ozone Stress on Rhizosphere Soil of Poplar Seedlings" Forests 15, no. 1: 205. https://doi.org/10.3390/f15010205
Note that from the first issue of 2016, this journal uses article numbers instead of page numbers. See further details here.