

Effects of Different Levels of Physical Damage Combined with Fungal Induction on Agarwood Formation
by
 ,
,
Weiwei Zhao
1,2,
Xiaochen Song
3,
Zaizhi Zhou
1,*,
Gaofeng Liu
1,4,
Qingqing Zhang
1 and
Shengjiang Pang
5,* 1
Research Institute of Tropical Forestry, Chinese Academy of Forestry, Guangzhou 510520, China
2
College of Forestry, Nanjing Forestry University, Nanjing 210037, China
3
Jiangxi Academy of Forestry, Nanchang 330013, China
4
College of Agricultural and Biological Engineering, Heze University, Heze 274000, China
5
Experimental Centre of Tropical Forestry, Chinese Academy of Forestry, Pingxiang 532600, China
*
Authors to whom correspondence should be addressed.
Forests 2024, 15(1), 168; https://doi.org/10.3390/f15010168
Submission received: 10 December 2023
/
Revised: 4 January 2024
/
Accepted: 6 January 2024
/
Published: 13 January 2024
(This article belongs to the Special Issue Advanced Technologies in Physical and Mechanical Wood Modification—Volume II)
Abstract
:As wild Aquilaria sinensis resources are exhausted and protected, China has established a huge number of plantations of Aquilaria trees and developed artificial induction techniques. However, the current output and quality of artificial induction technology have not yet met the expected results. It has been found that high-oil-containing agarwood may contain particular fungal stains associated with agarwood production. To enhance the quality of agarwood, we recovered and characterized three highly active fungi from high-oil-containing agarwood and inoculated them onto A. sinensis trees using two traditional physical methods. The results showed that fungi extracted from high-oil-containing agarwood can effectively increase the yield and quality of agarwood. During the agarwood formation process, parenchyma cells, xylem rays, and axial parenchyma cells in the xylem gradually undergo apoptosis, thereby promoting the expansion of the color range of agarwood. Nine months after the treatment, the alcohol-soluble extract content in agarwood reached the standard specified in the Chinese Pharmacopoeia (10%), and the proportions of sesquiterpenes and chromones in each treatment were 55.82%, 58.31%, 62.65%, 70.97%, and 13.71%, respectively. These results indicate that fungal induction has a positive impact on the quality of agarwood. In addition, compared to drilling and fungus combined induction, “burning holes and fungi” combined induction demonstrates better results and can further improve the yield and quality of agarwood.
1. Introduction
Agarwood is considered a valuable non-timber forest product, commonly utilized as a raw material in medicine, perfumery, religious rituals, and for collection purposes [1,2,3]. Aquilaria plants serve as significant sources of agarwood. The supply of agarwood from wild sources is significantly lower than the market demand and possesses an exceptionally high economic value [4,5]. Motivated by self-interest, unauthorized individuals are indiscriminately felling agarwood trees in pursuit of valuable wild agarwood, resulting in extensive logging of wild agarwood trees and environmental devastation. As a result, the natural resources in the region have been significantly diminished [6,7,8]. Nineteen species of Aquilaria, such as A. sinensis, A. crassna, and A. malaccensis, have been classified as endangered according to the Red List of the International Union for Conservation of Nature and Natural Resources [9,10]. Since 2004, all species of Aquilaria plants have been listed in Appendix II of the Convention on International Trade in Endangered Species of Wild Fauna and Flora for protection [11,12].
To protect the natural resources of Aquilaria populations and to increase agarwood supply, a huge number of plantations of Aquilaria trees have been established across its suitable planting area, as well as in China [4,13], effectively addressing the shortage of agarwood raw materials in the global market and providing a foundation for the sustainable and stable development of agarwood resources [14,15]. However, the healthy wood of Aquilaria trees is white, soft, and without scented resins, lacking true utilization value [16,17]. Only when the tree is subjected to external pressure or damage does it initiate defense reactions and produce secondary metabolites, such as sesquiterpenes and 2-(2-phenylethyl) chromone compounds, which usually accumulate over years to form agarwood [18,19]. In response to the growing demand in the agarwood market, both domestic and international scholars have started to explore artificial induction methods for agarwood formation. These methods mainly rely on physical and mechanical injuries or the application of chemical and biological agents [20,21]. Physical injury methods, such as burning, chiseling, drilling, cutting, nailing, and bark peeling, mimic natural agarwood production processes [2,22]. While this process produces higher-quality agarwood after a prolonged waiting period, the efficiency is low, and the yield of agarwood cannot be predicted [23]. Additionally, the formation of physical injury is confined to the affected area; the yield is proportional to the degree of tree damage, and excessive damage can easily lead to tree death [2,8]. Chemical induction involves injecting solvents containing ions or plant hormones into the trunk to stimulate tree defense responses and the production of agarwood [24,25]. While this approach may result in the short term production of agarwood, the introduction of chemical substances into the tree can lead to the deterioration of the woody tissue and potentially even the death of the tree [3]. Additionally, the agarwood produced may present potential risk of heavy metal contamination and environmental pollution, leading to apprehensions regarding the quality and safety of agarwood [24,26].
In recent years, extensive research has been conducted on the production mechanism of agarwood, resulting in the gradual development of bio-induced methods [25,27]. Researchers introduced endophytic fungal mycelia or endophytic fungal culture supernatants, which were isolated and purified from agarwood, into the trunks of healthy Aquilaria trees to simulate the pathological conditions observed in wild Aquilaria trees through biological stress. Subasinghe et al. [28] discovered that the presence of Aspergillus niger and Fusarium solani effectively promote agarwood formation when infecting A. sinensis with soil agarwood, and the latter fungus produced higher-quality agarwood. Faizal et al. [29] also achieved good agarwood formation through whole-tree induction by inoculation with F. solani after 6 months. Ma et al. [5] discovered that the agarwood quality induced by A. sinensis was higher when Aspergillus penicillioides was inoculated on both A. sinensis and A. crassna at the same time. To date, over 20 fungal species have played a significant role in the formation of agarwood. These fungi can continuously colonize the trunk and consistently stimulate the formation of agarwood with chemical composition and antimicrobial properties highly similar to those of natural agarwood, allowing for the extraction of high-quality essential oils with higher concentrations of chromones and sesquiterpenes [30]. While biological induction technology has been widely applied in production practices and has enormous potential for future development, the quality of agarwood obtained from different culture conditions and different fungal strains varies greatly [23,25,29]. Moreover, the concentrations of distinctive agarwood constituents, such as baimuxinal and agarotetrol, were found to be lower in comparison to those found in agarwood produced with a physical trauma method [31]. Therefore, to achieve large-scale production of high-quality agarwood, it is imperative to continue actively innovating and optimizing agarwood formation techniques. This represents the ultimate objective of artificially cultivating agarwood trees and presents a challenge that must be tackled for the advancement of the agarwood industry [32,33,34].
In this study, fungal inducers were isolated and purified from agarwood with high oil content. The inducers were then introduced into the trunks of Aquilaria trees through a combination of physical trauma and three fungal inoculations. The objective was to evaluate the quantity and quality of agarwood induced by this method and to compare the material changes during induction among different treatments. Material changes, such as discoloration range and microscopic observations, were analyzed at 3, 6, and 9 months. The analysis of alcohol-soluble extracts and volatile oils in the produced agarwood was analyzed through solvent extraction. Gas chromatography–mass spectrometry (GC-MS) was employed to analyze characteristic substances, such as sesquiterpenoids and 2-(2-phenylmethyl) chromones, to ascertain the relative percentage content of volatile oil constituents. These experiments were aimed to examine the impact of various physical traumas and agar–fungal combinations on the formation of Aquilaria tree xylem and enhance the agarwood induction technique for these trees. The ultimate goal was to establish the groundwork for enhancing the yield and quality of fungal induction in agarwood production.
2. Materials and Methods
2.1. Plant Material
The experimental forest is situated in the Dahuanggong agarwood plantation based in Henghe Town, Boluo County, Huizhou City, Guangdong Province (23° N, 114° E). The region exhibits a subtropical monsoon climate, characterized by an average annual temperature of 21.8 °C, average annual precipitation of 1814 mm, and an average annual sunshine duration of 2023 h. The soil type is a red loam mountain soil developed from granite. For this study, healthy 10-year-old Aquilaria trees were chosen as test material. The trees exhibited an average diameter of 10.58 ± 0.59 m and an average height of 5.82 ± 0.21 m.
2.2. Isolation, Purification, and Identification of Endophytic Fungal from Agarwood
The agarwood samples were collected and initially rinsed with sterile water for three minutes in order to remove surface impurities. Subsequently, the specimens were immersed in 75% ethanol for a duration of 3–5 min and then subjected to 3–4 rinses with sterile water in order to remove any remaining ethanol. The samples were then immersed in a 5% sodium hypochlorite solution for 3–5 min, followed by three washes with sterile water to eliminate any residual sodium hypochlorite from the surface. To assess the effectiveness of the sterilization procedure, approximately 100 μL of the last rinse water was introduced onto the surface of potato dextrose agar (PDA) plates. The surface-sterilized specimens were subsequently dissected into 1 cm × 1 cm segments under aseptic conditions and introduced onto PDA solid medium plates at a temperature of 28 °C. Three replicate plates were used for each specimen, and they were cultivated in an inverted position. After the fungal hyphae had sufficiently grown around the samples, a small amount of hyphae was transferred from the edge to a new Potato Dextrose Agar (PDA) medium using an inoculation needle. The process was continued until a pure strain was achieved. Pure culture was transferred for slant cultivation and subsequently stored at 4 °C. Additionally, 30 μg/L of chloramphenicol was incorporated into the PDA medium to suppress bacterial proliferation [35].
The endophytic fungal isolates were identified through standard culture methods, morphological features, and microscopic characteristics [36,37]. For the purpose of molecular identification, fungal gene DNA was isolated using the fungal DNA kit (OMEGA), in accordance with the methodology outlined by Jedidi et al. [38]. The primer sequences utilized for ITS1 were 5′-TCCGTAGGTGAACCTGCGG-3′, and for ITS4 were 5′-TCCTCCGCTTATTGATATGC-3′. The Microbiology Research Group of the Institute of Tropical Forestry, Chinese Academy of Forestry Sciences, conducted bidirectional sequencing to achieve ITS gene amplification and sequencing. The genomic sequences obtained were aligned using the BLAST search tool (http://blast.ncbi.nlm.nih.gov/Blast.cgi (accessed on 12–26 June 2022)) to GenBank, and their concordance with previously reported sequences was confirmed. The PCR amplification system comprised 25.0 μL, with 1.0 μL of template DNA, 12.5 μL of 2 × Taq PCR StarMix, 0.5 μL of each 10 μmol/L primer (ITS1 and ITS4), and 10.5 μL of ddH2O. The PCR reaction conditions included pre-denaturation at 94 °C for 5 min, denaturation at 94 °C for 45 s, annealing at 54 °C for 45 s, and extension at 72 °C for 1 min. The cycles were iterated 35 times and then concluded with a final extension at 72 °C for 5 min. Subsequently, three predominant strains were isolated and identified as Trichoderma maatroviride, Fusarium solani, and Lasiodiplodia theobromae during the final selection.
2.3. Plant Samples and Fungal Induction of Agarwood Formation
The aforementioned isolations were employed for the identification of three prominent fungi, specifically Trichoderma maatroviride, Fusarium solani, and Lasiodiplodia theobromae. The specimens were inoculated on agar using aseptic techniques and subsequently placed in an artificial climatic chamber set at a constant temperature of 28 °C for 7 days in darkness. The induction treatment was conducted in accordance with the group’s previous patented application [39].
The experiment employed three methods of induction: cold drilling, cold drilling with fungal application, and fire drilling with fungal application, resulting in a total of five treatments (Table 1). Each treatment was replicated three times, with 5 Aquilaria trees included in each replication, resulting in a total of 75 Aquilaria trees. The holes were drilled on the eastern and western sides of the tree trunk, each at a distance of 30 cm from the ground. The diameter of each hole was 1 cm, with a spacing of 30 cm between them, and a depth of 3 cm. The cold borehole was created with an electric drill, while the fire borehole was made using a red-hot iron rod. Upon completion of the drilling process, the cavity was filled with a fungal matrix at a volume ratio of 1:1 and then covered with a plastic film to preserve moisture. It was removed 20 days later. After the conclusion of the treatment, samples were collected at random intervals of 1, 3, 6, and 9 months to complete the index determination.
2.4. Histochemical Observation of Slices
At the first, third, and sixth months after wounding treatments, samples (3 cm long) were collected from 3 trees per treatment at 2 cm above the burning holes. The samples were immersed in FAA fixative (70% ethanol, 30% formaldehyde, and 10% acetic acid, 9:1:1). Fixed samples were cut into 1 × 1 × 1 cm3 pieces, which were later processed and embedded for making paraffin sections. Microscopic observation was aided by histological staining using a Leica sliding section machine (Leica RM2255, Wetzlar, Germany), and sections were deparaffinized and stained with potassium iodide for starch grains, Schiff’s reagent periodate for non-starch polysaccharides, and Sudan III stain for total lipids [40]. All sections were photographed and observed for histochemical changes with a high-definition digital camera (Pixera Pro 600ES, Santa Clara, CA, USA) and a light microscope (Olympus BX51, Tokyo, Japan).
2.5. Scanning Electron Microscopic Observation of Tissue Inclusions
At the first, third, and sixth months after wounding treatments, samples fixed by FAA were cut into 2 mm thick slices and put into a vacuum chamber, sprayed with gold by an ion sputtering instrument (JEC-1600, Tokyo, Japan) twice for 60 s each time with a 30 mA spraying flow, and then the samples were fixed under a scanning electron microscope (JSM-6510LV, Tokyo, Japan) for observation [41,42].
2.6. Non-Structural Carbohydrate Content Detection
At the first, third, sixth, and ninth months after wounding treatments, samples (3 cm long) were collected from 3 trees per treatment at 2 cm above the burning holes. The samples were then ground to powder using liquid nitrogen, and the determination of starch and non-starch polysaccharides was based on enzymatic digestion and the anthraquinone colorimetric method [43].
2.7. Induced Color Change Range Measurement
The length of longitudinal discoloration between drill holes was measured at the third, sixth, and ninth months after wounding by selecting three trees per treatment and drilling cores at 3–5 cm intervals above and below the drill holes using a 0.5 cm growth cone until the cores were all white wood. The width of the horizontal discoloration was measured by drawing a semicircle with a thickness of 5 cm and a radius of 3 cm at a point 5 cm above the drilled holes. Essential oil content and composition were determined.
2.8. Extraction of Alcohol-Soluble Essential Oils of Agarwood
At the third, sixth, and ninth months after wounding treatments, 5 cm thick half-round slices were taken at 5 cm on the drilling, and rotten and white wood was removed with a knife, leaving the dark resinous agarwood to dry in a constant temperature blast oven at 40 °C. The dried, constant-weight agarwood pieces were powdered with a grinder, and the alcohol-soluble substances were extracted and calculated according to the Chinese Pharmacopeia and Agarwood [44]. Agarwood (2 g) was precisely weighed and mixed with 20 mL of 95% ethanol before being sonicated at 60 °C at 35 kHz for 30 min (Elmasonic P300 H, Dominique Dutscher SAS, Bernolsheim, France) two times. The extracts were separated under vacuum using a 0.45 µm organic filter membrane and passed through a rotary evaporator (Concentrator 5301, Eppendorf, Hamburg, Germany) to a constant weight for alcohol extract content calculation [40].
2.9. Component Analysis of Essential Oils
Alcohol-soluble extract solution (10 mL) was removed, evaporated, re-formulated with 2 mL of ethyl acetate, and analyzed by a gas chromatography–mass spectrometer (7890B-5977A, Agilent Technologies Inc., Santa Clara, CA, USA) [5]. Compounds were identified in retention index and mass spectrometry data by searching with NIST 14. The relative areas of the peaks were then calculated to obtain the active ingredient content of each component. After preliminary identification, the peaks were screened for similarity greater than 80% and a retention index within ±20.
The chromatographic conditions were as follows: column HP-5MSZ (30 m 0.25 mm 0.25 m); ramp-up procedure, starting at 70 °C, holding for 1 min, then ramping up to 150 °C at 10 °C/min, holding for 5 min; then ramping up to 200 °C at 5 °C/min, holding for 5 min; then ramping up to 280 °C at 8 °C/min, holding for 1 min; inlet temperature 250 °C; carrier gas was high purity He (99.999%), carrier gas flow rate of 10 mL/min, injection volume of 0.2 L (no splitting), and solvent delay of 4 min.
The mass spectrometry conditions were as follows: chromatography–mass spectrometry interface temperature 280 °C; ion source temperature 230 °C; ionization method EI; electron energy 70 eV; mass scan range 35–350 AMU.
2.10. Statistics Analysis
All experimental data were preprocessed with Excel and analyzed using SPSS 22.0 software using a t-test and a one-way ANOVA to determine the significant differences between treatments. Statistical differences were considered significant at p < 0.05.
3. Results
3.1. Histological Formation Process of Agarwood Resin in the Agarwood Layers
3.1.1. Histological Formation Process of Agarwood Resin
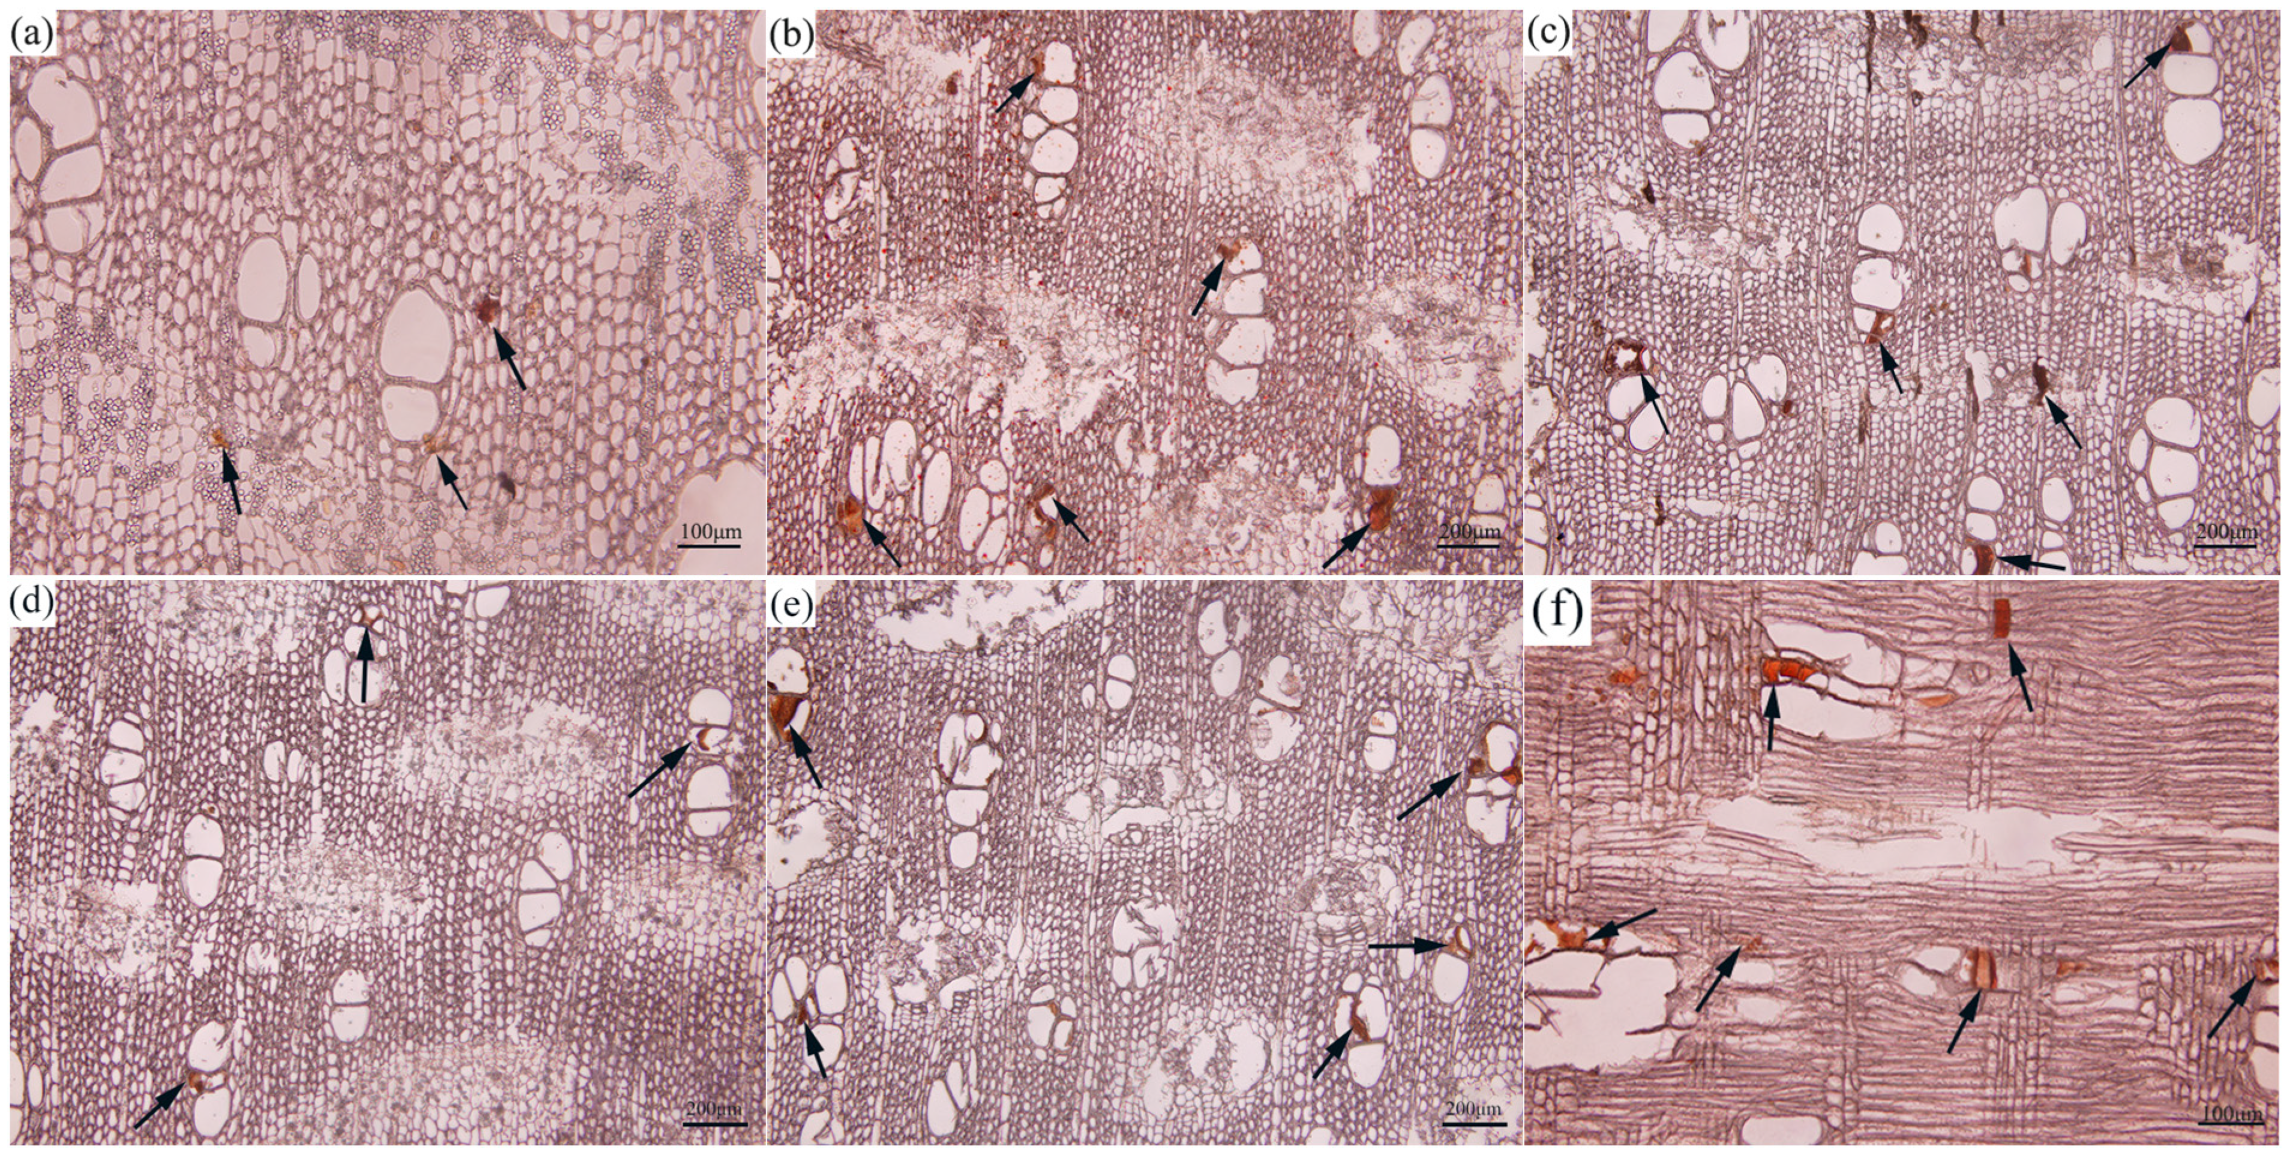
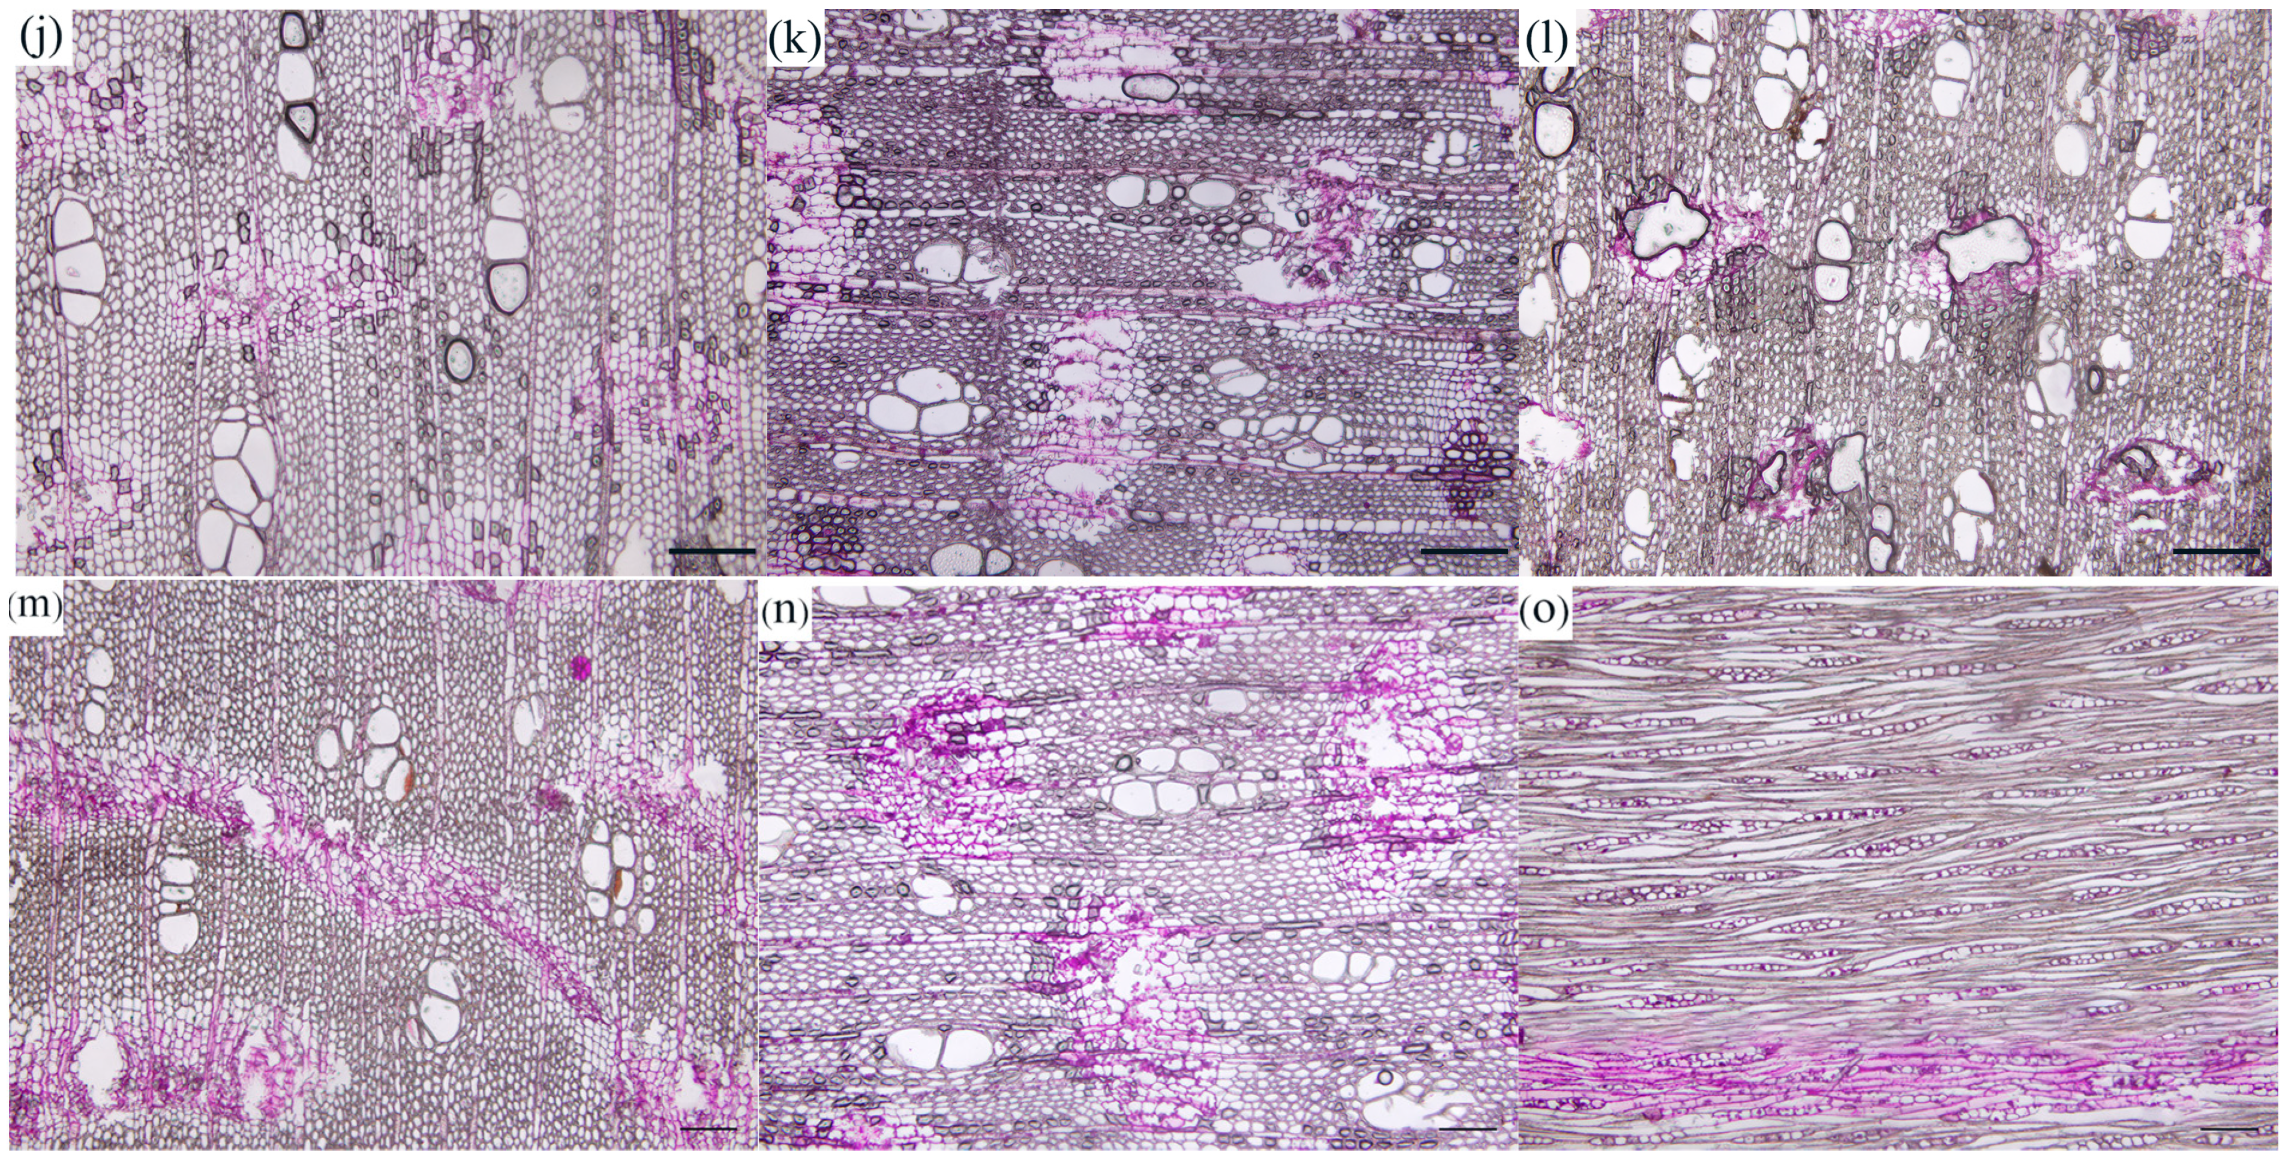
Agarwood resin is primarily localized in the agarwood layer. Consequently, we opted to study the histological changes of the agarwood layer produced by different combined induction methods at different induction periods. After 3 months of treatment with various combined induction methods, except for the control group, the remaining methods gradually showed yellow or brownish-yellow discoloration in certain parts of the interconnected phloem and xylem rays (Figure 1). In the cross-sections of the samples treated with D1 (Figure 1a) and D2 (Figure 1d), they only appeared in the adjacent parenchyma cells, while in the cross-sections of the samples treated with F1 (Figure 1g) and F2 (Figure 1j), oil-like substances were already present inside the vessels. After 6 months of treatment, the quantity of light-yellow substances in the IP and XR increased significantly on the cross-sections of agarwood samples produced by different combined induction methods. After nine months of combined induction treatment, the cross-sections of agarwood samples treated with F2 were filled with abundant light-yellow substances in the IP and XR, and the surrounding vessels and fibers were filled with brown substances (Figure 1l). Upon observation, it was determined that the accumulation of brownish oily substances in the xylem and phloem of the samples treated with F1 (Figure 1i) and F2 (Figure 1l) was more prominent, while in the samples treated with D2 (Figure 1f), only a small amount was discernible in individual vessels. The samples treated with CK showed only a very small amount of brownish oily substances in the xylem and phloem (Figure 1m–o). Consequently, the synergistic induction treatment method of “burning holes and fungi” inoculation was found to be more conducive to the formation of agarwood resin compared to the combined induction method of drilling holes and fungi.
3.1.2. Changes in Starch Grains during the Formation of Agarwood
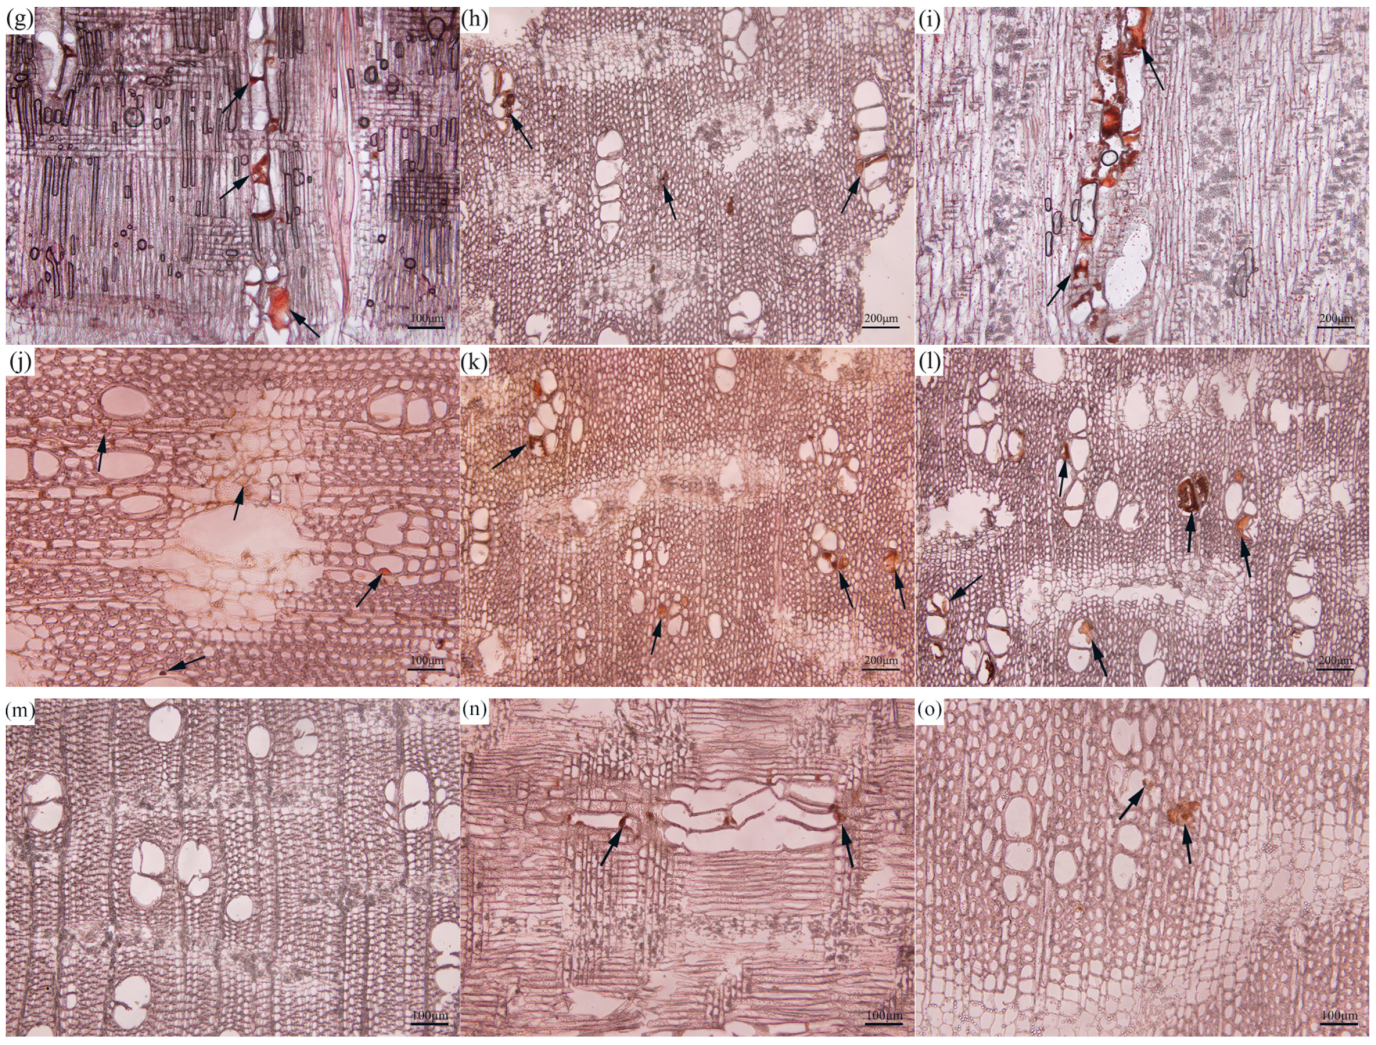
Some histochemical tests are commonly used to monitor the chemical changes during the formation of agarwood resin. After induction treatment, the first and most typical change is the abundance of starch granules. We applied an improved method to cut continuous sections and create complete transverse sections of the wood. After staining, starch substances within the xylem appeared blue. One month after the induction treatment, a small number of starch granules was detected in the ray cells and inter-wood phloem of the D1 (Figure 2a) and D2 (Figure 2d) treated samples, while in the F1 (Figure 2g)- and F2 (Figure 2j)-treated samples, they were only visible in the ray cells compared to the greater abundance of starch granules in ray cells and inter-wood ligaments in the cross sections of CK (Figure 2m)-treated samples. After three months of induction treatment, only the D2 (Figure 2e)- and CK (Figure 2n)-treated samples exhibited an increase in the prevalence of starch granules in the ray cells and inter-wood phloem, whereas the rest of the treated samples demonstrated a reduction. After six months of induction treatment, although the abundance of starch granules in all samples increased to varying extents, the samples treated with “burning holes and fungi” combined treatment still showed lower starch abundance compared to those treated with drilling holes and fungi combined treatment. Among them, the F1 (Figure 2i)-treated sample only contained a small amount of starch material in the interfascicular cambium, while the F2 (Figure 2l)-treated sample showed almost no visible abundance of starch granules. This indicates that the combined treatment induced by burning holes and fungi has a stronger metabolic capability and can consume a large amount of starches.
3.1.3. Changes in Starch Grains during the Formation of Agarwood
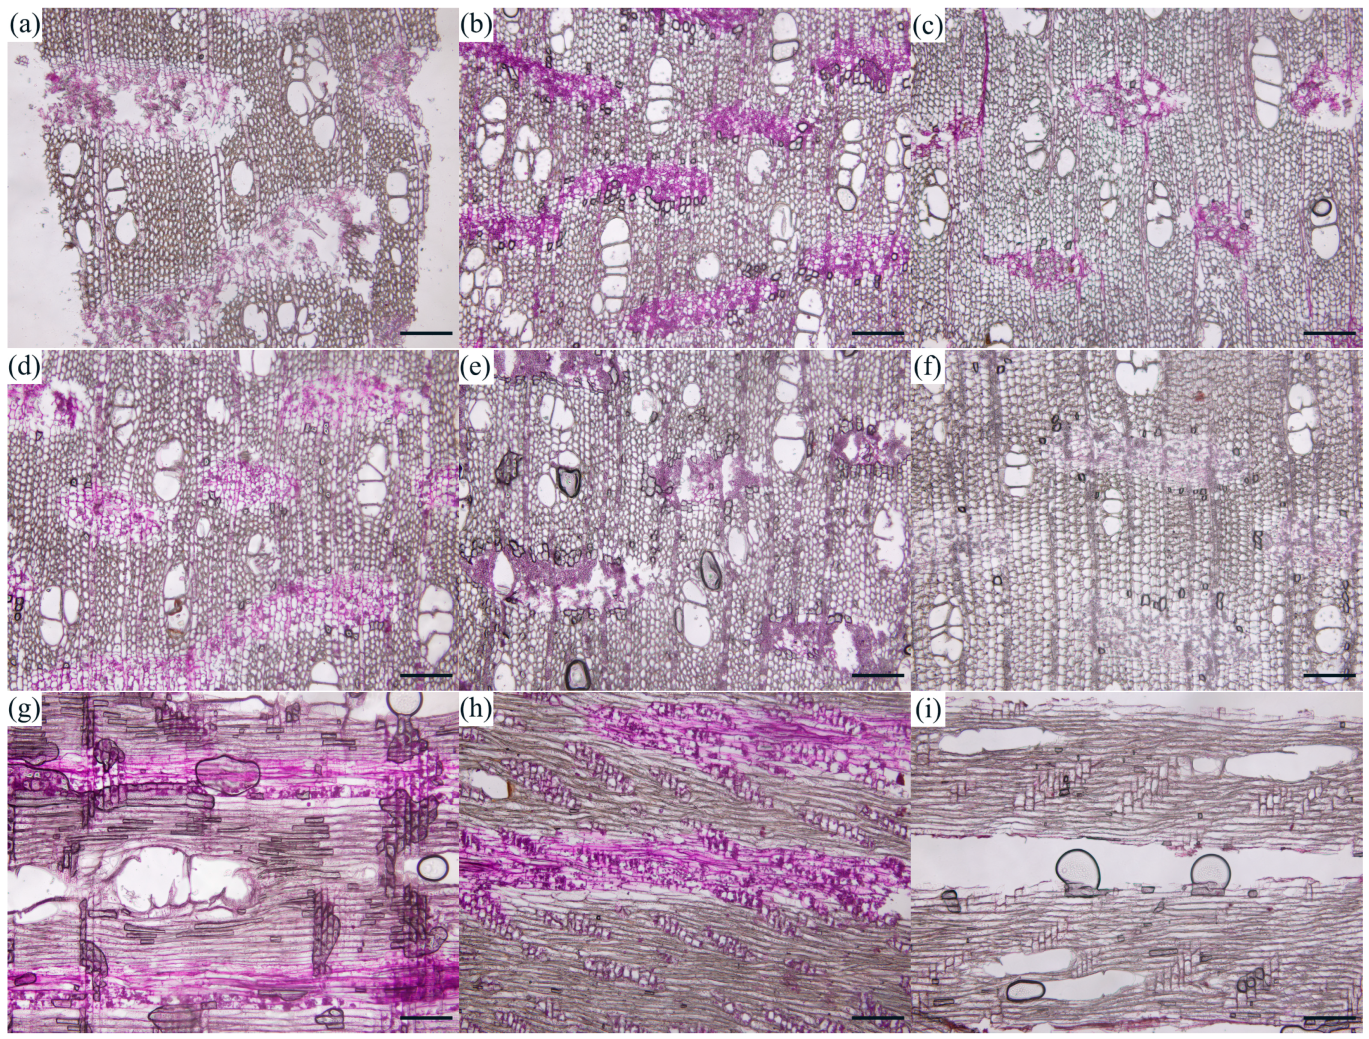
During the induction process, along with the changes in the number of starch granules, a novel substance emerged that reacted with PAS, producing a wine-red color, indicating that it may be a non-starch polysaccharide. This substance was primarily observed in the IP and XR of the wood section (Figure 3). One month after the induction treatment, all agarwood samples derived from the different induction treatments exhibited a large amount of non-starch polysaccharides in the interfascicular cambium and ray cells (Figure 3a,d,g,j,m). Three months after the induction, the staining areas of the interfascicular cambium and ray cells showed varying degrees of augmentation in agarwood samples derived from the different induction treatments. Among them, the D1 (Figure 3b)-, D2 (Figure 3e)-, F1 (Figure 3h)-, and F2 (Figure 3k)-treated samples showed significantly larger staining areas in the IP and XR of the agarwood section. After six months of induction, the staining areas of the interfascicular cambium and ray cells in the agarwood samples resulting from the different induction treatments significantly decreased, and the staining areas of non-starch polysaccharides in the wood ray cells were almost invisible (Figure 3f,i). By comparing the staining of starch granule abundance in tissue sections, it was observed that non-starch polysaccharides and the consumption of starch granules showed a negative correlation during the induction process. In order to more accurately observe and quantitatively identify the starch and non-starch polysaccharides in agarwood, we also assessed the variations in the substance content in agarwood samples derived from the different induction treatments.
3.2. Structural Characteristics of the Inclusions in the Xylem of Agarwood
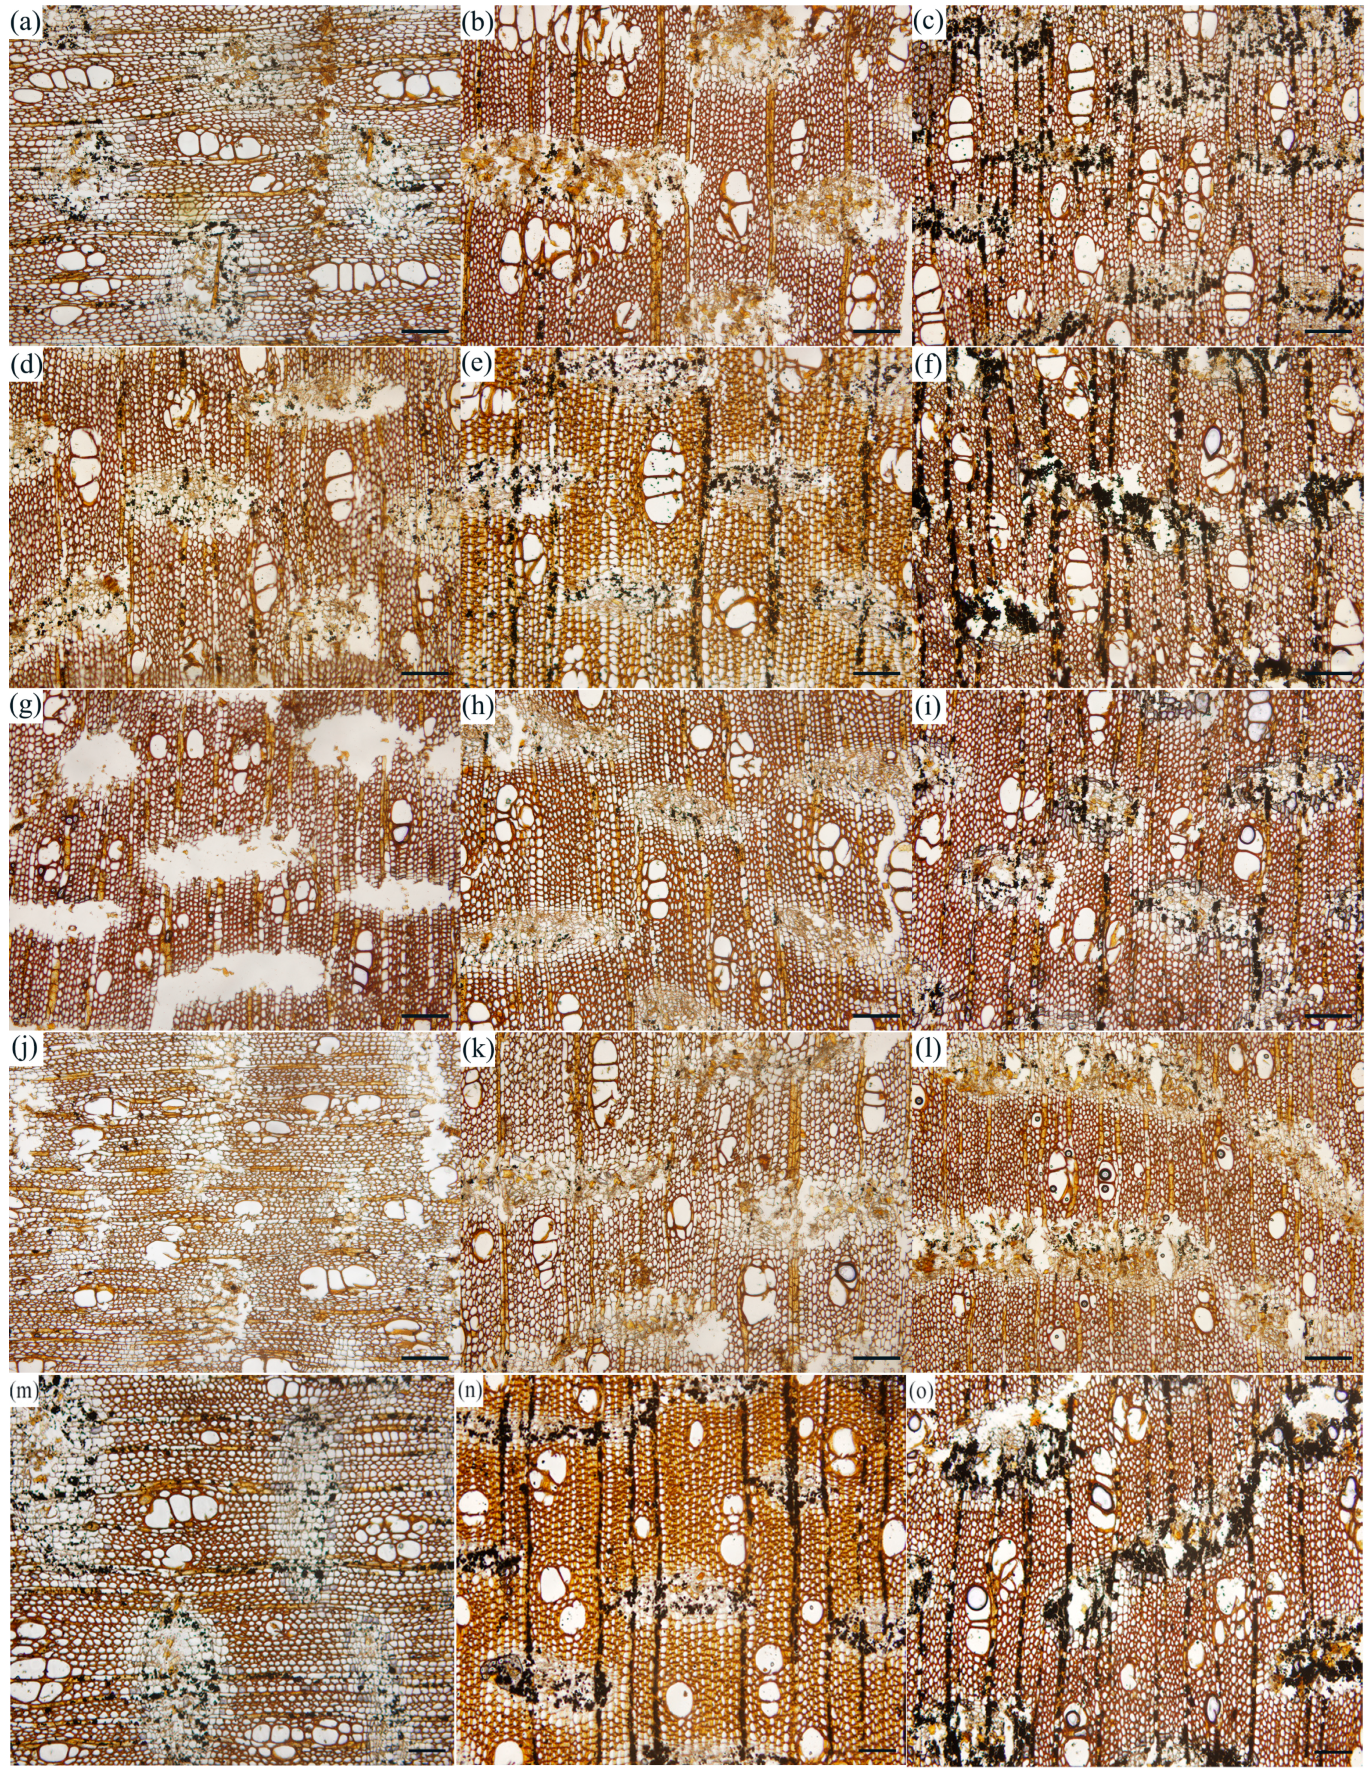
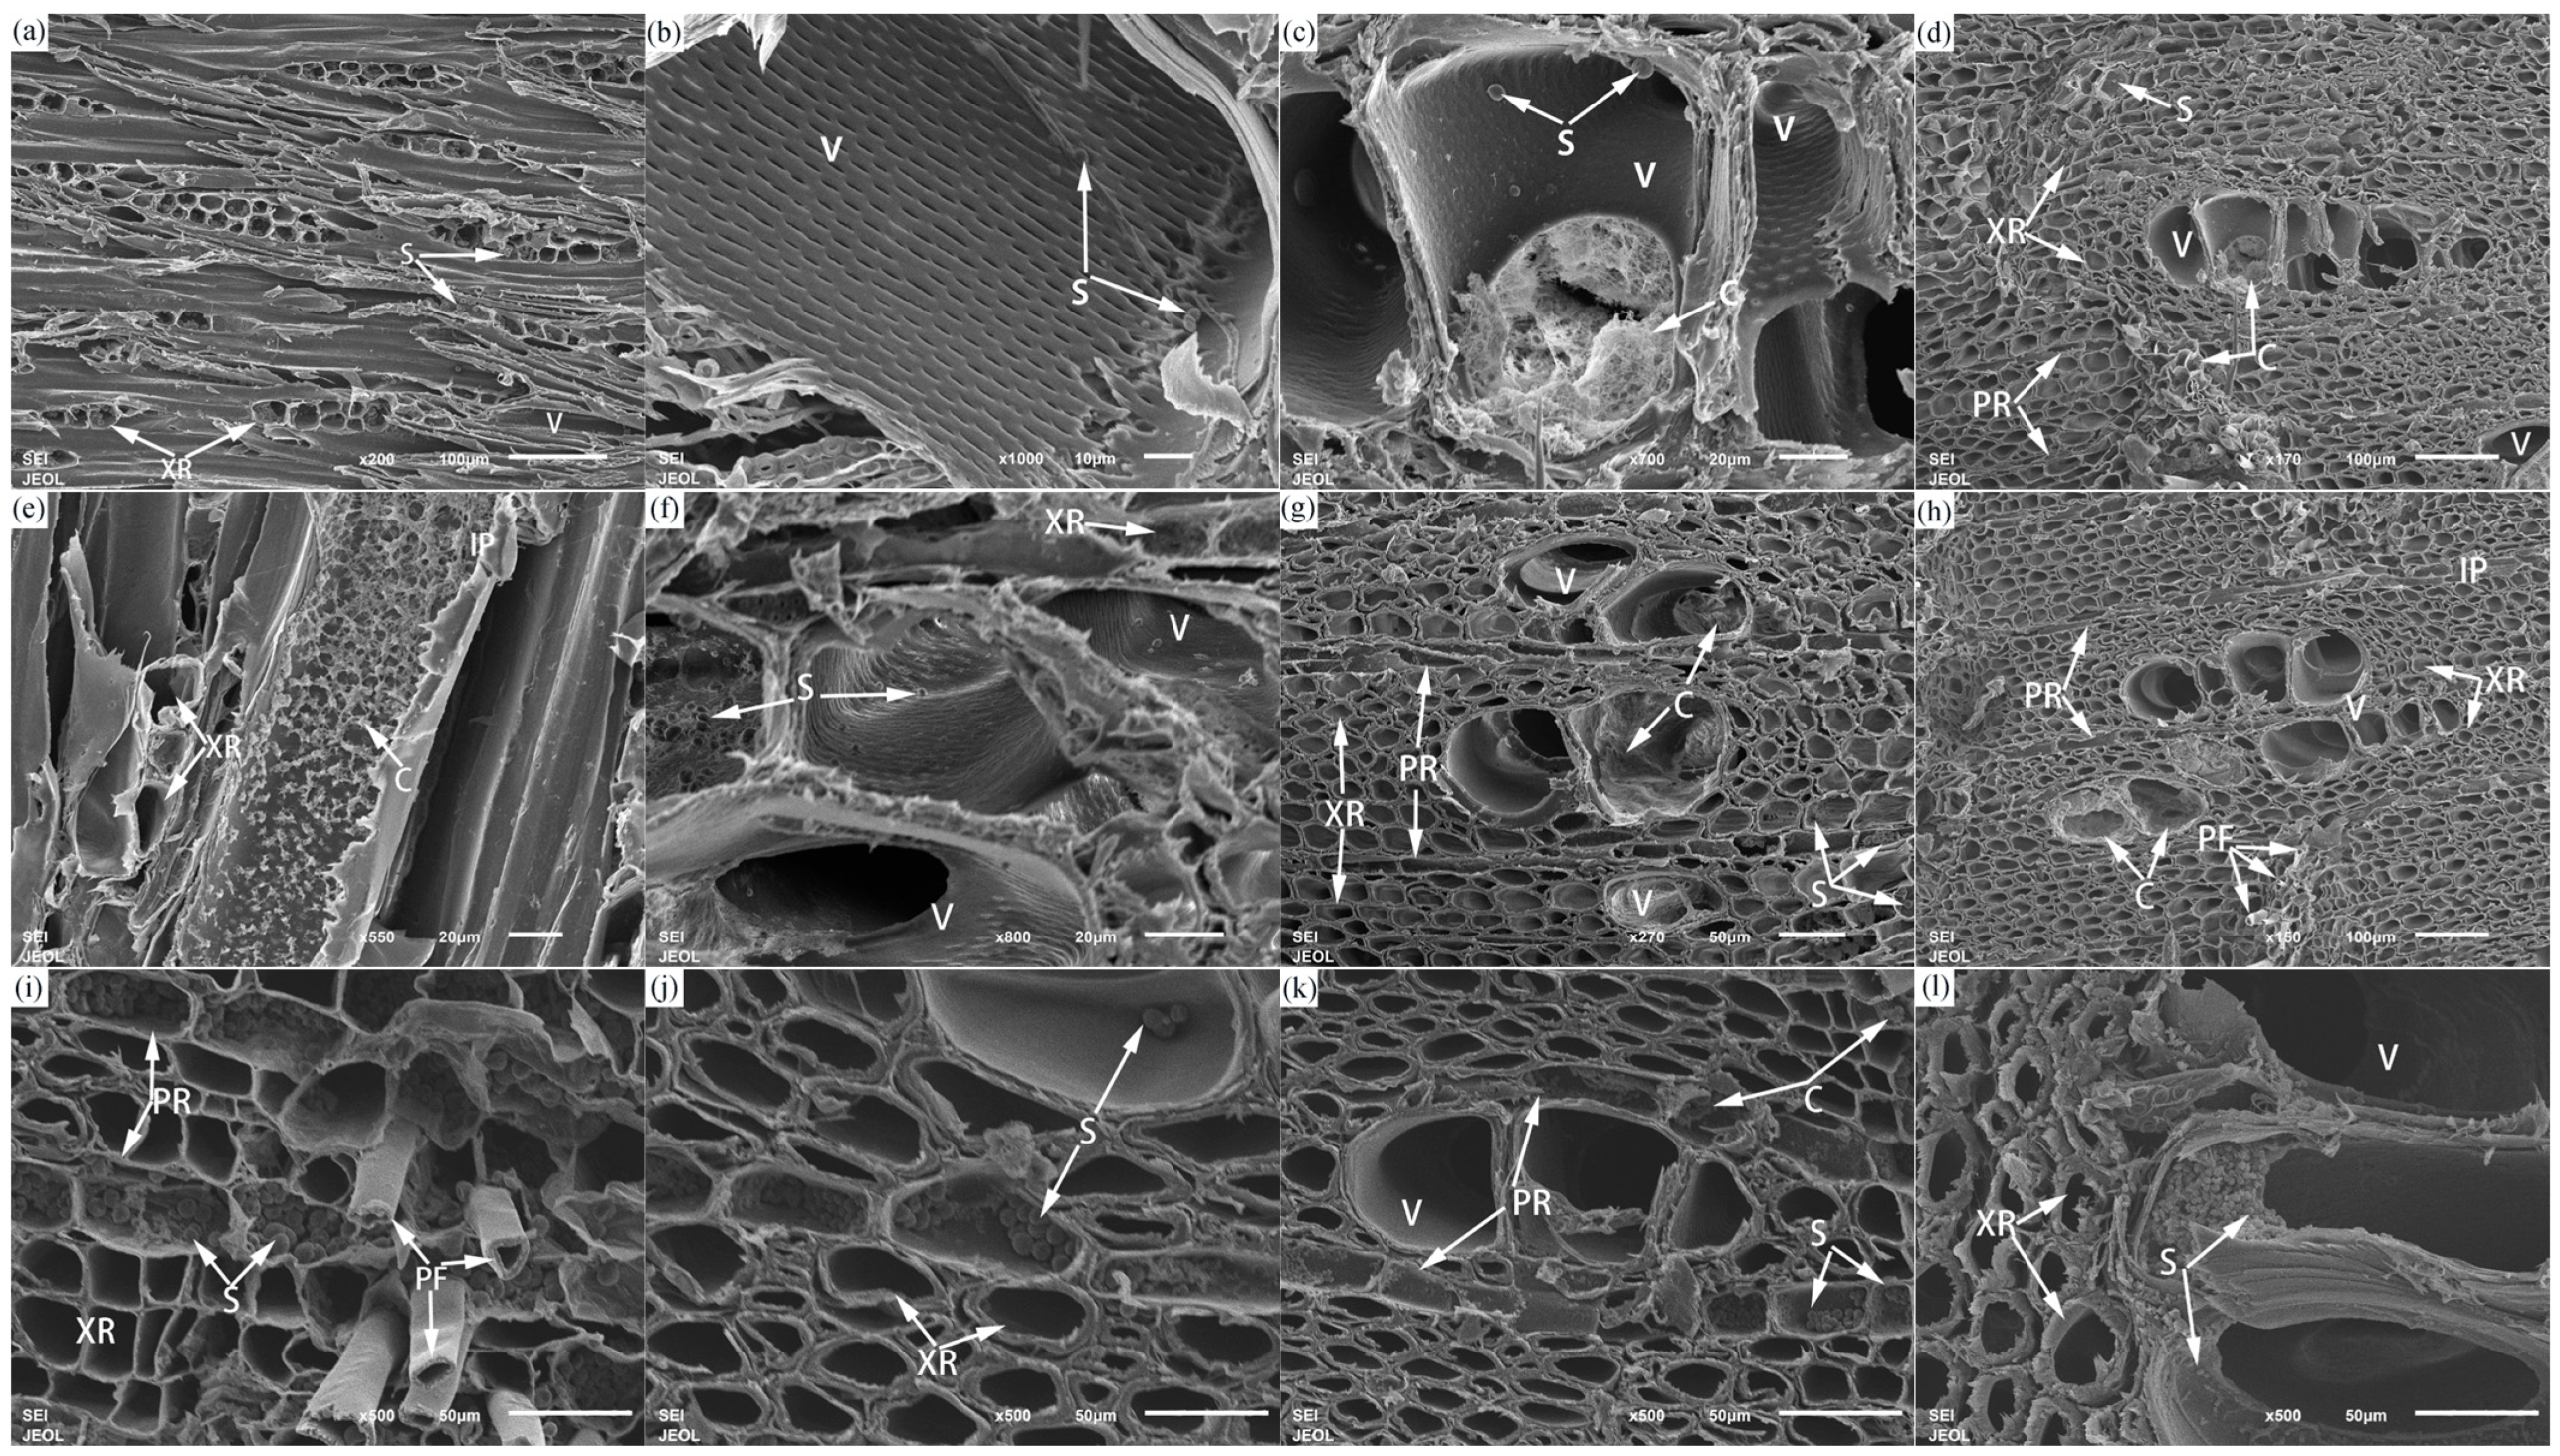
Similar to other Aquilaria species, the wood section of A. sinensis mainly consists of four parts: interfascicular cambium (IP), wood rays (XR), vessels (V), and wood fibers (F). Fully differentiated IP may consist of the following characteristic structures: thin-walled cells, sieve tubes, interfascicular cambium rays, and interfascicular cambium fibers. To investigate the characteristics of substance changes in the wood section during the formation of agarwood resin, based on the changes in the abundance of starch granules and non-starch polysaccharides, we took agarwood samples produced from the treatments with the lowest metabolic capacity (D2), the highest metabolic capacity (F2), and the control (CK) as examples. One month after induction, a large number of starch granules was found to be accumulated in the ray cells of agarwood samples produced from the D2 treatment (Figure 4a) and CK treatment (Figure 4i). In comparison, crystal aggregates began to form in the parenchyma cells of agarwood samples produced from the F2 treatment (Figure 4e). After three months of induction, a small quantity of oil droplets was observed in the vessels of agarwood samples obtained from the D2 treatment (Figure 4b,c), while a large number of oil droplets and fillings were observed in the vessels of agarwood samples produced from the F2 treatment (Figure 4f,g). However, a large number of starch granules remained in the vessels of agarwood samples produced from the CK treatment (Figure 4j,k), with only a minimal presence of oil droplets. After six months of induction, the content in the wood section of the CK (Figure 4l) treatment showed little difference from the previous stage. Both the D2 treatment (Figure 4d) and F2 treatment (Figure 4.h) agarwood samples showed a gradual accumulation of crystal aggregates in the vessels. Among them, some vessels of the F2 treatment (Figure 4h) agarwood samples showed complete blockage by crystal aggregates.
3.3. Non-Structural Carbohydrate Content
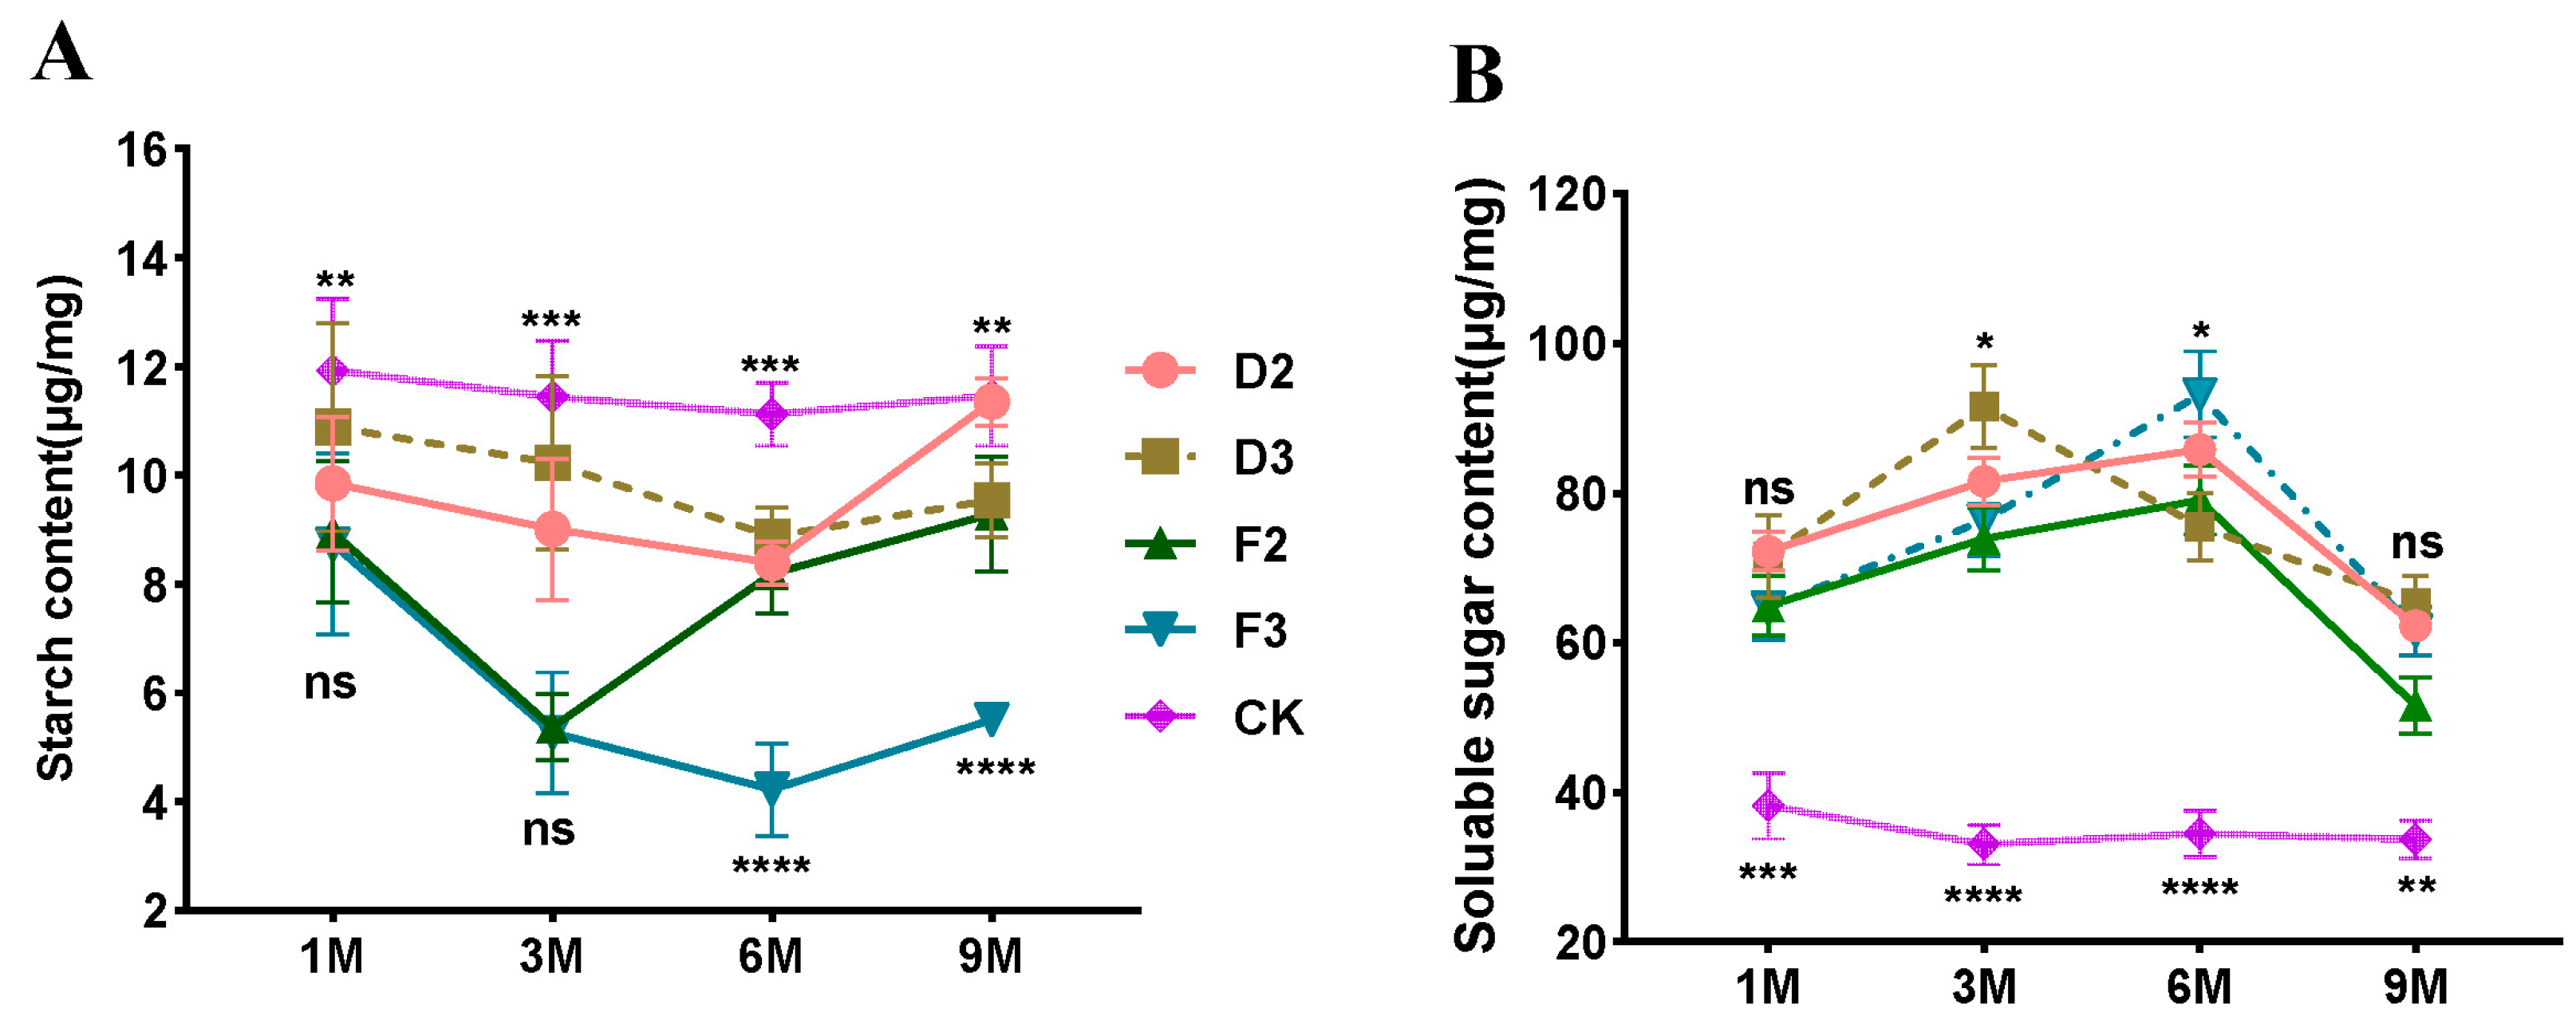
After treatment with injury, the starch content showed a decrease and subsequent increase. Furthermore, the starch content of each injury treatment was significantly lower compared to the control group at different intervals, as illustrated in Figure 5A. The decrease in starch content was greater in F1- and F2-treated samples between one month and three months of induction treatment (Figure 5A). In particular, F1 treatment samples reached their lowest point three months after injury treatment and then gradually increased. By the sixth month, the starch content of D1, D2, and F2 treatment samples had all reached their minimum levels. Notably, the starch content of the F2-treated sample was the lowest, measuring only 4.23 mg/g, which was merely 38% of the CK sample. While the injury treatments did exhibit a marked increase in starch content between the sixth to ninth months, they remained below the levels of the control samples. The non-starch polysaccharide content of the injury-treated samples, except CK, demonstrated an overall increase and decrease pattern. It was significantly higher than that of the control for all injury treatments at various times (Figure 5B). The non-starch polysaccharide content in the D2-, F1-, and F2-treated samples showed a consistent increase from the first to the sixth months. In the sixth month, all samples reached their peak with the F2-treatedsamples displaying the highest non-starch polysaccharide content of 93.2 mg/g, 2.7 times higher than the control. The non-starch polysaccharide content of D1-treated samples, on the other hand, peaked in the third month. At the sixth to ninth months, the non-starch polysaccharide content of all injury-treated samples was significantly higher than that of the control group (CK). However, all samples displayed a significant decrease.
3.4. Determination of the Discoloration Range of Agarwood
Measurements and analyses indicate that the resin area induced by the “drilling holes–fungi” combination method was smaller than that induced by the combination of “burning holes and fungi” (Table 2). Furthermore, over time, the different induction methods resulted in an enlargement of the horizontal and vertical discoloration of the resin area. Within the initial three months, there was no substantial variance in the length of horizontal discoloration in the resin region for the various methods of binding with the same fungus. At three to six months, both horizontal and radial discoloration in the resin region continued to expand among all treatments except for the combination of “burning holes and fungi B” (D2), which did not display a notable rise in horizontal discoloration. As time passed, approximately nine months after the initial treatment, the changes in the resin area not only encircled the wound and covered a large segment of the trunk, but also gradually infiltrated into the xylem. The radial and lateral discoloration distances of the resin zone in the F2 treatment were significantly greater than those in other treatments, measuring 10.7 cm and 5.43 cm, respectively. Conversely, there was no significant difference in the remaining treatments. Fungus B proved more effective than fungus A in inducing the range of discoloration in the resin zone. Moreover, the combination of “burning holes and fungi” exhibited a considerable advantage in inducing the range of discoloration.
3.5. Analysis of the Chemical Composition of Agarwood
3.5.1. Alcohol-Soluble Extract Content Analysis
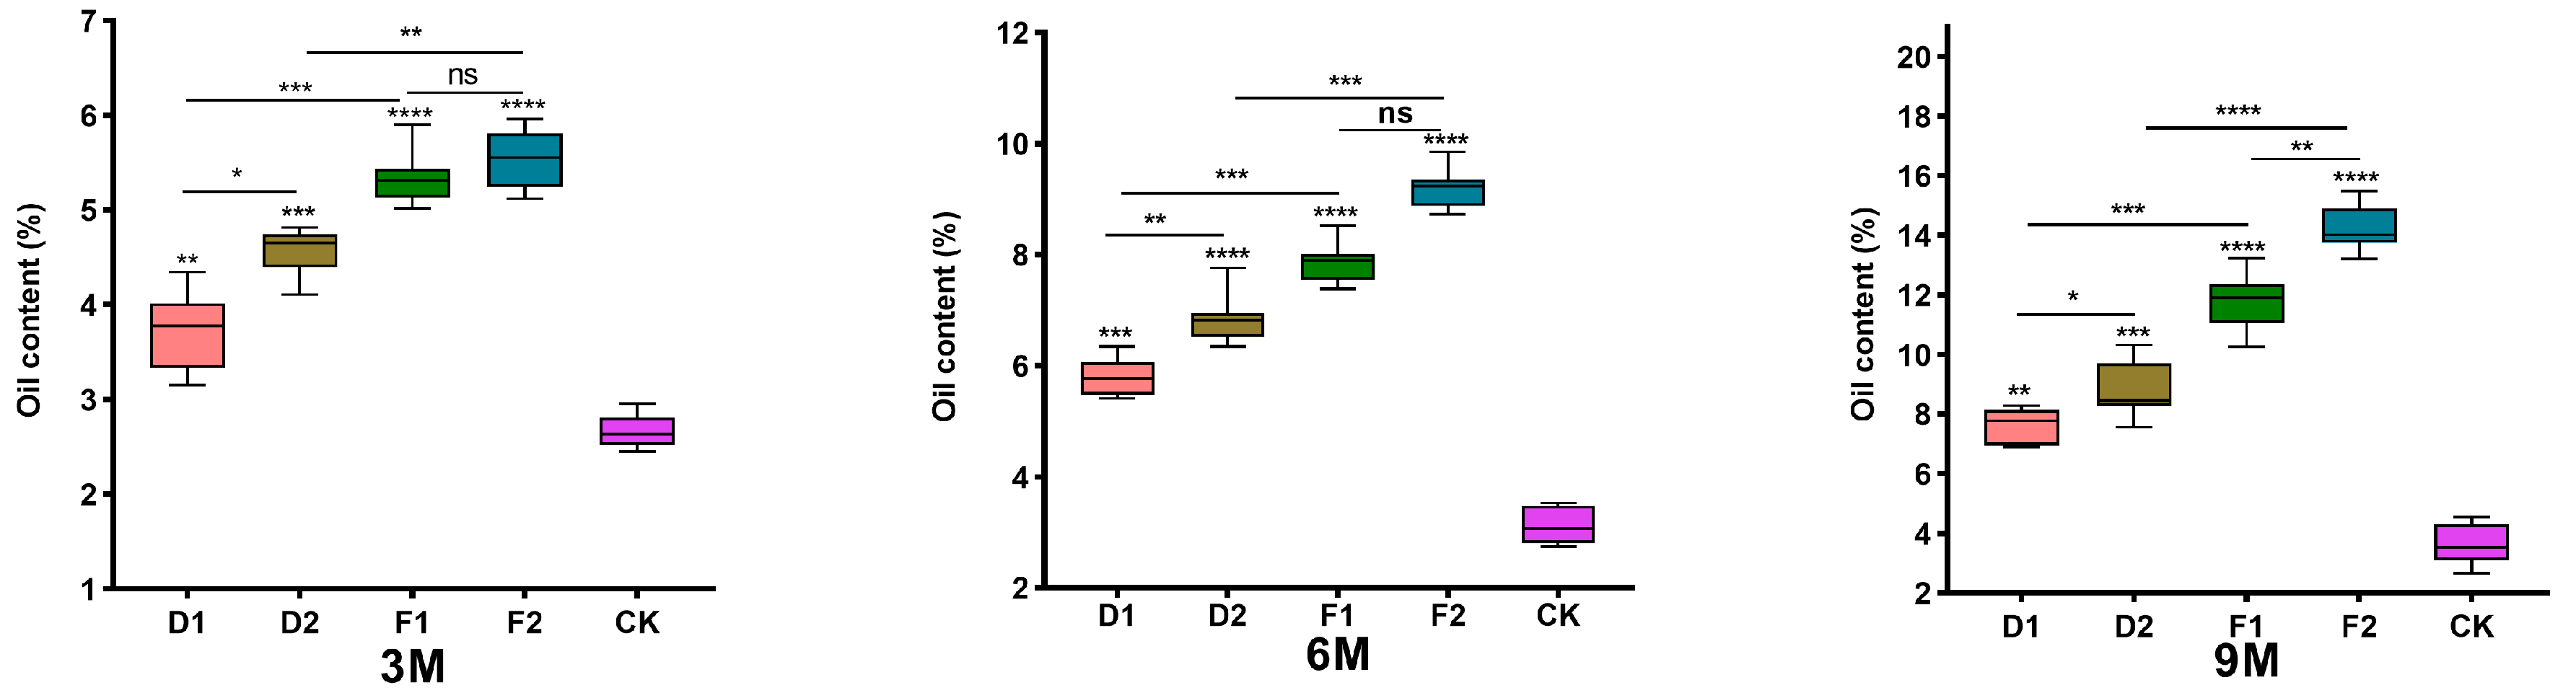
We used ultrasound-assisted solvent extraction to determine the content of alcohol-soluble essential oils in five different treatment samples: control with drilling treatment (CK), drilling treatment combined with fungal A (D1), drilling treatment combined with fungus B (D2), burning treatment combined with fungus A (F1), and burning treatment combined with fungus B (F2) (Figure 6). During the 3 to 9 months of induction after the damage, the content of alcohol-soluble essential oils in the treated agarwood samples ranged from 3.73% ± 0.43% to 14.20% ± 0.27%, which was significantly higher than the control group for the same inoculation time. Furthermore, the content of alcohol-soluble essential oils in the burning treatment combined with fungus A (F1) and fungus B (F2) exceeded that of the other damage treatments. Among them, the burning treatment combined with fungus B (F2) had the highest content of alcohol-soluble essential oils, significantly higher than the other damage treatments. This indicates that both fungi A and B can increase the content of alcohol-soluble essential oils in agarwood after the damage treatment. In addition, it is possible that the synergistic effect of the burning treatment and fungal leads to more vigorous fungal reproduction and an enhanced trunk defense response, resulting in the production of more secondary metabolites, which also contributes to the increased content of essential oils in agarwood.
3.5.2. Chemical Composition GC-MS Identification of Alcohol-Soluble Extracts
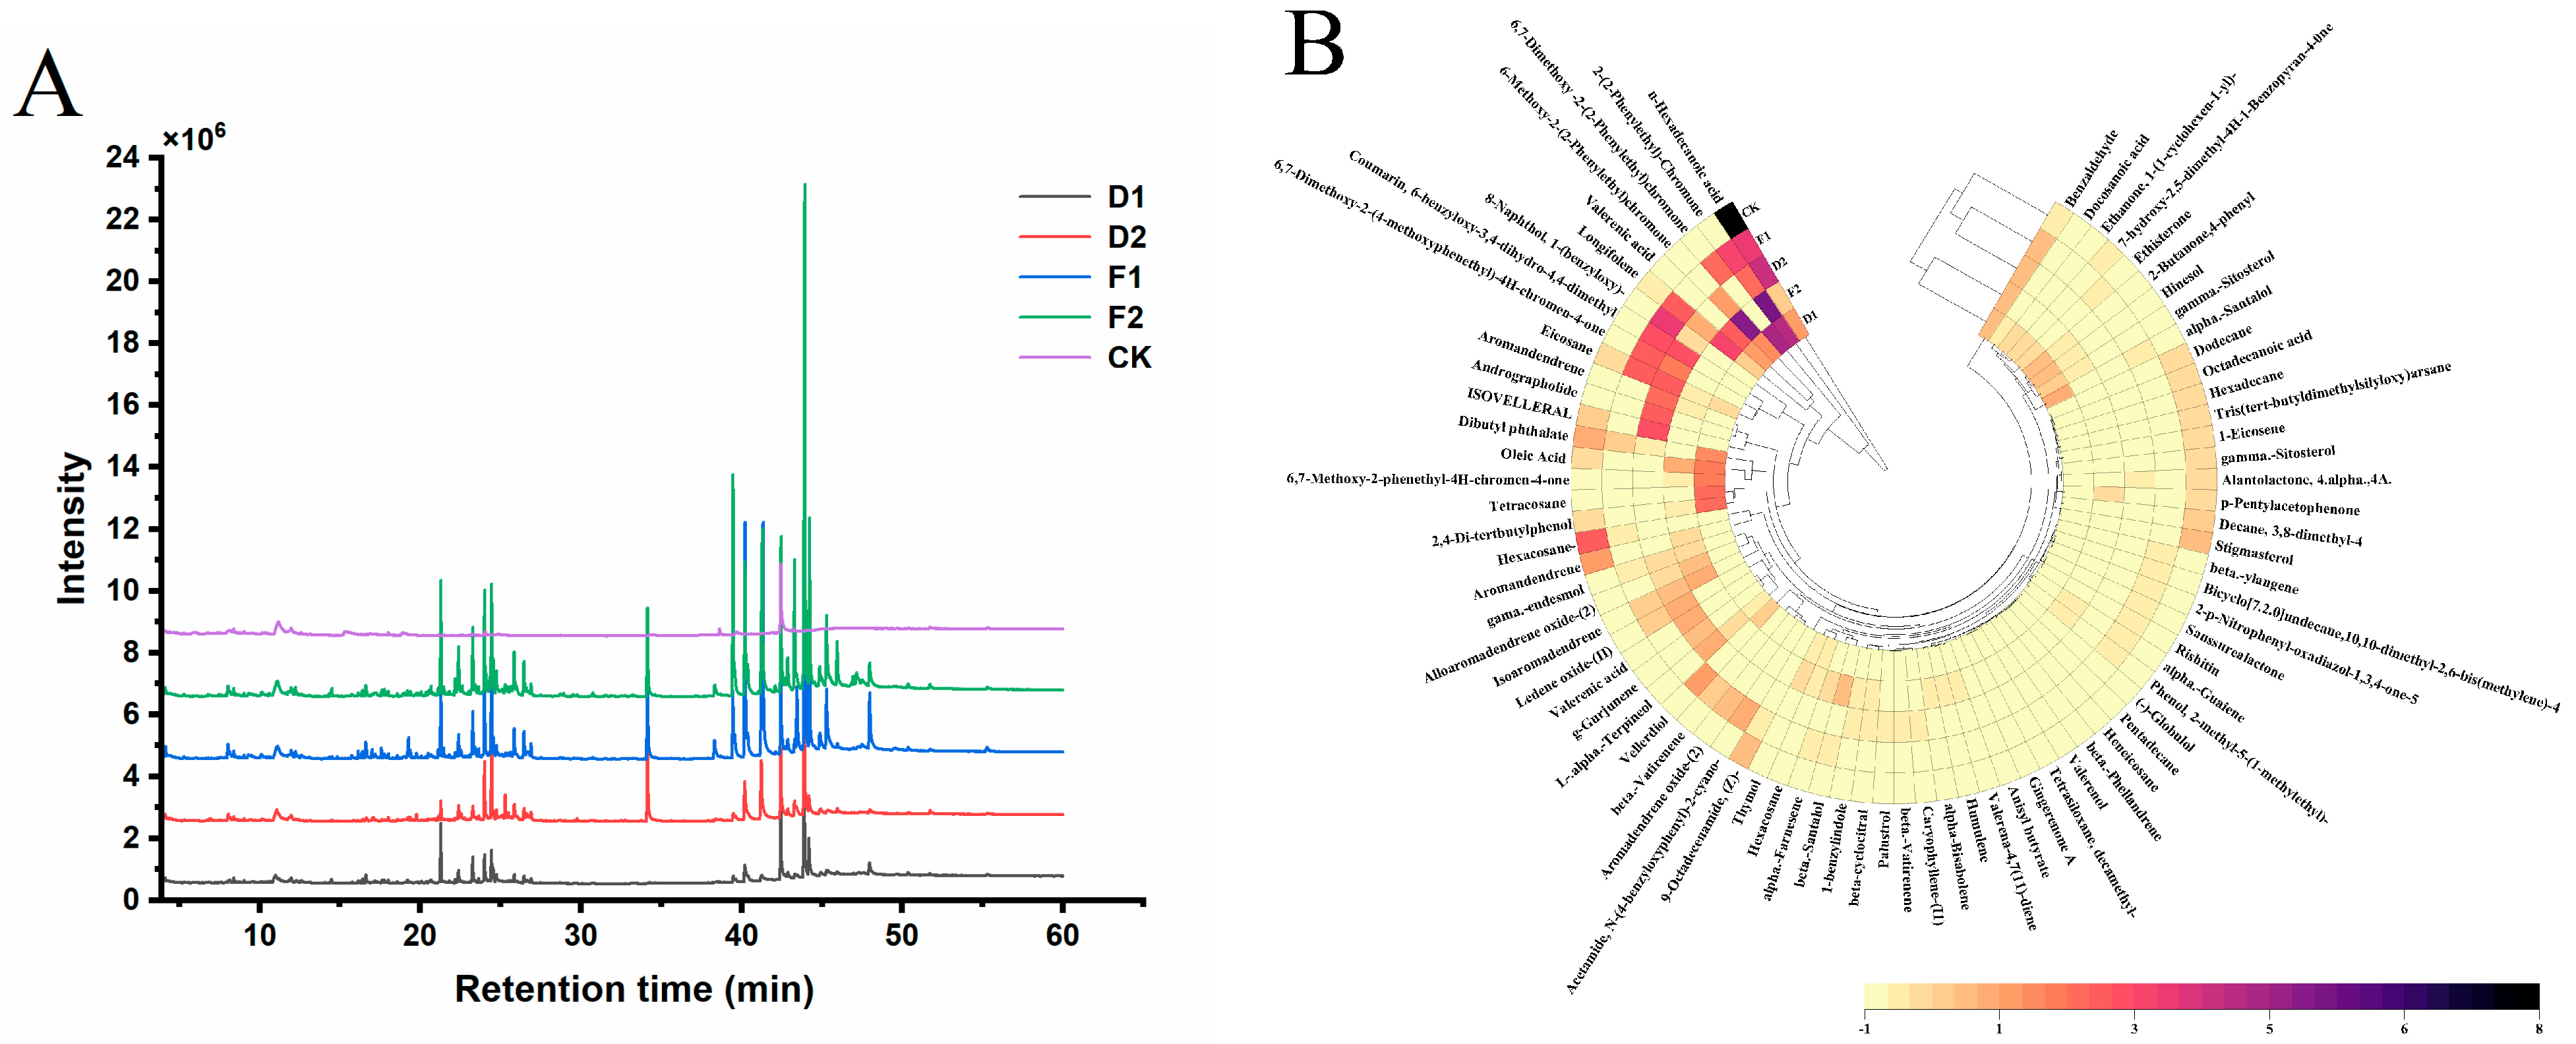
The TIC chromatographs of representative samples (D1, D2, F1, F2, and CK) are shown in Figure 7A. There were marked differences in the peak timing and area between different agarwood essential oils. The number of peaks for detecting the tail increased significantly in F2 compared to CK. The heatmap (Figure 7B) shows a panoramic view of the distribution of volatile compounds. Results of the chromatographic analysis showed that D1 was similar to F2, D2, and F1 clustered with CK. The classification results showed that the agarwood essential oil compositions were significantly different among the treatments.
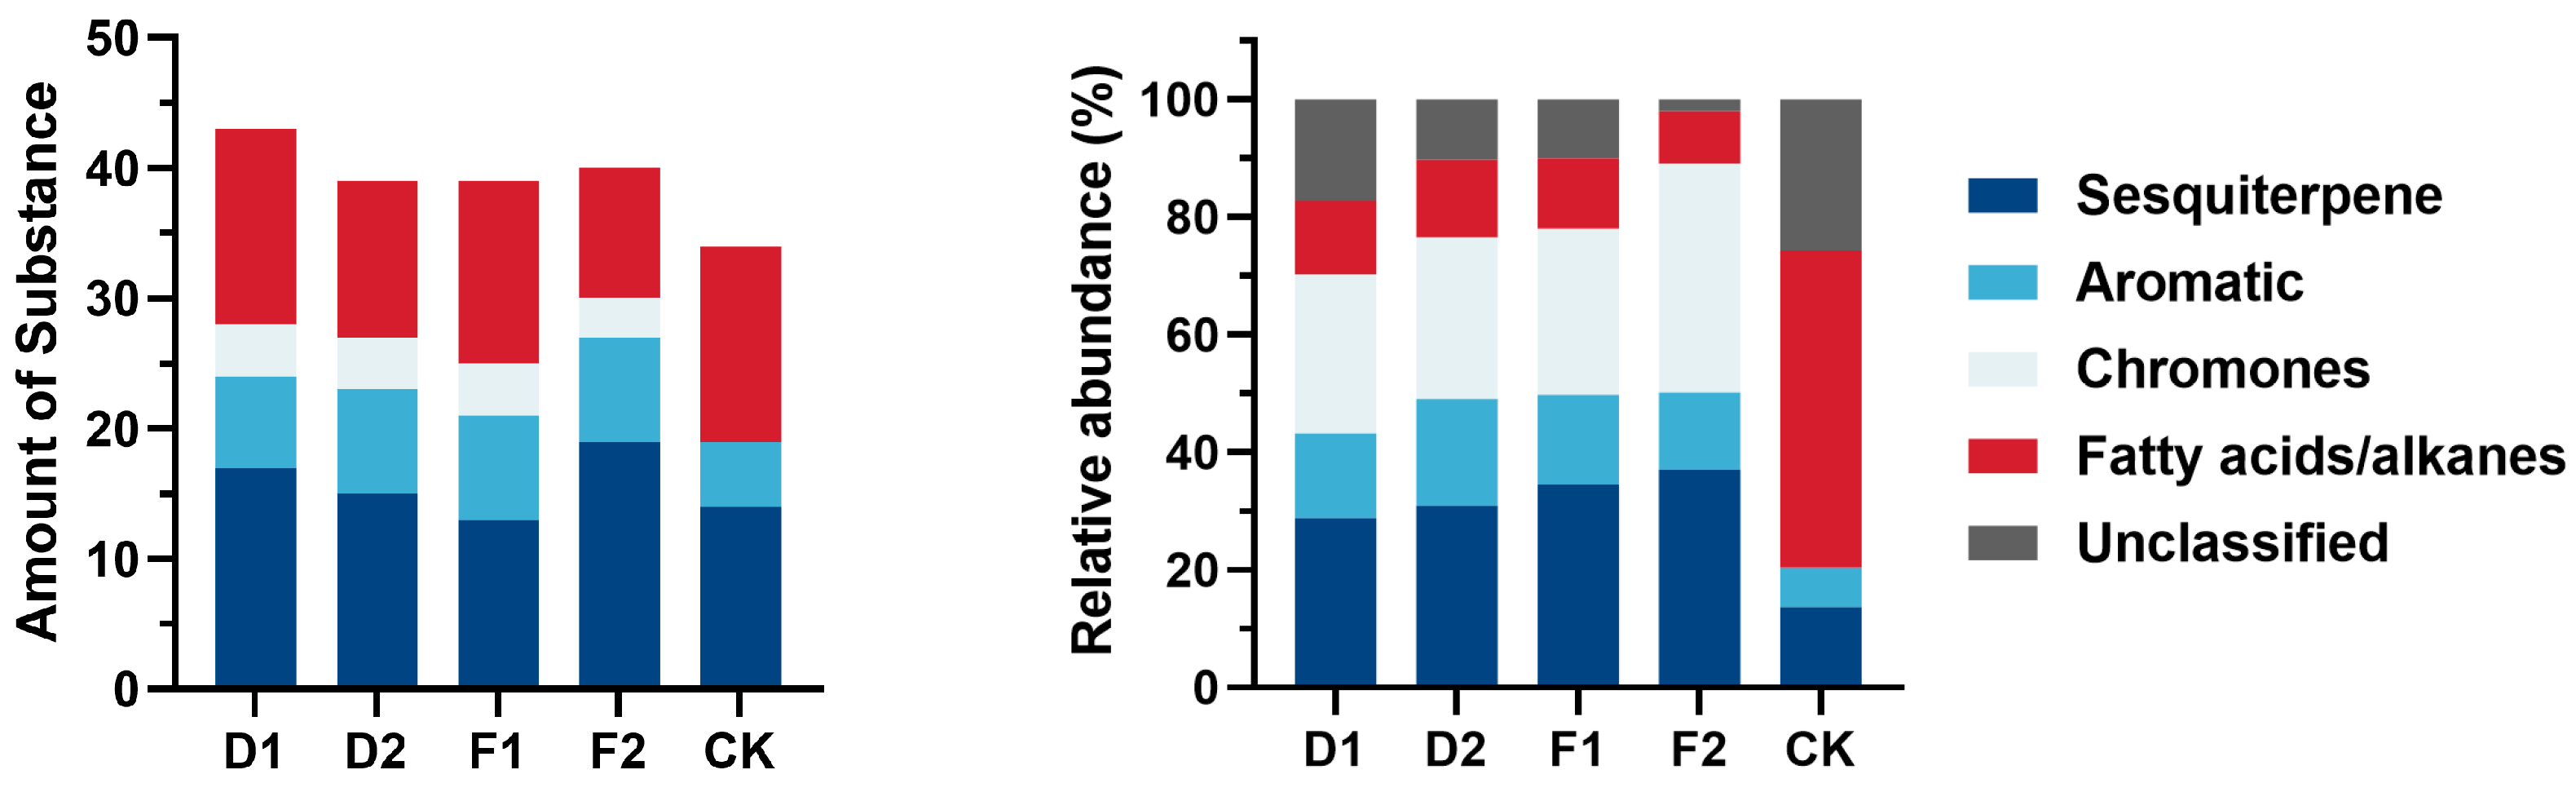
The alcohol-soluble essential oil composition of each treatment was analyzed to identify sesquiterpenoids and 2-(2-phenylethyl) chromones by comparing the retention times and mass spectra with reference compounds. The essential oil compositions of the agarwood treatments are presented in Appendix A, revealing 79 total compounds, consisting of 32 sesquiterpenoids, 8 chromones, 13 aromatic compounds, and 28 aliphatic or alkyl compounds (Figure 8). The combined total proportion of the chromatographic peaks in the samples treated with D1, D2, F1, F2, and CK was 82.75%, 89.65%, 90.01%, 92.95%, and 74.25%, respectively, determined by using the peak area normalization method. Furthermore, the presence of sesquiterpenes and 2-(2-phenylethyl) chromone constituents served as a crucial criterion for gauging the excellence of agarwood. The combined quantity of relative contents of sesquiterpenes and 2-(2-phenylethyl) chromone components in the respective injuries totaled 55.82%, 58.31%, 62.65%, 70.97%, and 13.71%. It is shown that the trunk xylem makes full use of biochemical synthetic reactions to resist fungal damage after inoculation damage treatment. Additionally, various characteristic agarwood substances were produced during this process. The relative contents of total sesquiterpenes and 2-(2-phenylethyl) chromatin were significantly different between the treatments. The levels of sesquiterpenes and 2-(2-phenylethyl) chromone were comparatively greater in the combined treatment (F1, F2) of burning holes and fungal than in the drilled holes and fungal-induced treatments (D1, D2). Therefore, to maximize the efficiency of agarwood production, the fungal induction method can be used in combination with the burning holes method to improve the quality of the produced agarwood wood.
4. Discussion
Plant secondary metabolites are known to play a crucial role in safeguarding plants against both biological and abiotic stressors [45]. Secondary metabolites constitute a category of biologically active compounds primarily derived from primary metabolites. Secondary metabolism, while not directly influencing plant growth, triggers plant defense mechanisms in response to various stresses, resulting in metabolic alterations and the synthesis of chemical compounds possessing aromatic or medicinal properties [46]. Secondary metabolites can be categorized into three main groups: (i) terpenoids, which are involved in plant resistance to biotic and abiotic stress and serve as signaling molecules for insect pollination; (ii) phenolic compounds such as flavonoids, lignin, coumarins, and tannins, which are released by plants in response to external stress signals to regulate antioxidant and enzyme activity, as well as free radical scavenging activity, enabling them to adapt to adverse environmental conditions; and (iii) nitrogen-containing compounds including alkaloids and glucosinolates, which primarily enhance plant resistance and improve adaptability [47,48,49]. Verma and Shukla [50] reported a notable rise in phenolic content in plants after fungal inoculation. Araya-Cloutier et al. [51] reported a notable elevation in the levels of isoflavones and stilbenoids in leguminous plants as a result of fungal induction. Moola and Diana [52] employed Aspergillus Niger and Penicillium as inducers to stimulate the production of betaines in hairy root cultures of beet. In this study, we performed a concurrent inoculation of three fungi with different levels of physical damage on agarwood. Physical punching causes direct damage to the integrity of plant cell walls. The cell walls of plants are intricate, dynamic, three-dimensional structures primarily consisting of cellulose, hemicellulose, pectin, and other constituents [53].
When plants detect damage to their cell walls, it typically initiates a cascade of defensive responses [54]. Simultaneously, the three endophytic fungi release cell wall-degrading enzymes such as cellulases, pectinases, and ligninases as part of the infection process, and they also activate various signaling pathways to prompt metabolic alterations. Compounds such as lignin and resin generated in the woody tissue have the ability to create a protective barrier surrounding the polysaccharides and protein molecules of plant tissues. This barrier serves to hinder fungi from infiltrating through the hydrolysis of plant tissues, thereby bolstering the plant’s resistance to diseases [54,55,56]. The study’s findings revealed an increase in the type and content of secondary metabolites when comparing the induction of burning holes with the induction of drilling combined with fungi. This phenomenon could be attributed to the heightened cell wall damage resulting from the fire-incense hole, which amplifies the efficacy of cellulases, hemicelluloses, and pectinases. Consequently, this amplification accelerates the extent and speed of substance conversion, fostering the generation of additional secondary metabolites in agarwood trees. This process serves to safeguard the trees from external stress and fungal intrusion [54,57,58].
The structural composition of agarwood trees plays a critical role in the formation and accumulation of agarwood resin [21]. When the Aquilaria sinensis are subjected to external stimuli or environmental changes, such as fungal infection or mechanical damage, the substances within the xylem structure transform and form secondary metabolites to protect and counteract external stresses [5,21,59]. Over time, these substances gradually develop into the distinctive fragrant agarwood. Therefore, studying the anatomical structure of agarwood trees can provide a deeper understanding of the mechanisms and regulation of agarwood resin production, and provide scientific support for agarwood fragrance and medicinal use of agarwood [60]. This study evaluated, compared, and explained the anatomical structure of agarwood formed by five different induction methods. Through observations of agarwood structure, it was found that agarwood resin initially forms in the wood’s intercellular spaces (IP) and XR cells. Over time, the agarwood resin continuously accumulated in the IP and XR cells and diffused outward through the wood rays into the adjacent V and F. A comparison of different induction treatments revealed that the use of burning holes combined with fungi resulted in a shorter time for the formation of grease and flocculent crystal obstructions within the IP and XP cells, effectively enhancing the quality of agarwood.
When the Aquilaria sinensis are subjected to external injuries, the chemical composition in the wood changes [61,62]. This process mainly involves the transformation of starch into non-structural polysaccharides, as well as other chemical reactions and metabolic processes. In addition, the rate and extent of material transformation may be influenced by factors such as the external environment, injuries, and pathogen invasion [21,40,63]. To gain a deeper understanding of the substance transformation during agarwood formation, we evaluated the changes in various indicators through consecutive section staining and measurement of wood substance content. The study found that after soil agarwood suffered external injuries, the abundance and content of starch in the wood decreased to varying extents, while the abundance and content of non-structural polysaccharides showed an initially increasing and then decreasing trend. During this process, the accumulation of agarwood resin in the wood was observed under a microscope. Furthermore, when the agarwood tree was invaded by pathogens, the thin-walled cells enhanced the conversion of starch granules into non-structural polysaccharides, thereby producing more secondary metabolites with injury resistance capabilities, playing an important role in preventing subsequent pathogen invasion and reducing external stresses [21,63,64,65]. Through measurement of wood substance content and microscopic observations of the Aquilaria sinensis after different treatments, it was found that the wood starch content in the Aquilaria sinensis after burning hole and fungal combined treatment was lower than that after drilling hole and fungal combined treatment. Additionally, it was observed under a microscope that burning hole and fungal combined treatment resulted in an earlier accumulation of agarwood resin in the IP, XR, and V regions of the wood, and as time progressed, there was a greater increase in resin accumulation in the V and F regions of the wood, effectively promoting substance transformation rate. This indicates that the combined treatment method can to some extent promote substance transformation in the xylem of Aquilaria sinensis, thereby producing more secondary metabolites and playing an important role in preventing subsequent pathogen invasion and reducing external stresses.
According to the Chinese Pharmacopoeia, the content of alcohol-soluble extracts in agarwood should not be less than 10% [66]. In addition, the content of alcohol-soluble essential oil serves as one of the guiding indicators for the classification of agarwood in the trading market and is also an important indicator for judging the quality of agarwood within the agarwood industry [67,68,69]. Studies have shown that the use of fungal inoculants can effectively increase the yield and quality of Agarwood after induction. [25,29,70]. However, research results still indicate that after 6–12 months of fungal inoculant induction, although the color range of Agarwood has improved, the alcohol-soluble extract content in Agarwood samples is lower than the standard specified in the Chinese Pharmacopoeia, and there are fewer characteristic components in volatile secondary metabolites. [28,71,72,73]. This indicates that not all fungal inducers can effectively enhance the quality of Agarwood. Liu et al. [19] indicated that the use of physical damage or biological inoculation methods can induce Agarwood to reach the standard of high-quality Agarwood in terms of the content of alcohol-soluble extracts [21,74]. In this study, we found that under the same induction time, the agarwood produced by the “burning holes and fungi” combined induction method has a higher content of alcohol-soluble essential oil than the “drilling holes–fungi” combined induction method. After 9 months of induction treatment, the content of alcohol-soluble essential oil in the agarwood produced by the “burning holes and fungi” combined induction method exceeded the standard specified in the “Chinese Pharmacopoeia”. This indicates that the “burning holes and fungi” combined induction method has a more promoting effect on the quality improvement of agarwood.
Agarwood contains various organic substances, mainly sesquiterpenes, 2-(2-phenylethyl) chromones, and other pharmacologically active compounds. Sesquiterpenes are the main source of agarwood fragrance, whereas 2-(2-phenylethyl) chromones have various pharmacological effects [66,75,76,77]. The content of these active secondary metabolites is often used as an indicator to evaluate the quality and grade of agarwood [73]. Currently, more than two hundred chemical components have been identified in agarwood, and this number continues to increase with the in-depth study of agarwood metabolites [76,78]. In this investigation, the chemical properties of agarwood generated by five induction methods were examined using GC-MS. We detected 79 chemical compounds in agarwood (Appendix A). By comparing the alcohol-soluble essential oil components of agarwood produced by five different induction methods, we found that they contained similar chemical substances but with differences in their relative content. This indicates that the composition and content of volatile oil components in agarwood are directly influenced by induction methods. The relative content of total sesquiterpenes and 2-(2-phenylethyl)chromones in agarwood produced by each induction method were as follows: 55.82% (D1), 58.31% (D2), 62.65% (F1), 75.97% (F2), and 13.71% (CK). These proportions were found to be significantly higher than the chromone content of yellowed agarwood and hanging agarwood [32]. This indicates that the substances in the wood structure are fully utilized in biochemical synthesis reactions and stably produce a large number of characteristic agarwood substances to resist fungal damage [5]. Except for the drilling treatment (CK), the agarwood produced by the other four induction methods was found to be rich in volatile components similar to natural agarwood, such as “benzyl acetone” and “agarol”, as well as characteristic sesquiterpenes related to agarwood quality, such as “guaiacol”, “limonene”, and “longifolene” [66,79].
We performed hierarchical clustering analysis on the components of agarwood produced by different induction methods and found that the D1 and F2 treatments had more overlapping metabolite components. The D2, F1, and CK treatments clustered together. Among them, the relative content of metabolite components induced by D1 and D2 treatments was relatively low. This indicates that the utilization of various fungal strains alongside appropriate treatment methods is essential for the significant enhancement of both agarwood yield and quality. However, the methods used in this study still need further optimization, and it is necessary to explore more efficient fungal and co-induction methods in order to enhance the yield and quality of agarwood.
5. Conclusions
We can draw from this study the following conclusions. 1. Non-structural carbohydrate starch and soluble sugar are the main metabolic substrates of Aquilaria sinensis to form agarwood, and the formation of agarwood is the stress response product of Aquilaria sinensis to resist external stress. 2. The xylem ray and inter-xylem phloem comprise the basic organizational structure of Aquilaria sinensis to form agarwood, and the formation process of agarwood in the active cells of xylem ray and inter-xylem phloem is the process of slow death of active cells. 3. The combined induction of “burning holes and fungi” can effectively improve the yield and quality of agarwood, and can be used as a new type of agarwood induction technology, which is more conducive to the development of agarwood industry. Meanwhile, the induction techniques used in this study need to be further optimized, such as screening of more effective fungi to improve artificial inducers, increasing the frequency of injury induction treatments, prolonging the duration of induction treatments, and combining the induction pathways of various modalities, to further explore safer, more efficient, and high-quality artificial induced agarwood formation techniques. In addition, there may be opportunities to establish different methods of distinct agarwood formation for different end-uses, as agarwood has multiple applications.
Author Contributions
Conceptualization, Z.Z. and X.S.; data curation, W.Z. and X.S.; formal analysis, X.S. and S.P.; funding acquisition, Z.Z. and S.P.; investigation, X.S., Q.Z., G.L. and W.Z.; project administration, Z.Z. and S.P.; software, W.Z.; supervision, Z.Z. and S.P.; visualization, W.Z.; writing—original draft, W.Z.; writing—review and editing, W.Z. and Q.Z. All authors have read and agreed to the published version of the manuscript.
Funding
The work was supported by the Basic Scientific Research Project of the Chinese Academy of Forestry (CAFYBB2022MB004); the Forestry Science and Technology Innovation Project of Guangdong Province (2017KJCX001).
Data Availability Statement
The data presented in this study are available on request from the corresponding authors, and the dataset was jointly completed by the team, so the data are not publicly available.
Acknowledgments
The authors thank the Institute of Tropical Forestry and the Chinese Academy of Forestry for their support.
Conflicts of Interest
All authors declare no conflicts of interest and consent to the publication of this manuscript.
Appendix A

Table A1.
Chemical composition and relative amount of the agarwood oils under treatment.
| No. | Compound Name | Molecular Formula | Nine Months after Treatment | ||||
| D1 | D2 | F1 | F2 | CK | |||
| 1 | Benzaldehyde | C7H6O | 2.47 | 3.05 | 3.02 | 3.63 | 0.67 |
| 2 | Docosanoic acid | C22H44O2 | 1.01 | -- | 0.56 | 0.18 | -- |
| 3 | Dodecane | C12H26 | -- | -- | -- | -- | 1.14 |
| 4 | beta.-ylangene | C15H24 | 0.37 | -- | 1.24 | -- | -- |
| 5 | (-)-Globulol | C14H22O | -- | -- | -- | -- | -- |
| 6 | 2-Butanone,4-phenyl | C10H12O2 | 2.43 | -- | -- | 1.12 | -- |
| 7 | Valerenol | C15H24O | -- | 0.25 | -- | -- | -- |
| 8 | 1-Eicosene | C20H40 | -- | -- | -- | -- | 2.06 |
| 9 | Hexadecane | C16H34 | -- | -- | 0.21 | -- | 1.53 |
| 10 | Caryophyllene-(I1) | C15H24 | -- | 0.68 | -- | 0.31 | -- |
| 11 | L-.alpha.-Terpineol | C10H18O | 0.67 | 3.80 | -- | 2.14 | -- |
| 12 | 2,4-Di-tertbutylphenol | C14H22O | 5.24 | -- | -- | 0.86 | 1.26 |
| 13 | beta.-Phellandrene | C10H16 | 0.11 | -- | -- | -- | -- |
| 14 | Eicosane | C20H42 | 1.12 | 6.69 | 7.90 | 0.57 | 1.45 |
| 15 | Decane, 3,8-dimethyl- | C12H26 | -- | -- | -- | -- | 2.96 |
| 16 | Isoaromadendrene | C15H24O | -- | 2.89 | 2.42 | 4.64 | -- |
| 17 | alpha.-Guaiene | C15H24 | -- | -- | 0.97 | 1.12 | -- |
| 18 | n-Hexadecanoic acid | C16H32O2 | 3.57 | 10.07 | 9.85 | 2.80 | 30.33 |
| 19 | Dibutyl phthalate | C16H22O4 | 4.25 | 1.18 | 2.27 | -- | 4.38 |
| 20 | Ledene oxide-(II) | C15H24O | -- | 3.31 | 2.17 | -- | -- |
| 21 | Pentadecane | C15H32 | -- | -- | -- | -- | -- |
| 22 | Acetamide, N-(4-benzyloxyphenyl)-2-cyano- | C11H12N2O2 | -- | -- | 3.64 | -- | -- |
| 23 | beta.-Vatirenene | C15H22 | -- | -- | 2.52 | -- | -- |
| 24 | Oleic Acid | C18H34O2 | 3.15 | -- | -- | 2.31 | 1.57 |
| 25 | Saussurealactone | C15H22O2 | -- | -- | 0.76 | -- | -- |
| 26 | Hinesol | C15H26O | 2.47 | -- | -- | 0.50 | -- |
| 27 | beta-cyclocitral | C10H16O | -- | 0.74 | -- | 1.03 | -- |
| 28 | Aromadendrene oxide-(2) | C15H24O | -- | -- | 3.18 | -- | -- |
| 29 | ISOVELLERAL | C16H26O3 | -- | 7.89 | -- | -- | 2.79 |
| 30 | Andrographolide | C20H30O5 | -- | 6.68 | -- | -- | -- |
| 31 | 8-Naphthol, 1-(benzyloxy)- | C17H14O2 | -- | 1.61 | 9.58 | -- | -- |
| 32 | Longifolene | C15H24 | 1.68 | 3.57 | 7.38 | 12.22 | 0.29 |
| 33 | g-Gurjunene | C15H24O | -- | 3.16 | -- | -- | -- |
| 34 | beta.-Santalol | C15H24O | 0.48 | -- | 0.90 | 3.47 | -- |
| 35 | Valerena-4,7(11)-diene | C15H24 | -- | -- | -- | 0.56 | -- |
| 36 | Phenol, 2-methyl-5-(1-methylethyl)- | C10H14O | -- | -- | 0.98 | 0.57 | -- |
| 37 | Ethanone, 1-(1-cyclohexen-1-yl)- | C8H12O | 1.37 | -- | -- | -- | -- |
| 38 | Aromandendrene | C15H24 | -- | -- | -- | 1.68 | 5.69 |
| 39 | beta.-Vatirenene | C15H22 | -- | 0.94 | -- | -- | -- |
| 40 | Alloaromadendrene oxide-(2) | C15H240 | 0.39 | 1.89 | -- | 3.48 | -- |
| 41 | Bicyclo [7.2.0]undecane,10,10-dimethyl-2,6-bis(methylene)- | C15H24 | -- | -- | 1.36 | -- | -- |
| 42 | Valerenic acid | C15H22O2 | -- | 3.48 | -- | -- | -- |
| 43 | Hexacosane | C26H54 | 0.68 | -- | -- | 1.23 | -- |
| 44 | alpha.-Santalol | C15H24O | 2.77 | -- | 1.30 | -- | -- |
| 45 | alpha.-Farnesene | C15H24 | -- | -- | 0.71 | 2.36 | -- |
| 46 | 9-Octadecenamide, (Z)- | C18H35NO | 0.27 | -- | 1.27 | -- | 3.21 |
| 47 | Palustrol | C15H26O2 | -- | 0.87 | -- | -- | -- |
| 48 | Vellerdiol | C15H24O2 | 1.97 | -- | 4.57 | -- | -- |
| 49 | Valerenic acid | C15H22O2 | 3.38 | -- | -- | 9.65 | -- |
| 50 | Heneicosane | C21H44 | -- | -- | -- | -- | -- |
| 51 | Aromandendrene | C15H24 | -- | 6.47 | -- | 0.5 | -- |
| 52 | Humulene | C15H24O | -- | -- | -- | 0.55 | -- |
| 53 | gamma.-Sitosterol | C29H50O | -- | 0.59 | -- | -- | 2.04 |
| 54 | alpha-Bisabolene | C15H24 | -- | -- | -- | 0.79 | -- |
| 55 | Thymol | C10H14O | 0.89 | 0.40 | 0.57 | 2.00 | -- |
| 56 | Hexacosane- | C26H54 | -- | -- | 1.34 | -- | 9.72 |
| 57 | Stigmasterol | C29H48O | -- | -- | -- | -- | 3.42 |
| 58 | Octadecanoic acid | C18H36O2 | -- | -- | -- | -- | 1.12 |
| 59 | Rishitin | C14H22O2 | -- | -- | 0.74 | -- | -- |
| 60 | Coumarin, 6-benzyloxy-3,4-dihydro-4,4-dimethyl- | C18H18O3 | -- | 7.73 | 8.51 | -- | -- |
| 61 | Oleic Acid | C18H34O2 | 1.62 | -- | -- | 2.31 | -- |
| 62 | Alantolactone, 4.alpha.,4A. | C15H20O2 | -- | 0.81 | -- | -- | 1.38 |
| 63 | gama.-eudesmol | C10H18O | -- | 1.91 | 1.32 | 2.24 | -- |
| 64 | Tetracosane | C24H50 | 5.26 | -- | 0.24 | -- | -- |
| 65 | p-Pentylacetophenone | C13H18O | -- | -- | -- | 1.45 | 1.28 |
| 66 | 2-(2-Phenylethyl)-Chromone | C17H14O2 | 8.85 | 6.48 | 9.24 | 19.26 | -- |
| 67 | 6,7-Dimethoxy -2-(2-Phenylethyl)chromone | C19H18O4 | 9.72 | -- | 6.57 | -- | -- |
| 68 | 6-Methoxy-2-(2-Phenylethyl)chromone | C18H16O3 | 3.86 | 4.50 | -- | 18.27 | -- |
| 69 | 6,7-Methoxy-2-phenethyl-4H-chromen-4-one | C19H18O4 | 4.56 | -- | -- | 1.38 | |
| 70 | 6,7-Dimethoxy-2-(4-methoxyphenethyl)-4H-chromen-4-one | C20H20O5 | -- | 5.68 | 7.34 | -- | -- |
| 71 | Ethisterone | C21H28O2 | 1.53 | -- | 1.34 | 0.21 | -- |
| 72 | Anisyl butyrate | C17H14O2 | 0.35 | -- | -- | -- | -- |
| 73 | 1-benzylindole | C15H13N | -- | 1.28 | -- | 0.68 | -- |
| 74 | Tetrasiloxane, decamethyl- | C10H30O3Si4 | -- | -- | 0.38 | -- | -- |
| 75 | 7-hydroxy-2,5-dimethyl-4H-1-Benzopyran-4-0ne | C11H10O3 | 1.34 | -- | -- | 0.24 | 0.68 |
| 76 | Gingerenone A | C21H24O5 | -- | -- | 0.31 | -- | -- |
| 77 | gamma.-Sitosterol | C29H50O | 1.89 | -- | -- | 1.21 | -- |
| 78 | 2-p-Nitrophenyl-oxadiazol-1,3,4-one-5 | C8H5N3O4 | -- | -- | 1.34 | -- | -- |
| 79 | Tris(tert-butyldimethylsilyloxy)arsane | C18H45AsO3Si3 | 0.32 | -- | -- | -- | 1.34 |
References
- Elias, M.F.; Ibrahim, H.; Mahamod, W.R.W. A review on the malaysian Aquilaria species in karas plantation and agarwood production. Int. J. Acad. Res. Bus. Soc. Sci. 2017, 7, 1021–1029. [Google Scholar] [CrossRef] [PubMed]
- Azren, P.D.; Lee, S.Y.; Emang, D.; Mohamed, R. History and perspectives of induction technology for agarwood production from cultivated Aquilaria in Asia: A review. J. For. Res. 2019, 30, 1–11. [Google Scholar] [CrossRef]
- Tan, C.S.; Isa, N.M.; Ismail, I.; Zainal, Z. Agarwood induction: Current developments and future perspectives. Front. Plant Sci. 2019, 10, 122. [Google Scholar] [CrossRef] [PubMed]
- Adhikari, S.R.; Pokhrel, K.; Baral, S.D. Economic value of agarwood and its prospects of cultivation. Int. J. Appl. Sci. Biotechnol. 2021, 9, 23–31. [Google Scholar] [CrossRef]
- Ma, S.; Fu, Y.; Li, Y.; Wei, P.; Liu, Z. The formation and quality evaluation of agarwood induced by the fungi in Aquilaria sinensis. Ind. Crops Prod. 2021, 173, 114129. [Google Scholar] [CrossRef]
- Yin, Y.; Jiao, L.; Dong, M.; Jiang, X.; Zhang, S. Wood Resources, Identification, and Utilization of Agarwood in China. In Agarwood: Science behind the Fragrance; Mohamed, R., Ed.; Springer: Berlin/Heidelberg, Germany, 2016; pp. 21–38. [Google Scholar]
- Shivanand, P.; Arbie, N.F.; Krishnamoorthy, S.; Ahmad, N. Agarwood—The Fragrant Molecules of a Wounded Tree. Molecules 2022, 27, 3386. [Google Scholar] [CrossRef] [PubMed]
- Rasool, S.; Mohamed, R. Understanding agarwood formation and its challenges. In Agarwood: Science behind the Fragrance; Mohamed, R., Ed.; Springer: Berlin/Heidelberg, Germany, 2016; pp. 39–56. [Google Scholar]
- Naziz, P.S.; Das, R.; Sen, S. The scent of stress: Evidence from the unique fragrance of agarwood. Front. Plant Sci. 2019, 10, 840. [Google Scholar] [CrossRef]
- Pern, Y.C.; Lee, S.Y.; Ng, W.L.; Mohamed, R. Cross-amplification of microsatellite markers across agarwood-producing species of the Aquilarieae tribe (Thymelaeaceae). 3 Biotech. 2020, 10, 1–9. [Google Scholar] [CrossRef]
- Mitsilegas, V.; Fasoli, E.; Giuffrida, F.; Fitzmaurice, M. Environmental Crime at the International Level: Criminalisation of Illegal Trade in Wildlife under the Convention on International Trade in Endangered Species of Wild Fauna and Flora (CITES). In The Legal Regulation of Environmental Crime; Brill Nijhoff: Leiden, The Netherlands, 2022; pp. 7–54. [Google Scholar]
- Thompson, I.D.; Lim, T.; Turjaman, M. Expensive, Exploited and Endangered. In A Review of the Agarwood-Producing Genera Aquilaria and Gyrinops: CITES considerations, Trade Patterns, Conservation, and Management; ITTO Technical Series No. 51; International Tropical Timber Organization (ITTO): Yokohama, Japan, 2022; pp. 14–25. [Google Scholar]
- Dobhal, S.; Bahuguna, D.; Binjola, R.; Bhatt, G.; Kumar, R.; Joshi, A.; Upadhyay, K.; Chauhan, N. Potential and scope of Agarwood (Aquilaria malaccensis lamk.) cultivation in India. Pantnagar. J. Res. 2023, 21, 2. [Google Scholar]
- Adam, A.Z.; Lee, S.Y.; Mohamed, R. Pharmacological properties of agarwood tea derived from Aquilaria (Thymelaeaceae) leaves: An emerging contemporary herbal drink. J. Herb. Med. 2017, 10, 37–44. [Google Scholar] [CrossRef]
- El Enshasy, H.A.; Hanapi, S.Z.; Malek, R.A.; Abdelgalil, S.A.; Leng, O.M. Endophytic fungi: The desired biostimulants for essential oil production. In Endophytic Fungal Research. Fungal Biology; Singh, B., Ed.; Springer: Cham, Switzerland, 2019; pp. 211–232. [Google Scholar]
- Kaleri, A.H.; Song, X.-Q.; Dai, H.F.; Kaleri, A.A.; Muhammad, N.M.; Mehmood, A.; Kaleri, G.S.; Kaleri, A.R. 1. An important variety of organic gemstones-Agarwood. Patent Abstr. Bibliogr. 2020, 9, 1424–1435. [Google Scholar] [CrossRef]
- Hoque, M.; Mondal, M.; Sagor, G.; Hasan, M.; Hannan, A. Inclusive Scenario of Natural Products Obtained from Agar Plant (Aquilaria sp.) In Bangladesh-A Review. J. Biosci. 2021, 29, 151–173. [Google Scholar] [CrossRef]
- Ding, X.; Mei, W.; Lin, Q.; Wang, H.; Wang, J.; Peng, S.; Li, H.; Zhu, J.; Li, W.; Wang, P. Genome sequence of the agarwood tree Aquilaria sinensis (Lour.) Spreng: The first chromosome-level draft genome in the Thymelaeceae family. GigaScience 2020, 9, giaa013. [Google Scholar] [CrossRef] [PubMed]
- Liu, Y.; Chen, H.; Yang, Y.; Zhang, Z.; Wei, J.; Meng, H.; Chen, W.; Feng, J.; Gan, B.; Chen, X. Whole-tree agarwood-inducing technique: An efficient novel technique for producing high-quality agarwood in cultivated Aquilaria sinensis trees. Molecules 2013, 18, 3086–3106. [Google Scholar] [CrossRef]
- Ye, W.; Zhang, W.; Liu, T.; Zhu, M.; Li, S.; Li, H.; Huang, Z.; Gao, X. iTRAQ-based quantitative proteomic analysis of chemically induced Aquilaria sinensis provides insights into agarwood formation mechanism. Proteomics 2018, 18, 1800023. [Google Scholar] [CrossRef] [PubMed]
- Liu, Y.; Qiao, M.; Fu, Y.; Wei, P.; Li, Y.; Liu, Z. Tissue structure changes of Aquilaria sinensis xylem after fungus induction. Forests 2022, 13, 43. [Google Scholar] [CrossRef]
- Van Thanh, L.; Van Do, T.; Son, N.H.; Sato, T.; Kozan, O. Impacts of biological, chemical and mechanical treatments on sesquiterpene content in stems of planted Aquilaria crassna trees. Agrofor. Syst. 2015, 89, 973–981. [Google Scholar] [CrossRef]
- Chhipa, H.; Chowdhary, K.; Kaushik, N. Artificial production of agarwood oil in Aquilaria sp. by fungi: A review. Phytochem. Rev. 2017, 16, 835–860. [Google Scholar] [CrossRef]
- Yang, Y.; Feng, J.; Zhu, J.; Liu, Y.; Chen, D.; Wei, J. Quality of agarwood produced by whole tree agarwood-inducing technique (Agar-WIT) from China and Southeast Asian countries. Chin. Pharm. J. 2019, 54, 1988–1994. [Google Scholar]
- Chen, X.; Liu, Y.; Yang, Y.; Feng, J.; Liu, P.; Sui, C.; Wei, J. Trunk surface agarwood-inducing technique with Rigidoporus vinctus: An efficient novel method for agarwood production. PLoS ONE 2018, 13, e0198111. [Google Scholar] [CrossRef]
- Liu, Y. Research on Quality Characteristics of Agarwood Produced by Whole-Tree Agarwood-Inducing Technique. Ph.D. Thesis, Peking Union Medical College, Beijing, China, 2018. [Google Scholar]
- Chen, X.; Sui, C.; Liu, Y.; Yang, Y.; Liu, P.; Zhang, Z.; Wei, J. Agarwood formation induced by fermentation liquid of Lasiodiplodia theobromae, the dominating fungus in wounded wood of Aquilaria sinensis. Curr. Microbiol. 2017, 74, 460–468. [Google Scholar] [CrossRef] [PubMed]
- Subasinghe, S.; Hitihamu, H.; Fernando, K. Use of two fungal species to induce agarwood resin formation in Gyrinops walla. J. For. Res. 2019, 30, 721–726. [Google Scholar] [CrossRef]
- Faizal, A.; Azar, A.W.P.; Turjaman, M.; Esyanti, R.R. Fusarium solani induces the formation of agarwood in Gyrinops versteegii (Gilg.) Domke branches. Symbiosis 2020, 81, 15–23. [Google Scholar] [CrossRef]
- Mohamed, R.; Jong, P.L.; Kamziah, A.K. Fungal inoculation induces agarwood in young Aquilaria malaccensis trees in the nursery. J. For. Res. 2014, 25, 201–204. [Google Scholar] [CrossRef]
- Zhang, Z.; Han, X.M.; Wei, J.H.; Xue, J.; Yang, Y.; Liang, L.; Li, X.J.; Guo, Q.M.; Xu, Y.H.; Gao, Z.H. Compositions and antifungal activities of essential oils from agarwood of Aquilaria sinensis (Lour.) Gilg induced by Lasiodiplodia theobromae (Pat.) Griffon. & Maubl. J. Braz. Chem. Soc. 2014, 25, 20–26. [Google Scholar]
- Tibpromma, S.; Zhang, L.; Karunarathna, S.C.; Du, T.Y.; Phukhamsakda, C.; Rachakunta, M.; Suwannarach, N.; Xu, J.; Mortimer, P.E.; Wang, Y.H. Volatile constituents of endophytic fungi isolated from Aquilaria sinensis with descriptions of two new species of Nemania. Life 2021, 11, 363. [Google Scholar] [CrossRef]
- Wang, Y.; Xu, J. Endophytic fungi of agarwood and their chemical compounds. Fungal Biotec 2022, 2, 16–35. [Google Scholar]
- Zhang, Z.; Zhao, M.; Ran, J.; Gao, M.; Li, N.X.; Ma, Y.M.; Sun, Y.; Li, Y. Fusarium oxysporum infection-induced formation of agarwood (FOIFA): A rapid and efficient method for inducing the production of high quality agarwood. PLoS ONE 2022, 17, e0277136. [Google Scholar] [CrossRef]
- Khalil, A.M.A.; Hassan, S.E.-D.; Alsharif, S.M.; Eid, A.M.; Ewais, E.E.-D.; Azab, E.; Gobouri, A.A.; Elkelish, A.; Fouda, A. Isolation and characterization of fungal endophytes isolated from medicinal plant Ephedra pachyclada as plant growth-promoting. Biomolecules 2021, 11, 140. [Google Scholar] [CrossRef] [PubMed]
- Woudenberg, J.; Groenewald, J.; Binder, M.; Crous, P. Alternaria redefined. Stud. Mycol. 2013, 75, 171–212. [Google Scholar] [CrossRef]
- Kidd, S.; Halliday, C.; Ellis, D. Aspergillus Micheli Ex Link. In Descriptions of Medical Fungi; Kidd, S., Halliday, C., Ellis, D., Eds.; Springer: Adelaide, Australia, 2022; pp. 20–34. [Google Scholar]
- Jedidi, I.; Soldevilla, C.; Lahouar, A.; Marín, P.; González-Jaén, M.T.; Said, S. Mycoflora isolation and molecular characterization of Aspergillus and Fusarium species in Tunisian cereals. Saudi J. Biol. Sci. 2018, 25, 868–874. [Google Scholar] [CrossRef] [PubMed]
- Zhou, Z.; Song, X.; Song, J.; Huang, G.; Wang, X.; Liang, K.; Yang, G.; Zhang, Q. A Biophysical Method for Inducing Incense Formation in Earth Aquilaria Trees and Its Application. C.N. Patent CN201910608768, 31 August 2021. [Google Scholar]
- Zhang, P.; Li, X.; Cui, Z.; Xu, D. Morphological, physiological, biochemical and molecular analyses reveal wounding-induced agarwood formation mechanism in two types of Aquilaria sinensis (Lour.) Spreng. Ind. Crops Prod. 2022, 178, 114603. [Google Scholar] [CrossRef]
- Castillo-Argaez, R.; Vazquez, A.; Konkol, J.L.; Vargas, A.I.; Ploetz, R.C.; Etxeberria, E.; Schaffer, B. Sap flow, xylem anatomy and photosynthetic variables of three Persea species in response to laurel wilt. Tree Physiol. 2021, 41, 1004–1018. [Google Scholar] [CrossRef] [PubMed]
- Cui, Z.; Li, X.; Xu, D.; Yang, Z.; Zhang, N.; Liu, X.; Hong, Z. Physiological changes during heartwood formation induced by plant growth regulators in Dalbergia odorifera (Leguminosae). IAWA J. 2021, 42, 217–234. [Google Scholar] [CrossRef]
- Lin, L.; Guo, D.; Huang, J.; Zhang, X.; Zhang, L.; Wei, C. Molecular structure and enzymatic hydrolysis properties of starches from high-amylose maize inbred lines and their hybrids. Food Hydrocolloid. 2016, 58, 246–254. [Google Scholar] [CrossRef]
- LY/T 2904-2017; Standardization Administration of the People’s Republic of China. Chinese Standard of Forestry, Agarwood; Standards press of China: Beijing, China, 2017.
- Mahajan, M.; Kuiry, R.; Pal, P.K. Understanding the consequence of environmental stress for accumulation of secondary metabolites in medicinal and aromatic plants. J. Appl. Res. Med. Aromat. Plants 2020, 18, 100255. [Google Scholar] [CrossRef]
- Thakur, M.; Bhattacharya, S.; Khosla, P.; Puri, S.K. Improving production of plant secondary metabolites through biotic and abiotic elicitation. J. Appl. Res. Med. Aromat. Plants 2019, 12, 1–12. [Google Scholar] [CrossRef]
- Zhan, X.; Chen, Z.; Chen, R.; Shen, C. Environmental and Genetic Factors Involved in Plant Protection-Associated Secondary Metabolite Biosynthesis Pathways. Front. Plant Sci. 2022, 13, 877304. [Google Scholar] [CrossRef]
- Ahmed, E.; Arshad, M.N.; Khan, M.Z.; Amjad, M.; Sadaf, H.M.; Riaz, I.; Sabir, S.; Ahmad, N.; Sabaoon. Secondary metabolites and their multidimensional prospective in plant life. J. Pharmacogn. Phytochem. 2017, 6, 205–214. [Google Scholar]
- Ashraf, M.A.; Iqbal, M.; Rasheed, R.; Hussain, I.; Riaz, M.; Arif, M.S. Environmental Stress and Secondary Metabolites in Plants: An Overview. In Plant Metabolites and Regulation under Environmental Stress; Parvaiz, A., Ahanger, M.A., Singh, V.P., Eds.; Academic Press: Cambridge, MA, USA, 2018; pp. 153–167. [Google Scholar]
- Verma, N.; Shukla, S.K. Impact of various factors responsible for fluctuation in plant secondary metabolites. J. Appl. Res. Med. Aromat. Plants 2015, 2, 105–113. [Google Scholar] [CrossRef]
- Araya-Cloutier, C.; den Besten, H.M.W.; Aisyah, S.; Gruppen, H.; Vincken, J.P. The position of prenylation of isoflavonoids and stilbenoids from legumes (Fabaceae) modulates the antimicrobial activity against Gram positive pathogens. Food Chem. 2017, 226, 193–201. [Google Scholar] [CrossRef] [PubMed]
- Moola, A.K.; Diana, R.K.B. Elicitation as a means for enhanced plant secondary metabolites through hairy root system. Adv. Sci. Res. 2019, 10, 6–12. [Google Scholar]
- Anderson, C.T.; Kieber, J.J. Dynamic construction, perception, and remodeling of plant cell walls. Annu. Rev. Plant Biol. 2020, 71, 39–69. [Google Scholar] [CrossRef] [PubMed]
- Wan, J.; He, M.; Hou, Q.; Zou, L.; Yang, Y.; Wei, Y.; Chen, X. Cell wall associated immunity in plants. Stress Biol. 2021, 1, 3. [Google Scholar] [CrossRef] [PubMed]
- Ninkuu, V.; Yan, J.; Fu, Z.; Yang, T.; Ziemah, J.; Ullrich, M.S.; Kuhnert, N.; Zeng, H. Lignin and Its Pathway-Associated Phytoalexins Modulate Plant Defense against Fungi. J. Fungi 2023, 9, 52. [Google Scholar] [CrossRef] [PubMed]
- Perincherry, L.; Urbaniak, M.; Pawłowicz, I.; Kotowska, K.; Waśkiewicz, A.; Stępień, Ł. Dynamics of Fusarium Mycotoxins and Lytic Enzymes during Pea Plants’ Infection. Int. J. Mol. Sci. 2021, 22, 9888. [Google Scholar] [CrossRef]
- Chaudhary, P.; Agri, U.; Chaudhary, A.; Kumar, A.; Kumar, G. Endophytes and their potential in biotic stress management and crop production. Front. Microbiol. 2022, 13, 933017. [Google Scholar] [CrossRef] [PubMed]
- Miliute, I.; Buzaite, O.; Baniulis, D.; Stanys, V. Bacterial endophytes in agricultural crops and their role in stress tolerance: A review. Zemdirbyste 2015, 102, 465–478. [Google Scholar] [CrossRef]
- Ngadiran, S.; Baba, S.; Nor, N.F.A.; Yahayu, M.; Muhamad, M.F.; Kushairi, A.K.A.; Zaidel, D.N.A.; Muhamad, I.I. The induction techniques of resinous agarwood formation: A review. Bioresour. Technol. Rep. 2023, 21, 101337. [Google Scholar] [CrossRef]
- Du, T.Y.; Dao, C.J.; Mapook, A.; Stephenson, S.L.; Elgorban, A.M.; Al-Rejaie, S.; Suwannarach, N.; Karunarathna, S.C.; Tibpromma, S. Diversity and biosynthetic activities of agarwood associated fungi. Diversity 2022, 14, 211. [Google Scholar] [CrossRef]
- Liu, T.; Liu, Y.; Fu, Y.; Qiao, M.; Wei, P.; Liu, Z.; Li, Y. Structural, defense enzyme activity and chemical composition changes in the xylem of Aquilaria sinensis during fungus induction. Ind. Crops Prod. 2024, 208, 117804. [Google Scholar] [CrossRef]
- Cui, Z.; Li, X.; Xu, D.; Yang, Z. Changes in non-structural carbohydrates, wood properties and essential oil during chemically-induced heartwood formation in Dalbergia odorifera. Front. Plant Sci. 2020, 11, 1161. [Google Scholar] [CrossRef] [PubMed]
- Liu, P.; Zhang, X.; Yang, Y.; Sui, C.; Xu, Y.; Wei, J. Interxylary phloem and xylem rays are the structural foundation of agarwood resin formation in the stems of Aquilaria sinensis. Trees 2019, 33, 533–542. [Google Scholar] [CrossRef]
- Hartmann, H.; Trumbore, S. Understanding the roles of nonstructural carbohydrates in forest trees–from what we can measure to what we want to know. New Phytol. 2016, 211, 386–403. [Google Scholar] [CrossRef] [PubMed]
- Tripathi, S.N.; Sahney, M.; Tripathi, A.; Pandey, P.; Jatav, H.S.; Minkina, T.; Rajput, V.D. Elucidating the anatomical features, adaptive and ecological significance of Kopsia fruticosa Roxb.(Apocynaceae). Horticulturae 2023, 9, 387. [Google Scholar] [CrossRef]
- Wang, Y.; Hussain, M.; Jiang, Z.; Wang, Z.; Gao, J.; Ye, F.; Mao, R.; Li, H. Aquilaria species (Thymelaeaceae) distribution, volatile and non-volatile phytochemicals, pharmacological uses, agarwood grading system, and induction methods. Molecules 2021, 26, 7708. [Google Scholar] [CrossRef] [PubMed]
- Liu, Y.Y.; Wei, J.H.; Gao, Z.H.; Zhang, Z.; Lyu, J.C. A review of quality assessment and grading for agarwood. Chin. Herb. Med. 2017, 9, 22–30. [Google Scholar] [CrossRef]
- Mohamed, R.; Lee, S.Y. Keeping up appearances: Agarwood grades and quality. In Agarwood: Science behind the Fragrance; Mohamed, R., Ed.; Springer: Berlin/Heidelberg, Germany, 2016; pp. 149–167. [Google Scholar]
- Wangiyana, I.G.A.S. Medicinal Usage of Agarwood Resin in Form of Essential Oil: A Review. J. Silva Samalas 2019, 2, 86–90. [Google Scholar]
- Justin, S.; Lihan, S.; Elvis-Sulang, M.; Chiew, T. Formulated microbial consortium as inoculant for agarwood induction. J. Trop. For. Sci. 2020, 32, 161–169. [Google Scholar] [CrossRef]
- Turjaman, M.; Hidayat, A.; Santoso, E. Development of agarwood induction technology using endophytic fungi. In Agarwood: Science Behind the Fragrance; Mohamed, R., Ed.; Springer: Singapore, 2016; pp. 57–71. [Google Scholar]
- Ramli, A.N.M.; Yusof, S.; Bhuyar, P.; Aminan, A.W.; Tajuddin, S.N. Fungi mediated agarwood (A. malaccensis) production and their pharmaceutical applications: A systematic review. Int. J. Plant Based Pharm. 2022, 2, 261–270. [Google Scholar]
- Faizal, A.; Hermawaty, D.; Junita, E.; Rahmawati, A.; Azar, A.W.P.; Makajanma, M.M.; Turjaman, M. Evaluation of biotic and abiotic stressors to artificially induce agarwood production in Gyrinops versteegii (Gilg.) Domke seedlings. Symbiosis 2022, 86, 229–239. [Google Scholar] [CrossRef]
- Ismail, N.; Rahiman, M.H.F.; Taib, M.N.; Ibrahim, M.; Zareen, S.; Tajuddin, S.N. A review on agarwood and its quality determination. In Proceedings of the 2015 IEEE 6th Control and System Graduate Research Colloquium (ICSGRC), Shah Alam, Malaysia, 10–11 August 2015; pp. 103–108. [Google Scholar]
- Chen, S.T.; Rao, Y.K. An overview of agarwood, phytochemical constituents, pharmacological activities, and analyses. Tradit. Med. 2022, 3, 1–71. [Google Scholar] [CrossRef]
- Li, W.; Chen, H.Q.; Wang, H.; Mei, W.L.; Dai, H.F. Natural products in agarwood and Aquilaria plants: Chemistry, biological activities and biosynthesis. Nat. Prod. Rep. 2021, 38, 528–565. [Google Scholar] [CrossRef] [PubMed]
- Yu, M.; He, Q.Q.; Chen, X.Q.; Feng, J.; Wie, J.H.; Liu, Y.Y. Chemical and Bioactivity Diversity of 2-(2-Phenylethyl) chromones in Agarwood: A Review. Chem. Biodivers. 2022, 19, e202200490. [Google Scholar] [CrossRef] [PubMed]
- Wang, S.; Yu, Z.; Wang, C.; Wu, C.; Guo, P.; Wei, J. Chemical constituents and pharmacological activity of agarwood and Aquilaria plants. Molecules 2018, 23, 342. [Google Scholar] [CrossRef]
- Kalra, R.; Kaushik, N. A review of chemistry, quality and analysis of infected agarwood tree (Aquilaria sp.). Phytochem. Rev. 2017, 16, 1045–1079. [Google Scholar] [CrossRef]
Figure 1.
Histochemical changes in resin formation and distribution were examined in Aquilaria sinensis trees. (a–c) D1 treatment, (d–f) D2 treatment, (g–i) F1 treatment, (j–l) F2 treatment, and (m–o) CK treatment. (a,d,g,j,m) At one month of injury induction, (b,e,h,k,n) at three months of injury induction, and (c,f,i,l,o) at six months of injury induction. Black arrows point to grease. The black arrows in the figure indicate agarwood resin. Scale bars = (a,f,g,j,n) 100 μm; (b–e,h,i,k,l,m,o) 200 μm.


Figure 2.
Color development of starch granules in xylem parenchyma cells of Aquilaria sinensis. (a–c) D1 treatment, (d–f) D2 treatment, (g–i) F1 treatment, (j–l) F2 treatment, and (m–o) CK treatment. (a,d,g,j,m) At one month of injury induction, (b,e,h,k,n) at three months of injury induction, and (c,f,i,l,o) at six months of injury induction. All scale bars = 200 μm.

Figure 3.
Color development of non-starch polysaccharide in xylem parenchymal cells of Aquilaria sinensis. (a–c) D1 treatment, (d–f) D2 treatment, (g–i) F1 treatment, (j–l) F2 treatment, and (m–o) CK treatment. (a,d,g,j,m) At one month of injury induction, (b,e,h,k,n) at three months of injury induction, and (c,f,i,l,o) at six months of injury induction. All scale bars = 200 μm.


Figure 4.
Histochemical changes in the formation and distribution of wounding-induced agarwood resin of Aquilaria sinensis. (a–d) D1 treatment, (e–h) D2 treatment, and (i–l) CK treatment. (a,e,i) At one month of injury induction, (b,f,j) at three months of injury induction, and (c,d,g,h,k,l) at six months of injury induction. (b–d,f,g) Cross-section of agarwood. (a,e) Diameter cross-section of agarwood. C crystal, IP interxylary phloem, PF phloem fiber, PR phloem ray, S starch grain, V vessel, XR xylem ray. Scale bar = (b) 10 µm, (c,e,f) 20 µm, (g,i–l) 50 µm, (d,h) 100 µm.

Figure 5.
Effect of wounding stress on the non-structural carbohydrates in two types of Aquilaria sinensis. (A) Changes in starch content during the formation of agarwood resin. (B) Changes in the content of non-starch polysaccharides during the formation of agarwood resin. The data presented below are expressed as the mean ± standard error (SE). All data presented herein are expressed as mean ± SE. (“ns” indicates not significant, * indicates a statistically significant difference, * p < 0.05, ** p < 0.01, *** p < 0.001, **** p < 0.0001, and ns is no significant, one-way ANOVA).

Figure 6.
Effect of wounding stress on the agarwood oil content of Aquilaria sinensis. All data presented herein are expressed as mean ± SE. (“ns” indicates not significant, * indicates a statistically significant difference, * p < 0.05, ** p < 0.01 and *** p < 0.001, **** p < 0.0001, one-way ANOVA).

Figure 7.
GC-MS analysis of agarwood produced by different damage treatments. (A) GC-MS base peak ion chromatograms of the agarwood essential oils from different treatments. (B) Heatmap of compounds in agarwood samples by GC-MS.
Figure 7.
GC-MS analysis of agarwood produced by different damage treatments. (A) GC-MS base peak ion chromatograms of the agarwood essential oils from different treatments. (B) Heatmap of compounds in agarwood samples by GC-MS.

Figure 8.
GC-MS analysis of artificial agarwood induced by different techniques.

Table 1.
Experimental design and materials used in this study.
| Sample Code | Treatment Method | Collection Time/Month | Number of Trees |
|---|---|---|---|
| D1 | drilling and agar-fungal A | 1, 3, 6, 9 | N = 3 |
| D2 | drilling and agar-fungal B | 1, 3, 6, 9 | N = 3 |
| F1 | burning and agar-fungal A | 1, 3, 6, 9 | N = 3 |
| F2 | burning and agar-fungal B | 1, 3, 6, 9 | N = 3 |
| CK | drilling | 1, 3, 6, 9 | N = 3 |
Notes: agar-fungal A was composed of Trichoderma solani and Lasiodiplodia theobromae in a 1:1 volume ratio. agar-fungal B was composed of Fusarium solani and Lasiodiplodia theobromae in a 1:1 volume ratio.
Table 2.
Range of discoloration of agarwood resin after damage treatment.
| Treatment | Discoloration Range | |||||
|---|---|---|---|---|---|---|
| Discoloration Length between Holes (cm) | Discoloration Width (cm) | |||||
| Third Months | Sixth Months | Ninth Months | Third Months | Sixth Months | Ninth Months | |
| D1 | 1.07 ± 0.21 c | 2.30 ± 0.10 c | 3.30 ± 5.2 c | 1.13 ± 2.3 b | 2.13 ± 0.06 c | 2.17 ± 0.06 c |
| D2 | 1.43 ± 0.31 c | 2.27 ± 0.15 c | 3.33 ± 6.0 c | 2.03 ± 6.5 a | 2.03 ± 0.06 c | 2.07 ± 0.06 c |
| F1 | 2.60 ± 0.26 b | 3.50 ± 0.26 b | 4.60 ± 6.3 b | 1.43 ± 1.3 b | 3.13 ± 0.15 b | 3.37 ± 0.12 b |
| F2 | 4.53 ± 0.29 a | 5.70 ± 0.20 a | 10.70 ± 0.46 a | 2.07 ± 0.06 a | 4.43 ± 0.21 a | 5.43 ± 0.61 a |
| CK | 0.27 ± 0.06 e | 0.53 ± 0.06 d | 0.63 ± 0.12 d | 0.17 ± 0.06 c | 0.47 ± 0.06 d | 0.47 ± 0.12 d |
Notes: Mean ± standard deviation (n = 3), which were analyzed using one-way ANOVA with the least significant difference test. Different lower-case letters in the same column indicate significant differences (p < 0.05) between the ranges of discoloration of different agarwood inductions.
Disclaimer/Publisher’s Note: The statements, opinions and data contained in all publications are solely those of the individual author(s) and contributor(s) and not of MDPI and/or the editor(s). MDPI and/or the editor(s) disclaim responsibility for any injury to people or property resulting from any ideas, methods, instructions or products referred to in the content. |
© 2024 by the authors. Licensee MDPI, Basel, Switzerland. This article is an open access article distributed under the terms and conditions of the Creative Commons Attribution (CC BY) license (https://creativecommons.org/licenses/by/4.0/).
Share and Cite
MDPI and ACS Style
Zhao, W.; Song, X.; Zhou, Z.; Liu, G.; Zhang, Q.; Pang, S. Effects of Different Levels of Physical Damage Combined with Fungal Induction on Agarwood Formation. Forests 2024, 15, 168. https://doi.org/10.3390/f15010168
AMA Style
Zhao W, Song X, Zhou Z, Liu G, Zhang Q, Pang S. Effects of Different Levels of Physical Damage Combined with Fungal Induction on Agarwood Formation. Forests. 2024; 15(1):168. https://doi.org/10.3390/f15010168
Chicago/Turabian StyleZhao, Weiwei, Xiaochen Song, Zaizhi Zhou, Gaofeng Liu, Qingqing Zhang, and Shengjiang Pang. 2024. "Effects of Different Levels of Physical Damage Combined with Fungal Induction on Agarwood Formation" Forests 15, no. 1: 168. https://doi.org/10.3390/f15010168
Note that from the first issue of 2016, this journal uses article numbers instead of page numbers. See further details here.