
Impact of Climate Change on the Habitat Suitability of Monochamus saltuarius Gebler (Coleoptera; Cerambycidae) and Its Natural Enemies in China

1
College of Forestry, Shenyang Agricultural University, Shenyang 110866, China
2
Key Laboratory of Beijing for the Control of Forest Pests, College of Forestry, Beijing Forestry University, Beijing 100083, China
*
Author to whom correspondence should be addressed.
Forests 2024, 15(1), 33; https://doi.org/10.3390/f15010033
Submission received: 14 November 2023
/
Revised: 13 December 2023
/
Accepted: 21 December 2023
/
Published: 22 December 2023
(This article belongs to the Special Issue Advances in Wood-Boring Insects Control and Management)
Abstract
:The longicorn beetle Monochamus saltuarius (Coleoptera; Cerambycidae) is an insect vector that transmits the pine wood nematode Bursaphelenchus xylophilus, a serious issue in pine forests in China, Japan, and South Korea. Dastarcus helophoroides and Scleroderma guani are effective in controlling M. saltuarius. However, the application of these parasites for the direct control of vector insects requires detailed analyses of the suitability of the selected natural enemies in potential pest areas, particularly under climate change. Based on species distribution records as well as the current and projected climate change trends up to 2050, we utilized an optimized Maxent algorithm to predict the potential distribution patterns of M. saltuarius and its natural enemies in China. Furthermore, we estimated Schoener’s D to quantify the overlap in adaptability between M. saltuarius and its natural enemies. The potentially suitable areas predicted under the current climate conditions were concentrated mainly in northeast and north China. Additional suitable areas were detected in central, eastern, northwestern, and southwestern China. Under future climate conditions, the suitable range of M. saltuarius gradually shifted southward, with a tendency to expand into high-altitude and colder regions, such as Sichuan, Qinghai, and Tibet. The potential distribution of the natural enemies D. helophoroides and S. guani continued to expand under climate change. A comparison of the appropriate habitats of M. saltuarius and natural enemy insects indicated that D. helophoroides is more suitable for initial biological control in north, northeast, and central China as well as certain northwest and coastal regions. S. guani could be prioritized for nationwide release, while joint control using both species may be effective in Liaoning, Hebei, and Tianjin provinces. These analyses demonstrate that future climate change is likely to exert adverse effects on the potential distribution of M. saltuarius but is favorable for the potential distributions of natural enemies. This study offers important insights into the effective control of M. saltuarius and provides an experimental basis for the utilization of natural enemies according to the characteristics of different regions.
1. Introduction
The longicorn beetle Monochamus saltuarius Gebler (Coleoptera; Cerambycidae) is a type of wood-boring pest [1,2]. As a kind of native longicorn beetle on the Eurasian continent, it has two subspecies, including the nominal subspecies Monochamus saltuarius saltuarius (Gebler, 1830) and the western subspecies Monochamus saltuarius occidentalis (Sláma, 2017). In this study, M. saltuarius, a native subspecies in China, is referred to as Monochamus saltuarius saltuarius (Gebler, 1830). The current literature records of this subspecies in China are mainly distributed in northeast China (Liaoning, Jilin, Heilongjiang, and Inner Mongolia) [3]. Larvae of the longicorn beetle primarily damage the Abies, Larix, Picea, and Pinus genera belonging to the Pinaceae family [4]. M. saltuarius may harm a wide range of tree species. The longicorn beetle directly harms Pinus tabuliformis, P. koraiensis, and P. densiflora in China, and a few studies have found that P. sylvestris var. mongolica and Larix are also the feeding targets of M. saltuarius, but their feeding behavior is less than that of P. tabulaeformis and P. koraiensis [5,6]. The larvae destroy the xylem and cambium layer of the trunk, causing the trees to weaken and eventually die. Additionally, as a vector of Bursaphelenchus xylophilus Steiner and Buhrer (Aphelenchida; Aphelenchoididae), adult M. saltuarius transmits the pine wood nematode (PWN) to healthy pine trees during feeding and egg laying, leading to pine wilt and eventual death [7,8]. In 2017, the longicorn beetle carrying PWN infected Pinaceae trees in Dongtang town, Fengcheng, Liaoning Province [1]. Pinewood nematode disease (PWD) was first introduced into China in 1983 and has since caused 742 county-level PWD epidemic areas by 2021 [9]. The impact of PWD is significant as the import and export restrictions it causes result in the United States losing approximately USD 150 million and Canada losing USD 700 million annually [10]. M. saltuarius has increased the risk of pine wilt disease in China, posing a significant threat to forest resources and ecological security [11,12,13,14].
Dastarcus helophoroides Fairmaire, a species of beetle belonging to the Bothrideridae family Coleoptera genus, is widely used as a natural parasitic enemy in China for biological control of longicorn beetles [15]. Another native Chinese insect, Scleroderma guani Xiao and Wu from the Bethylidae family Hymenoptera genus, has also shown significant progress in parasitizing and controlling M. saltuarius [16]. Theoretically, for large-scale biological control, it is necessary to evaluate the survival of relevant natural enemy insects in pest-infested areas, providing a basis for the release of relevant species in batches in different suitable areas. Recent evidence suggests that D. helophoroides primarily parasitizes pupae and larvae of M. saltuarius, with a higher rate of parasitism in pupae than in larvae. S. guani predominantly parasitizes larvae of this longicorn beetle [16,17]. In northeast China, the initial control effects of D. helophoroides and S. guani on M. saltuarius have been confirmed [16,17]. However, it is currently unclear whether the two natural enemies mentioned are effective in all regions. It is important to evaluate which natural enemy insect is best suited based on the harmful characteristics of pests and the climatic conditions present in various regions.
Global climate change is one of the most significant challenges faced by human beings at present, and the environmental and ecological issues resulting from climate change have become a primary focus of research in numerous countries [18,19]. Pests have strong adaptability to the environment and respond quickly to environmental changes. Climate change will alter the location, timing, and scale of pest outbreaks, thereby increasing the survival rate and number of pest generations. This will undoubtedly increase the risk of biological invasion and the spread of pests and diseases, consequently altering the dynamics of “plant–pest–natural enemy” interactions [20].
Ecological niche models (ENMs) estimate a species’ niche using a specific algorithm that combines species distribution data and relevant environmental variables. They reflect the habitat preference of a species in the form of a probability. The results are often expressed in terms of potential suitable areas for species and habitat suitability [21,22]. ENMs are a type of correlation model that do not aim to explain the biological changes in species resulting from genetic and environmental factors [23]. Therefore, the suitability of different species in various environments can be determined for a particular area. It is possible to predict the potential distribution of species and identify the main environmental variables that contribute to this distribution [24]. The maximum entropy model (Maxent) is a niche model. Maxent considers species and environmental conditions as a closed system. The stable relationship between species and the environment is determined by calculating state parameters when the system has the maximum entropy, enabling the estimation of species distributions and habitat suitability [25,26]. In the context of alien biological invasion and global climate change, species distribution modeling is an effective approach to simulate potential distributions [27]. Using Maxent to predict species distributions and extrapolate across time or spaces, predicted species distributions fall between the potential and real distributions [28].
In this study, we collected observation data and used a Maxent approach to predict the potential distribution area of M. saltuarius and its natural enemies in China under a climate change scenario and measured the degree of overlap between these longicorn beetles and their natural enemies. The key study aims were as follows: (1) To determine the potential suitable range of M. saltuarius in China under current and future climate scenarios; (2) To identify the potential suitable range of D. helophoroides and S. guani in China under current and future climate scenarios; (3) To provide recommendations for selecting the most suitable natural enemy in various regions based on differences in adaptability between longicorn beetles and natural enemies of pests. The impact of climate change on the species distribution was analyzed, providing a reference for the early warning and control of this longicorn beetle. To improve the theoretical system related to the biological control of PWN vector insects, we provide suggestions for the control of the specific natural enemy of the longicorn beetle in China under current climate conditions from the perspective of regional habitat suitability.
2. Materials and Methods
2.1. Species Location Data
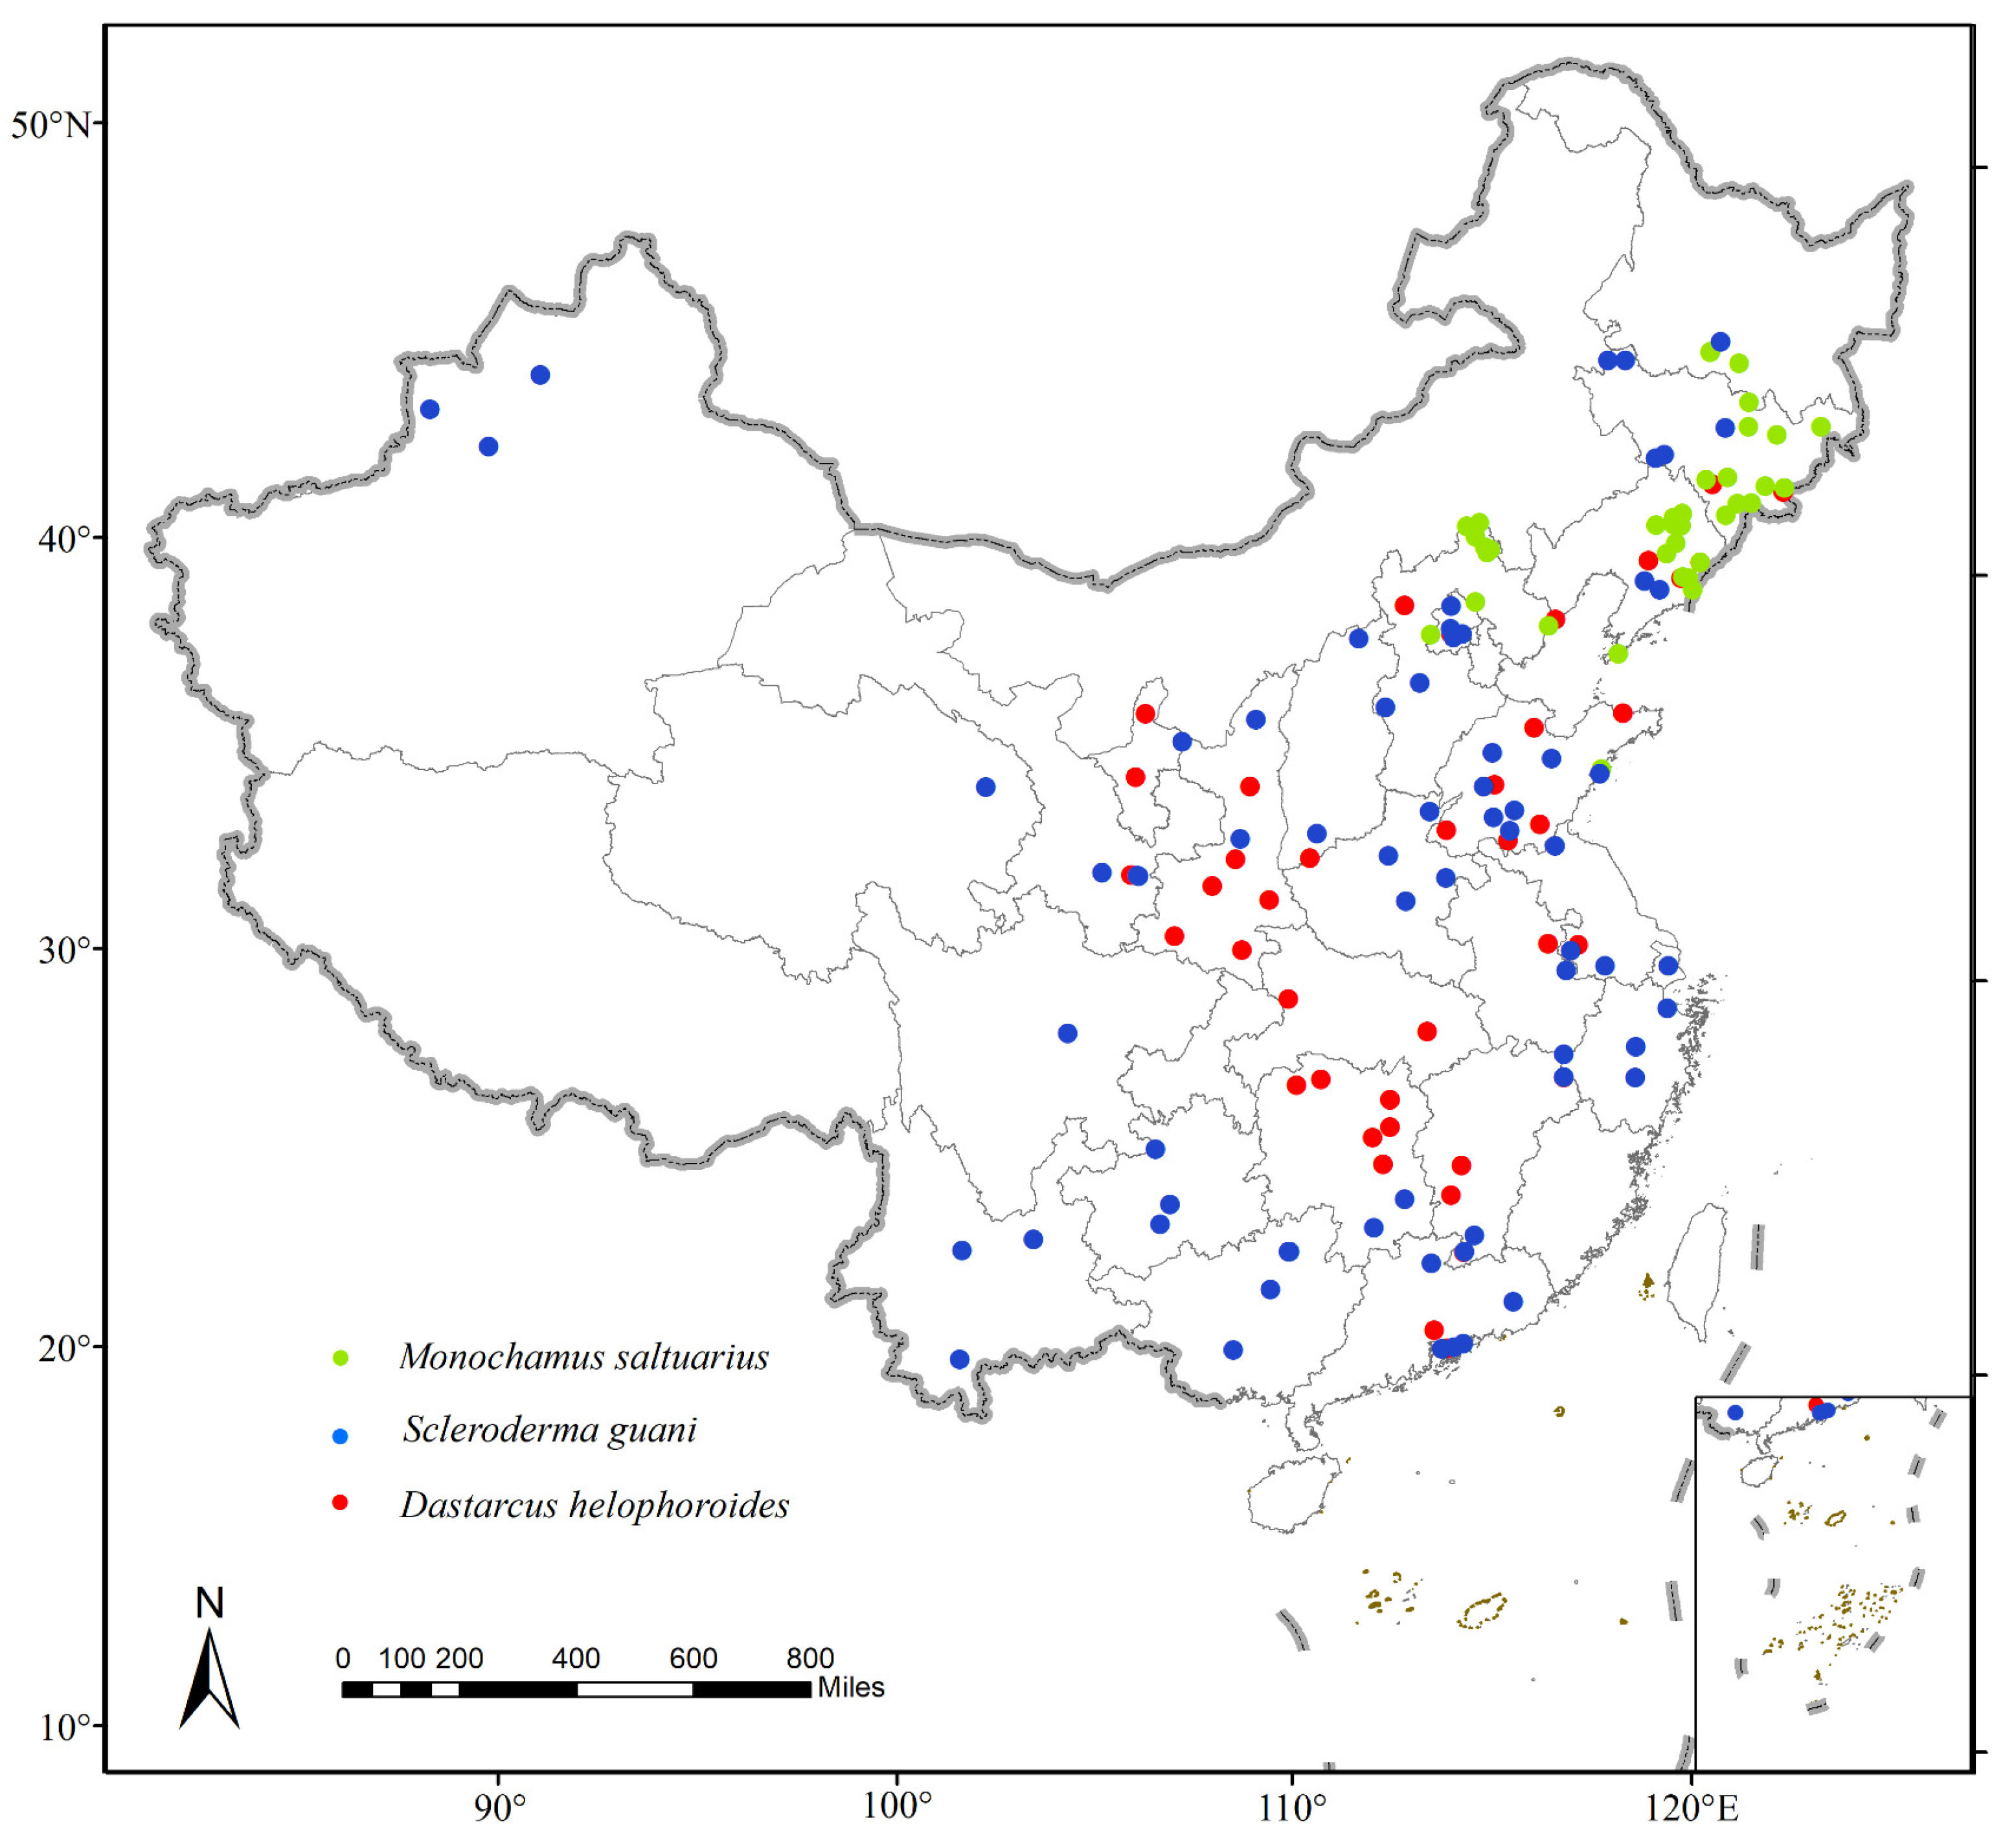
Observation data for M. saltuarius, D. helophoroides, and S. guani were collected using three methods. First, literature searches against both the China National Knowledge Infrastructure (CNKI, https://www.cnki.net/, accessed on 16 October 2022) and Web of Science (WOS, https://www.webofscience.com/wos, accessed on 13 December 2022) were conducted using the scientific name of each species as the keyword. The records obtained in the search contained information on the distribution of the target species. Second, precise pest occurrence records were obtained through a field survey conducted in Shenyang and Fushun, Liaoning Province. Longhorn beetles were sampled from wood in Fushun Dahuofang Forest Farm during the PWN epidemic in November 2021. Trapping observations were conducted in Shenyang Dongling Park from March to April 2022. Third, distribution data were collected through websites that record species occurrences, such as the Global Biodiversity Information Facility (GBIF, https://www.gbif.org, accessed on 23 December 2022; M. saltuarius: https://doi.org/10.15468/dl.54g7jc, downloaded 19 April 2023; and D. helophoroides: https://doi.org/10.15468/dl.dt8rfu, download 20 February 2023), the Centre for Agriculture and Bioscience International (CABI, https://www.cabidigitallibrary.org, accessed on 15 March 2023), the National Specimen Information Infrastructure (NSII, http://www.nsii.org.cn/2017/home-en.php, accessed on 15 March 2023), and MapBio (http://map.especies.cn, accessed on 15 March 2023). For some locations lacking specified latitude and longitude coordinates, Earth Online (https://www.earthol.com/, accessed on 30 June 2023) was used to obtain this information. In total, 44 distribution points were obtained for M. saltuarius, 48 for D. helophoroides, and 71 for S. guani. After obtaining the current distribution data for the target species, duplicate data were removed, errors in species classification were corrected, and recording errors in the location data were resolved. This allowed us to mitigate the impact of spatial autocorrelation and sampling deviation on the final prediction results and ensure that there was only one distribution point in every 10 × 10 km grid. In ArcGIS (version 10.6), all samples were thinned by using average nearest neighbor analyses [29,30]. Finally, 42 points were retained for M. saltuarius, 41 for D. helophoroides, and 68 for S. guani (Figure 1).
2.2. Acquisition and Selection of Bioclimate Variables
The bioclimatic data used in this study were downloaded from WorldClim version 2.1 (https://worldclim.org/, accessed on 17 October 2022). A spatial resolution of 2.5 min (approximately 5 km × 5 km) and current (1970–2000) and future (2021–2040) projections were selected. The future data are based on four types of shared socioeconomic pathways (SSPs) under the climate system model BCC-CSM2-MR, developed by the National Climate Centre of China as part of the Coupled Model Intercomparison Project 6 (CMIP6): SSP1-2.6 (low greenhouse gas emissions), SSP2-4.5 and SSP3-7.0 (medium greenhouse gas emissions), and SSP5-8.5 (high greenhouse gas emissions) [31,32]. Accounting for the impact of social and economic development, CMIP6 has a more complex calculation process and higher resolution than those of other models and is more aligned with future climate change trends [33]. SSPs are also updated based on the original four emission scenarios of CMIP5, integrating the typical concentration pathways and other factors. Among them, SSP1-2.6 represents the low radiation forcing scenario, which is considered the ideal state. The global temperature is expected to rise gradually through 2100. SSP2-4.5 represents a moderately stable scenario. This scenario utilizes the Decadal Climate Prediction Project (DCPP) to make a short-term forecast (to 2030). It also employs the detection and attribution MIP (DAMIP) as an extension of the historical simulation to update the regression-based estimation of the single forcing effect after 2015. This updated estimation is then used as a reference for future single forcing experiments. SSP3-7.0 represents the middle and high-end forced scenario; it is a further enhancement of SSP2-4.5 and a new greenhouse gas emission scenario based on CMIP6. SSP5-8.5 represents a high forcing scenario, which indicates that the global temperature rise will intensify in the future [34].
2.3. Optimization of Maxent Model Parameters
The Maxent model requires simplification of highly correlated variables to achieve reasonable prediction results [35]. Species distribution data and climate variable data were imported into ArcGIS. The sampling tool in the Spatial Analyst Tools of Arc Toolbox was then used to randomly sample climate variables at the occurrence points. The resulting sample data were subsequently imported into SPSS (version 26.0) for a Pearson correlation analysis. A value of r ≥ 0.8 indicated a strong correlation between two variables. Nineteen climate variables from the current climate and the collected species distribution data were input into Maxent (version 3.4.1, https://biodiversityinformatics.amnh.org/open_source/maxent/, accessed on 24 October 2022). The jackknife method was selected to screen the variables and determine the contribution and importance of the current climate variables to the distribution data. Based on the results obtained from jackknife and Pearson correlation analyses as well as ecological characteristics, a particular combination of climate variables was selected for each species.
A large and growing body of literature has shown that using the default coefficients of the Maxent model will result in an increased gap between the area under the curve (AUC) values for the modeling data and the test data as well as an increase in the omission error for different focal species [36]. Furthermore, the Maxent model uses a complex algorithm and the interpretation of prediction results is similarly complex. The complex function itself may result in overfitting during the extrapolation process [37,38]. The complexity of Maxent is mainly reflected in the combination of five feature class parameters (FC) (i.e., linear, quadratic, hinge, product, and threshold) and regularization multipliers (RM) affecting the clustering or fitting degree of the distribution of prediction results [39,40,41,42]. Consequently, when multiple species use the same model method for modeling and prediction, it is necessary to separately optimize the specific parameters of each target species model to reduce omission errors and overfitting. Using the “SDMtune” package (https://consbiol-unibern.github.io/SDMtune/, accessed on 22 May 2023) in R, the model results were optimized separately for each species. Using SDMtune, the selection of the optimal combination of model parameters and implementation of the random combination search algorithm and random forest algorithm are rapid, thereby expediting the optimization process and improving performance [43]. This process mainly adjusts two important parameters, RM and FC, in Maxent. The FC setting encompasses seven combinations: L, LQ, LQP, LQPH, LQPHT, QPH, and QPHT (where L = linear, Q = quadratic, H = hinge, P = product, and T = threshold). The RM setting can be adjusted in the range of 0.1–5 with a step size of 0.1. A minimum of 350 candidate models were amalgamated for each target species to assess the predictive outcomes in a comprehensive manner. The distribution data for each species were divided into a 60% training data set and a 40% test data set. These sets were cross-verified 500 times. The AUC and true skill statistic (TSS), calculated from the receiver operating characteristic (ROC) curve, were used as evaluation indicators. The optimal parameter combination was determined when both values reached their maximum. Finally, the potential distribution of species in different future scenarios was projected based on current predictions.
2.4. Changes in the Potential Distributions of M. saltuarius and Natural Enemies
After optimization of the model parameters, the potential distributions of M. saltuarius, D. helophoroides, and S. guani were obtained. The thresholds for species distribution and nondistribution were determined using the natural breakpoint method in ArcGIS [44]. In the final model, the fitness value of the species ranges from 0 to 1, which we denote as the occurrence probability p. According to the natural breakpoint method, the suitable is p > 0.0150 and the unsuitable is p ≤ 0.0150 for M. saltuarius; the suitable is p > 0.3164 and the unsuitable is p ≤ 0.3164 for D. helophoroides; and the suitable is p > 0.3477 and unsuitable is p ≤ 0.3477 for S. guani. Use the “Distribution changes between binary SDMs” function in the ArcGIS toolbox SDMtoolbox (http://www.sdmtoolbox.org/, accessed on 12 June 2023) to plot the distribution changes in a species from the present to the future [45]. The ratio of future to current distribution changes (N), the proportion of total suitable area in the country (N1), the proportion of increased area (N2), and the proportion of decreased area (N3) in the country were calculated based on the number of rasters with different attributes (increasing, decreasing, and unchanged). The formulae are as follows:
As is the potential distribution area of species in a certain period (current and future climate change scenarios); Ac is the current potential distribution area of species; Ai is the potential area for species to increase in the future; Ad is the potential area of species decreases in the future; and At is the total national land area.
2.5. Calculation of Fitness Overlap between M. saltuarius and Natural Enemies
To compare the adaptability of natural enemies and M. saltuarius, and to determine the most effective biological control method, Schoener’s index (D) was evaluated as an adaptability overlap index (AOI) in various provinces [46]. As shown in Formula (5), the index quantifies the overall difference in grid values between two layers in a specific area.
px,i (py,i) represents the fitness probability value assigned by the ecological niche model to a particular raster i in the ArcGIS potential distribution dataset under the assumption of a uniform distribution based on the probability of existence of the species X (or Y) defined in geospatial terms [47]. The index ranges from 0 to 1. A value of 0 indicates that the fitness distribution differs completely between pests and natural enemies, while a value of 1 indicates that the fitness distributions of pests and natural enemies are completely coincidental [47].
In this study, taking the “M. saltuarius + D. helophoroides” model as an example, we use the original prediction data obtained from the optimization model to divide the suitable overlapping areas of the two according to each province of China and calculate the AOI of each province. The “M. saltuarius + S. guani” model operates in the same way.
3. Results
3.1. Model Optimization Results
We predicted the potential distributions of M. saltuarius, D. helophoroides, and S. guani, indicating the suitability of these target species within a limited range under predetermined environmental conditions. Model parameters for M. saltuarius included Bio1, Bio7, Bio8, Bio18, and Bio19. The parameters for D. helophoroides were Bio1, Bio2, Bio4, Bio5, Bio16, Bio18, and Bio19. The parameters for S. guani included Bio2, Bio4, Bio8, Bio10, Bio15, Bio17, Bio18, and Bio19 (Table 1). The model optimization results are shown in Table 2. The AUC and TSS values for the three species were close to 1.
3.2. Projected Changes in Species Distributions
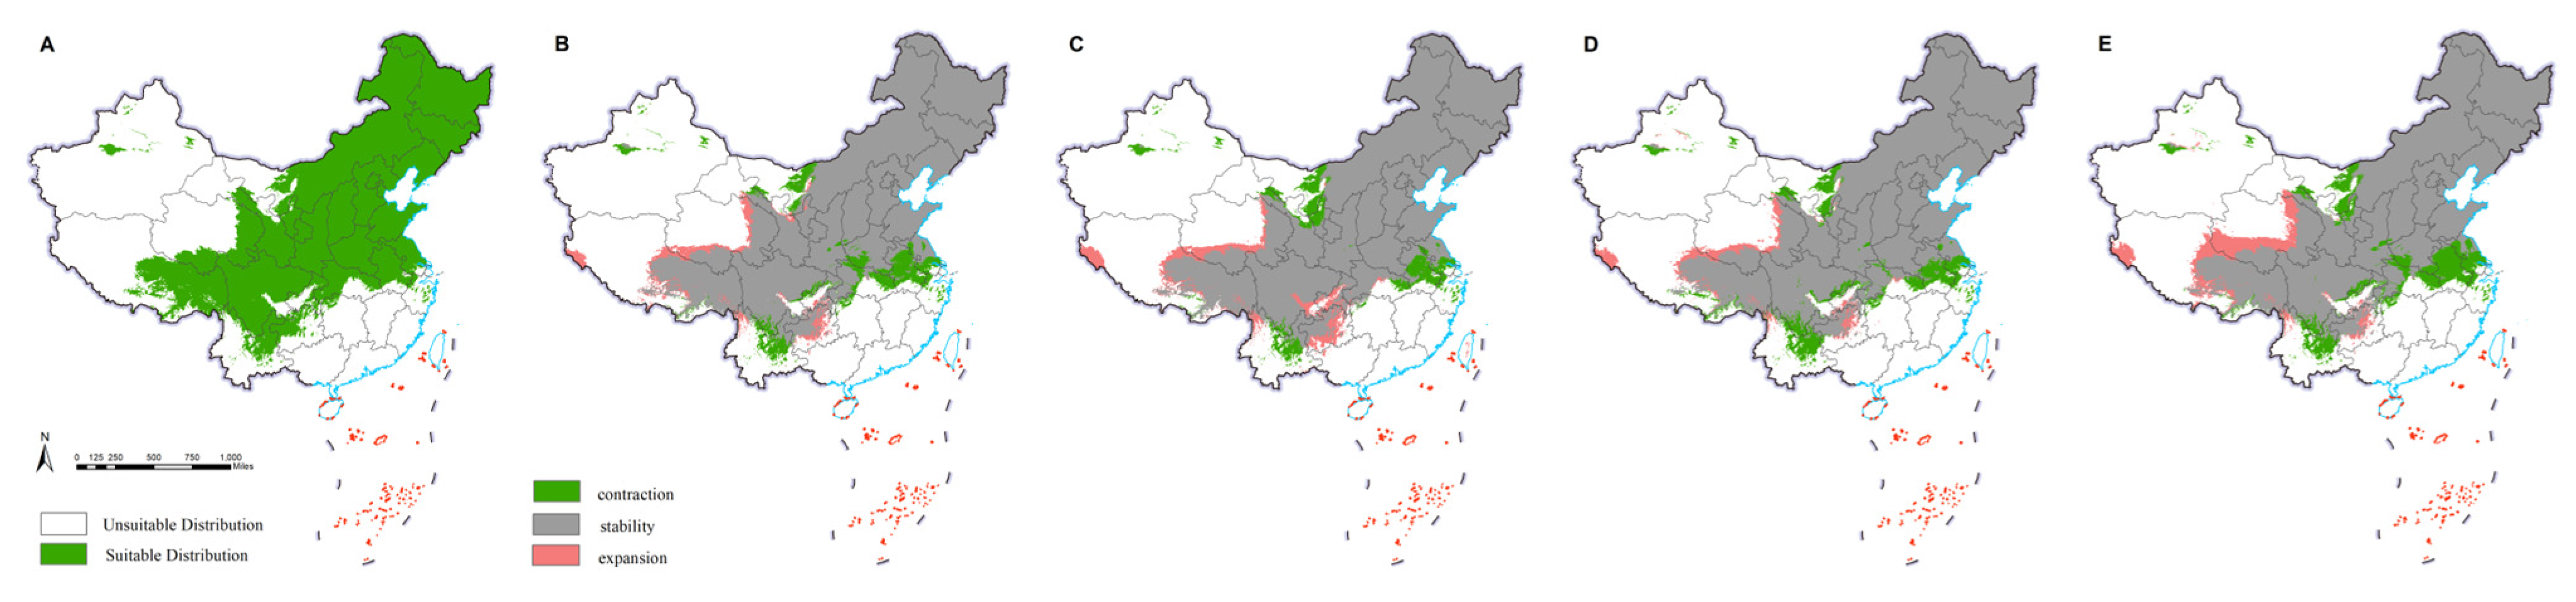
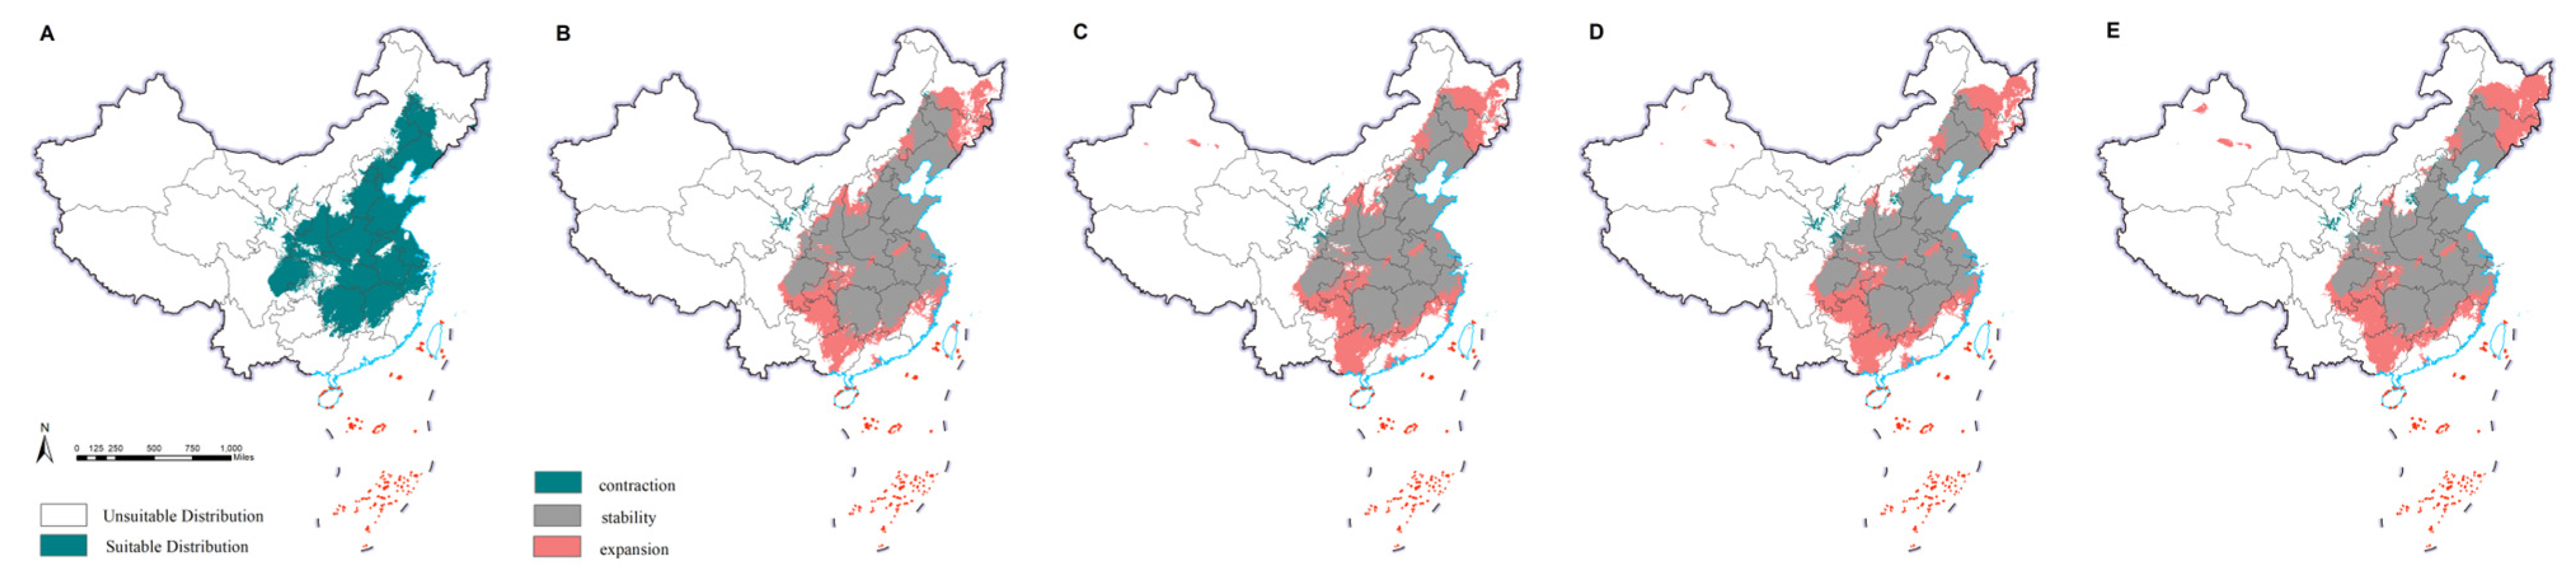
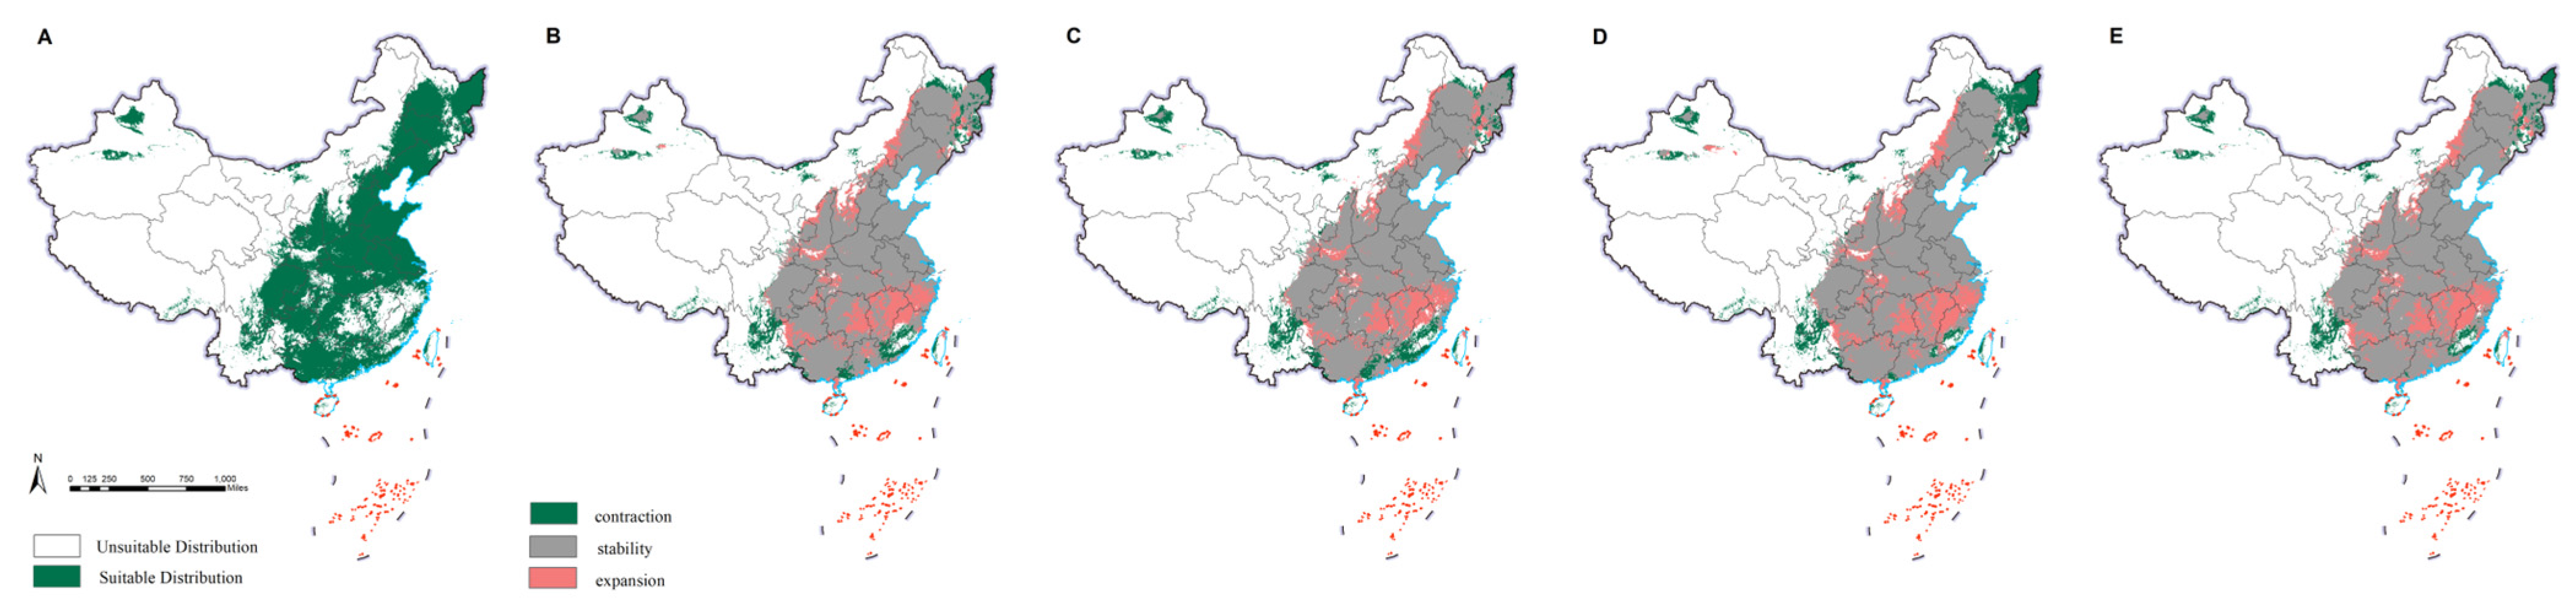
The current potential distribution of M. saltuarius was mainly in northeast China, north China, and parts of central, east, northwest, and southwest China. This included Heilongjiang, Jilin, Liaoning, Inner Mongolia, Beijing, Tianjin, Hebei, Henan, Shandong, Jiangsu, Shanghai, Zhejiang, Anhui, Hubei, Shaanxi, Shanxi, Ningxia, Gansu, Qinghai, Xinjiang, Sichuan, Chongqing, Tibet, Guizhou, and Yunnan. The observed distribution included 25 provinces (cities and autonomous regions) (Figure 2). Under future climate conditions, the overall distribution was predicted to shrink, except in Qinghai, Tibet, Sichuan, Chongqing, Guizhou, and Yunnan, where it was predicted to expand. The final prediction results for D. helophoroides (Figure 3) indicated that the main provinces in the current potential distribution are Heilongjiang, Jilin, Liaoning, Beijing, Tianjin, Hebei, Shaanxi, Shanxi, Ningxia, Sichuan, Henan, Shandong, Hubei, Hunan, Jiangsu, Shanghai, and Zhejiang, among others. We detected a trend toward diffusion in the future. Except for the contraction in distribution in Ningxia and Gansu, suitable areas in the remaining provinces were expanding. The prediction results for S. guani (Figure 4) showed that the current potential distribution is spread across all provinces except Qinghai Province, Hainan Province, and Taiwan. The distribution of S. guani in China covered a wide range of latitudes and longitudes. Diffusion is expected in the future.
According to the grid area calculation using ArcGIS (Table 3), the area change ratio of M. saltuarius under the four emission scenarios was less than 1 but greater than 0.9, indicating a nonsignificant contraction. The area change ratio of D. helophoroides was 1–1.5, suggesting a significant expansion in the future. The area change range of S. guani was 1–1.1, indicating a slight expansion in the future.
3.3. Quantitative Analysis of Species Overlap under Current Climate Change
Table 4 shows the AOI values for M. saltuarius and its natural enemies. The provinces with a high degree of overlap (>0.9) were Beijing, Tianjin, Shanghai, Liaoning, Hunan, and Ningxia. In addition to Shaanxi, Shanxi, Ningxia, and Anhui provinces, in the provinces where all three species were distributed, the degree of fitness overlap was highest for “M. saltuarius + D. helophoroides”. Overall, the provinces covered by S. guani were more extensive than those covered by D. helophoroides. However, the degree of overlap in fitness in the provinces covered by D. helophoroides was relatively high.
4. Discussion
4.1. Model Prediction Reliability
The actual distributions of the target species were included within the potential distribution, indicating that the model is relatively reliable and that the predicted range can serve as a reference for the actual species distribution [48,49]. Similarly, Estay et al. accurately predicted the distribution of Monochamus in Chile [50]. When extrapolating the prediction results for M. saltuarius to Asia, the species was primarily distributed in Japan, South Korea, North Korea, and the northeastern, northern, central, and eastern regions of China. Deng et al. predicted the main distribution of S. guani in China [51]. The predicted distribution of S. guani in this study aligned with the medium and high fitness areas predicted by Deng et al. [51]. The predicted results of this experiment indicate that, under different future climate emission scenarios, the outcomes are similar for S. guani. We believe that the short-term climate change trend caused by greenhouse gas emissions is insufficient to cause a significant migration of insects from their native habitat. The main differences between the distribution of D. helophoroides predicted by Zhang et al. and our prediction were the presence of the species in Guangdong and Fujian provinces [52]. These differences may be due to the difference in the measurement standard of “whether a species can survive in a certain place” between us and Zhang. In this study, we believe that the local climate is not suitable for the survival of the organism based on the biological climate conditions. However, the actual situation changes due to various factors, and different combinations of variables may lead to different prediction results. Zhang et al. include not only climate variables, but also non biological factors such as aspect, elevation, slope, landcover, and vegetation. Therefore, the climate may not be suitable in the future, but the D. helophoroides still exist in some places under the effect of microclimate based on terrain and vegetation.
4.2. Ecological and Environmental Factors Influencing the Distribution of M. saltuarius and Its Natural Enemies
The main climatic factors affecting the potential distribution of M. saltuarius were temperature seasonality and extreme precipitation (Table 1). The longicorn beetle completes one generation per year in China and starts to emerge when the temperature drops between May and August of that year [52]. The effective accumulated temperature for adult eclosion is 243.9 °C·day, and the developmental starting temperature is 10.1 °C [4]. Therefore, a future rise in temperature may hinder the eclosion of M. saltuarius [4]. The longicorn beetle is a typical phytophagous insect. Host plant growth largely determines the number of generations [53,54]. Temperature also affects the diffusion and distribution of host plants and insects. In addition to direct effects, temperature indirectly affects the distribution of M. saltuarius by regulating the growth and distribution of host plants [55]. Warming promotes the growth of host trees, causing earlier sprouting and increased leaf production, thereby providing a nutritional benefit to longicorn beetles [7]. Extreme precipitation is also related to the distribution of longicorn insects; it specifically affects the growth, development, diffusion, and migration of adults by influencing the health of host plants [54].
The main climatic factors affecting the potential distribution of D. helophoroides included the annual average temperature, trend in temperature variation, and seasonal precipitation in extreme climates (Table 1). The parasite has strong environmental adaptability. It can survive for up to 39 days under long-term high temperature conditions (35 ± 0.5 °C), with an extended survival time to 49 days under low temperature conditions (−10 ± 4 °C) [56]. Temperature has a significant impact on the reproductive development, physiological characteristics, and parasitic behavior of organisms. High temperature stress can reduce the lifespan of parasitic insects and severely affect their oviposition behavior and egg mass hatching rate [57]. Finally, the main climatic factors that restrict the potential distribution of S. guani included temperature changes and extreme precipitation events, particularly fluctuations in temperature and humidity (Table 1). These factors are closely linked to the growth and development of S. guani [58]. The speed of development at each stage of the tube wasp accelerates with an increase in temperature. The developmental threshold temperature and effective accumulated temperature of the egg, larva, and cocoon pupa differ significantly among relative humidities (40%–42%, 60%–66%, 79%–83%, and 91%–96%) and increase with increasing relative humidity. Under the same relative humidity, the developmental threshold temperature and effective accumulated temperature from egg to cocoon and pupa also increased gradually [59,60].
4.3. Future Control Strategy for M. saltuarius Based on Model Predictions
Under future climate change with CMIP6 as the background, analyses of changes in the predicted range under the four climate emission scenarios revealed that M. saltuarius will expand significantly in the Yunnan–Guizhou Plateau, Tibet, Qinghai, and other provinces, in addition to its original distribution. Climate change in various regions of China has become increasingly evident. Based on climate change trends, high temperatures will occur frequently in the south, except in areas where sea levels rise. Additionally, the coldest air temperature in the north will rise [61]. The growth and diffusion of M. saltuarius are related to extremely low temperatures. Therefore, with the increase in temperature in the north, the original potential distribution will not be conducive to growth. As a result, some native M. saltuarius will disperse to higher altitudes and alpine areas where suitable hosts can be found. Our risk analysis of the longicorn beetle indicated that it poses a significant threat in China, with a high risk of spread to other regions. At the same time, the potential distribution will move southward, resulting in significant overlap with the current distribution of the PWN in China. This overlap may further exacerbate the expansion of the epidemic area of B. xylophilus in China [12,62,63]. In the future, the control of PWN will become more difficult due to the expansion of the distribution of the vector insect M. saltuarius and the southward migration of M. alternatus [64,65,66]. Based on the future distribution of natural enemy insects, the increase in temperature is conducive to the colonization and expansion of natural enemy insects.
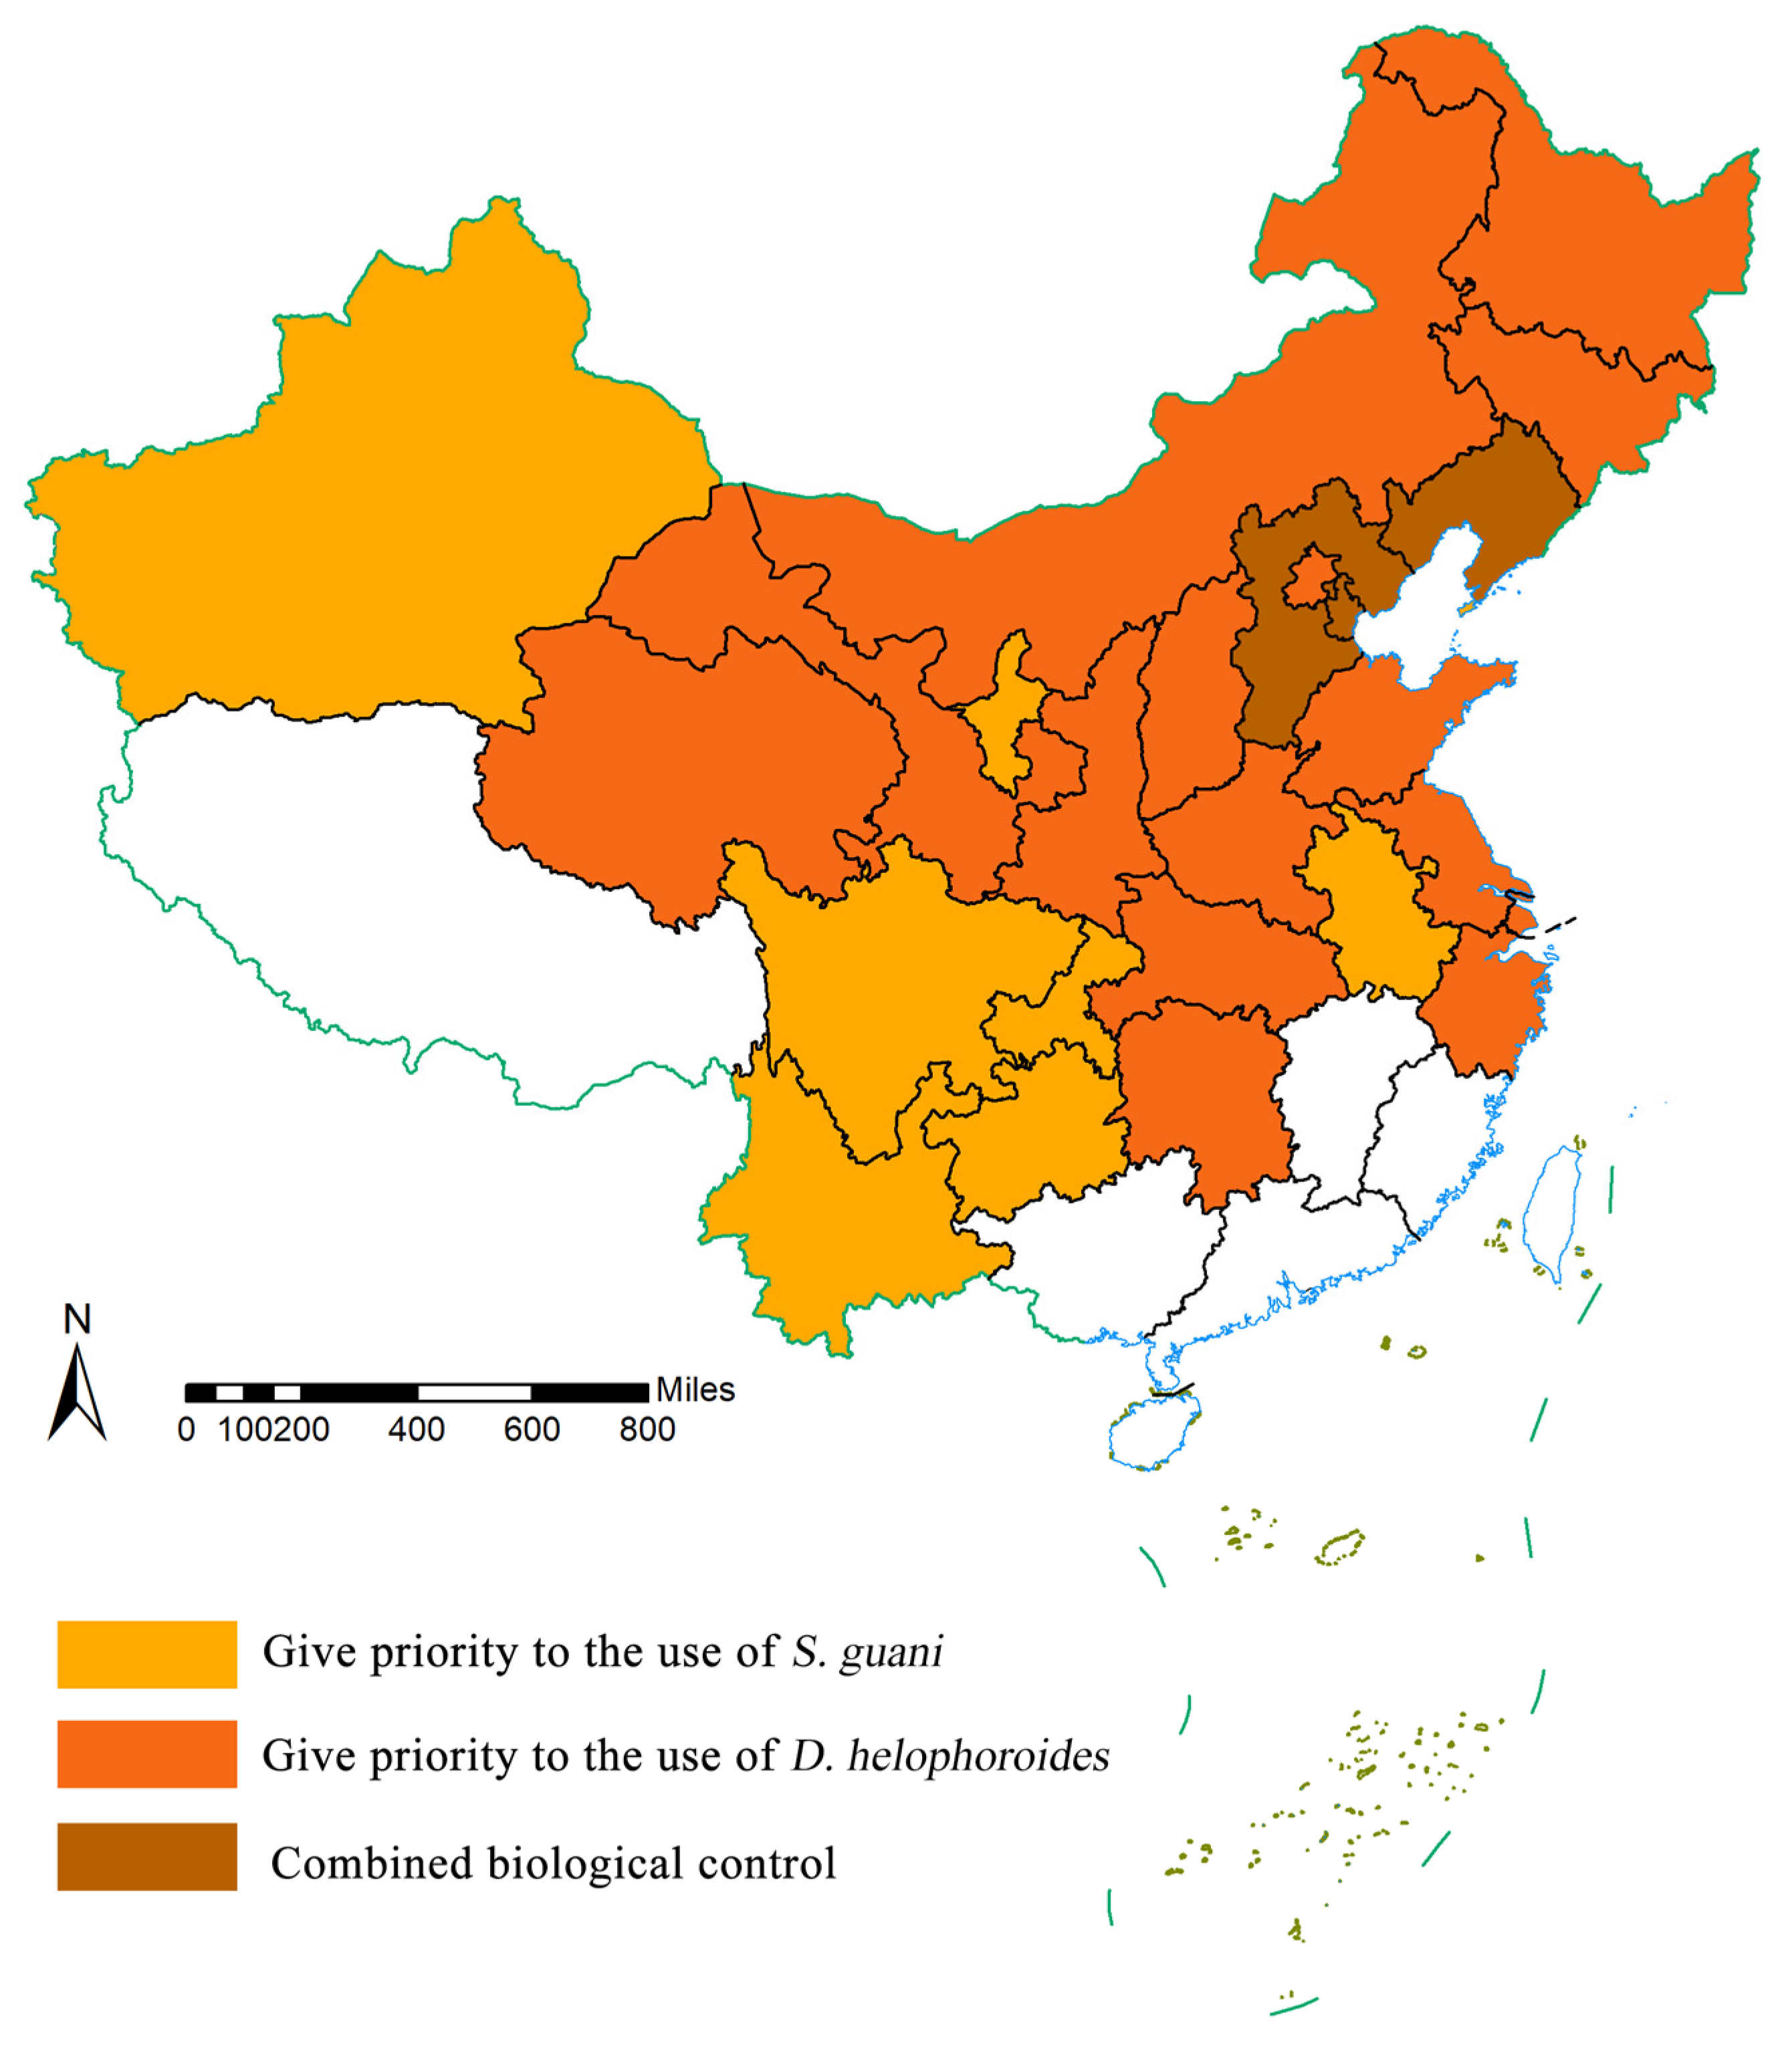
In contrast to the longhorn beetle, the future increase in temperature is expected to facilitate colonization by natural parasitoids. The future distributions of D. helophoroides and S. guani are projected to increase. In a previous study, the symbiotic period between M. saltuarius alone with D. helophoroides lasted from April to August (approximately 5 months) [67]. The mortality rate of M. saltuarius was 74.15% after the release of D. helophoroides in the forest, indicating that a preliminary control effect was achieved. The highest corrected mortality of M. saltuarius larvae was 95.65%, while the corrected mortality of M. saltuarius larvae in the forest was 39.20% [16]. In a study in which D. helophoroides and S. guani were applied to M. alternatus, the combined release of both species showed a more significant control efficacy than those of each species separately [68]. The combined control of M. saltuarius by S. guani and D. helophoroides has not been reported to date. By comparing the AOI values of “M. saltuarius + D. heliophoroides” and “M. saltuarius + S. guani” in each province. We prioritize natural enemy insects based on the combination with the highest value. When the two quantities are equal, they are used together, as depicted in Figure 5. The results of this study (Figure 5) indicate that S. guani can be used for nationwide large-scale biological control. Release should be prioritized in seven provinces (Xinjiang, Sichuan, Yunnan, Guizhou, Chongqing, Anhui, and Ningxia). D. helophoroides is more suitable for north China, northeast China, central China, and some northwest and coastal areas, including Beijing, Inner Mongolia, Shanxi, Heilongjiang, Jilin, Shaanxi, Gansu, Qinghai, Hebei, Hubei, Hunan, Shandong, Jiangsu, and Zhejiang. In addition, the provinces of Liaoning, Hebei, and Tianjin should prioritize the use of the combination.
Since the development of ENMs, research has shifted from predicting the distribution and suitable habitat of a single species using a single model against the background of global warming to predicting the distribution and suitable habitat of multiple species by multiple models [21,69]. Despite extensive modeling of the potential distribution of a species, previous studies rarely provide guidance for actual biological control and regulation based on model results. The biggest progress of this experiment lies in the use of a quantitative index to try to give reasonable suggestions on the utilization of natural enemy resources with the data. From the perspective of expanding the role of ENMs, this experimental idea seems feasible, and it is also generalized and repeatable.
However, this study had some deficiencies. This modeling approach only considers the impact of climate change on species distributions; from the perspective of long-term prevention and control monitoring, it does not consider the impact of natural enemy insects on their distribution or the impact of human activities on the distribution of natural enemy insects and M. saltuarius [70,71]. In future modeling and prediction, we will introduce a variable for the control effect to accurately predict the distribution of related species and propose more precise and practical control measures for managing M. saltuarius.
5. Conclusions
In this study, we evaluated the distribution of M. saltuarius and its natural enemies in China. We also predicted the main potential distribution areas of M. saltuarius and its natural enemies under current and future climate conditions. Additionally, we examined the environmental factors that affect the current potential distribution of M. saltuarius and its natural enemies. Through modeling and prediction, the potential distribution of M. saltuarius under the current climate in China is mainly concentrated in northeast and north China as well as in central, east, northwest, and southwest China. With the changing climate, the suitable area for M. saltuarius will gradually move southward, with trends toward high altitudes and cold regions, such as Sichuan, Qinghai, and Tibet. The potential distribution of the natural enemies D. helophoroides and S. guani will expand under climate change. The prediction results revealed that future climate change will decrease the potential distribution of M. saltuarius, while it will increase the potential distribution of natural enemies. The niche overlap of the two natural enemy insects in areas where M. saltuarius is distributed was good. S. guani was more suitable for national large-scale auxiliary biological control, while D. helophoroides was more appropriate for joint control in individual provinces. Liaoning, Hebei, and Tianjin provinces can consider jointly applying the two biocontrol measures. This prediction has high reliability, accurately predicts the suitable range and degree of overlap between M. saltuarius and its natural enemies, provides a theoretical basis for the long-term early warning and monitoring of M. saltuarius, and has important significance for the prevention and control of B. xylophilus and its vector insects in the future.
Author Contributions
Conceptualization, X.Z. and Y.Z.; methodology, X.Z.; software, X.Z.; validation, X.Z., Y.Z. and T.X.; formal analysis, X.Z.; investigation, X.Z.; resources, Y.Z.; data curation, X.Z. and T.X.; writing—original draft preparation, X.Z.; writing—review and editing, X.Z., T.X. and Y.Z.; visualization, X.Z.; supervision, S.Z.; project administration, S.Z.; funding acquisition, S.Z. All authors have read and agreed to the published version of the manuscript.
Funding
This research was supported by the National Key R&D Program of China (2021YFD1400900).
Data Availability Statement
Data are contained within the article.
Acknowledgments
We thank Ya Zou (Beijing Forestry University) for help with the logical structure and language of this paper. We also thank the reviewers and editor for their suggestions and help for the manuscript.
Conflicts of Interest
The authors declare no conflict of interest.
References
- Li, M.; Li, H.; Sheng, R.C.; Sun, H.; Sun, S.H.; Chen, F.M. The First Record of Monochamus saltuarius (Coleoptera; Cerambycidae) as Vector of Bursaphelenchus xylophilus and Its New Potential Hosts in China. Insects 2020, 11, 636. [Google Scholar] [CrossRef] [PubMed]
- Yusuke, N.; Katsumi, T. Transmission of Bursaphelenchus mucronatus Mamiya et Enda (Nematoda, Aphelenchoididae) from Monochamus saltuarius (Gebler) (Coleoptera, Cerambycidae) to pine branches via vector’s oviposition wounds in comparison to B. xylophilus (Steiner et Buhrer) Nickle carried by M. alternatus Hope. J. For. Res. 2022, 27, 236–243. [Google Scholar] [CrossRef]
- Zhao, S.G.; Chen, G.F.; Qu, H.C.; Xu, S.L.; Lu, Y.H.; Wang, J. Advances in studies on biological and ecological characteristics of Monochamus saltuarius. For. Pest Dis. 2021, 40, 37–43. [Google Scholar]
- Lim, J.; Jung, S.Y.; Lim, J.S.; Jang, J.; Kim, K.M.; Lee, Y.M.; Lee, B.W. A review of host plants of Cerambycidae (Coleoptera: Chrysomeloidea) with new host records for fourteen cerambycids, including the Asian longhorn beetle (Anoplophora glabripennis Motschulsky), in Korea. Korean J. Appl. Entomol. 2014, 53, 111–133. [Google Scholar] [CrossRef]
- Pang, J.L.; Li, J.; Dong, Y.Q. Feeding preference of Monochamus saltuarius Gebler (Coleoptera: Cerambycidae) for Pinus koraiensis, Pinus tabulaeformis and Larix kaempferi. For. Pest Dis. 2020, 39, 19–22. [Google Scholar]
- Jiang, S.W.; Wu, H.; Li, D.B.; Luo, Z.Q.; He, S.; Song, Y.S. Analysis on disaster characteristics of pine wood nematode in Northeast China. For. Pest Dis. 2022, 41, 9–15. [Google Scholar]
- Hanks, L.M. Influence of the larval host plant on reproductive strategies of cerambycid beetles. Annu. Rev. Entomol. 1999, 44, 483–505. [Google Scholar] [CrossRef]
- Lee, H.R.; Lee, S.C.; Lee, D.H.; Choi, W.S.; Jung, C.S.; Jeon, J.H.; Kim, J.E.; Park, I.K. Identification of the Aggregation-sex Pheromone Produced by Male Monochamus saltuarius, a Major Insect Vector of the Pine Wood Nematode. J. Chem. Ecol. 2017, 43, 670–678. [Google Scholar] [CrossRef]
- Ye, J.R.; Wu, X.Q. Research progress of pine wilt disease. For. Pest Dis. 2022, 41, 1–10. [Google Scholar]
- Carnegie, A.J.; Venn, T.; Lawson, S.; Nagel, M.; Wardlaw, T.; Cameron, N.; Last, I. An analysis of pest risk and potential economic impact of pine wilt disease to Pinus plantations in Australia. Aust. For. 2018, 81, 24–36. [Google Scholar] [CrossRef]
- Zheng, Y.N.; Shi, Y.; Li, Y.; Fan, L.C.; Wang, J.; Wang, W.T. Feeding preference of Monochamus saltuarius (Coleoptera: Cerambycidae) adults for four host pine trees. Acta Entomol. Sin. 2021, 64, 1478–1482. [Google Scholar]
- Zou, Y.; Ge, X.Z.; Zhou, Y.T.; Guo, S.W.; Wang, T.; Zong, S.X. Risk of Monochamus saltuarius spreading in China. Chin. J. Appl. Entomol. 2023, 60, 287–297. [Google Scholar]
- Han, J.; Kim, H.K.; Kang, W.J.; Kim, G. Feeding and oviposition preference of the Sakhalin pine sawyer Monochamus saltuarius (Coleoptera: Cerambycidae) for various tree species. Entomol. Res. 2016, 46, 331–336. [Google Scholar] [CrossRef]
- Yusuke, N.; Katsumi, T. Oviposition sites constructed in Pinus densiflora phloem by Monochamus alternatus and Monochamus saltuarius (Coleoptera, Cerambycidae). J. For. Res. 2023, 28, 78–81. [Google Scholar]
- Golec, J.R.; Li, F.; Cao, L.; Wang, X.; Duan, J.J. Mortality factors of Anoplophora glabripennis (Coleoptera: Cerambycidae) infesting Salix and Populus in central, northwest, and northeast China. Biol. Control 2018, 126, 198–208. [Google Scholar] [CrossRef]
- Zheng, Y.N.; Zhang, Y.L.; Shi, Y.; Fan, L.C.; Li, Y. Preliminary study on the control efficiency of Monochamus saltuarius by Sclerodermus spp. Chin. J. Biol. Control 2022, 38, 306–311. [Google Scholar]
- Zheng, Y.N.; Jiang, S.W.; Huang, F.Y.; Yang, Z.Q.; Gao, G.P.; Liu, P.X.; Zhang, Y.L. Dastarcus helophoroides, Natural Enemy of Monochamus saltuarius was Found in Pine Tree Infected by Bursaphelenchus xylophilus in Liaoning, China. Chin. J. Biol. Control 2020, 36, 315–318. [Google Scholar]
- Kocmánková, E.; Trnka, M.; Juroch, J.; Dubrovský, M.; Semerádová, D.; Možný, M.; Žalud, Z. Impact of climate change on the occurrence and activity of harmful organisms. Plant Prot. Sci. 2009, 45, S48–S52. [Google Scholar] [CrossRef]
- Skendžić, S.; Zovko, M.; Živković, I.; Lešić, V.; Lemić, D. The impact of climate change on agricultural insect pests. Insects 2021, 12, 440. [Google Scholar] [CrossRef]
- Seidl, R.; Thom, D.; Kautz, M. Forest disturbances under climate change. Nat. Clim. Chang. 2017, 7, 395–402. [Google Scholar] [CrossRef]
- Elith, J.; Leathwick, J. Species distribution models: Ecological explanation and prediction across space and time. Annu. Rev. Ecol. Evol. Syst. 2009, 40, 677–697. [Google Scholar] [CrossRef]
- Franklin, J. Species distribution models in conservation biogeography: Developments and challenges. Divers. Distrib. 2013, 19, 1217–1223. [Google Scholar] [CrossRef]
- Morente-López, J.; Kass, J.M.; Lara-Romero, C. Ecological niche models as hypothesis generators of functional genetic differentiation and potential local adaptation in a Mediterranean alpine ecosystem. bioRxiv 2020. [Google Scholar] [CrossRef]
- Searcy, C.A.; Shaffer, H.B. Do Ecological Niche Models Accurately Identify Climatic Determinants of Species Ranges? Am. Nat. 2016, 187, 423–435. [Google Scholar] [CrossRef] [PubMed]
- Elith, J.; Phillips, S.; Hastie, T.; Dudík, M.; Chee, Y.E.; Yates, C.J. A statistical explanation of maxent for ecologists. Divers. Distrib. 2010, 17, 43–57. [Google Scholar] [CrossRef]
- Phillips, S.; Anderson, R.H.; Schapire, R.E. Maximum entropy modeling of species geographic distributions. Ecol. Model. 2006, 190, 231–259. [Google Scholar] [CrossRef]
- Araújo, M.; Luoto, M. The importance of biotic interactions for modelling species distributions under climate change. Glob. Ecol. Biogeogr. 2007, 16, 743–753. [Google Scholar] [CrossRef]
- Jiménez-Valverde, A.; Peterson, A.; Soberón, J.; Overton, J.; Aragón, P.; Lobo, J. Use of niche models in invasive species risk assessments. Biol. Invasions 2011, 13, 2785–2797. [Google Scholar] [CrossRef]
- Smeraldo, S.; Bosso, L.; Salinas-Ramos, V.B.; Ancillotto, L.; Sánchez-Cordero, V.; Gazaryan, S.; Russo, D. Generalists yet different: Distributional responses to climate change may vary in opportunistic bat species sharing similar ecological traits. Mammal Rev. 2021, 51, 571–584. [Google Scholar] [CrossRef]
- Kwon, H.S.; Kim, B.J.; Jang, G.S. Modelling the spatial distribution of wildlife animals using presence and absence data. Contemp. Probl. Ecol. 2016, 9, 515–528. [Google Scholar] [CrossRef]
- Wu, T.; Lu, Y.; Fang, Y.; Xin, X.; Li, L.; Li, W.; Liu, X. The Beijing climate center climate system model (BCC-CSM): The main progress from cmip5 to cmip6. Geosci. Model Dev. 2019, 12, 1573–1600. [Google Scholar] [CrossRef]
- Nie, S.; Fu, S.; Cao, W. Comparison of monthly air and land surface temperature extremes simulated using CMIP5 and CMIP6 versions of the Beijing Climate Center climate model. Theor. Appl. Climatol. 2020, 140, 487–502. [Google Scholar] [CrossRef]
- Eyring, V.; Bony, S.; Meehl, G.A.; Senior, C.A.; Stevens, B.; Stouffer, R.J.; Taylor, K.E. Overview of the Coupled Model Intercomparison Project Phase 6 (CMIP6) experimental design and organization. Geosci. Model Dev. 2016, 9, 1937–1958. [Google Scholar] [CrossRef]
- O’Neill, B.C.; Tebaldi, C.; Van Vuuren, D.P. The scenario model intercomparison project (Scenario MIP) for CMIP6. Geosci. Model Dev. 2016, 9, 3461–3482. [Google Scholar] [CrossRef]
- Sillero, N.; Barbosa, A.M. Common mistakes in ecological niche models. Int. J. Geogr. Inf. Sci. 2021, 35, 213–226. [Google Scholar] [CrossRef]
- Merow, C.; Smith, M.; Silander, J. A practical guide to maxent for modeling species’ distributions: What it does, and why inputs and settings matter. Ecography 2013, 36, 1058–1069. [Google Scholar] [CrossRef]
- Zhu, G.P.; Qiao, H.J. Effect of the Maxent model’s complexity on the prediction of species potential distributions. Biodivers. Sci. 2016, 24, 1189–1196. [Google Scholar] [CrossRef]
- Radosavljevic, A.; Anderson, R.P. Making better Maxent models of species distributions: Complexity, overfitting and evaluation. J. Biogeogr. 2014, 41, 629–643. [Google Scholar] [CrossRef]
- Moreno-Amat, E.; Saura, S.; Nieto-Lugilde, D.; Morueta-Holme, N.; Svenning, J.; García-Amorena, I. Impact of model complexity on cross-temporal transferability in maxent species distribution models: An assessment using paleo botanical data. Ecol. Model. 2015, 312, 308–317. [Google Scholar] [CrossRef]
- Syfert, M.M.; Smith, M.J.; Coomes, D.A. The effects of sampling bias and model complexity on the predictive performance of maxent species distribution models. PLoS ONE 2013, 8, e55158. [Google Scholar] [CrossRef]
- Fithian, W.; Elith, J.; Hastie, T.; Keith, D.A. Bias correction in species distribution models: Pooling survey and collection data for multiple species. Methods Ecol. Evol. 2015, 6, 424–438. [Google Scholar] [CrossRef] [PubMed]
- Warren, D.L.; Seifert, S.N. Ecological niche modeling in Maxent: The importance of model complexity and the performance of model selection criteria. Ecol. Appl. 2011, 21, 335–342. [Google Scholar] [CrossRef] [PubMed]
- Vignali, S.; Barras, A.G.; Arlettaz, R.; Braunisch, V. SDMtune: An R package to tune and evaluate species distribution models. Ecol. Evol. 2020, 10, 11488–11506. [Google Scholar] [CrossRef] [PubMed]
- Zhang, Y.; Dang, Y.Q.; Wang, X. Risk Assessment of the Worldwide Expansion and Outbreak of Massicus raddei (Blessig) (Coleoptera: Cerambycidae) Based on Host Plant and Climatic Factors. Insects 2022, 13, 730. [Google Scholar] [CrossRef] [PubMed]
- Brown, J.L. SDM toolbox: A python-based GIS toolkit for landscape genetic, biogeographic and species distribution model analyses. Methods Ecol. Evol. 2014, 5, 694–700. [Google Scholar] [CrossRef]
- Schoener, T. The anoles lizards of Bimini: Resource partitioning in a complex fauna. Ecology 1968, 49, 704–726. [Google Scholar] [CrossRef]
- Warren, D.; Glor, R.; Turelli, M. Environmental niche equivalency versus conservatism: Quantitative approaches to niche evolution. Evolution 2008, 62, 2868–2883. [Google Scholar] [CrossRef] [PubMed]
- Lobo, J.M.; Jiménez-Valverde, A.; Real, R. AUC: A misleading measure of the performance of predictive distribution models. Glob. Ecol. Biogeogr. 2008, 17, 145–151. [Google Scholar] [CrossRef]
- Allouche, O.; Tsoar, A.; Kadmon, R. Assessing the accuracy of species distribution models: Prevalence, kappa and the true skill statistic (TSS). J. Appl. Ecol. 2006, 43, 1223–1232. [Google Scholar] [CrossRef]
- Estay, S.; Labra, F.; Sepúlveda, R.; Bacigalupe, L. Evaluating habitat suitability for the establishment of Monochamus spp. through climate-based niche modeling. PLoS ONE 2014, 9, e102592. [Google Scholar] [CrossRef]
- Deng, X.; Xu, D.; Liao, W.; Wang, R.; Zhuo, Z. Predicting the distributions of Scleroderma guani (Hymenoptera: Bethylidae) under climate change in China. Ecol. Evol. 2022, 12, e9410. [Google Scholar] [CrossRef] [PubMed]
- Zhang, Q.; Wang, J.; Lei, Y. Predicting Distribution of the Asian Longhorned Beetle, Anoplophora glabripennis (Coleoptera: Cerambycidae) and its natural enemies in China. Insects 2022, 13, 687. [Google Scholar] [CrossRef] [PubMed]
- Shim, J.; Jung, J.; Byeon, D.; Jung, S.; Lee, W. Evaluation of the spatial distribution of Anoplophora glabripennis (motschulsky) (Coleoptera: Cerambycidae) in South Korea combining climate and host plant distribution. J. Asia-Pac. Entomol. 2020, 23, 646–652. [Google Scholar] [CrossRef]
- Pureswaran, D.S.; Roques, A.; Battisti, A. Forest Insects and Climate Change. Curr. For. Rep. 2018, 4, 35–50. [Google Scholar] [CrossRef]
- Dang, Y.Q.; Zhang, Y.; Wang, X.; Xin, B.; Quinn, N.; Duan, J. Retrospective analysis of factors affecting the distribution of an invasive wood-boring insect using native range data: The importance of host plants. J. Pest Sci. 2021, 94, 981–990. [Google Scholar] [CrossRef]
- Wei, J.R.; Yang, Z.Q.; Niu, Y.L.; Zhao, H.B.; Tang, H. Distribution and ecological biology of Dastarcus helophoroides. For. Pest Dis. 2009, 28, 16–18. [Google Scholar]
- Zhou, Y.J.; Lu, C.D.; Shen, H.Y.; Liang, Y.; Chen, Z.H.; Zhong, J.H.; Tan, J.; Wang, X.Y.; Liang, G.H. Adaptation and Physiological Response of Dastarcus helophoroides (Fairmaire) to High Temperature Stress. Chin. J. Biol. Control 2021, 37, 1179–1188. [Google Scholar]
- Yao, D.F.; Yan, J.J.; Xu, C.H. Study on the relationship between temperature and humidity and the growth and development of Scleroderma guani Xiao et Wu. Sci. Silvae Sin. 1983, 19, 85–91. [Google Scholar]
- Tian, S.Z.; Zhang, Z.X. Study on the effective accumulated temperature of Scleroderma guani. J. Shandong For. Sci. Technol. 1983, 2, 33–36. [Google Scholar]
- Gao, X.; Zhao, D.S.; Zheng, D. Regional Differences in Surface Temperature Variation in China from 1961 to 2018. Chin. J. Atmos. Sci. 2023, 47, 995–1006. [Google Scholar]
- Liang, C.; Zhu, G.M.; Zhen, H.L.; Lin, W.; Jason, F.; Yan, P.L. Dynamical Downscaling of Temperature and Precipitation Extremes in China under Current and Future Climates. Atmos.-Ocean 2018, 56, 55–70. Available online: https://www.tandfonline.com/doi/full/10.1080/07055900.2017.1422691 (accessed on 17 September 2023).
- Gao, R.; Liu, L.; Zhao, L.; Cui, S. Potentially Suitable Geographical Area for Monochamus alternatus under Current and Future Climatic Scenarios Based on Optimized MaxEnt Model. Insects 2023, 14, 182. [Google Scholar] [CrossRef] [PubMed]
- Ye, J.R. Epidemic Status of Pine Wilt Disease in China and Its Prevention and Control Techniques and Counter Measures. Sci. Silvae Sin. 2019, 55, 1–10. [Google Scholar]
- David, G.; Giffard, B.; Piou, D.; Roques, A.; Jactel, H. Potential effects of climate warming on the survivorship of adult Monochamus galloprovincialis. Agric. For. Entomol. 2016, 19, 192–199. [Google Scholar] [CrossRef]
- Liu, Q.; Wu, Z.W.; Lin, S.T.; Li, S.; Fang, Z.B. Spatial point pattern analysis of pine wilt disease occurrence and its influence factors. Chin. J. Appl. Ecol. 2022, 33, 2530–2538. [Google Scholar]
- Xu, X.G.; Yu, R.B.; Yang, C.X.; Liu, H.J.; Zhou, Z.L.; Shen, Y.J. Prediction of invasion risk of pine wilt disease based on GIS spatial technology and MaxEnt model in western Sichuan. J. Beijing For. Univ. 2023, 45, 104–115. [Google Scholar]
- Zheng, Y.N.; Wang, J.; Wang, W.T.; Li, Y.; Fan, L.C.; Shi, Y.; Zhang, Y.L. Parasitic Effect of Dastarcus helophoroides of Monochamus alternatus Biotype on Monochamus saltuarius. Chin. J. Biol. Control 2022, 38, 587–594. [Google Scholar]
- Cui, Y.S.; Liu, Y.P.; Song, Y.S.; Xu, F.Y.; Xu, K.Q. Control of Monochamus alternatus with natural enemies. For. Pest Dis. 2011, 30, 31–33. [Google Scholar]
- Guo, Y.L.; Zhao, F.Z.; Qiao, H.J.; Wang, R.; Wei, H.Y.; Wang, L.S.; Li, X. Challenges and Development Trend of Species Distribution Model. Adv. Earth Sci. 2020, 35, 1292–1305. [Google Scholar]
- Mi, C.; Huettmann, F.; Li, X.; Jiang, Z.; Du, W.; Sun, B. Effects of climate and human activity on the current distribution of amphibians in China. Conserv. Biol. J. Soc. Conserv. Biol. 2022, 36, e13964. [Google Scholar] [CrossRef]
- Carvajal Acosta, A.N.; Mooney, K. Effects of geographic variation in host plant resources for a specialist herbivore’s contemporary and future distribution. Ecosphere 2021, 12, e03822. [Google Scholar] [CrossRef]
Figure 1.
Geographical distribution of Monochamus saltuarius, Scleroderma guani, and Dastarcus helophoroides in China after collection and screening.
Figure 1.
Geographical distribution of Monochamus saltuarius, Scleroderma guani, and Dastarcus helophoroides in China after collection and screening.

Figure 2.
Potential distribution of Monochamus saltuarius. Potential distribution in the current climate is depicted in the map below, with green indicating a suitable habitat for growth (A). Extrapolating from the current climate to the future (2021–2040), the scenarios SSP1-2.6 (B), SSP2-4.5 (C), SSP3-7.0 (D), and SSP5-8.5 (E) were considered. Green indicates areas in the potential distribution that will disappear in the future. Gray indicates areas where the potential distribution will not change in the future. Pink indicates new potential distribution areas.

Figure 3.
Potential distribution range of Dastarcus helophoroides. Predictions for the current climate are depicted in the map below, with green indicating the suitable habitat for growth (A). Extrapolating from the current climate to the future (2021–2040), the scenarios SSP1-2.6 (B), SSP2-4.5 (C), SSP3-7.0 (D), and SSP5-8.5 (E) were considered. The interpretation of colors is the same as that in Figure 1.

Figure 4.
Potential distribution range of Scleroderma guani. Results for the current climate are depicted in the map below, with green indicating the suitable habitat for growth (A). Extrapolating from the current climate to the future (2021–2040), the scenarios SSP1-2.6 (B), SSP2-4.5 (C), SSP3-7.0 (D), and SSP5-8.5 (E) were considered. The interpretation of colors is the same as that in Figure 1.

Figure 5.
Schematic diagram of natural enemy insects that should be preferentially used in different provinces of China.
Figure 5.
Schematic diagram of natural enemy insects that should be preferentially used in different provinces of China.


Table 1.
Description of the environmental variables selected for the Maxent models of species in this study and the percentage of importance of these variables.
Table 1.
Description of the environmental variables selected for the Maxent models of species in this study and the percentage of importance of these variables.
| Species Name | Variable Codes | Environment Variable Meaning (Unit) | Permutation Importance (%) |
|---|---|---|---|
| Monochamus saltuarius | bio1 | Annual mean temperature (°C) | 45.2 |
| bio18 | Precipitation of the warmest quarter (mm) | 23.0 | |
| bio8 | Mean temperature of the wettest quarter (°C) | 20.3 | |
| bio19 | Precipitation of the coldest quarter (mm) | 9.9 | |
| bio7 | Temperature annual range (bio5-bio6) (°C) | 1.6 | |
| Dastarcus helophoroides | bio4 | Temperature seasonality (standard deviation × 100) | 54.5 |
| bio1 | Annual mean temperature (°C) | 31.9 | |
| bio16 | Precipitation of the wettest quarter (mm) | 4.7 | |
| bio19 | Precipitation of the coldest quarter (mm) | 4.6 | |
| bio18 | Precipitation of the warmest quarter (mm) | 2.4 | |
| bio2 | Mean diurnal range (°C) | 1.3 | |
| bio5 | Maximum temperature of the warmest month (°C) | 0.6 | |
| Scleroderma guani | bio4 | Temperature seasonality (standard deviation × 100) | 56.9 |
| bio10 | Mean temperature of the warmest quarter (°C) | 16.2 | |
| bio2 | Mean diurnal range (°C) | 8.2 | |
| bio18 | Precipitation of the warmest quarter (mm) | 7.2 | |
| bio17 | Precipitation of the driest quarter (mm) | 5.3 | |
| bio19 | Precipitation of the coldest quarter (mm) | 3.1 | |
| bio8 | Mean temperature of the wettest quarter (°C) | 2.3 | |
| bio15 | Precipitation seasonality (coefficient of variation) | 0.9 |
Table 2.
Model parameter optimization results.
| Parameters | Species Name | RM | FC | Train TSS | Train AUC | Test TSS | Test AUC |
|---|---|---|---|---|---|---|---|
| Default | Monochamus saltuarius | 1 | LQPH | 0.9886 | 0.9972 | 0.9826 | 0.9968 |
| Dastarcus helophoroides | 0.9793 | 0.9936 | 0.8544 | 0.9723 | |||
| Scleroderma guani | 0.9090 | 0.9792 | 0.9657 | 0.9893 | |||
| Optimization | Monochamus saltuarius | 0.7 | LQPH | 0.9890 | 0.9974 | 0.9873 | 0.9975 |
| Dastarcus helophoroides | 0.5 | QPH | 0.9834 | 0.9944 | 0.9143 | 0.9835 | |
| Scleroderma guani | 0.5 | LQPHT | 0.9273 | 0.9896 | 0.9873 | 0.9966 |
FC, feature classes; RM, regularization multiplier; H, hinge; L, linear; P, product; Q, quadratic; T, threshold; AUC, Area Under Curve.
Table 3.
Potential distribution changes in research species in China under current and future climate scenarios (2021–2040).
Table 3.
Potential distribution changes in research species in China under current and future climate scenarios (2021–2040).
| Species | SSPs | N | N1 | N2 (%) | N3 (%) | Trend |
|---|---|---|---|---|---|---|
| Monochamus saltuarius | current | 1 | 0.497 | reduction | ||
| SSP1-2.6 | 0.956 | 0.475 | 2.30 | 4.48 | ||
| SSP2-4.5 | 0.987 | 0.490 | 3.06 | 3.69 | ||
| SSP3-7.0 | 0.950 | 0.472 | 2.05 | 4.53 | ||
| SSP5-8.5 | 0.963 | 0.478 | 3.75 | 5.60 | ||
| Dastarcus helophoroides | current | 1 | 0.201 | expansion | ||
| SSP1-2.6 | 1.444 | 0.291 | 9.22 | 0.28 | ||
| SSP2-4.5 | 1.484 | 0.299 | 10.05 | 0.31 | ||
| SSP3-7.0 | 1.462 | 0.295 | 9.75 | 0.44 | ||
| SSP5-8.5 | 1.518 | 0.306 | 10.85 | 0.40 | ||
| Scleroderma guani | current | 1 | 0.313 | expansion | ||
| SSP1-2.6 | 1.067 | 0.334 | 6.13 | 4.04 | ||
| SSP2-4.5 | 1.055 | 0.330 | 5.83 | 4.12 | ||
| SSP3-7.0 | 1.035 | 0.324 | 5.95 | 4.85 | ||
| SSP5-8.5 | 1.077 | 0.337 | 5.99 | 3.58 |
Table 4.
Table of AOI between Monochamus saltuarius and different natural enemies.
| Province | M. saltuarius + S. guani | M. saltuarius + D. helophoroides |
|---|---|---|
| Anhui | 0.77 | 0.75 |
| Beijing | 0.92 | 0.95 |
| Gansu | 0.82 | 0.86 |
| Hebei | 0.72 | 0.72 |
| Henan | 0.70 | 0.76 |
| Heilongjiang | 0.80 | 0.87 |
| Hubei | 0.68 | 0.72 |
| Hunan | 0.82 | 0.90 |
| Jilin | 0.79 | 0.81 |
| Jiangsu | 0.57 | 0.63 |
| Liaoning | 0.89 | 0.89 |
| Inner Mongolia | 0.80 | 0.86 |
| Ningxia | 0.91 | 0.88 |
| Qinghai | - | 0.87 |
| Shandong | 0.76 | 0.77 |
| Shanxi | 0.64 | 0.67 |
| Shaanxi | 0.67 | 0.75 |
| Shanghai | 0.96 | 0.97 |
| Tianjin | 0.92 | 0.92 |
| Zhejiang | 0.85 | 0.86 |
| Guizhou | 0.50 | - |
| Sichuan | 0.60 | - |
| Xinjiang | 0.75 | - |
| Yunnan | 0.61 | - |
| Chongqing | 0.72 | - |
Disclaimer/Publisher’s Note: The statements, opinions and data contained in all publications are solely those of the individual author(s) and contributor(s) and not of MDPI and/or the editor(s). MDPI and/or the editor(s) disclaim responsibility for any injury to people or property resulting from any ideas, methods, instructions or products referred to in the content. |
© 2023 by the authors. Licensee MDPI, Basel, Switzerland. This article is an open access article distributed under the terms and conditions of the Creative Commons Attribution (CC BY) license (https://creativecommons.org/licenses/by/4.0/).
Share and Cite
MDPI and ACS Style
Zhang, X.; Zhou, Y.; Xu, T.; Zong, S. Impact of Climate Change on the Habitat Suitability of Monochamus saltuarius Gebler (Coleoptera; Cerambycidae) and Its Natural Enemies in China. Forests 2024, 15, 33. https://doi.org/10.3390/f15010033
AMA Style
Zhang X, Zhou Y, Xu T, Zong S. Impact of Climate Change on the Habitat Suitability of Monochamus saltuarius Gebler (Coleoptera; Cerambycidae) and Its Natural Enemies in China. Forests. 2024; 15(1):33. https://doi.org/10.3390/f15010033
Chicago/Turabian StyleZhang, Xuemei, Yuting Zhou, Tian Xu, and Shixiang Zong. 2024. "Impact of Climate Change on the Habitat Suitability of Monochamus saltuarius Gebler (Coleoptera; Cerambycidae) and Its Natural Enemies in China" Forests 15, no. 1: 33. https://doi.org/10.3390/f15010033
Note that from the first issue of 2016, this journal uses article numbers instead of page numbers. See further details here.