
A Simulation Study of the Impact of Urban Street Greening on the Thermal Comfort in Street Canyons on Hot and Cold Days


School of Architecture and Art, Central South University, Changsha 410075, China
*
Author to whom correspondence should be addressed.
Forests 2023, 14(11), 2256; https://doi.org/10.3390/f14112256
Submission received: 12 October 2023
/
Revised: 28 October 2023
/
Accepted: 14 November 2023
/
Published: 16 November 2023
(This article belongs to the Special Issue Advances on the Influence of Vegetation and Forest on Urban Air Quality and Thermal Comfort—Series II)
Abstract
:The urban heat island effect has become a widely concerning issue worldwide. Many researchers have made great efforts to improve the summer thermal comfort of urban street canyons by optimizing street greening. Relatively less research has focused on how to improve the thermal comfort of street canyons by optimizing street greening during cold days. Many researchers have proposed strategies to improve the summer thermal comfort of street canyons using road greening. This may have a significant negative impact on the winter thermal comfort of street canyons due to the lack of consideration of the impact on hot and cold days simultaneously, especially when the road green space is mainly composed of evergreen tree species. We aimed to explore the impacts of urban street greening on thermal comfort on hot and cold days at the same time. We used Zhutang West Road in Changsha, China, as an example and built six different models to explore the impacts of the street vegetation types, number of street trees, tree heights, crown widths, and Leaf Area Index on the thermal comfort of the street canyon. In addition, we also considered the impact of different building features and wind directions on the thermal comfort of the street canyon. We employed ENVI-met (version 5.5.1) to simulate different urban street greening models. The results show that the model with a high tree canopy density, tall trees, large and dense crowns, and sufficient building shade has good thermal comfort on hot days (the average physiological equivalent temperature (PET) is 31.1 °C for the study period) and bad thermal comfort on cold days (the PET is 13.3 °C) when it is compared with the other models (the average PETs are 36.2 °C, 31.5 °C, 41.5 °C, 36.2 °C, and 35.5 °C, respectively, on hot days and for other models). In addition, the model with a very large number of short hedges has a positive impact on thermal comfort during hot days (the PET is 31.1 °C). The PET value of another comparable model which does not have hedges is 31.5 °C. Even if the model with a small building area has good ventilation, the small building shade area in the model has a more obvious impact and the model has relatively good thermal comfort during cold days (the PET is 14.2 °C) when it is compared to models with bigger building areas (the PET is 13.9 °C). In summer, when the wind is parallel to the direction of the street canyon, the wind speed in the street canyon is high and the model has relatively good thermal comfort (the PET is 35.5 °C) compared with another model which has different wind direction and lower wind speed at the street canyon (the PET is 36.2 °C). In winter, when the wind is perpendicular to the direction of the street canyon, buildings and trees have a strong windproof effect and this is beneficial to the improvement of thermal comfort (the PET is 15.3 °C for this model and 13.9 °C for another comparable model). This research lays a solid foundation and encourages people to think about the impact of building and tree composition and configuration on the thermal comfort of street canyons during hot and cold days simultaneously.
1. Introduction
Urban heat island effects and global warming have obvious negative impacts on thermal comfort and public health [1,2,3]. The Climate Change 2023 Synthesis Report of the Intergovernmental Panel on Climate Change (IPCC) indicates that from 2011 to 2020, the global surface temperature was 1.1 °C above that from 1850 to 1900. This includes a 1.59 °C increase over land and a 0.88 °C increase over the ocean [4]. Some researchers have pointed out that approximately 5 million deaths worldwide are associate with non-optimal temperatures per year. This accounts for 9.43% of the total number of deaths [5]. Planting trees is considered one of the most effective ways to improve the thermal comfort of urban street canyons during hot summer days [6]. However, this may not be a good way to improve thermal comfort in winter [7]. For better urban planning, planners should have a better understanding of the impact of street trees and buildings on the thermal comfort in street canyons [3].
Some researchers have studied the impact of street trees and buildings on the thermal comfort in street canyons during hot summer conditions [3,6,7,8,9,10,11,12]. Street trees can significantly improve the thermal comfort of the street canyon during hot days [6]. Li et al. (2023) considered the impact of street trees on thermal comfort and air pollution in street canyons on hot days. They found that a higher Leaf Area Index (LAI) and planting density could increase the concentration of PM2.5 but improve the thermal comfort in street canyons [8]. Cheng et al. (2022) explored the impact of tree canopy characteristics on human thermal comfort in street canyons. They found that for the same type of tree species, trees with higher LAI and crown width can be much more effective in improving thermal comfort. For the selection of tree species, LAI is an important factor to consider. Those trees with higher LAI tend to be more effective in improving thermal comfort [10]. Huang et al. (2020) found that tree canopies block solar radiation and influence wind speed. This can improve the summer thermal comfort [11]. Narimani et al. (2022) considered the impact of street orientation and tree species on thermal comfort on the streets. They pointed out that street orientation has less effect on improving the thermal comfort than tree cover [9]. Cui et al. (2023) found that if the street orientation and vegetation distribution are the same, when the aspect ratio (a ratio of building height to street width) [13] is 0.9, the thermal comfort of the street canyon is the best. Their research indicates that the same road greening features may have different effects on thermal comfort in different street canyon environments [13]. Cao et al. (2022) found that the impact of green space on the thermal comfort of streets was affected by the street orientation and aspect ratio [7].
The abovementioned aspects are more related to the component of street greening and buildings on thermal comfort. In addition, the spatial configuration of green space and buildings on thermal comfort has also been widely focused on [12,13,14,15]. For example, Ren et al. (2022) studied the impact of different tree coverage on thermal comfort and public health in street canyons. They found that the streets with a higher street tree coverage had a lower physiological equivalent temperature (PET) and better thermal comfort. In addition, they found people in areas with a higher street tree coverage had lower systolic blood pressure, diastolic blood pressure, and pulse rate during hot days [3]. Yang et al. (2018) found that if the street canyon is narrow, wind has a weak impact on thermal comfort. In this case, the shadows of buildings and trees can have a more significant impact on thermal comfort. Under the same lighting conditions, the shade generated by buildings and trees in east–west streets has a different effect on the thermal comfort of street canyons compared to the shade generated by buildings and trees in north–south streets. This is mainly because the city they studied, Xi’an, is located in the northern hemisphere, north of the Tropic of Cancer. Affected by the specific location of shadows generated by buildings and trees at different times throughout the day, the buildings and trees on the south side of the street can play a quite active role in improving the thermal comfort of the street canyon at many different times of the day, especially around noon. Thus, on the east–west streets, planting street trees near buildings had the best effect for the improvement of thermal comfort in street canyons. For north–south streets, the thermal comfort is better if the trees were planted in the middle of one side of the street. This is mainly because the buildings’ and trees’ shade improves the thermal comfort of the street canyon at many different times of the day [14]. Zheng et al. (2018) explored the thermal comfort of roads under different street configurations and tree distributions. They found that denser tree canopies were better for cooling and the interval between the trees was observed to have an optimal effect when it was equal to the canopy width [12]. Morakinyo and Lam (2016) explored the impact of a street’s tree layout on the thermal comfort in street canyons. They found the thermal comfort of a layout of two rows of trees is better than that of a layout of street trees in the center; proper ventilation is important for the improvement of the thermal comfort of roads; and vegetation is more effective in improving thermal comfort under calm vertical wind than strong skew wind [15]. Yilmaz et al. (2018) found that vegetation, public space layouts, street orientation, and the height and shape of the buildings can have a significant impact on the thermal comfort of street canyons. These factors need to be well considered when improving the thermal comfort of street canyons [16].
In winter, vegetations and the buildings can still have a significant impact on the thermal comfort of street canyons [17,18,19]. Cohen et al. (2012) pointed out that plants can reduce the air temperature during winter [18]. Cao et al. (2022) pointed out that street trees on pedestrian streets have an improvement effect on the thermal comfort of street canyons in summer and a deterioration effect on the thermal comfort of street canyons in winter [7]. Yilmaz et al. (2018) believe that deciduous trees should be given priority for improving the thermal comfort of street canyons because they can effectively block sunlight and fully utilize transpiration effects in the summer. In winter, due to the shedding of their leaves, their canopy no longer blocks sunlight from shining onto the street canyons. This is also beneficial for the thermal comfort of street canyons in winter [16]. Fan and Dong (2021) studied the thermal comfort of narrow urban street canyons in Shanxi, China. They found a “single-arch” tree-lined street canyon space had a good effect on summer thermal comfort. In addition, they found the street space can achieve good thermal comfort in winter due to reasonable coordination between the street trees and the building layout [19]. This indicates that not only the summer thermal comfort can be improved by optimizing the spatial configuration of the street canyon but also the winter thermal comfort. It is impossible to implement two different renovation plans simultaneously in the same street canyon area. In this case, a renovation plan that is beneficial for improving the summer thermal comfort of street canyons taking into account measures such as building shadows and the transpiration effect of street trees while also improving the winter thermal comfort of the street canyons considering measures like the use of buildings’ and street trees’ wind-blocking effects is very important.
Compared with the widely discussed urban summer thermal comfort challenges, people have focused less on urban winter thermal comfort improvement [20,21,22]. In addition, if people propose urban planning strategies for the improvement of the thermal comfort of street canyons only based on a single season, their strategies may not be good from the whole year’s perspective. We attempted to study the impacts of street tree configuration on the thermal comfort of street canyons during hot and cold days simultaneously. We tried to explore the impact of the urban street canyon layout on the thermal comfort. We will focus on the impact of street tree quantity, height, and canopy features (like leaf area density (LAD), crown width, crown height and canopy density) on the thermal comfort of the street canyon during hot and cold days. The LAD is defined as the total one-sided leaf area per unit volume [23,24,25]. In addition, we will also consider whether the impact of street trees on the thermal comfort of the street canyon may be different under different building features, wind speeds, and wind directions.
2. Material and Methods
2.1. Selection of the Study Time and Area
The scope of Changsha is 27°51′~28°40′ north latitude and 111°53′~114°15′ east longitude. It is located on the western margin of the Changliu Basin and far from the sea. Changsha is an important central city in the middle reaches of the Yangtze River in China and the capital of the Hunan province. By the end of 2021, the total permanent population of Changsha reached 10.2393 million [26]. According to the Köppen–Geiger climate classification updated by Beck et al. (2018), Changsha is located in Cfa of the climate classes, that is, temperate, hot summers without a dry season [27]. Its climate is a subtropical monsoon climate. It is hot in summer and cold in winter. In summer, it is often sunny continuously for several days. The sun shines fiercely and evaporation is strong. The average temperature is above 25 °C. The winter is short and cold, with an average temperature of 5–12 °C [28]. Evergreen is the main street tree type in Changsha [29]. We will use Changsha as a typical case to explore how to optimize the spatial form of street canyons in areas with hot summer and cold winter climate characteristics and evergreen trees as the main street trees. We aim to achieve the most favorable thermal comfort for hot and cold days. In this study, a section of Zhutang West Road within the scope of the Third Ring Road of Changsha was studied. The street trees in the selected road section are camphor trees. These are one of the most common street tree types in Changsha. The central urban area of Changsha is mainly composed of multi-story and high-rise buildings. The road section we selected has both high-rise and multi-story buildings on both sides, which are also very representative. Figure 1 shows the study area. We can see from the picture below that the sidewalk in this section is narrow, and the canopy of the street trees is large. The distance between the canopies of two adjacent street trees is relatively small and the street trees block the sun well.
In China, the lunar definition of four seasons is widely used [30]. Based on the lunar defining of the four seasons, the beginning of spring, summer, autumn, and winter have been dated consistently on 3–4 February; 5–6 May; 7–8 August; and 7–8 November of each year, respectively, for the last 10 years [31]. Thus, 13 May 2023 is a hot summer day and 16 December 2022 is a cold winter day. We conducted meteorological data collection using a Kestrel 5500 (Nielsen-Kellerman, Upper Chichester, PA, USA) in the Third Ring Road of Changsha City over 2 days, and used the measured data to represent the meteorological data within the Third Ring Road of Changsha City and further applied it to the research.
According to the China Meteorological Administration, a comfortable air temperature for people in summer is between 19 and 24 °C [32,33]. The air temperature we measured on 13 May 2023 from 8:00 to 18:00 was mostly higher than the highest comfortable air temperature for the human body, 24 °C. The weather was sunny and the air temperature was hot on 13 May 2023. It is necessary to fully utilize the cooling effect of road green spaces to effectively improve the thermal comfort of street canyons. This day belongs to a representative hot summer day. According to the China Meteorological Administration, the comfortable air temperature range for winter is between 12 and 22 °C [32,33]. The air temperature we measured from 10:00 to 19:00 on 16 December 2022 was below the minimum comfortable air temperature, 12 °C. The morning was relatively sunny, and the noon and afternoon were cloudy and windy. This day belongs to a representative cold winter day. In this case, measures to increase the air temperature of the street canyon can enhance the comfort of the street canyon.
2.2. Data Collection and Selection of a Thermal Comfort Index
We selected a Kestrel 5500 to collect data on the air temperature, relative humidity, wind direction, and speed in the study area. The Kestrel 5500 is a weather meter designed and produced by Nielsen-Kellerman in Boothwyn, PA, USA [34]. The accuracy of the Kestrel 5500 for the measurement of meteorological parameters is shown in Table 1 [35].
We collected the air temperature, relative humidity, wind direction, and wind speed data from fixed observation points located within the Third Ring Road of Changsha City from 8:00 to 18:00 on 13 May 2023, and from 10:00 to 19:00 on 16 December 2022. We used them as the meteorological data within the Third Ring Road of Changsha City during the research period. The instrument records data every minute. For the air temperature and relative humidity, we average the data measured within each hour and used it as the data for that hour. We used the average wind direction and speed throughout 8:00 to 18:00 on 13 May 2023, and 10:00 to 19:00 on 16 December 2022, respectively, as the input wind directions and speeds for the two different days. We used ENVI-met version 5.5.1 to conduct the simulation study since the full forcing mode in ENVI-met can report errors when the hourly wind speed and direction change considerably. This study chose the simple forcing mode for simulation due to the fact that the hourly change in wind direction and speed were relatively large in the measured data. The wind direction and speed throughout the entire research period were uniformly set as 225° and 0.42 ms−1 on 13 May 2023 and as 47.9° and 3 ms−1 on 16 December 2022. The air temperature and relative humidity data on 13 May 2023 are shown in Table 2. The air temperature and relative humidity on 16 December 2022 are shown in Table 3.
We judged the canopy diameter of trees using a Deli-EDL330060 mechanical roller diastimeter (Deli, Ningbo, China). The error between the measured and actual values of the roller diastimeter is less than 0.5% of the actual value [36]. We determined two points on the ground that could represent the positions of the two endpoints of the canopy and measured the diameter of the tree. We judged the crown width of trees on this basis. We randomly chose 12 trees in the study area. The canopies diameters of the 12 trees were measured and averaged as 9 m. The canopies diameter of the trees were uniformly set as 9 m in the simulation. We measured the heights of the 12 street trees using the direct reading height finder CGQ-1 from Huaguang Forests, Harbin, China. We judged that the height of most street trees in the study area were around 15 m. We uniformly set the street trees as 15 m in the simulation study. We analyzed the LAI of the 12 street trees using the HemiView plant canopy analyzer from Delta-T in Cambridge, the UK. The LAI is defined as the one-sided green leaf area per unit ground surface area [25,37]. We found that the average LAI of most street trees ranged from 1.8 to 3.6 m2m−2. The street tree canopies are sparse. Referring to the relevant sparse tree canopy information in ENVI-met and the canopy characteristics of the street canyon, the LAD of the street canyon was determined as 0.225 m2m−3.
PET was uniformly used to reflect thermal comfort in this study. It is defined as the corresponding air temperature when the skin temperature and internal temperature of the human body reach the same thermal state as the typical indoor environment in an indoor or outdoor environment [38]. We simulated the relevant microclimate data (mean radiant temperature, air temperature, relative humidity, wind direction and speed, etc.) in the study area using ENVI-met. We calculated the PET values using the BIO-met module in ENVI-met [39]. Elraouf et al. (2022) have verified the PET simulation results of ENVI-met are valid in their study [40]. This laid a solid foundation for future researchers to use ENVI-met to simulate PET values. The PET values for 13 May 2023 were calculated based on the default male summer clothing (male, 35 years old, height: 1.75 m, weight: 75 kg, outdoor: 0.50 clo, pre. speed: 1.34 ms−1, total metabolic rate: 86.21 W/m2). The PET value calculation for 16 December 2022 is based on the default male average clothing (male, 35 years old, height: 1.75 m, weight: 75 kg, outdoor: 0.90 clo, pre. speed: 1.34 ms−1, total metabolic rate: 86.21 W/m2). The heat balance equation below is its main basis [38]:
is the metabolic rate; represents the physical work output; is the net radiation of body; is the convective heat flow; is the latent heat flow to evaporate water into water vapor diffusing through skin; and is the sum of heat flows for heating and humidifying the inspired air. is the heat generated by sweat evaporation. represents stored heat.
By combining the following Formulas (2) and (3) with Formula (1), the core temperature of the human body, skin surface temperature, and clothing surface temperature can be calculated. These three indicators are the main indicators that determine the thermal sensation of the human body. After ascertaining these three indicators, people can know the human thermal sensation further [41,42].
is the heat flow from the core of the body to the skin, is the blood flow from the core of the body to the skin, represents the density of the blood, represents the specific heat capacity of the blood, represents the core body temperature, and represents the skin surface temperature.
is the heat flow from the skin surface to the clothing surface, represents the clothing thermal resistance, represents the skin surface temperature, and represents the clothing surface temperature.
2.3. Model Building and Simulation Analysis
From the perspective of a single tree, its height, crown width, and LAD have been highly valued by previous researchers when exploring the impact of trees on environmental thermal comfort [5,7,10]. From the perspective of the thermal comfort of the whole street canyon area, vegetation types, tree quantity, canopy density, ventilation, open space, building shadow, and wind direction and speed are some influencing factors on thermal comfort that have been highly valued by previous researchers [7,8,9,10]. In the past, researchers usually focused on the impact of these features on environmental thermal comfort only in hot or cold weather [3,4,5,6,7,8,9,10]. We explored the different effects of these factors on thermal comfort on hot and cold days at the same time by constructing different scenario models and conducting simulation analysis.
We used a Mavic Air 2 unmanned aerial vehicle designed and produced by DJI in Shenzhen, China, to take aerial pictures of the research area. We spliced the pictures using DJI Terra to form an orthograph. This can correct the geometric deformation of the pictures caused by sensors, external orientation elements, and terrain fluctuations. The shape of the orthograph is consistent with the actual situation. The scale of the different areas of the orthophoto map is consistent. The relevant orientations of each part in the orthophoto remain unchanged [43,44]. We first traced the contours of buildings and roads in AutoCAD 2008 and determined the positions of all kinds of plants in the picture. We imported the plan into SketchUp 2020 and built a three-dimensional model of the study area. Model 1 was built according to the actual conditions of the research area. The canopy of trees plays an important role in improving thermal comfort [45,46,47]. In order to better explore the different effects of tree canopy characteristics on thermal comfort, LAD, as an indicator of the leaf area per unit area, is explored to consider the different situations of tree canopy [48]. This study attempts to explore the differences in comfort level of street canyons under different LAD conditions. Street tree species is uniformly set as camphor tree for the model 1. This is one of the most common street trees in Changsha.
Xue and Li (2017) pointed out that the LADs of broadleaf trees usually range from 0.2 to 1.1 m2m−3 [49]. The studies of Turhan (2023) [50], Katul et al. (2004) [51], Chen et al. (2022) [45], Zhou et al. (2020) [52], Zhao et al. (2014) [53], Wu et al. (2016) [54], and Li (2012) [55] show the LADs of different trees are within this range. Among these studies, Zhao et al. (2014) [53]; Wang et al. (2018) [54]; and Li (2012) [55] explored the canopy features of Cinnamomum camphora and Platanus hispanica. For some studies which only provide LAI values, we refer to Lalic et al. (2004) [25] to determine the LAD based on the LAI. Based on the measured data and reference to other relevant studies [56,57,58], when the LAD of the street tree is 0.225 m2m−3, the canopy of the street tree is relatively sparse. Referring to the common range of broadleaf tree LAD values pointed out by Xue and Li (2017) [49], and combined with our actual measurement of the street tree LAI in different areas of Changsha, we ultimately determined that the LAD of a dense street tree model is uniformly set as 0.825 m2m−3. We built Model 2, which had the same feature as Model 1 except the LAD of street trees on both sides of the road was 0.825 m2m−3.
Due to the tight arrangement of street trees on the road section we are studying, it is difficult to further add street trees 15 m high and with a 9 m crown width on this basis. We selected street trees with a height of 5 m and a crown width of 3 m to construct Model 3. The trees are small. We arranged 5 m street trees whose number was near twice the number of those in Model 1 and built Model 3. These are the only differences between Models 1 and 3.
Different plant species can also have different impacts on the thermal comfort of the surrounding environment [59]. We constructed Model 4 with dense canopy trees and hedges. The hedge species was Ligustrum lucidum. This is a common hedge species in Changsha. Models 2 and 4 are almost the same except that Model 4 has hedges and Model 2 does not.
We considered rebuilding some low-rise buildings within Model 1 for the purpose of decreasing the floor area of the buildings. The building height remained unchanged. This can add air ducts. We named the amended model Model 5. We could explore the impact of the improvement of ventilation on thermal comfort in street canyons using Models 1 and 5.
We set different wind directions from Model 1 and constructed Model 6 based on it. We set the wind direction of Model 6 as 90° on 13 May 2023. This wind direction was parallel to the street direction. We set the wind direction of Model 6 as 180° on 16 December 2022. This wind direction was perpendicular to the direction of the street. Model 6 had different wind directions on summer and winter days. This was beneficial for the comparison of the thermal comfort of the street canyon under different wind directions.
The canopy width of all 15 m high street trees was set to 9 m, and the trunk height was set to 4 m. All 5 m high street trees had a uniform canopy width of 3 m and a trunk height of 1 m. When simulating based on meteorological conditions on 13 May 2023, the main differences among the six models are shown in Figure 2 and Table 4. When simulating based on meteorological conditions on 16 December 2022, the main differences among the six models are shown in Figure 3 and Table 5.
After the three-dimensional models of the study area were made in SketchUp, we used the INX plugin in SketchUp to determine the geographical coordinates of the study area, materials of the ground and buildings, and information on the plants in the area. We imported the models made in SketchUp into ENVI-met using the INX plugin. We entered the measured air temperature and relative humidity into ENVI-met. We used ENVI-met to simulate the microclimate conditions and BIO-met to simulate the PET.
2.4. Error Analysis
We analyzed the measured and simulated air temperature and relative humidity to explore the accuracy of the simulation. On 13 May 2023, the measurement point selected by us was a fixed point. The corresponding coordinate of the measurement point is (42, 43) in Model 1. After completing the simulation, we extracted the simulated air temperature and relative humidity of the observation point (42, 43) over 10 h. The height selected for reading the value of the simulation was 1.4 m. This was roughly consistent with the height of the Kestrel 5500 in the process of the actual measurement. The indicators selected by us were the coefficient of determination (R2), root mean square error (RMSE), and index of agreement (d) [60,61,62,63]:
in which is the i-th simulated value, is the i-th measured value, is the average value of the measured values, and is the number of measurements.
These three indicators have been widely used to analyze the accuracy of the simulation results in urban microclimate research [61,64,65,66]. The measured and simulated air temperature and relative humidity on 13 May 2023 are shown in Table 6. We made scatterplots to analyze the errors between the simulated values and measured values in Excel. The R2 between the measured and the simulated air temperature was 0.97, the RMSE was 0.55, and the d was 0.98. The R2 between the measured and simulated humidity was 0.96, the RMSE was 1.62, and the d was 0.99.
Except for using measured and simulated data at a height of 1.4 m for the error analysis, we chose a unified 1 m height for thermal comfort analysis in the study area. This height is relatively close to adults’ center of gravity height [67,68]. Creating a comfortable wind and heat environment involves attributing great importance to the thermal comfort of various parts of the human body at corresponding heights. This 1 m height for research can consider the feelings of various parts of the human body better [69,70].
3. Results and Discussions
3.1. Results
We further explored the impact of street greening on the thermal comfort of street canyons on hot and cold days based on existing research [3,6,7,8,9,10,11,12]. Some previous studies have focused on how one factor can maximize the improvement of thermal comfort in street canyons. For example, Huang et al. (2020) conducted research on the impact of different tree canopy covers on the thermal comfort of street canyons [11]. Our study considers many different ways to improve the thermal comfort of the street canyon simultaneously. These include using densely covered street trees to replace sparsely covered street trees, further increasing the number of street trees by selecting street trees with smaller tree heights and crown widths in limited street canyon spaces, and increasing the green space rate of the street canyon by adding low plants such as hedges or shrubs in narrow street canyons, to improve the ventilation effect of the street canyon. We tried to compare which method was more likely to significantly improve the thermal comfort of the street canyon. In addition, we also considered whether street greening would have different impact under different wind directions. Compared to previous studies that only focused on the impact of street greening on the thermal comfort of street canyons during hot days or cold days [12,20,71], this study considers the impacts of street greening on street canyons during both hot and cold days. This can help to improve the thermal comfort of street canyons more comprehensively. Compared to previous studies that only focused on thermal comfort indices such as the PET, Predicted Mean Vote (PMV), and Universal Thermal Climate Index (UTCI), or only focused on air temperature and relative humidity [7,72,73], this study considers the PET, mean radiant temperature, air temperature, relative humidity, and wind speed in the street canyon simultaneously. This helps to better explore the different impacts of different road greening characteristics on street canyons.
Deng et al. (2022) pointed out that in Changsha, when the PET value is between 24.7–27.8 °C, people will neither feel cold nor hot and the metabolic level of the body will be at its lowest level [70]. The average PET values of each model in each period are shown in Table 7 below. Figure 4 shows the average value of the PET in each model in the street canyon area.
The tree canopy is sparse (0.225 m2m−3) in Model 1, while the tree canopy is dense (0.825 m2m−3) in Model 2. This is the only difference between the two models. The average PET value in the street canyon in Model 2 is 4.6 °C lower than that in Model 1 during the 10 h. This can be attributed to a denser canopy being beneficial for fully utilizing the effect of transpiration, ventilation, and shade. This can improve the thermal comfort of street canyons in hot summer conditions [71]. This is consistent with the findings of Huang et al. (2020) on tree canopy research [11]. A dense tree canopy is beneficial for blocking sunlight [72]. The mean radiant temperature and air temperature of the tree shading area can be very low. Street trees can convert sensible heat into latent heat and release water vapor in to the air via transpiration and reduce air temperature [73]. Dense canopy trees can have a stronger transpiration effect than sparse canopy trees [74]. Dense canopy trees have better effects on increasing the relative humidity than sparse canopy trees. This is the main reason why the average relative humidity of the street canyon area of Model 2 was higher than that of Model 1. Street trees can achieve the effect of blocking wind through their canopy. Dense canopies have a stronger effect on blocking wind. When the wind speed is low, heat dissipation by the wind is also weak [75]. Although the wind speed in Model 1 is higher than Model 2, the mean radiation temperature and air temperature in Model 2 are both lower than in Model 1. In addition, the relative humidity of Model 2 is higher than Model 1. The mean radiation temperature and air temperature are believed to be the two most influential factors on human thermal sensation [72,75]. This can explain why Model 2 has a better thermal comfort than Model 1 even if the average wind speed of Model 1 is higher. Thus, improving the LAD characteristics of trees should be given priority in increasing summer thermal comfort.
The number of street trees in Model 3 is around twice that of Model 1. However, the trees in Model 3 have lower heights and crown heights than in Model 1. The canopy of the street tree in Model 3 is significantly smaller than that in Model 1. The canopy density of Model 3 is smaller than that in Model 1. In these 10 h, the average hourly PET value in Model 3 is 5.3 °C higher than that in Model 1. The PET values have the greatest difference at 16 o’clock, which is 7.4 °C. PET values have the smallest difference at 18 o’clock, which is 0.9 °C. The shadow area formed by trees is relatively small in Model 3. This results in a larger area of direct solar radiation. In addition, the transpiration effect is also weaker in Model 3 due to a short crown height and smaller canopy density. Trees with a lower canopy height have a better effect in blocking wind within the height range of 0–2 m [76]. There is an unfavorable heat dissipation environment in Model 3. Therefore, the average mean radiation temperature and air temperature in the street canyon area of Model 3 are higher than that of Model 1. The average relative humidity and wind speed in Model 3 are lower than those in Model 1. These contribute to the poor human thermal comfort in this model. Equally, 15 m street trees improve the thermal comfort in street canyons more significantly than 5 m street trees. This indicates that from the perspective of the canopy structure, tall plants with large canopy volumes have a much stronger effect on improving summer thermal comfort in street canyons than short plants with small canopy volumes. This is consistent with the noticeable negative correlation between crown width and air temperature pointed out by Huang et al. (2022) [10]. This also inspires urban designers to reasonably lay out tall street trees in street canyons based on the transpiration and shade characteristics of tall street trees.
We added a certain number of hedges in an open area on the basis of Model 2 and built Model 4. We can see from Table 7 and Figure 4 that Model 4 has the lowest PET value and the best thermal comfort. In Model 4, hedges block sunlight in the open space. This reduces the area affected by direct solar radiation. This can reduce the mean radiant temperature and air temperature in the open space area. Hedges can also increase the relative humidity due to transpiration. Low hedges can effectively block wind [76]. The average wind speed of Model 4 is smaller than that in Model 2. However, the hedges have weak effects on the wind due to their size and the low wind speed. Model 4 increased the relative humidity more efficiently than Model 1. This indicates that we can improve the thermal comfort in street canyons by adding hedges in the open area, but the effect is not obvious. The PET value in the street canyon area of Model 4 is only less than 1 °C lower than that in Model 2 each hour. The average PET value in the 10 hours is 0.38 °C lower. In a street canyon where the street trees are closely arranged, it is difficult for people to further increase the number of tall street trees. Setting low hedges in open areas can achieve a certain improvement in summer thermal comfort, which is an option to consider. However, its effect on improving summer thermal comfort is weak and will occupy a certain amount of open space. Whether to adopt this method to improve the summer thermal comfort of street canyons needs to be carefully considered based on the actual situation.
We considered demolishing some short buildings based on Model 1. We formed Model 5 with the same building heights and a smaller floor area than Model 1. The hourly average PET in the street canyon area in Model 5 slightly increased on the basis of Model 1. However, the difference between the corresponding values in the two models in each period was within 1 °C. The thermal comfort in the street canyon is deteriorated by reconstructing some large buildings into several small buildings even if this improves the ventilation. This is different from the findings found by some researchers that improving ventilation can achieve the effect of improving thermal comfort in hot summer conditions [77,78,79]. This does not mean that increasing ventilation will have a negative impact on the thermal comfort. On the one hand, due to the low average wind speed during the research period, the effect achieved by increased ventilation is not noticeable. On the other hand, demolishing some buildings can also lead to a reduction in the shadow area of the buildings. Some researchers have pointed out that thermal comfort can be significantly improved due to the shading effect of buildings [19,80,81]. Building shading is beneficial for reducing the mean radiation temperature [81]. The building area in Model 5 is relatively small. The shaded area formed by the buildings in the street canyon is also relatively small. This has a negative impact on the mean radiation temperature in the street canyon area. This is the main reason why the average mean radiation temperature of the street canyon area of Model 5 is higher than that of Model 1. The cooling effect achieved by demolishing some buildings to improve ventilation is sometimes weaker than the cooling effect achieved by blocking out sunlight and forming shaded areas [70]. The air temperature in shaded areas can be significantly reduced [74,81]. In addition, this can promote the flow of surrounding hot air into the street canyon [82]. This results in the relative humidity of the street canyon area in Model 5 being slightly lower than that in Model 1. Although the average wind speed in the street canyon area of Model 5 is slightly higher than in Model 1, the average mean radiation temperature and air temperature in the street canyon area of Model 1 are both lower than Model 5. The average relative humidity of Model 1 is higher than Model 5. The mean radiation temperature and air temperature are considered the two most influential factors that can affect human thermal sensation [72,75]. This can explain why the average PET value of Model 1 is lower than in Model 5. Therefore, the decrease in the building shadow area may have a negative impact on the thermal comfort of the street canyon.
We constructed Model 6 in the same way as Model 1 except for wind direction. The wind direction of Model 1 and Model 6 are 225° and 90°, respectively. It can be seen from Table 7 and Figure 4 that the average PET value in the street canyon area of Model 6 is 0.67 °C lower than the average PET value of Model 1 during the 10 h. This can be attributed to the fact that the wind blowing toward the roadway area in Model 1 will be blocked by buildings and roadside trees to a serious extent. This is not beneficial for reducing the air temperature [82]. The wind is parallel to the road direction in Model 6. The wind speed is high. A higher wind speed is also beneficial for increasing the relative humidity of the street canyon [82]. This is similar to what some researchers have found under suitable direction and speed winds [15,83,84,85].
We compared the simulation results of each model at 12 o’clock. Figure 5 is a plan view of the PET simulation results at a height of 1 m for each model. Each point within the simulation area has a specific PET value. The specific PET value of each point can be known based on the color of each point and the explanation of the PET value range in the legend section. The black area in the figure is the area where the building is located, so there is no specific PET value.
From the comparison of the simulation results in Model 1 and Model 2 in the picture below, we can see that the thermal comfort of the area under the trees is good compared with the surrounding environment. The PET under the street trees of Model 2 with a denser canopy is much better than that in Model 1. This is attributed to the fact that plants with a higher LAD can generate more significant transpiration and shade, improving the thermal comfort of street canyons in hot summer conditions [10].
The number of street trees in Model 3 is almost twice that in Model 2, but the canopy size of the street trees in Model 3 is significantly smaller than that in Model 2. Many small areas with good thermal comfort under the tree are formed in Model 3, but these areas are very small and the PET values are often 35.60–38.80 °C, which are much higher than those under the tree in Model 1 (29.20–35.60 °C) and Model 2 (below 29.20 °C).
The hedges in Model 4 are shown in green in Figure 5. This is the only difference between the two models. We can see from the picture that the thermal comfort in the area where the hedges are located is relatively poor. The PET values are often 42–48.4 °C, which is much higher than that (below 29.20 °C) in the area under the trees in Model 4. The effect of the hedges on thermal comfort is very limited. Tochaiwat et al. (2023) have already pointed out that tall trees always have a greater impact on the thermal comfort of the surrounding environment than shrubs [86]. This shows consistency even if they studied shrubs and we studied hedges.
The positions of the buildings in Model 1 and Model 5 are shown in the black area in the figure. By comparing the black areas in the simulation results of Model 1 and Model 5 in Figure 5, we can see that some buildings in Model 5 are relatively small, and more open spaces can help with the ventilation of street canyons. However, from Table 4 and Figure 5, we can see that the thermal comfort in Model 5 with more buildings with smaller floor areas is worse than that in Model 1. This street is an east–west street. At this time, the architectural shadow is on the north side of the building. By comparing the conditions of Model 1 and Model 5 in Figure 5, we can see that an area with good thermal comfort is formed in the area where the building shadow is located in the two models. In Model 5, the floor area of buildings on both sides of the road is smaller than that in Model 1 and the area with good thermal comfort in street canyons formed due to the building shadow is also relatively small. Rodríguez Algeciras and Matzarakis (2016) compared the effects of using ventilation and shadows to improve thermal comfort and found that using shadows to improve thermal comfort was more effective [87]. Our findings are consistent with this.
A wind direction of 90° was selected for the simulation of Model 6. The wind direction of Model 1 is 225°. This is the only difference between the two models. Compared with the impact of the LAD, crown width, and canopy density, the impact of the wind on the thermal comfort of street canyons is not quite as obvious. In Model 6, the wind blowing from the east (90°) can benefit the thermal comfort of the street canyon more due to a higher wind speed and lower blockage. In Model 1, the southeast wind (225°) is less effective in improving the thermal comfort of the street canyon, influenced by the barrier formed by buildings and trees to the wind blowing through the street canyon.
We found that the hourly average PET (Table 8 and Figure 6) in all six models was lower than the neutral PET range in Changsha (24.7–27.8 °C) pointed out by Deng et al. (2022) [70]. In this case, the closer the PET is to the neutral range, the weaker the feeling of cold in the human body.
The average PET value of Model 2 is 0.66 °C lower than Model 1 during the 9 h. The LAD is the only variable between the two models. We can find that the PET value in Model 2 is lower than that in Model 1 from 11 o’clock to 16 o’clock. This can be attributed to sufficient sunlight during the day, and the mean radiation temperature and air temperature of the sunlit area are generally higher than that of the shaded area formed by building and vegetation coverage [88]. From 17:00 to 19:00, it is almost dark. The tree canopy inhibits longwave radiative cooling [11]. This leads to a higher average mean radiation temperatures in the street canyon area in Model 2 than in Model 1 even if the average air temperature of Model 2 still lower than Model 1. The average PET of Model 2 is higher than Model 1 between 17 o’clock and 19 o’clock. The model with high LADs has a higher average relative humidity in the street canyon area [48]. Reducing the LADs of street trees is beneficial for improving the thermal comfort of street canyons during the daytime in winter. Our findings are consistent with the findings by Yang et al. (2022) that the higher the LAD, the more effectively the air temperature is reduced [14]. Model 2 with a dense tree canopy has a stronger wind resistance effect than Model 1. The average wind speed in the canyon area of Model 2 is lower. The change trend reflected by the PETs of Model 1 and Model 2 is closest to the change trend reflected by the mean radiation temperature of the two models. This also indicates that the mean radiation temperature is one of the most influential factors on human thermal sensation [72].
The average PET value of Model 3 is 1.51 °C higher than Model 1 during the 9 h. The PET in Model 3 is closest to the neutral PET range, and the human comfort is the best. This is opposite to the worst thermal comfort in Model 3 in summer. In winter, plants can increase the water vapor in the air through transpiration and block sunlight. This can make street canyons colder [71]. The transpiration caused by the smaller canopy of 5 m roadside trees is relatively weak, and there are relatively few areas that block sunlight. The lower canopy height is beneficial for blocking wind near the ground. This can explain why Model 3 has the lowest overall average PET. In colder weather conditions in winter, an increased air temperature is needed in the street canyon to improve the comfort level [75]. Model 3, with the lowest canopy density, has the highest average mean radiation temperature and air temperature in the street canyon area. This can be attributed to the mean radiation temperature and air temperature of the sunlit area being generally higher than that of the shaded area formed by building and vegetation coverage during the day [88]. In addition, short trees and a low canopy density have a weak transpiration effect [73]. Although the crowns of the street trees in Model 3 are smaller, the starting height of the crowns of the street trees in Model 3 are shorter. This is beneficial for blocking wind at the height of 0–2 m. We found that the average wind speed at a height of 1 m in the street canyon area of Model 3 is lower than that of Model 1. The high PET value of Model 3 can be attributed to its high mean radiant temperature and air temperature and low relative humidity and wind speed.
The impact of hedges on the thermal comfort of street canyons can be explored by comparing the simulation results of Models 2 and 4. The average PET value of Model 4 is almost the same as Model 2. Although the hedge in Model 4 can block out sunlight, this results in a smaller area of direct solar radiation. This can result in a lower mean radiation temperature [72]. The average mean radiant temperature of Model 4 is higher than that of Model 2 due to hedges inhibiting longwave radiative cooling from the surface [11]. Hedges can reduce the air temperature of the surrounding environment during winter days due to them blocking sunlight and having a transpiration effect [74]. The average relative humidity of Model 4 is higher than that of Model 2 due to the hedges also increasing the relative humidity due to transpiration [74]. Near the ground, 2 m hedges have a good wind blocking effect. The average wind speed of Model 4 is lower than that of Model 2. Reducing the wind speed is beneficial for the thermal comfort of the street canyon in winter [74]. In addition, the hedges are small in size, and this makes their influence weak. Although the street canyon area in Model 4 shows good thermal comfort during summer compared to Model 2, in winter, the hedges in Model 4 do not have a noticeable impact on the comfort level of the street canyon area.
The average PET value of Model 5 is 0.22 °C higher than Model 1 during the 9 h. Model 5 has a smaller building area than Model 1. This is more conducive to ventilation. In addition, Model 5 also has smaller shaded areas. Model 5 shows higher average PET values than Model 1. The mean radiation temperature and air temperature of the sunlit area is generally higher than that of the shaded area formed by the buildings [88]. The mean radiant temperature and air temperature of Model 5 is higher than those in Model 1. The average relative humidity of Model 5 is lower than Model 1. A larger area of direct sunlight can contribute to a lower relative humidity in Model 5 [89]. In cold winter, when there is strong wind in the area, their narrowness generates a more significant effect when the wind blows through street canyons. This leads to a rapid increase in wind speed in the street canyons [90]. Adding an open space at this time is beneficial for reducing the effect of the narrow space. This can be used to explain why the average wind speed in the street canyon area of Model 5 is lower than that of Model 1. The average mean radiant temperature and air temperature of the street canyon area of Model 5 is higher than those of Model 1. The relative humidity and wind speed of Model 5 are lower than Model 1. These can explain why the PET value of Model 5 is lower than Model 1. The overall comfort of Model 5 is relatively good in winter. Habib et al. (2015) also found that building shadows can have a significant impact on the thermal comfort of street canyons during hot and cold days. This also supports our viewpoint [91].
The average PET value of Model 6 is 1.33 °C higher than Model 1 during the 9 h. The only difference between Model 1 and Model 6 is the wind direction. The wind direction is 47.9° in Model 1 and 180° in Model 6. The simulated wind speeds in Models 1 and 6 are both 3 ms−1. This is much higher than the simulated wind speed on 13 May 2023. The better thermal comfort of Model 6 can be attributed to the good blocking effect of buildings on both sides of the street on the cold air blown. In Model 6, the wind direction is perpendicular to the street direction. The buildings and roadside trees on both sides of the street have a good wind resistance effect. The average mean radiation temperature and air temperature of the street canyon area of Model 6 re lower than in Model 1. This is consistent with the significant impact of the wind environment on the mean radiation temperature pointed out by Sangkertadi and Syafriny (2016) [92]. The effect of water evaporation is weak [93]. The average relative humidity in the street canyon area in this model is relatively low. The average wind speed of the street canyon area of Model 6 is lowest among the six models since buildings and trees play quite positive roles in blocking the wind in this model. This means that fully utilizing the wind resistance effect of buildings and trees is beneficial for improving the comfort level of street canyons in winter.
Figure 7 shows a plan view of the simulation results of each model within the study area at 17:00, 16 December 2022. On a cold winter day, it is necessary to increase the PET value of the street canyons to achieve the goal of improving thermal comfort. In general, the enclosed area formed by buildings and trees shows a relatively better thermal comfort than open areas at the outskirts of the research area. This shows the importance of buildings and trees in blocking the wind during cold and windy winter days. From the following figure, it can be seen that the areas with higher PETs in each model appear on both sides of the building. This is due to wind resistance. The areas where the road green space is located show a relatively lower PET value than the surrounding environment. Based on the analysis of the average PETs of the street canyon areas in the six models, we did not find warming effects of the green space in winter as pointed out by some researchers [94,95,96]. Although street trees can decrease winter thermal comfort by blocking sunlight and transpiration [57,58], their effect on blocking the wind should not be neglected. Buildings can effectively block wind blowing from the south (180°) into the street canyon. The thermal comfort in the street canyon of Model 6 is better than Model 1 with a wind direction of 47.9°. Model 6 shows a larger area of relatively good thermal comfort (PET 12–13.6 °C) than Model 1. This indicates to us that we can think more about how to improve the winter thermal comfort of the street canyon by optimizing the building layout as well as the building–tree arrangement.
3.2. Discussion
Table 9 shows the advantages and disadvantages of the building and tree features in relation to the thermal comfort of the street canyon area during hot and cold days. Although the dense distribution of road green spaces may effectively block sunlight and increase moisture on hot days, this type of green space layout may worsen the thermal comfort of the street canyon due to its good cooling effect on cold days. The buildings and green spaces in the street canyon area need to be considered simultaneously to form an optimal street canyon spatial form and achieve good thermal comfort throughout the year.
Whether in hot or cold weather, street trees have a certain cooling effect. Street trees with high tree heights and large and dense canopies can have a good cooling effect in summer and are beneficial for summer thermal comfort. However, such street trees are not conducive to improving winter thermal comfort in the street canyon. When the street trees in the street canyon are short, with small and sparse tree crowns, the street canyon has relatively good thermal comfort in winter, while the street canyon has poor thermal comfort in summer. Given that evergreen trees can produce good cooling effects in both summer and winter, prioritizing deciduous trees for street trees in hot summer and cold winter areas is beneficial for improving the comfort of hot and cold weather.
A reasonable arrangement of a certain number of short hedges can achieve cooling effects in summer by blocking sunlight and transpiration. In winter, low hedges can provide excellent wind protection at pedestrian heights. The wind-proofing effect of hedges can also weaken the cooling effect of the street canyon area affected by the environment. We suggest arranging low hedges in open areas to fully utilize their potential.
The existence of certain open spaces between buildings can facilitate ventilation. A well-ventilated environment is conducive to cooling. The design of tall buildings with large building base areas is more conducive to forming building shadows to block sunlight in summer and improve thermal comfort. In cold weather, the building can generally produce good wind resistance, making the thermal comfort of the street canyon area superior to other open spaces. However, having a certain amount of open space between buildings is also beneficial for increasing the area with direct sunlight, which may further increase the temperature of the street canyon area and improve the thermal comfort of the street canyon in winter.
Considering this, we should reduce the air temperature of the street canyon on hot days to improve the thermal comfort, while increasing the air temperature in winter to improve the thermal comfort of street canyons. We believe that there is no spatial pattern of street canyons that can achieve the goal of reducing the temperature as much as possible in summer and increasing the temperature as much as possible in winter. We believe that improving the thermal comfort of the street canyon on hot and cold days by improving the green space and buildings on both sides is more of a trade-off, that is, trying to have a greater positive impact on the thermal comfort of hot or cold days while minimizing the negative impact on the thermal comfort of cold or hot days. Our research is beneficial for guiding future researchers to consider how to fully utilize various cooling and heating conditions and make the overall thermal comfort of the street canyon better throughout the year. Due to differences in conditions like annual average temperature, dominant wind direction, street direction, street width, building height, and street tree species among different street canyons, there is no single good street canyon spatial form that can suit all street canyon areas.
4. Conclusions
It is important to improve the thermal comfort of urban street areas which many people pass by every day. Many researchers have conducted research on how to improve the thermal comfort of street canyons [3,6,7,8,9,10,11,12,19,20,21]. Many studies only focus on improving the summer or winter thermal comfort of street canyons. We selected a section of Zhutang West Road in the central urban area of Changsha for our research. We used the microclimate simulation software ENVI-met 5.5.1 to construct different models for comparative simulation research. Camphor trees as an evergreen tree species was selected as the main street trees for the research. We selected PET as the thermal comfort indicator. In addition, we also analyzed the corresponding mean radiant temperature, air temperature, relative humidity, and wind speed. We selected a hot day (13 May 2023) and a cold day (16 December 2022) to study. We found that on the hot day, Model 2, which had tall trees, large canopies, and dense leaves, could effectively cool down the street canyon by blocking sunlight and having a transpiration effect. The average PET value of this model is 31.5 °C. This is lower than the PET value of Model 1 with tall trees and large and sparse canopies (36.2 °C) and Model 3 with a large number of short street trees with small crowns, and sparse leaves (31.1 °C). Short trees have a certain cooling effect, but this is weaker. Our simulation did not achieve the expected goal of adding open spaces to improve ventilation to enhance summer thermal comfort in the street canyon. Model 5 with a smaller building base area and better ventilation has almost the same thermal comfort condition as the model with a greater building base area and poor ventilation. The average PETs of the two models are both 36.2 °C. This is due to the decrease in the building shadow area for Model 5 and this is not beneficial for the thermal comfort. This also indicates that when exploring the improvement of the spatial structure of the street canyon to improve thermal comfort, building shadows and ventilation effects are two factors that need to be considered simultaneously. The wind parallel to the direction of the street canyon promotes wind flow through the street canyon due to lower barriers. This is beneficial for the thermal comfort of the street canyon in summer. This can be used to explain why Model 6 with a wind direction parallel to the street can have a lower PET value than Model 1 with a wind direction of 225°. The average PET value of Model 6 during the study period on 13 May 2023 was 35.5 °C and the value was 36.2 °C for Model 1. In winter, tall trees, large canopies, and dense leaves still have a significant cooling effect in Model 2. This cannot achieve the goal of improving the thermal comfort of street canyons. On the contrary, the short, small, and sparse roadside trees in Model 3 have a weaker transpiration effect. This results in smaller shadow areas that block sunlight. In addition, tree crowns also have a certain degree of wind resistance. The average PET value of Model 2 during the study period was 13.3 °C and the value was 15.4 °C for Model 3. The overall thermal comfort of the models with small trees and hedges in the street canyons were relatively good. By demolishing some buildings in the street canyon, open spaces can be added. This is beneficial for reducing the shadow area of buildings and improving the thermal comfort of the street canyon in winter. In addition, increasing the open space on both sides of the road can be beneficial for weakening the effect of narrow, reducing wind speed, and improving the thermal comfort of the street canyon. Blocking the wind blowing into the street canyon through building spaces is beneficial for reducing the wind speed and improving the thermal comfort of the street canyon in winter. These factors can be used to explain why the average PET value of Model 5 (14.2 °C) was higher than the average PET value of Model 1 (13.9 °C).
Our comparative research confirms that street canyon green space and building layouts that have good cooling effects on hot days also produce good cooling effects in cold days. This results in relatively poor thermal comfort in the street canyon in winter. We argue it is quite important to highly value the impact of building and tree layouts on the thermal comfort of street canyons on hot and cold days at the same time, especially for those cities with hot summers and cold winters. We should make trade-offs among different street canyon spatial patterns based on the thermal comfort of the street canyon during hot and cold days at the same time. We should try to maximize the advantages and minimize the disadvantages. Since different street canyon environments have different specific situations, like dominant wind directions and speeds, building heights, street widths, tree canopy densities, and so on, no one optimization strategy can suit all different environment. We suggest following research highlighting the thermal comfort on hot and cold days at the same time and formulating an optimization strategy based on the specific situations for different street canyons.
Author Contributions
Conceptualization, J.L.; methodology, J.L. and B.Z.; software, J.L.; validation, J.L.; formal analysis, J.L. and B.Z.; investigation, J.L.; resources, J.L. and F.Y.; data curation, J.L. and F.Y.; writing—original draft preparation, J.L.; writing—review and editing, J.L., B.Z. and F.Y.; visualization, J.L.; supervision, F.Y. and B.Z.; project administration, J.L. and F.Y.; funding acquisition, B.Z., F.Y. and J.L. All authors have read and agreed to the published version of the manuscript.
Funding
This research was funded by the Natural Science Foundation of Hunan Province (2023JJ30693), Hunan Provincial Innovation Foundation for Postgraduates (CX20230091), and for the Postgraduate Independent Exploration and Innovation Program of Central South University (2023ZZTS0001).
Data Availability Statement
The data presented in this study are available on request from the corresponding author.
Conflicts of Interest
The authors declare no conflict of interest.
References
- Wu, J. Urban ecology and sustainability: The state-of-the science and future directions. Landsc. Urban Plan. 2014, 125, 209–221. [Google Scholar] [CrossRef]
- Hwang, R.L.; Lin, C.Y.; Huang, K.T. Spatial and temporal analysis of urban heat island and global warming on residential thermal comfort and cooling energy in Taiwan. Energy Build. 2017, 152, 804–812. [Google Scholar] [CrossRef]
- Ren, Z.B.; Zhao, H.B.; Fu, Y.; Xiao, L.; Dong, Y.L. Effects of urban street trees on human thermal comfort and physiological indices: A case study in Changchun city, China. J. For. Res. 2022, 33, 911–922. [Google Scholar] [CrossRef]
- IPCC. 2023: Sections. In Climate Change 2023: Synthesis Report. Contribution of Working Groups I, II and III to the Sixth Assessment Report of the Intergovernmental Panel on Climate Change; Core Writing Team, Lee, H., Romero, J., Eds.; IPCC: Geneva, Switzerland, 2023; pp. 35–115. [Google Scholar] [CrossRef]
- Zhao, Q.; Guo, Y.; Ye, T.; Gasparrini, A.; Tong, S.; Overcenco, A.; Urban, A.; Schneider, A.; Entezari, A.; Vicedo-Cabrera, A.M.; et al. Global, regional, and national burden of mortality associated with non-optimal ambient temperatures from 2000 to 2019: A three-stage modelling study. Lancet Planet Health 2021, 5, e415–e425. [Google Scholar] [CrossRef] [PubMed]
- Martini, A.; Biondi, D.; Batista, A.C. Thermal comfort provided by street trees in cities. Arboric. J. 2020, 42, 153–164. [Google Scholar] [CrossRef]
- Cao, L.S.; Xu, H.; Li, H. Effect of Greening Trees on Thermal Comfort of the Pedestrian Streets in Hot Summer and Cold Winter Regions in China. Nat. Environ. Pollut. Technol. 2022, 21, 1543–1552. [Google Scholar] [CrossRef]
- Li, Z.; Zhang, H.; Juan, Y.-H.; Lee, Y.-T.; Wen, C.-Y.; Yang, A.-S. Effects of urban tree planting on thermal comfort and air quality in the street canyon in a subtropical climate. Sustain. Cities Soc. 2023, 91, 104334. [Google Scholar] [CrossRef]
- Narimani, N.; Karimi, A.; Brown, R.D. Effects of street orientation and tree species thermal comfort within urban canyons in a hot, dry climate. Ecol. Inform. 2022, 69, 101671. [Google Scholar] [CrossRef]
- Cheng, Y.; Huang, Z.; Guo, Y.; Cheng, W.; Wu, C. Tree Canopy Characteristics Affect Street Canyon’s Microclimate Conditions and Human Thermal Comfort in Hot-Humid Climate. In Climate Change and Environmental Sustainability. Advances in Science, Technology & Innovation; He, B.J., Prasad, D., Pignatta, G., Jupesta, J., Eds.; Springer: Cham, Switzerland, 2022. [Google Scholar] [CrossRef]
- Huang, Z.; Wu, C.; Teng, M.; Lin, Y. Impacts of Tree Canopy Cover on Microclimate and Human Thermal Comfort in a Shallow Street Canyon in Wuhan, China. Atmosphere 2020, 11, 588. [Google Scholar] [CrossRef]
- Zheng, B.; Bernard Bedra, K.; Zheng, J.; Wang, G. Combination of Tree Configuration with Street Configuration for Thermal Comfort Optimization under Extreme Summer Conditions in the Urban Center of Shantou City, China. Sustainability 2018, 10, 4192. [Google Scholar] [CrossRef]
- Cui, P.; Jiang, J.J.; Zhang, J.; Wang, L. Effect of street design on uhi and energy consumption based on vegetation and street aspect ratio: Taking harbin as an example. Sust. Cities Soc. 2023, 92, 29. [Google Scholar] [CrossRef]
- Yang, Y.J.; Zhou, D.A.; Gao, W.J.; Zhang, Z.H.; Chen, W.; Peng, W.C.Y. Simulation on the impacts of the street tree pattern on built summer thermal comfort in cold region of China. Sustain. Cities Soc. 2018, 37, 563–580. [Google Scholar] [CrossRef]
- Morakinyo, T.E.; Lam, Y.F. Simulation study on the impact of tree-configuration, planting pattern and wind condition on street-canyon’s micro-climate and thermal comfort. Build. Environ. 2016, 103, 262–275. [Google Scholar] [CrossRef]
- Yilmaz, S.; Mutlu, E.; Yilmaz, H. Quantification of thermal comfort based on different street orientation in winter months of urban city Dadaşkent (Conference Paper). Acta Hortic. 2018, 1215, 67–72. [Google Scholar] [CrossRef]
- Chan, S.Y.; Chau, C.K. On the study of the effects of microclimate and park and surrounding building configuration on thermal comfort in urban parks. Sust. Cities Soc. 2021, 64, 13. [Google Scholar] [CrossRef]
- Cohen, P.; Potchter, O.; Matzarakis, A. Daily and seasonal climatic conditions of green urban open spaces in the Mediterranean climate and their impact on human comfort. Build. Environ. 2012, 51, 285–295. [Google Scholar] [CrossRef]
- Fan, Y.; Dong, L. Analysis of Winter Microclimate Test of “Single Arch” Tree-lined Street Valley Space in Xi’an City Street. Chinese Landsc. 2022, 38, 115–120. [Google Scholar] [CrossRef]
- Huang, H.; Peng, M. The outdoor thermal comfort of urban square: A field study in a cold season in Chongqing. In IOP Conference Series: Earth and Environmental Science; IOP Publishing: Bristol, UK, 2020; Volume 467, p. 012215. [Google Scholar] [CrossRef]
- He, X.C.; Gao, W.J.; Wang, R.; Yan, D.Y. Study on outdoor thermal comfort of factory areas during winter in hot summer and cold winter zone of China. Build. Environ. 2023, 228, 12. [Google Scholar] [CrossRef]
- Ebrahimabadi, S.; Nilsson, K.L.; Johansson, C. The problems of addressing microclimate factors in urban planning of the subarctic regions. Environ. Plan. B-Plan. Des. 2015, 42, 415–430. [Google Scholar] [CrossRef]
- Chen, Q.; Baldocchi, D.; Gong, P.; Kelly, M. Isolating individual trees in a savanna woodland using small footprint lidar data. Photogramm. Eng. Remote Sens. 2006, 72, 923–932. [Google Scholar]
- Rouzbeh Kargar, A.; MacKenzie, R.; Asner, G.P.; van Aardt, J. A Density-Based Approach for Leaf Area Index Assessment in a Complex Forest Environment Using a Terrestrial Laser Scanner. Remote Sens. 2019, 11, 1791. [Google Scholar] [CrossRef]
- Lalic, B.; Mihailovic, D.T. An empirical relation describing leaf-area density inside the forest for environmental modeling. J. Appl. Meteorol. 2004, 43, 641–645. [Google Scholar] [CrossRef]
- Changsha Municipal Government. Overview of Changsha. 2022. Available online: http://www.changsha.gov.cn/xfzs/zjmlzs/zsgl/200907/t20090727_5686409.html?ivk_sa=1024320u (accessed on 13 May 2023).
- Beck, H.E.; Zimmermann, N.E.; McVicar, T.R.; Vergopolan, N.; Berg, A.; Wood, E.F. Present and future Köppen-Geiger climate classification maps at 1-km resolution. Sci. Data 2018, 5, 180214. [Google Scholar] [CrossRef] [PubMed]
- Xiang, J.; Liu, H. Study on Optimal Design of Exterior Sunshade for Residential Buildings in Hot Summer and Cold Winter Zone. Build. Sci. 2016, 32, 80–84+126. [Google Scholar] [CrossRef]
- Wang, X. Investigation, Analysis and Evaluation of Street Trees in Changsha City. In Proceedings of the Third China Forestry Academic Conference, Fuzhou, China, 12–13 September 2013. [Google Scholar]
- Jiang, H.; Zhu, M.; Li, J.; Zhong, L.; Su, X.; Feng, Z.; Qi, Y.; Zhang, X. Data Mining Based on Chinese Traditional Calendar in the Han Dynasty Yang Mausoleum Museum. Appl. Sci. 2019, 9, 5442. [Google Scholar] [CrossRef]
- Ren, X. Chinese Folk Perpetual Calendar; China Commercial Publishing House: Beijing, China, 2012. [Google Scholar]
- The Central People’s Government of the people’s Republic of China. Meteorological Science Popularization: Why Does Comfort Feel Different at the Same Temperature. 2007. Available online: https://www.gov.cn/govweb/fwxx/kp/2007-04/06/content_573324.htm (accessed on 30 September 2023).
- China Meteorological Administration. What Is a High-Temperature Heat Wave? 2011. Available online: https://www.cma.gov.cn/2011qxfw/2011qqxkp/2011qkpdt/201110/t20111026_124192.html#:~:text=%E4%BA%BA%E7%9A%84%E6%AD%A3%E5%B8%B8%E4%BD%93%E6%B8%A9%E5%A4%A7%E7%BA%A6,%E5%BF%8D%E8%80%90%E6%9E%81%E9%99%90%EF%BC%8C%E9%80%A0%E6%88%90%E6%AD%BB%E4%BA%A1%E4%BA%8B%E6%95%85%E3%80%82 (accessed on 30 September 2023).
- Kestrel Instruments. Company History. 2023. Available online: https://kestrelinstruments.com/company-history (accessed on 13 May 2023).
- Kestrel Instruments. Kestrel 5500 Weather Meter. Available online: https://kestrelinstruments.com/kestrel-5500-weather-meter (accessed on 6 July 2023).
- Deli. Product Details. 2023. Available online: https://www.deli-tools.com/productinfo/info/53938.html (accessed on 13 May 2023).
- Watson, D.J. Comparative physiological studies on the growth of field crops: I. Variation in net assimilation rate and leaf area between species and varieties and within and between years. Ann. Bot. 1947, 11, 41–76. [Google Scholar] [CrossRef]
- Höppe, P. The physiological equivalent temperature—A universal index for the biometeorological assessment of the thermal environment. Int. J. Biometeorol. 1999, 43, 71–75. [Google Scholar] [CrossRef]
- ENVI-met. Microclimate Model Calculations: Exploring the Comprehensive Analysis. 2023. Available online: https://www.envi-met.com/zh-hans/%E8%BD%AF%E4%BB%B6%E4%BA%A7%E5%93%81/ (accessed on 5 May 2023).
- Elraouf, R.A.; ELMokadem, A.; Megahed, N.; Eleinen, O.A.; Eltarabily, S. Evaluating urban outdoor thermal comfort: A validation of ENVI-met simulation through field measurement. J. Build. Perform. Simul. 2022, 15, 268–286. [Google Scholar] [CrossRef]
- Ji, T.; Yuan, W.; Wang, K.; Ji, L. Perspective on thermal sensation in sports under thermal environment. China Sport Sci. Technol. 2022, 4, 73–80. [Google Scholar]
- Krüger, E.; Rossi, F.; Drach, P. Calibration of the physiological equivalent temperature index for three different climatic regions. Int. J. Biometeorol. 2017, 61, 1323–1336. [Google Scholar] [CrossRef]
- Lin, J.; Cang, G. Photogrammetry; National Defense Industry Press: Beijing, China, 2006. [Google Scholar]
- Liu, K.; Zhou, J.; Liu, Y.; Zeng, P.; Xin, W.; Liu, K.; Zhao, Z. Accuracy Analysis of Multitemporal Image-free Orthographic of Consumer Aerial Survey. J. Univ. South China (Sci. Technol.) 2022, 36, 71–78. [Google Scholar]
- Chen, Y.; Liu, J.; Yao, X.; Deng, Y.; Hao, Z.; Lin, L.; Wu, N.; Yu, K. Effect of layer thickness and voxel size inversion on leaf area density based on the voxel-based canopy profiling method. J. For. Res. 2022, 33, 1545–1558. [Google Scholar] [CrossRef]
- Middel, A.; Selover, N.; Hagen, B.; Chhetri, N. Impact of shade on outdoor thermal comfort—A seasonal field study in Tempe, Arizona. Int. J. Biometeorol. 2016, 60, 1849–1861. [Google Scholar] [CrossRef] [PubMed]
- Ornelas, A.; Cordeiro, A.; Lameiras, J.M. Thermal Comfort Assessment in Urban Green Spaces: Contribution of Thermography to the Study of Thermal Variation between Tree Canopies and Air Temperature. Land 2023, 12, 1568. [Google Scholar] [CrossRef]
- Kang, G.; Kim, J.J. Effects of Vertical Forests on Air Quality in Step-up Street Canyons. Sustain. Cities Soc. 2023, 94, 14. [Google Scholar] [CrossRef]
- Xue, F.; Li, X. The impact of roadside trees on traffic released PM10 in urban street canyon: Aerodynamic and deposition effects. Sustain. Cities Soc. 2017, 30, 195–204. [Google Scholar] [CrossRef]
- Turhan, C.; Atalay, A.S.; Gokcen Akkurt, G. An Integrated Decision-Making Framework for Mitigating the Impact of Urban Heat Islands on Energy Consumption and Thermal Comfort of Residential Buildings. Sustainability 2023, 15, 9674. [Google Scholar] [CrossRef]
- Katul, G.G.; Mahrt, L.; Poggi, D.; Sanz, C. ONE- and TWO-Equation Models for Canopy Turbulence. Bound. Layer Meteorol. 2004, 113, 81–109. [Google Scholar] [CrossRef]
- Zhou, M.; Gao, F.; Ma, K. Research on Species Optimization of Typical Road Trees in Beijing Based on ENVI-met. Chin. Landsc. Archit. 2020, 36, 141–144. [Google Scholar]
- Zhao, Y.; Kan, L.; Che, S. A Preliminary Study about Common Garden Plants’ Effect of Carbon Fixation and Oxygen Release in Shanghai’s Community and Optimal Arrangement. J. Shanghai Jiaotong Univ. Agric. Sci. 2014, 32, 45–53. [Google Scholar]
- Wu, Z.; Kong, F.; Wang, Y.; Sun, R.; Chen, L. The Impact of Greenspace on Thermal Comfort in a Residential Quarter of Beijing, China. Int. J. Environ. Res. Public Health 2016, 13, 1217. [Google Scholar] [CrossRef]
- Li, B. The Study on Common Street Trees Fixing Carbon and Releasing Oxygen Sluggish Dust Benefits in Changsha. Master’s Thesis, Central South University of Forestry and Technology, Changsha, China, 2012. [Google Scholar]
- Bréda, N.J.J. Ground-based measurements of leaf area index:: A review of methods, instruments and current controversies. J. Exp. Bot. 2003, 54, 2403–2417. [Google Scholar] [CrossRef] [PubMed]
- Segura, R.; Krayenhoff, E.S.; Martilli, A.; Badia, A.; Estruch, C.; Ventura, S.; Villalba, G. How do street trees affect urban temperatures and radiation exchange? Observations and numerical evaluation in a highly compact city. Urban Clim. 2022, 46, 101288. [Google Scholar] [CrossRef]
- Teng, R.; Liu, G.; Chen, X.; Li, C.; Wang, Z. Study on the effect of solar radiation on the mean radiant temperature and PMV in winter. J. Qingdao Univ. Technol. 2023, 41, 95–102. [Google Scholar]
- Sayad, B.; Alkama, D.; Rebhi, R.; Menni, Y.; Ahmad, H.; Inc, M.; Sharifpur, M.; Lorenzini, G.; Azab, E.; Elnaggar, A.Y. Outdoor Thermal Comfort Optimization through Vegetation Parameterization: Species and Tree Layout. Sustainability 2021, 13, 11791. [Google Scholar] [CrossRef]
- Chicco, D.; Warrens, M.J.; Jurman, G. The coefficient of determination R-squared is more informative than SMAPE, MAE, MAPE, MSE and RMSE in regression analysis evaluation. Peer J Comput. Sci. 2021, 7, e623. [Google Scholar] [CrossRef]
- Tsoka, S.; Tsikaloudaki, A.; Theodosiou, T. Analyzing the ENVI-met microclimate model’s performance and assessing cool materials and urban vegetation applications—A review. Sustain. Cities Soc. 2018, 43, 55–76. [Google Scholar] [CrossRef]
- Willmott, C.J. On the validation of models. Phys. Geogr. 1981, 2, 184–194. [Google Scholar] [CrossRef]
- Willmott, C.J.; Robeson, S.M.; Matsuura, K. A refined index of model performance. Int. J. Climatol. 2012, 32, 2088–2094. [Google Scholar] [CrossRef]
- Zhu, S.J.; Causone, F.; Gao, N.P.; Ye, Y.; Jin, X.; Zhou, X.; Shi, X. Numerical simulation to assess the impact of urban green in-frastructure on building energy use: A review. Build. Environ. 2023, 228, 20. [Google Scholar] [CrossRef]
- Lam, C.K.C.; Lee, H.; Yang, S.R.; Park, S. A review on the significance and perspective of the numerical simulations of outdoor thermal environment. Sust. Cities Soc. 2021, 71, 30. [Google Scholar] [CrossRef]
- Liu, J.; Tang, H.; Zheng, B. Simulation study of summer microclimate in street space of historic conservation areas in China: A case study in Changsha. Front. Environ. Sci. 2023, 11, 1146801. [Google Scholar] [CrossRef]
- Chi, M.; Dan, J. Chinese Grow in Height Rankings. 2016. Available online: https://www.chinadaily.com.cn/china/2016-07/27/content_26242508.htm (accessed on 7 March 2023).
- NCD Risk Factor Collaboration. A century of trends in adult human height. eLife 2016, 5, e13410. [Google Scholar] [CrossRef]
- Lu, G.; Hu, Y.; Yang, Z.; Zhang, Y.; Lu, S.; Gong, S.; Li, T.; Shen, Y.; Zhang, S.; Zhuang, H. Geographic latitude and human height statistical analysis and case studies from China. Arab. J. Geosci. 2022, 15, 335. [Google Scholar] [CrossRef]
- Deng, Y.; Gan, D.; Tang, N.; Cai, Z.; Li, X.; Chen, S.; Li, X. Research on Outdoor Thermal Comfort and Activities in Residential Areas in Subtropical China. Atmosphere 2022, 13, 1357. [Google Scholar] [CrossRef]
- Boukhabl, M.; Alkam, D. Impact of vegetation on thermal conditions outside, thermal modeling of urban microclimate, case study: The street of the Republic, Biskra. Energy Procedia 2012, 18, 73–78. [Google Scholar] [CrossRef]
- Liu, J.; Tang, H.; Zheng, B.; Sun, Z. A Study on the Summer Microclimate Environment of Public Space and Pedestrian Commercial Streets in Regions with Hot Summers and Cold Winters. Appl. Sci. 2023, 13, 5263. [Google Scholar] [CrossRef]
- Berardi, U.; Jandaghian, Z.; Graham, J. Effects of greenery enhancements for the resilience to heat waves: A comparison of analysis performed through mesoscale (WRF) and microscale (Envi-met) modeling. Sci. Total. Environ. 2020, 747, 141300. [Google Scholar] [CrossRef]
- Wang, Z.; Li, Y.; Song, J.; Wang, K.; Xie, J.; Chan, P.W.; Ren, C.; Di Sabatino, S. Modelling and optimizing tree planning for urban climate in a subtropical high-density city. Urban CLim. 2022, 43, 101141. [Google Scholar] [CrossRef]
- Darbani, E.S.; Rafieian, M.; Parapari, D.M.; Guldmann, J.M. Urban design strategies for summer and winter outdoor thermal comfort in arid regions: The case of historical, contemporary and modern urban areas in Mashhad, Iran. Sustain. Cities Soc. 2023, 89, 104339. [Google Scholar] [CrossRef]
- Li, J.Y.; Zheng, B.H.; Ouyang, X.; Chen, X.; Bedra, K.B. Does shrub benefit the thermal comfort at pedestrian height in Singapore? Sustain. Cities Soc. 2021, 75, 10. [Google Scholar] [CrossRef]
- Hong, B.; Lin, B.R. Numerical studies of the outdoor wind environment and thermal comfort at pedestrian level in housing blocks with different building layout patterns and trees arrangement. Renew. Energy 2015, 73, 18–27. [Google Scholar] [CrossRef]
- Müller, N.; Kuttler, W.; Barlag, A.B. Counteracting urban climate change: Adaptation measures and their effect on thermal comfort. Theor. Appl. Climatol. 2014, 115, 243–257. [Google Scholar] [CrossRef]
- Jang, G.; Kim, S.; Lee, J. Planning scenarios and microclimatic effects: The case of high-density riverside residential districts in Seoul, South Korea. Build. Environ. 2022, 223, 109517. [Google Scholar] [CrossRef]
- Goldberg, V.; Kurbjuhn, C.; Bernhofer, C. How relevant is urban planning for the thermal comfort of pedestrians? Numerical case studies in two districts of the City of Dresden (Saxony/Germany) (Article). Meteorol. Z. 2013, 22, 739–751. [Google Scholar] [CrossRef]
- Acero, J.A.; Koh, E.J.Y.; Tan, Y.S.; Norford, L.K. Quantifying the Effect of Building Shadowing and Cloudiness on Mean Radiant Temperature in Singapore. Atmosphere 2021, 12, 1012. [Google Scholar] [CrossRef]
- Heaviside, C.; Cai, X.M.; Vardoulakis, S. The effects of horizontal advection on the urban heat island in birmingham and the west midlands, united kingdom during a heatwave. Q. J. R. Meteorol. Soc. 2015, 141, 1429–1441. [Google Scholar] [CrossRef]
- Zhang, C.; Wang, Q.; Chan, P.; Ren, C.; Li, Y. The effect of background wind on summertime daily maximum air temperature in Kowloon, Hong Kong. Build. Environ. 2022, 210, 108693. [Google Scholar] [CrossRef]
- Al-Obaidi, I.; Rayburg, S.; Półrolniczak, M.; Neave, M. Assessing the Impact of Wind Conditions on Urban Heat Islands in Large Australian Cities. J. Ecol. Eng. 2021, 22, 1–15. [Google Scholar] [CrossRef]
- Lopes, A.; Alves, E.; Alcoforado, M.J.; Machete, R. Lisbon Urban Heat Island Updated: New Highlights about the Relationships between Thermal Patterns and Wind Regimes. Adv. Meteorol. 2013, 2013, 487695. [Google Scholar] [CrossRef]
- Tochaiwat, K.; Phichetkunbodee, N.; Suppakittpaisarn, P.; Rinchumphu, D.; Tepweerakun, S.; Kridakorn Na Ayutthaya, T.; Sittisom, P. Eco-Efficiency of Green Infrastructure on Thermal Comfort of Outdoor Space Design. Sustainability 2023, 15, 2566. [Google Scholar] [CrossRef]
- Rodríguez Algeciras, J.A.; Matzarakis, A. Quantification of thermal bioclimate for the management of urban design in Mediterranean climate of Barcelona, Spain. Int. J. Biometeorol. 2016, 60, 1261–1270. [Google Scholar] [CrossRef] [PubMed]
- Lindberg, F.; Holmer, B.; Thorsson, S.; Rayner, D. Characteristics of the mean radiant temperature in high latitude cities-implications for sensitive climate planning applications. Int. J. Biometeorol. 2014, 58, 613–627. [Google Scholar] [CrossRef] [PubMed]
- Wu, H.; Cao, J.; Miao, M.; LI, C. Characteristics of sunshine duration in ecological conservation area of West Beijing and its influencing factors. J. Atmos. Environ. Opt. 2022, 17, 195. [Google Scholar]
- Wang, K.; Liang, H.; Shi, P.; Zhao, M. A comparative study of wind environment measurement and CFD simulation in a compact urban open space based on wind sense. Acta Ecol. Sin. 2019, 39, 6051–6057. [Google Scholar]
- Habib, F.; Barzegar, Z.; Cheshmehghasabani, M. Adjustment comparison of veranda effect on building shadow area in semi-arid and moderate climates. Ksce J. Civ. Eng. 2015, 19, 1256–1264. [Google Scholar] [CrossRef]
- Sangkertadi, S.; Syafriny, R. Pair influence of wind speed and mean radiant temperature on outdoor thermal comfort of humid tropical environment. J. Urban Environ. Eng. 2016, 10, 177–185. [Google Scholar] [CrossRef]
- Hathway, E.A.; Sharples, S. The interaction of rivers and urban form in mitigating the Urban Heat Island effect: A UK case study. Build. Environ. 2012, 58, 14–22. [Google Scholar] [CrossRef]
- Thompson, K.L.; Pauli, J.N.; Erker, T.; Kucharik, C.J.; Schatz, J.; Townsend, P.A.; Zuckerberg, B. Urban greenspaces promote warmer soil surface temperatures in a snow-covered city. Landsc. Urban Plan. 2022, 227, 12. [Google Scholar] [CrossRef]
- Yang, J.; Zhao, Y.; Zou, Y.; Xia, D.; Lou, S.; Liu, W.; Ji, K. Effects of Tree Species and Layout on the Outdoor Thermal Environment of Squares in Hot-Humid Areas of China. Buildings 2022, 12, 1867. [Google Scholar] [CrossRef]
- Huttner, S. Further Development and Application of the 3D Microclimate Simulation ENVI-Met. Ph.D. Thesis, Johannes Gutenberg University Mainz, Mainz, Germany, 2012. [Google Scholar]
Figure 1.
Picture of the study area.

Figure 2.
A schematic diagram to compare the differences between Models 1–6 on 13 May 2023.

Figure 3.
A schematic diagram to compare the differences between Models 1–6 on 16 December 2022.

Figure 4.
The average PET values in the street canyon area of each model at different times on 13 May 2023.
Figure 4.
The average PET values in the street canyon area of each model at different times on 13 May 2023.

Figure 5.
Simulation results of PET values in each model at 12:00, 13 May 2023 (In the figure, the black area represents the area occupied by buildings, for which a PET value is not available).
Figure 5.
Simulation results of PET values in each model at 12:00, 13 May 2023 (In the figure, the black area represents the area occupied by buildings, for which a PET value is not available).

Figure 6.
The average PET values (°C) in the street canyon area of each model at different times on 16 December 2022.
Figure 6.
The average PET values (°C) in the street canyon area of each model at different times on 16 December 2022.

Figure 7.
Simulation results of PET values in each model at 17:00, 16 December 2022.


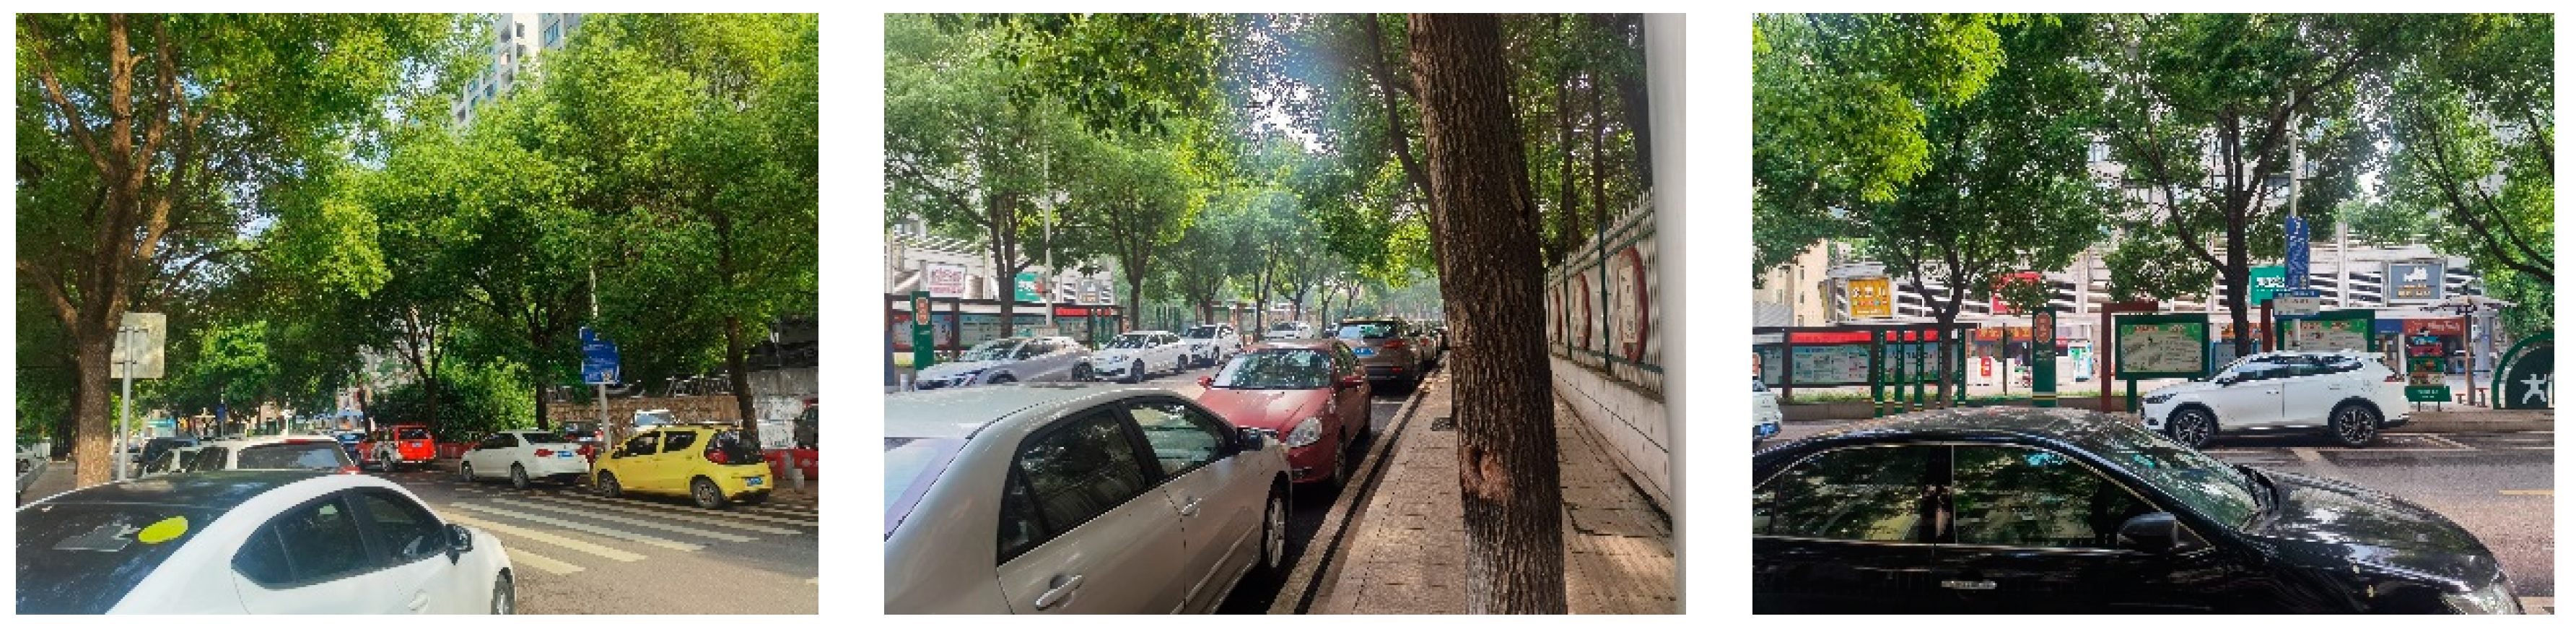
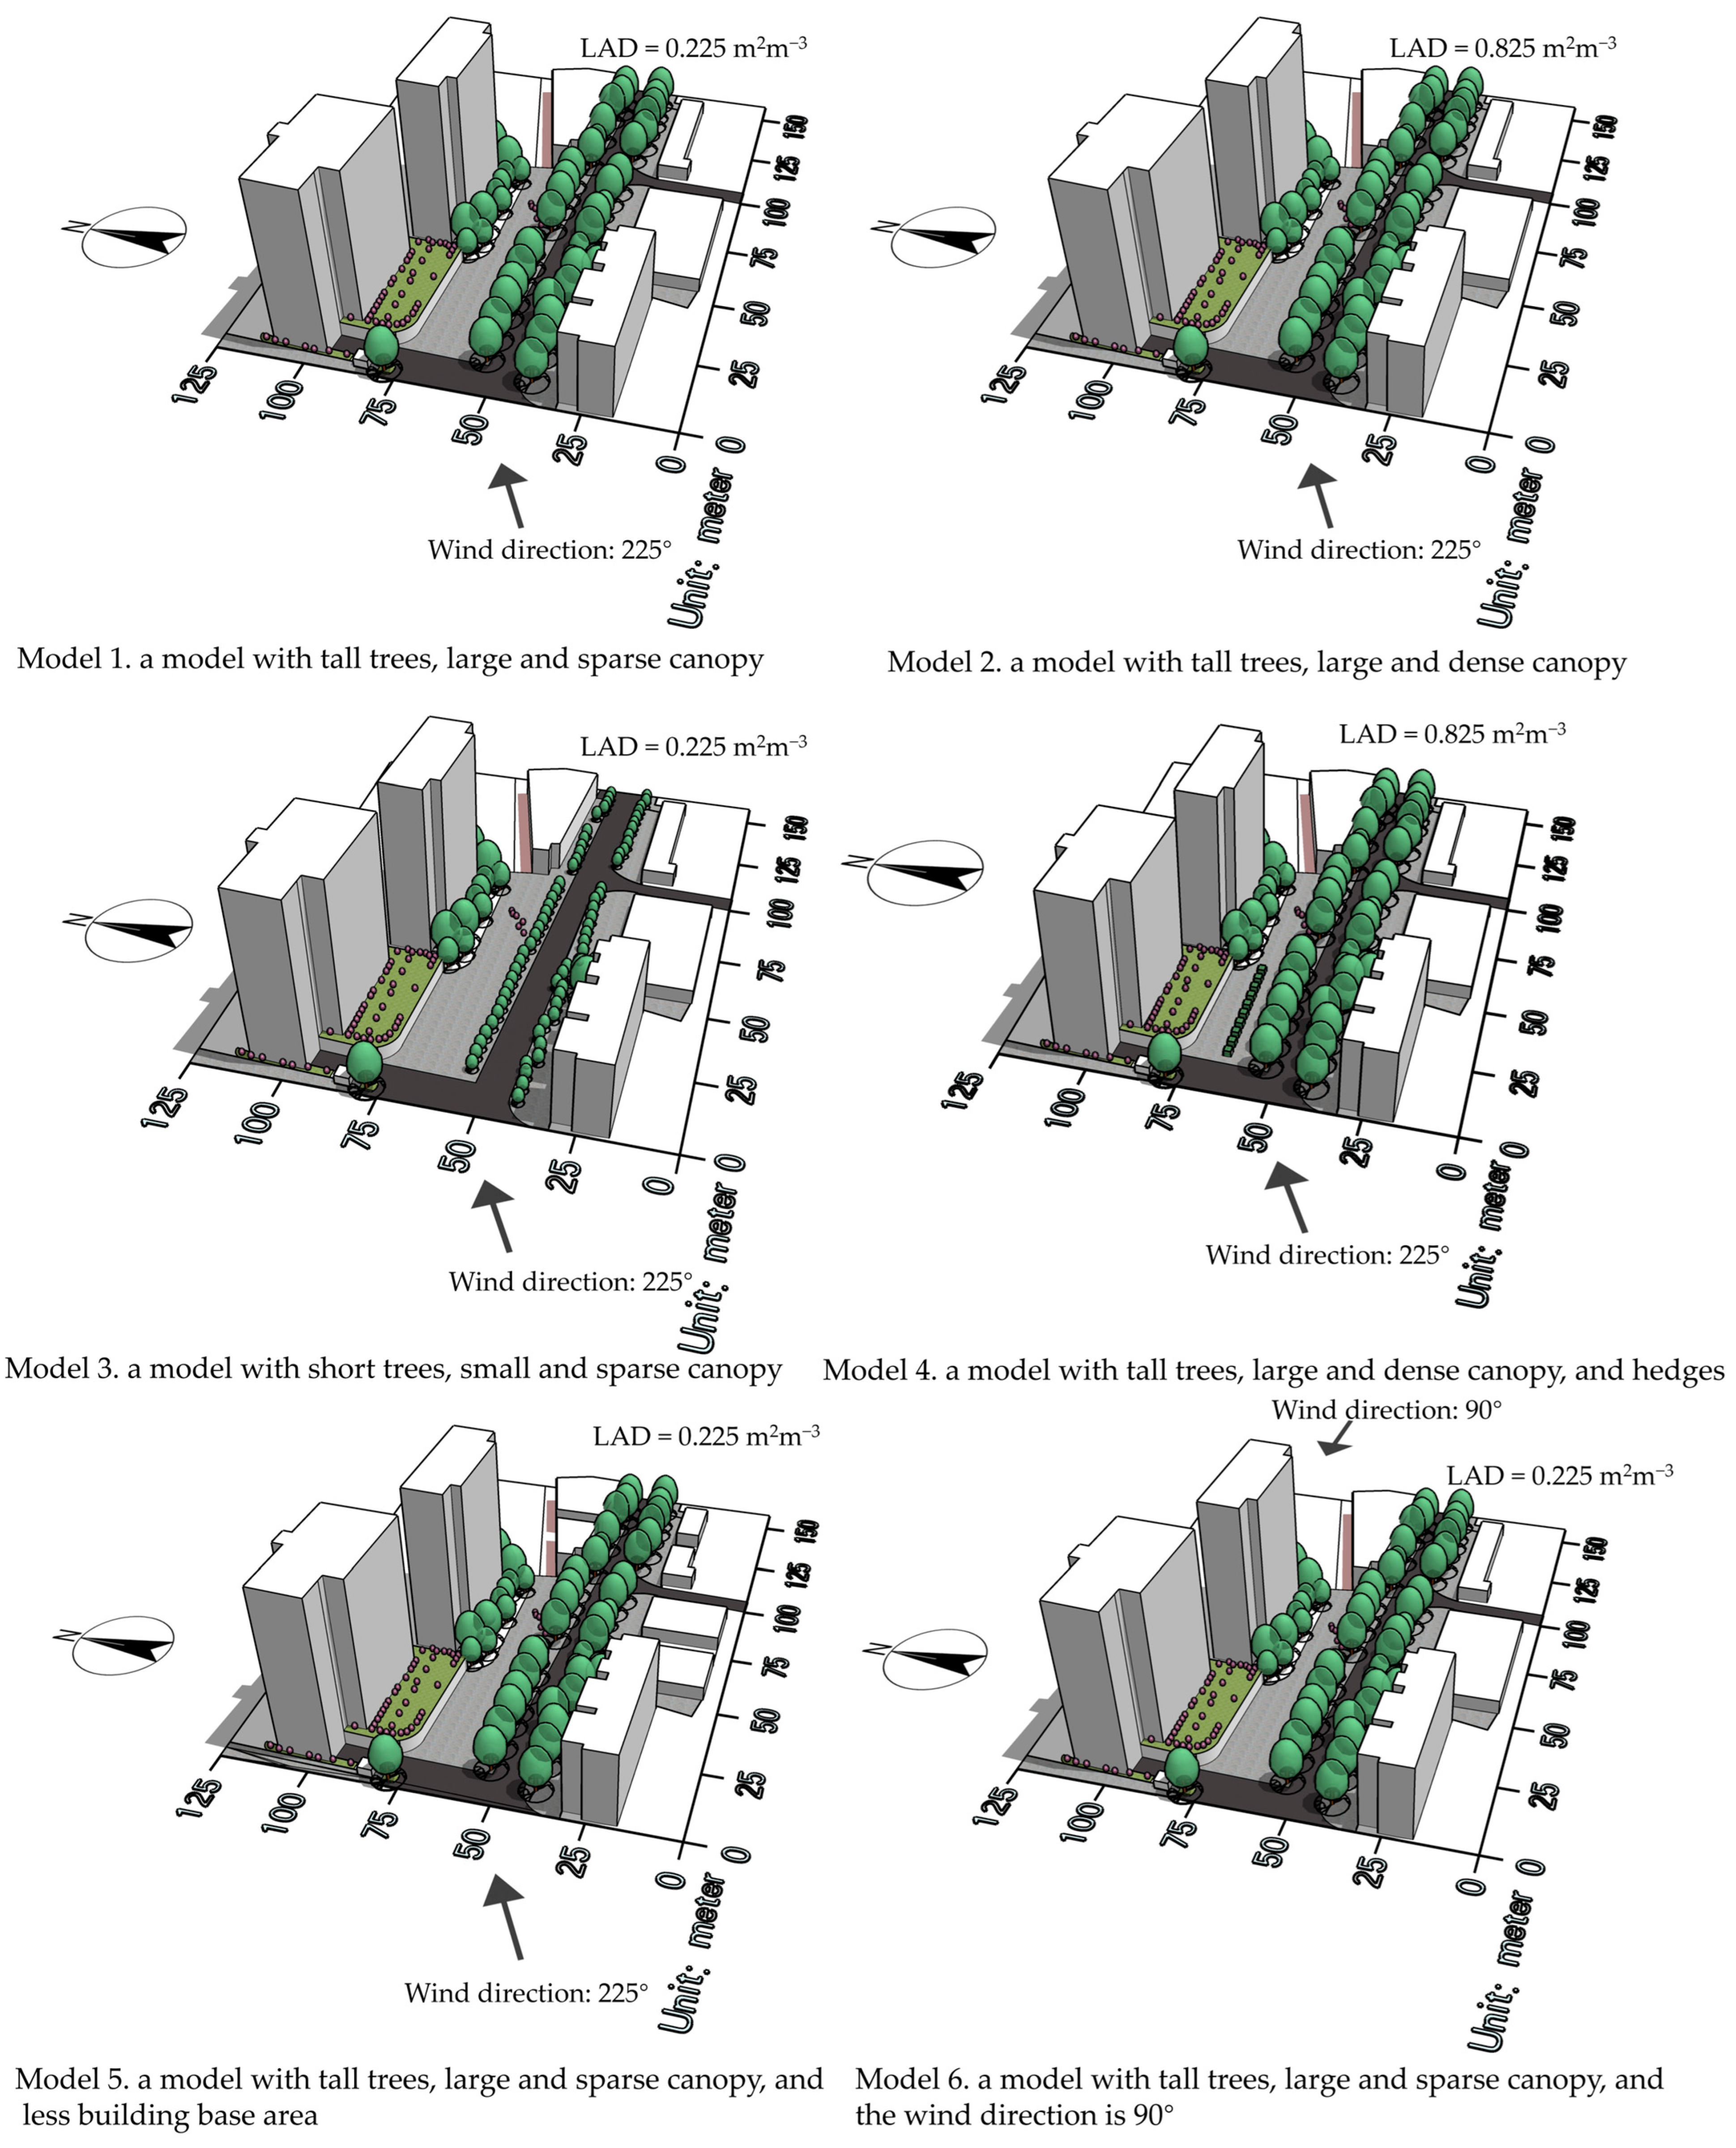
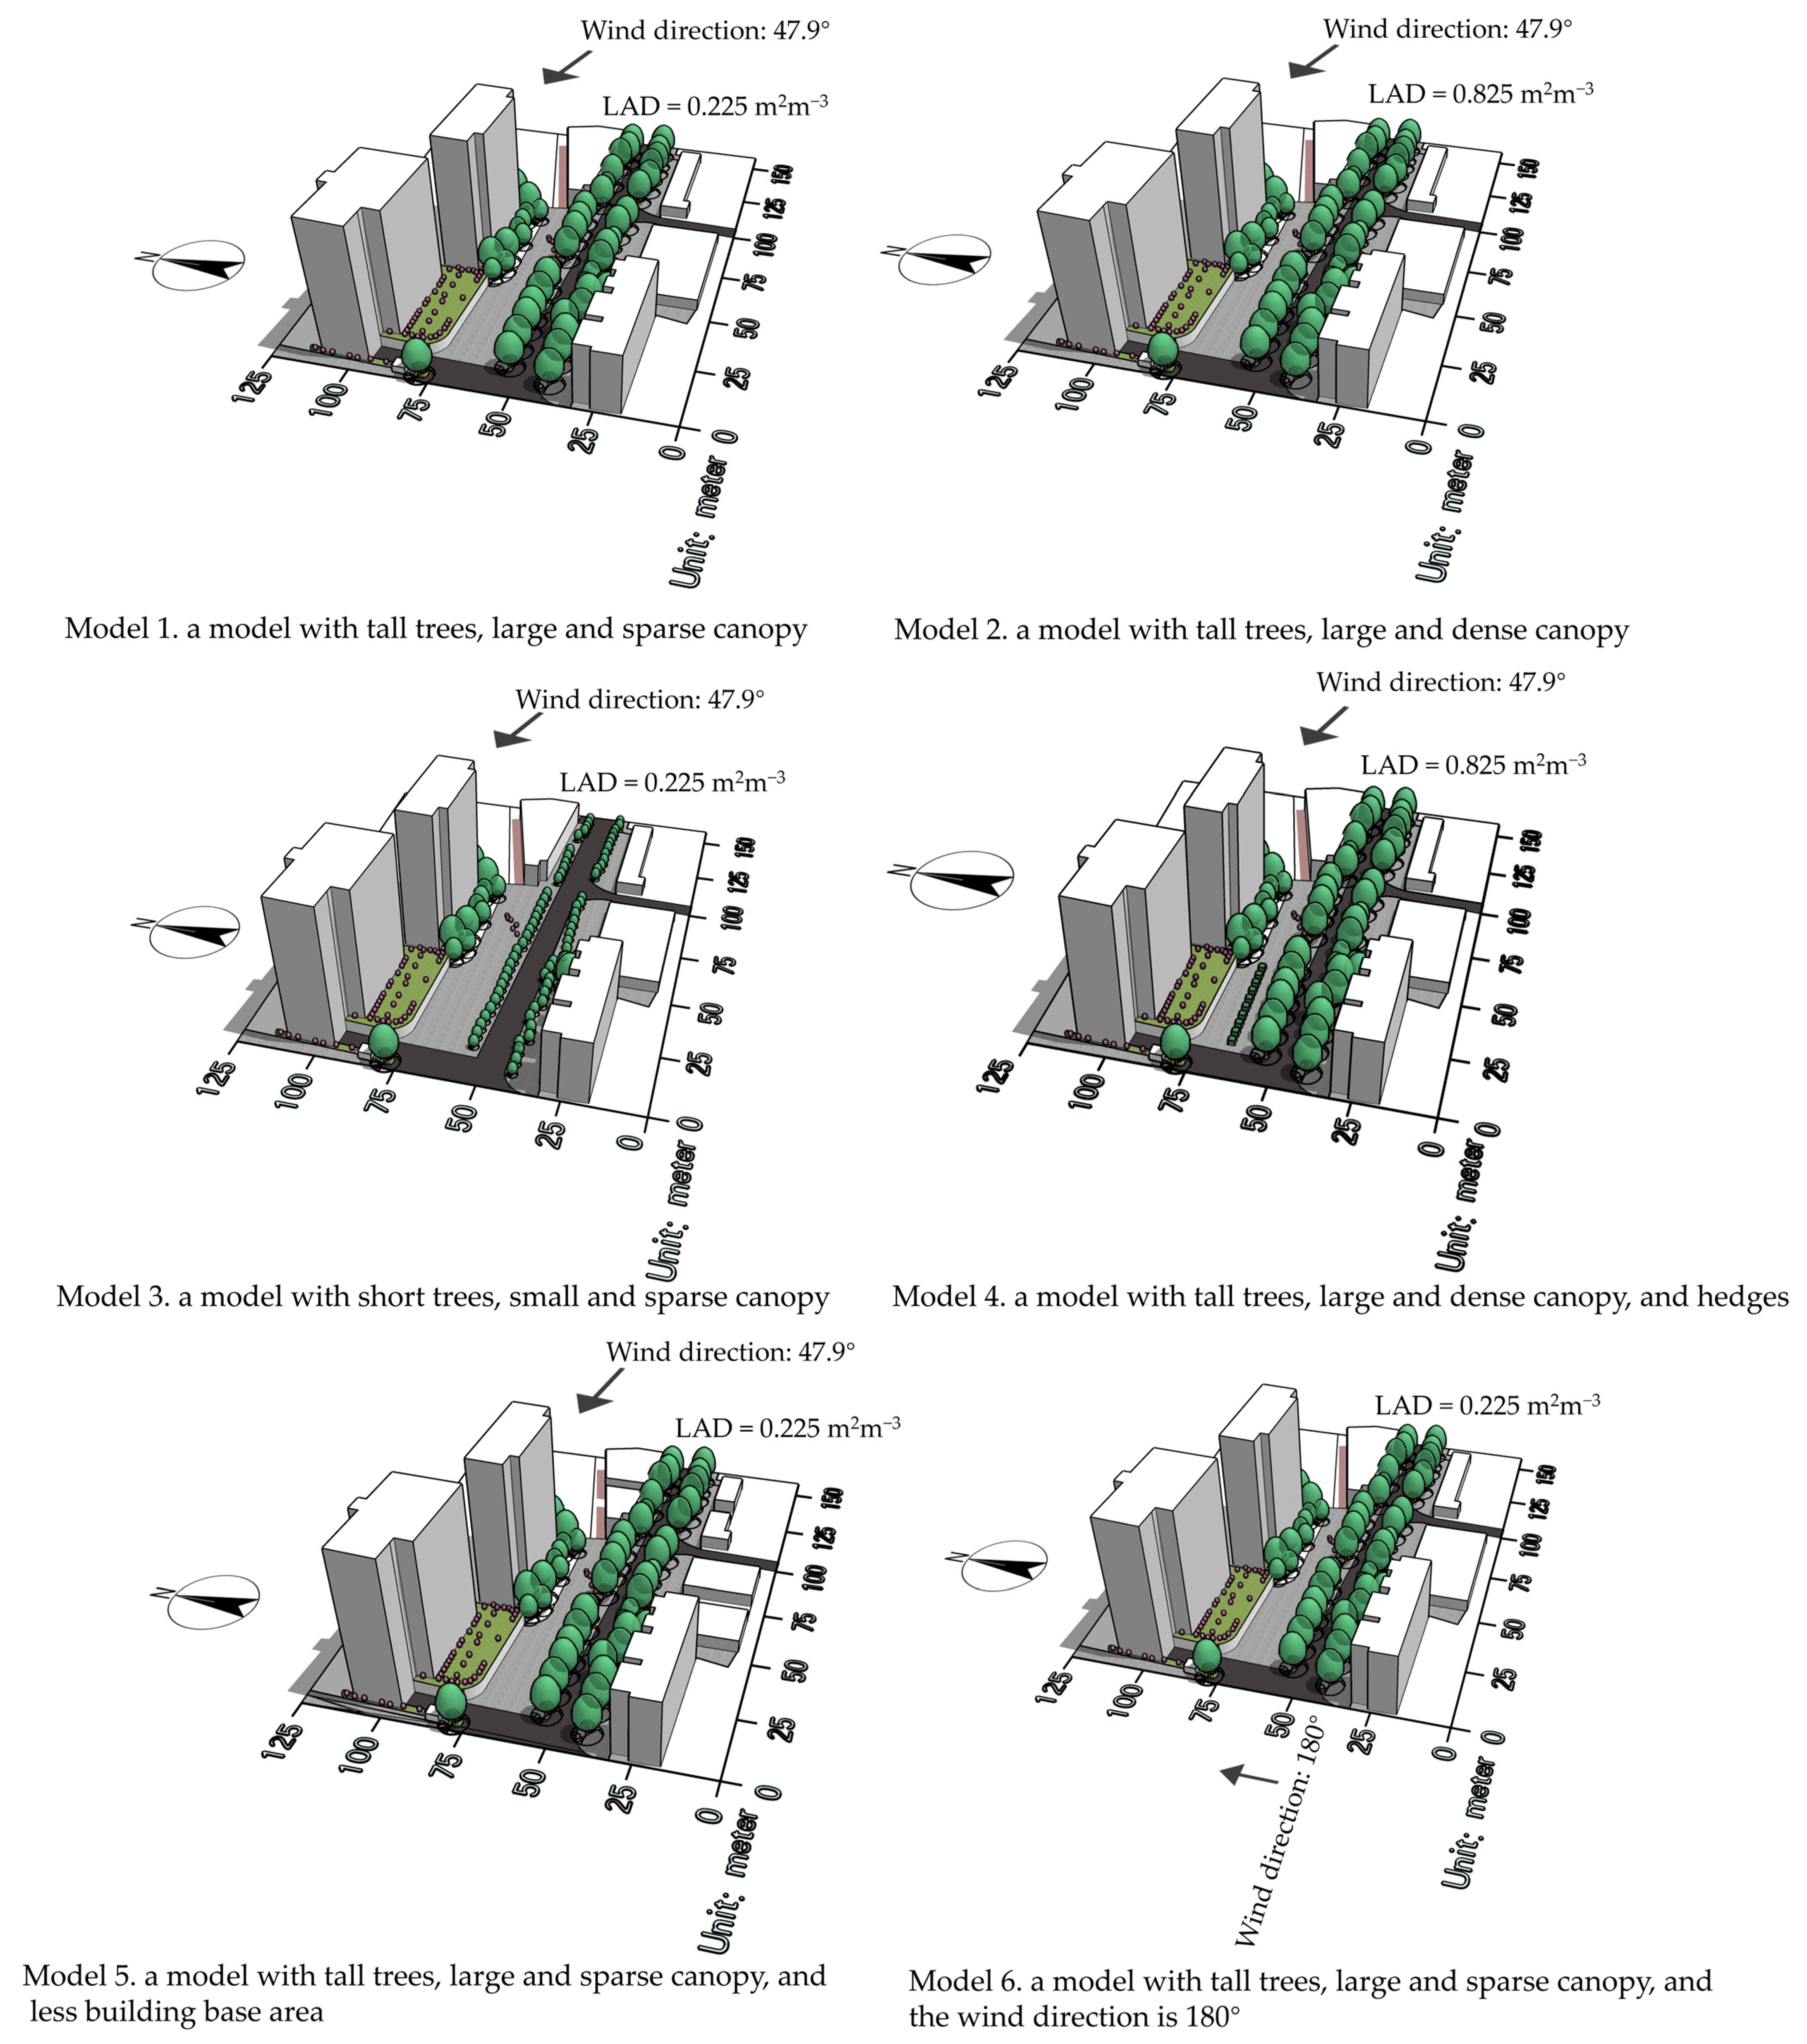
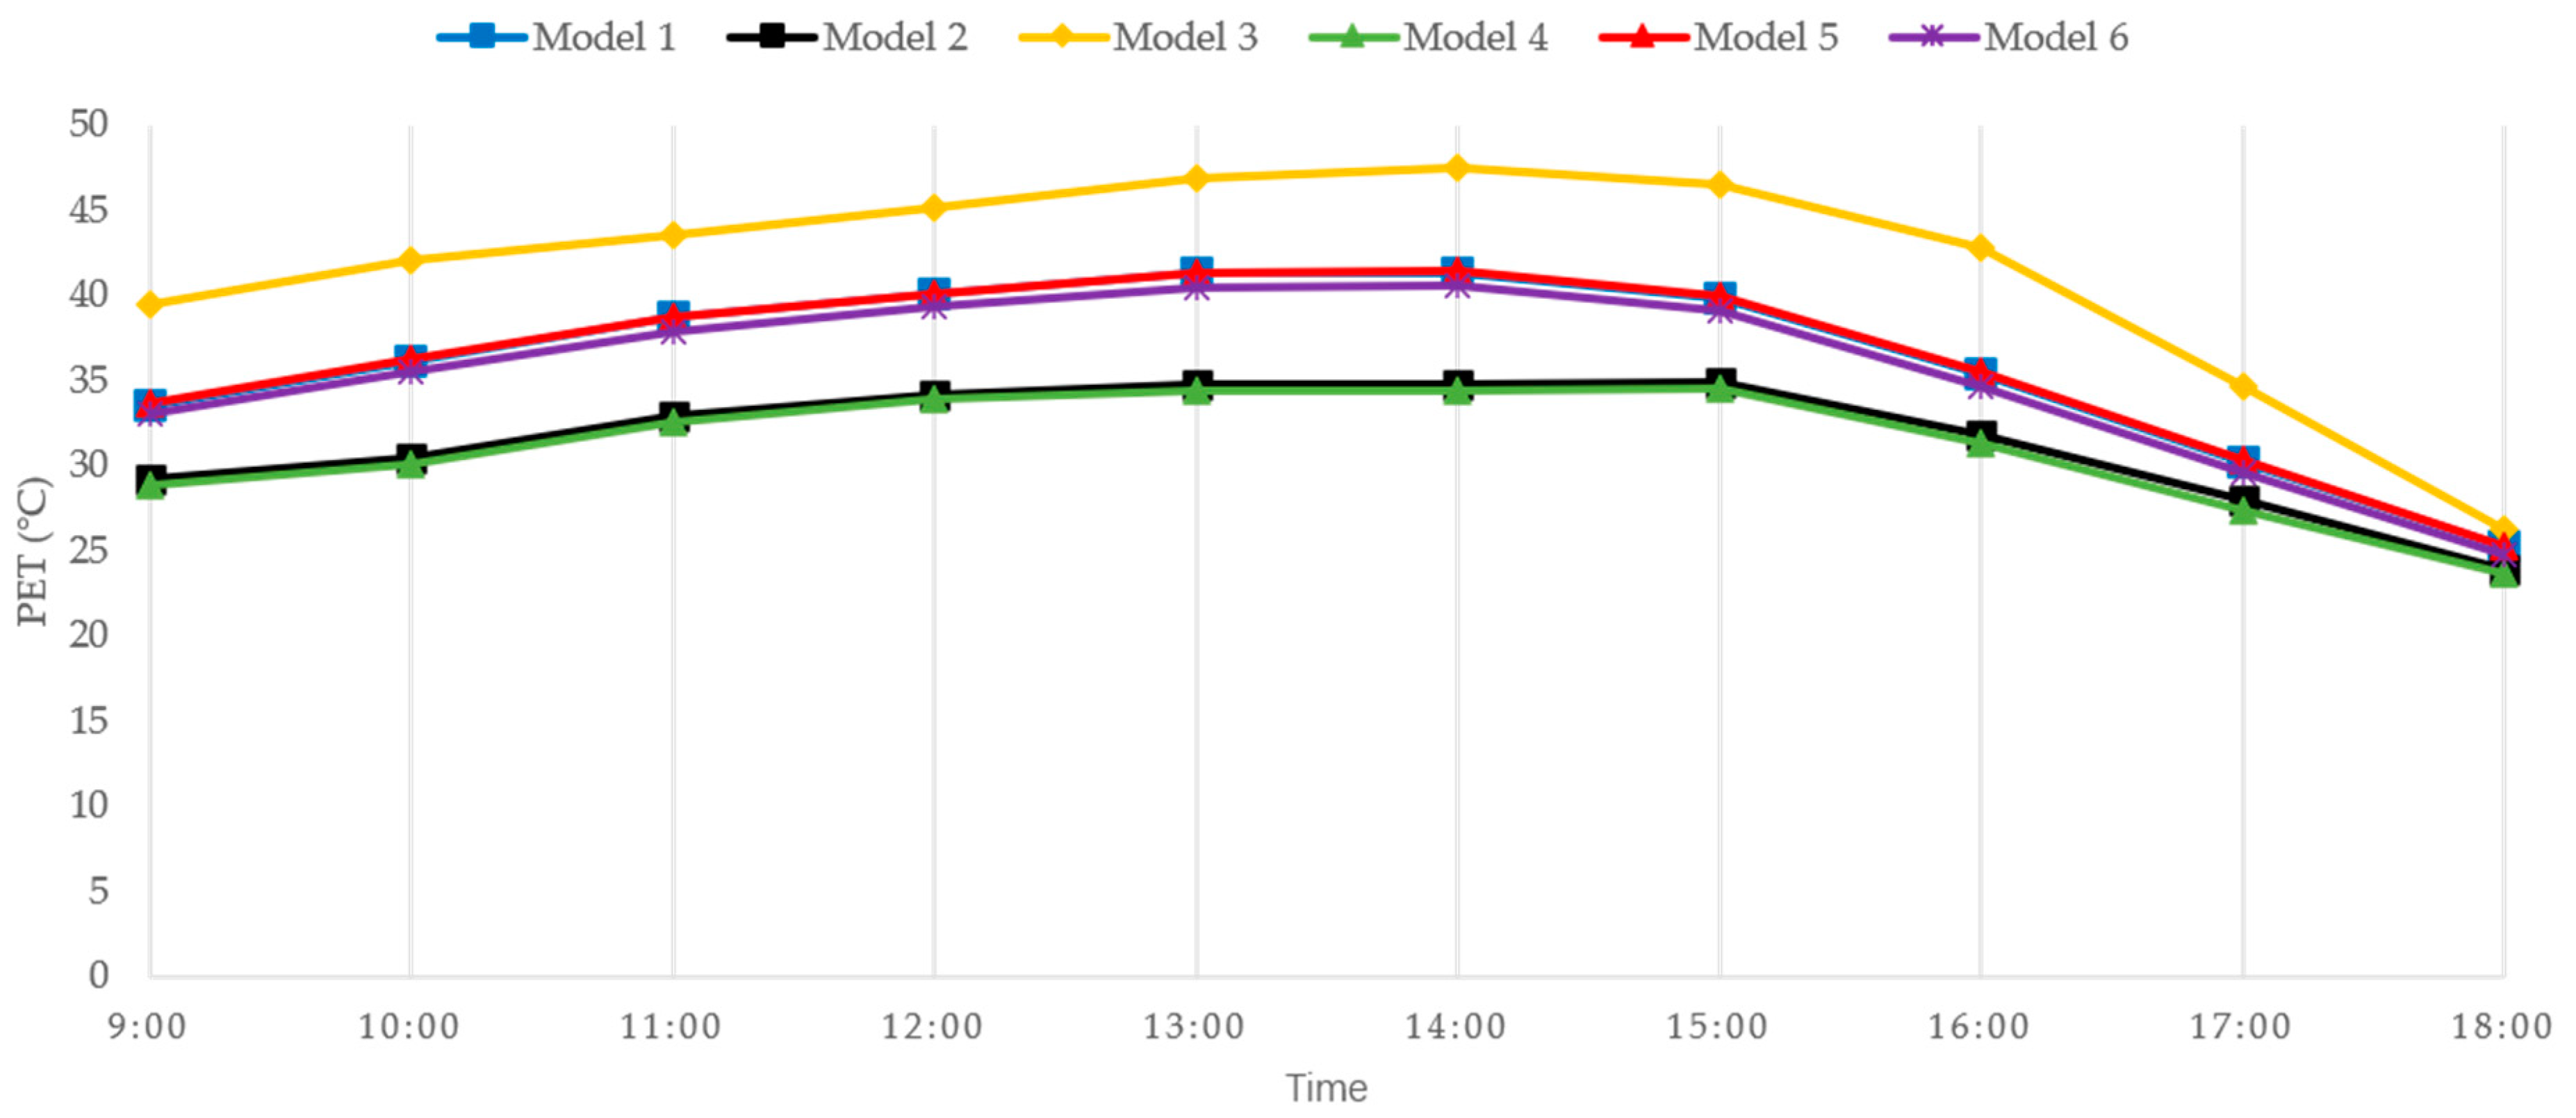
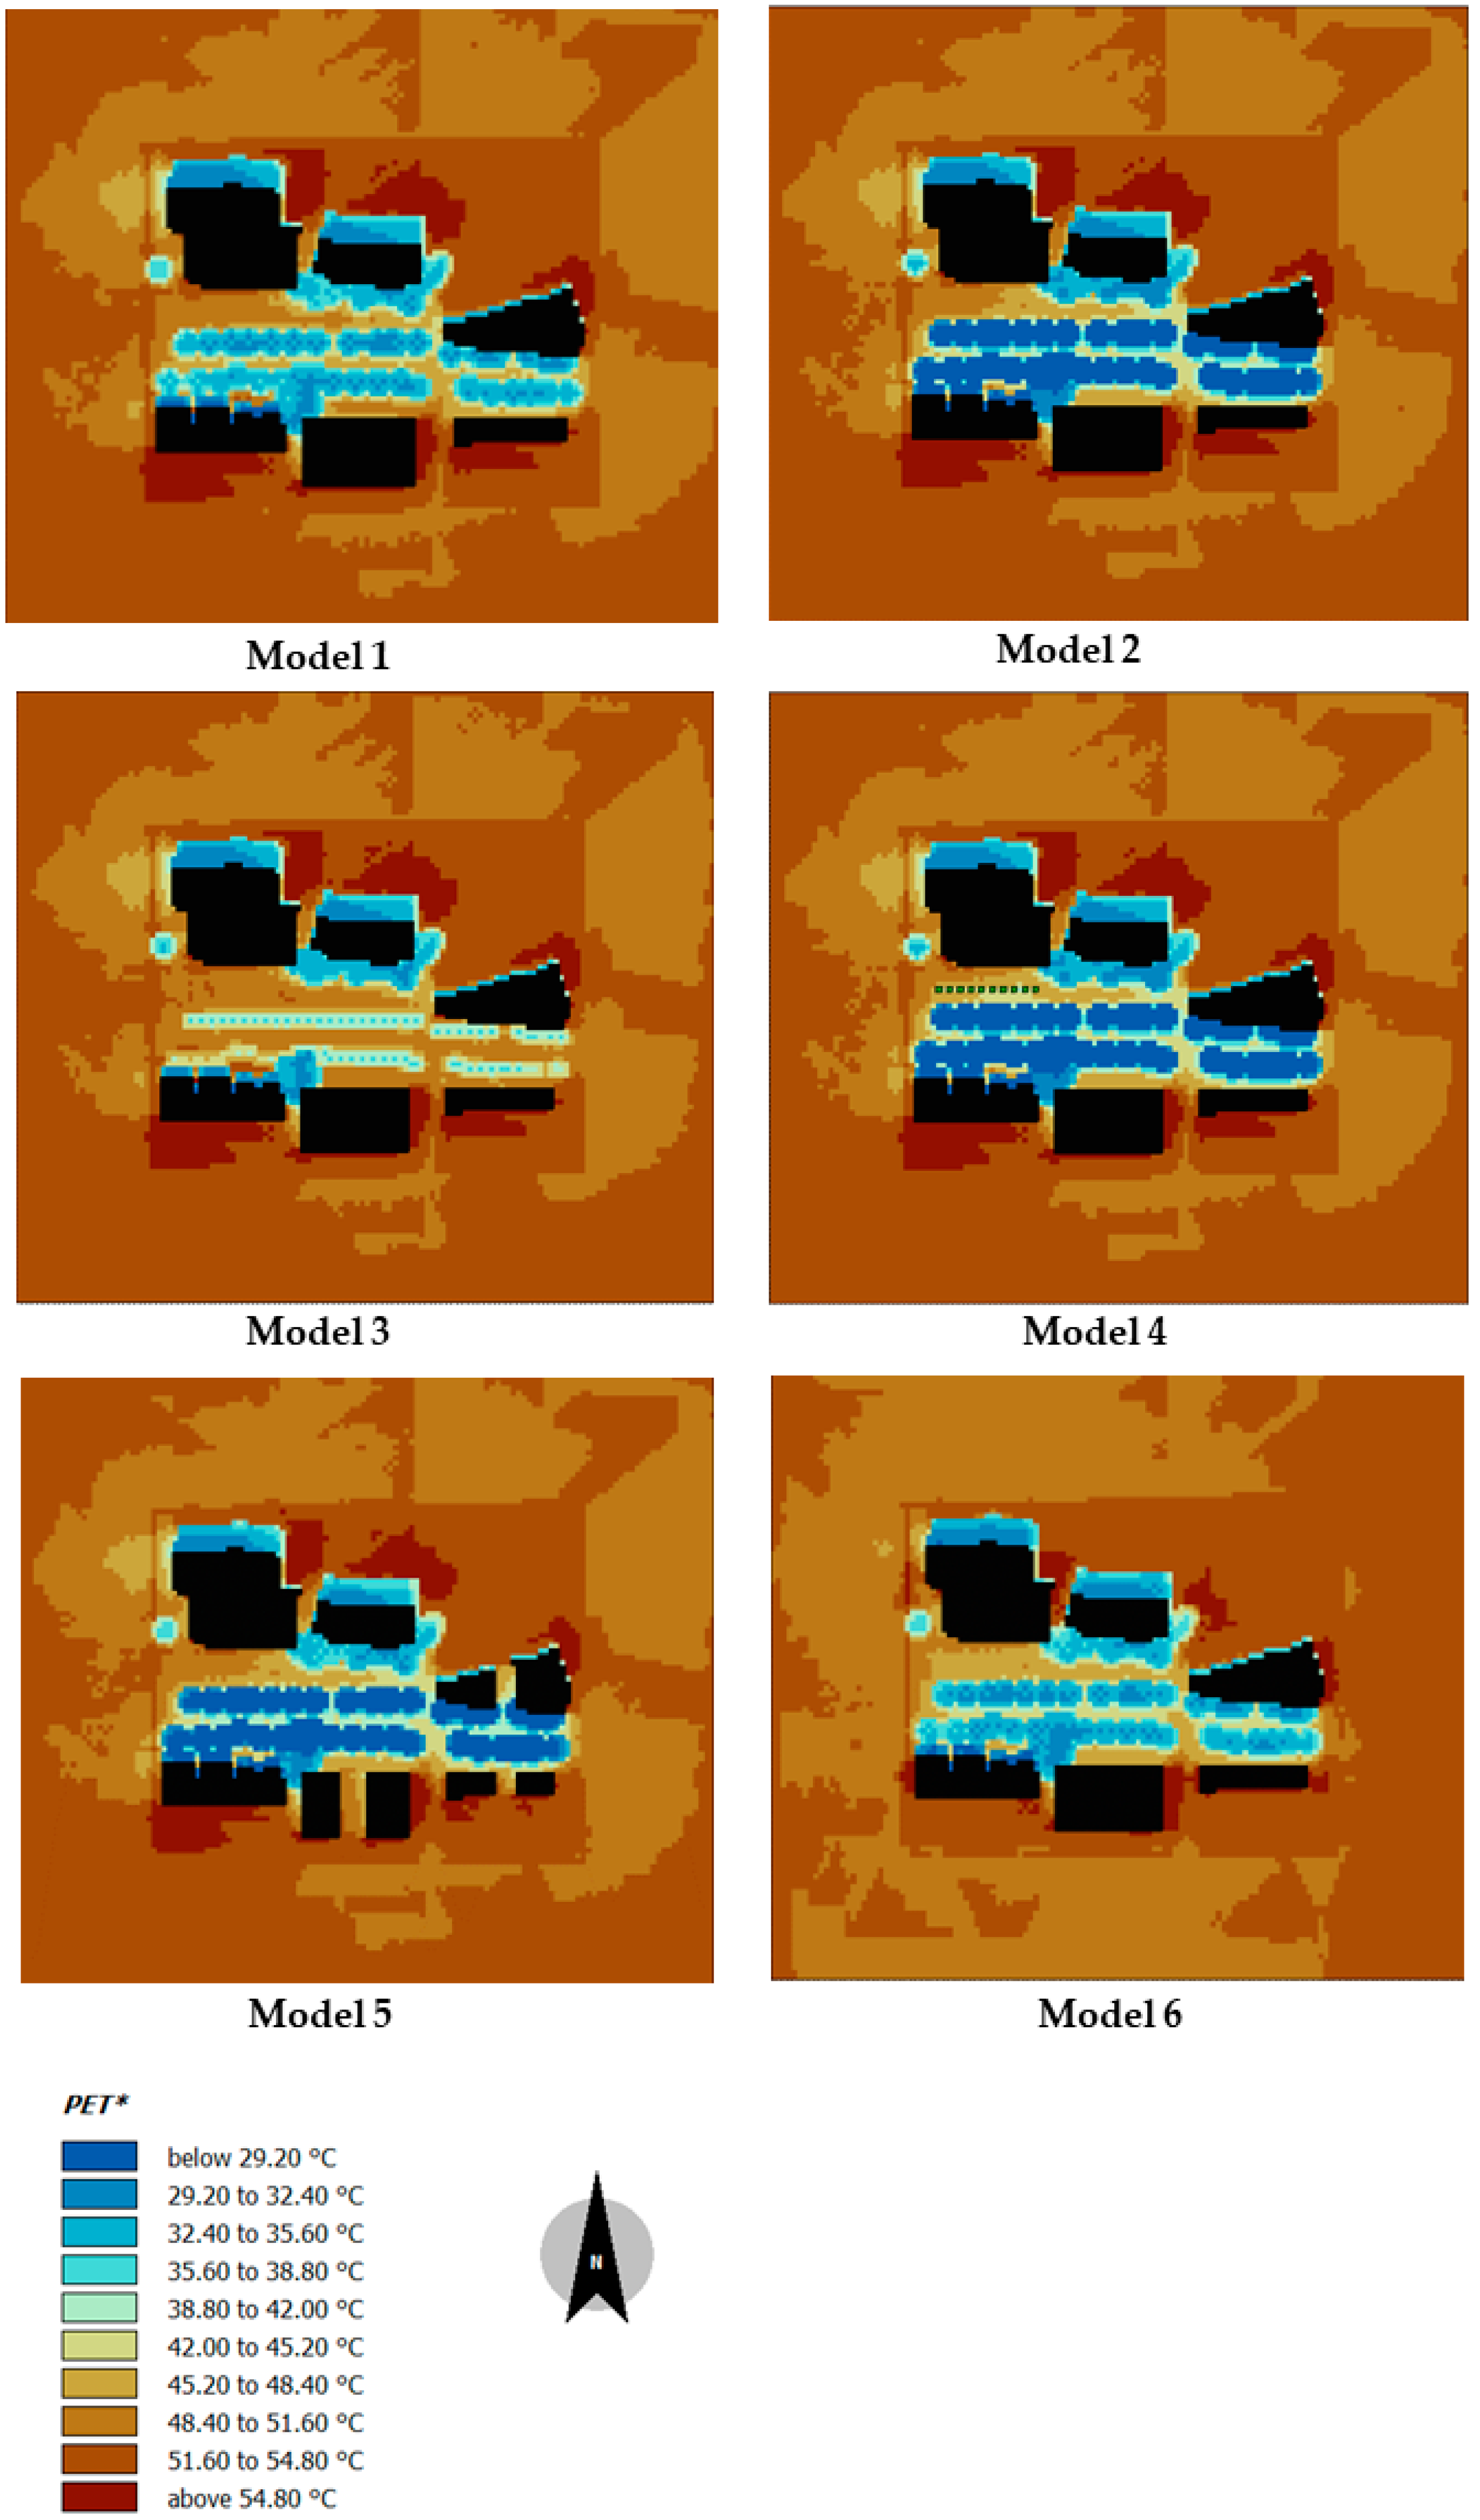
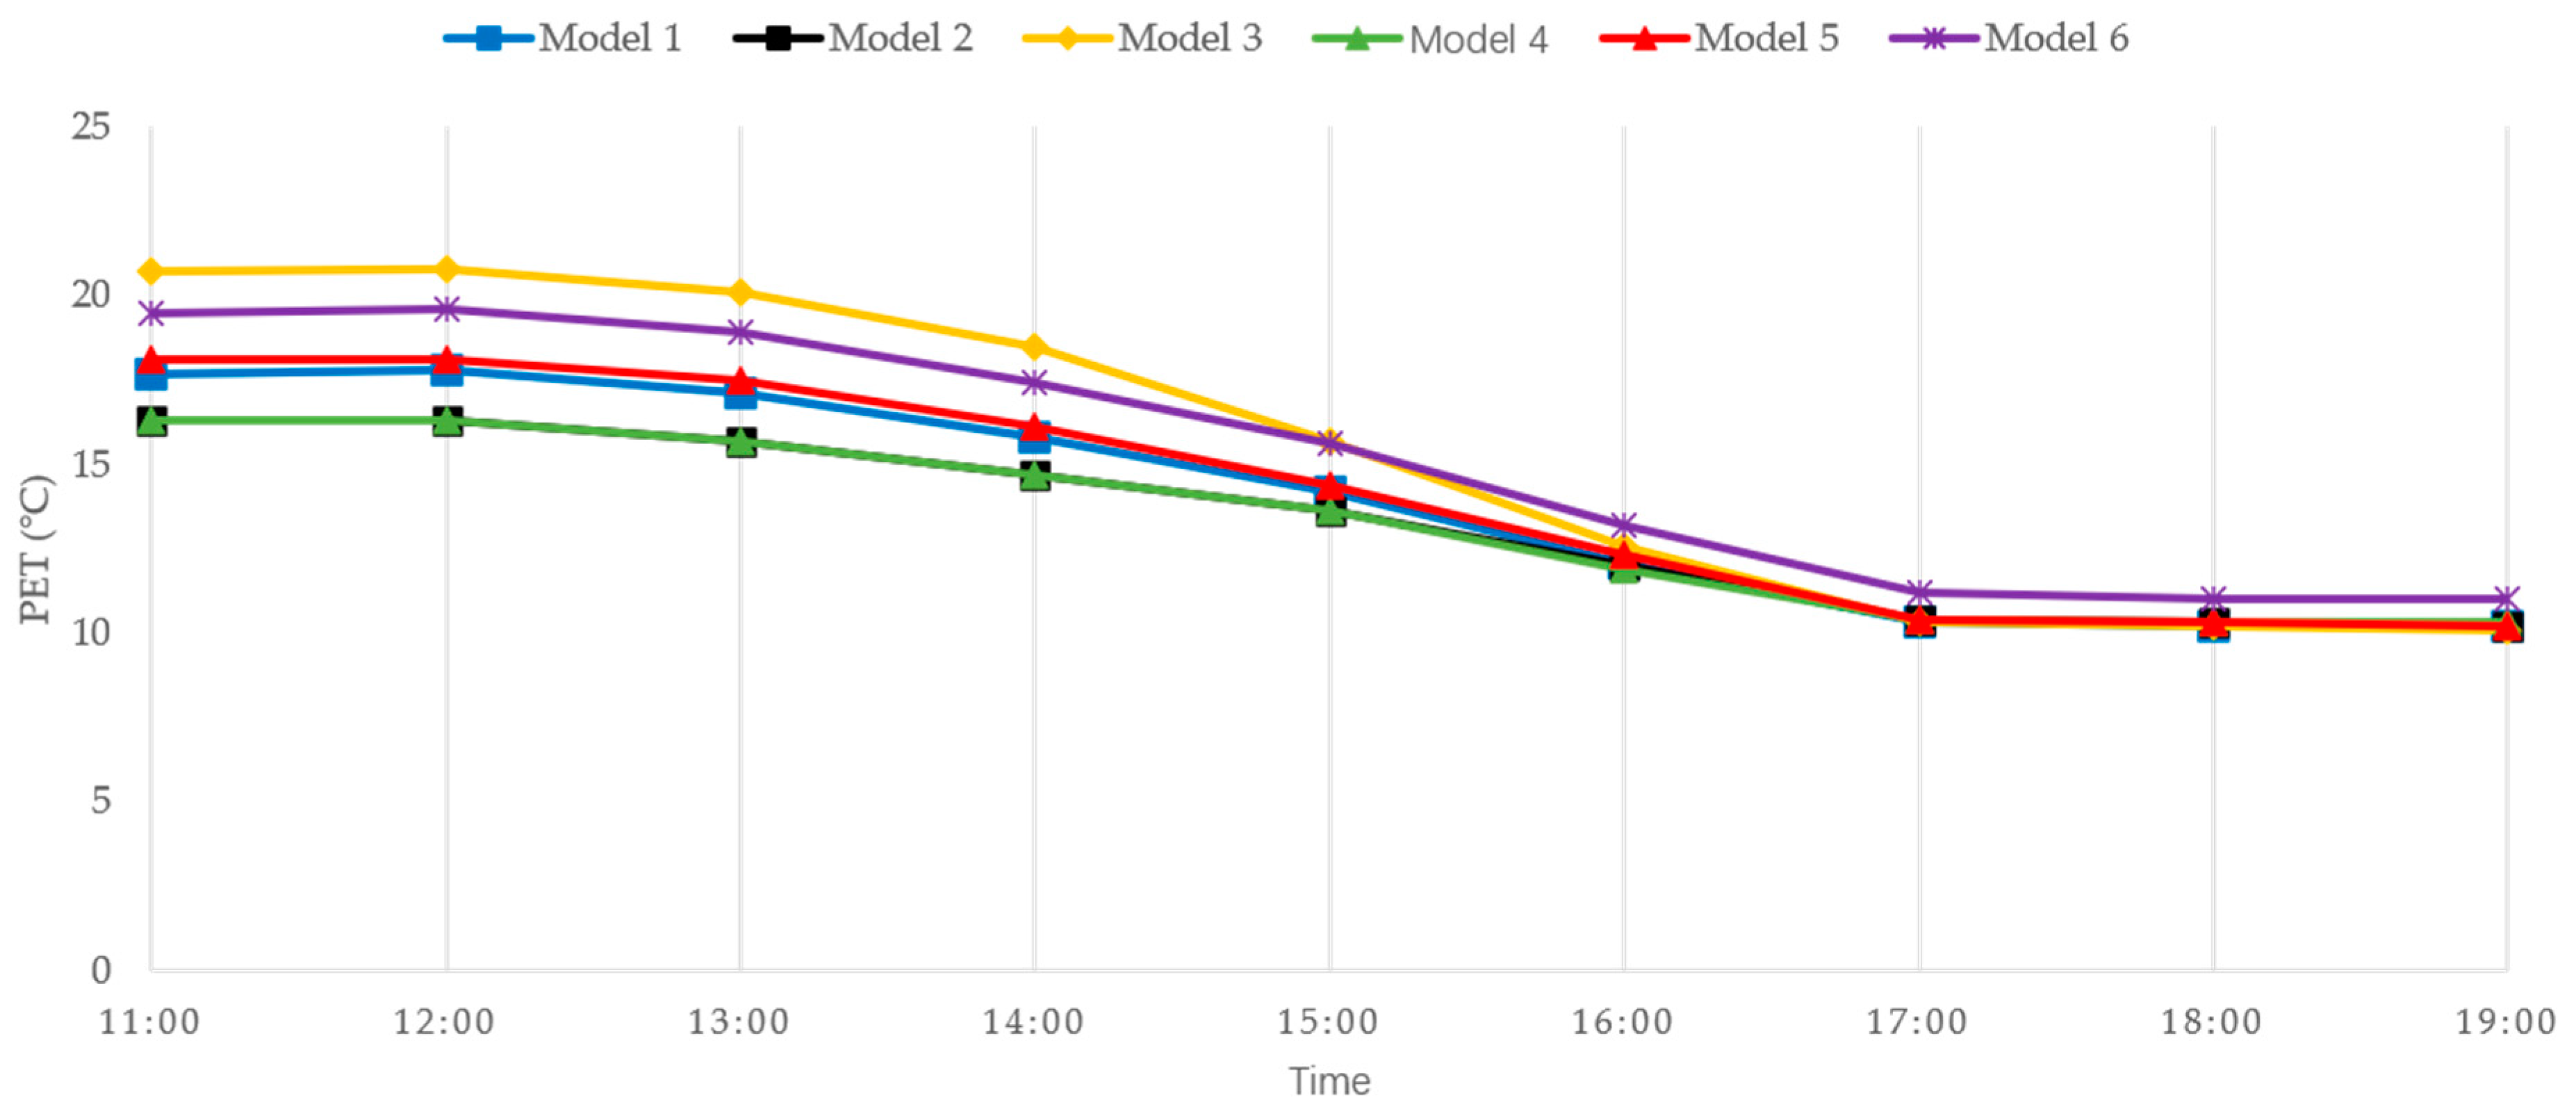
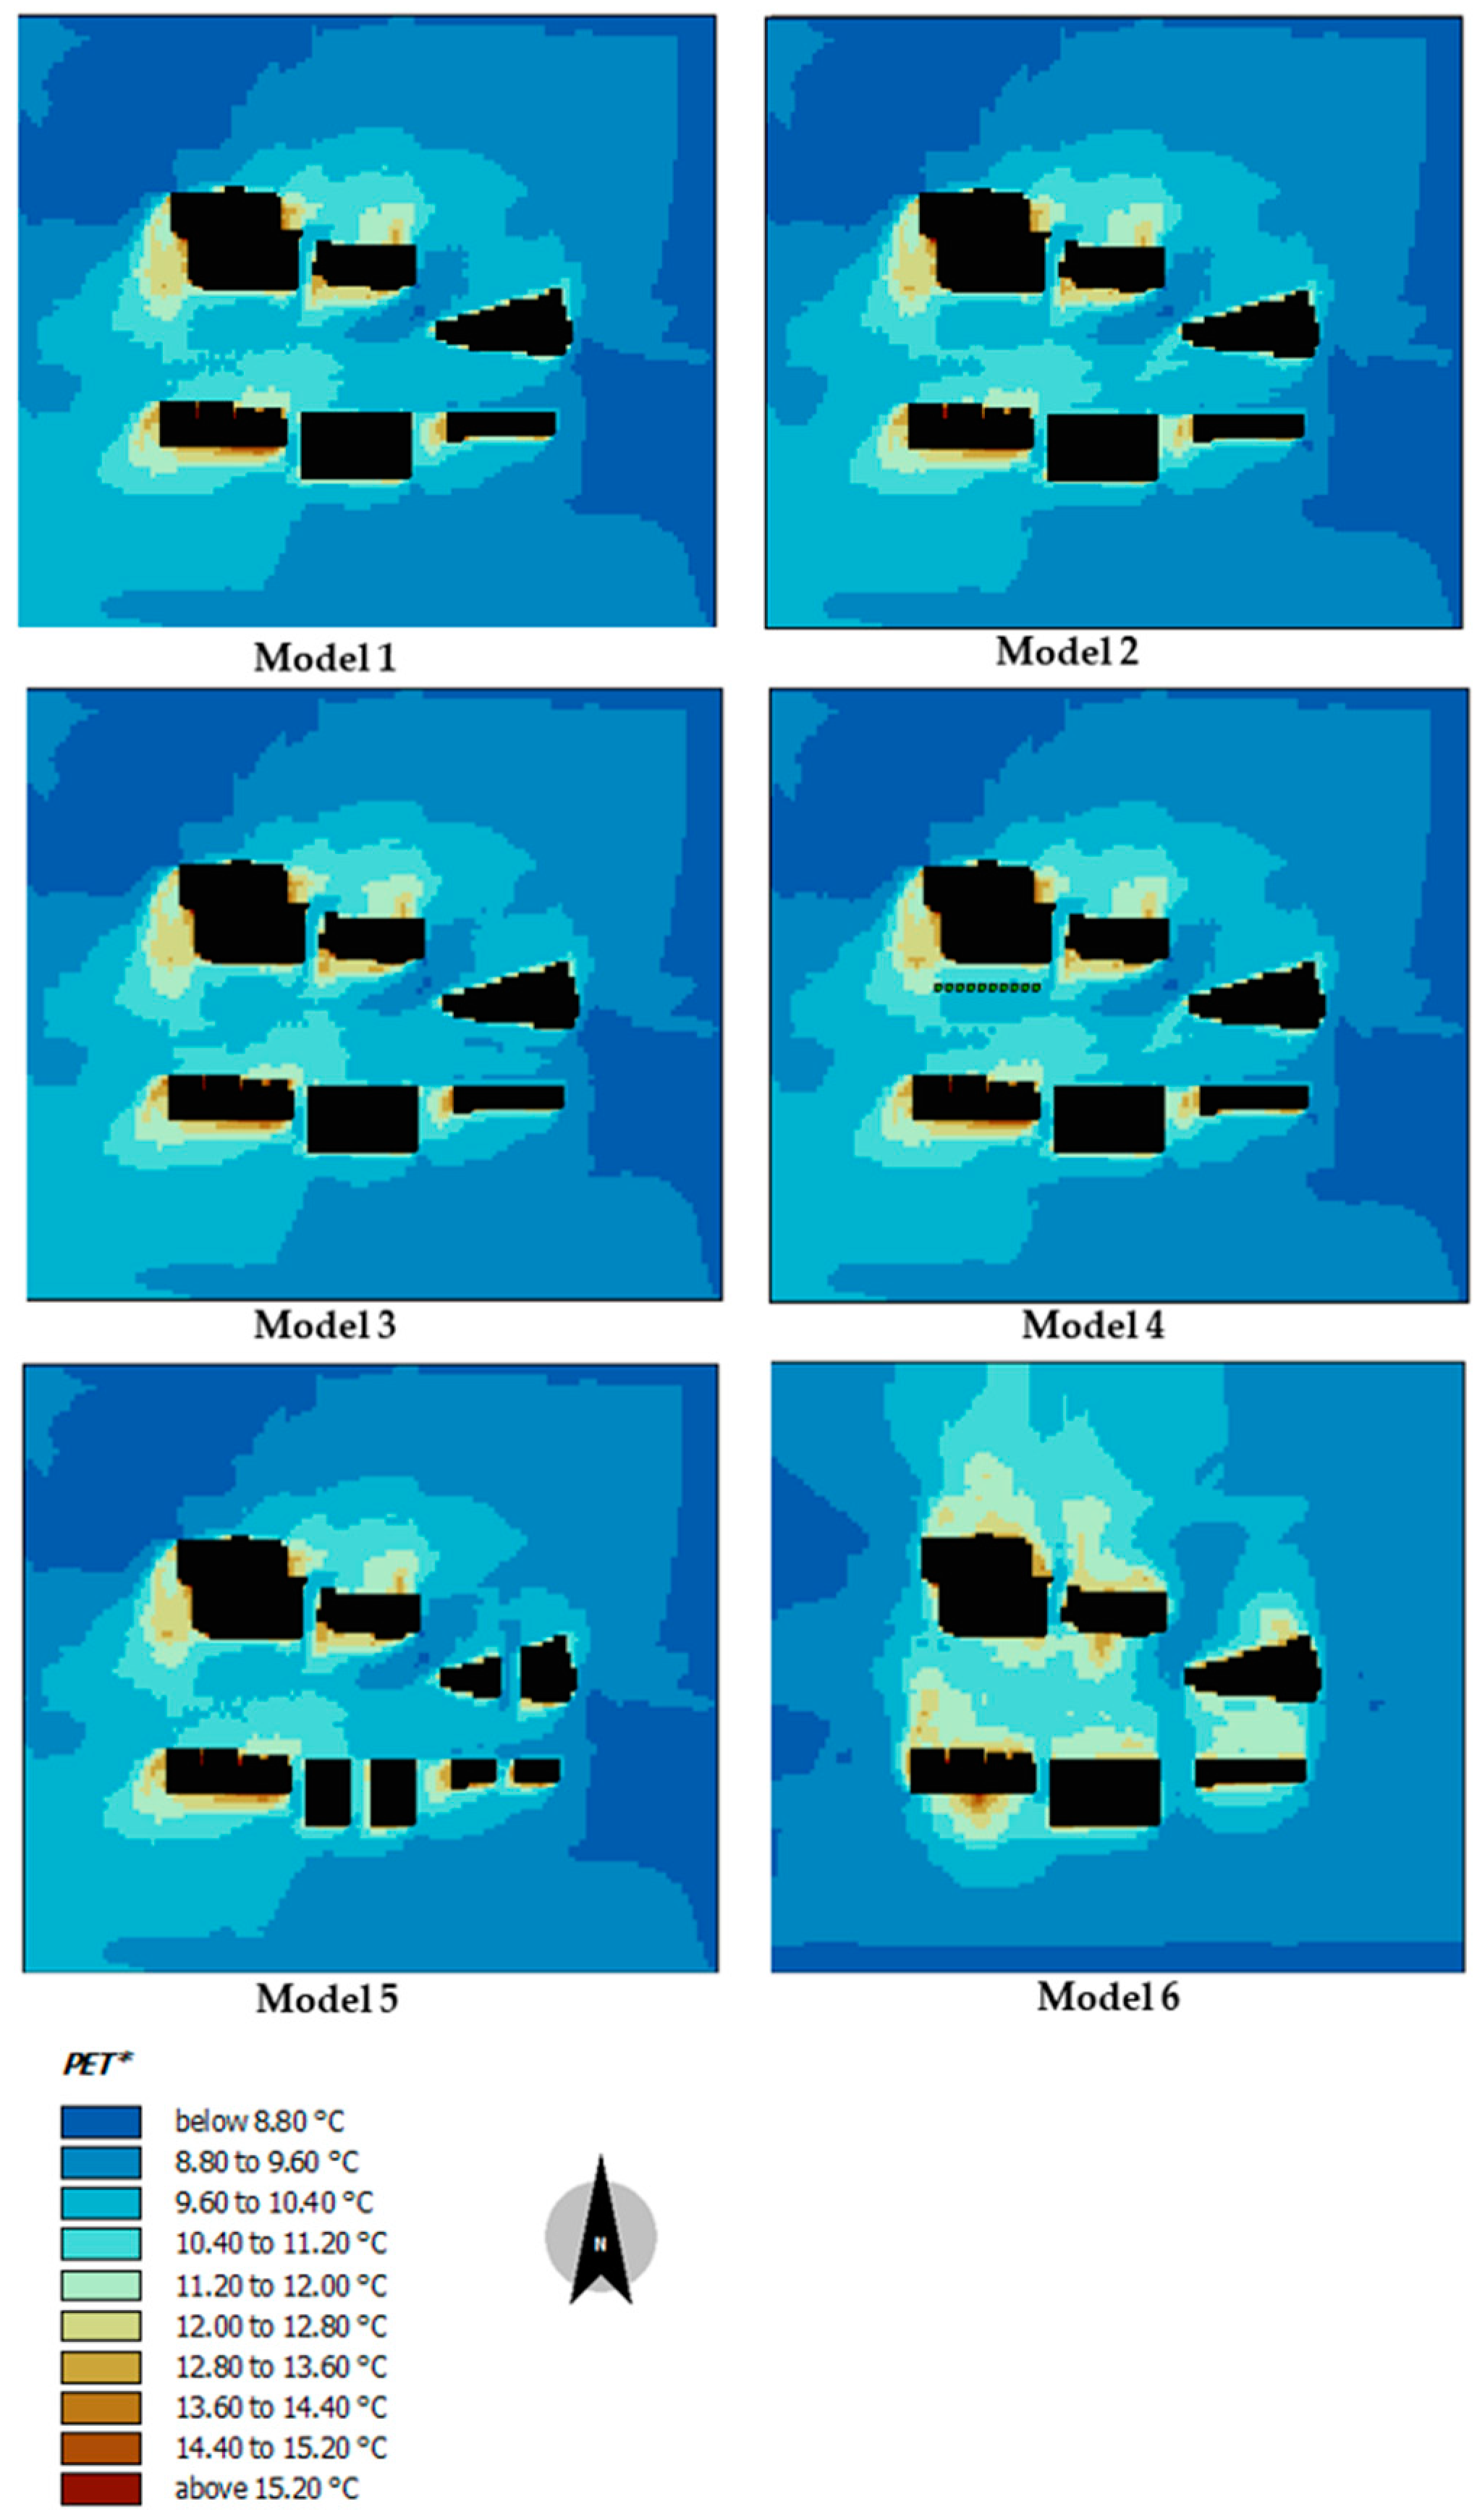
Table 1.
Measurement accuracy of Kestrel 5500.
| Meteorological Parameters | Air Temperature | Relative Humidity | Wind Speed | Wind Direction |
|---|---|---|---|---|
| Accuracy | 0.5 °C | 2% RH | Larger than 3% of reading, least significant digit, or 20 ft/min | 5° |
Table 2.
Summary of measured meteorological data on 13 May 2023.
| Time | Air Temperature (°C) | Relative Humidity (%) |
|---|---|---|
| 08:00:00 | 20.8 | 76.7 |
| 09:00:00 | 22.4 | 67.5 |
| 10:00:00 | 23.9 | 61.6 |
| 11:00:00 | 25.7 | 56.8 |
| 12:00:00 | 26.1 | 54.0 |
| 13:00:00 | 27.1 | 52.0 |
| 14:00:00 | 27.2 | 49.4 |
| 15:00:00 | 26.9 | 50.3 |
| 16:00:00 | 27.0 | 52.0 |
| 17:00:00 | 26.6 | 53.4 |
| 18:00:00 | 25.8 | 58.3 |
Table 3.
Summary of Measured Meteorological Data on 16 December 2022.
| Time | Air Temperature (°C) | Relative Humidity (%) |
|---|---|---|
| 10:00 | 8.7 | 69.9 |
| 11:00 | 8.2 | 68.5 |
| 12:00 | 7.7 | 70.2 |
| 13:00 | 7.8 | 65.3 |
| 14:00 | 7.7 | 62.4 |
| 15:00 | 7.6 | 60.5 |
| 16:00 | 7.5 | 57.0 |
| 17:00 | 7.5 | 55.7 |
| 18:00 | 7.7 | 54.9 |
| 19:00 | 8.0 | 52.5 |
Table 4.
A table which compares the differences of the six models on 13 May 2023.
| Model 1 | Model 2 | Model 3 | Model 4 | Model 5 | Model 6 | |
|---|---|---|---|---|---|---|
| Street tree height (m) | 15 | 15 | 5 | 15 | 15 | 15 |
| Crown width (m) | 9 | 9 | 3 | 9 | 9 | 9 |
| Street tree numbers in the study area | 36 | 36 | 71 | 36 | 36 | 36 |
| Leaf area density (m2m−3) | 0.225 | 0.825 | 0.225 | 0.825 | 0.225 | 0.225 |
| Hedge area (m2) | 0 | 0 | 0 | 40 | 0 | 0 |
| Building area (m2) | 4060 | 4060 | 4060 | 4060 | 3672 | 4060 |
| Wind direction | 225.0° | 225.0° | 225.0° | 225.0° | 225.0° | 90.0° |
Table 5.
A table which compares the differences between the six models on 16 December 2022.
| Model 1 | Model 2 | Model 3 | Model 4 | Model 5 | Model 6 | |
|---|---|---|---|---|---|---|
| Street tree height (m) | 15 | 15 | 5 | 15 | 15 | 15 |
| Crown width (m) | 9 | 9 | 3 | 9 | 9 | 9 |
| Street tree numbers in the study area | 36 | 36 | 71 | 36 | 36 | 36 |
| Leaf area density (m2m−3) | 0.225 | 0.825 | 0.225 | 0.825 | 0.225 | 0.225 |
| Hedge area (m2) | 0 | 0 | 0 | 40 | 0 | 0 |
| Building area (m2) | 4060 | 4060 | 4060 | 4060 | 3672 | 4060 |
| Wind direction | 47.9° | 47.9° | 47.9° | 47.9° | 47.9° | 180° |
Table 6.
Measured and simulated air temperature values on 13 May 2023.
| Time | Measured Air Temperature (°C) | Simulated Air Temperature (°C) | Measured Relative Humidity (%) | Simulated Relative Humidity (%) |
|---|---|---|---|---|
| 08:00 | 20.8 | 20.7 | 76.7 | 75.5 |
| 09:00 | 22.4 | 23.0 | 67.5 | 67.8 |
| 10:00 | 23.9 | 23.9 | 61.6 | 62.6 |
| 11:00 | 25.7 | 24.7 | 56.8 | 59.2 |
| 12:00 | 26.1 | 25.5 | 54.0 | 56.1 |
| 13:00 | 27.1 | 26.2 | 52.0 | 53.5 |
| 14:00 | 27.2 | 26.6 | 49.4 | 51.6 |
| 15:00 | 26.9 | 26.7 | 50.3 | 50.9 |
| 16:00 | 27.0 | 26.6 | 52.0 | 51.6 |
| 17:00 | 26.6 | 26.2 | 53.4 | 52.9 |
| 18:00 | 25.8 | 25.5 | 58.3 | 55.4 |
Table 7.
The average PET values (°C) of each model in the street canyon area at different times on 13 May 2023.
Table 7.
The average PET values (°C) of each model in the street canyon area at different times on 13 May 2023.
| Time | Model 1 | Model 2 | Model 3 | Model 4 | Model 5 | Model 6 |
|---|---|---|---|---|---|---|
| 09:00 | 33.5 | 29.2 | 39.5 | 28.9 | 33.6 | 33.0 |
| 10:00 | 36.1 | 30.4 | 42.0 | 30.1 | 36.2 | 35.5 |
| 11:00 | 38.7 | 32.9 | 43.5 | 32.5 | 38.7 | 37.9 |
| 12:00 | 40.1 | 34.2 | 45.1 | 33.9 | 40.1 | 39.3 |
| 13:00 | 41.3 | 34.8 | 46.9 | 34.4 | 41.3 | 40.5 |
| 14:00 | 41.3 | 34.8 | 47.5 | 34.4 | 41.4 | 40.6 |
| 15:00 | 39.8 | 34.9 | 46.5 | 34.5 | 39.9 | 39.1 |
| 16:00 | 35.4 | 31.8 | 42.8 | 31.3 | 35.5 | 34.7 |
| 17:00 | 30.2 | 28.0 | 34.7 | 27.4 | 30.3 | 29.6 |
| 18:00 | 25.3 | 23.9 | 26.2 | 23.7 | 25.3 | 24.8 |
Table 8.
The average PET values (°C) of each model in the street canyon area at different times on 16 December 2022.
Table 8.
The average PET values (°C) of each model in the street canyon area at different times on 16 December 2022.
| Time | Model 1 | Model 2 | Model 3 | Model 4 | Model 5 | Model 6 |
|---|---|---|---|---|---|---|
| 11:00 | 17.7 | 16.3 | 20.7 | 16.3 | 18.1 | 19.5 |
| 12:00 | 17.8 | 16.3 | 20.8 | 16.3 | 18.1 | 19.6 |
| 13:00 | 17.1 | 15.7 | 20.1 | 15.7 | 17.5 | 18.9 |
| 14:00 | 15.8 | 14.7 | 18.5 | 14.7 | 16.1 | 17.4 |
| 15:00 | 14.2 | 13.6 | 15.7 | 13.6 | 14.4 | 15.6 |
| 16:00 | 12.1 | 12.0 | 12.6 | 11.9 | 12.3 | 13.2 |
| 17:00 | 10.3 | 10.4 | 10.3 | 10.4 | 10.4 | 11.2 |
| 18:00 | 10.2 | 10.3 | 10.2 | 10.3 | 10.3 | 11.0 |
| 19:00 | 10.2 | 10.2 | 10.1 | 10.3 | 10.2 | 11.0 |
Table 9.
A comparison between different tree and building features on the thermal comfort of the street canyon during hot and cold days.
Table 9.
A comparison between different tree and building features on the thermal comfort of the street canyon during hot and cold days.
| Advantages | Disadvantages | |
|---|---|---|
| Tall trees, large crown high canopy density, and LADs | Beneficial for decreasing air temperature and improving thermal comfort during hot days. | Play a quite active role in the reduction in air temperature and deteriorates thermal comfort during cold days. |
| Short and sparse hedges | Reduced air temperature and increased moisture due to hedges are beneficial for hot day thermal comfort improvement. Wind-resistant effects of hedges are beneficial for winter thermal comfort improvement. | Even if they are quite active in wind proofing and this is beneficial for thermal comfort during cold days, their transpiration effect can reduce the air temperature. |
| Buildings | Form building shadows and this is quite helpful for thermal comfort improvement during hot days. The wind-proofing effect of buildings can make the thermal comfort of the street canyon area better than other open spaces, which are heavily influenced by winds. | Even if buildings have a good wind-proofing effect and make the thermal comfort of the street canyon generally good during cold days, the building shadow area still has a lower temperature than areas with direct sunlight in the street canyon. |
| Areas with direct sunlight and without building or tree shadows | Good sunlight conditions are beneficial for the improvement of thermal comfort in the street canyon area during cold days. | Sunlit areas can have worse thermal comfort than shadowed areas during hot days. |
| Wind environment | On hot days, wind can play an active role in thermal comfort improvement. Thus, if the wind direction is parallel to the street and the wind speed is high, this is beneficial for the thermal comfort of the street canyon. | On cold days, wind can the reduce air temperature and deteriorate thermal comfort. Thus, if the wind direction is perpendicular to the street and the wind speed is low, this is beneficial for the thermal comfort of the street canyon. |
Disclaimer/Publisher’s Note: The statements, opinions and data contained in all publications are solely those of the individual author(s) and contributor(s) and not of MDPI and/or the editor(s). MDPI and/or the editor(s) disclaim responsibility for any injury to people or property resulting from any ideas, methods, instructions or products referred to in the content. |
© 2023 by the authors. Licensee MDPI, Basel, Switzerland. This article is an open access article distributed under the terms and conditions of the Creative Commons Attribution (CC BY) license (https://creativecommons.org/licenses/by/4.0/).
Share and Cite
MDPI and ACS Style
Liu, J.; Zheng, B.; Yang, F. A Simulation Study of the Impact of Urban Street Greening on the Thermal Comfort in Street Canyons on Hot and Cold Days. Forests 2023, 14, 2256. https://doi.org/10.3390/f14112256
AMA Style
Liu J, Zheng B, Yang F. A Simulation Study of the Impact of Urban Street Greening on the Thermal Comfort in Street Canyons on Hot and Cold Days. Forests. 2023; 14(11):2256. https://doi.org/10.3390/f14112256
Chicago/Turabian StyleLiu, Junyou, Bohong Zheng, and Fan Yang. 2023. "A Simulation Study of the Impact of Urban Street Greening on the Thermal Comfort in Street Canyons on Hot and Cold Days" Forests 14, no. 11: 2256. https://doi.org/10.3390/f14112256
Note that from the first issue of 2016, this journal uses article numbers instead of page numbers. See further details here.