Article

Spatial Distribution and Determinants of Aboveground Biomass in a Subalpine Coniferous Forest in Southwestern China

1
Institute of Ecology, and Key Laboratory for Earth Surface Processes of the Ministry of Education, College of Urban and Environmental Sciences, Peking University, Beijing 100871, China
2
School of Life Sciences, Peking University, Beijing 100871, China
3
State Key Laboratory of Vegetation and Environmental Change, Institute of Botany, Chinese Academy of Sciences, Beijing 100093, China
*
Author to whom correspondence should be addressed.
Forests 2023, 14(11), 2197; https://doi.org/10.3390/f14112197
Submission received: 30 September 2023 / Revised: 26 October 2023 / Accepted: 2 November 2023 / Published: 4 November 2023
(This article belongs to the Special Issue Aboveground and Belowground Interaction and Forest Carbon Cycling)

Abstract

:
Aboveground biomass (AGB) is the most dynamic carbon pool in forest ecosystems and is sensitive to biotic and abiotic factors. Previous studies on AGB have mostly focused on tropical and temperate forests, while studies on AGB and its determinants in subalpine coniferous forests are lacking and the mechanisms are not yet clear. Here, we systematically investigated all woody plants in 630 subplots (20 m × 20 m) in the Wanglang Plot (25.2 ha) to explore the spatial distribution of AGB and the effects of topography, soil, and stand structure on AGB. The results showed that AGB varied remarkably among different subplots with an average of 184.42 Mg/ha. AGB increased significantly with aspect, soil organic matter, maximum DBH, and important value of spruce–fir, while it decreased significantly with slope, total phosphorus, and stem density. Stand structure exerted greater influences than topography and soil factors, and especially maximum DBH determines the variation of AGB. Our results are of great significance to accurately estimate and predict the productivity of this forest type, and can provide insights into the diversity maintenance of subalpine coniferous forests as well as the conservation and management of forest ecosystems.

1. Introduction

Forests are the largest, most widely distributed and structurally complex of the terrestrial ecosystems [1]. They play a crucial role in the global carbon pool and dynamics, accounting for 45% of the total global terrestrial carbon [2,3,4]. The carbon stored in the trunks, branches, and leaves of plants is usually referred to as forest aboveground biomass (AGB) [5,6]. AGB is not only strongly dependent on the species composition and community structure of forests [7,8], but is also sensitive to changes in the natural environment (climate, topography, soil, etc.) and anthropogenic disturbances [9,10,11]. For specific forest types, estimating forest AGB accurately and distinguishing the relative importance of different factors are essential for the large-scale monitoring of forest productivity and carbon stocks, global carbon cycle studies, and the formulation of climate change mitigation strategies [12,13,14].
As a comprehensive factor, topography has an important effect on both forest species diversity and biomass [15,16]. Topography can not only reflect the microclimate (e.g., moisture, temperature), soil processes, and soil properties (e.g., soil water content, nutrient elements) [17,18], but can also influence solar radiation reaching the ground and habitat heterogeneity, which, in turn, affect forest structure and dynamics as well as plant growth [19,20,21]. Many studies have investigated the effects of topographic factors on forest AGB, and the results show that elevation, aspect, slope, and convexity are all strong predictors of the pattern of forest biomass [22,23,24,25]. However, the role of topographic factors on forest AGB is complex and varies greatly among different regions and forest types, which needs to be further investigated.
Soil provides support for plant growth, as well as essential organic matter, nutrients, and water, which can further influence the composition, structure, and biomass accumulation of forests [22,25,26]. Previous studies found that soil factors explained up to 30% of the variance in aboveground biomass, making them determinants [27,28]. Moreover, the relationship between soil nutrients and forest AGB is diverse, with positive, negative, and single-peaked relationships reported [28,29,30]. The soil fertility hypothesis summarized that plants can grow under conditions of high nutrient availability, but it may also lead to a high degree of competition, which can increase mortality and be detrimental to biomass accumulation [31,32]. Abundant studies have focused on exploring soil and climate interactions on forest AGB, but how soil factors regulate AGB under the influence of microtopography needs to be further explored.
Forest AGB is not only affected by environmental factors, but equally limited by biotic factors such as species diversity and stand structure [26,33,34]. Due to the complex structure of forests, the conclusions on the relationship between species diversity and forest biomass are not completely consistent [25,35], but a positive relationship was most commonly reported [36,37,38]. Stand structural attributes affecting the spatial distribution of AGB mainly include individual tree structure (DBH, tree height, wood density, etc.), species composition, community complexity, and large tree density, which can reflect the horizontal and vertical distribution of plant communities [7,39,40]. Previous studies suggested that species richness and stand structural complexity may also be the direct, independent, or alternative biotic factors of AGB, with stand structure being a better predictor [41,42,43]. Therefore, any study that attempts to address the patterns and determinants of AGB should take these important features of stand structure into account.
Subalpine coniferous forest dominated by spruce (Picea spp.) and fir (Abies spp.) is the main component of forests on the eastern margin of the Qinghai–Tibet Plateau, and is also the important ecological barrier in the upper reaches of the Yangtze River in China [44]. This area is one of the important giant panda (Ailuropoda melanoleuca) habitats, and is considered to be part of a biodiversity conservation hotspot in China [16,45]. However, coniferous forests in this region are vulnerable ecosystems owing to their variable microclimate conditions, heterogeneous local topography, and shallow soil layers, where the loss of species diversity is accelerating [46]. In recent decades, the establishment of a large number of forest dynamic plots has provided an ideal platform to characterize the spatial distribution of forest biomass and examine the factors regulating forest carbon storage, which contributes to monitoring temporal change in biomass pools at a larger scale [47,48]. Here, we performed a case study in a subalpine spruce–fir forest dynamic plot (25.2 ha) in Wanglang Nature Reserve, North Sichuan. Then, the species composition and structural characteristics of forest communities were systematically investigated, and corresponding environmental factors were obtained as well. We aimed to (1) explore the spatial distribution of AGB in a subalpine spruce–fir forest, and (2) elucidate how topography, soil properties, and stand structure affect forest biomass.

2. Materials and Methods
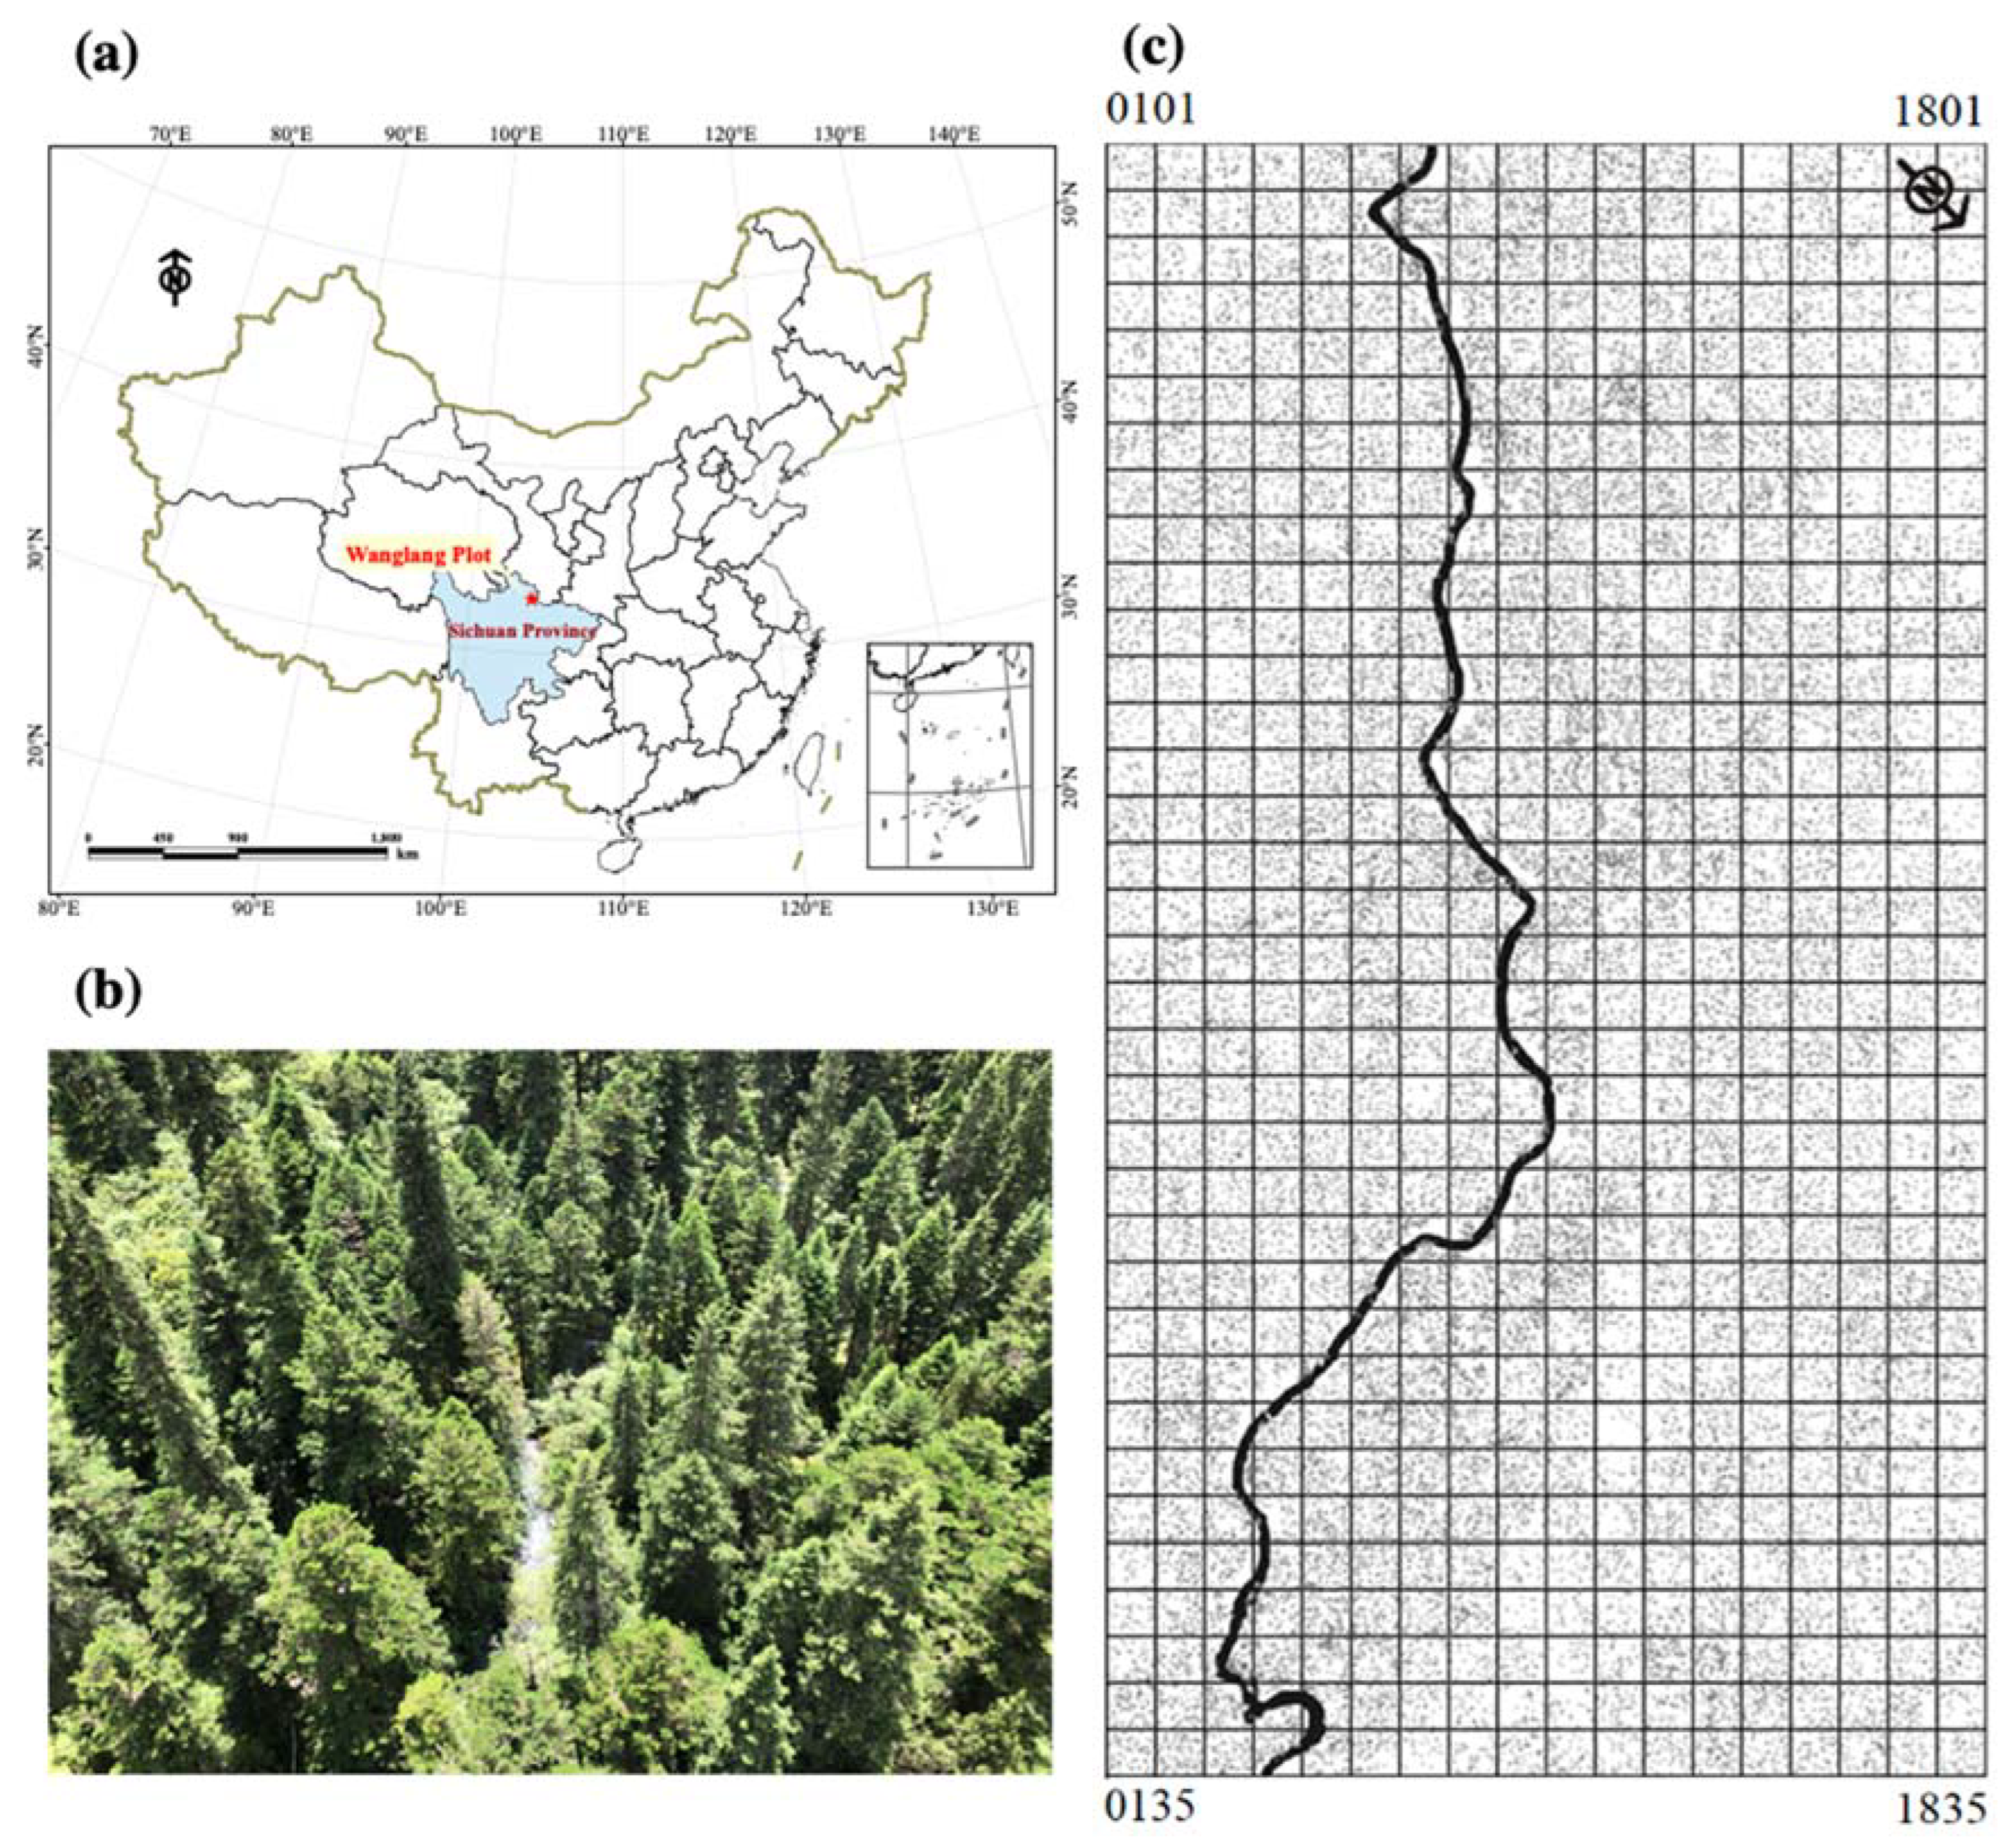
2.1. Study Sites

Our study was conducted in the Wanglang Dynamics Plot (104.02° E, 33.00° N, hereafter the Wanglang Plot), which is located in Wanglang Nature Reserve, southwestern China (Figure 1a,b). The construction of the Wanglang Plot started in 2016, with a total area of 25.2 ha. The plot consists of 18 columns and 35 rows, with a total of 630 subplots (each 20 m × 20 m) (Figure 1c). The climate in this area is characterized as a semi-humid monsoon climate, with a distinct rainy season from May to October. The mean annual temperature (MAT) is 2.3 °C and mean annual precipitation (MAP) is 862.5 mm. The Wanglang Plot is flat in the center, with a river running through it, and the elevations of the shady and sunny slopes on the sides increase. The soil types are subalpine meadow soil and mountain dark brown loam [16,49,50].
The Wanglang Nature Reserve has obvious vertical zonality, with vegetation types ranging from low altitude to high altitude, including deciduous broad-leaved forest, mixed coniferous and broad-leaved forest, subalpine coniferous forest, shrub, and alpine meadow. The Wanglang Plot we studied features a well-preserved subalpine coniferous forest dominated by Abies faxoniana and Picea purpurea (Figure 1b), with an elevation span of 2849–2947 m [16]. There are obvious bamboo (Fargesia denudate) layers of understory, which is the moving range of giant pandas. The Wanglang Plot is the only Forest Global Earth Observatory (ForestGEO) site that has been established in the giant panda habitats worldwide and joined the Chinese Forest Biodiversity Monitoring Network (CForBio) in 2020 [44].

2.2. Vegetation Investigation and AGB Estimation

We conducted a systematic investigation of woody stems with a main branch diameter at breast height (DBH) ≥ 1 cm in 630 subplots within the Wanglang Plot in 2019, recording their subplot number, measuring the DBH of the main branch and each sub-branch, identifying the species level as well as labeling the location of each individual (Figure 1c). The total number of listed plant individuals in the plot was 62,438, with a total of 117,472 branches (DBH ≥ 1 cm). In total, there were 48 species of woody plants, belonging to 15 families and 27 genera, with Abies faxoniana and Picea purpurea being the most dominant species (important value = 0.53, 0.21, respectively), followed by Betula and Acer. The species list and the important values of each family and genus of the Wanglang Plot are shown in Tables S1 and S2.
We used specific allometric equations for each part (stem, branch, leaf) of the woody plant species in nearby regions with similar climatic conditions or forest types to estimate the aboveground biomass [51]. Because of the large error in determining tree height in the plot, we uniformly chose the one-dimensional biomass equation based on DBH to calculate aboveground biomass according to Equation (1), where W is the biomass of each part (organ) of the plant, D is the DBH, and a and b are model parameters.
W = aDb
The stand structure variables of each subplot including species richness (SR), stem density, maximum DBH (max_DBH), DBH variance (cv_DBH), and important value of spruce–fir (spruce–fir_IV, indicated by relative total basal area) were calculated using the above investigation data, as shown in Table 1.

2.3. Soil Sampling and Determination

We randomly selected 234 subplots for soil sampling and determination, and the distribution of the plots investigated is shown in Figure S1. After the careful removal of the organic layer, soil cores were taken at the four corners and the center of the 20 m × 20 m subplot to a depth of 0–10 cm using a soil auger with an inner diameter of 3.8 cm. The five soil cores were mixed as one sample for the subplot and transported to the laboratory. Then, the soil samples were sieved through a 2 mm mesh after removing stones, roots, and other visible organic debris and were then air-dried for several days until reaching a constant weight. Soil organic matter (SOM) was determined using the K2CrO4 volumetric method. Soil total nitrogen (TN) was determined using a CHN analyzer using Dumas combustion (Vario EL III Elementar, Langenselbold, Germany). Soil total phosphorus (TP) was measured using the molybdate/ascorbic acid method after H2SO4-HClO4 digestion, and soil pH was determined by mixing the topsoil samples with distilled water at a 1:2.5 (w/v) ratio with a pH electrode (Five Easy Plus, Mettler Toledo, Columbus, OH, USA). Statistical information about the soil properties is shown in Table 1.

2.4. Topography Acquisition

We scanned the Wanglang Plot using a backpack Light Detection and Ranging (LiDAR) scanning system (LiBackpack DG50, Beijing Green Valley Technology Co., Ltd., Beijing, China). The LiDAR data were processed in Lidar360 V4.1 software through splicing, ground point extraction, denoising, and Kriging interpolation to obtain a digital elevation model (DEM) with a resolution of 0.2 m. Combining with the lowest elevation within the plot, we calculated and obtained topography data such as the slope, aspect, and elevation of each subplot in ArcGIS 10.3 [16]. The original aspect was converted into an angle to the north (Table 1, ranging from 0 to 180).

2.5. Statistical Analysis

We first summed the total AGB of each subplot, presenting the spatial pattern and frequency distribution of the AGB. The relationship between all measured variables (topography, soil, and stand structure) was assessed using Pearson correlation coefficients (Figure S2). Then, general linear regression models were applied to analyze the relationships between the different variables and AGB. We further conducted multiple linear regression models to compare the effect size of different variables on the forest AGB based on the standardized coefficients. Multicollinearity was tested using the variance inflation factor (VIF) and we removed the variables with a VIF > 5 from the model [52]. Model selection was conducted with the ‘MuMIn’ package in R, comparing all possible models and including all variables. The optimal model was selected based on Akaike information criterion (AIC) values [24], and then the model results were presented in a forest plot. We selected the final model including topography (slope, aspect), soil (SOM, TP), and stand structure (SR, Density, max_DBH, and spruce–fir_IV). In addition, to evaluate the relative importance of variables for explaining variation in AGB, we used hierarchical and variation partitioning analyses (VPA) to compare the relative contributions of the three groups of variables with the R package ‘rdacca.hp’ [53]. All variables were standardized before the regression analysis. All statistical analysis and graphical representations were mainly conducted using R 4.2.1 [54]. Finally, we employed structural equation models (SEMs) including topography, soil, and stand structure to access the direct and indirect effects of the selected variables on the AGB. The fitted model was evaluated by using the chi-square (χ2) test, root-mean-square error of approximation (RMSEA), and goodness-of-fit index (GFI). When the model satisfies p > 0.05, RMSEA < 0.05, and GFI > 0.90, the model is fitted well. SEM analysis was performed in the Amos 21.0 software (Amos Development Corporation, Chicago, IL, USA). Statistical significance was determined as p < 0.05 unless otherwise noted.

3. Results

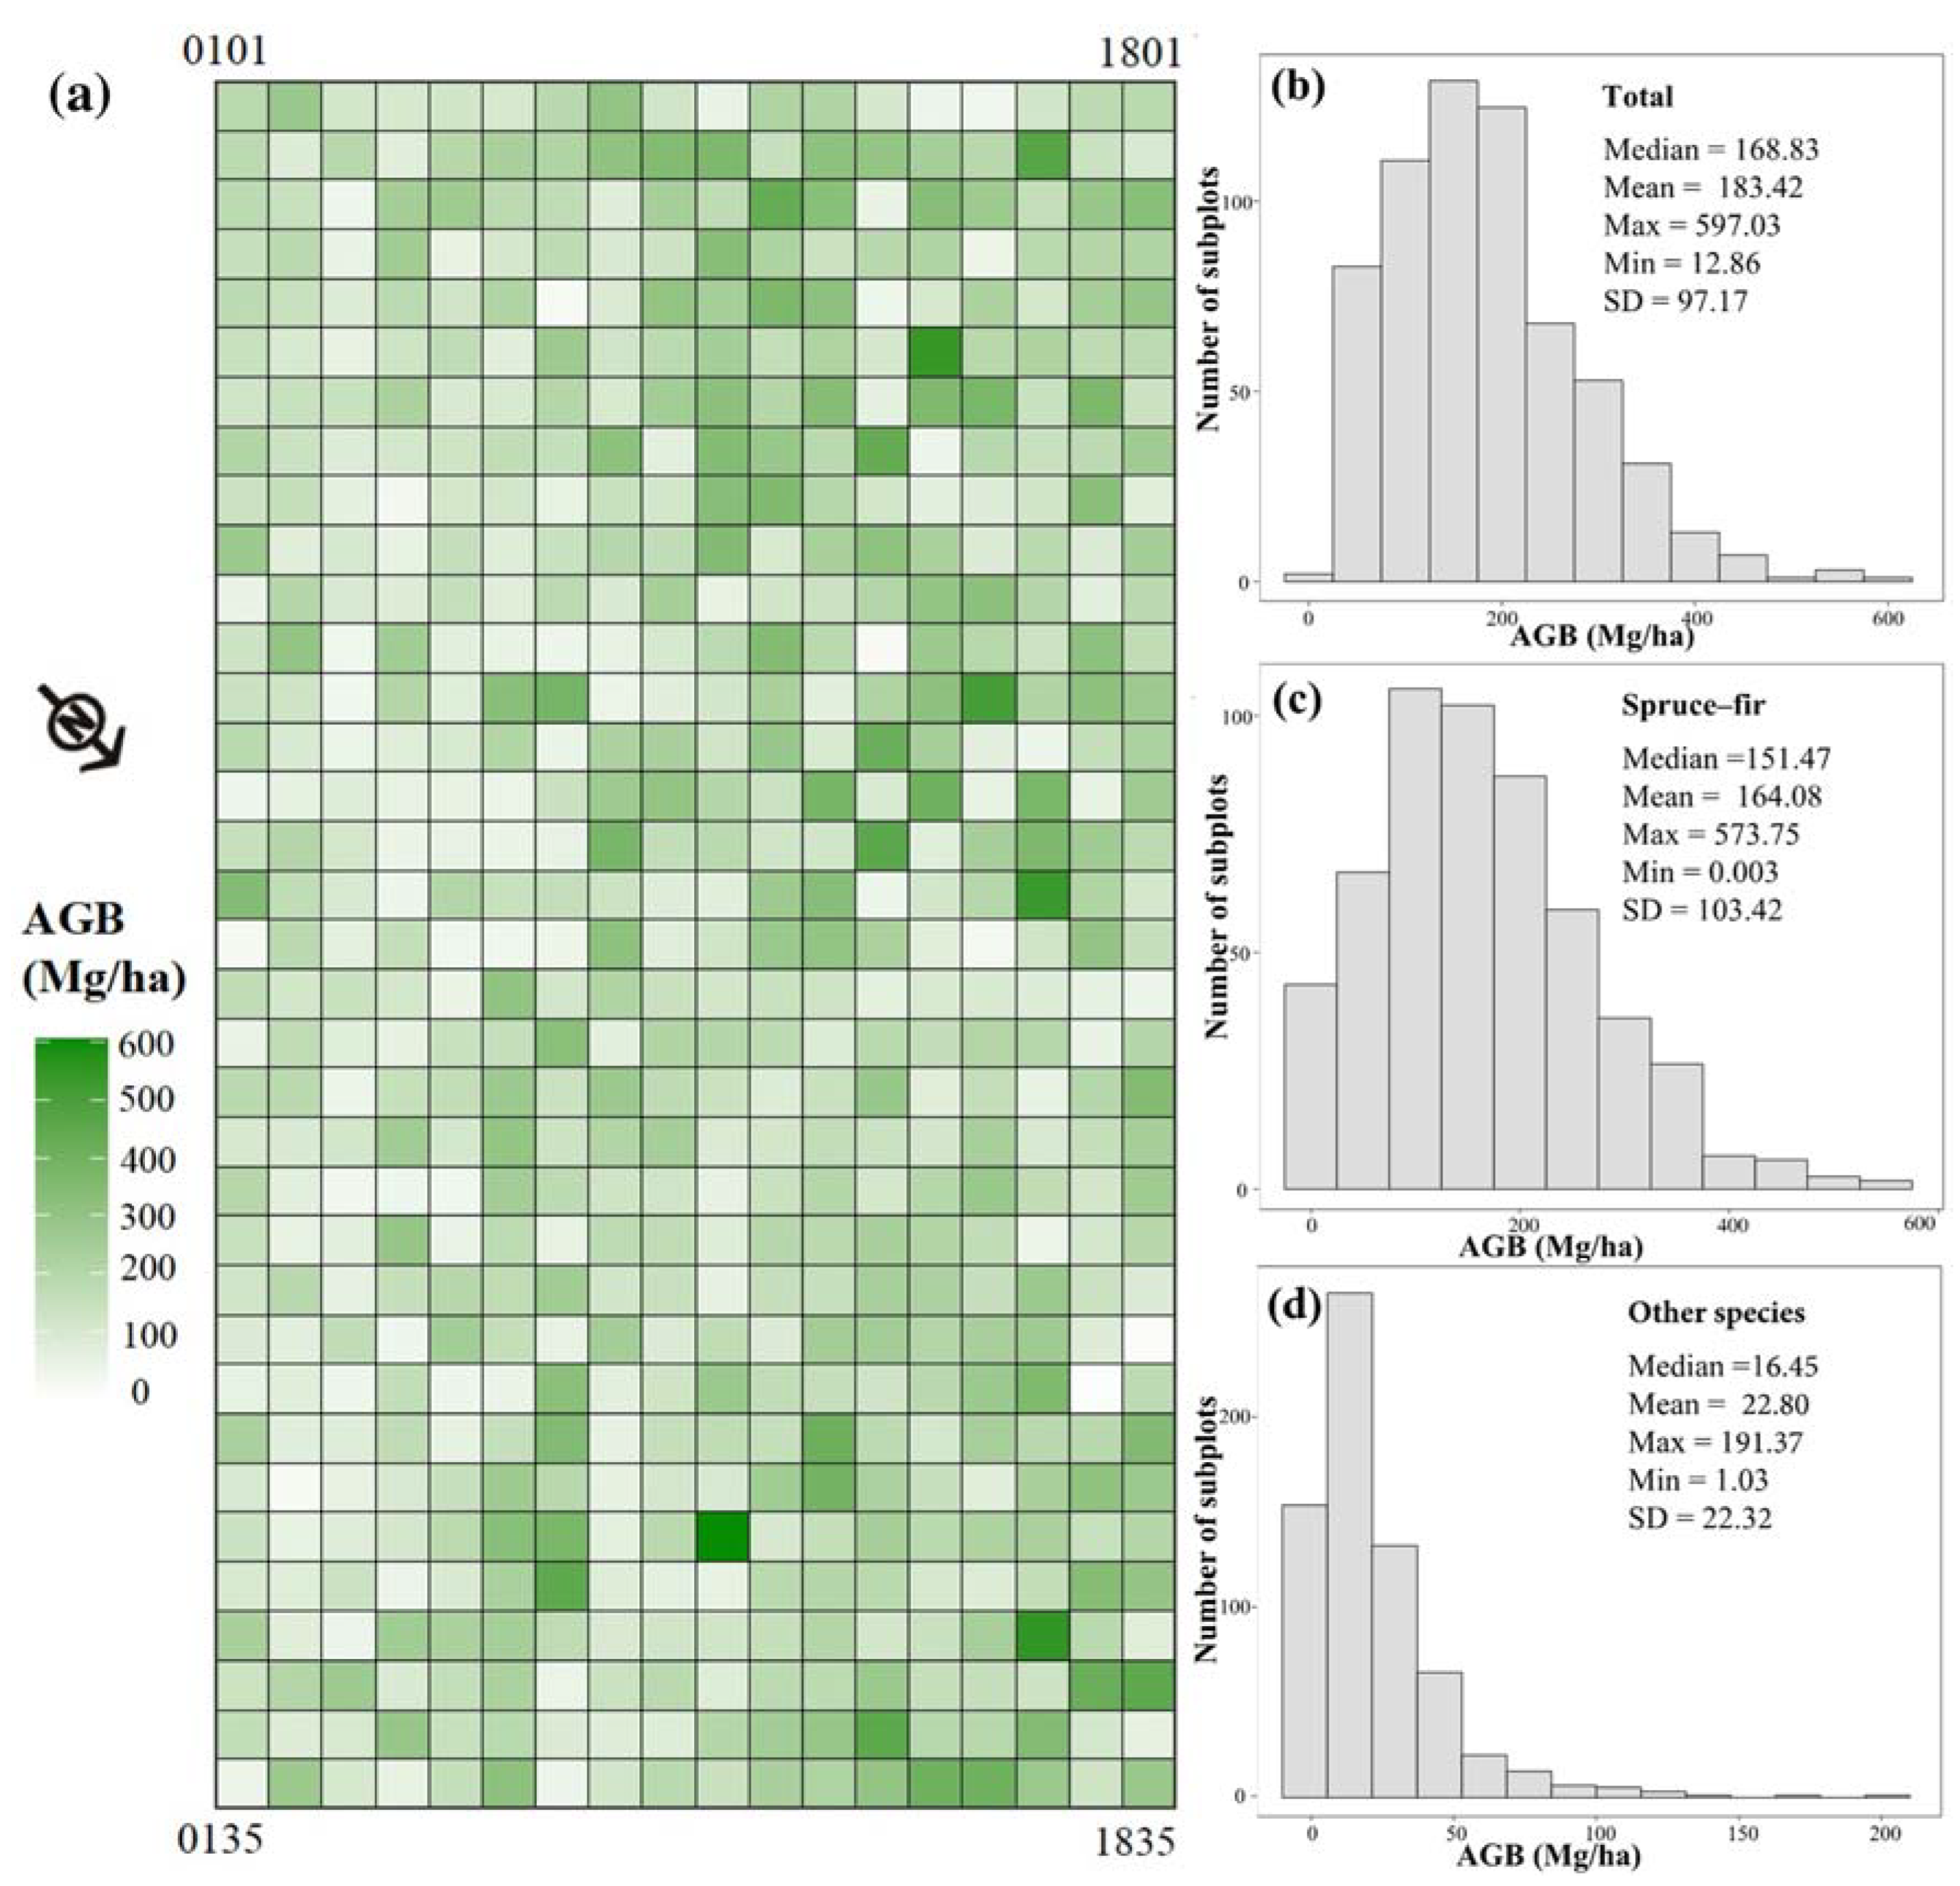
3.1. Spatial Distribution of Forest AGB

The spatial distribution of AGB in the Wanglang Plot was mapped based on biomass estimated from 630 subplots (Figure 2a). The AGB was higher in the middle of the plot where it was flatter, and lower on both sides of the plot where it was steeper. The forest AGB was higher on the southern aspects than on the northern aspects as well. The mean value of total AGB was 183.43 Mg/ha, the median value was 168.83 Mg/ha, the standard deviation was 97.17, and the maximum value was 14.26 times the minimum value (Figure 2b). The total AGB in the plot showed an approximately normal distribution, with most of the subplots having an AGB of 100–200 Mg/ha. The mean value of the AGB of spruce–fir and other species were 164.08 and 22.80 Mg/ha, ranging from 0.003 to 573.75 Mg/ha and from 1.03 to 191.37 Mg/ha, respectively (Figure 2c,d).

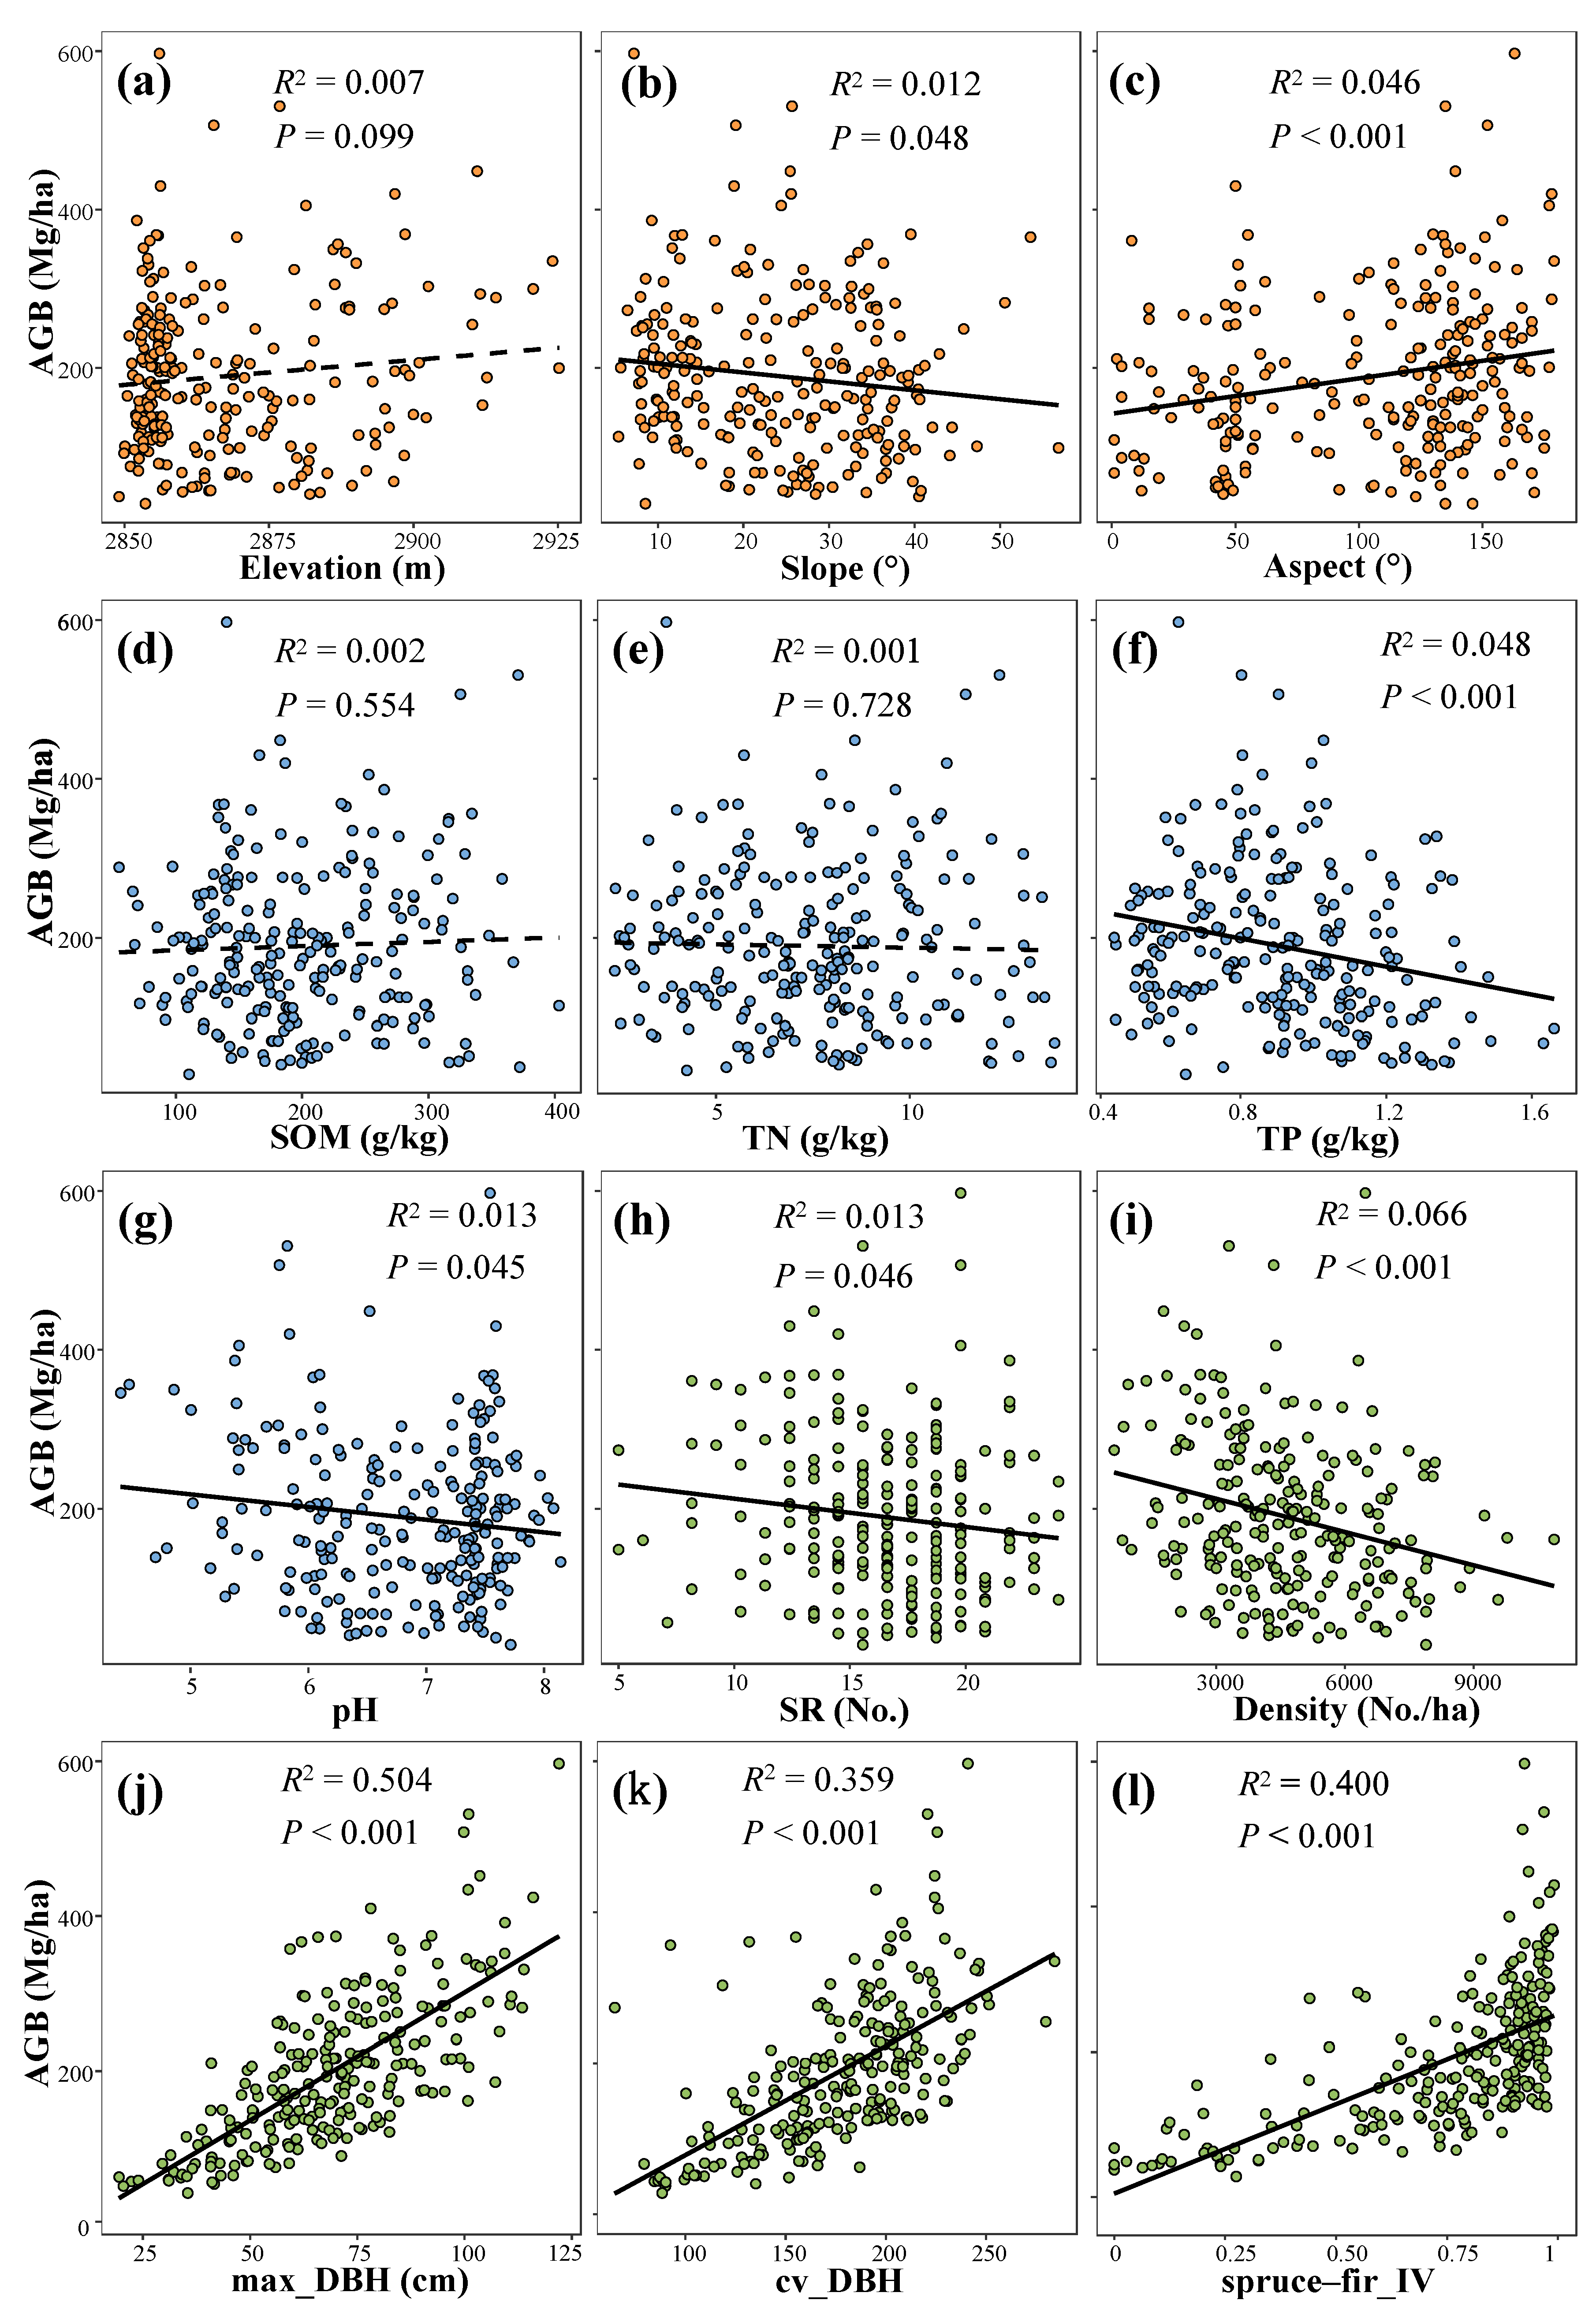
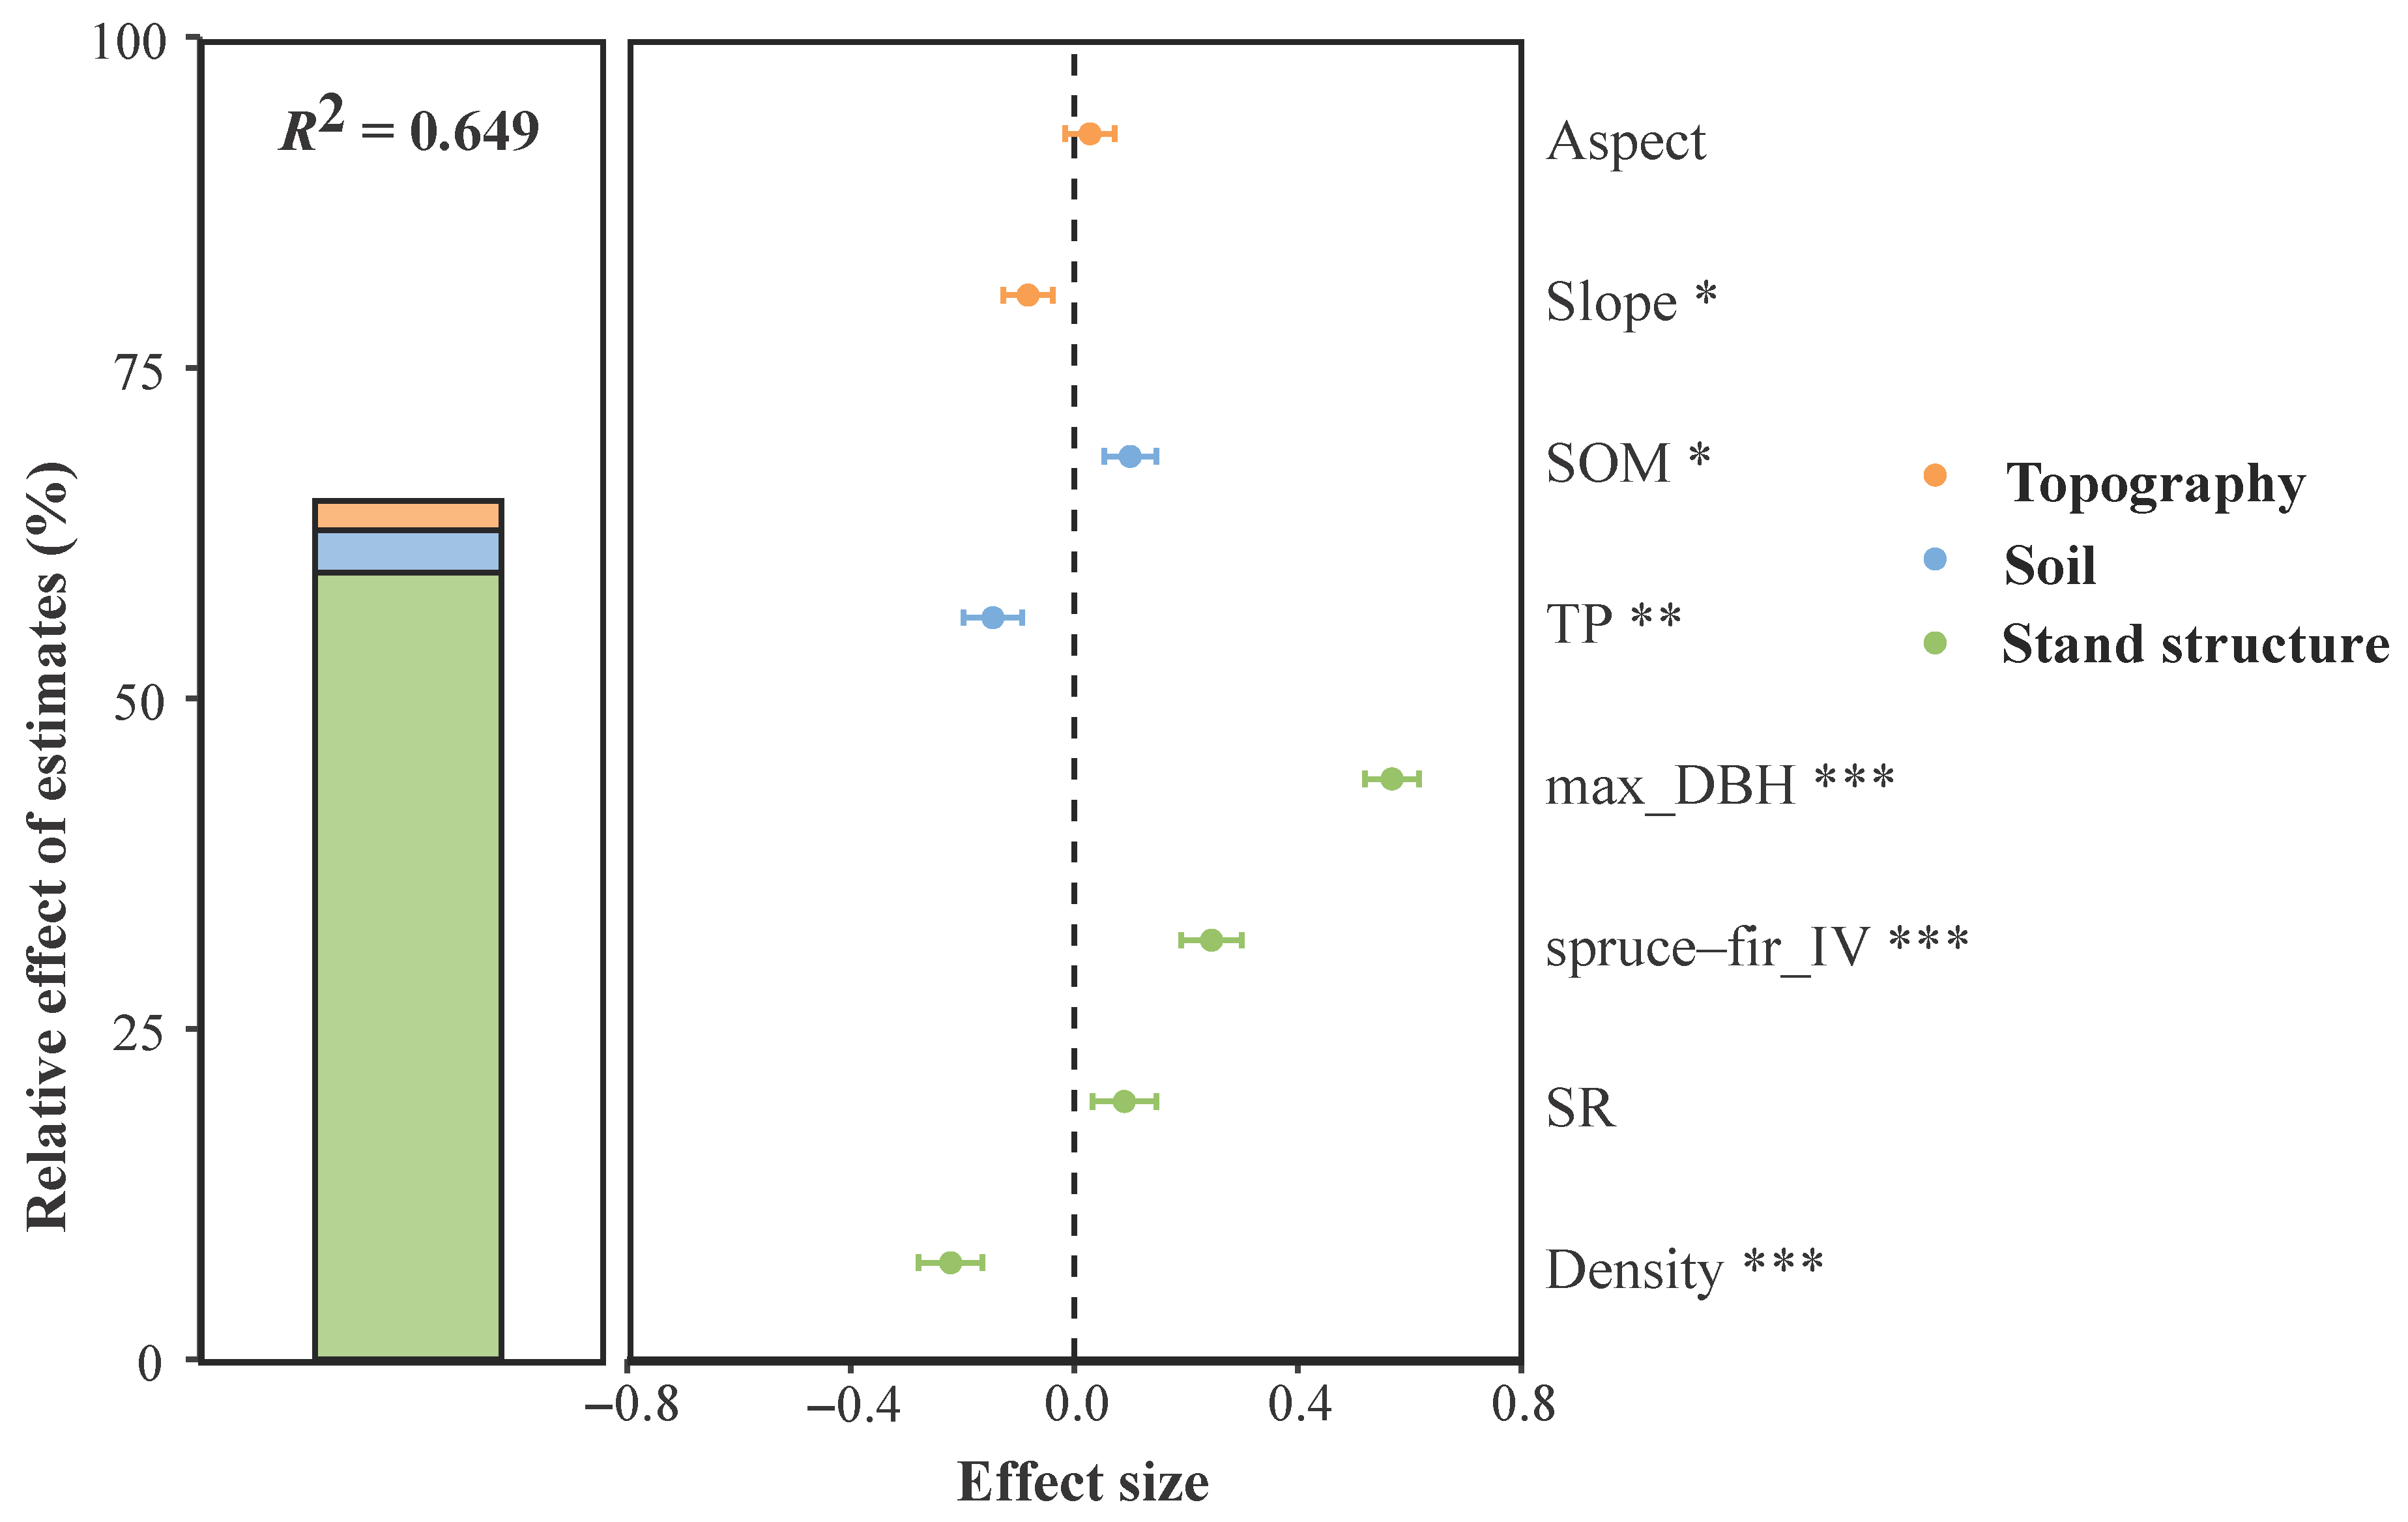
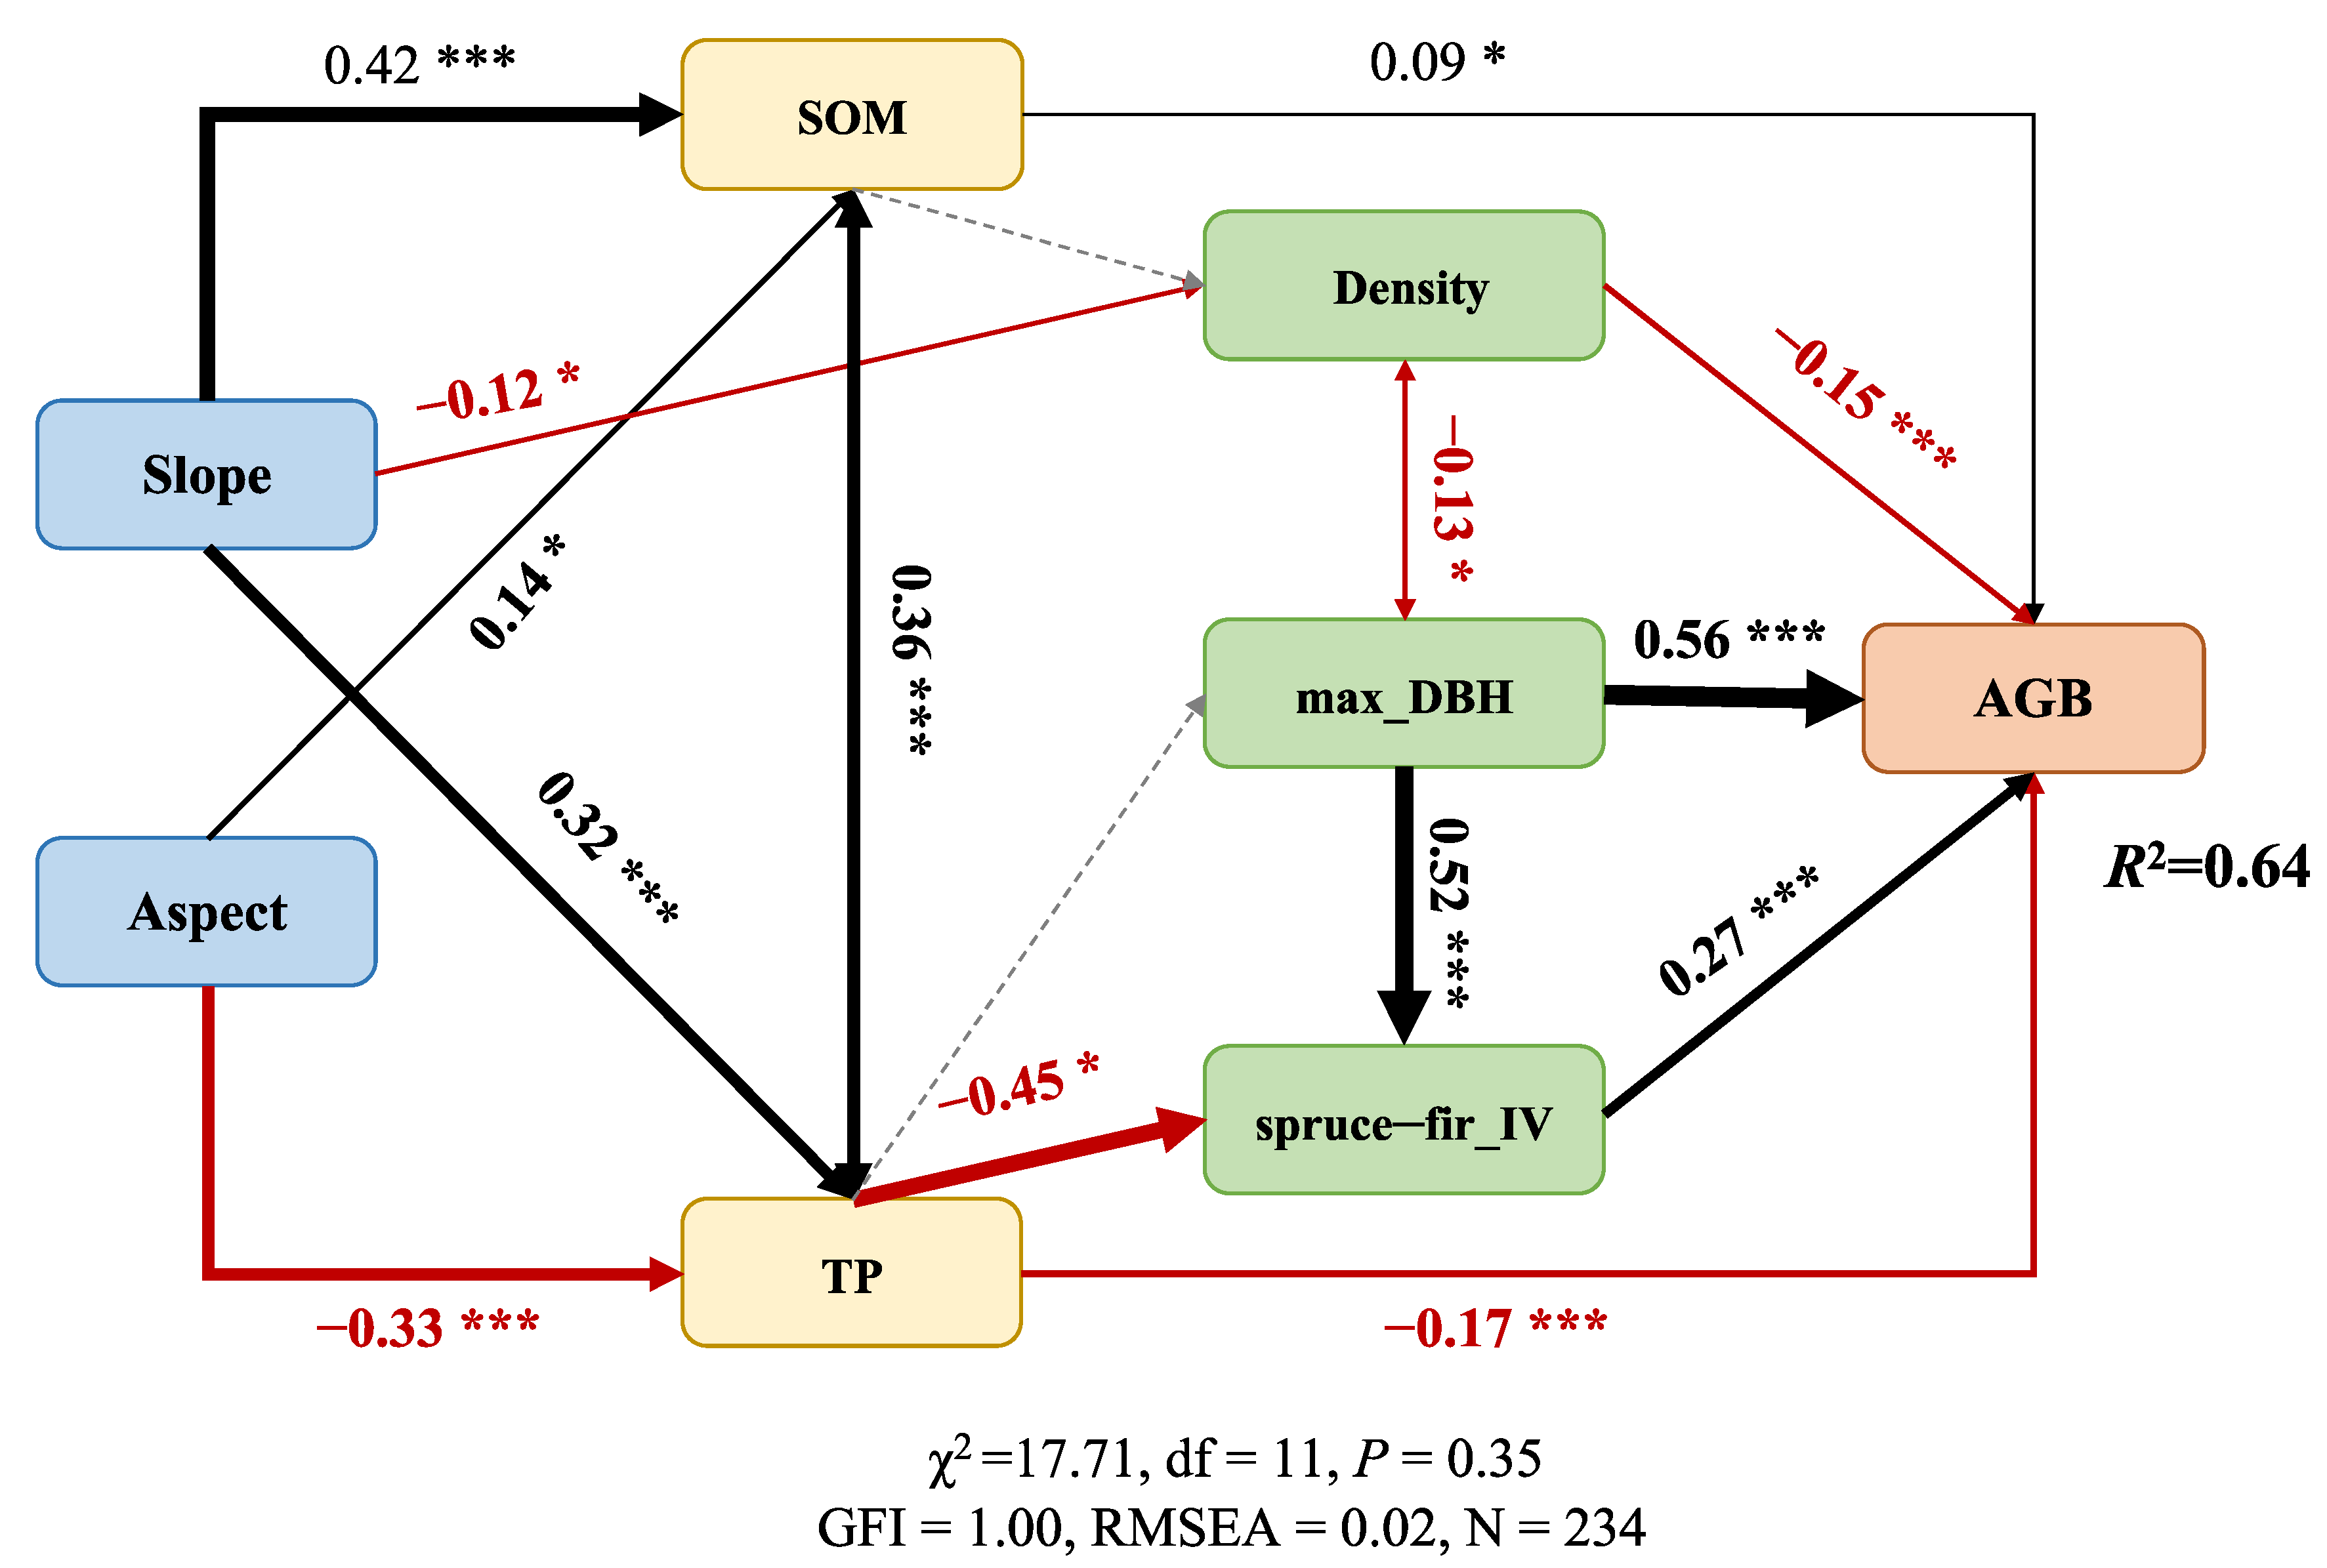
3.2. Topography, Soil, and Stand Structure Factors Affecting Forest AGB

For topography factors, AGB decreased significantly with slope (R2 = 0.012, p = 0.048, Figure 3b), and increased significantly with aspect (R2 = 0.046, p < 0.001, Figure 3c), but had no significant relationship with elevation. For soil factors, AGB decreased significantly with soil TP and pH (R2 = 0.048, p < 0.001, R2 = 0.013, p = 0.045, Figure 3f,g), but did not change significantly with soil TN or SOM. For stand structure factors, AGB exhibited significantly negative correlations with SR and Density (R2 = 0.013, p = 0.046, R2 = 0.066, p < 0.001, Figure 3h,i), but exhibited significantly positive correlations with max_DBH, cv_DBH, and spruce–fir_IV (R2 = 0.504, 0.359, 0.400, p < 0.001, respectively, Figure 3j–l). Of all factors, max_DBH had the greatest effect on AGB, followed by spruce–fir_IV. Subplots with larger maximum DBH were characterized by lower species richness and stem density (Figure S2).
The topography, soil, and stand structure variables together accounted for 64.9% of the total variations in forest AGB according to the variation partitioning analyses (Figure 4). Stand structure explained a much larger proportion of the variance (59.5%) than soil (3.22%) and topography (2.22%) factors did. Multiple linear regression analysis showed that max_DBH still had the greatest effect on AGB (positive effect), followed by spruce–fir_IV, and the effect direction remaining unchanged (Figure 4). Density had the largest negative effect on AGB. After controlling for other variables, aspect had no significant effect on AGB, while the effect of SR on AGB was positive, but not significant. For the soil factors, SOM significantly affected AGB (positive effect) while TP showed the opposite effect (Figure 4).
The structural equation models revealed the direct and indirect effects of three groups of variables on AGB (Figure 5, Table 2). Topography mainly affected AGB by modulating the soil properties and stand structure. Slope increased SOM and TP and reduced stem density to achieve a negative effect on AGB (total effects = −0.022). Aspect indirectly promoted AGB by increasing SOM and reducing TP (total effects = 0.098). SOM directly promoted AGB (total effects = 0.100), while TP reduced AGB through direct path and reducing spruce–fir_IV (total effects = −0.256). Stand structure directly affected AGB, with max_DBH and spruce–fir_IV showing positive effects (total effects = 0.703 and 0.272, respectively), while stem density had a negative effect (total effects = −0.163).

4. Discussion

4.1. Stand Structure Determined Forest AGB

In our study, it was found that stand structure plays a more important role in determining forest aboveground biomass than topography and soil factors, explaining a large proportion (59.5%) of the total variation (Figure 4). In particular, the max_DBH had the highest contribution and was the determinant of the spatial distribution of forest AGB (Figure 3j, Figure 4 and Figure 5). Previous studies have reported that stand structure is a better predictor of AGB [40,42,43]. The stand structure of individuals including DBH, tree height, and wood density are often used as variables in biomass equations; therefore, factors associated with individual size also have strong positive correlations with AGB [55]. Trees with a larger DBH tend to have large heights and high woody volumes, which leads to the storage of large quantities of carbon and contributes greatly to the AGB [7,56]. In addition, the size of the larger individuals mainly reflects the age of the forest community, indicating that the community is progressively less affected by disturbance, which tends to have a great potential for carbon sequestration and biomass accumulation along the chronosequence [57]. Species traits related to maximum tree size might also play an important role in explaining large-scale variations in AGB [28,29,55,58], which requires further confirmation in future studies. The cv_DBH, which represents the structural complexity of the forest, also had a large effect on AGB (Figure 3k). Higher DBH variance indicates the presence of individuals of all sizes in plot and diverse ecological niche differentiation, which enables better use of the space, resources, and energy, favoring biomass accumulation [34,41]. However, due to the strong collinearity between cv_DBH and max_DBH, we did not consider it in the following multiple linear regression models and SEMs (Figure 4 and Figure 5).
We found that stem density had a significant negative effect on forest AGB (Figure 3i, Figure 4 and Figure 5). The forest biomass is a composite of individual biomass, and it is generally accepted that the higher the stem density in a forest, the more biomass that has accumulated [55]. But in the Wanglang Plot we studied, there were fewer large trees in the subplots with high stem density, which indicated a significant negative correlation between them (Figure S2). Therefore, the AGB of subplots with high stem density was lower instead. Although positive stem density and biomass relationships have been observed in many studies [56,59], it may depend on the forest type or spatial scale [60]. Many studies have reached the main conclusion that species richness enhanced the forest productivity and promoted the accumulation of biomass in different forest types [37,38,61]. We found a negative correlation between species richness and AGB using general linear regression models (Figure 3h). But when topography and soil variables were controlled, there was a positive relationship between SR and AGB, although the effect of SR was relatively small compared to other variables (Figure 4).

4.2. Influence of Topography and Soil on Forest AGB

Topography and soil affect the AGB variability in forests; however, the influence can be overshadowed by the various structural conditions existing in the stands that make up the forest [15,62]. In this study, we found that the effect of topography and soil variables on forest AGB was smaller than that of stand structure, and they explained a total of 2.22% and 3.22% of the variation in AGB, respectively (Figure 4). The results of the SEMs suggested that topography and soil mainly affect AGB by modulating the stand structure of forests (Figure 5 and Table 2). The significant indirect effect of soil fertility on AGB corroborates previous reports [63], which also demonstrated that soil P content is a key driver of forest biomass dynamics. AGB increased significantly with SOM, but decreased significantly with TP in our study (Figure 4 and Figure 5); that is, AGB changes inconsistently with increasing soil fertility. This may be due to the low accumulation of SOM in this forest, where the soil is high in TP, but relatively low in AP [28]. Numerous studies have found that forest biomass is greater on fertile soils because fertile soils help to increase the number and size of trees, and therefore more biomass can be accumulated [27,29]; however, there are also studies that have found lower biomass on fertile soils [30]. Fertile soils may lead to a high degree of competition that may also increase forest turnover, causing lower biomass due to carbon loss from forest mortality [28]. Another explanation is that trees growing in low-fertility soils usually employ a conservative growth strategy, increasing their wood density and longevity and then resulting in high overall AGB [31,32]. There is also a hypothesis that a one-peak curve relationship between soil nutrients and AGB is existed, which still needs to be further explored [30].
Slope and aspect were the main topography factors in this study, and forest aboveground biomass increased with aspect, but decreased with slope (Figure 3b,c), which contributes to the formation of a distribution pattern with the highest AGB on flatlands, followed by southern aspects, and the lowest on the northern aspects (Figure 2a). Topography influenced the microclimate as well as soil properties, which may, in turn, affect species distribution and community composition [21,64], eventually determining AGB. In our study, topography mainly affected AGB by altering the soil properties and stem density (Figure 5). Aspect had a significant effect on AGB, with higher biomass on southern aspects than on northern aspects, which is consistent with the results of other studies [65,66,67]. AGB was shown to differ between sites with sunny and shady aspects by affecting stem density and species diversity [68]. In the northern hemisphere, southern aspects generally have long daylight hours, abundant light resources, and relatively high temperatures [65,66]. According to the species–energy hypothesis, higher energy can support more individuals, thus favoring the maintenance of higher levels of species diversity in the community [69,70]. Previous study supported our result that AGB exhibited a negative relationship with slope [62]. Slope is an important driver of water and soil nutrient mobility [67,71], and soils with high slopes tend to be dry and heavily leached of nutrients, with acidic soils [72], which is not conducive to plant growth, maintenance of diversity, and accumulation of AGB. The weak effect of elevation on AGB might be attributed to the relatively small range of elevations in the Wanglang Plot.

5. Conclusions

In this study, we investigated 630 subplots to explore the spatial distribution and determinants of forest AGB in the Wanglang Plot in southwestern China. The results showed that the AGB varied remarkably among different subplots, with an average of 184.42 Mg/ha. The overall distribution of AGB was highest on flatlands, followed by southern aspects, and the lowest distribution was found on northern aspects. AGB was jointly shaped by topography, soil, and stand structure, with aspect, SOM, max_DBH, and spruce–fir_IV promoting AGB significantly, while slope, TP, and stem density reduced AGB significantly. Among all variables, maximum DBH determined the spatial distribution of forest AGB. As a result, more attention needs to be paid to large trees, which contribute strongly to carbon storage in forest ecosystems. Our results are of great significance to accurately estimate and predict the productivity of the subalpine coniferous forest, and can provide insights into the diversity maintenance as well as the conservation and management of forest ecosystems.

Supplementary Materials

The following supporting information can be downloaded at: https://www.mdpi.com/article/10.3390/f14112197/s1: Figure S1. Distribution of plots investigated for soil properties; Figure S2. Correlations between topography, soil, and stand structure variables (N = 234). The size and the color gradient of the circle represent Pearson’s correlation coefficients. SOM, soil organic matter; TN, total nitrogen content; TP, total phosphorus content; SR, species richness; Density, stem density; max_DBH, maximum DBH; cv_DBH, DBH variance; spruce–fir_IV, important value of spruce–fir. * p < 0.05, ** p < 0.01, *** p < 0.001; Figure S3. Regression relationships between forest aboveground biomass and topography, soil, and stand structure variables (N = 630). (a) Elevation, (b) slope, (c) aspect, (d) species richness, (e) stem density, (f) maximum DBH, (g) DBH variance, and (h) important value of spruce–fir; Table S1. Woody plant list in the Wanglang Plot; Table S2. Importance value (IV) of woody plants in the Wanglang Plot.

Author Contributions

Conceptualization, X.N., C.J. and J.Z.; Methodology, X.N., Q.C., F.F., C.H., S.L. and X.S.; Formal analysis, X.N., X.X. and Q.C.; Investigation, X.X., F.F. and C.J.; Writing—original draft, X.N.; Writing—review & editing, X.N., Q.C., F.F., C.H., C.J., J.Z., S.L. and X.S.; Visualization, X.N., X.X., Q.C. and C.H.; Funding acquisition, J.Z. All authors have read and agreed to the published version of the manuscript.

Funding

This work was supported by the National Natural Science Foundation of China (No. 32271622).

Data Availability Statement

Data are available upon reasonable request from the corresponding author.

Acknowledgments

We thank Yuhao Feng for helpful suggestions on data analysis. We also thank the editors and anonymous reviewers for their constructive comments on the manuscript.

Conflicts of Interest

The authors declare no conflict of interest.

References

  1. Tamiminia, H.; Salehi, B.; Mahdianpari, M.; Beier, C.M.; Johnson, L. Mapping two decades of New York State Forest aboveground biomass change using remote sensing. Remote Sens. 2022, 14, 4097. [Google Scholar] [CrossRef]
  2. Beer, C.; Reichstein, M.; Tomelleri, E.; Ciais, P.; Jung, M.; Carvalhais, N.; Rödenbeck, C.; Arain, M.A.; Baldocchi, D.; Bonan, G.B.; et al. Terrestrial gross carbon dioxide uptake: Global distribution and covariation with climate. Science 2010, 329, 834–838. [Google Scholar] [CrossRef] [PubMed]
  3. Pan, Y.; Birdsey, R.; Fang, J.; Houghton, R.; Kauppi, P.; Kurz, W.; Phillips, O.L.; Shvidenko, A.; Lewis, S.L.; Canadell, J.G.; et al. A large and persistent carbon sink in the world’s forests. Science 2011, 333, 988–993. [Google Scholar] [CrossRef] [PubMed]
  4. King, A.W.; Hayes, D.J.; Huntzinger, D.N.; WesSt, T.O.; Post, W.M. North American carbon dioxide sources and sinks: Magnitude, attribution, and uncertainty. Front. Ecol. Environ. 2012, 10, 512–519. [Google Scholar] [CrossRef]
  5. Houghton, R.A. Aboveground Forest biomass and the global carbon balance. Glob. Chang. Biol. 2005, 11, 945–958. [Google Scholar] [CrossRef]
  6. Fahey, T.J.; Woodbury, P.B.; Battles, J.J.; Goodale, C.L.; Hamburg, S.P.; Ollinger, S.V.; Woodall, C.W. Forest carbon storage: Ecology, management, and policy. Front. Ecol. Environ. 2010, 8, 245–252. [Google Scholar] [CrossRef]
  7. Slik, J.F.; Paoli, G.; McGuire, K.; Amaral, I.; Barroso, J.; Bastian, M.; Blanc, L.; Bongers, F.; Boundja, P.; Clark, C.; et al. Large trees drive forest aboveground biomass variation in moist lowland forests across the tropics. Glob. Ecol. Biogeogr. 2013, 22, 1261–1271. [Google Scholar] [CrossRef]
  8. Liu, X.; Trogisch, S.; He, J.S.; Niklaus, P.A.; Bruelheide, H.; Tang, Z.; Erfmeier, A.; Scherer-Lorenzen, M.; Pietsch, K.A.; Yang, B.; et al. Tree species richness increases ecosystem carbon storage in subtropical forests. Proc. R. Soc. B 2018, 285, 20181240. [Google Scholar] [CrossRef]
  9. Lin, D.; Lai, J.; Muller-Landau, H.C.; Mi, X.; Ma, K. Topographic variation in aboveground biomass in a subtropical evergreen broad-leaved forest in China. PLoS ONE 2012, 7, e48244. [Google Scholar] [CrossRef]
  10. Liang, J.; Crowther, T.W.; Picard, N.; Wiser, S.; Zhou, M.; Alberti, G.; Schulze, E.D.; McGuire, A.D.; Bozzato, F.; Pretzsch, H.; et al. Positive biodiversity-productivity relationship predominant in global forests. Science 2016, 354, aaf8957. [Google Scholar] [CrossRef]
  11. Babst, F.; Bouriaud, O.; Poulter, B.; Trouet, V.; Girardin, M.P.; Frank, D.C. Twentieth century redistribution in climatic drivers of global tree growth. Sci. Adv. 2019, 5, eaat4313. [Google Scholar] [CrossRef]
  12. Zhao, F.; Guo, Q.; Kelly, M. Allometric equation choice impacts lidar-based forest biomass estimates: A case study from the Sierra National Forest, CA. Agric. For. Meteorol. 2012, 165, 64–72. [Google Scholar] [CrossRef]
  13. Pan, Y.; Birdsey, R.A.; Phillips, O.L.; Jackson, R.B. The structure, distribution, and biomass of the world’s forests. Annu. Rev. Ecol. Evol. Syst. 2013, 44, 593. [Google Scholar] [CrossRef]
  14. Yang, Q.; Su, Y.; Hu, T.; Jin, S.; Liu, X.; Niu, C.; Liu, Z.; Kelly, M.; Wei, J.; Guo, Q. Allometry-based estimation of forest aboveground biomass combining lidar canopy height attributes and optical spectral indexes. For. Ecosyst. 2022, 9, 617–629. [Google Scholar] [CrossRef]
  15. Swetnam, T.L.; Brooks, P.D.; Barnard, H.R.; Harpold, A.A.; Gallo, E.L. Topographically driven differences in energy and water constrain climatic control on forest carbon sequestration. Ecosphere 2017, 8, e01797. [Google Scholar] [CrossRef]
  16. Xiong, X.; Zhu, J.; Li, S.; Fan, F.; Cai, Q.; Ma, S.; Su, H.; Ji, C.J.; Tang, Z.; Fang, J. Aboveground biomass and its biotic and abiotic modulators of a main food bamboo of the giant panda in a subalpine spruce–fir forest in southwestern China. J. Plant Ecol. 2022, 15, 1–12. [Google Scholar] [CrossRef]
  17. Luizão, R.C.; Luizão, F.J.; Paiva, R.Q.; Monteiro, T.F.; Sousa, L.S.; Kruijt, B. Variation of carbon and nitrogen cycling processes along a topographic gradient in a central Amazonian Forest. Glob. Chang. Biol. 2004, 10, 592–600. [Google Scholar] [CrossRef]
  18. Culmsee, H.; Leuschner, C.; Moser, G.; Pitopang, R. Forest aboveground biomass along an elevational transect in Sulawesi, Indonesia, and the role of Fagaceae in tropical montane rain forests. J. Biogeogr. 2010, 37, 960–974. [Google Scholar] [CrossRef]
  19. Larsen, D.R.; Speckman, P.L. Multivariate regression trees for analysis of abundance data. Biometrics 2004, 60, 543–549. [Google Scholar] [CrossRef]
  20. Méndez-Toribio, M.; Meave, J.A.; Zermeño-Hernández, I.; Ibarra-Manríquez, G. Effects of slope aspect and topographic position on environmental variables, disturbance regime and tree community attributes in a seasonal tropical dry forest. J. Veg. Sci. 2016, 27, 1094–1103. [Google Scholar] [CrossRef]
  21. Sundqvist, M.K.; Sanders, N.J.; Wardle, D.A. Community and ecosystem responses to elevational gradients: Processes, mechanisms, and insights for global change. Annu. Rev. Ecol. Evol. Syst. 2013, 44, 261–280. [Google Scholar] [CrossRef]
  22. de Castilho, C.V.; Magnusson, W.E.; de Araújo, R.N.O.; Luizao, R.C.; Luizao, F.J.; Lima, A.P.; Higuchi, N. Variation in aboveground tree live biomass in a central Amazonian Forest: Effects of soil and topography. For. Ecol. Manag. 2006, 234, 85–96. [Google Scholar] [CrossRef]
  23. McEwan, R.W.; Lin, Y.C.; Sun, I.F.; Hsieh, C.F.; Su, S.H.; Chang, L.W.; Song, G.Z.M.; Wang, H.H.; Hwong, J.L.; Lin, K.C.; et al. Topographic and biotic regulation of aboveground carbon storage in subtropical broad-leaved forests of Taiwan. For. Ecol. Manag. 2011, 262, 1817–1825. [Google Scholar] [CrossRef]
  24. Fotis, A.T.; Murphy, S.J.; Ricart, R.D.; Krishnadas, M.; Whitacre, J.; Wenzel, J.W.; Queenborough, S.A.; Comita, L.S. Aboveground biomass is driven by mass-ratio effects and stand structural attributes in a temperate deciduous forest. J. Ecol. 2017, 106, 561–570. [Google Scholar] [CrossRef]
  25. Ding, Y.; Zang, R.G. Determinants of aboveground biomass in forests across three climatic zones in China. For. Ecol. Manag. 2021, 482, 118805. [Google Scholar] [CrossRef]
  26. Ali, A.; Lin, S.-L.; He, J.-K.; Kong, F.-M.; Yu, J.-H.; Jiang, H.-S. Climate and soils determine aboveground biomass indirectly via species diversity and stand structural complexity in tropical forests. For. Ecol. Manag. 2019, 432, 823–831. [Google Scholar] [CrossRef]
  27. Laurance, W.F.; Fearnside, P.M.; Laurance, S.G.; Delamonica, P.; Lovejoy, T.E.; Rankin-de Merona, J.M.; Chambers, J.Q.; Gascon, C. Relationship between soils and Amazon Forest biomass: A landscape-scale study. For. Ecol. Manag. 1999, 118, 127–138. [Google Scholar] [CrossRef]
  28. Paoli, G.D.; Curran, L.M.; Slik, J.W.F. Soil nutrients affect spatial patterns of aboveground biomass and emergent tree density in southwestern Borneo. Oecologia 2008, 155, 287–299. [Google Scholar] [CrossRef]
  29. Dewalt, S.J.; Chave, J. Structure and Biomass of Four Lowland Neotropical Forests. Biotropica 2004, 36, 7–19. [Google Scholar] [CrossRef]
  30. Baraloto, C.; Rabaud, S.; Molto, Q.; Blanc, L.; Fortunel, C.; Herault, B.; Dávila, N.; Mesones, I.; Rios, M.; Valderrama, E.; et al. Disentangling stand and environmental correlates of aboveground biomass in Amazonian forests. Glob. Chang. Biol. 2011, 17, 2677–2688. [Google Scholar] [CrossRef]
  31. Quesada, C.A.; Phillips, O.L.; Schwarz, M.; Czimczik, C.I.; Baker, T.R.; Patiño, S.; Fyllas, N.M.; Hodnett, M.G.; Herrera, R.; Almeida, S.; et al. Basin-wide variations in Amazon Forest structure and function are mediated by both soils and climate. Biogeosciences 2012, 9, 2203–2246. [Google Scholar] [CrossRef]
  32. Poorter, L.; van der Sande, M.T.; Arets, E.J.M.M.; Ascarrunz, N.; Enquist, B.; Finegan, B.; Licona, J.C.; Martínez-Ramos, M.; Mazzei, L.; Meave, J.A.; et al. Biodiversity and climate determine the functioning of Neotropical forests. Glob. Ecol. Biogeogr. 2017, 26, 1423–1434. [Google Scholar] [CrossRef]
  33. Prado-Junior, J.A.; Schiavini, I.; Vale, V.S.; Arantes, C.S.; van der Sande, M.T.; Lohbeck, M.; Poorter, L. Conservative species drive biomass productivity in tropical dry forests. J. Ecol. 2016, 104, 817–827. [Google Scholar] [CrossRef]
  34. Wang, S.; Jiménez-Alfaro, B.; Pan, S.; Yu, J.; Sanaei, A.; Sayer, E.J.; Ye, J.; Hao, Z.Q.; Fang, S.; Lin, F.; et al. Differential Responses of Forest Strata Species Richness to Paleoclimate and Forest Structure. For. Ecol. Manag. 2021, 499, 119605. [Google Scholar] [CrossRef]
  35. Vilà, M.; Vayreda, J.; Gracia, C.; Ibáñez, J.J. Does tree diversity increase wood production in pine forests? Oecologia 2003, 135, 299–303. [Google Scholar] [CrossRef] [PubMed]
  36. Poorter, L.; van der Sande, M.T.; Thompson, J.; Arets, E.J.M.M.; Alarc’oõn, A.; Alvarez-Sanchez, J.; Ascarrunz, N.; Balvanera, P.; Barajas-Guzmán, G.; Boit, A.; et al. Diversity enhances carbon storage in tropical forests. Glob. Ecol. Biogeogr. 2015, 24, 1314–1328. [Google Scholar] [CrossRef]
  37. Ali, A.; Yan, E.R.; Chang, S.X.; Cheng, J.Y.; Liu, X.Y. Community-weighted mean of leaf traits and divergence of wood traits predict aboveground biomass in secondary subtropical forests. Sci. Total Environ. 2017, 574, 654–662. [Google Scholar] [CrossRef]
  38. Feng, Y.; Schmid, B.; Loreau, M.; Forrester, D.I.; Fei, S.; Zhu, J.; Tang, Z.Y.; Zhu, J.L.; Hong, P.B.; Ji, C.J.; et al. Multispecies Forest Plantations Outyield Monocultures across a Broad Range of Conditions. Science 2022, 376, 865–868. [Google Scholar] [CrossRef]
  39. Zhang, Y.; Chen, H.Y. Individual size inequality links forest diversity and above-ground biomass. J. Ecol. 2015, 103, 1245–1252. [Google Scholar] [CrossRef]
  40. Dănescu, A.; Albrecht, A.T.; Bauhus, J. Structural diversity promotes productivity of mixed, uneven-aged forests in southwestern Germany. Oecologia 2016, 182, 319–333. [Google Scholar] [CrossRef]
  41. Ali, A.; Yan, E.R.; Chen, H.Y.; Chang, S.X.; Zhao, Y.T.; Yang, X.D.; Xu, M.S. Stand Structural Diversity rather than Species Diversity Enhances Aboveground Carbon Storage in Secondary Subtropical Forests in Eastern China. Biogeosciences 2016, 13, 4627–4635. [Google Scholar] [CrossRef]
  42. Ali, A.; Mattsson, E. Individual tree size inequality enhances aboveground biomass in homegarden agroforestry systems in the dry zone of Sri Lanka. Sci. Total Environ. 2017, 575, 6–11. [Google Scholar] [CrossRef] [PubMed]
  43. Yuan, Z.; Wang, S.; Ali, A.; Gazol, A.; Ruiz-Benito, P.; Wang, X.; Lin, F.; Ye, J.; Hao, Z.Q.; Loreau, M. Aboveground carbon storage is driven by functional trait composition and stand structural attributes rather than biodiversity in temperate mixed forests recovering from disturbances. Ann. For. Sci. 2018, 75, 67. [Google Scholar] [CrossRef]
  44. Fan, F.; Zhao, L.J.; Ma, T.Y.; Xiong, X.Y.; Zhang, Y.B.; Shen, X.L.; Li, S. Community composition and structure in a 25.2 hm2 subalpine dark coniferous forest dynamics plot in Wanglang, Sichuan, China. Chin. J. Plant Ecol. 2022, 46, 1005–1017. [Google Scholar] [CrossRef]
  45. Myers, N.; Mittermeier, R.A.; Mittermeier, C.G.; da Fonseca, G.A.B.; Kent, J. Biodiversity Hotspots for Conservation Priorities. Nature 2000, 403, 853–858. [Google Scholar] [CrossRef]
  46. Liu, Q. Ecological Research on Subalpine Coniferous Forests in China; Sichuan University Press: Chengdu, China, 2002. [Google Scholar]
  47. Barredo, J.I.; San-Miguel-Ayanz, J.; Caudullo, G.; Busetto, L. A European map of living forest biomass and carbon stock. Reference Report by the Joint Research Centre of the European Commission. EUR-Sci. Technol. Res. 2012, 25730, 5. [Google Scholar]
  48. Anderson-Teixeira, K.J.; Davies, S.J.; Bennett, A.C.; Gonzalez-Akre, E.B.; Muller-Landau, H.C.; Joseph Wright, S.; Abu Salim, K.; Almeyda Zambrano, A.M.; Alonso, A.; Baltzer, J.L.; et al. CTFS-Forest GEO: A worldwide network monitoring forests in an era of global change. Glob. Chang. Biol. 2015, 21, 528–549. [Google Scholar] [CrossRef]
  49. Taylor, A.H.; Qin, Z.; Liu, J. Tree regeneration in an Abies faxoniana forest after bamboo dieback, Wang Lang Natural Reserve, China. Can. J. For. Res. 1995, 25, 2034–2039. [Google Scholar] [CrossRef]
  50. Fan, F.; Bu, H.L.; McShea, W.J.; Shen, X.L.; Li, B.V.; Li, S. Seasonal habitat use and activity patterns of blood pheasant Ithaginis cruentusbe in the presence of free-ranging livestock. Glob. Ecol. Conserv. 2020, 23, e01155. [Google Scholar] [CrossRef]
  51. Zhou, G.; Yin, G.; Tang, X. Carbon Stocks of Forest Ecosystems in China: Biomass Equation; Science Press: Beijing, China, 2018. [Google Scholar]
  52. Graham, M.H. Confronting multicollinearity in ecological multiple regression. Ecology 2003, 84, 2809–2815. [Google Scholar] [CrossRef]
  53. García-Palacios, P.; Gross, N.; Gaitán, J.; Maestre, F.T. Climate mediates the biodiversity-ecosystem stability relationship globally. Proc. Natl. Acad. Sci. USA 2018, 115, 8400–8405. [Google Scholar] [CrossRef] [PubMed]
  54. R Core Team. R: A Language and Environment for Statistical Computing; Foundation for Statistical Computing: Vienna, Austria, 2022. [Google Scholar]
  55. Chave, J.; Andalo, C.; Brown, S.; Cairns, M.A.; Chambers, J.Q.; Eames, D.; Fölster, H.; Fromard, F.; Higuchi, N.; Kira, T.; et al. Tree allometry and improved estimation of carbon stocks and balance in tropical forests. Oecologia 2005, 145, 87–99. [Google Scholar] [CrossRef] [PubMed]
  56. Stegen, J.C.; Swenson, N.G.; Enquist, B.J.; White, E.P.; Phillips, O.L.; Jørgensen, P.M.; Weiser, M.D.; Mendoza, A.M.; Vargas, P.N. Variation in Above-ground Forest Biomass across Broad Climatic Gradients. Glob. Ecol. Biogeogr. 2011, 20, 744–754. [Google Scholar] [CrossRef]
  57. Pregitzer, K.S.; Euskirchen, E.S. Carbon Cycling and Storage in World Forests: Biome Patterns Related to Forest Age. Glob. Chang. Biol. 2004, 10, 2052–2077. [Google Scholar] [CrossRef]
  58. Feldpausch, T.R.; Banin, L.; Phillips, O.L.; Baker, T.R.; Lewis, S.L.; Quesada, C.A.; Affum-Baffoe, K.; Arets, E.J.M.M.; Berry, N.J.; Bird, M.; et al. Height–diameter allometry of tropical forest trees. Biogeosciences 2011, 8, 1081–1106. [Google Scholar] [CrossRef]
  59. Morin, X. Species richness promotes canopy packing: A promising step towards a better understanding of the mechanisms driving the diversity effects on forest functioning. Funct. Ecol. 2015, 29, 993–994. [Google Scholar] [CrossRef]
  60. Ali, A. Forest Stand Structure and Functioning: Current Knowledge and Future Challenges. Ecol. Indic. 2019, 98, 665–677. [Google Scholar] [CrossRef]
  61. Mao, Z.; van der Plas, F.; Corrales, A.; Anderson-Teixeira, K.J.; Bourg, N.A.; Chu, C.; Hao, Z.Q.; Jin, G.Z.; Lian, J.Y.; Lin, F.; et al. Scale-Dependent Diversity-Biomass Relationships Can Be Driven by Tree Mycorrhizal Association and Soil Fertility. Ecol. Monogr. 2023, 93, e1568. [Google Scholar] [CrossRef]
  62. Soriano-Luna, M.D.l.Á.; Ángeles-Pérez, G.; Guevara, M.; Birdsey, R.; Pan, Y.; Vaquera-Huerta, H.; Valdez-Lazalde, J.R.; Johnson, K.D.; Vargas, R. Determinants of Above-Ground Biomass and Its Spatial Variability in a Temperate Forest Managed for Timber Production. Forests 2018, 9, 490. [Google Scholar] [CrossRef]
  63. Yuan, Z.; Ali, A.; Jucker, T.; Ruiz-Benito, P.; Wang, S.; Jiang, L.; Wang, X.G.; Lin, F.; Ye, J.; Hao, Z.Q.; et al. Multiple abiotic and biotic pathways shape biomass demographic processes in temperate forests. Ecology 2019, 100, e02650. [Google Scholar] [CrossRef]
  64. Maren, I.E.; Karki, S.; Prajapati, C.; Yadav, R.K.; Shrestha, B.B. Facing North or South: Does Slope Aspect Impact Forest Stand Characteristics and Soil Properties in a Semiarid Trans-Himalayan Valley? J. Arid Environ. 2015, 121, 112–123. [Google Scholar] [CrossRef]
  65. Warren, R.J. Mechanisms driving understory evergreen herb distributions across slope aspects, as derived from landscape position. Plant Ecol. 2008, 198, 297–308. [Google Scholar] [CrossRef]
  66. Yu, M.; Sun, O.J. Effects of forest patch type and site on herb layer vegetation in a temperate forest ecosystem. For. Ecol. Manag. 2013, 300, 14–20. [Google Scholar] [CrossRef]
  67. Wang, H.; Zhang, M.; Nan, H. Abiotic and biotic drivers of species diversity in understory layers of cold temperate coniferous forests in North China. J. For. Res. 2018, 30, 2213–2225. [Google Scholar] [CrossRef]
  68. Xue, R.; Yang, Q.; Miao, F.; Wang, X.; Shen, Y. Slope Aspect Influences Plant Biomass, Soil Properties and Microbial Composition in Alpine Meadow on the Qinghai-Tibetan Plateau. J. Soil Sci. Plant Nutr. 2018, 18, 1–12. [Google Scholar] [CrossRef]
  69. Gaston, K.J. Global patterns in biodiversity. Nature 2000, 405, 220–227. [Google Scholar] [CrossRef] [PubMed]
  70. Chu, C.; Lutz, J.A.; Král, K.; Vrška, T.; Yin, X.; Myers, J.; Abiem, I.; Alonso, A.; Bourg, N.; Burslem, D.F.R.P.; et al. Direct and indirect effects of climate on richness drive the latitudinal diversity gradient in forest trees. Ecol. Lett. 2018, 22, 245–255. [Google Scholar] [CrossRef]
  71. Pachepsky, Y.A.; Timlin, D.J.; Rawls, W.J. Soil water retention as related to topographic variables. Soil Sci. Soc. Am. J. 2001, 65, 1787–1795. [Google Scholar] [CrossRef]
  72. Cai, W.H.; Yang, J.; Liu, Z.H.; Hu, Y.M.; Liu, S.J.; Jing, G.Z.; Zhao, Z.F. Controls of post-fire tree recruitment in Great Xing’an Mountains in Heilongjiang Province. Acta Ecol. Sin. 2012, 32, 3303–3312. [Google Scholar]
Figure 1. (a) Location of the Wanglang Plot; (b) dominant species Abies faxoniana and Picea purpurea in the plot; (c) subplot setting and all woody plant individuals alive (DBH ≥ 1 cm) in the plot. Gray dots represent each individual and black curve represents the river through the plot.
Forests 14 02197 g001
Figure 2. (a) Forest aboveground biomass distribution in the Wanglang Plot: (bd) frequency distribution of aboveground biomass of total, spruce–fir, and other species, respectively.
Forests 14 02197 g002
Figure 3. Regression relationships between forest aboveground biomass and topography, soil, and stand structure variables (N = 234). (a) Elevation, (b) slope, (c) aspect, (d) soil organic matter, (e) total nitrogen content, (f) total phosphorus content, (g) soil pH, (h) species richness, (i) stem density, (j) maximum DBH, (k) DBH variance, and (l) important value of spruce–fir.
Forests 14 02197 g003
Figure 4. Relative influences of topography, soil, and stand structure variables on forest aboveground biomass. In each panel, the left part is the relative contribution of different groups of variables based on variation partitioning analyses, and the right part is the standardized coefficients from multiple linear regressions estimated separately for each variable. The bars refer to the standard errors of regression coefficients. SOM, soil organic matter; TP, total phosphorus content; max_DBH, maximum DBH; spruce–fir_IV, important value of spruce–fir; SR, species richness; Density, stem density. * p < 0.05; ** p < 0.01; *** p < 0.001.
Forests 14 02197 g004
Figure 5. Structural equation model examining the multivariate effects of topography, soil, and stand structure variables on forest aboveground biomass. One-way arrows indicate causal relationships, and two-way arrows indicate correlations. Black, red, and dashed gray arrows indicate positive, negative, and insignificant effects, respectively. Numbers on the arrows are standardized path coefficients, and the arrow width is proportional to the standardized path coefficient. SOM, soil organic matter; TP, total phosphorus content; max_DBH, maximum DBH; Density, stem density; spruce–fir_IV, important value of spruce–fir. * p < 0.05, *** p < 0.001.
Forests 14 02197 g005
Table 1. Descriptive statistics of investigated subplots in the Wanglang Plot. Topography and stand structure variables, N = 630; soil variables, N = 234.
VariablesAbbreviationsUnitsMeanSDMaxMinMedian
Topography
ElevationElevationm286616292528492858
SlopeSlope°241157525
AspectAspect°105501791124
Soil
Soil organic matterSOMg/kg200.271.7403.255.1189.5
Total nitrogen contentTNg/kg0.910.261.660.450.91
Total phosphorus contentTPg/kg7.532.7213.752.387.71
Soil pHpH/6.790.818.144.417.06
Stand structure
Species richnessSRNo.16324517
Stem densityDensityNo./ha4627174410,8756254575
Maximum DBHmax_DBHcm68.520.1122.019.468.7
DBH variance cv_DBH/180.940.0284.364.7185.0
Important value of
spruce–fir
spruce–fir_IV/74.1124.9999.14082.98
Table 2. Direct, indirect, and total standardized effects of topography, soil, and stand structure variables on forest aboveground biomass based on structural equation model. SOM, soil organic matter; TP, total phosphorus content; max_DBH, maximum DBH; Density, stem density; spruce–fir_IV, important value of spruce–fir.
Direct EffectsIndirect EffectsTotal Effects
Aspect00.0980.098
Slope0−0.022−0.022
TP−0.173−0.084−0.256
SOM0.0880.0120.100
max_DBH0.5610.1420.703
Density−0.146−0.017−0.163
spruce–fir_IV0.27200.272
Disclaimer/Publisher’s Note: The statements, opinions and data contained in all publications are solely those of the individual author(s) and contributor(s) and not of MDPI and/or the editor(s). MDPI and/or the editor(s) disclaim responsibility for any injury to people or property resulting from any ideas, methods, instructions or products referred to in the content.

