Article

Using Social Media and Multi-Source Geospatial Data for Quantifying and Understanding Visitor’s Preferences in Rural Forest Scenes: A Case Study from Nanjing

School of Landscape Architecture, Nanjing Forestry University, Nanjing 210037, China
*
Author to whom correspondence should be addressed.
Forests 2023, 14(10), 1932; https://doi.org/10.3390/f14101932
Submission received: 26 August 2023 / Revised: 5 September 2023 / Accepted: 18 September 2023 / Published: 22 September 2023

Abstract

:
Rapid urbanization has made urban forest scenes scarce resources, leading to a surge in the demand for high-quality rural forest scenes as alternative outdoor recreation spaces. Previous studies mainly applied survey methods, focusing on visitors’ feedback for different types of scenes from the perspective of visual quality evaluation. Nevertheless, the explanations of the relationships between various factors of scenes and visitors’ preferences are relatively superficial. This study sought to explore the distribution and characteristics of preferred rural forest scenes based on visitor reviews from social media, and using Geodetector, a geospatial statistics tool, to quantitatively analyzed the reasons for visitors’ preferences in terms of factors obtained from multi-source geospatial data. The findings are that (1) visitors are already satisfied with the natural environment but expect scenes that reflect the culture of tea; (2) spatial factor has a more robust interpretation of visitors’ preference, and although the Normalized Difference Vegetation Index (NDVI) and non-consumption indicators barely explain visitors’ preference solely when each of them is combined with other indicators, they can produce non-linear enhancement effects. Consequently, this study synthesizes visitors’ feedback and factors in rural forest scenes to understand visitors’ preferences, thus providing insights into human-centered planning.

1. Introduction

Rapid urbanization along with more intensive urban buildings and crowded spaces has resulted in a decline in environmental quality of urban areas [1]. Urban forest scenes refer to the scenes with enough green environment in urban built areas, including plazas, lawns, garden paths, ponds, rockeries, etc. [2]. High-quality urban forest scenes are becoming scarce sources for people who live in urban areas. A trend exists that citizens are interested in finding alternative outdoor spaces for leisure and recreational activities [3]. As a type of semi-artificial natural environment in villages, rural forest scenes are one type of rural public space, referring to the outdoor public spaces based on the countryside’s natural environment and cultural resources [4]. Villages with satisfactory rural forest scenes are becoming popular destinations for urban populations, which has promoted local tourism development [5].
Tourism-oriented planning methods take tourism as an engine for rural economic and social development and aim to attract visitors [6]. When observing the villages applying these methods, the rural areas’ socio-economic morphology and spatial pattern are dramatically restructured [7]. Visitors’ preferences, referring to the expression of a visitor’s favor, can reflect the willingness of visitors to choose a scene and their degree of satisfaction with it. Therefore, visitors’ preferences are closely related to the attractiveness of a village, and insights from visitors’ preferences help to guide the construction and capitalize on the positive effects of tourism on village development. Contrary to the ambition of revival, the allocation of village factors may fail to meet the factual demand, causing unreasonable utilization of the precious and limited village resources. Previous research revealed the potential value visitors could bring to villages, but visitors’ preference for rural forest scenes was not thoroughly analyzed [5].
Currently, most studies on visitors’ preferences were conducted in built-up urban areas and focused on urban forest scenes. Arne Arnberger and Renate Eder [8] developed a conceptual framework and four choice sets, each consisting of four image- and text-based green-space scenarios (stated choice survey) was shown to each respondent to investigate the preferences for site characteristics green-space urban visitors have when they are seeking stress relief compared to their general green-space preferences. In terms of evaluation indicators, previous studies focused on natural factors. For instance, Canliu Li et al. [9] conducted scenic beauty estimation (SBE) of the landscape factors in 29 winter plant communities to evaluate the aesthetic characteristics of the plant landscape using photographs. Findings in urban forest scenes were that the vegetation-related and water-related evaluation indicators turn out to be the major factors influencing visitors’ preferences [10].
In conclusion, outdoor recreation planners, land use planners, and researchers often turn to on-site surveys as the primary methods [11], including face-to-face methods in scenes, such as semi-structured interviews [12] and open-ended interviews [13], or photography as a proxy of the natural environment to indirectly assess visitors’ responses to urban forest scenes [14,15,16]. However, a low response rate is a common problem for survey-based studies, mainly because respondents do not have enough time or are not interested in participating in the study [8,17], which is one of the reasons for the high research costs.
In the context of the new data environment, social media data provide researchers access to a large amount of visitor-related data compared with traditional surveys. All the content from social media, including travel-related comments [18] and on-site photos, were voluntarily uploaded by visitors, reducing the cost that researchers needed to invest in collecting data [19]. Analyzing the tourism comments obtained from Mafengwo, one of the influential tourism social networking sites, Qiusheng Li et al. [20] effectively analyzed tourists’ regional tendencies and emotional changes. However, given that over 70% of the original datasets might be noise or non-relevant messages, plenty of data from social media are unstructured, subjective, and exist in massive databases [21]. When studying visitors’ preferences, the heterogeneous data from social media lack spatially explicit information and have flaws in spatiotemporal analysis in a fine-scaled village.
Additionally, survey-based studies on urban forest scenes tended to pay attention to visitor’s perception or attitudes from the perspective of visual quality evaluation [10]. The visual quality evaluation allows respondents to express their attitudes toward objects based on visual perception, thereby measuring the quality of the object. The visual quality evaluation in preference studies represents the most realistic opinion of humans toward a physical scene, an image, or a video [22]. It remains to be validated whether the conclusions drawn from the urban forest scenes are equally applicable to the rural forest scenes. A previous study highlighted the importance of other endogenous resources as preconditions for the development of tourism [23]. However, other potential factors affecting preference, such as socio-economic and spatial factors, were not given enough attention in rural forest scene studies.
Multi-source geospatial data can be utilized to reveal the detailed characteristics of various factors influencing visitors’ preferences. Points of interest (POIs) are locations that, historically, cartographers have added to maps to communicate an interesting or relevant named place, using cartographic symbols and labels. POIs typically include visually and culturally important features and can be used to show the locations of these features [24]. Commonly used in the urban built environment [25,26], POIs are used to perceive the socio-economic environmental characteristics. Street networks collected from the Open Street Map (OSM) were utilized to explore the spatial configurations and how these spatial configurations affect visitors’ behaviors [26,27,28] using a space syntax analysis tool, which has long been used in architecture [27] and urban design [29]. Unmanned Aerial Vehicle (UAV) is characterized by the superiority of full perspective, high realism [30], and fast and on-demand data acquisition [31], and is applied to capture fine-scaled information about a village [32].
In summary, social media and multi-source geospatial data supplemented detailed information on studying visitors’ preferences compared to traditional surveys. Consequently, based on social media and multi-source geospatial data in rural forest scenes, there is a call for comprehensive explanations of visitors’ preferences based on fully characterizing visitors’ preferences and describing the potential factors affecting visitors’ preferences.
According to the previous discussion, for a better understanding of visitor’s preference in rural forest scenes, there do exist two gaps to be investigated:
  • Lack of cost-effective methods for acquiring, processing, and analyzing visitor-related data to describe the content of visitors’ feedback comprehensively;
  • Lack of in-depth exploration of the effects of various factors in the rural forest scenes on visitors’ preferences in addition to natural factors.
This study sought to explore the distribution and characteristics of preferred rural forest scenes based on visitor reviews from social media, and using Geodetector, a geospatial statistics tool, quantitatively analyzing the reasons for visitors’ preferences in terms of factors obtained from multi-source geospatial data.

2. Materials and Methods

2.1. Study Area and Research Framework

In this study, we took the Huanglongxian Village (Figure 1) in the suburb of Nanjing as the empirical study area to quantify and understand visitors’ preferences in rural forest scenes. Located in the community of Pai Fang, the southwest corner of Jiangning District, Huanglongxian Village is 40 km from the central city of Nanjing. It is famous as “Jinling Tea Village” for tea culture and ecological leisure tourism. In the past decade, it has received more than 2 million visitors.
Surrounded by tea mountains and a lake adjacent to it from the north by right, the total area of this Village included in the study is about 9.9 hectares. It is distributed in an overall east–west direction along the north of the arterial highway, which is the area where the main villagers live, and most tourists visit. With a representative tea culture, natural environment, and sufficient visitor data, Huanglongxian Village can be a qualified case to study visitors’ preferences.
In response to the gaps mentioned above, this study developed a framework, which is shown in Figure 2. Based on social media and multi-source geospatial data and corresponding analysis strategies, this framework consists of four components: data collection, data preprocessing, quantification and modeling, and understanding establishment. Performing these procedures, this framework aimed to figure out the following questions:
  • Which rural forest scenes do visitors prefer?
  • What are the characteristics of these rural forest scenes preferred by visitors?
  • How are other factors of the rural forest scenes in addition to natural factors distributed?
  • How can factors of rural forest scenes explain visitors’ preferences?
To answer these questions, (1) social media data, including comments and photos, were adopted according to detailed data collection and “noise” reduction (data cleaning and screening) criteria to reflect the visitor-preferred rural forest scenes; (2) screened photos were processed using CV technology to reveal the characteristics of the rural forest scenes preferred by visitors, and comments were hierarchically analyzed using NLP models for recognizing the heterogeneousness of visitors’ attitudes; (3) the distribution of socio-economic factor, spatial factor and natural factor were extracted from multi-source geospatial data; (4) visitors’ preferences and factors of rural forest scenes were modeled using Geodector to explore their potential association.

2.2. Data Collection and Preprocessing

2.2.1. Acquisition of Social Media Data

In this study, visitors’ reviews, one of the most visitor-related social media data, were taken to obtain the targeted information on visitors’ behavior [33]. The Dianping website, a reliable social media data source for visitors’ activities in green spaces [34], allows visitors to rate attractions and upload text comments attaching photos.
Based on the web crawler technology, we collected photos and comments from web sources by extracting web content from a list of Uniform Resource Locators (URLs) [19,35]. This study identified and scraped web elements with the target information using the Selenium package in Python [19], and all data stored in web elements found by Selenium were saved and cleaned using a regular expression to remove the redundant and noisy records.

2.2.2. Screening of Social Media Data

The photos shared by visitors, to a certain extent, reflect the visitors’ preference for the content photographed. For the photo to more clearly reflect the visitor’s preference for the rural forest scenes of Huanglongxian Village, these photos need to be screened. If the same visitor uploaded multiple photos reflecting the same scene, only one was retained, and the rest were excluded; if multiple photos were combined in the same image, they were processed separately. The screening criteria are as follows to reduce the data “noise”:
  • Photos in which visitors clearly expressed negative comments in their comments were excluded;
  • Photos with single subjects, such as people, plants, animals, food, signs, etc., and those that reflect the indoor scene were excluded;
  • Other photos that are unrelated to the content of the current rural forest scenes or fail to identify the specific geographical location were accurately excluded.

2.2.3. Acquisition of Muti-Source Geospatial Data

For this research, we obtained fine-scaled geospatial data from map service providers, including POIs and street networks, and UAV remote sensing data.
  • Map service provider data: POIs were fetched from Bigemap, a widely used map service provider in China, and street networks were fetched from OSM. All these data were supplemented with on-site observation. After applying the correction algorithm to correct the data to the WGS-84 coordinate system and project it to the World Mercator system, their accuracy could meet the research needs.
  • UAV remote sensing data: The UAV (DJI Mavic Air 2) was conducted at low altitudes (100 m flight height above the ground) with −90° of gimbal tilt angle, guaranteeing high spatial resolution [36] and mapping accuracy [37]. The time of the aerial survey was 29 April 2023, and there was sufficient daylight, 20 km/h wind speed at the site, and no electromagnetic interference in the surrounding environment to meet the requirements of UAV remote sensing. The study site was photographed in a “zigzag” pattern, and the overlap between horizontal and vertical pixels of each image was guaranteed to be more than 1/3 so that a Digital Orthophoto Map (DOM) of the village could be obtained using Pix4Dmapper (Version 4.4.12) software.

2.2.4. Factors of Rural Forest Scene Extraction

  • Extraction of socio-economic factors from POIs: For fully utilizing relatively high accuracy positioning and multilevel categories [38] of POIs, all POIs were classified into consumption and non-consumptions (Table 1). Each of these categories of POIs was geo-processed by the KDE in ArcGIS (same as for visualizing visitor preferences), and the results separately reflected the socio-economic factor.
  • Extraction of spatial factors from street networks: Street network data obtained from OSM were amended and supplemented according to the fine-scaled DOM obtained from UAV to fix errors in the OSM, in which the deviating street network was deleted, and the missing street network was added manually. Space syntax tools were applied to extract spatial factors by calculating configurative spatial relationships of street networks [39]. In this study, the segment model of space syntax was chosen to describe the networks quantitatively, and both angular and metric parameters were analyzed, including Connectivity, Integration, and Choice [40] (Table 1).
  • Extraction of natural factors from UVA: The Normalized Difference Vegetation Index (NDVI) (Table 1) quantifies vegetation by measuring the difference between near-infrared light (which vegetation strongly reflects) and red light (which vegetation absorbs) [41], which was selected to represent the natural factor of rural forest scenes Taking advantage of the contrast of the characteristics of two bands from the DOM obtained by UVA, we utilized the Arithmetic function in ArcGIS to get the NDVI of the village. The NDVI equation [42] is as follows:
    N D V I = N I R R e d N I R + R e d
    where NIR is the pixel values from the near-infrared band, and Red is the pixel values from the red band.

2.3. Quantification and Modeling

2.3.1. Identifying the Visitor-Preferred Scenes

Online reviews from social media were often used for regional or city-scale studies because of their lack of spatially explicit information. This framework applied traditional investigation experiences obtained from on-site observation to address this problem.
We conducted three systematic observations of Huanglongxian Village on 28 April, 3 May, and 23 May 2023. The date 3 May was during the Labor Day holiday, with more visitors than on working days. Each observation often took about two hours, from the main roads and deep into the remote gray spaces to a comprehensive review of the rural forest scenes. In addition, scenes with more visitors or complex morphology were recorded through photography. These on-site observation experiences allowed us to fully recognize the details of the rural forest scenes in Huanglongxian Village.
The researcher deduced the precise geographical location of the screened photos according to systematic observation experiences with the assistance of photography. The deduction results were marked as points on the map representing visitors’ preferences. It should be noticed that the marked points were the spatial visual focal points shown by the visitors’ photos, not the points where visitors stood when taking photos. For example, if a visitor took a photo of Huanglong Tea House on Huanglong Tea Street, the location of Huanglong Tea House should be recorded and marked on the map instead of Huanglong Tea Street (Figure 3).
To visualize the spatial distribution pattern of visitor preferences, kernel Density Estimation (KDE) in ArcGIS was utilized to smooth out the points representing visitors’ preferences. When dealing with geospatial information, KDE generates a density surface where each cell is rendered based on the kernel density at the pixel center. KDE fits a kernel function for each observed geographic point, assuming each observation is continuously spread within its kernel window [19]. In this study, the kernel estimator with kernel K [43] is defined by
f ^ ( x ) = 1 n h i = 1 n K ( x X i h )
where h is the window width, the smoothing parameter, or bandwidth.

2.3.2. Semantic Segmentation and Cluster Analysis of Photos

The screened photos were considered as proxies of visitor-preferred scenes, which allowed us to quantify the characteristics of these rural forest scenes using CV technology and clustering algorithm:
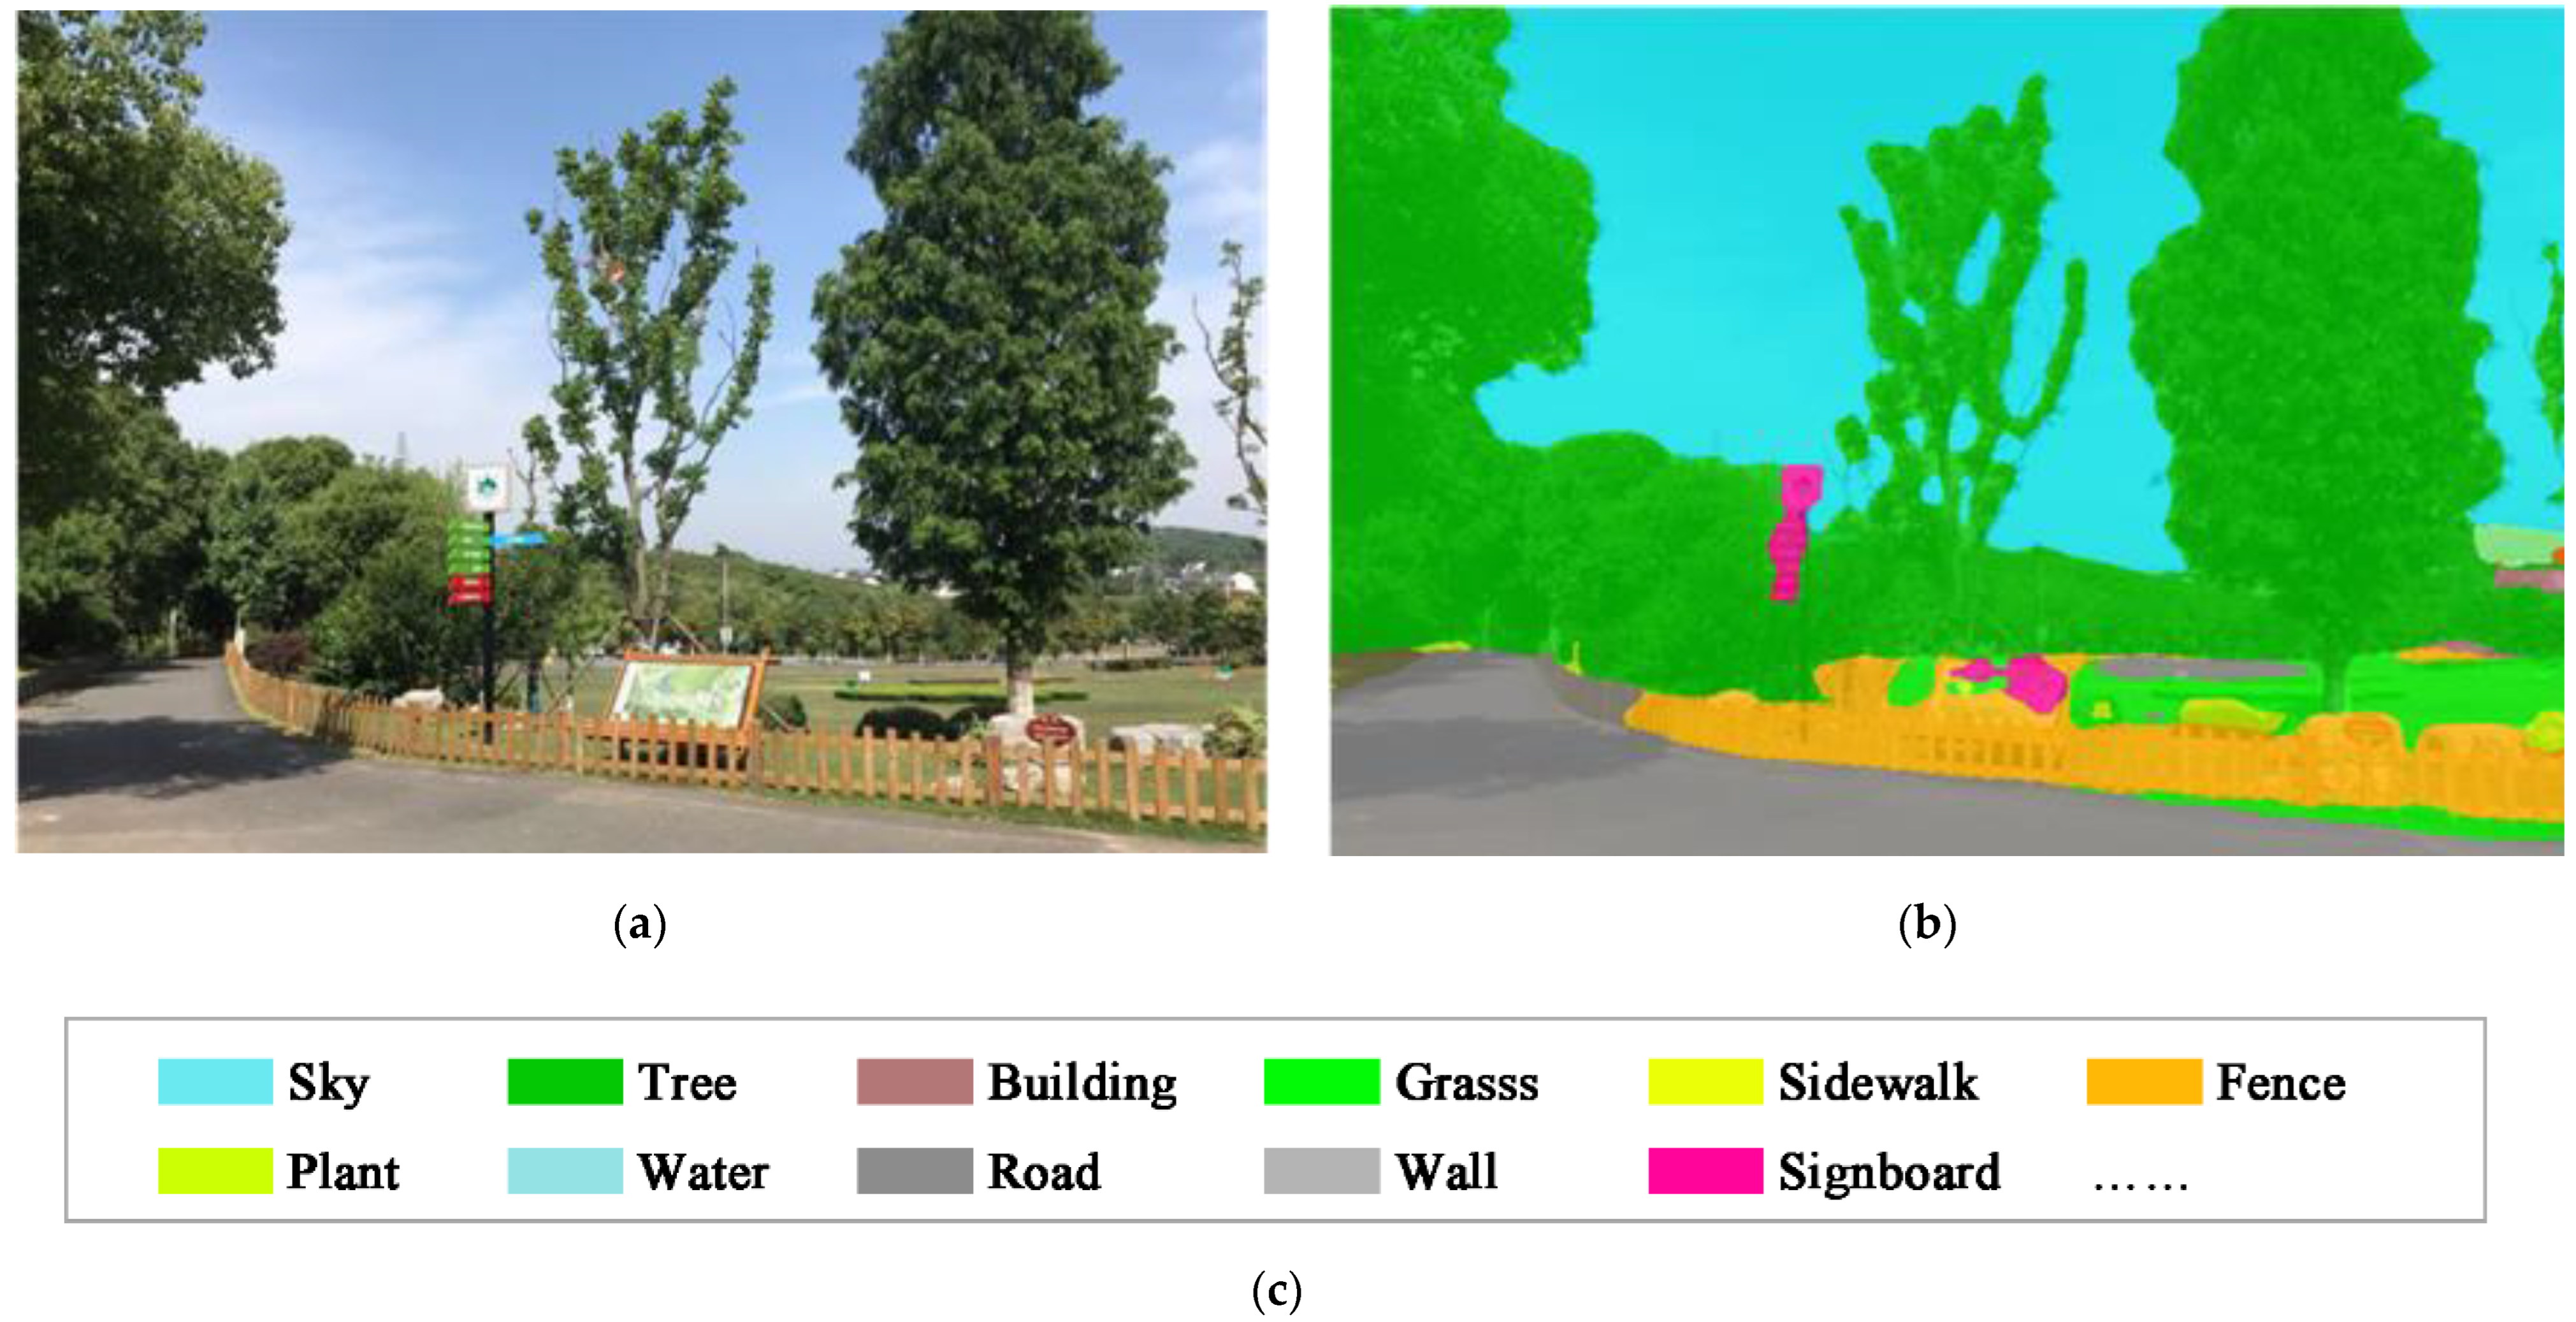
  • Semantic segmentation (Figure 4): Pixels of physical features of the screened photos were extracted using the Pyramid Scene Parsing Network (PSPNet) [44] model, which could accurately parse the scenes with complicated elements. In this study, PSPNet model training was based on the ADE20K dataset [45].
  • Cluster analysis: We introduced the K-means clustering algorithm to perform dimensionality reduction. The K-means algorithm minimizes the within-cluster sum of squares [46]. One of these clusters is a collection of individuals with similarities, with obvious dissimilarities among different clusters. With the help of the K-means algorithm in IBM SPSS Statistics, we could categorize the visitor-preferred scenes according to their physical features obtained from semantic segmentation and find different types of visitor-preferred rural forest scenes that share similar features proportion, which exhibit significant differences.

2.3.3. Natural Language Processing on Comments

In this study, online comment data were taken as a proxy to understand visitors’ attitudes to the rural forest scenes. The comments on Huanglongxian Village were posted by visitors voluntarily. We analyzed the visitor attitudes to the rural forest scenes according to the following steps:
  • Data cleaning: Before analysis, cleaning comments data should be performed appropriately, including removing special characters, punctuation marks, and deactivated words and performing operations such as word separation.
  • Topic modeling: The Latent Dirichlet Allocation-based Natural Language Processing (LDA-NLP), a semantic extraction approach, was utilized to extract the comments topic according to different ratings. LDA-NLP helped to decompose the comments into various topics and determine the distribution of each document on each topic. By referring to the perplexity score, we can determine the number of topics to be extracted. A lower perplexity score indicates better generalization performance. For a test set of M documents, the perplexity is as follows:
    p e r p l e x i t y ( D t e s t ) = exp { d = 1 M log p ( w d ) d = 1 M N d }
    where p ( w d ) refers to the probability of occurrence of each word in the test set.
  • Sentiment analysis: After topic modeling, each topic contained a certain amount of topic words. Then, we categorized topic words into positive, neutral, and negative sentiments, and the visitor’s attitudes towards the topics were uncovered by counting the number of topic words under different categories.

2.3.4. Geodectector Analysis

Spatial Stratified Heterogeneity (SSH) is a phenomenon in which the within strata is more similar than the between strata and ubiquitous in rural phenomena. Geodetector, or Geographical Detector, is a tool of spatial statistics to measure SSH and to make attributions for or by SSH and can explicitly reveal the association between rural forest scenes and visitors’ preference without assuming linearity of the association and with clear physical meanings [47,48]. The analysis tasks can be accomplished using the Geodetector q-statistic:
q = 1 1 N σ 2 h = 1 L N h σ h 2
where the population Explained Variable (Y) is composed of L strata (h = 1, 2, …, L); N and σ 2 stand for the number of units and the variance of Y in a study area, respectively; [(NL)q]/[(L − 1)(1 − q)]~F (L − 1, NL, g), and g is a non-central parameter [47].
Before detecting the association analysis, we divided the study area into a grid of 5 m resolution, according to which the Explained Variable (Y) and Explanatory variables (Xs) were sampled (Table 1).
In this study, the factor detector and the interaction detector tools from Geodetector were incorporated:
  • The factor detector [47] q-statistic measures the degree of spatial stratified heterogeneity of a Y if Y is stratified by itself and the determinant power of an explanatory variable (Xn) on Y if Y is stratified by Xn;
  • The interaction detector [47] reveals whether the risk factors X1 and X2 (and more) have an interactive influence on Y. The format of the results for the interaction detector has five intervals, and the interaction relationship is determined using the location of q(xy) in the five intervals (Table 2).

3. Results

3.1. Result of Identifying the Visitor-Preferred Scenes

Obtained using web-crawling Python script from the Dianping website, the total number of visitor-rated photos uploaded from 1 July 2013 to 25 May 2023 was 6637. After conducting the noise-reduction standards to screen these photos, valid photos (n = 905) in the sample were identified and marked on the map to reflect the visitor-preferred scenes. After being geo-processed by KED, the visitors’ preference was divided into six grades using Quantile in ArcGIS (Figure 5). The high values, concentrated in the middle of the village, show a linear spatial distribution in an east–west direction. This suggests that visitors’ preference for rural forest scenes in Huanglongxian Village was extremely uneven.

3.2. Result of Semantic Segmentation and Cluster Analysis of Photos

After being segmented, physical features of the 905 screened photos, such as sky, building, tree, grass, sidewalk, water, plant, wall, etc., were marked in the image, and the proportion of each feature in the photo was recorded in detail.
Analyzing Table 3, when there are too few clusters, not all types of visitor-preferred scenes can be distinguished, and when there are too many clusters, some clusters cannot be interpreted into specific scene types. To ensure the variability between each group and to avoid dispersing the classification too much, this study considered the selection of 6 clusters.
Figure 6 illustrates the average proportion of physical features among six clusters, based on which six types of visitor-preferred scenes with distinguishing physical feature proportions can be identified: waterfront scene, lawn scene, street scene, woodland scene, enclosed scene, and architectural scene.

3.3. Result of Natural Language Processing on Comments

We collected 1356 comments from the Dianping website, which visitors voluntarily posted. The users’ IDs and the time of the reviews were also recorded as attached information to distinguish each visitor.
In this study, the perplexity, used by convention in language modeling, is monotonically decreasing in the test data from 2 to 14 topic divisions (Figure 7). While a lower perplexity score indicates better generalization performance, overfitting results from peaked posteriors in the training set should be avoided. Accordingly, eight topics with their topic words were extracted from 1356 comments: facilities, nature, tourism, tea culture, lawn, leisure, and consumption (Table 4).
As Figure 8 demonstrates, visitors expressed predominantly positive sentiments under most topics, especially in the facilities topic (69.35% positive sentiment) and nature topic (59.46% positive sentiment), which means that the facilities and greening construction in Huanglongxian Village can satisfy visitors. However, most visitors expressed negative (39.4%) or neutral (30.3%) sentiments about the tea culture, although Huanglongxian is a tourist village featuring the Jinling tea culture.

3.4. Result of Factors of Rural Forest Scene Extraction

  • Socio-economic factor: The total amount of POIs collected from Bigemap is 83, including 46 consumption POIs (of all restaurants, hotels, and stores) and 37 non-consumption POIs (of all facilities and attractions). As Figure 9 shows, the visualization results of the two types of POIs processed by KDE demonstrate a significant spatial variation: while high-service-level areas of consumption are concentrated on the west side of Huanglong Tea Street, high-service-level areas of non-consumption are mainly located in the eastern part of the village.
  • Spatial factor: As previous research reported [49], there is a certain degree of collinearity between space syntax indicators (Table 5). The distribution of five spatial configuration indicators geo-processed by KED is depicted in Figure 9. The high-value areas of these five indicators, representing more convenient spatial configuration areas, are concentrated in the center of the village, especially the entrance. The result of these five indicators can explain spatial properties from diverse perspectives. Connectivity is relatively independent of the other indicators (Person coefficient < 0.3, Sig. < 0.01) (Table 5). The high value of connectivity, which represents how many spaces are directly connected to the starting space, is more dispersed in spatial distribution, and the areas with high connectivity are relatively small. NACH and NAIN are all significantly correlated with each other (Sig. < 0.01) (Table 5). NAIN and NACH, which represent visitors’ accessibility and usability, respectively, are significantly affected by the calculation radius (R). With a small radius (R = 200 m), the calculated values indicate local walking behavior (<5 min), and with an increase in the radius (R = 1000 m), the calculated values reflect approximately 15–20 min walk behavior [40].
  • Natural factor: The final 175 site photos with a resolution of 4000 × 3000 pixels per image were captured by UAV. After being imported into Pix4Dmapper software, 170 out of 175 (97%) photos were calibrated, and 175 out of 175 (100%) images were geolocated to get the fine-scaled DOM of the village with the WGS-84 coordinate system. As Figure 9 shows, NDVI obtained from the band calculations of the DOM indicates the vegetation growth and cover status of Huanglongxian Village. The value of NDVI is scattered between 0 and 1, and the average NDVI value is closer to 1, which means that the vegetation growth (green leaf area) and vegetation cover of Huanglongxian Village are well-maintained overall. There is not much difference in greening level.

3.5. Result of Geodectector Analysis

Factor detection results (Table 6) demonstrate that the significance levels for all eight indicators are less than 0.0, but their q-statistics values are below 0.2. The q-statistics values of indicators from spatial factor all exceed 0.1, among which NAINr1000m (q-statistics = 0.175, Sig. < 0.01) and NACHr1000m (q-statistics = 0.174, Sig. < 0.01) are the highest, and NAINr200m (q-statistics = 0.125, Sig. < 0.01) and NACHr200m (q-statistics = 0.132, Sig. < 0.01) are relatively lower. Additionally, q-statistics of connectivity (q-statistics = 0.144, Sig. < 0.01) is the third highest. When it comes to socio-economic factor, the q-statistics values of consumption (q-statistics = 0.136, Sig. < 0.01) is significantly higher than non-consumption support (q-statistics = 0.038, Sig. < 0.01). Among eight factors, the q-statistics values of non-consumption and NDVI (q-statistics = 0.011, Sig. < 0.01) are the lowest (no more than 0.05).
Interactive detection results of factors are shown in Figure 10. The interaction detector helps to check whether two indicators work independently or not, and all indicators of three types of factors are found to enhance each other to increase the visitors’ preference (q(A∩B) > Max(q(A), q(B))). NDVI and non-consumption should be noticed when each of them is combined with other indicators, and they can produce non-linear enhancements on visitors’ preference (q(A∩B) > (q(A) + q(B))). Additionally, the interactions between consumption and connectivity, NACHr200m, are also nonlinear enhanced (q(A∩B) > (q(A) + q(B))).

4. Discussion

4.1. Comprehensively Description of Visitors’ Feedback

This study reverses the status of visitors and researchers. In this study, each visitor’s feedback was fully valued, and the expert only played a role in organizing and analyzing the visitor’s reviews. Utilizing visitors’ voluntarily uploaded reviews (including comments and photos) on social media saves the cost of collecting visitors’ feedback and greatly expands the study’s sample size [18,19,20]. This provides the foundation for comprehensively describing visitors’ feedback.

4.1.1. Spatial Distribution of Preferred Rural Forest Scenes

In traditionally survey-based studies, the researcher commonly pre-set several types of scenes for visitors to judge their preferences [8]. Additionally, the expert experience occupied a decisive position [9], and therefore, some visitor-preferred scenes may be overlooked. In contrast to previous studies, this study shifts the opportunity for scene selection to visitors themselves by taking photos voluntarily posted by all visitors into consideration.
Photos screened by “noise” reduction criteria comprehensively reflect the visitor-preferred rural forest scenes in Huanglongxian Villages. As Figure 5 shows, Huanglong Tea Street, especially at the entrance and on the waterfront (the red area in the figure), are visitors’ most preferred outdoor scenes in Huanglongxian village. Compared with the popular scenes, many scenes (the blue area in the figure) hardly appear in the photos of visitors, which demonstrates that these scenes are neglected and not preferred enough by visitors. At the scale of the whole village, the level of visitors’ preference decreases from the east–west street in the center of the village to the surrounding area. However, there are exceptions in local areas, such as the areas near tourist service centers, hotel-concentrated regions, and children’s playgrounds, where there are localized high values in the level of visitor preference.

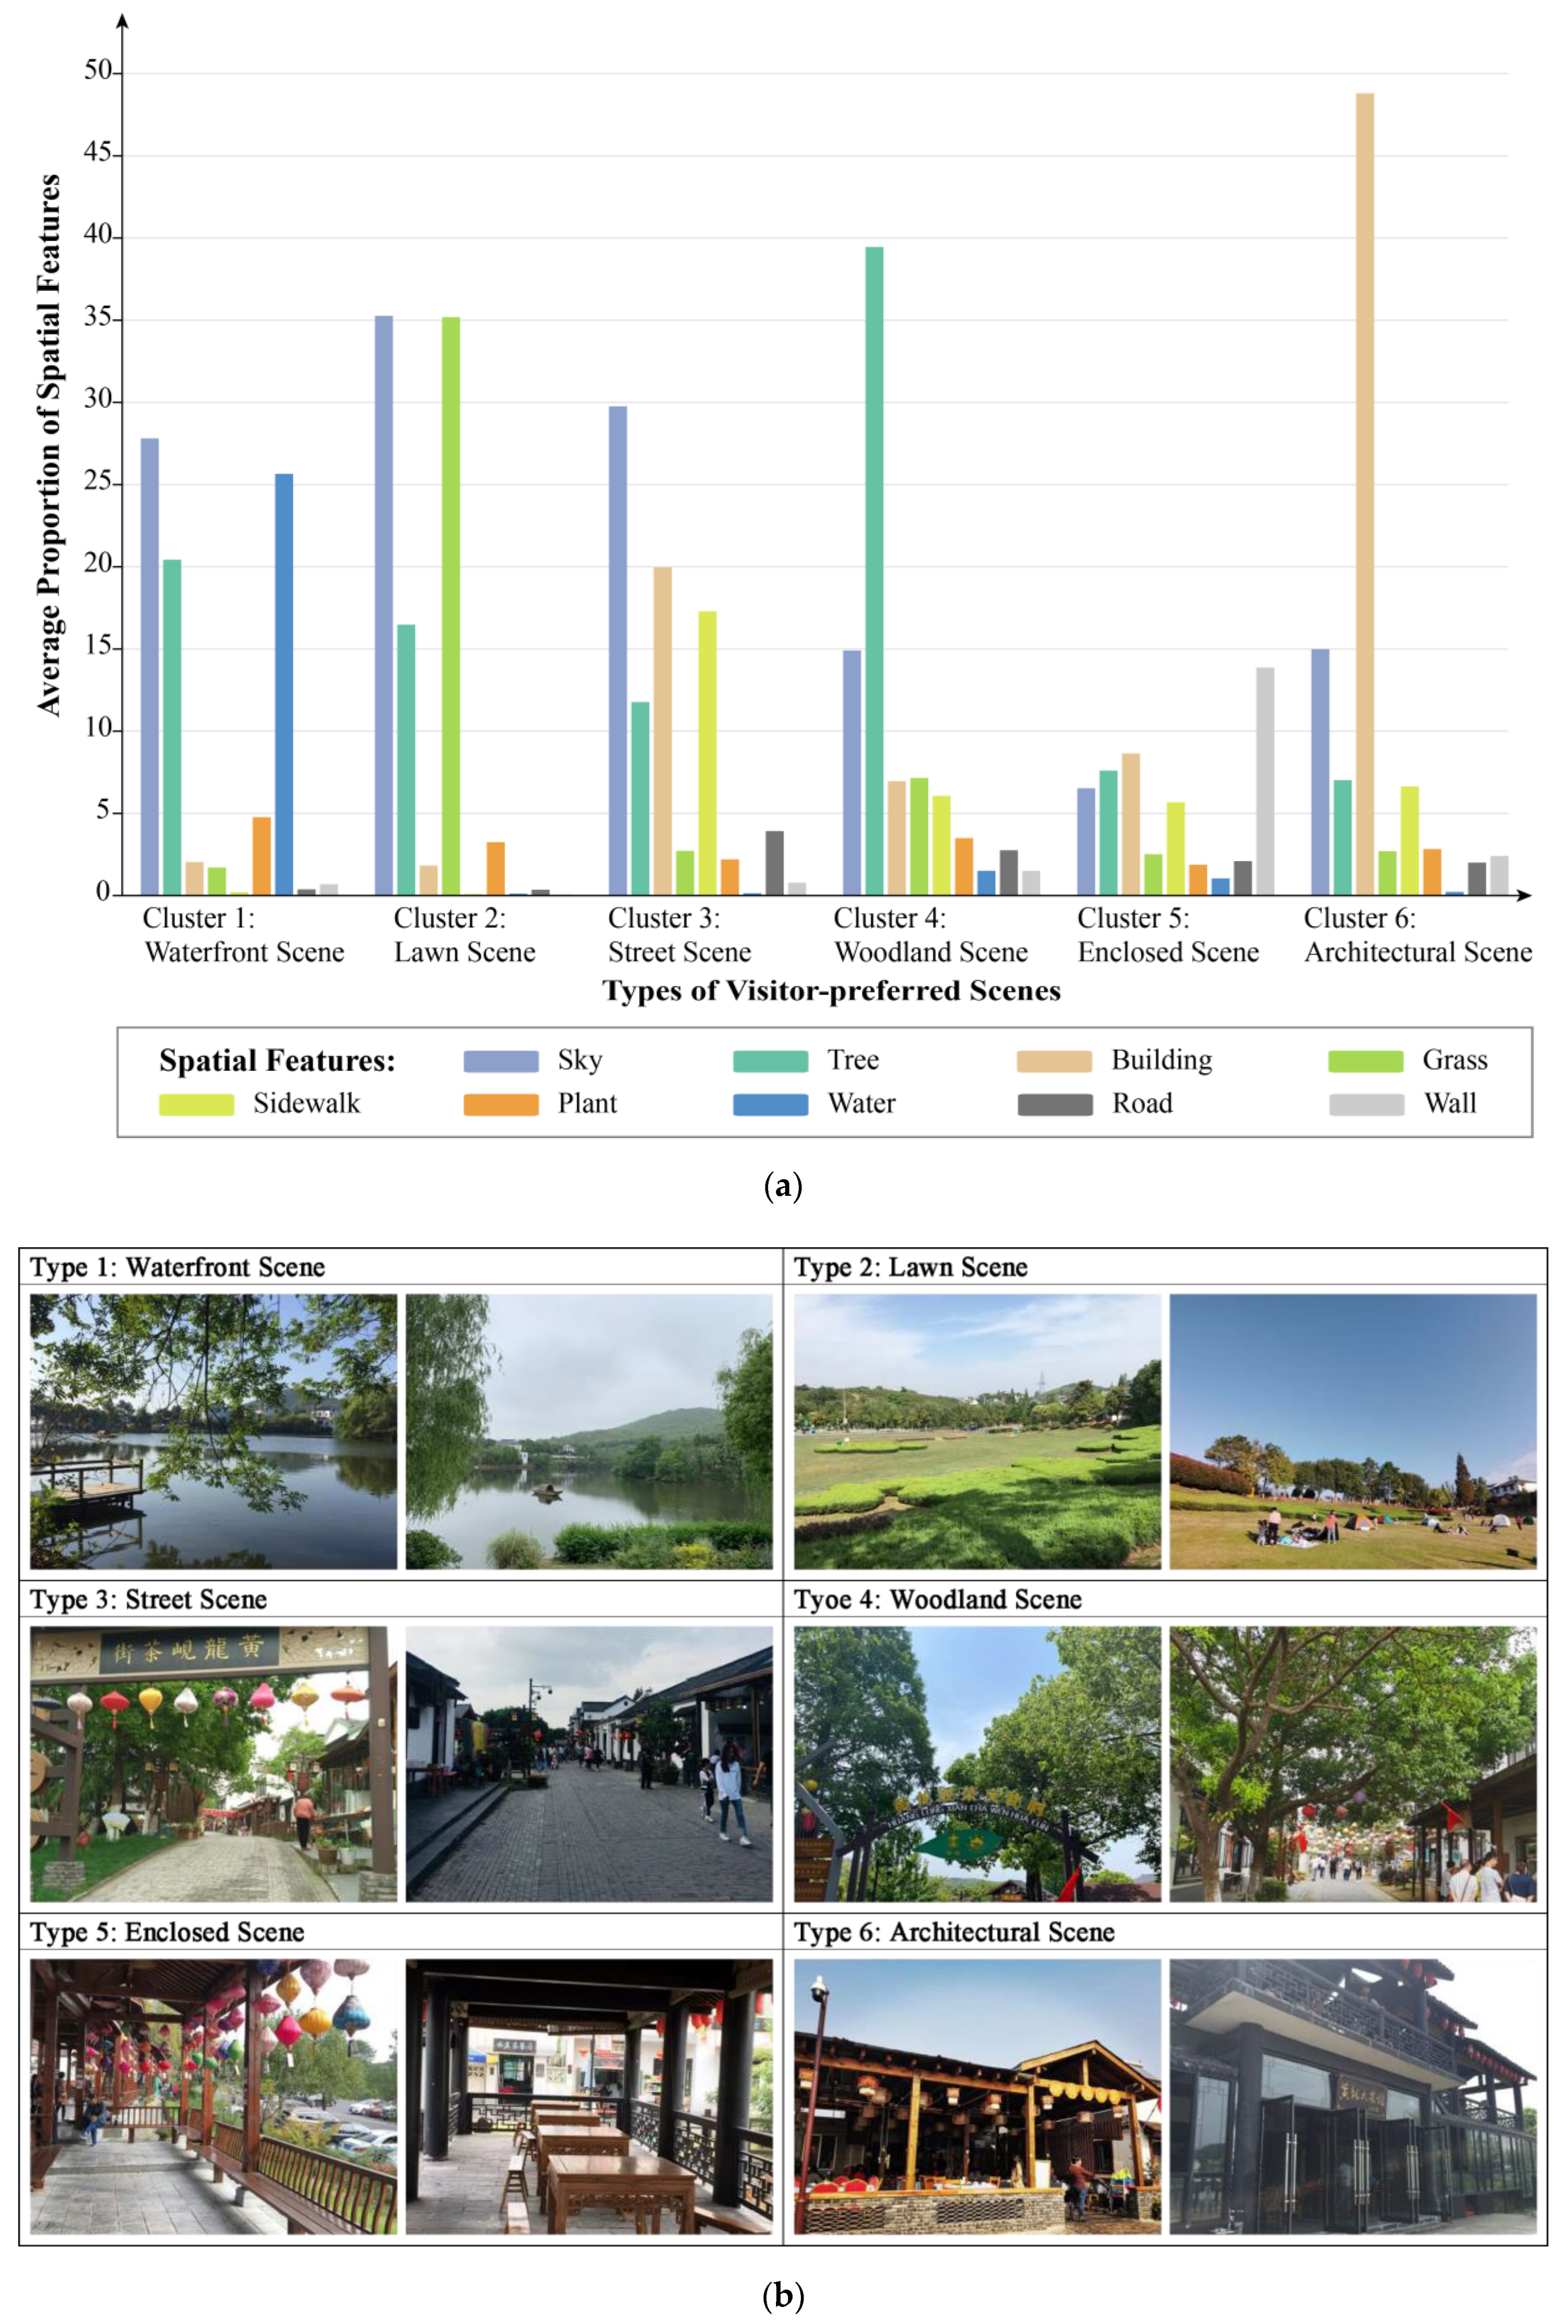
4.1.2. Scenes Characteristics of Preferred Rural Forest Scenes

In previous studies, the characteristics of scenes were described by researchers according to pre-set scenes before collecting visitors’ feedback [9,12]. This study tunes the sequence of describing scene characteristics. This study analyzed the characteristics of visitor-preferred scenes based on visitors’ feedback using CV technology and clustering algorithm so that we can quantitatively understand the characteristics of visitor-preferred rural forest scenes as follows:
  • In the waterfront scene, the sky and the water are dominant, accompanied by trees along the shore of Huanglong Lake.
  • The lawn scene is Huanglong Square, a great lawn covered by trample-resistant grass with sparse dwarf trees. The lawn scene gives visitors access to enjoy the sunshine and blue sky.
  • Mainly referring to the Huanglong Tea Street and Xiaoxian Market, the street scene is visitors’ most popular type of rural forest scene in Huanglongxian Village. Wide and well-greened streets are flanked by antique buildings where visitors can see the sky.
  • In the natural environment with plenty of trees, the second most popular scene is the woodland scene, with relatively less sky visibility, providing visitors with shade.
  • In the enclosed scene, the physical features are scattered, among which the wall relatively occupies a higher proportion. For example, the scene inside the Huanglong Pavilion, enclosed by low walls, offers visitors a place to rest.
  • In the architectural scene, the proportion of buildings is extremely high, which means the surroundings of native architecture with classical characteristics have a unique attraction for urban visitors.

4.1.3. Visitors’ Attitudes to Rural Forest Scenes

The limitation of lacking visitors’ feedback in previous studies [11,14,17] can be compensated by a large number of visitor social media reviews, and these comments were auto-analyzed using the LDA-NLP model. Based on the cost savings in visitors’ feedback acquisition and analysis, we can further interpret visitors’ attitudes to rural forest scenes:
  • Facilities support visitors and activities, including restrooms, farms, walking paths, etc. To some extent, tourism-related and consumption-related topic words can explain visitors’ preference for street scenes. Tea houses, shops, and restaurants are available in the street scene for rest, dining, and shopping.
  • Nature-related topic words indicate visitors prefer fresh air, tea mountains, lakes, and bamboo forests in waterfront and woodland scenes. Lawn-related topics words illustrate that visitors prefer the lawn scene because it supports numerous activities and access to sharing time with family and friends.
  • While the facilities and natural conditions of Huanglongxian Village already meet the needs of visitors and no additional construction is required, tea culture still needs to be optimized. Even though Huanglongxian Village is famous for the Jinling tea culture, its rural forest scenes lack elements that reflect the relevant culture, such as facilities, attractions, and services. This is why it fails to give tourists a good tea culture experience.

4.2. Effects of Factors in the Rural Forest Scenes on Visitors’ Preferences

This study incorporates multi-source geospatial data analysis to figure out the driven factors from the perspective of rural forest scene factors. Conventional regression methods [47,48,49] were the most common classical statistical methods in exploring how potential influencing factors affect visitors. The implications behind the multi-source geospatial data and how these implications can explain visitors’ preferences are yet to be appropriately uncovered. This study thoroughly considered SSH phenomena [44], using Geodetector to disentangle the complicated relationships between eight indicators of rural forest scene factors and visitors’ preferences. In addition to the natural factor, spotlighted in the urban forest scenes [8,9,10], this study extends to socio-economic and spatial factors.

4.2.1. Explanation Power of the Singe Factor in Rural Forest Scenes

From the perspective of a single indicator, although the explanatory power of each indicator is not as strong, the indicators of spatial factors have a more robust interpretation of visitors’ preferences. On the one hand, accessibility (reflected by NAIN) and usability (reflected by NACH) under the waking range area can be identified as the main driving power for the visitors’ preference in Huanglongxian Village. On the other hand, compared to the 2–3 min walk (which is the 200 m walking range), the 10–15 min walk (which is the 1000 m walking range) behavior is more likely to occur in Huanglongxian Village. Additionally, connectivity, to some extent, is also strongly associated with visitors’ preferences. These spatial indicators also reflect the transport condition within the village. And the results illustrate the equal importance of taking visitors to the different attractions and bringing visitors to the destination [23].
Regarding indicators of socio-economic factors, consumption support has significantly stronger explanatory power than non-consumption support for the visitors’ preference. Compared with non-consumption scenes such as scenic spots, planners should improve the construction of consumption scenes. This is not only an urgent need for visitors, but also a measure to promote the village’s economic growth.
Opposed to the conclusions obtained from studies in urban forest scenes, the natural factor has weak explanatory power for visitors’ preferences in rural forest scenes. Surrounded by Huanglong Lake and tea mountains, the natural environment throughout the village is already excellent compared to the urban forest scenes.

4.2.2. Interactive Effect of Factors in Rural Forest Scenes

From the perspective of an interactive detector, the combination of each of the two indicators of rural forest scene factors explains the distribution of visitors’ preferences better than a single indicator. It means that rational combinations between the various sources of the village can be more effective for visitors’ preferences. Moreover, although NDVI and Non-consumption barely explain visitors’ preference solely, combining them with other indicators can produce a non-linear enhancement effect on visitors’ preference. Although slight differences in vegetation cover have little impact on visitors’ perceptions, a pleasant natural environment, and non-consumptive attractions are the basis for villages to be able to attract visitors.

4.3. Theoretical Implications

From the technical perspective, in addition to the experience from traditional on-site surveys, this study fully utilizes interdisciplinary technologies and develops and validates a framework to transform social media and multi-source geospatial data into interpretable outcomes for visitors’ preferences in rural forest scenes. The data-fusion framework in this study consequently addresses traditional face-to-face surveys’ high monetary and time costs with low response rates [8,17]. Additionally, this data-fusion framework proposes a paradigm compatible with other types of data analysis methods and can be further optimized for different study purposes, such as business and commercial data, transportation and traffic data, and sports tracking data [50,51].
From the scope perspective, this study broadens the understanding of visitors’ preferences from urban forest scenes to rural forest scenes. This study tests and completes the conclusions drawn in the urban forest scenes: natural factors that play an important role in urban forest scenes [10] may fail to solely exert a significant influence on visitors’ preferences in rural forest scenes. In addition to natural factors, this study further expands the indicators of socio-economic and spatial factors.

4.4. Practical Implications

This study, fully utilizing interdisciplinary technologies, explores visitors’ preferences in rural forest scenes. The findings broaden the understanding of visitors’ preference in rural forest scenes and provide empirical evidence for rural planners to develop a visitor-attractive village from the perspective of socio-economic, spatial, and natural factors.
First of all, our study revealed that although socio-economic and spatial factors are not emphasized in the urban forest scenes, they are relevant to the visitors’ preference for rural forest scenes. Planners should be concerned about the socio-economic environment and spatial configurations. For example, visitors should be given more opportunities for consumption, and accessibility and usability should be considered when planning village roads.
Second, there should be some restraint on the greening of villages. This is because the effect of simply adding greenery to a rural forest scene on visitor preferences is insignificant. This places requirements on planners for the quality of greenery in addition to its quantity. Designing planted landscapes at the entrance to the village or on the street is more responsive to visitors’ needs than planting trees in groups.
Third, planners should think holistically about the various resources in the rural forest scenes. Analyzing the interactive effect between factors closely related to village construction, planners should contribute to human-centered village development by finding a new path for rationalizing the allocation of these factors.

4.5. Limitations

There are several limitations in this study. First, potential biases from social media data may hinder the full representation of all visitors’ feedback in Huanglongxian Village. The demographic details of visitors are not available on social media for personal privacy reasons. Feedback from people such as elderly children may make it harder to appear on social media because they do not use smartphones. Previous studies have shown that differences in visitors’ attributes, including visitors’ age, place of residence, destination stay time, return visits, etc., can lead to differences in tourist perceptions [52] and the sentiments they may convey [53]. Second, this study may not have sufficiently refined the identification of rural forest scenes. Because the ADE20K dataset was used for training the CV model in this study, it lacked sufficient training data for rural forest scene identification [45]. Future studies could improve the accuracy of identifying the physical features of rural forest scenes by producing datasets and labeling the training data as needed. Third, “cultural landscape” is another important concept of rural forest scene but less emphasized in this study compared with “natural landscape”. Huanglongxian Village has an abundance of cultural resources and has witnessed the human influence over time. Consequently, the cultural landscapes in Villages like Huanglongxian can be further studied in the future. Finally, geospatial data quality exhibited spatial heterogeneity [54], with fewer qualified data in the countryside compared to developed areas [55]. For example, as a type of Volunteered Geographic Information (VGI) [54,55], street networks from OSM were created by large numbers of citizens, mostly with no formal training [56]. Although street networks were manually amended and supplemented based on UAV remote sensing in this study, the accuracy of the results needs to be verified in subsequent studies.

5. Conclusions

This study developed a data-fusion framework to broaden the scope of understanding visitors’ preferences in rural forest settings. At the methodological level, empirical research implemented in Huanglongxian Village demonstrates the efficiency of social media and multi-source geospatial data in understanding visitors’ preferences compared with traditional approaches. At the level of the study subject, this study expanded from urban forest scenes to rural forest scenes. Contrary to the urban forest scenes, findings in rural forest scenes suggest that the natural factor does not significantly impact visitors’ preferences, and the spatial factor has a more robust interpretation. At the level of research depth, this study explores the influence of three types of indicators, including socio-economic factors, spatial factors, and natural factors. The combination of indicators can have a more substantial effect on visitors’ preferences than a single indicator. Consequently, the insight gained from this study will help achieve a more scientific decision-making process toward developing villages by instructing the village planning to meet the factual demand.

Author Contributions

Conceptualization, C.W. and S.C.; methodology, C.W. and S.C.; software, C.W.; validation, C.W., J.Z. and S.C.; formal analysis, C.W.; investigation, C.W., J.Z. and X.F.; resources, J.Z.; data curation, X.F.; writing—original draft preparation, C.W.; writing—review and editing, C.W.; visualization, C.W. and J.Z.; supervision, H.W.; project administration, H.W.; funding acquisition, H.W. All authors have read and agreed to the published version of the manuscript.

Funding

This research was funded by the “National Key Research and Development Program of China” (Grant No.2019YFD1100404): Research on the construction and application technology of rural plant landscape, “National Natural Science Foundation of China” (Grant No.52308066), “Jiangsu Province Universities Natural Sciences Foundation” (Grant No. 23KJB560018), and “A Project Funded by the Priority Academic Program Development of Jiangsu Higher Education Institutions” (PAPD).

Data Availability Statement

The data presented in this study are available upon request from the author. Images employed for the study will be available online for readers.

Acknowledgments

We would particularly like to acknowledge Hongchao Jiang for inspiring our interest in developing innovative technologies. In addition, we would like to acknowledge Bingchen Tong for her guidance on statistical methods for processing and analyzing social media data.

Conflicts of Interest

The authors declare no conflict of interest.

References

  1. Zhang, F.; Wang, N.; Li, Q. Low-Carbon Space in Urban and Rural Areas: Ecological Greenway Planning of Shanhaiguan District, Qinhuangdao City, China. Appl. Mech. Mater. 2013, 253–255, 821–824. [Google Scholar] [CrossRef]
  2. Lan, Y.; Liu, Q.; Zhu, Z. Exploring Landscape Design Intensity Effects on Visual Preferences and Eye Fixations in Urban Forests: Insights from Eye Tracking Technology. Forests 2023, 14, 1628. [Google Scholar] [CrossRef]
  3. Sun, Y.; Shao, Y.; Chan, E.H.W. Co-Visitation Network in Tourism-Driven Peri-Urban Area Based on Social Media Analytics: A Case Study in Shenzhen, China. Landsc. Urban Plan. 2020, 204, 103934. [Google Scholar] [CrossRef]
  4. Su, T.; Wang, K.; Li, S.; Wang, X.; Li, H.; Ding, H.; Chen, Y.; Liu, C.; Liu, M.; Zhang, Y. Analysis and Optimization of Landscape Preference Characteristics of Rural Public Space Based on Eye-Tracking Technology: The Case of Huangshandian Village, China. Sustainability 2022, 15, 212. [Google Scholar] [CrossRef]
  5. Kastenholz, E.; Eusebio, C.; Carneiro, M.J. Segmenting the Rural Tourist Market by Sustainable Travel Behaviour: Insights from Village Visitors in Portugal. J. Destin. Mark. Manag. 2018, 10, 132–142. [Google Scholar] [CrossRef]
  6. Gao, C.; Cheng, L.; Iqbal, J.; Cheng, D. An Integrated Rural Development Mode Based on a Tourism-Oriented Approach: Exploring the Beautiful Village Project in China. Sustainability 2019, 11, 3890. [Google Scholar] [CrossRef]
  7. Tu, S.; Long, H.; Zhang, Y.; Ge, D.; Qu, Y. Rural Restructuring at Village Level under Rapid Urbanization in Metropolitan Suburbs of China and Its Implications for Innovations in Land Use Policy. Habitat Int. 2018, 77, 143–152. [Google Scholar] [CrossRef]
  8. Arnberger, A.; Eder, R. Are Urban Visitors’ General Preferences for Green-Spaces Similar to Their Preferences When Seeking Stress Relief? Urban For. Urban Green. 2015, 14, 872–882. [Google Scholar] [CrossRef]
  9. Li, C.; Shen, S.; Ding, L. Evaluation of the Winter Landscape of the Plant Community of Urban Park Green Spaces Based on the Scenic Beauty Esitimation Method in Yangzhou, China. PLoS ONE 2020, 15, e0239849. [Google Scholar] [CrossRef]
  10. Santosa, H.; Ernawati, J.; Wulandari, L.D. Visual Quality Evaluation of Urban Commercial Streetscape for the Development of Landscape Visual Planning System in Provincial Street Corridors in Malang, Indonesia. IOP Conf. Ser. Earth Environ. Sci. 2018, 126, 012202. [Google Scholar] [CrossRef]
  11. Wilkins, E.J.; Van Berkel, D.; Zhang, H.; Dorning, M.A.; Beck, S.M.; Smith, J.W. Promises and Pitfalls of Using Computer Vision to Make Inferences about Landscape Preferences: Evidence from an Urban-Proximate Park System. Landsc. Urban Plan. 2022, 219, 104315. [Google Scholar] [CrossRef]
  12. Jay, M.; Schraml, U. Understanding the Role of Urban Forests for Migrants—Uses, Perception and Integrative Potential. Urban For. Urban Green. 2009, 8, 283–294. [Google Scholar] [CrossRef]
  13. Sonti, N.F.; Campbell, L.K.; Svendsen, E.S.; Johnson, M.L.; Novem Auyeung, D.S. Fear and Fascination: Use and Perceptions of New York City’s Forests, Wetlands, and Landscaped Park Areas. Urban For. Urban Green. 2020, 49, 126601. [Google Scholar] [CrossRef]
  14. Southon, G.E.; Jorgensen, A.; Dunnett, N.; Hoyle, H.; Evans, K.L. Biodiverse Perennial Meadows Have Aesthetic Value and Increase Residents’ Perceptions of Site Quality in Urban Green-Space. Landsc. Urban Plan. 2017, 158, 105–118. [Google Scholar] [CrossRef]
  15. Heyman, E. Analysing Recreational Values and Management Effects in an Urban Forest with the Visitor-Employed Photography Method. Urban For. Urban Green. 2012, 11, 267–277. [Google Scholar] [CrossRef]
  16. Du, H.; Jiang, H.; Song, X.; Zhan, D.; Bao, Z. Assessing the Visual Aesthetic Quality of Vegetation Landscape in Urban Green Space from a Visitor’s Perspective. J. Urban Plan. Dev. 2016, 142, 04016007. [Google Scholar] [CrossRef]
  17. Arnberger, A.; Budruk, M.; Schneider, I.E.; Wilhelm Stanis, S.A. Predicting Place Attachment among Walkers in the Urban Context: The Role of Dogs, Motivations, Satisfaction, Past Experience and Setting Development. Urban For. Urban Green. 2022, 70, 127531. [Google Scholar] [CrossRef]
  18. Xiang, Z.; Gretzel, U. Role of Social Media in Online Travel Information Search. Tour. Manag. 2010, 31, 179–188. [Google Scholar] [CrossRef]
  19. Huang, Y.; Li, Z.; Huang, Y. User Perception of Public Parks: A Pilot Study Integrating Spatial Social Media Data with Park Management in the City of Chicago. Land 2022, 11, 211. [Google Scholar] [CrossRef]
  20. Li, Q.; Wu, Y.; Wang, S.; Lin, M.; Feng, X.; Wang, H. VisTravel: Visualizing Tourism Network Opinion from the User Generated Content. J. Vis. 2016, 19, 489–502. [Google Scholar] [CrossRef]
  21. Chan, H.K.; Wang, X.; Lacka, E.; Zhang, M. A Mixed-Method Approach to Extracting the Value of Social Media Data. Prod. Oper. Manag. 2016, 25, 568–583. [Google Scholar] [CrossRef]
  22. Liu, T.-J.; Lin, Y.-C.; Lin, W.; Kuo, C.-C.J. Visual Quality Assessment: Recent Developments, Coding Applications and Future Trends. APSIPA Trans. Signal Inf. Process. 2013, 2, e4. [Google Scholar] [CrossRef]
  23. Mira, M.D.R.C.; Mónico, L.M.; Breda, Z.J. Territorial Dimension in the Internationalization of Tourism Destinations: Structuring Factors in the Post-COVID19. Tour. Manag. Stud. 2021, 17, 33–44. [Google Scholar] [CrossRef]
  24. Psyllidis, A.; Gao, S.; Hu, Y.; Kim, E.-K.; McKenzie, G.; Purves, R.; Yuan, M.; Andris, C. Points of Interest (POI): A Commentary on the State of the Art, Challenges, and Prospects for the Future. Comput. Urban Sci. 2022, 2, 20. [Google Scholar] [CrossRef] [PubMed]
  25. Chen, B.; Tu, Y.; Song, Y.; Theobald, D.M.; Zhang, T.; Ren, Z.; Li, X.; Yang, J.; Wang, J.; Wang, X.; et al. Mapping Essential Urban Land Use Categories with Open Big Data: Results for Five Metropolitan Areas in the United States of America. Isprs J. Photogramm. Remote Sens. 2021, 178, 203–218. [Google Scholar] [CrossRef]
  26. Ye, Y.; Richards, D.; Lu, Y.; Song, X.; Zhuang, Y.; Zeng, W.; Zhong, T. Measuring Daily Accessed Street Greenery: A Human-Scale Approach for Informing Better Urban Planning Practices. Landsc. Urban Plan. 2019, 191, 103434. [Google Scholar] [CrossRef]
  27. Kuliga, S.F.; Nelligan, B.; Dalton, R.C.; Marchette, S.; Shelton, A.L.; Carlson, L.; Hölscher, C. Exploring Individual Differences and Building Complexity in Wayfinding: The Case of the Seattle Central Library. Environ. Behav. 2019, 51, 622–665. [Google Scholar] [CrossRef]
  28. Hillier, B.; Iida, S. Network and Psychological Effects in Urban Movement. In Proceedings of the Spatial Information Theory, Ellicottville, NY, USA, 14–18 September 2005; Cohn, A.G., Mark, D.M., Eds.; Springer: Berlin, Heidelberg, 2005; pp. 475–490. [Google Scholar]
  29. Koohsari, M.J.; Kaczynski, A.T.; Mcormack, G.R.; Sugiyama, T. Using Space Syntax to Assess the Built Environment for Physical Activity: Applications to Research on Parks and Public Open Spaces. Leis. Sci. 2014, 36, 206–216. [Google Scholar] [CrossRef]
  30. Luo, J.; Zhao, T.; Cao, L.; Biljecki, F. Semantic Riverscapes: Perception and Evaluation of Linear Landscapes from Oblique Imagery Using Computer Vision. Landsc. Urban Plan. 2022, 228, 104569. [Google Scholar] [CrossRef]
  31. Albetis, J.; Duthoit, S.; Guttler, F.; Jacquin, A.; Goulard, M.; Poilvé, H.; Féret, J.-B.; Dedieu, G. Detection of Flavescence Dorée Grapevine Disease Using Unmanned Aerial Vehicle (UAV) Multispectral Imagery. Remote Sens. 2017, 9, 308. [Google Scholar] [CrossRef]
  32. Liu, C.; Cao, Y.; Yang, C.; Zhou, Y.; Ai, M. Pattern Identification and Analysis for the Traditional Village Using Low Altitude UAV-Borne Remote Sensing: Multifeatured Geospatial Data to Support Rural Landscape Investigation, Documentation and Management. J. Cult. Herit. 2020, 44, 185–195. [Google Scholar] [CrossRef]
  33. Donahue, M.L.; Keeler, B.L.; Wood, S.A.; Fisher, D.M.; Hamstead, Z.A.; McPhearson, T. Using Social Media to Understand Drivers of Urban Park Visitation in the Twin Cities, MN. Landsc. Urban Plan. 2018, 175, 1–10. [Google Scholar] [CrossRef]
  34. Liang, H.; Yan, Q.; Yan, Y.; Zhang, L.; Zhang, Q. Spatiotemporal Study of Park Sentiments at Metropolitan Scale Using Multiple Social Media Data. Land 2022, 11, 1497. [Google Scholar] [CrossRef]
  35. Kobayashi, M.; Takeda, K. Information Retrieval on the Web. ACM Comput. Surv. 2000, 32, 144–173. [Google Scholar] [CrossRef]
  36. Kedzierski, M.; Wierzbicki, D. Methodology of Improvement of Radiometric Quality of Images Acquired from Low Altitudes. Measurement 2016, 92, 70–78. [Google Scholar] [CrossRef]
  37. Cao, J.; Leng, W.; Liu, K.; Liu, L.; He, Z.; Zhu, Y. Object-Based Mangrove Species Classification Using Unmanned Aerial Vehicle Hyperspectral Images and Digital Surface Models. Remote Sens. 2018, 10, 89. [Google Scholar] [CrossRef]
  38. Shang, Y.; Wen, C.; Bai, Y.; Hou, D. A Novel Framework for Exploring the Spatial Characteristics of Leisure Tourism Using Multisource Data: A Case Study of Qingdao, China. IEEE J. Sel. Top. Appl. Earth Obs. Remote Sens. 2022, 15, 6259–6271. [Google Scholar] [CrossRef]
  39. Soares, I.; Yamu, C.; Weitkamp, G. The Relationship between the Spatial Configuration and the Fourth Sustainable Dimension Creativity in University Campuses: The Case Study of Zernike Campus, Groningen, The Netherlands. Sustainability 2020, 12, 9263. [Google Scholar] [CrossRef]
  40. Sheng, Q.; Wan, D.; Yu, B. Effect of Space Configurational Attributes on Social Interactions in Urban Parks. Sustainability 2021, 13, 7805. [Google Scholar] [CrossRef]
  41. Lyu, F.; Zhang, L. Using Multi-Source Big Data to Understand the Factors Affecting Urban Park Use in Wuhan. Urban For. Urban Green. 2019, 43, 126367. [Google Scholar] [CrossRef]
  42. Ersi, C.; Bayaer, T.; Bao, Y.; Bao, Y.; Yong, M.; Lai, Q.; Zhang, X.; Zhang, Y. Comparison of Phenological Parameters Extracted from SIF, NDVI and NIRv Data on the Mongolian Plateau. Remote Sens. 2023, 15, 187. [Google Scholar] [CrossRef]
  43. Silverman, B.W. Density Estimation for Statistics and Data Analysis; CRC Press: Boca Raton, FL, USA, 1986; ISBN 978-0-412-24620-3. [Google Scholar]
  44. Zhao, H.; Shi, J.; Qi, X.; Wang, X.; Jia, J. Pyramid Scene Parsing Network. In Proceedings of the 2017 IEEE Conference on Computer Vision and Pattern Recognition (CVPR), Honolulu, HI, USA, 21–26 July 2017; pp. 6230–6239. [Google Scholar]
  45. Zhou, B.; Zhao, H.; Puig, X.; Xiao, T.; Fidler, S.; Barriuso, A.; Torralba, A. Semantic Understanding of Scenes through the ADE20K Dataset. Int. J. Comput. Vis. 2019, 127, 302–321. [Google Scholar] [CrossRef]
  46. Hartigan, J.A.; Wong, M.A. Algorithm AS 136: A K-Means Clustering Algorithm. J. R. Stat. Soc. Ser. C Appl. Stat. 1979, 28, 100–108. [Google Scholar] [CrossRef]
  47. Wang, J.-F.; Zhang, T.-L.; Fu, B.-J. A Measure of Spatial Stratified Heterogeneity. Ecol. Indic. 2016, 67, 250–256. [Google Scholar] [CrossRef]
  48. Wang, J.; Li, X.; Christakos, G.; Liao, Y.; Zhang, T.; Gu, X.; Zheng, X. Geographical Detectors-Based Health Risk Assessment and Its Application in the Neural Tube Defects Study of the Heshun Region, China. Int. J. Geogr. Inf. Sci. 2010, 24, 107–127. [Google Scholar] [CrossRef]
  49. Zhai, Y.; Baran, P.K. Do Configurational Attributes Matter in Context of Urban Parks? Park Pathway Configurational Attributes and Senior Walking. Landsc. Urban Plan. 2016, 148, 188–202. [Google Scholar] [CrossRef]
  50. Tsou, M.-H. Research Challenges and Opportunities in Mapping Social Media and Big Data. Cartogr. Geogr. Inf. Sci. 2015, 42, 70–74. [Google Scholar] [CrossRef]
  51. Heikinheimo, V.; Tenkanen, H.; Bergroth, C.; Järv, O.; Hiippala, T.; Toivonen, T. Understanding the Use of Urban Green Spaces from User-Generated Geographic Information. Landsc. Urban Plan. 2020, 201, 103845. [Google Scholar] [CrossRef]
  52. Li, Q.; Li, S.; Zhang, S.; Hu, J.; Hu, J. A Review of Text Corpus-Based Tourism Big Data Mining. Appl. Sci. 2019, 9, 3300. [Google Scholar] [CrossRef]
  53. Padilla, J.J.; Kavak, H.; Lynch, C.J.; Gore, R.J.; Diallo, S.Y. Temporal and Spatiotemporal Investigation of Tourist Attraction Visit Sentiment on Twitter. PLoS ONE 2018, 13, e0198857. [Google Scholar] [CrossRef]
  54. Corcoran, P.; Mooney, P.; Bertolotto, M. Analysing the Growth of OpenStreetMap Networks. Spat. Stat. 2013, 3, 21–32. [Google Scholar] [CrossRef]
  55. Mashhadi, A.; Quattrone, G.; Capra, L. Putting Ubiquitous Crowd-Sourcing into Context. In Proceedings of the 2013 Conference on Computer Supported Cooperative Work, San Antonio, TX, USA, 23–27 February 2013; Association for Computing Machinery: New York, NY, USA, 2013; pp. 611–622. [Google Scholar]
  56. Goodchild, M.F. Citizens as Sensors: The World of Volunteered Geography. Geo. J. 2007, 69, 211–221. [Google Scholar] [CrossRef]
Figure 1. The extent of the study area, Huanglongxian, China.
Forests 14 01932 g001
Figure 2. The data-fusion framework of this research.
Forests 14 01932 g002
Figure 3. Photo screening criteria and process.
Forests 14 01932 g003
Figure 4. Semantic segmentation based on PSPNet. (a) Original image before semantic segmentation; (b,c) The result of semantic segmentation.
Forests 14 01932 g004
Figure 5. The spatial distribution of visitors’ preferences.
Forests 14 01932 g005
Figure 6. Six types of visitor-preferred scenes. (a) The average proportion of physical features among six clusters; (b) examples of photos among six types of scenes.
Forests 14 01932 g006
Figure 7. The trend of perplexity with the number of topics.
Forests 14 01932 g007
Figure 8. Distribution of visitors’ attitudes under different topics.
Forests 14 01932 g008
Figure 9. Results of factors extraction. (a,b) Results of socio-economic factor extraction; (cg) results of spatial factor extraction; (h) results of natural factor extraction.
Forests 14 01932 g009aForests 14 01932 g009b
Figure 10. Results of interaction detector.
Forests 14 01932 g010
Table 1. The data sources and description of all variables.
VariablesData SourceDescriptionReference
Explained Variable (Y)
Y: Visitor PreferenceDianpingBased on systematic observation, we identified the location of the visitor preference scenes from photos posted by visitors on Dianping.com. These location points were geo-processed by KDE, and the result of data smoothing represented the Visitor Preference.Yiwei Huang et al. [19]
Silverman et al. [43]
Explanatory Variables (X)
Socio-economic factor
X1: ConsumptionBigemapThe density of POIs, including all restaurants, hostels, and stores, represents the service level of consumption for visitors.Yiqun Shang et al. [38]
X2: Non-consumptionBigemapThe density of POIs, including all facilities and attractions, represents the service level of non-consumption for visitors.
Spatial factor
X3: ConnectivityOSM, UAVConnectivity represents how many spaces are directly connected to the starting space. The angular connectivity offers a better description of space relationships by considering the weight of each connected space according to the turn angle. Isabelle Soares et al. [39]
Cha Ersi et al. [42]
Integration
(X4: NAINr200m,
X5: NAINr1000m)
OSM, UAVIntegration represents how easily a space can be reached from other spaces. To compare systems of different sizes, normalized angular integration (NAIN) with two radii (200 and 1000 m) was taken in this study according to the range of the village scales to represent walking accessibility.
Choice
(X6: NACHIr200m,
X7: NACHr1000m)
OSM, UAVChoice is a measure of space usability that considers the potential for each segment element to be selected as the shortest path. A higher choice value indicates that the calculated space is more likely to be selected by the through-movement in the network. Similar to the integration, the normalized angular choice (NACH) with two calculation radii (200 and 1000 m) was applied to represent local usability in this study.
Nature factor
X8: NDVIUAVNDVI indicates the vegetation growth and vegetation cover status of which value is between 0 and 1, and the closer to 1, the larger the vegetation cover and the better the vegetation growth condition (more green leaf area).Feinan Lyu et al. [41]
Cha Ersi et al. [42]
Table 2. Interaction between Explanatory Variables (Xs).
DescriptionInteraction
q(X1∩X2) < Min(q(X1), q(X2))Weaken, nonlinear
Min(q(X1), q(X2)) < q(X1∩X2) < Max(q(X1)), q(X2))Weaken, uni-
q(X1∩X2) > Max(q(X1), q(X2))Enhance, bi-
q(X1∩X2) = q(X1) + q(X2)Independent
q(X1∩X2) > q(X1) + q(X2)Enhance, nonlinear
Table 3. Number of cases per cluster with different divisions of clusters.
Cluster 1Cluster 2Cluster 3Cluster 4Cluster 5Cluster 6Cluster 7Cluster 8
2 Clusters490415
3 Clusters329182394
4 Clusters28316280380
5 Clusters208100142169286
6 Clusters8014427517982145
7 Clusters1571821331497614761
8 Clusters161137130144619111269
Table 4. Topic extraction results for visitors’ comments.
Topic NamesComments CountTopic Words
Facilities157Restroom, Farm, Walking paths, Store, etc.
Nature176Fresh air, Tea mountains, Lake, Bamboo Forest, etc.
Tourism194Scenic spots, Commercial streets, Markets, Products, etc.
Tea Culture165Tea art, tea fields, Tea houses, Tea mountains, etc.
Lawn186Sunbathing, Partying, Picnicking, Kite flying, etc.
Leisure159Relaxation, Flower viewing, Oxygen bar, Music, etc.
Consumption196Teahouse, Shops, Hotels, Restaurants, etc.
Table 5. Result of Pearson correlation between spatial factor indicators.
ConnectivityNAINr200mNAINr1000mNACHIr200mNACHr1000m
Connectivity1.000
NAINr200m0.151 **1.000
NAINr1000m0.114 **0.767 **1.000
NACHIr200m0.270 **0.533 **0.435 **1.000
NACHr1000m0.279 **0.577 **0.544 **0.955 **1.000
Note: ** represents a significant correlation at 0.01 level. Correlation coefficients > 0.5 are bolded.
Table 6. Results of factor detector.
X1X2X3X4X5X6X7X8
ConsumptionNon-ConsumptionConnectivityNAINr200mNAINr1000mNACHIr200mNACHr1000mNDVI
q-statistics0.1360.0380.1440.1250.1750.1320.1740.011
p-value0.0000.0000.0000.0000.0000.0000.0000.000
Disclaimer/Publisher’s Note: The statements, opinions and data contained in all publications are solely those of the individual author(s) and contributor(s) and not of MDPI and/or the editor(s). MDPI and/or the editor(s) disclaim responsibility for any injury to people or property resulting from any ideas, methods, instructions or products referred to in the content.

