Article

A 900-Year Isotopic Proxy Rainfall Record from Northeastern Botswana

1
Faculty of Chemistry and Chemical Engineering, Babeş-Bolyai University, 400084 Cluj-Napoca, Romania
2
Raluca Ripan Institute for Research in Chemistry, Babeş-Bolyai University, 400084 Cluj-Napoca, Romania
3
Mammal Research Institute, University of Pretoria, Private Bag X20, Hatfield, Pretoria 0028, South Africa
4
Tau Consultants (Pty) Ltd., Maun P/Bag 83, Botswana
5
Department of Geography, Swansea University, Swansea SA2 8PP, UK
6
Faculty of Environmental Science and Engineering, Babeş-Bolyai University, 400084 Cluj-Napoca, Romania
7
Faculty of Biology and Geology, Babeş-Bolyai University, 400084 Cluj-Napoca, Romania
8
iThemba LABS, Private Bag 11, WITS, Johannesburg 2050, South Africa
*
Author to whom correspondence should be addressed.
Forests 2023, 14(9), 1917; https://doi.org/10.3390/f14091917
Submission received: 31 August 2023 / Revised: 15 September 2023 / Accepted: 18 September 2023 / Published: 20 September 2023
(This article belongs to the Special Issue Age and Growth Assessment of Trees by Radiocarbon Dating)

Abstract

:
A high-resolution climate archive was reconstructed based on carbon isotope analysis and radiocarbon dating of the Chapman baobab in northeastern Botswana. The Chapman baobab, which exhibited an open ring-shaped structure composed of six stems, collapsed in January 2016 during an intense El Niño event. Two samples belonging to the oldest stems were investigated in order to obtain a proxy rainfall record, which provides insight into the precipitation regime over the last millennium, evincing centennial and decadal scale variability. The results indicate that the Medieval Warm Period was marked by relatively stable precipitation, whereas rainfall variability and drought frequency increased during the Little Ice Age. The investigated area has experienced both wetter and drier conditions in the past. The wettest conditions of the last millennium were registered before 1450 while the driest period occurred in 1835. For southern Africa, inter-annual rainfall variability is mainly associated with sea surface temperatures in the Agulhas Current core region, which determine the east–west displacement of tropical temperate troughs. Previous studies suggested that positive sea surface temperature anomalies in the Mozambique Channel led to an eastward movement of the troughs but the Chapman record demonstrates a westward displacement in the past, causing drought in northeastern South Africa and wetter conditions in the central part of southern Africa. The positive rainfall correlation with SST anomalies reversed after 1900, causing a gradual decrease in precipitation and confirming the current aridity trend for Botswana. The results contribute to a better understanding of the past climate of southern Africa for which paleoclimate reconstructions remain scarce.

1. Introduction

The dry regions of the tropics present a high climatological risk of desertification and southern Africa is particularly vulnerable [1]. Climate simulations indicate a temperature increase of 4–6 °C associated with widespread reduction in rainfall by the end of the century [2]. The warming rate of this region is twice as high as the global trend [3] and among the most elevated in the Southern Hemisphere [4]. Temperature increases lead to significant modifications in atmospheric processes causing higher uncertainty in future precipitation prediction patterns [5,6]. Rainfall regimes are expected to shift and alter their frequency, while rainfall variability will increase and generate water insecurity [7]. An increasing number of people inhabit regions where the mean annual precipitation is considered unfamiliar compared to the previous century and, although for southern Africa annual precipitation shows no trend, precipitation extremes have increased with more intense heavy rainfall and longer dry spells [3]. Extreme climate events such as droughts, cyclones, floods, and anomalies such as heat-wave days and fire danger days are also expected to rise, while extreme cold waves will decrease [2,3].
Governance systems to reduce the impact of climate change require a long-term sustainable perspective based on a fundamental understanding of the climate. Modelling can, for example, output rainfall fields that show substantial changes without elucidating the underlying mechanisms. Future temperature projections are consistent between simulations, yet future rainfall simulations exhibit great uncertainty [2,7,8,9]. Poor instrumental climate records are a challenge to reducing this uncertainty. In the absence of long instrumental records, paleoclimate studies are required to reveal the mechanisms of intrinsic changes in the climate system, but this approach is undermined by a paucity of suitable paleoenvironmental sites [10,11].
Two-thirds of Botswana is a savanna desert in which evaporation rates exceed precipitation [12]. Rainfall is erratic, unpredictable, heterogeneous and unreliable, showing high variability at a regional scale. The dominant rain-fed agricultural subsistence strategies would suffer greatly even with a small decline in rainfall, especially in areas close to the limit for such practices [13,14], highlighting the importance of adaptation options to reduce food insecurity, especially in vulnerable groups. A global warming increase of 0.5 °C above 1.5 °C represents a transition from medium- to high-risk impact on food security as food availability in southern Africa is projected to decrease [15]. Biodiversity loss in southern Africa is foreseen to be among the highest with increasing warming [3]. Rising temperatures combined with a reduction in precipitation will exacerbate crop failure, water scarcity, famine, disease, energy demand, land degradation and desertification [3,16]. Studies on rainfall variability over the past 30 years did not identify a clear trend for southern Africa, where inter-annual rainfall variability can reach 200%, but all concur that there is an increase in the duration and intensity of dry periods [3,7,17]. According to Gimeno et al. [6], southern Africa receives moisture from only 1–2 source regions, which renders it more exposed to strong changes in the water cycle caused by climate change. The Indian Ocean has been the main rainfall source throughout the past 45 ka in the Kalahari [18]. Large-scale forcing is linked to sea-surface temperature (SST) in the Agulhas Current core region, which influences the E/W displacement of temperate tropical troughs (TTTs) that are responsible for most precipitation events in this area [19,20]. El Niño Southern Oscillation (ENSO) is not a constant driver of rainfall over the last millennium; rather, mature phases of El Niño alternated with wet/dry conditions. Funk et al. [21] found that anthropogenic forcing plays a role in exacerbating the effects of moderate to strong El Niño events in southern Africa and that western North Pacific SST appears to be a strong teleconnection [22]. Nevertheless, a clear negative association between modern-day El Niño events and southern African rainfall emerged [23,24]. Fauchereau et al. [25] suggested that El Niño generates a complex indirect influence over southern Africa; however, longer and better spatially resolved data is required to unravel this forcing.
Tree-ring chronologies could offer a suitable temporal and spatial proxy but tropical tree species are relatively short lived [26]. Furthermore, tropical trees do not necessarily form distinct annual growth rings; thus, developing accurate tree-ring chronologies is a challenging feat, especially by traditional dendrochronological means [9,27,28]. Relatively few climate reconstructions based on traditional dendroclimatological methods have been established for Africa: a 412-year record for the southwestern winter rainfall area [29], a 596-year rainfall archive for KwaZulu-Natal [30], a 600-year reconstruction for the southern coastal region of South Africa [31,32], a 200-year record for Zimbabwe [33], a 100-year record for Namibia [34], 111 years for Mozambique [35], 68 [36] and 91 years for Ethiopia [37,38], 160 years for Benin [39], 149 years for Zambia [8], and 49 years for Botswana [40]. In all studies, growing seasons were triggered by precipitation, which was often negatively correlated with temperature. The spatial and temporal resolution of these records remains inadequate to fully understand regional climate dynamics. An alternative approach to ring-width chronologies is stable isotope investigation of trees, coupled with radiocarbon dating for species with problematic growth rings. This is possible due to the active leaf-level physiological control trees exert on carbon assimilation and biochemical isotopic discrimination [41]. The Rubisco fixation process has a constant isotopic fractionation effect on wood relative to atmospheric CO2. During periods of low edaphic moisture availability, drought-avoidance mechanisms limit stomatal activity and the discrimination against 12CO2 in favour of 13CO2 is reduced. For southern Africa, the environmental forcing on tree C isotope ratios consists of edaphic moisture availability driven by seasonal rainfall since the temperature during the growth season is relatively high and does not present a determining factor for CO2 assimilation [20]. By analysing the variability of carbon isotopic fractionation in wood (δ13C), the rainfall series can be reconstructed. This cannot be applied to riparian specimens, nor for trees with additional moisture sources.
The use of δ13C as a proxy for rainfall in Africa was used in yellowwood trees (Podocarpus latifolius) [42], coastal red milkwood trees (Mimusops caffra) [43], camel thorn (Vachellia erioloba) [44], Cape cheesewood (Pittosporum viridiflorum), African cherry (Prunus africana) [45], Grandidier and za baobabs (Adansonia grandidieri, A. za) [46] and matumi trees (Breonadia salicina), which yielded a 600-year long record that proved the changes in the carbon isotope composition reflect rainfall variability [47], whereas the oxygen isotope composition is influenced by additional factors [48].
In 2005, we started a complex research project aiming to clarify numerous controversial aspects related to the architecture, development, and age of the African baobab (Adansonia digitata), which gradually extended to other Adansonia species [49,50,51,52,53,54]. This research relies on AMS radiocarbon dating of tiny wood samples extracted from different areas of monumental trees [55,56,57,58]. Through radiocarbon investigation, we identified the unique multi-stem architecture within the genus Adansonia, namely the ring-shaped structure that enables specimens to reach old ages and great sizes, making the African baobab the stoutest and oldest known angiosperm in the world [59].
Such longevity makes the baobab a valuable candidate for high-resolution paleoclimate reconstructions. In 2006, Robertson et al. [60] explored the potential of δ13C from African baobabs as a climate archive and demonstrated that its growth is positively correlated with rainfall. Due to their shallow root system [61], baobabs seldom access groundwater and mainly rely on precipitation events [40]. However, the African baobab’s growth ring anomalies include false, missing, indistinct, supra- or sub-annual growth rings, and in some cases, certain stems slow their radial growth to an insignificant rate for hundreds of years [27,62]. Radiocarbon dating is the sole solution for ascertaining the age and growth rates of baobab stems [27,50,63].
The first high temporal and spatial resolution proxy rainfall record based on the African baobabs was produced for the northeast of South Africa [20,64]. This reconstruction provided decadal and centennial rainfall oscillation over the past 1000 years. The records reflected a shift from wet conditions in the Medieval Warm Period (MWP) to dry conditions during the Little Ice Age (LIA). Woodborne et al. [20,64] attributed dry conditions at the Pafuri and Mapungubwe sites to an eastward shift of the TTT system. The proposed mechanism should have concurred with hyper-arid conditions in Botswana. However, a 250-year δ13C rainfall proxy record for the xeric region of southern Botswana indicates wetter conditions induced by positive SST anomalies [44]. This suggests a westward shift of the TTT with elevated SST and emphasises the need for records with improved temporal and spatial resolution. Another rainfall proxy in northern Botswana supports this hypothesis, although the region is also at the limit of ITCZ [65].
The objectives of our study are to reconstruct the past climate of northeastern Botswana by performing stable isotope analysis and radiocarbon dating on African baobab cores extracted from the historic Chapman baobab, which collapsed in 2016. The study will provide a better understanding of the southern African climate through a high-resolution rainfall record that reflects decadal and centennial variability over the past 1000 years. In particular, the reconstruction will be compared with the existing records to verify the westward displacement of the TTT hypothesis in response to SST anomalies.

2. Materials and Methods

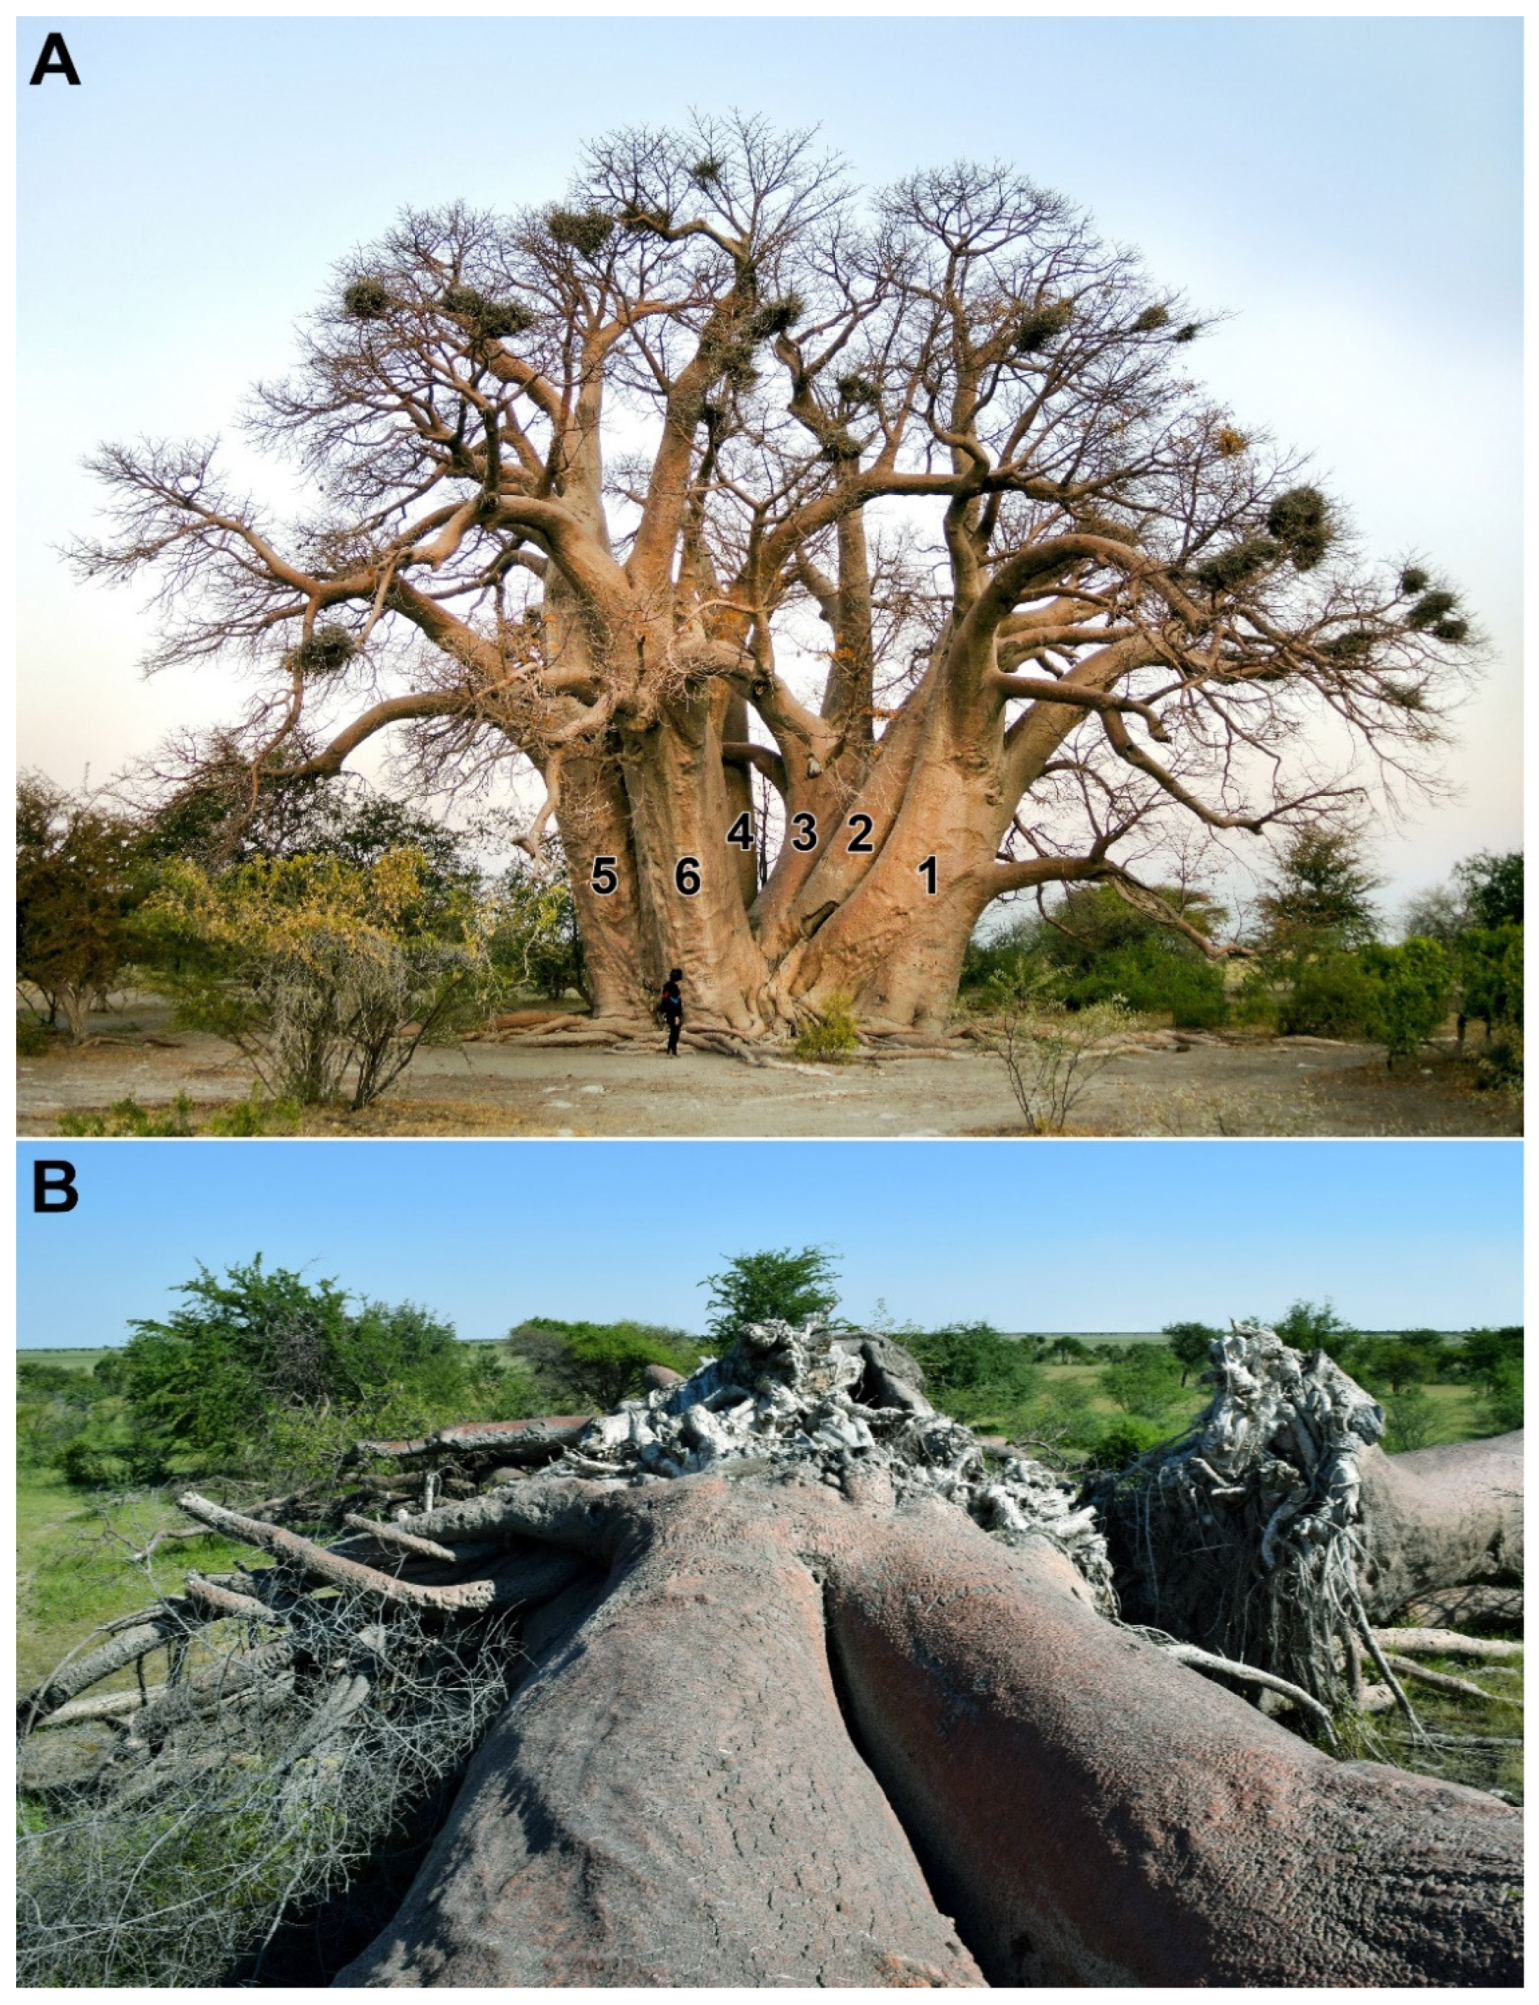
2.1. The Baobab and Its Area

The Chapman baobab was located close to the Ntwetwe Pan of the Makgadikgadi Basin of northeastern Botswana. The GPS coordinates of this location are 20°29.404′ S, 025°14.971′ E, the altitude reaches 905 m, while the mean annual rainfall is around 450 mm [59,63].
This area belongs to the world’s largest salt pan complex comprised of paleolakes [66,67], with a semi-arid climate and an average annual rainfall ranging from 359 mm in Rakops (to the west) to 545 mm in Maitengwe (to the east), along a southwest–northeast (rainfall) gradient [68]. Precipitations are highly variable and occur in the austral summer (October–April) with the highest monthly mean concentrated in January–February. July–August are the driest months and the average evapotranspiration rate exceeds 2000–2500 mm per year [68,69]. Satellite data shows a mean annual temperature of 35.2 °C for the area and a mean temperature during the summer months of 39.7 °C.
The historic Chapman baobab was a national monument of Botswana. It had a maximum height of 22.6 m and measured 25.90 m in circumference at breast height (i.e., at 1.30 m above the ground) (Figure 1A). The monumental baobab had an open ring-shaped structure composed of 6 large stems. The radiocarbon investigation revealed that the stems belonged to three distinct generations that were 1350–1400 (stem 3), 800–1000 (stems 1, 5, 6) and 500–600 (stems 2, 4) years old [59,63]. All stems collapsed (Figure 1B) on 7 January 2016 during a severe drought caused by a considerable delay in the start of the rainy season which began about 5 months later, in mid-February. The 2015–2016 El Niño episode was the strongest in the past 145 years, surpassing the dramatic episodes of 1982–1983 and 1997–1998 that wreaked havoc around the world. The event began in the spring of 2015 and peaked in November 2015–January 2016, ending in May 2016, setting records for the highest global surface temperatures and the highest increase in atmospheric CO2 concentrations [3,70]. Thus, the ensuing devastating droughts that also affected Botswana contributed to the collapse of the Chapman baobab [59,63].
The only water source for the tree was rainfall, and due to the uncommonly large area covered by its network of buttressed roots, up to 65 m long, it is likely that the water table in its location was generally very low.

2.2. Sampling

Two cores from the two oldest stems of the Chapman baobab, namely CH3 (originating from stem 3) and CH6 (originating from stem 6), were collected in 2016 after its demise, by a long Haglöf increment borer (1.50 m length, 1.2 × 10⁻³ m inner diameter), following the methodology of Patrut et al. [49,50,51,52,53,54,55,56,57,58,59]. The length of CH3 was 1.06 m and CH6 measured 1.47 m. The samples were glued onto conventional wooden sample holders and stored until further analysis.

2.3. Radiocarbon Dating: Pretreatment, AMS Measurements and Calibration

For obtaining an age model, small wood segments (10−3 m) were extracted from predetermined positions along each sample to be aged. Eight and eleven segments were selected from CH3 and CH6, respectively. The standard α-cellulose pretreatment was used for removing soluble and organic components [71]. The resulting samples were combusted to CO2 via the closed tube combustion method [72] and further reduced to graphite on iron catalyst, under a hydrogen atmosphere [73]. The resulting graphite samples were analysed by AMS (accelerator mass spectrometer) either at the Woods Hole Oceanographic Institution, Woods Hole, Massachusetts, United States or at the iThemba LABS, Johannesburg, Gauteng, South Africa. The AMS radiocarbon measurements were performed on a Pelletron®Tandem 500 kV AMS system [74,75] at the Woods Hole Oceanographic Institution or on the 6 MV tandem accelerator with a configuration similar to the SUERC 5 MV Pelletron AMS system at iThemba LABS [76].
The obtained fraction modern values wereconverted to a radiocarbon date. Radiocarbon dates and errors were rounded to the nearest year. Radiocarbon dates were calibrated and converted into calendar dates with the OxCal v4.4 program for Windows [77] and the Southern Hemisphere terrestrial dataset SHCal20 [78].

2.4. Stable Isotope Analysis

A series of wood aliquots of approximately 0.5–1 × 10⁻³ m width were separated along the length of each core. The width depended on the morphology and the state of the wood and corresponded as much as possible to a distinct growth ring. For sample CH3, we subsampled 810 aliquots while for CH6 we obtained 1426 aliquots indicating sub- and supra-annual ring formation, respectively.
The aliquots underwent a Soxhlet extraction using a toluene/ethanol solution and then were subject to hemicellulose and α-cellulose reduction using acidified sodium chlorite and sodium hydroxide, respectively [71,79].
Subsamples of each aliquot (0.05–0.06 × 10⁻⁶ kg) were placed in tin cups for the isotopic analysis. The δ13C measurements were performed for all 2236 aliquot subsamples at the University of Pretoria, South Africa, using a Thermoquest EA 1110 elemental analyser coupled with a Delta V Plus isotope ratio mass spectrometer with a ConFlo III interface. Laboratory standard samples (Shorea superba) and blanks were run at the start and end of each analysis and after every 12 unknowns [20,42,43,64]. The precision on laboratory standards is <0.15‰.

2.5. Age Model of the Chapman Baobab

In the absence of clear annual rings, an age model for the δ13C time series was constructed from the radiocarbon analyses. We make the assumption that two baobab stems from the same tree experienced the same environmental variation through time and should therefore have matching δ13C time series. The match between the two δ13C time series is therefore used as a constraint in the formulation of the age model. Unfortunately, the available Bayesian age/depth models that use the known age relationship between samples (whether one radiocarbon sample is older or younger than another is known a priori) are not able to accommodate the match between δ13C time series as a priori constraints. Instead, we use a series of linear age relationships between aliquot number and date (that is, assuming a linear relationship between radial growth and age) that meets the constraint that the model for each individual stem should intercept the radiocarbon ages within the 2-sigma error range and that excursions in the δ13C time series between stems should match (Figure S1). Assuming that the radial growth rate is constant over extended periods of time is obviously flawed, as the trees likely grow faster under favourable conditions and slower under unfavourable conditions, and this means that the age model only approximates the average growth over time. This error is constrained by the 2-sigma match of the age model with the radiocarbon dates, but the age model will have an inherent under- and over-approximation of the growth rate that introduces errors in the age assignment for individual aliquots in the δ13C time series. For this reason, we follow the method used by [20,64,65] and apply a 21-year biweight mean (a mean δ13C value that is weighted by the δ13C values from both stems for the 10 years prior to, and after, the aliquot in question) [80] The biweight mean also has an associated variance calculation, but this is substantially smaller than the errors in the radiocarbon dates, and while we consider it, it is not presented in the result.
This approach allows a date to be assigned to each aliquot in the δ13C time series, but it is necessary to caution against a literal interpretation of the dates. The error range in radiocarbon dating limits precision to approximately 30 years and this must be combined with the failure of the age model to approximate minor growth rate variations. The errors are less problematic with longer time series where the variability is assessed at mult-decadal to centennial ranges, but it does have a strong effect on correlating the younger part of the record with instrumental data. Even though there is an acknowledged weakness in the age model, the date errors on adjacent aliquots will be similar, and the resulting time series of water stress in the trees still provides a strong indication of the frequency and duration of protracted droughts and wet periods.
When the age model has been applied to the δ13C time series, it is necessary to make a correction for the temporal changes in the atmospheric δ13C variation through time. We used the Southern Hemisphere record of atmospheric δ13C variability [81] with online updates of the dataset (http://cdiac.ornl.gov/ftp/db1014/isotope.cgo, accessed on 25 May 2023). Changes in the intrinsic water use efficiency (iWUE) of trees have occurred in response to elevated CO2 concentrations post the industrial age [82], but Woodborne et al. [20] proved that the overall effect of such iWUE changes have a relatively small effect on the isotope proxy record, and are irrelevant in the calculation.

3. Results and Discussion

The radiocarbon dating results, namely the radiocarbon ages, the corresponding calibrated values and the assigned years for the dated segments are presented in Table 1. The age assigned to the dated segment intersects the 2σ (95.4%) probability distribution shown in the table; in some exceptional cases, it has a (negligible) error of a few years.
The data from Table 1 show that the sample originating from stem 3 grew 1.05 m in about 900 years, resulting in a growth rate of ca. 0.11 cm per year, while CH6 grew 1.38 m in about 850 years, indicating a growth rate of 0.16 cm per year. Note that the cores did not reach the centre of each stem, so the true age of recruitment is higher.

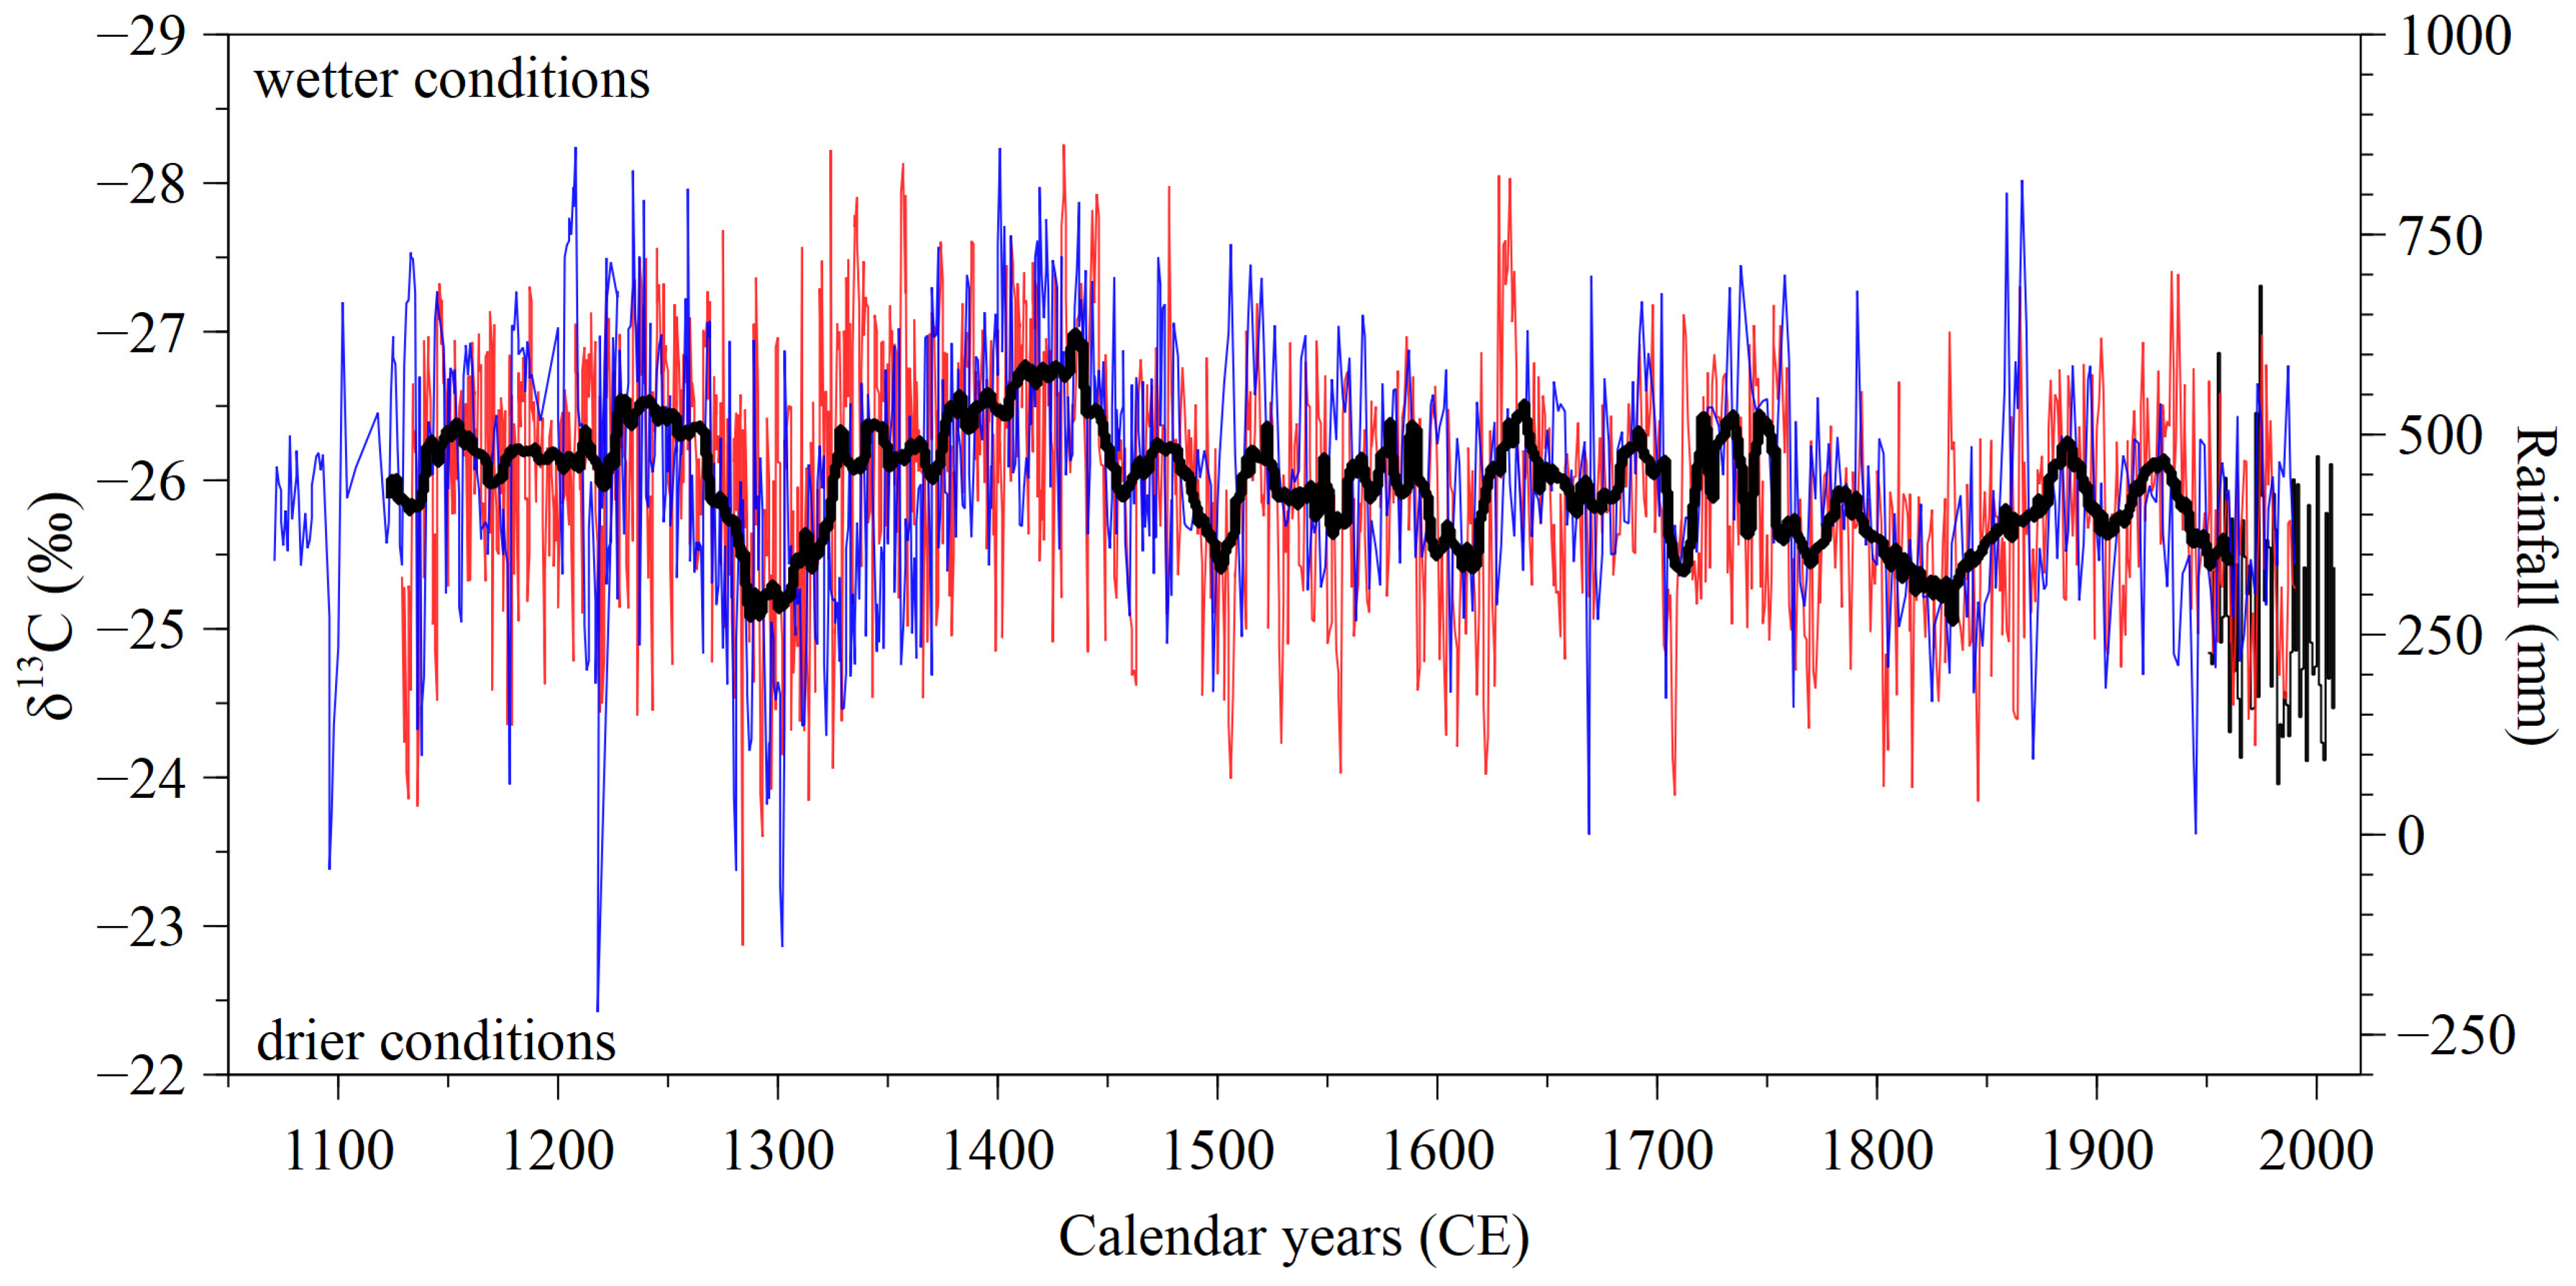
3.1. Proxy Rainfall Record
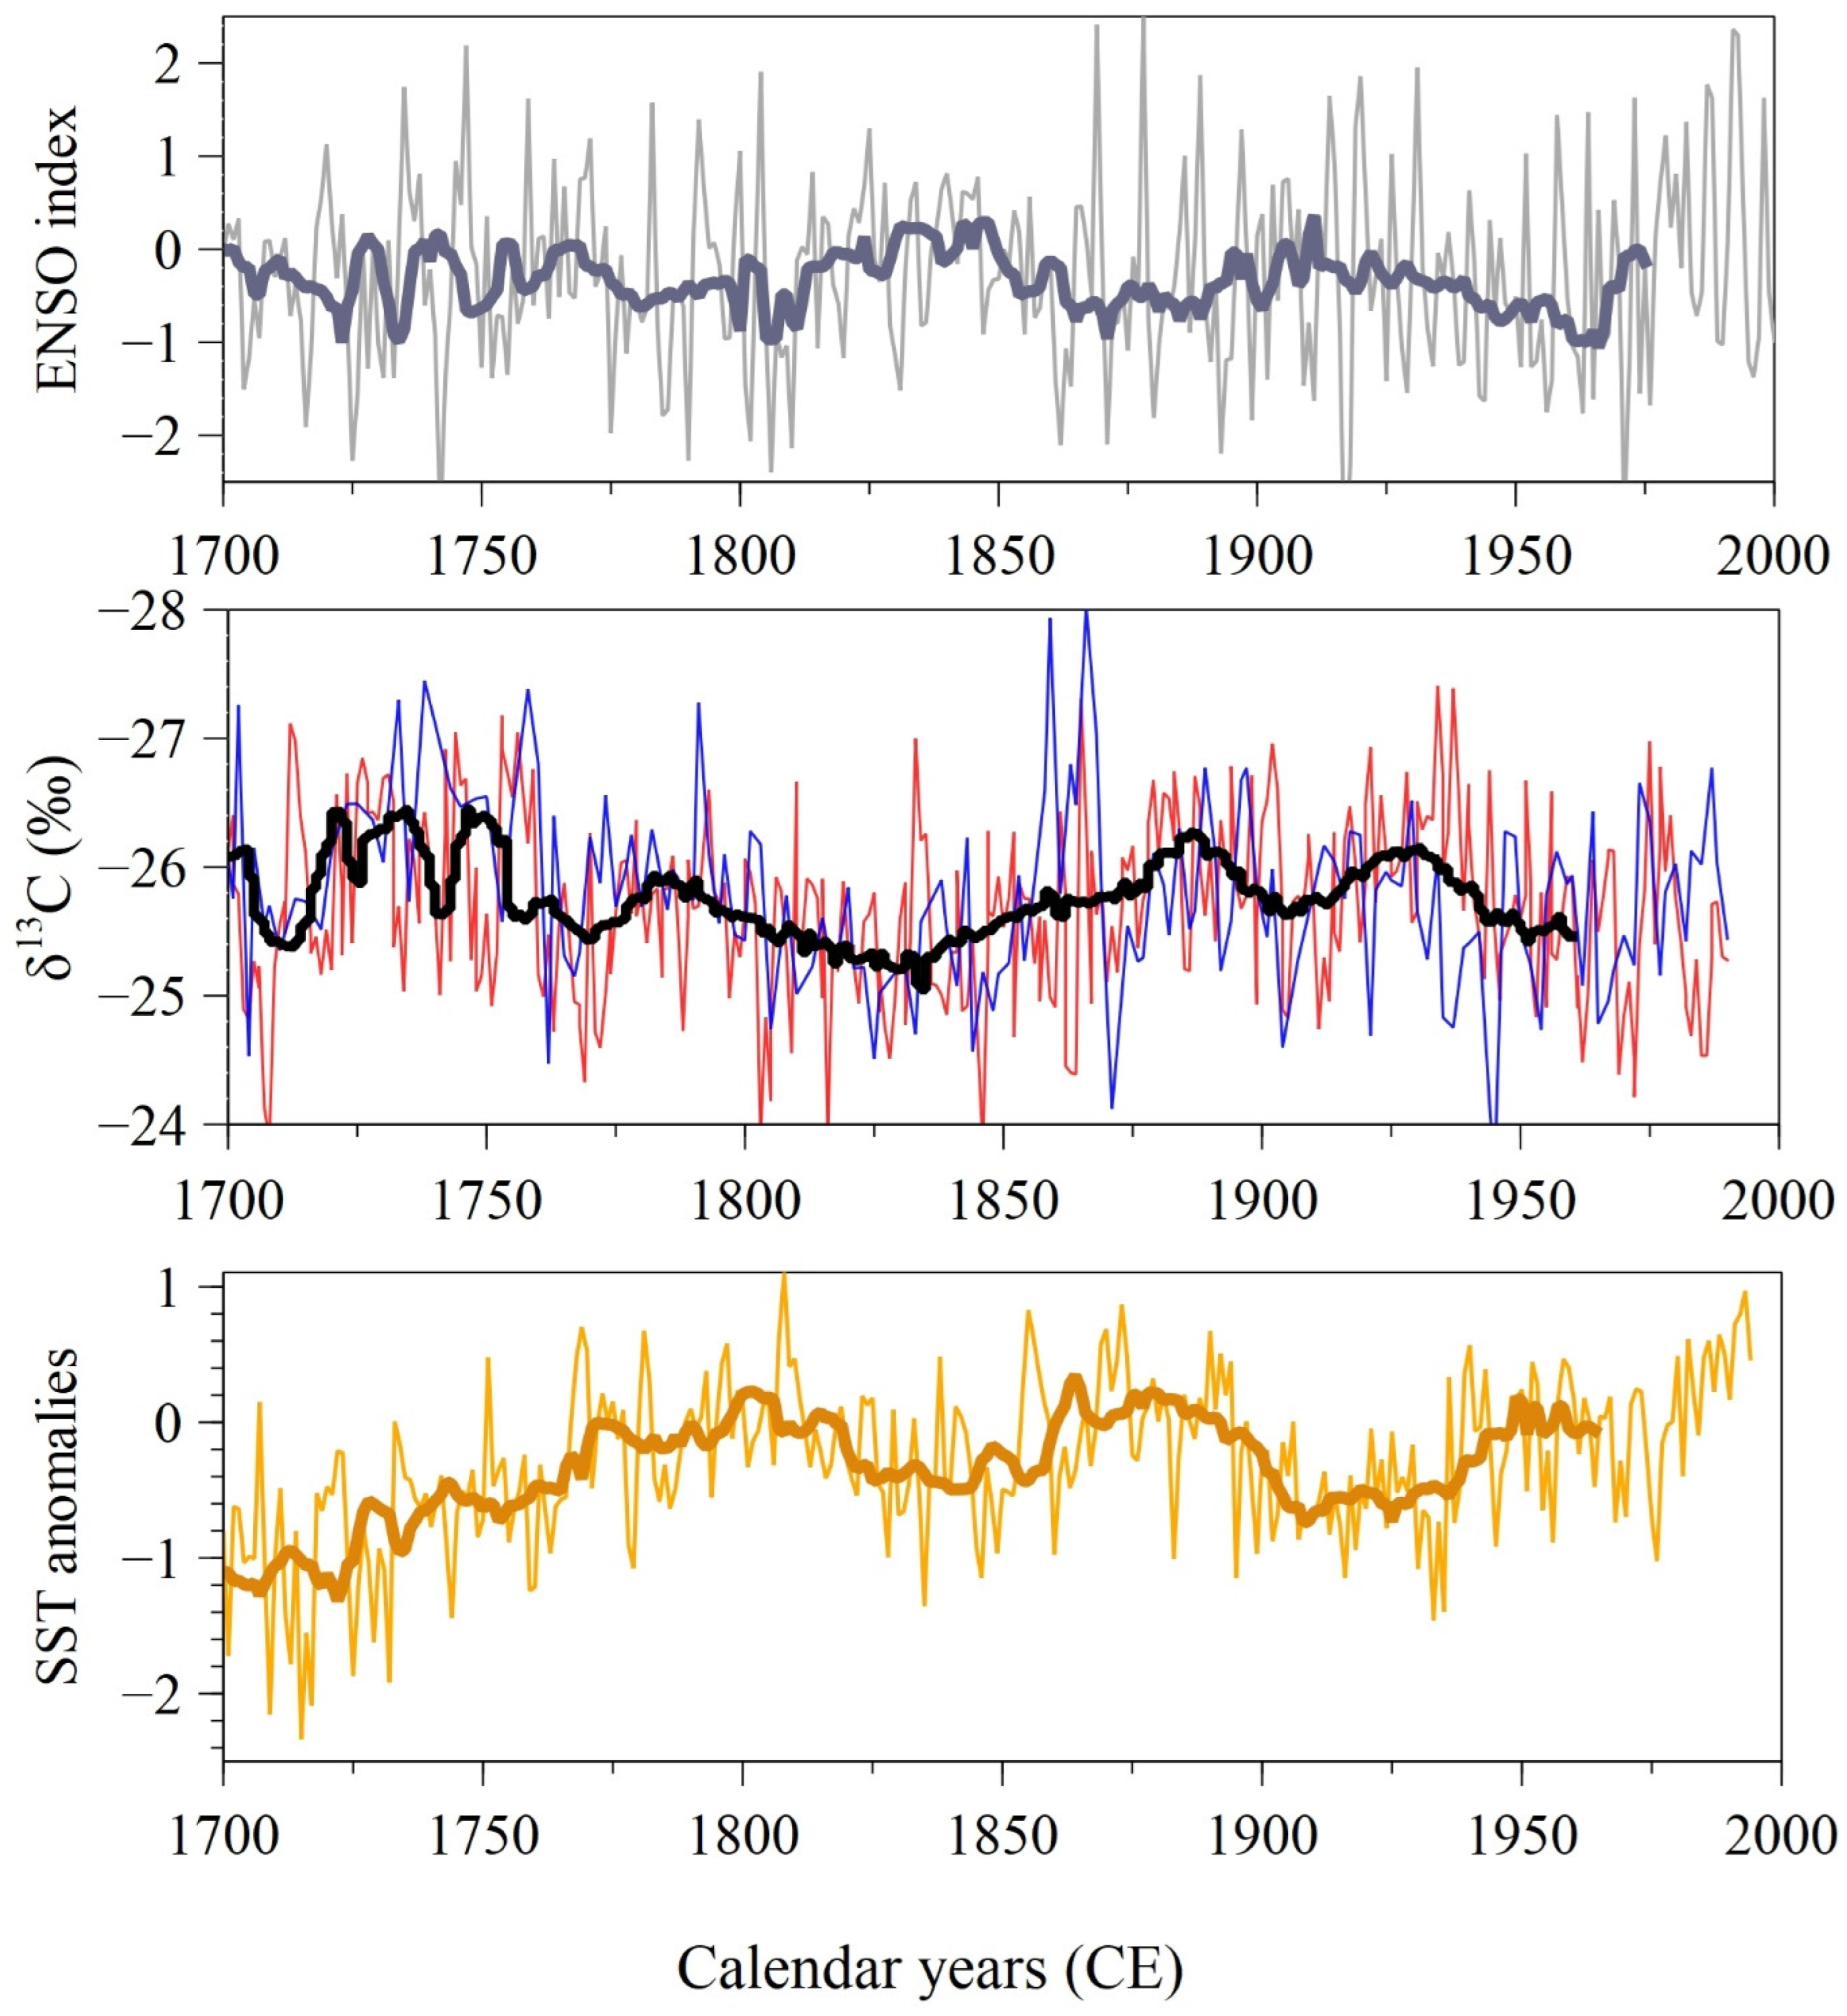
The Climate Explorer program (accessible online: climexp.knmi.nl) was used for correlating the Chapman archive (Figure 2) with the rainfall reconstruction for the western part of Zimbabwe covering the last 200 years [32], the reconstructed seven-century-long ENSO index in the Niño 3.4 region [83], SST values since 1660 in the Agulhas Current core region [84] and the combined baobab record for the Limpopo province after Woodborne et al. [20], which spans over the last millennium. A 21-point biweight mean was calculated for all records. Baobab trees (Adansonia spp.) were used as rainfall proxy before by Woodborne et al. [20,64,65], Slotta et al. [40,85] and Razanatsoa [46], who obtained rainfall reconstructions for southwestern Madagascar spanning 775 years for Adansonia grandidieri and 765 years for A. za.
The closest instrumental rainfall record dates since the 1950s and was measured for Maun [86], a town located about 210 km west of the Chapman baobab. The baobab archive in Figure 2 was calibrated with this dataset. However, due to the short period registered for Maun, a correlation with the isotopic time series is not feasible.
However, the rainfall reconstruction of Therrell et al. [33] from western Zimbabwe based on samples of Pterocarpus angolensis covers 200 years. The moderately positive correlation with the Chapman series (r = 0.448, p < 0.05) shows that precipitation events in Zimbabwe correspond to somewhat drier conditions in Botswana. This relationship was stronger and more significant before 1900 (r = 0.63, p < 0.01), supporting a displacement of the TTT from the east coast inland. After 1900, the association between rainfall events in Zimbabwe and the Chapman area became weak and non-significant (r = 0.163, p > 0.05).
Solar activity, which shows a well-defined periodicity of grand minima/maxima cycles of 350–400 years played a role in shaping past climate variations before the Industrial Revolution [85,86]. Thus, events that marked the past climate of the last millennium are the Dalton Minimum (ca. 1797–1825), the Maunder Minimum (ca. 1645–1715; a period of extremely low solar activity), Spörer Minimum (ca. 1460–1550), Wolf Minimum (ca. 1282–1342) and the Medieval Maximum (ca. 1100–1250) [87,88,89].
The Chapman archive captures periods of low precipitation levels throughout the centuries, which overlap with some of the above-mentioned minima. The Medieval Warm Period (MWP; 900–1300), which was marked by an overall warmer yet highly variable climate between 900–1300 [90], included the Oort Minimum and the Medieval Maximum. The period of the Chapman record covering this Maximum is characterised by a high rainfall amount with a peak registered between 1228–1267, after which rainfall abruptly decreases into the second longest driest period of our archive between 1288 and 1306. This dry spell spanning over decades coincides with the Wolf Minimum (ca. 1282–1342) as wetter conditions are indicated only after 1330. Afterward, the Chapman area received the highest quantity of rainfall in the last millennium, with the wettest condition registered during 1379–1446. This time frame is also the wettest evinced in the baobab record of the Lynianti region of Botswana [65].
Following 1446, rainfall gradually reduced before hitting another low between 1487 and 1515. Reduced precipitation levels occur around the year 1500, halfway through the Spörer Minimum. A relatively stable period ensues, defined by a low amplitude for almost a century between 1515 and 1594, alternating between wet episodes peaking in 1523, 1579 and 1590 and drier years in 1554–1559. After 1596, rainfall dropped abruptly, showing a protracted drought until 1620, after which it steadily increased for about two decades. After 1640, at the onset of the Maunder Minimum (ca. 1645–1715), precipitation levels decreased somewhat and stabilised until 1700 CE, followed by an abrupt reduction that culminated with the third driest period of our record between 1707 and 1716. Afterward, the area experienced an overall rainfall increase for the next 4 decades, and then the longest protracted drought gradually developed, spanning from 1756 to 1878. Over this period, the lowest precipitation level of the Chapman archive was evinced around 1835 CE. This period, which also marks the end of the Little Ice Age (LIA), partly overlaps with the Dalton Minimum (ca. 1797–1825). Post 1878, rainfall increased for about a decade then decreased until 1906 followed by another increase peaking in 1931 and gradually decreasing towards 1960.
The aridification trend for northeastern Botswana is more pronounced after the 1750s. This concurs with several studies that indicate a continuous decrease in rainfall after 1900 [7,17,86]. This effect replicated in the Chapman record, which highlights a particularly dry spell after 1945, can be compared with the vast temporal scale of the archive to evince that the rainfall decrease is not as drastic as believed compared to the droughts registered for the last millennium. Our archive shows there were 5 drier periods during the last millennium, namely between 1814 and 1845 (overlapping with the Dalton Minimum), 1284–1311 (overlapping with the Wolf Minimum), 1710–1714 (overlapping with the Maunder Minimum), 1612–1619 and in 1502 (during the Spörer Minimum), with the years 1814–1845 representing the least rainfall and 1502 the fifth least compared to modern-day levels. Our results corroborate well with the paleoclimate reconstruction for the last 250 years for southern Botswana based on δ13C and δ18O records of Vachellia erioloba wood samples [44].
The temperature of the last millennium in southern Africa was characterised by positive anomalies during MWP, after which a variable, unstable and mostly cold climate prevailed during 1300–1850, corresponding to the LIA [90,91]. The temperatures for southern Africa over the last millennium were about 3 °C higher during MWP or about −1 °C lower during LIA, compared to the present day [91]. The very cold periods reported by Tyson and Lindsey [90] around 1600 and 1700 CE are replicated in the Chapman archive as years with lower rainfall. Tyson et al. [91] established that LIA had two mainly dry periods in 1300–1500 and 1675–1800 CE, alternating with a warmer period in 1500–1675 CE. Although a long dry period is evinced by the isotopic excursions between 1288 and 1306 CE, the wettest conditions were registered in the time frame 1379–1446.
The Chapman record underscores that wetter than current-day conditions have prevailed in northeastern Botswana over the last millennium and the area receives a declining amount of precipitation, especially since 1750, as the rainfall variability decreases after this point, which also coincides with the onset of the industrial revolution.
Clear spikes shown in time series such as wet/dry periods that cannot be linked to solar activity provide discrimination between the influence of the sun and other parameters [88] that shape the climate of Botswana, such as the sea (paleo)temperatures (ENSO/SST). The δ13C Chapman record consists of evident decadal and centennial oscillations. Thus, to understand the climate forcing of decadal variability, correlations with the El Niño–Southern Oscillation (ENSO) phenomenon and the sea-surface temperatures (SST) in the Agulhas Current core region were performed (Figure 3). SST influences the movement of the tropical temperate troughs (TTTs), which are the main rainfall drivers for southern Africa.

3.2. ENSO Influence

For ENSO correlations, the dataset of Li et al. [83] was used, which is a record of the sea-surface temperature for the Niño 3.4 region over the last 700 years. The results presented in Table 2 show a moderately positive significant relation of the Chapman series with ENSO from before the 19th century (r = 0.540, p < 0.001). This positive association reversed after 1900 CE, becoming less significant and moderately negative (r = −0.454, p = 0.06). The correlation of the Chapman record with ENSO for 700 years showed no relationship overall (r ≈ 0) that is non-significant. Although ENSO plays an important role in the rainfall of southern Africa, the influence is complex, erratic and non-stationary [92]. In recent times, intense El Niño events have been associated with extreme drought, but Woodborne et al. [64] showed that the transition from a positive to a negative correlation with rainfall is a recent occurrence, dating from around 1950 CE for Limpopo province of South Africa. According to the Chapman record, this reversal started earlier for northeastern Botswana, namely after 1900 CE. Before 1900 CE, La Niña episodes corresponded to droughts, while El Niño events were associated with increased rainfall. It is possible that the Pacific Decadal Oscillation plays a role in the distribution of dry–wet changes associated with ENSO, but the combination is not yet clearly understood [93]. The influence and intensity of ENSO are also modulated by the sea-surface temperature of the Indian Ocean and the propagation of the effects can be delayed by up to a year. The overall weak correlation results of the Chapmanarchive with ENSO support its irregular character. ENSO effects and influences can be enhanced or diminished by several different proximal or distal factors that remain to be fully elucidated [94].

3.3. SST Influence

For analysing the influence of the SST in the Agulhas core region, the paleoclimate coral reconstruction for the Mozambique Channel, Ifaty area of the last 400 years was used [84]. The results show a moderately negative correlation of the SST with the Chapman record (r = −0.560, p = 0.07) before 1900, which is not very significant. As in the case of ENSO, the SST influence reversed after 1900, demonstrating a shift in the climate regime (r = −0.0667, p < 0.05). Thus, the positive temperature anomalies of the Mozambique Channel were responsible for a western displacement of TTT, which led to increased rainfall for Botswana until 1900. This result contradicts the findings of Richard et al. [95] and Mulenga et al. [96], which proposed an eastern movement of TTT caused by positive SST anomalies. However, this mechanism becomes apparent in the isotopic time series after 1900 CE. The proposed eastern displacement of TTT was erroneously extrapolated to the pre-1900 period based on short instrumental records available for the last century [94]. The Chapman record is one of the few paleoclimate reconstructions for southern Africa spanning over the last millennium and the westward TTT movement evinced is in good accord with the study of Woodborne et al. [44], for the last 250 years in the Mabuasehube area of southern Botswana.

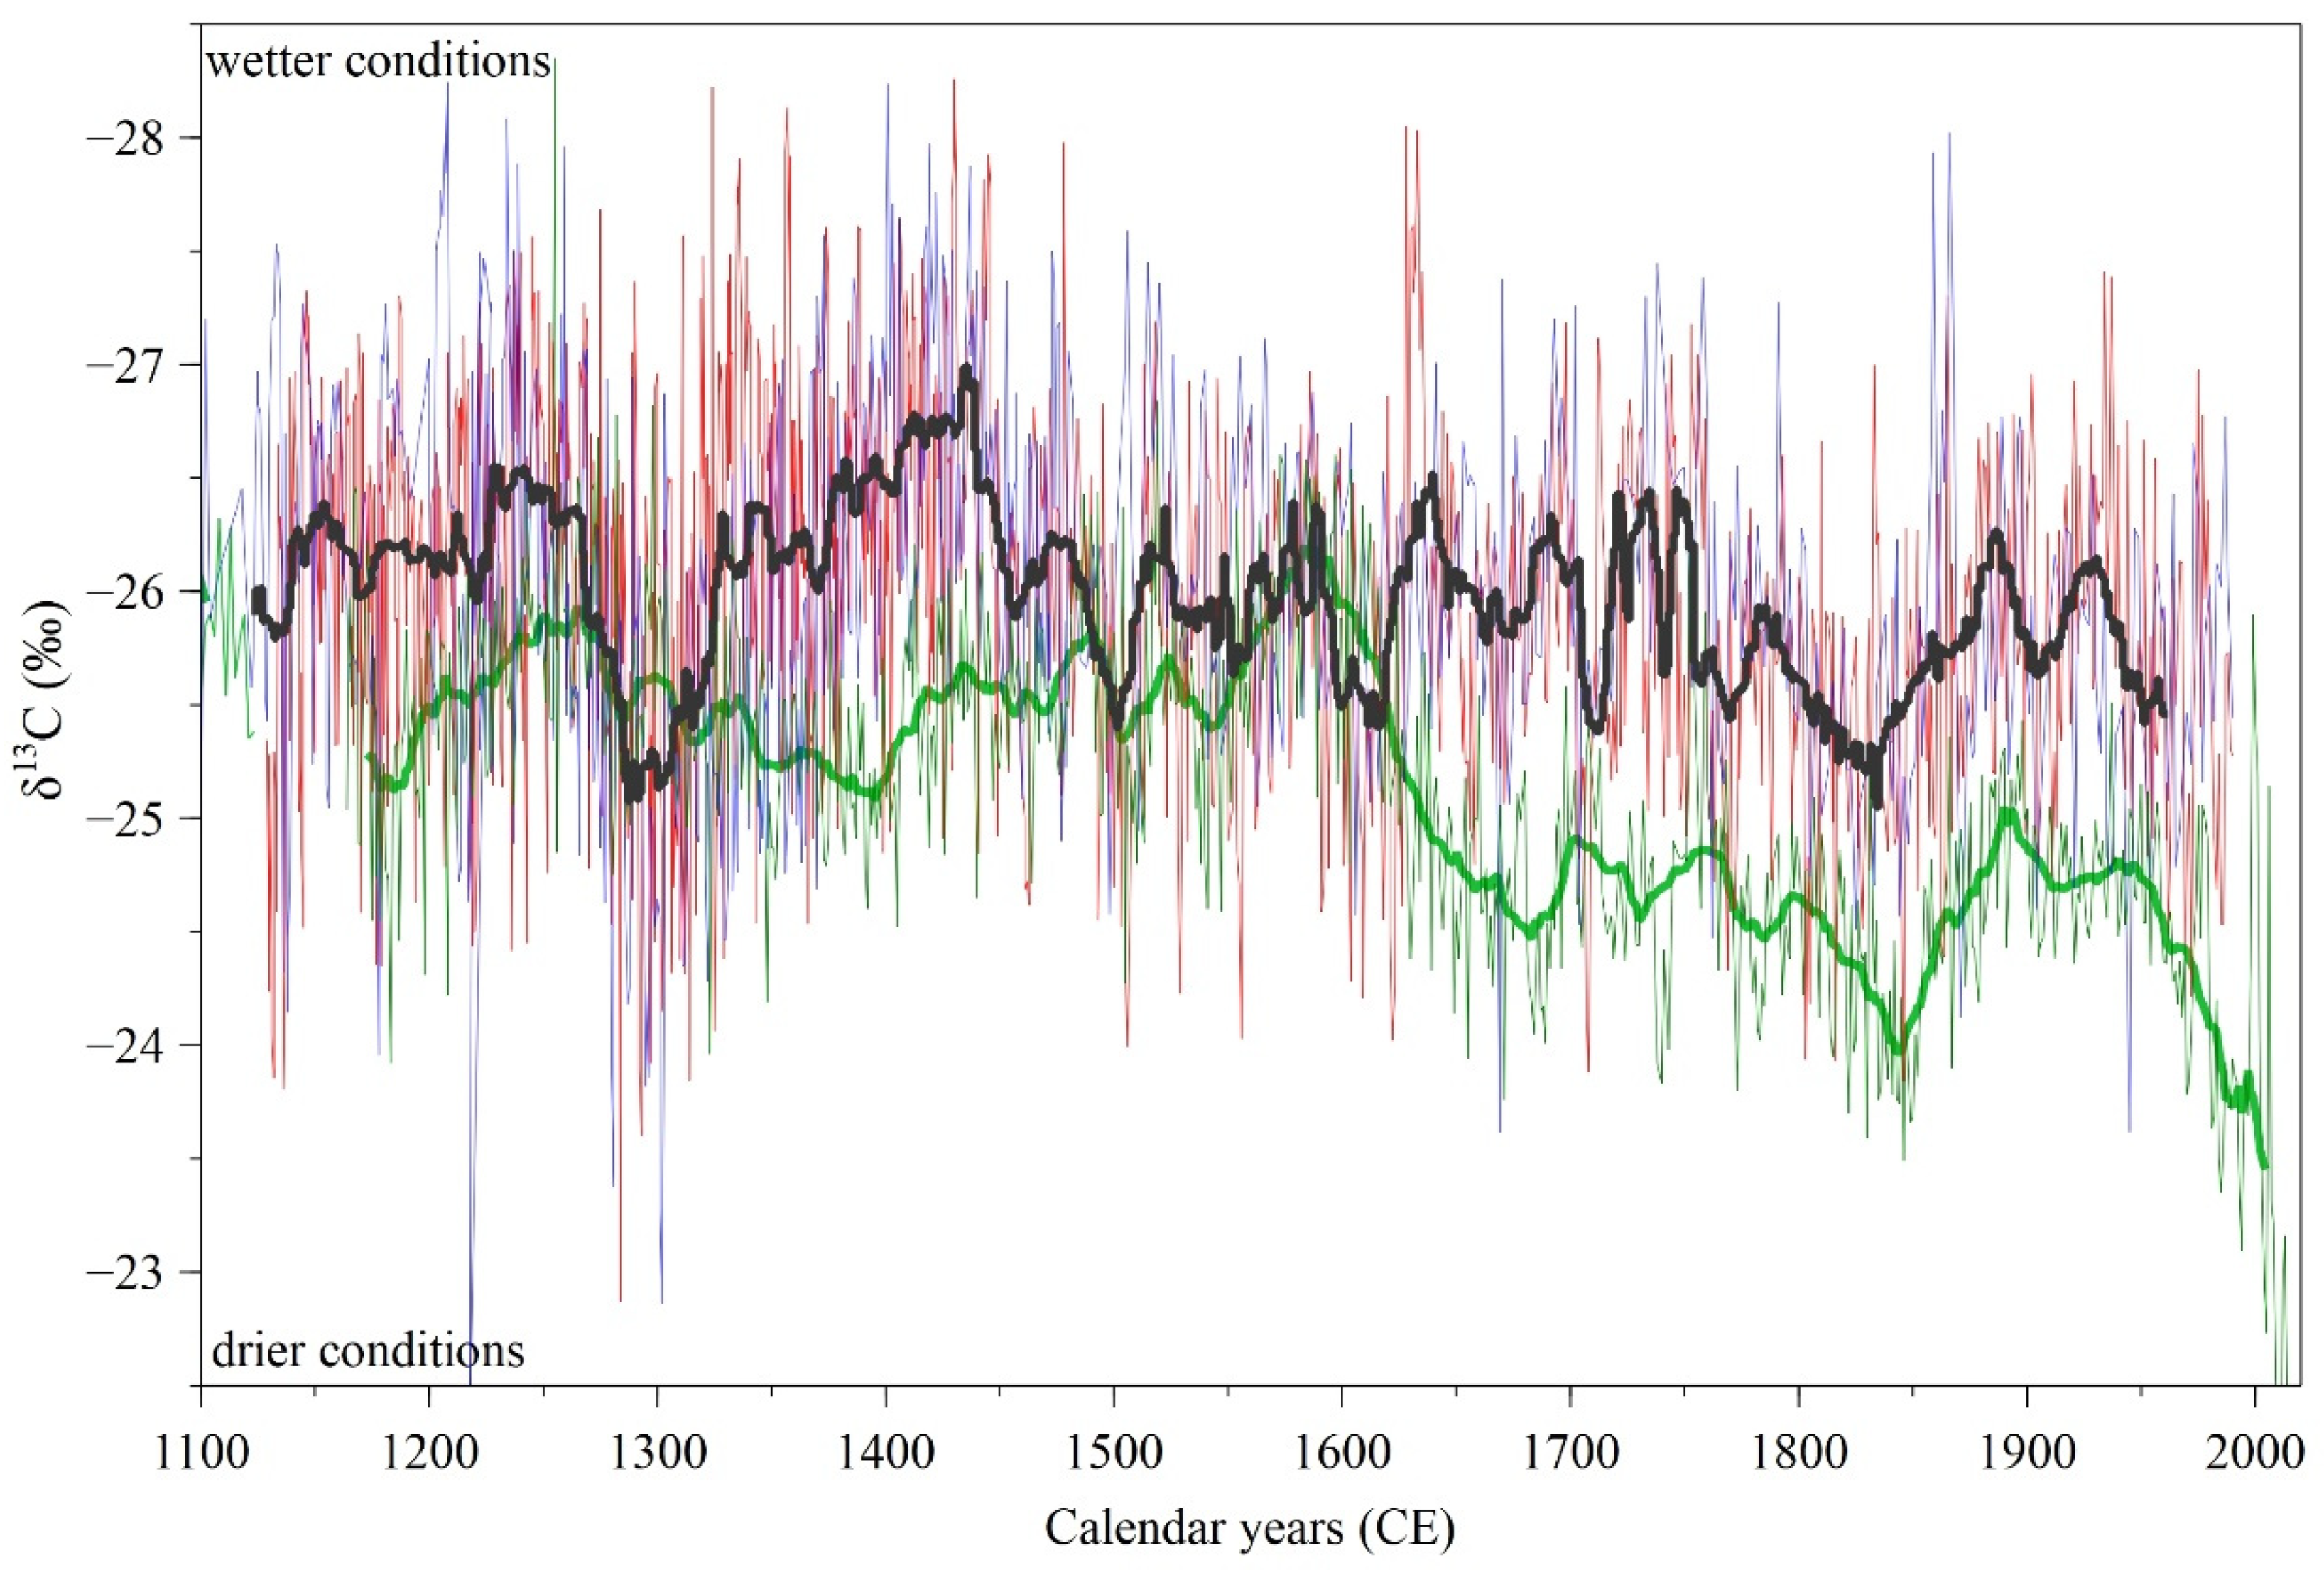
3.4. Comparison with the Paleoclimate Reconstruction of the Limpopo Region, South Africa

The comparison between the Chapman dataset and the combined rainfall proxy on African baobabs from the Limpopo province (Pafuri and Mapungubwe areas, South Africa) after Woodborne et al. [20] demonstrate that in northeast South Africa, conditions became increasingly arid. The correlation shows a clear negative association from 1600 up to 1750 CE (r = −0.544, p < 0.05) in rainfall occurrence between northeastern Botswana and the Limpopo province, which also supports a westward TTT displacement that ensured wetter conditions for Botswana. After 1750 CE, the correlation becomes strongly positive (r = 0.662, p < 0.01), indicating that wet episodes in the northeast of South Africa correspond to wetter conditions in northeastern Botswana and also in Zimbabwe. The influence of ENSO and SST shifted post 1900 CE in the Chapman area, and the relationship with the Limpopo record becomes weak and non-significant (r = 0.169, p > 0.05). Figure 4 illustrates that the rainfall for the Limpopo area steeply decreased post 1600 and is much lower in the present day than in the conditions of the last millennium.

3.5. Aridity Trend

The instrumental records for northeastern Botswana show a clear aridity trend. Our data confirms this tendency. Recent rainfall levels have occurred in the past around the years 1320, 1500, 1620, 1700, 1760, 1800 and 1850. Lower levels of precipitation than the modern day were registered between 1800–1850 (which overlaps with the Dalton Minimum) and 1285–1320 (which overlaps with the Wolf Minimum).

4. Conclusions

High-resolution climate archives for southern Africa are scarce yet essential for designing and validating climate projections, as well as for providing a deeper understanding of the climate. Samples from the Chapman baobab were used as a proxy to reconstruct the precipitation over the last millennium in the salt pans of northeastern Botswana by radiocarbon dating and stable isotope analysis. The results provide valuable insight into decadal and centennial rainfall variability. The isotopic time series captures the Medieval Maximum of the MWP, which was characterised by relatively stable wetter conditions than current-day. The following LIA was marked by increased rainfall variability and drought frequency, proving that both wetter and drier conditions than in the present existed in the past. However, the Chapman archive discloses that northeastern Botswana received overall a higher rainfall amount than today throughout the last millennium, confirming the recent aridity trend. The rainfall received in this region of Botswana over the last century represents its sixth driest period of the past millennium.
The data shows that the current eastward movement of TTTs during positive SST anomalies in the Mozambique Channel is a modern occurrence, as positive SST anomalies prior to 1900 CE corresponded to a westward displacement of TTTs. Such episodes led to increased rainfall in Botswana while drier conditions prevailed in northeast South Africa. The relationship inversion of the SST influence on the rainfall regime of Botswana coincides with a similar change with ENSO. Although the complex implications of ENSO on southern African climate are not fully elucidated, it is likely that El Niño events brought rain to the central parts of southern Africa before 1900.

Supplementary Materials

The following supporting information can be downloaded at: https://www.mdpi.com/article/10.3390/f14091917/s1, Figure S1: Age-depth model.

Author Contributions

Conceptualization, R.T.P., A.P. and S.W.; methodology, A.P., S.W., G.H. and I.R.; validation, A.P., G.H., I.R. and S.W.; formal analysis, A.P. and L.R.; investigation, R.T.P., A.P., G.H., C.W.W., L.R. and S.W.; resources, A.P., C.W.W. and S.W.; writing—original draft preparation, R.T.P. and S.W.; writing—review and editing, A.P., I.A.R., V.B.-B. and L.R.; visualization, R.T.P. and S.W.; supervision, A.P., G.H., L.R. and S.W.; project administration, R.T.P., A.P., G.H. and S.W.; funding acquisition, A.P., I.A.R., V.B.-B. and S.W. All authors have read and agreed to the published version of the manuscript.

Funding

This research was funded by the Romanian Ministry of Research CNCS-UEFISCDI under grant PN-III-P4-ID-PCE-201620-2567, No. 145/2021.

Conflicts of Interest

The authors declare no conflict of interest.

References

  1. Spinoni, J.; Vogt, J.; Naumann, G.; Carrao, H.; Barbosa, P. Towards identifying areas at climatological risk of desertification using the Köppen-Geiger classification and FAO aridity index. Int. J. Climatol. 2015, 35, 2210–2222. [Google Scholar] [CrossRef]
  2. Engelbrecht, F.; Adegoke, J.; Bopape, M.-J.; Naidoo, M.; Garland, R.; Thatcher, M.; McGregor, J.; Katzfey, J.; Werner, M.; Ichoku, C.; et al. Projections of rapidly rising surface temperatures over Africa under low mitigation. Environ. Res. Lett. 2015, 10, 085004. [Google Scholar] [CrossRef]
  3. IPCC (Intergovernmental Panel on Climate Change). Climate Change 2022: Impacts, Adaptation, and Vulnerability. In Contribution of Working Group II to the Sixth Assessment Report of the Intergovernmental Panel on Climate Change; Pörtner, H.-O., Roberts, D.C., Tignor, M., Poloczanska, E.S., Mintenbeck, K., Alegría, A., Craig, M., Langsdorf, S., Löschke, S., Möller, V., et al., Eds.; Cambridge University Press: Cambridge, UK; New York, NY, USA, 2022; 3056p. [Google Scholar] [CrossRef]
  4. Jones, J.M.; Gille, S.T.; Goosse, H.; Abram, N.J.; Canziani, P.O.; Charman, D.J.; Clem, K.R.; Crosta, X.; de Lavergne, C.; Eisenman, I.; et al. Assessing recent trends in high-latitude Southern Hemisphere surface climate. Nat. Clim. Chang. 2016, 6, 917–926. [Google Scholar] [CrossRef]
  5. Kenabatho, P.K.; Parida, B.P.; Moalafhi, D.B. The value of large-scale climate variables in climate change assessment: The case of Botswana’s rainfall. Phys. Chem. Earth 2012, 50–52, 64–71. [Google Scholar] [CrossRef]
  6. Gimeno, L.; Drumond, A.; Nieto, R.; Trigo, R.M.; Stohl, A. On the origin of continental precipitation. Geophys. Res. Lett. 2010, 37, L13804. [Google Scholar] [CrossRef]
  7. Kusangaya, S.; Warburton, M.L.; Van Garderen, E.A.; Jewitt, G.P.W. Impacts of climate change on water resources in southern Africa: A review. Phys. Chem. Earth 2013, 67–69, 47–54. [Google Scholar] [CrossRef]
  8. Trouet, V.; Esper, J.; Beeckman, H. Climate/growth relationships of Brachystegia spiciformis from the miombo woodland in south central Africa. Dendrochronologia 2010, 28, 161–171. [Google Scholar] [CrossRef]
  9. Gebrekirstos, A.; Bra, A.; Sass-Klaassen, U.; Mbow, C. Opportunities and applications of dendrochronology in Africa. Curr. Opin. Environ. Sustain. 2014, 6, 48–53. [Google Scholar] [CrossRef]
  10. Mann, M.; Zhang, Z.; Hughes, M.; Bradley, R.; Miller, S.; Rutherford, S.; Ni, F. Proxy-Based Reconstructions of Hemispheric and Global Surface Temperature Variations over the Past Two Millennia. Proc. Natl. Acad. Sci. USA 2008, 105, 13252–13257. [Google Scholar] [CrossRef]
  11. Holmgren, K. The Potential of Speleothems in the Reconstruction of Southern African Paleoclimates—An Example from Lobatse II Cave, Botswana, in Climate Change: The Karst Record by Karst Waters Institute Special Publication 2, Extended Abstracts of a Conference Held at the Department of Geology; University of Bergen: Bergen, Norway, 1996. [Google Scholar]
  12. Gimeno, L.; Stohl, A.; Trigo, R.M.; Dominguez, F.; Yoshimura, K.; Yu, L.; Drumond, A.; Duran-Quesada, A.M.; Nieto, R. Oceanic and terrestrial sources of continental precipitation. Rev. Geophys. 2012, 50. [Google Scholar] [CrossRef]
  13. Rockström, J.; Karlberg, L.; Wani, S.P.; Barron, J.; Hatibu, N.; Oweis, T.; Bruggeman, A.; Farahani, J.; Qiang, Z. Managing water in rainfed agriculture—The need for a paradigm shift. Agric. Water Manag. 2010, 97, 543–550. [Google Scholar] [CrossRef]
  14. Niang, I.; Ruppel, O.; Abdrabo, M.; Essel, A.; Lennard, C.; Padgham, J.; Urquhart, P. Africa. In Climate Change 2014: Impacts, Adaptation and Vulnerability. Contribution of Working Group II to the Fifth Assessment Report of the Intergovernmental Panel on Climate Change; Cambridge University Press: Cambridge, UK, 2014. [Google Scholar]
  15. Hoegh-Guldberg, O.; Masson-Delmotte, V.; Zhai, P.; Pörtner, H.-O.; Roberts, D.; Skea, J.; Shukla, P.R.; Pirani, A.; Moufouma-Okia, W.; Péan, C.; et al. (Eds.) Impacts of 1.5 °C Global Warming On Natural and Human Systems. Global Warming of 1.5 °C. An IPCC Special Report on the Impacts of Global Warming of 1.5 °C above Pre-Industrial Levels and Related Global Greenhouse Gas Emission Pathways, in the Context of Strengthening the Global Response to the Threat of Climate Change, Sustainable Development, and Efforts to Eradicate Poverty. 2018; in press. [Google Scholar]
  16. Wingqvist, G.Ö.; Dahlberg, E. Botswana Environmental and Climate Change Analysis. Sida Helpdesk for Environmental Economics. University of Gothenburg. 2008. Available online: https://sidaenvironmenthelpdesk.se/digitalAssets/1683/1683296_environmental-and-climate-change-policy-brief-botswana-2008.pdf (accessed on 25 May 2023).
  17. Kane, R.P. Periodicities, ENSO Effects and Trends of Some South African Rainfall Series: An Update. South Afr. J. Sci. 2009, 105, 199–207. [Google Scholar] [CrossRef]
  18. Kulongoski, J.T.; Hilton, D.R.; Selaolo, E.T. Climate variability in the Botswana Kalahari from the late Pleistocene to the present day. Geophys. Res. Lett. 2004, 31, L10204. [Google Scholar] [CrossRef]
  19. Macron, C.; Pohl, B.; Richard, Y.; Bessafi, M. How do tropical temperate troughs form and develop over South Africa? J. Clim. 2014, 27, 1633–1647. [Google Scholar] [CrossRef]
  20. Woodborne, S.; Gandiwa, P.; Hall, G.; Patrut, A.; Finch, J. A Regional Stable Carbon Isotope Dendro-Climatology from the South African Summer Rainfall Area. PLoS ONE 2016, 11, e0159361. [Google Scholar] [CrossRef]
  21. Funk, C.; Davenport, F.; Harrison, T.M.; Galu, L.G.; Pomposi, C.; Macharia, D.; Husak, G.J.; Faka, D. Anthropogenic enhancement of moderate-to-strong El Niño events likely contributed to drought and poor harvests in Southern Africa during 2016. Bull. Am. Meteorol. Soc. 2018, 99, S91–S96. [Google Scholar] [CrossRef]
  22. Funk, C.; Harrison, L.; Shukla, S.; Pomposi, C.; Galu, G.; Korecha, D.; Husak, G.; Magadzire, T.; Davenport, F.; Hillbruner, C.; et al. Examining the role of unusually warm indo-pacific sea-surface temperatures in recent African droughts. Q. J. R. Meteorol. Soc. 2018, 144, 360–383. [Google Scholar] [CrossRef]
  23. Hoell, A.; Funk, C.; Magadzire, T.; Zinke, J.; Husak, G. El Niño–Southern Oscillation diversity and Southern Africa teleconnections during austral summer. Clim. Dyn. 2015, 45, 1583–1599. [Google Scholar] [CrossRef]
  24. Ratnam, J.V.; Behera, S.K.; Masumoto, Y.; Yamagata, T. Remote effects of El Niño and Modoki events on the austral summer precipitation of southern Africa. J. Clim. 2014, 27, 3802–3815. [Google Scholar] [CrossRef]
  25. Fauchereau, N.; Pohl, B.; Reason, C.J.C.; Rouault, M.; Richard, Y. Recurrent daily OLR patterns in the Southern Africa/Southwest Indian Ocean region, implications for South Africa rainfall and teleconnections. Clim. Dyn. 2009, 32, 575–591. [Google Scholar] [CrossRef]
  26. Locosselli, G.M.; Brienen, R.J.; de Leite, M.; Gloor, M.; Krottenthaler, S.; Oliveira, A.A.; Barichivich, J.; Anhuf, D.; Ceccantini, G.; Schöngart, J.; et al. Global Tree-Ring Analysis Reveals Rapid Decrease in Tropical Tree Longevity with Temperature. Proc. Natl. Acad. Sci. USA 2020, 117, 33358–33364. [Google Scholar] [CrossRef] [PubMed]
  27. Détienne, P. Appearance and Periodicity of Growth Rings in some Tropical Woods. IAWA J. 1989, 10, 123–132. [Google Scholar] [CrossRef]
  28. Patrut, A.; Woodborne, S.; von Reden, K.F.; Hall, G.; Patrut, R.T.; Rakosy, L.; Danthu, P.; Leong Pock-Tsy, J.-M.; Lowy, D.A.; Margineanu, D. The growth stop phenomenon of baobabs (Adansonia spp.) indentified by radiocarbon dating. Radiocarbon 2017, 59, 435–448. [Google Scholar] [CrossRef]
  29. Dunwiddie, P.W.; LaMarche, V.C., Jr. A climaticaly responsive tree-ring record from Widdrinngtonia cedarbergensis, Cape Province, South Africa. Nature 1980, 286, 796–797. [Google Scholar] [CrossRef]
  30. Hall, M. Dendroclimatology, rainfall and human adaptation in the later Iron Age of Natal and Zululand. Ann. Natal Mus. 1976, 22, 693–703. [Google Scholar]
  31. Thackeray, J.F. Ring width variation in a specimen of South African Podocarpus, circa 1350–1937 AD. Palaeoecol. Afr. 1996, 24, 233–240. [Google Scholar]
  32. Thackeray, J.F.; Potze, S. A sectioned yellowwood tree trunk housed at the Transvaal Museum, Pretoria. Ann. Transvaal Mus. 2000, 37, 131–137. [Google Scholar]
  33. Therrell, M.D.; Stahle, D.W.; Ries, L.P.; Shugart, H.H. Tree-ring reconstructed rainfall variability in Zimbabwe. Clim. Dyn. 2006, 26, 677–685. [Google Scholar] [CrossRef]
  34. Fichtler, E.; Trouet, V.; Beeckman, H.; Coppin, P.; Worbes, M. Climatic signals in tree rings of Burkea africana and Pterocarpus angolensis from semiarid forests in Namibia. Trees 2004, 18, 442–451. [Google Scholar] [CrossRef]
  35. Remane, I.A.D. Analysis of Annual Growth Patterns of Millettia stuhlmannii, in Mozambique. Master’s Thesis, Southern Illinois University Carbondale, Carbondale, IL, USA, 2013. [Google Scholar]
  36. Gebrekirstos, A.; van Noordwijk, M.; Neufeldt, H.; Mitlöhner, R. Relationships of stable carbon isotopes, plant water potential and growth: An approach to assess water use efficiency and growth strategies of dry land agroforestry species. Trees 2011, 25, 95–102. [Google Scholar] [CrossRef]
  37. Sass-Klaassen, U.; Couralet, C.; Sahle, Y.; Sterck, F.J. Juniper from Ethiopia contains a large-scale precipitation signal. Int. J. Plant Sci. 2008, 169, 1057–1065. [Google Scholar] [CrossRef]
  38. Wils, T.H.G.; Sass-Klaassen, U.G.W.; Eshetu, Z.; Bräuning, A.; Gebrekirstos, A.; Couralet, C.; Robertson, I.; Touchan, R.; Koprowski, M.; Conway, D.; et al. Dendrochronology in the dry tropics: The Ethiopian case. Trees 2011, 25, 345–354. [Google Scholar] [CrossRef]
  39. Schöngart, J.; Orthmann, B.; Hennenberg, K.J.; Porembski, S.; Worbes, M. Climate-growth relationships of tropical tree species in West Africa and their potential for climate reconstruction. Glob. Chang. Biol. 2006, 12, 1139–1150. [Google Scholar] [CrossRef]
  40. Slotta, F.; Helle, G.; Heussner, K.-U.; Shemang, E.; Riedel, F. Baobabs on Kubu island, Botswana—A dendrochronological parameter study using ring width and stable isotopes. Erdkunde 2017, 71, 23–43. [Google Scholar] [CrossRef]
  41. Farquhar, G.D.; O’Leary, M.H.; Berry, J.A. On the relationship between carbon isotope discrimination and the intercellular carbon dioxide concentration in leaves. Aust. J. Plant Physiol. 1982, 9, 121–137. [Google Scholar] [CrossRef]
  42. Hall, G.; Woodborne, S.; Scholes, M. Stable carbon isotope ratios from archaeological charcoal as palaeoenvironmental indicators. Chem. Geol. 2008, 247, 384–400. [Google Scholar] [CrossRef]
  43. Hall, G.; Woodborne, S.; Pienaar, M. Rainfall control of the δ13C ratios of Mimusops caffra from KwaZulu-Natal, South Africa. Holocene 2009, 19, 251–260. [Google Scholar] [CrossRef]
  44. Woodborne, S.; Hall, G.; Jones, C.W.; Loader, N.J.; Patrut, A.; Patrut, R.T.; Robertson, I.; Winkler, S.R.; Winterbach, C.W. A 250-year isotopic proxy rainfall record from southern Botswana. Stud. UBB Chem. 2018, 63, 109–123. [Google Scholar] [CrossRef]
  45. Schoeman, M.H.; Aub, B.; Burrows, J.; Hall, G.; Woodborne, S. Past Climatic Conditions for Bokoni at Buffelskloof, Mpumalanga, Using Δ13C Analysis of Prunus Africana and Pittosporum Viridiflorum Tree Rings. J. Afr. Archaeol. 2019, 17, 150–160. [Google Scholar] [CrossRef]
  46. Razanatsoa, E. Impact of Human Land-Use and Rainfall Variability in Tropical Dry Forests of Southwest Madagascar during the Late Holocene. Ph.D. Thesis, University of Cape Town, Cape Town, South Africa, 2019. [Google Scholar]
  47. Norström, E.; Holmgren, K.; Mörth, C.M. Rainfall-driven variations in d13C composition and wood anatomy of Breonadia salicina trees from South Africa between AD 1375 and 1995. South Afr. J. Sci. 2005, 101, 162–168. [Google Scholar]
  48. Norström, E.; Holmgren, K.; Mörth, C. A 600-year-long δ18O record from cellulose of Breonadia salicina trees, South Africa. Dendrochronologia 2008, 26, 21–33. [Google Scholar] [CrossRef]
  49. Patrut, A.; von Reden, K.F.; Lowy, D.A.; Alberts, A.H.; Pohlman, J.W.; Wittmann, R.; Gerlach, D.; Xu, L.; Mitchell, C.S. Radiocarbon dating of a very large African baobab. Tree Physiol. 2007, 27, 1569–1574. [Google Scholar] [CrossRef] [PubMed]
  50. Patrut, A.; Patrut, R.T.; Rakosy, L.; Ratiu, I.A.; Lowy, D.A.; von Reden, K.F. Age, Growth and Architecture of the Historic Big Tree at Victoria Falls, Zimbabwe assessed by Radiocarbon Dating. Dendrochronologia 2021, 70, 125898. [Google Scholar] [CrossRef]
  51. Patrut, A.; Patrut, R.T.; Rakosy, L.; Ratiu, I.A.; Bodis, J.; Nassor, N.M.; von Reden, K.F. Radiocarbon Investigation of two large Arican Baobabs from Kizimkazi, Zanzibar, Tanzania. Stud. UBB Chem. 2022, LXVII, 143–153. [Google Scholar] [CrossRef]
  52. Patrut, A.; von Reden, K.F.; Danthu, P.; Leong Pock-Tsy, J.-M.; Rakosy, L.; Patrut, R.T.; Lowy, D.A.; Margineanu, D. AMS radiocarbon dating of very large Grandidier’s baobabs (Adansonia grandidieri). Nucl. Instr. Meth. B 2015, 361, 591–598. [Google Scholar] [CrossRef]
  53. Patrut, A.; Patrut, R.T.; Danthu, P.; Leong Pock-Tsy, J.-M.; Rakosy, L.; Lowy, D.A.; von Reden, K.F. AMS radiocarbon dating of large za baobabs (Adansonia za) of Madagascar. PLoS ONE 2016, 11, e0146977. [Google Scholar] [CrossRef]
  54. Patrut, A.; Patrut, R.T.; Leong Pock-Tsy, J.-M.; Danthu, P.; Woodborne, S.; Rakosy, L.; Ratiu, I.A. Investigation of the Architecture and Age of Superlative Adansonia grandidieri from the Andombiry Forest, Madagascar. Forests 2021, 12, 1258. [Google Scholar] [CrossRef]
  55. Patrut, A.; Garg, A.; Woodborne, S.; Patrut, R.T.; Rakosy, L.; Ratiu, I.A.; Lowy, D.A. Radiocarbon dating of two old African baobabs from India. PLoS ONE 2020, 15, e0227352. [Google Scholar] [CrossRef]
  56. Hajdas, I.; Ascough, P.; Garnett, M.H.; Fallon, S.J.; Pearson, C.L.; Quarta, G.; Spalding, K.L.; Yamaguchi, H.; Yoneda, M. Radiocarbon dating. Nat. Rev. Methods Primers 2021, 1, 62. [Google Scholar] [CrossRef]
  57. Garg, A.; Patrut, R.T.; Patrut, A.; Woodbourne, S.; Rakosy, L. Radiocarbon dating and status of the oldest extant Ceylon iron wood (Manilkara hexandra) in the riverine Ramsar site of India. Curr. Sci. 2021, 120, 562–566. [Google Scholar] [CrossRef]
  58. Patrut, R.T.; Garg, A.; Patrut, A.; Woodborne, S.; Rakosy, L.; Ratiu, I.-A. Radiocarbon Analysis of the Indian Banyan (Ficus benghalensis L.) at Narora. Curr. Sci. 2023, 124, 1175–1180. [Google Scholar]
  59. Patrut, A.; Woodborne, S.; Patrut, R.T.; Rakosy, L.; Lowy, D.A.; Hall, G.; von Reden, K.F. The demise of the largest and oldest African baobabs. Nat. Plants 2018, 4, 423–426. [Google Scholar] [CrossRef] [PubMed]
  60. Robertson, I.; Loader, N.J.; Froyd, C.A.; Zambatis, N.; Whyte, I.; Woodborne, S. The potential of the baobab (Adansonia digitata L.) as a proxy climate archive. Appl. Geochem. 2006, 21, 1674–1680. [Google Scholar] [CrossRef]
  61. Fenner, M. Some measurements on the water relations of baobab trees. Biotropia 1980, 12, 205. [Google Scholar] [CrossRef]
  62. Patrut, A.; Woodborne, S.; von Reden, K.F.; Hall, G.; Hofmeyr, M.; Lowy, D.A.; Patrut, R.T. African Baobabs with False Inner Cavities: The Radiocarbon Investigation of the Lebombo Eco Trail Baobab. PLoS ONE 2015, 10, e0117193. [Google Scholar] [CrossRef]
  63. Patrut, A.; Woodborne, S.; Patrut, R.T.; Hall, G.; Rakosy, L.; Winterbach, C.; von Reden, K.F. Age, growth and death of a national icon: The Historic Chapman Baobab of Botswana. Forests 2019, 10, 983. [Google Scholar] [CrossRef]
  64. Woodborne, S.; Hall, G.; Robertson, I.; Patrut, A.; Rouault, M.; Loader, N.J.; Hofmeyr, M. A 1000-Year Carbon Isotope Rainfall Proxy Record from South African Baobab Trees (Adansonia digitata L.). PLoS ONE 2015, 10, e0124202. [Google Scholar] [CrossRef]
  65. Hamilton, T.; Archibald, S.; Woodborne, S. Historic Changes in the Fire-Rainfall Relationship at a Woodland-Savanna Transition Zone in Southern Africa. Afr. J. Range Forage Sci. 2022, 39, 70–81. [Google Scholar] [CrossRef]
  66. Podgorski, J.E.; Green, A.G.; Kgotlhang, L.; Kinzelbach, W.; Kalscheuer, T.; Auen, E.; Ngwisanyi, T. Paleo-megalake and paleo-megafan in southern Africa. Geology 2013, 41, 1155–1158. [Google Scholar] [CrossRef]
  67. Burrough, S.L.; Thomas, D.S.G.; Bailey, R.M. Mega-lake in the Kalahari: A Late Pleistocene record of the Palaeolake Makgadikgadi system. Quat. Sci. Rev. 2009, 28, 1392–1411. [Google Scholar] [CrossRef]
  68. Grey, D.; Cooke, H.J. Some problems in the Quaternary evolution of the landforms of Northern Botswana. Catena 1977, 4, 123–133. [Google Scholar] [CrossRef]
  69. Thomas, A.D.; Dougil, A.J.; Elliott, D.R.; Mairs, H. Seasonal differences in soil CO2 efflux and carbon storage in Ntwetwe Pan, Makgadikgadi Basin, Botswana. Geoderma 2014, 219–220, 72–81. [Google Scholar] [CrossRef]
  70. L’Heureux, M.L.; Takahashi, K.; Watkins, A.B.; Barnston, A.G.; Becker, E.J.; Di Liberto, T.E.; Gamble, F.; Gottschalck, J.; Halpert, M.S.; Huang, B.; et al. Observing and Predicting the 2015-16 El Niño. Bull. Amer. Meteor. Soc. 2017, 98, 1363–1382. [Google Scholar] [CrossRef]
  71. Loader, N.J.; Robertson, I.; Barker, A.C.; Switsur, V.R.; Waterhouse, J.S. An improved technique for the batch processing of small wholewood samples to α-cellulose. Chem. Geol. 1997, 136, 313–317. [Google Scholar] [CrossRef]
  72. Sofer, Z. Preparation of carbon dioxide for stable carbon isotope analysis of petroleum fractions. Anal. Chem. 1980, 52, 1389–1391. [Google Scholar] [CrossRef]
  73. Vogel, J.S.; Southon, J.R.; Nelson, D.E.; Brown, T.A. Performance of catalytically condensed carbon for use in accelerator mass spectrometry. Nucl. Instrum. Methods Phys. Res. Sect. B 1984, 5, 289–293. [Google Scholar] [CrossRef]
  74. Povinec, P.P.; Litherland, A.E.; von Reden, K.F. Developments in Radiocarbon Technologies: From the Libby Counter to Compound-Specific AMS Analyses. Radiocarbon 2009, 51, 45–78. [Google Scholar] [CrossRef]
  75. Roberts, M.L.; Burton, J.R.; Elder, K.L.; Longworth, B.E.; McIntyre, C.P.; von Reden, K.F.; Han, B.X.; Rosenheim, B.E.; Jenkins, W.J.; Galutschek, E.; et al. A high-performance 14C Accelerator Mass Spectrometry system. Radiocarbon 2010, 52, 228–235. [Google Scholar] [CrossRef]
  76. Mbele Vela, L.; Mullins, S.M.; Winkler, S.R.; Woodborne, S. Acceptance tests for AMS radiocarbon measurements at iThemba LABS, Gauteng, South Africa. Phys. Procedia 2017, 90, 10–16. [Google Scholar] [CrossRef]
  77. Bronk Ramsey, C. Bayesian analysis of radiocarbon dates. Radiocarbon 2009, 51, 337–360. [Google Scholar] [CrossRef]
  78. Hogg, A.; Heaton, T.; Hua, Q.; Palmer, J.; Turney, C.; Southon, J.; Bayliss, A.; Blackwell, P.; Boswijk, G.; Bronk Ramsey, C.; et al. SHCal20 Southern Hemisphere calibration, 0–55,000 years cal BP. Radiocarbon 2020, 62, 759–778. [Google Scholar] [CrossRef]
  79. Rinne, K.T.; Boettger, T.; Loader, N.J.; Robertson, I.; Switsur, V.R.; Waterhouse, J.S. On the purification of α-cellulose from resinous wood for stable isotope (H, C and O) analysis. Chem. Geol. 2005, 222, 75. [Google Scholar] [CrossRef]
  80. Lanzante, J.R. Resistant, robust and non-parametric techniques for the analysis of climate data: Theory and examples, including applications to historical Radiosonde Station Data. Int. J. Climatol. 1996, 16, 1197–1226. [Google Scholar] [CrossRef]
  81. Francey, R.J.; Allison, C.E.; Etheridge, D.M.; Trudinger, C.M.; Enting, I.G.; Leuenberger, M.; Langenfelds, R.L.; Michel, E.; Steele, L.P. A 1000-year high precision record of δ13C in atmospheric CO2. Tellus B 1999, 51, 170–193. [Google Scholar] [CrossRef]
  82. Wils, T.H.; Robertson, I.; Woodborne, S.; Hall, G.; Koprowski, M.; Eshetu, Z. Anthropogenic Forcing Increases the Water-Use Efficiency of African Trees. J. Quat. Sci. 2016, 31, 386–390. [Google Scholar] [CrossRef]
  83. Li, J.; Xie, S.P.; Cook, E.R.; Morales, M.S.; Christie, D.A.; Johnson, N.C.; Chen, F.; D’Arrigo, R.D.; Fowler, A.M.; Gou, X.; et al. El Niño Modulations over the Past Seven Centuries. Nat. Clim. Chang. 2013, 3, 822–826. [Google Scholar] [CrossRef]
  84. Zinke, J.; Loveday, B.R.; Reason, C.; Dullo, W.-C.; Kroon, D. Madagascar corals track sea surface temperature in the Agulhas Current core region over the past 334 years. Sci. Rep. 2014, 4, 4393. [Google Scholar] [CrossRef]
  85. Slotta, F.; Wacker, L.; Riedel, F.; Heußner, K.-U.; Hartmann, K.; Helle, G. High resolution 14C bomb-peak dating and climate response analyses of subseasonal stable isotope signals in wood of the African baobab—A case study from Oman. Biogeosciences 2021, 18, 3539–3564. [Google Scholar] [CrossRef]
  86. Mphale, K.; Dash, S.K.; Adedoyin, A.; Panda, S.K. Rainfall regime changes and trends in Botswana Kalahari Transect’s late summer precipitation. Theor. Appl. Climatol. 2014, 116, 75–91. [Google Scholar] [CrossRef]
  87. Zharkova, V.V.; Shepherd, S.J.; Popova, E.; Zharkov, S.I. Reinforcing a Double Dynamo Model with Solar-Terrestrial Activity in the Past Three Millennia. Proc. Int. Astron. Union 2017, 13, 211–215. [Google Scholar] [CrossRef]
  88. Luening, S.; Galka, M.; Vahrenholt, F. Warming and Cooling: The Medieval Climate Anomaly in Africa and Arabia. Paleoceanography 2017, 32, 1219–1235. [Google Scholar] [CrossRef]
  89. Hady, A.A. Deep solar minimum and global climate changes. J. Adv. Res. 2013, 4, 209–214. [Google Scholar] [CrossRef] [PubMed]
  90. Tyson, P.D.; Lindesay, J.A. The climate of the last 2000 years in southern Africa. Holocene 1992, 2, 271–278. [Google Scholar] [CrossRef]
  91. Tyson, P.D.; Karlen, W.; Holmgren, K.; Heiss, G.A. The little ice and medieval warming in South Africa. S. Afr. J. Sci. 2000, 96, 121–126. [Google Scholar]
  92. Neukom, R.; Nash, D.J.; Endfield, G.H.; Grab, S.W.; Grove, C.A.; Kelso, C.; Vogel, C.H.; Zinke, J. Multi-proxy summer and winter precipitation reconstruction for southern Africa over the last 200 years. Clim. Dyn. 2014, 42, 2713–2726. [Google Scholar] [CrossRef]
  93. Jury, M.R. Passive suppression of South African rainfall by the Agulhas Current. Earth Interact. 2015, 19, 150916154153004. [Google Scholar] [CrossRef]
  94. Wang, S.; Huang, J.; He, Y.; Guan, Y. Combined Effects of the Pacific Decadal Oscillation and El Niño-Southern Oscillation on Global Land Dry–Wet Changes. Sci. Rep. 2014, 4, 6651. [Google Scholar] [CrossRef] [PubMed]
  95. Richard, Y.; Traska, S.; Roucou, P.; Rouault, M. Modification of the southern African rainfall variability/ENSO relationship since the late 1960s. Clim. Dyn. 2000, 16, 883–895. [Google Scholar] [CrossRef]
  96. Mulenga, H.M.; Rouault, M.; Reason, C.J.C. Dry summers over northeastern South Africa and associated circulation anomalies. Clim. Res. 2003, 25, 29–41. [Google Scholar] [CrossRef]
Figure 1. The standing Chapman baobab with stem numbering (A). The baobab after its collapse in 2016 (B).
Forests 14 01917 g001
Figure 2. The δ13C isotopic excursions over the last millennium for samples CH3 (blue) and CH6 (red). The 21-point biweight mean of the combined record is outlined (thick black line). The y-axis is inverted and more negative values correspond to wetter conditions. The secondary y-axis presents the rainfall. The instrumental rainfall record for Maun after Mphale et al. [86] is shown in thin black lines.
Forests 14 01917 g002
Figure 3. Comparison between the Chapman δ13C archive (black), the ENSO reconstruction [83] (grey) and the SST reconstruction [84] (orange). The isotopic excursions of CH3 can be seen in blue whereas CH6 is presented in red. The 21-point biweight mean is marked with a stronger grey, black and orange line, respectively.
Forests 14 01917 g003
Figure 4. Comparison between the δ13C results of the Chapman baobab (black) and the combined proxy record of the Limpopo province, South Africa (green) [20].
Forests 14 01917 g004
Table 1. Radiocarbon dating results, calibrated ranges and assigned years to investigated segments from the Chapman baobab samples CH3 and CH6.
Sample (Segment)
Code
Depth into the Wood
(10−2 m)
Radiocarbon Date
(Error)
(14C yr BP)
Cal CE

[Confidence Interval]
Assigned Year (cal CE)Accession #
CH3-16025211 ± 221662–1699 [22.4%]
1723–1812 [71.5]
1839–1844 [0.6%]
1870–1876 [0.6%]
1932–1936 [0.4%]
1796OS-126074
CH3-25030420 ± 441446–1628 [95.4%]1588IT-C-1110
CH3-30442.9470 ± 341421–1504 [86.6%]
1594–1616 [8.9%]
1464IT-C-1266
CH3-32545630 ± 161319–1354 [65.1%]
1360–1405 [30.4%]
1443OS-127129
CH3-39853560 ± 351327–1340 [4.1%]
1392–1450 [91.3%]
1406IT-C-1095
CH3-51165687 ± 211291–1328 [41.1%]
1339–1393 [54.3%]
1350OS-126075
CH3-66985841 ± 221211–1279 [95.4%]1243OS-126076
CH3-791105985 ± 181032–1150 [95.4%]1111OS-125231
CH6-10020.8100 ± 361697–1725 [12.8%]
1809–… [82.6%]
1914IT-C-1096
CH6-19825139 ± 221696–1725 [16.6%]
1809–… [78.9%]
1810OS-127128
CH6-28435340 ± 301497–1653 [95.4%]1510IT-C-1271
CH6-41345347 ± 181503–1595 [77.5%]
1616–1643 [17.9%]
1654OS-127130
CH6-61665367 ± 201485–1635 [95.4%]1507OS-127131
CH6-74078.3600 ± 331318–1355 [33.6%]
1385–1436 [61.9%]
1422IT-C-1093
CH6-79085617 ± 211320–1354 [50.5%]
1386–1415 [44.9%]
1403OS-127132
CH6–984105648 ± 171314–1360 [71.8%]
1381–1402 [23.7%]
1331OS-126137
CH6-1129115800 ± 301220–1292 [95.4%]1276OS-126138
CH6-1295127.5930 ± 371043–1223 [95.4%]1214IT-C-1592
CH6-1420138910 ± 351046–1088 [12.7%]
1109–1121 [1.2%]
1135–1233 [77.4%]
1246–1269 [4.1%]
1167IT-C-1524
Table 2. Correlation results between the Chapman time series with different parameters.
ParameterData SourcePeriodrpn
RainfallTherrell et al. [33]1826–19660.4480.0388135
1826–19000.6340.006275
post 19000.1630.634661
SSTZinke et al. [84]1800–1900−0.5600.0741101
post 19000.6670.031561
ENSOLi et al. [83]1330–19600.0390.6751631
1800–19000.5400.0014101
1900–1960−0.4540.060961
Limpopo province paleoclimate reconstruction (δ13C)Woodborne et al. [20]1600–1750−0.5440.0197134
1750–19000.6620.0026143
1900–19600.1690.588561
Disclaimer/Publisher’s Note: The statements, opinions and data contained in all publications are solely those of the individual author(s) and contributor(s) and not of MDPI and/or the editor(s). MDPI and/or the editor(s) disclaim responsibility for any injury to people or property resulting from any ideas, methods, instructions or products referred to in the content.

