Article

The Effects of Thinning on Tree Growth and Stand Biomass in a Chronosequence of Pinus tabulaeformis Plantations in the Loess Plateau of China

1
State Key Laboratory of Herbage Improvement and Grassland Agro-Ecosystems, Lanzhou University, Lanzhou 730000, China
2
Heshui Branch of Ziwuling Forestry Administration of Gansu Province, Qingyang 745400, China
3
Key Laboratory for Earth Surface Processes of the Ministry of Education, Institute of Ecology, College of Urban and Environmental Sciences, Peking University, Beijing 100871, China
*
Author to whom correspondence should be addressed.
Forests 2023, 14(8), 1620; https://doi.org/10.3390/f14081620
Submission received: 4 June 2023 / Revised: 29 July 2023 / Accepted: 2 August 2023 / Published: 11 August 2023
(This article belongs to the Special Issue Aboveground and Belowground Interaction and Forest Carbon Cycling)

Abstract

:
Thinning plays a vital role in controlling stand density of plantation forests to get quality wood and more ecological function. However, the specific effects of thinning on forest biomass connected with forest age are usually overlooked especially in semi-arid regions. Here, we examined the effects of thinning on individual tree growth and stand biomass in a chronosequence of 20-, 30-, 40-, and 50-year-old Chinese pine (Pinus tabulaeformis) plantations on the Loess Plateau, China. We found that under different thinning managements, both mean diameter at breast height (DBH) and tree height followed the logistic growth pattern, and thinning promoted tree radial growth more than height. The effects of thinning on tree biomass differed between the individual tree and stand level. Thinning could promote individual tree biomass irrespective of stand ages, while stand biomass did not differ between the thinned and unthinned stands at different stand ages. Furthermore, the multiple linear regression analysis and structure equation model showed that individual tree growth was the primary contributor of stand biomass. Thus, we infer that the stand biomass loss after thinning could be mainly compensated by enhanced tree growth, especially radial growth, after a period of recovery (no more than 20 years). The results could provide helpful guidance for forest management and highlighted that reasonable thinning treatment could result in both high individual tree product and stand level harvests in the long term.

1. Introduction

Plantation forests play important roles in producing timber and mitigating climate change by sequestering carbon dioxide and supplying other ecosystem services [1,2,3,4,5], covering about 7% (294 million ha) of the global forest area [6]. China has the largest area of plantation forests (85 million ha), accounting for 29% of the world [6,7]. The Loess Plateau, a semi-arid region in North China, has historically experienced severe deforestation and erosion [8]. Thus, about 50% of this region is covered by loess, where the ecosystems have low tolerance to disturbance and are extremely fragile [9,10]. Since the 1950s, large-scale ecological restoration has been launched in this region, increasing the forest coverage from 9% to 33% from 1960 to 2020, respectively [8,11,12]. However, the effects of forest management on plantations on the Loess Plateau have seldom been assessed so far.
Biomass reflects the capacity of forests for wood production, carbon storage, and climate change mitigation [6,13]. Abiotic factors, such as soil condition, topographic heterogeneity, and climatic factors can greatly influence forest growth through determining resource availability (e.g., light, water, nutrients) and microclimate [14,15]. In addition, biotic factors such as stand age, interspecific or intraspecific competition, and plant community structure can also affect forest biomass [16,17]. Recent studies have suggested that stand structure (e.g., stand density, tree size variation) and stand age might contribute more to aboveground biomass even than species composition in some subtropical and temperate forests in Asia and Europe [17,18,19,20,21]. Specifically, stand density is considered an important stand structural attribute, which can affect forest biomass by increasing tree size variation and adjusting the allocation of resource [22,23].
Thinning is the main forest management strategy, executed by removing some trees in high stand density, which is designed to reduce competition from surrounding trees and increase the availability of water, light, and nutrients [24,25]. Furthermore, for plantation forests, thinning is often used for better quality timber and to facilitate management. Especially, when the initial stand density of a plantation is too high, thinning can reduce the death of trees. In the beginning, thinning directly reduces forest biomass and tree canopy density [17,26]. On the other hand, thinning alters the allocation of resources and stand structure as well as the microenvironment (e.g., light, moisture, and temperature), which usually change aboveground biomass allocation and improve individual growth [24,27,28]. Stem radial growth ensures more water transportation and storage, and height growth can capture more light [29,30,31]. Some studies have demonstrated that thinning could promote diameter growth in individual trees at the expense of height growth [31,32]. For example, studies of thinning effects on Ponderosa pine, stone pine, Loblolly pine, Scots pine, and Norway spruce forests have demonstrated that thinning can promote radial growth of trees [33,34,35,36,37]. In addition, as stand age increases, whether and when the increase of individual tree growth could mitigate the adverse impacts of thinning on stand biomass remain unclear, especially in semi-arid regions.
In this study, with a chronosequence of 20-, 30-, 40-, and 50-year-old Chinese pine (Pinus tabulaeformis) plantations under different thinning managements (thinned and unthinned) sampled on the Loess Plateau, we estimated the influence of thinning management on individual tree growth and stand biomass. We quantified the relative contribution of thinning management, stand age, stand structure, and individual tree growth on forest biomass and the causal links of these variables. The objective of this study is to estimate the change of individual tree growth and stand biomass after thinning management in Chinese pine plantations and supply suggestions regarding plantation management for better timber productivity and forest ecosystem service. Accordingly, we hypothesized that thinning can promote the growth of individual trees (H1), and the sudden stand biomass loss after thinning at an intensity of 45–60% could be compensated by enhanced tree growth after no more than 20 years of recovery in the Chinese pine plantations (H2).

2. Materials and Methods

2.1. Study Site

The study was conducted in a plantation forest on Mt. Ziwuling (108°09′–108°43′ E, 35°18′–36°30′ N, 885–2089 m), south of the Loess Plateau, Gansu province, China (Table 1, Figure S1). The study area is typical loess geomorphology and possesses a temperate continental monsoon climate. The mean annual temperature is 7.4–8.5 °C and the mean annual precipitation is 500–620 mm, along with relatively high mean annual evaporation (1500 mm). These forest stands were planted after large-scale deforestation in the 1960s and the main tree species for reforestation was Chinese pine (Pinus tabulaeformis).
We selected eight types of Chinese pine stands with different forest managements (thinned and unthinned) along a chronosequence (20-, 30-, 40-, and 50-year-old stands) (Table 1). We finally found 24 forest plots (three plots for each stand with the same forest management and stand age). In detail, we chose three replicate plots randomly within each stand, which covered an area of about 200 ha. The area of each plot was 400 m2 (20 m × 20 m) and the distance between the plots was greater than 50 m (Figure S1). Basic stand characteristics are shown in Table 1 and the site indexes were calculated based on the height of trees with corresponding stand age. The stands were planted with pine seedlings directly by the method of cluster planting, which means a cluster was planted (2–3 stems) per hole with square spacing 2.5 m × 2.5 m and the initial planting density was about 4000 to 5000 seedlings/ha–1 for the stands [38,39]. The stand management included pruning and thinning. Specifically, the thinned stands experienced three times thinning with a cut intensity of 15–20% (the number of cut trees divided by all trees) every time. In total, about 45–60% trees in each stand were cut. All the stands were dominated by Chinese pine and its importance value (the average of relative abundance, frequency, and BA (basal area at breast height)) was 0.72–1.00. In addition, the stands were mixed with a few other trees, such as Quercus mongolica, Acer pilosum, A. tataricum, Malus baccata, and Ulmus davidiana.

2.2. Field Investigation

In July 2022, we set three plots (20 m × 20 m) randomly within each of the eight forest stands to investigate living trees. All living trees with a diameter at breast height (DBH) no less than 3 cm in the plot were identified and measured, to record tree height (m) and DBH (cm). In addition, according to the study region and specific tree species, we used the corresponding allometric equation (Equation (1)) of different tree components (leaf, branch, stem, and root) to calculate the biomass of each component [38].
w = a ( D 2 H ) b
where w is the estimate of biomass of each component; D and H are the diameter at breast height and tree height, respectively; and a and b are the coefficients of the function. For different components (leaf, branch, stem, and root) of trees and different tree species, the coefficients varied. Specifically, species-specific allometric equations were used for Pinus tabulaeformis and Quercus mongolica and local broad-leaved tree allometric equations were used for the other few trees to calculate biomass (Table 2) [40]. Then, we calculated the individual tree biomass by summing the biomass of the different components, and stand biomass was calculated by summing the biomass of all trees within a plot. As the underlayer shrubs and herbs were quite sparse in the investigated stands, we did not include their biomass when estimating the stand biomass.

2.3. Predictors of Stand Biomass

We used four groups of variables to predict the variation of stand biomass: (i) thinning management, (ii) stand age, (iii) stand density, and (iv) individual tree growth. Specifically, two basic dimensions of a tree, namely DBH and height, were used to describe individual tree growth. Tree height and DBH represent vertical and lateral growth, respectively. The stand age of these plantation stands was calculated based on the records of local afforestation history. The stands were planted from 1970 to 2000 approximately. Forest thinning management includes thinned and unthinned treatments (thinned with low stand density and unthinned with high stand density), and were assigned as 1 and 0 in the general linear mixed model analyses.

2.4. Statistical Analyses

Three models (simple linear, exponential, and logistic model) were used to fit the DBH and tree height (m) growth curves along the chronosequence. DBH and tree height were used as response variables in the three models. Then, the logistic models were selected based on the Akaike information criterion (AIC) (Equation (2); Table 3).
Y = W 1 + α × e λ × a g e
where Y is the height or DBH of trees and age is stand age; and W, α, and λ are the coefficients of the function. In brief, W and λ represent potential maximum growth quantity and innate rate of increase, respectively. The differences in the mean DBH, mean height, individual tree biomass, and stand biomass of different stands were tested with the one-way analysis of variance (ANOVA). We also used a paired t-test to give a precise comparison between thinned and unthinned stands at different stand ages. All the above analyses were conducted with R 4.2.2 (R Core Team, 2022).
To compare the effects of possible drivers (individual tree growth (DBH and height), stand density, thinning, and stand age) on stand biomass. We first conducted the general linear mixed model analyses with the R function ‘nlme’. We set stand biomass as the response variable and stand as the random factor. The regression coefficient of each predictor was standardized, which represents the effect size for stand biomass. Then, we separated the relative contribution of the four groups of predictors using variation and hierarchical partitioning with the R package ‘rdacca.hp’ [41]. Finally, we used the structure equation model (SEM) to infer the causal links among these predictors (individual tree growth (DBH and height), stand density, and stand age) and stand biomass. Model fit of the SEM was evaluated with goodness of fit index (GFI), root mean square error of approximation (RMSEA), and chi-square (χ2) test. The SEM analyses were performed with AMOS 28.0 (Amos Development Corporation, Chicago, IL, USA).

3. Results

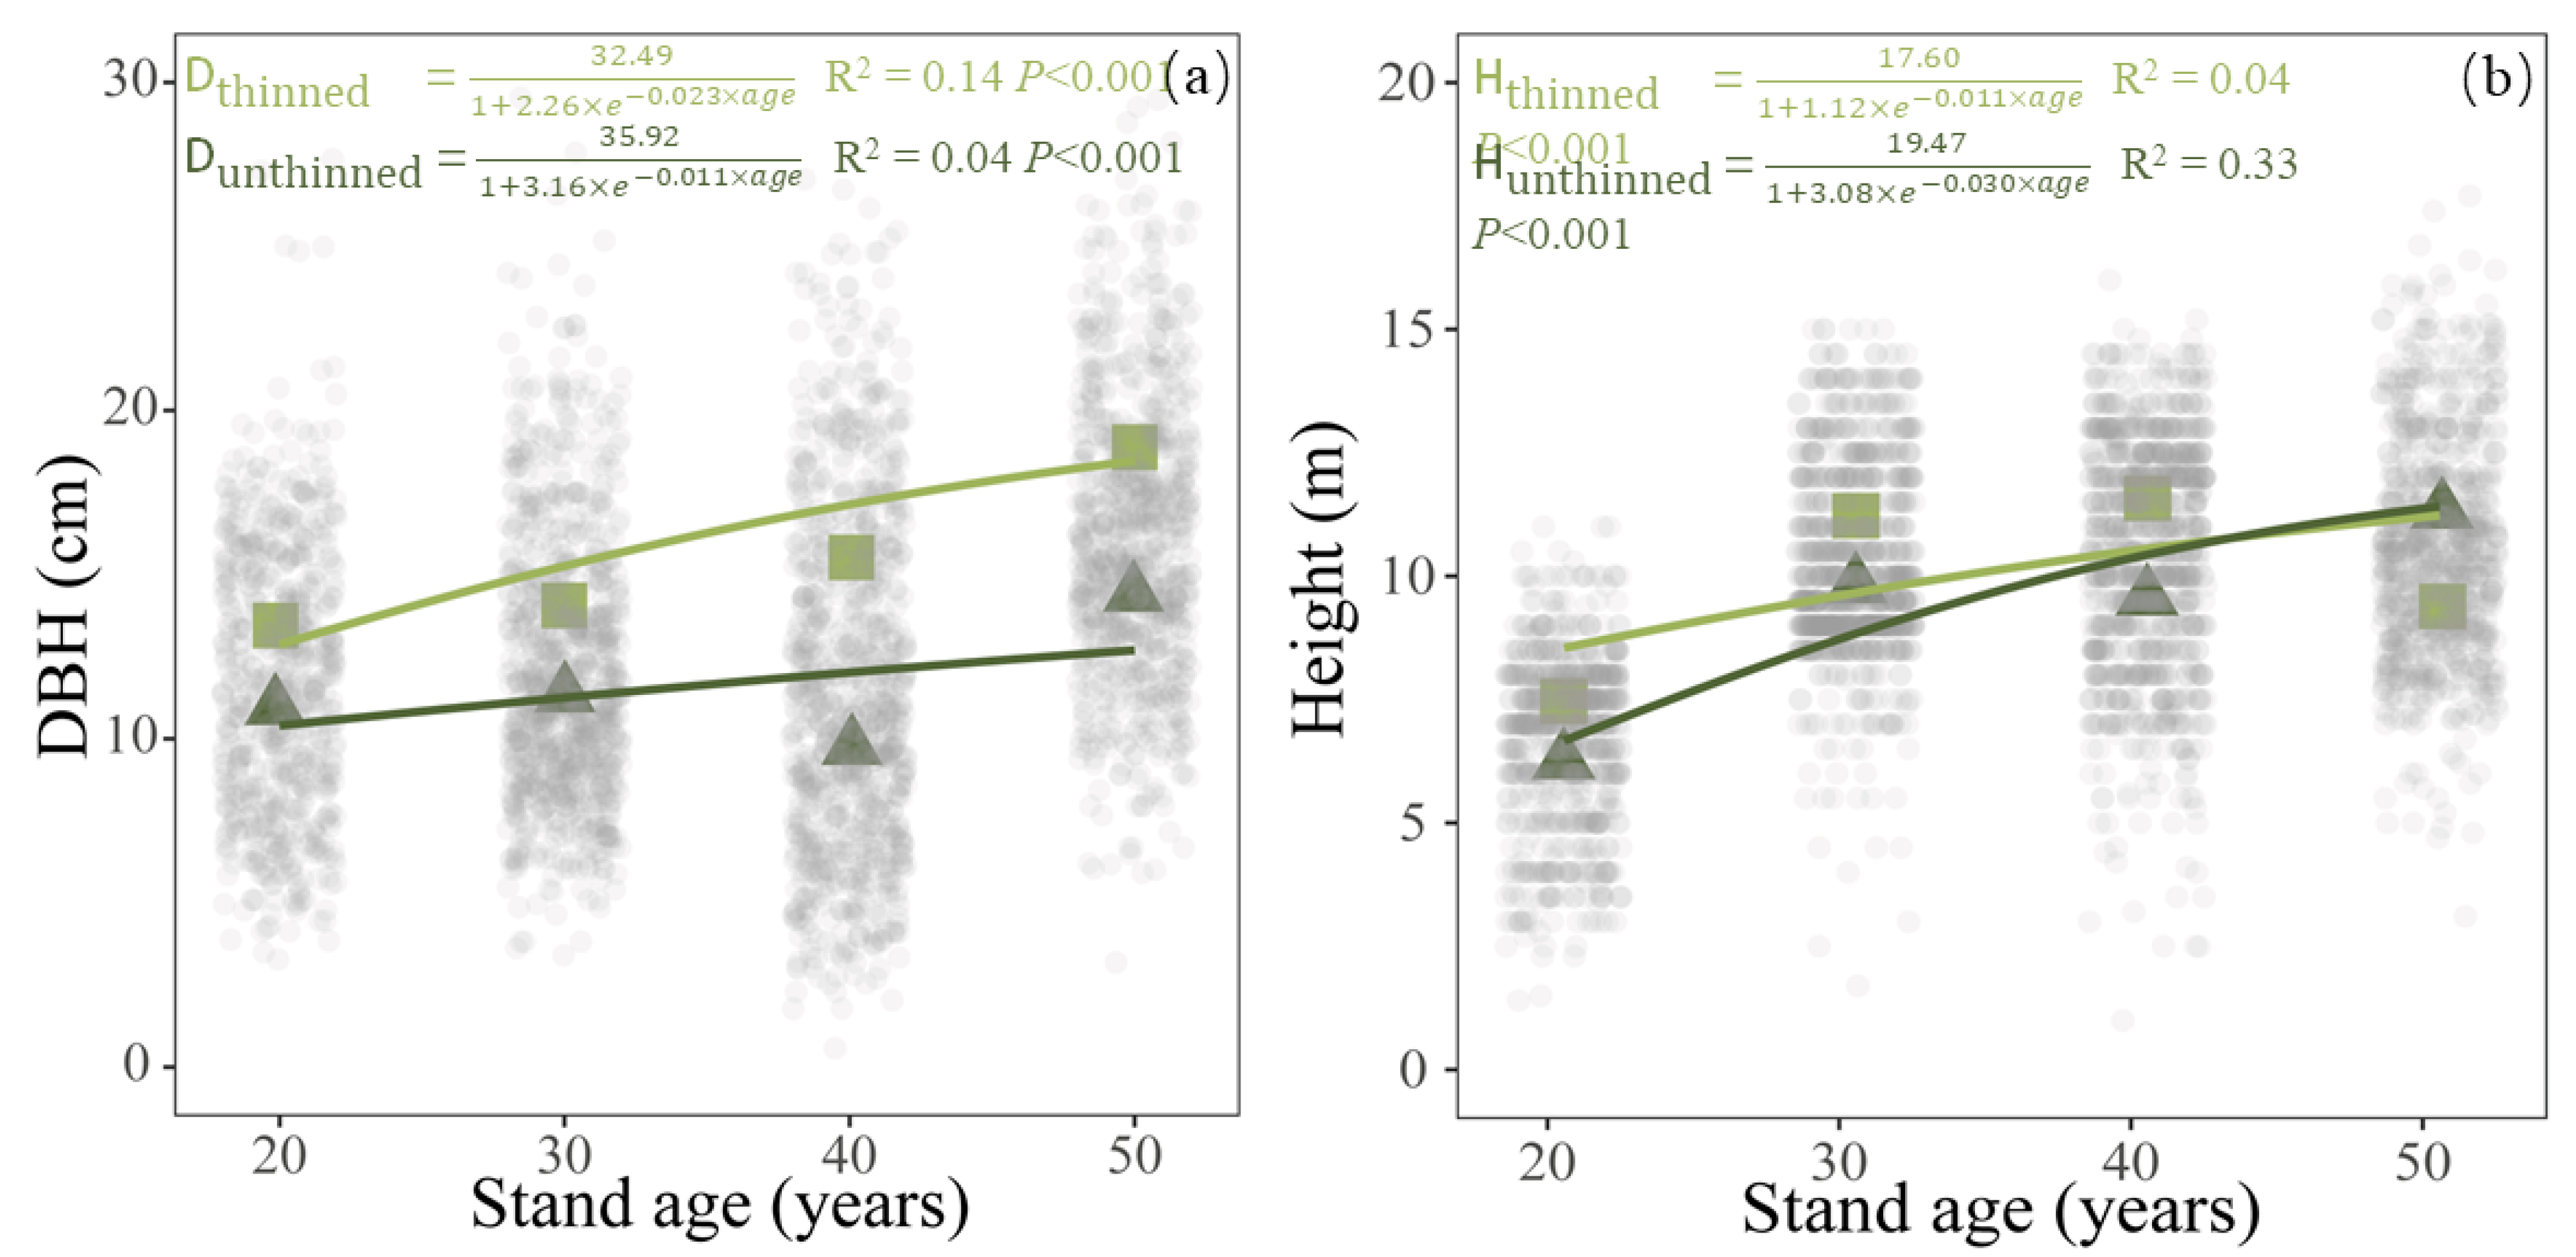
3.1. Individual Tree Growth under Different Thinning Managements

Under different thinning managements, both mean DBH and height followed the logistic growth pattern (Figure 1; Table 3). Based on the logistic regression, the estimated innate DBH growth rate of thinned stands was higher than that of the unthinned stands (Figure 1a), but the estimated innate height growth rate of thinned stand was lower than that of unthinned stands (Figure 1b). The mean DBH increased from 10.97 ± 0.32 cm for the juvenile (20 year) unthinned stands to 14.42 ± 0.38 cm for the near-mature (50 year) unthinned stands, and from 13.45 ± 0.51 cm to 18.88 ± 2.51 cm for the thinned stands. In addition, the mean DBH of thinned plantation stands was significantly higher than that of unthinned stands at different age stages (20- and 40-year-old, p < 0.05; Table 4). The mean height increased from 6.25 ± 0.41 m for the juvenile (20 year) unthinned stands to 11.32 ± 0.56 m for the near-mature (50 year) unthinned stands, and from 7.74 ± 0.48 m to 9.39 ± 0.95 m for the thinned stands. Furthermore, the mean height of thinned stands was higher than the unthinned stands only for younger stages (p < 0.05; Table 4).

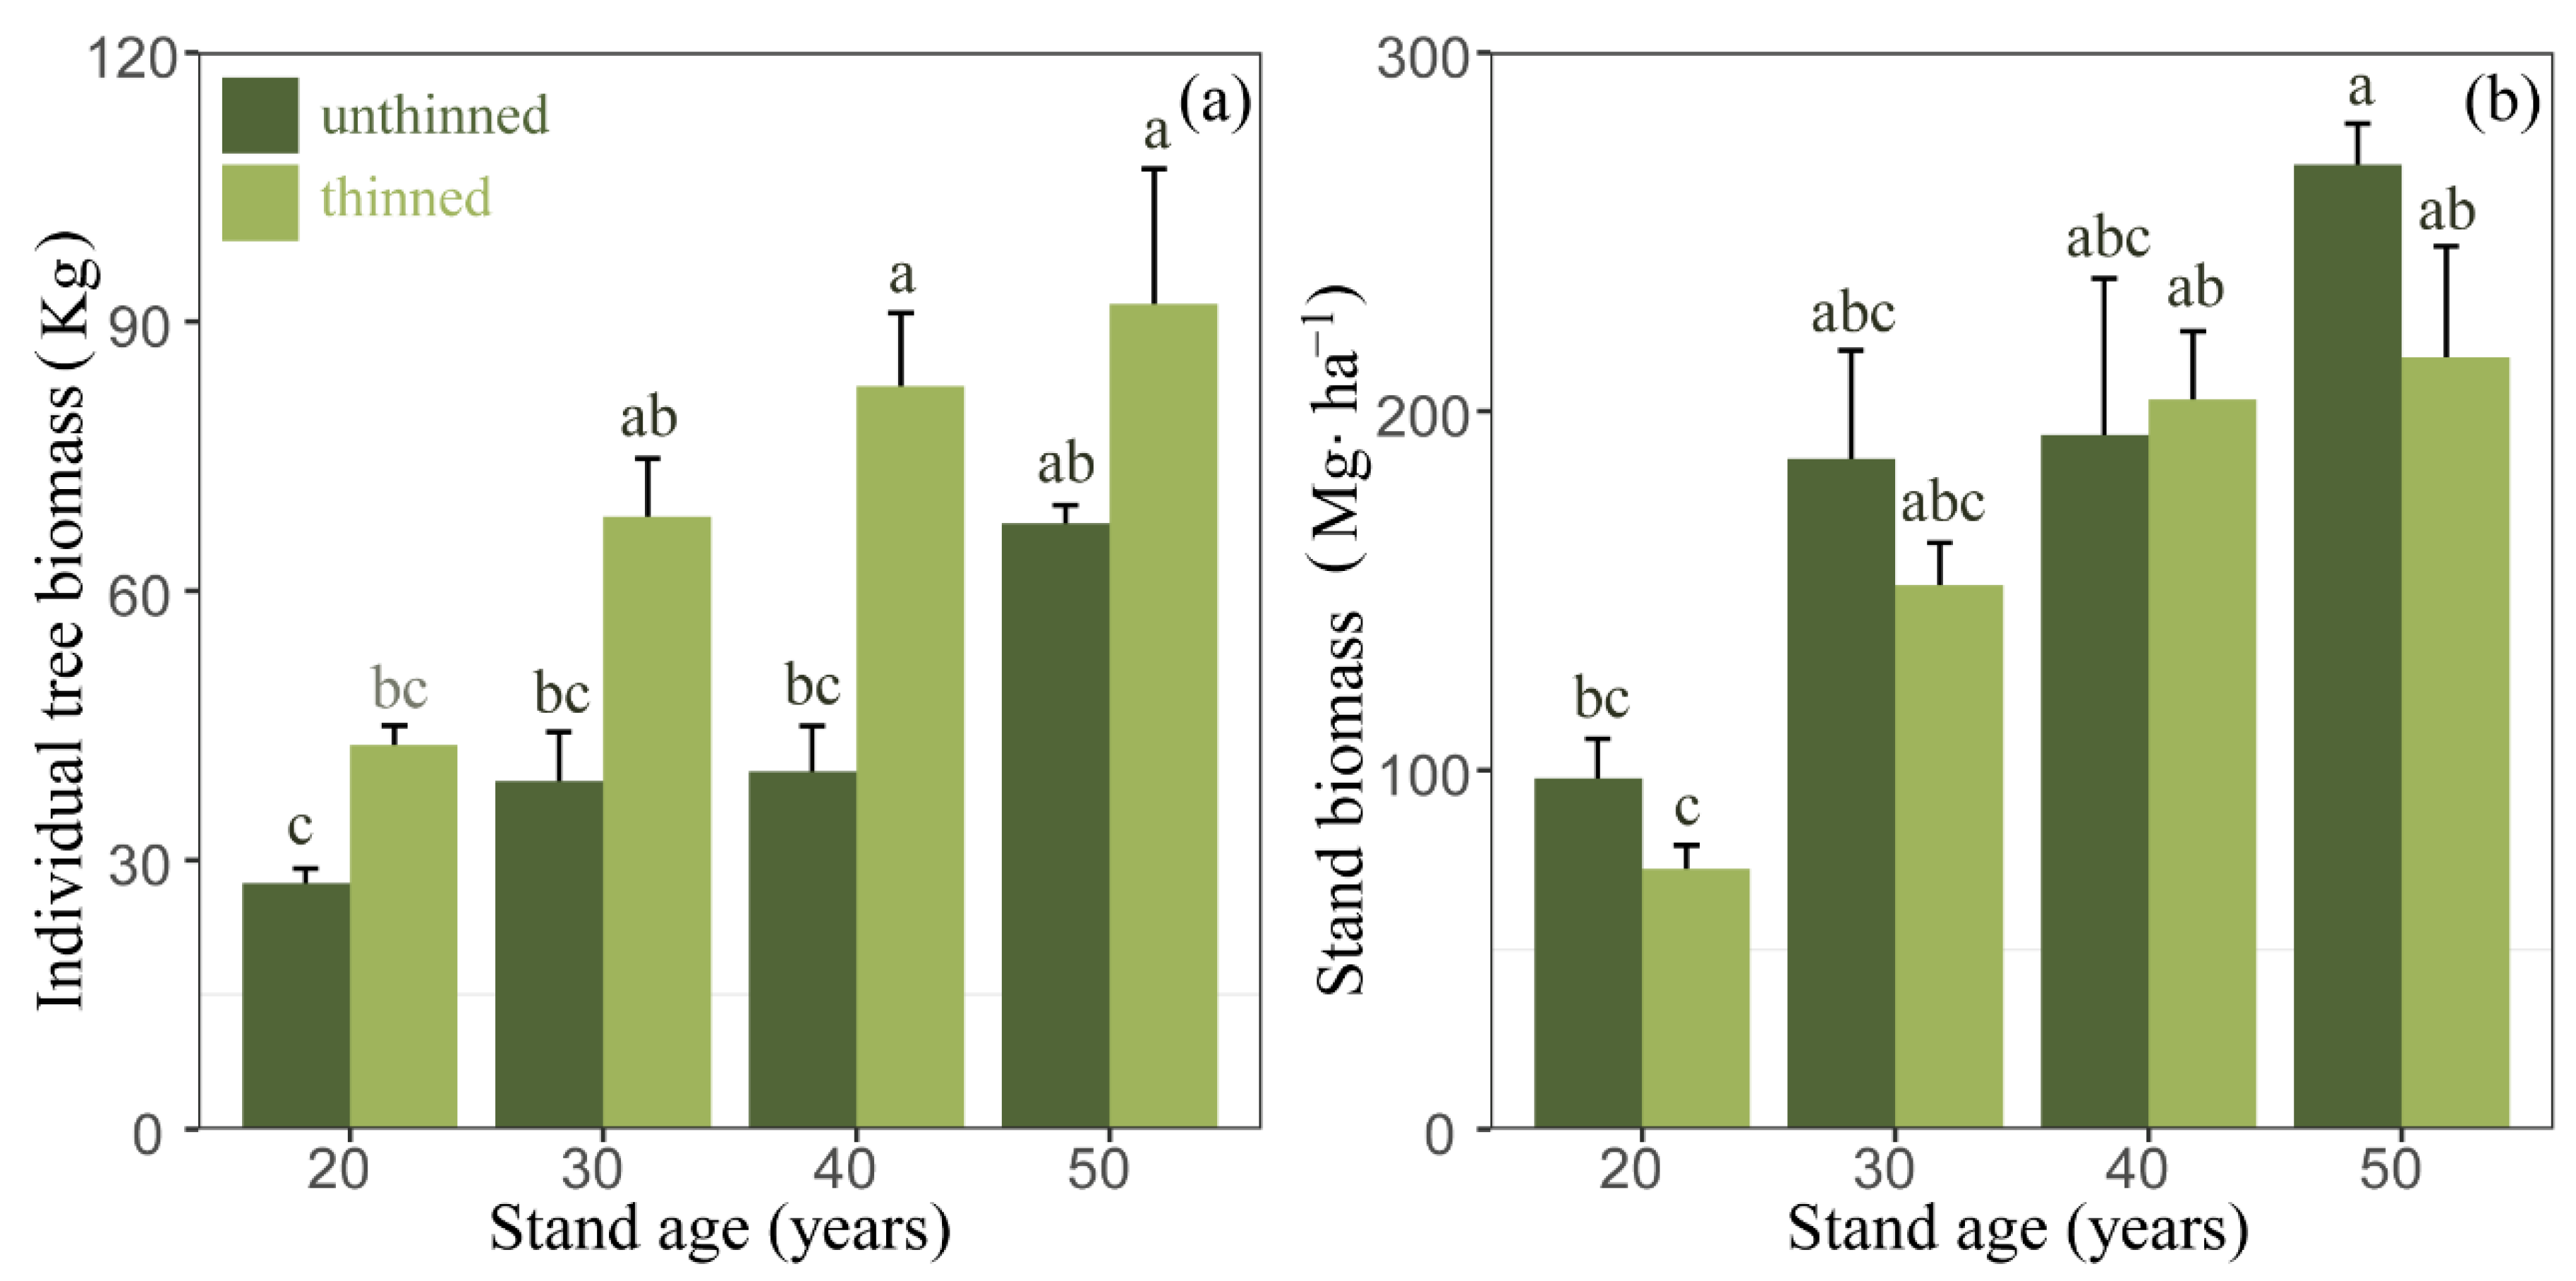
3.2. Individual Tree and Stand Biomass under Different Thinning Managements

Both individual tree and stand biomass increased significantly with stand age for the thinned and unthinned stands (p < 0.05; Figure 2). Individual tree biomass increased from 27.4 ± 2.9 kg for the juvenile (20 years) unthinned stands to 67.5 ± 3.6 kg for the near-mature (50 years) unthinned stands, and from 42.8 ± 3.9 to 91.9 ± 26.1 kg for the thinned stands. For stand biomass, the ranges were 97.6 ± 19.2 to 268.7 ± 19.8 Mg∙ha–1 and 72.5 ± 11.4 to 215.1 ± 53.5 Mg∙ha–1 for the untinned and thinned stands, respectively (Figure 2, Table 4). In addition, the effects of thinning management on tree biomass differed between the individual tree and stand level. The individual tree biomass for the thinned stands was higher than that of unthinned stands at different age stages on the whole (F = 31.48, p < 0.01; Figure 2a), with significant differences observed for the juvenile stands and middle-age stands (40 years) (T = 4.70, 5.23, p < 0.05, respectively; Table 4). However, the stand biomasses of thinned and unthinned stands were not significantly different (F = 2.47, p = 0.13; Figure 2b).

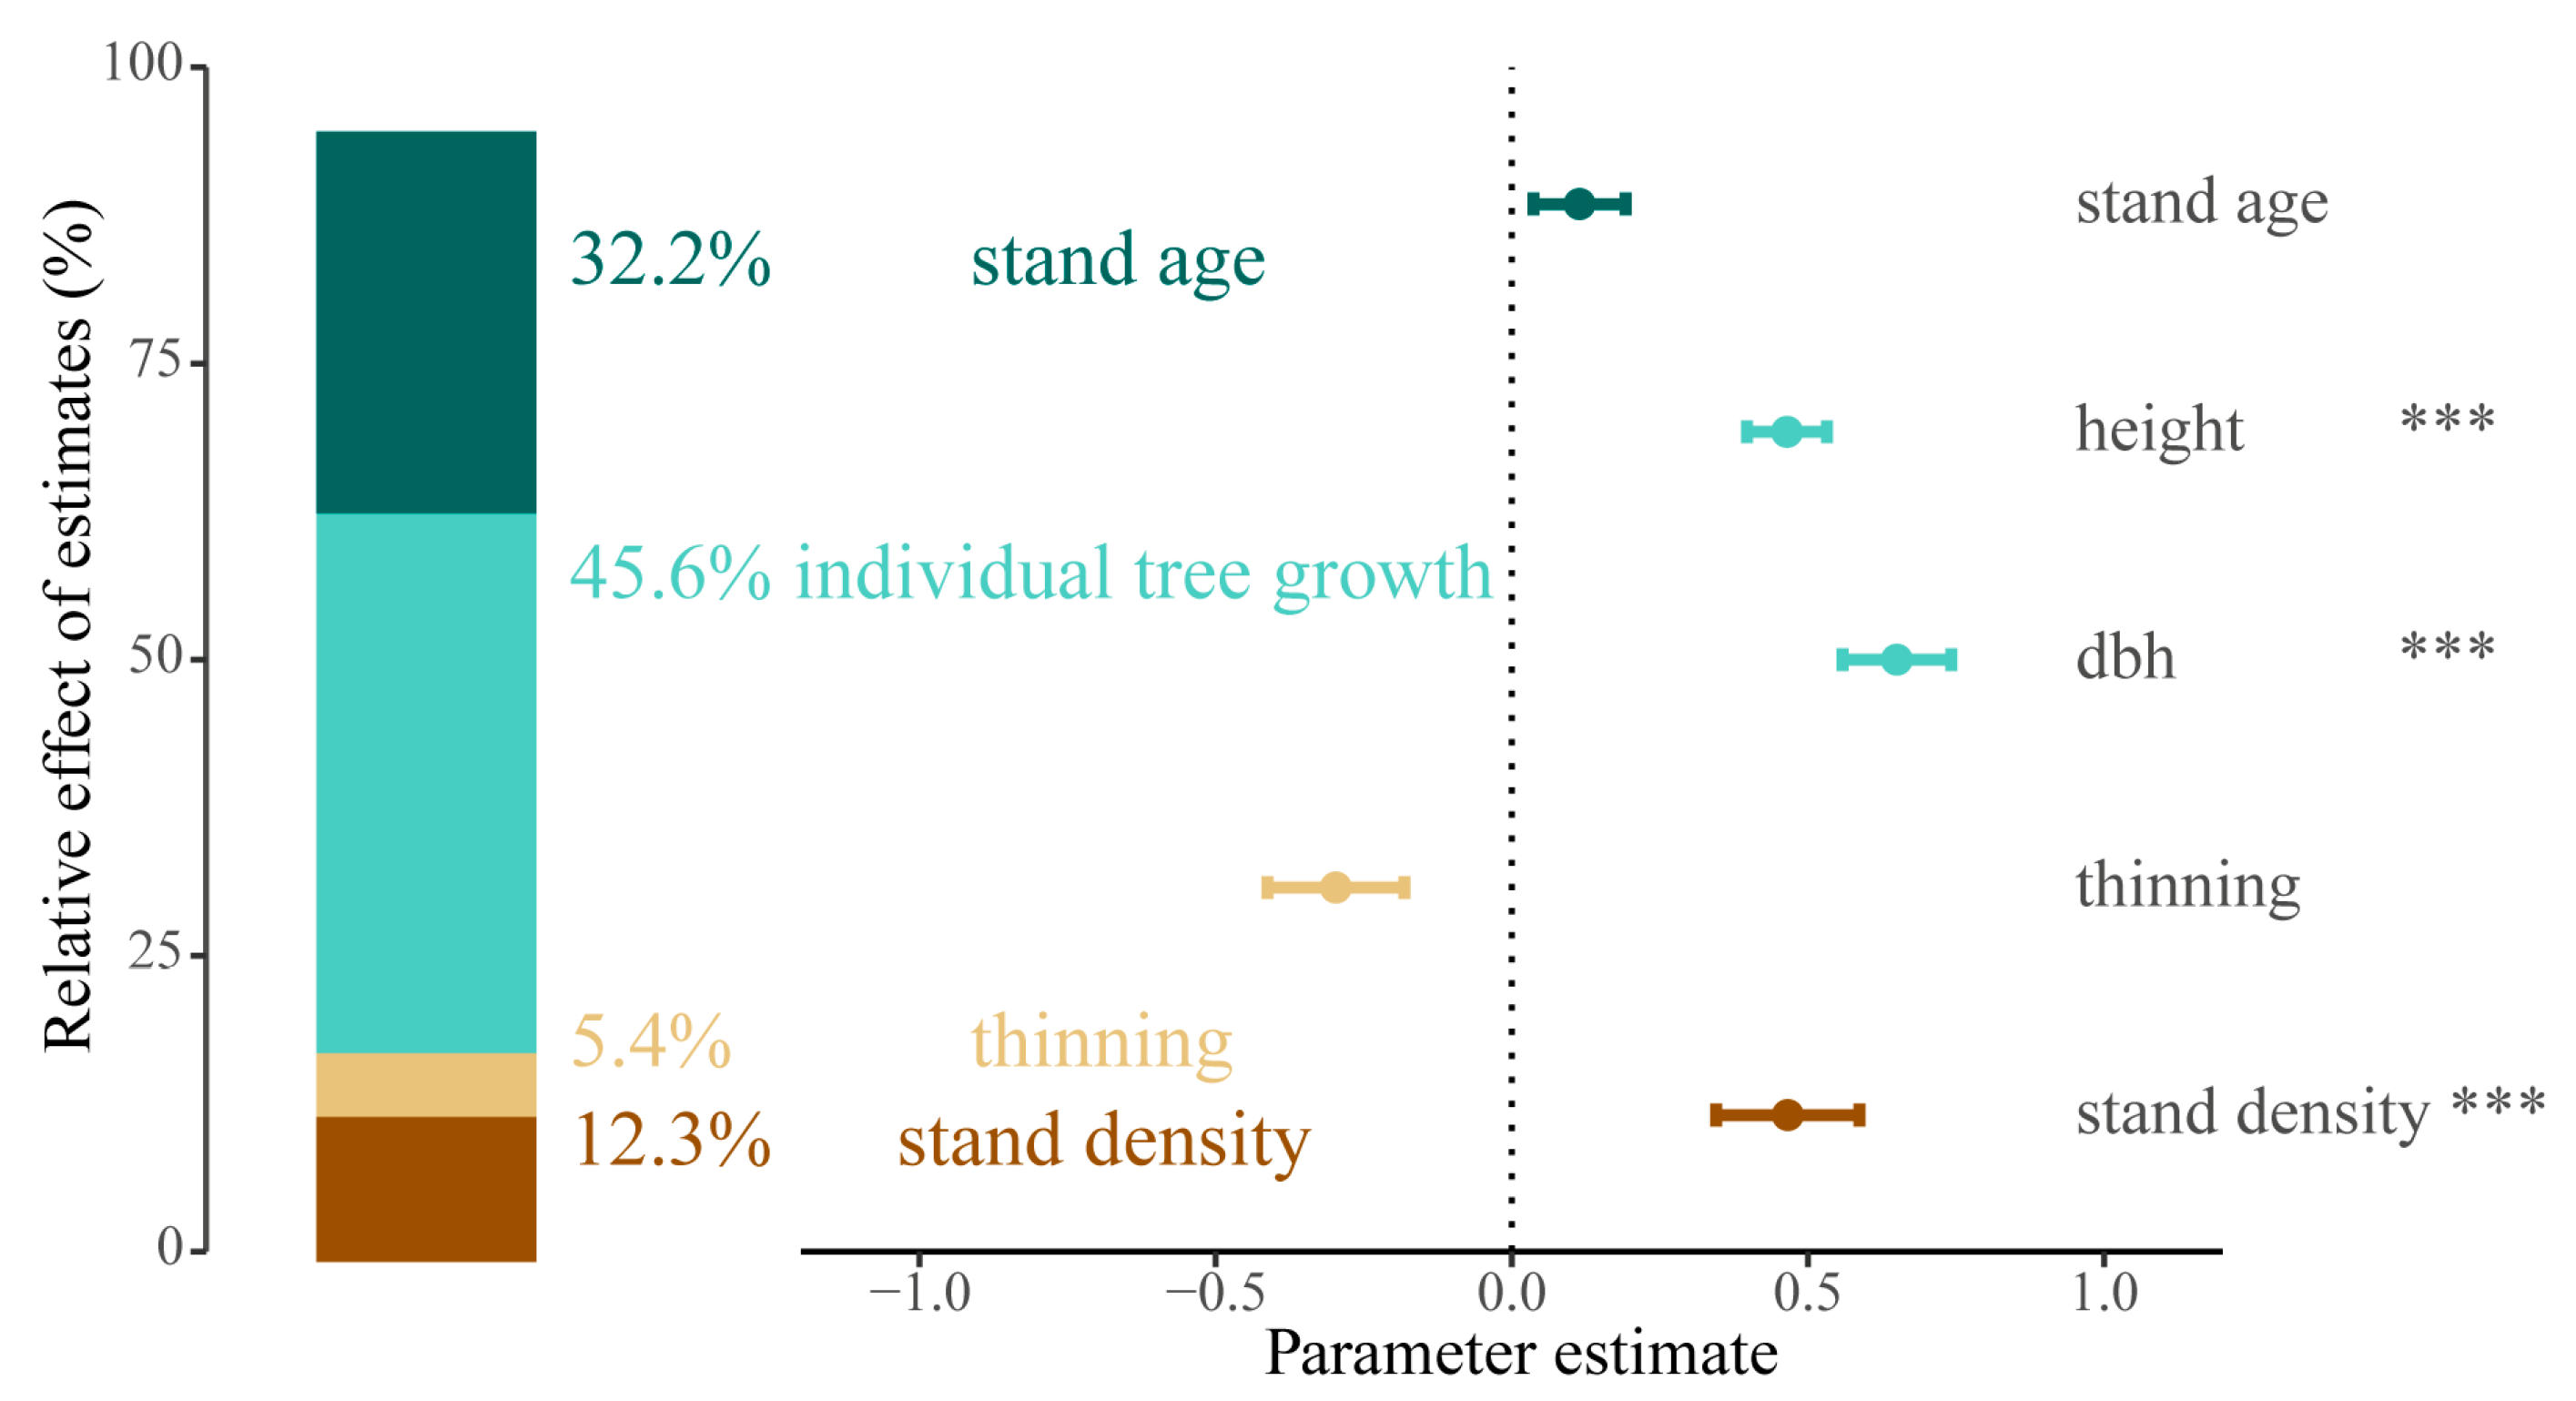
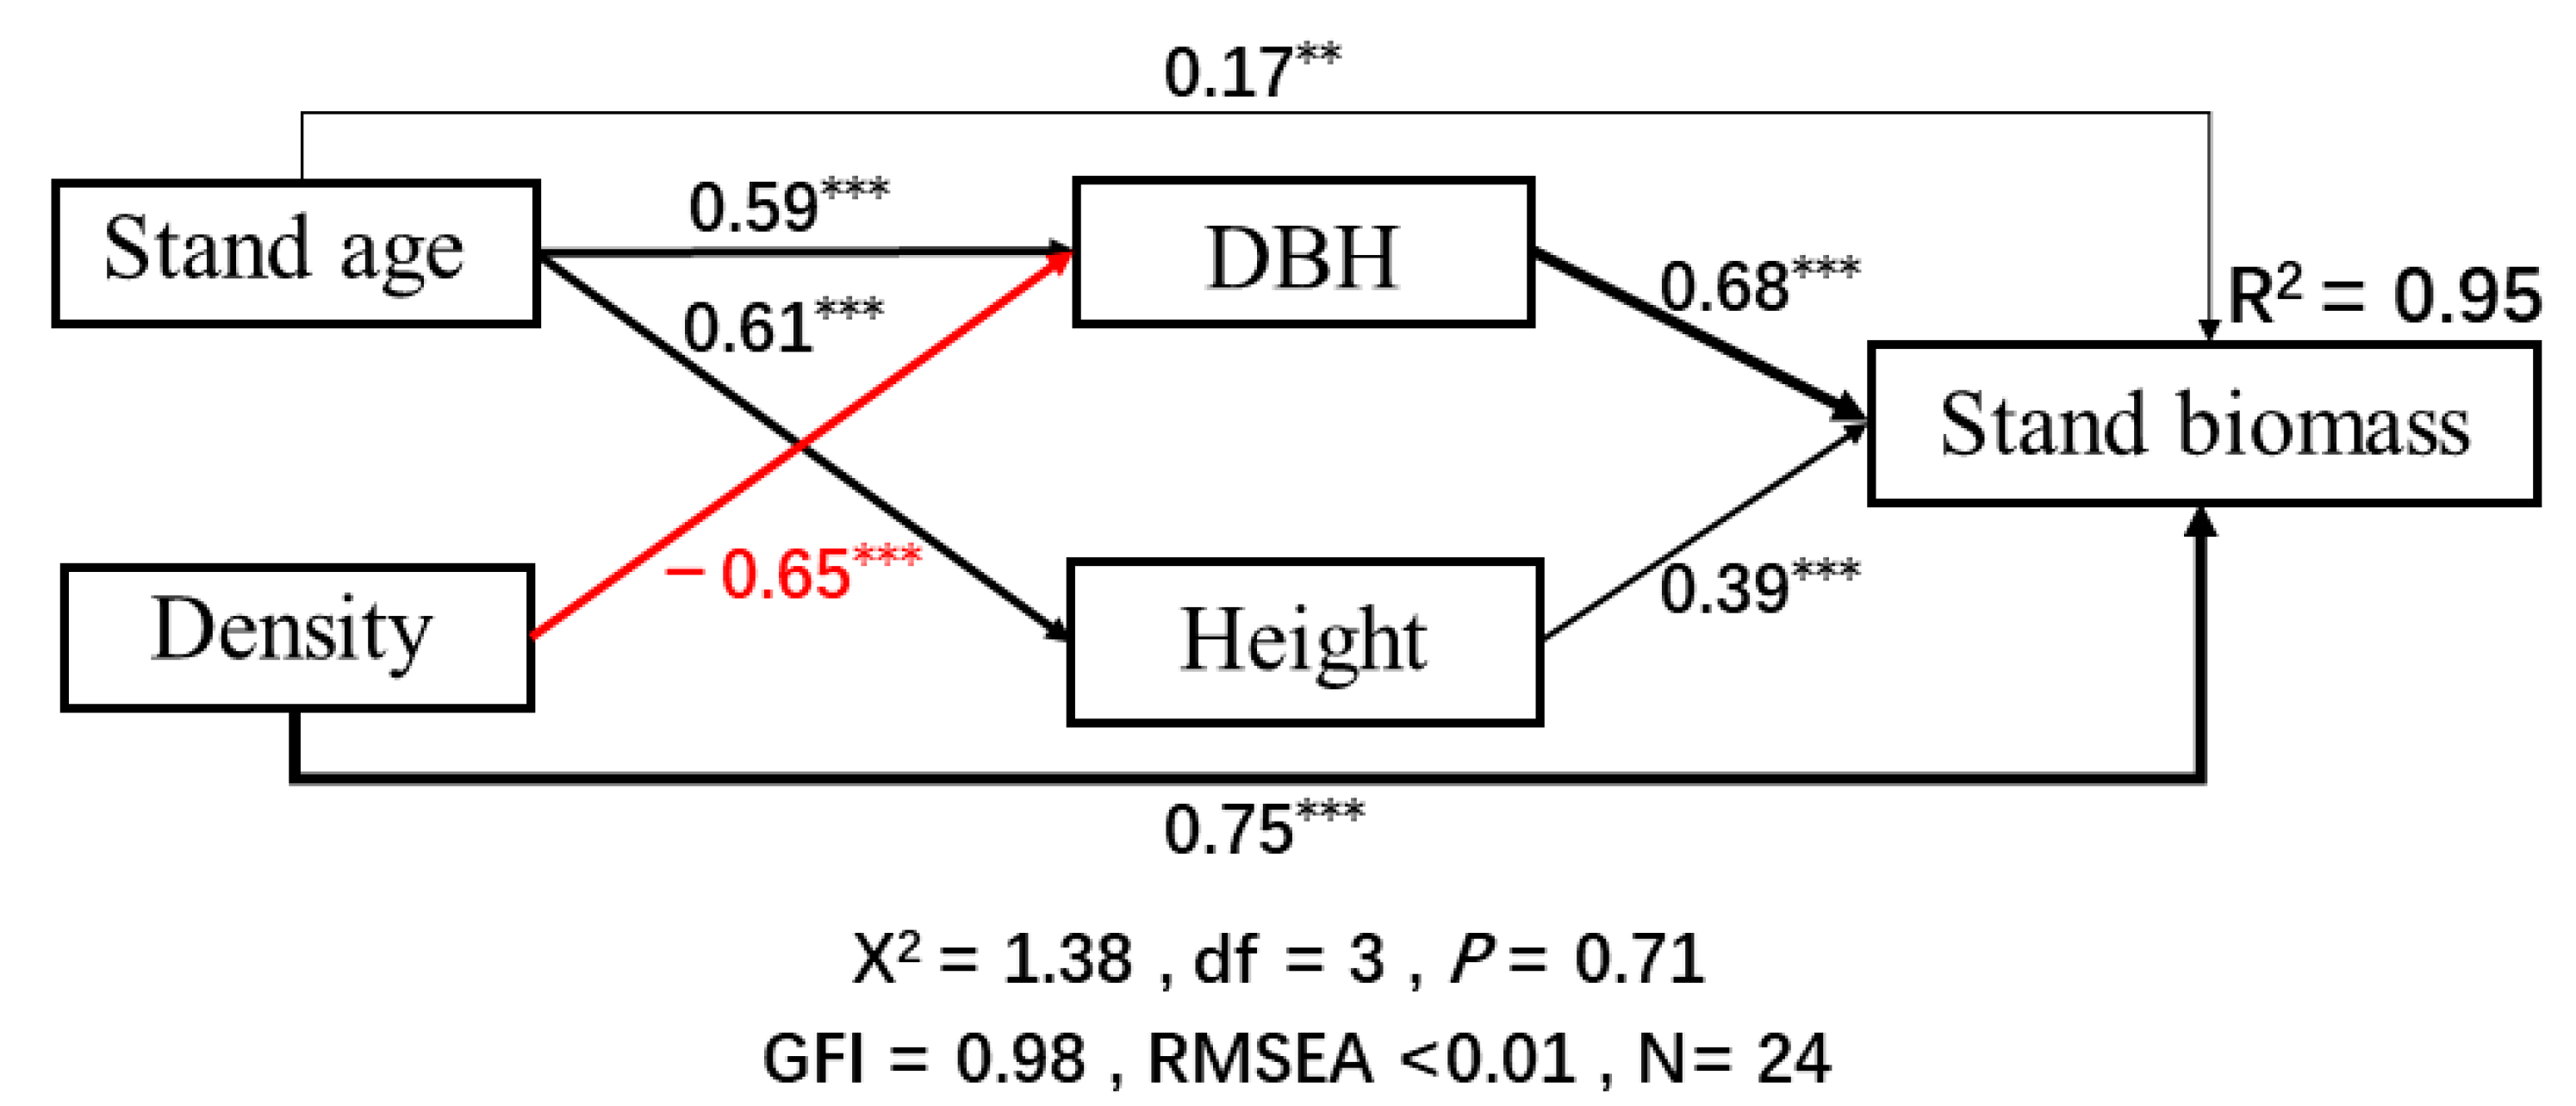
3.3. Potential Predictors of Stand Biomass

We used general linear mixed models to estimate the effects of possible drivers. The four groups of variables, namely thinning management, stand age, stand density, and individual tree growth, explained a high proportion of the variance in stand biomass (R2 = 0.96). Specifically, individual tree growth contributed the majority of its variance (45.6%), followed by stand age (32.2%) and stand density (12.3%), while thinning management only explained 5.4% of its variance (Figure 3). For detailed variables, stand density, DBH, and height had significantly positive correlations with stand biomass (p < 0.01 Figure 3) and stand age and thinning had no significant positive correlation with stand biomass.
Finally, we fit a structural equation model (SEM) to infer the direct and indirect effects of individual tree growth (DBH and height), stand age, stand density, and thinning on stand biomass. As thinning and stand density were highly correlated, we only kept DBH, height, stand age, and stand density in the analyses. The model with Fisher’s C statistic p > 0.05 (p = 0.71 in the model) was adopted (Figure 4). The results of the SEM demonstrated that individual tree growth (DBH and height), stand density, and stand age could directly promote stand biomass (Figure 4). Stand density directly affected stand biomass and had the greatest positive effects (standardized coefficient β = 0.75). It also indirectly affected stand biomass through the growth of DBH (Table 5). Stand age increased stand biomass directly (β = 0.17) and indirectly by enhancing individual tree growth (height and DBH, β = 0.61 and 0.59, respectively).

4. Discussion

4.1. Thinning Promoted Individual Tree Radial Growth

Radial and vertical growth are two dimensions of individual tree growth [42]. Trees adjust their growth strategies, namely allocation in the two dimensions, in response to varying tree age, environmental conditions, interspecific or intraspecific competition, and human disturbance [37,43]. Our results show that stand age promoted both tree DBH and height (Figure 4). However, thinning promoted tree DBH growth more than height (Figure 1, Table 4), partly in line with our hypothesis H1 and consistent with previous studies conducted in different forest ecosystems [36,37,44,45,46]. Furthermore, the results of the SEM showed that stand density ultimately affected biomass by influencing DBH rather than tree height. The site index also indicated that site index increased with stand age and unthinned management. This result demonstrated that unthinned Chinese pine plantation with high density could restrain the DBH growth of trees. Chinese pine is considered as a light-demanding species [47], and water is also vital for tree growth especially in semi-arid regions. For individual trees, height mainly determines light capture ability, and the stem plays an important role in the efficiency of water transportation and mechanical support [30,34]. Therefore, vertical growth allows trees to compete for more light, becoming the primary growth mode before thinning when the plantation had high stem density and the canopy has not yet closed [48]. After thinning, the canopy state changed suddenly, leaving more growing space for the remaining trees, and reduced the competition among trees for water and light. As a result, these trees changed the original vertical growth mode and allocated more resources for diameter growth to maintain their spatial advantages and strengthen mechanical support and capacity of water transportation [30,49].

4.2. Thinning Effects on Stand Biomass

Based on different analysis methods, the results indicated that after a period of recovery, the sudden stand biomass loss after thinning could be compensated by enhanced tree growth in the 20-, 30-, 40-, and 50-year-old Chinese pine plantations, supporting hypothesis H2. Based on the results, stand biomass of the thinned stands could catch up to that of the unthinned stands after a period of recovery no greater than 20 years (Figure 2), and individual tree growth, especially radial growth, proved to be the most important contributor (Figure 3 and Figure 4). On the one hand, thinning management directly reduced stand density, and thus stand biomass, due to the loss of individual trees. On the other hand, as discussed above, thinning promoted the growth of individual trees, especially radial growth, due to increased space and decreased competition. As the stands aged, individual tree biomass accumulated faster in the thinned stands, and could eventually compensate for the stand biomass loss caused by thinning. Similar results have also been observed in beech [50,51], fir [52], and spruce [53] forests and natural tropical forests [30]. In a study about the relationships between stand density and the value of timber in an 80-year-old Scots pine forest in Poland, lower densities were beneficial to wood production and higher densities might have an advantage in forest biomass production [54]. Our study suggests that reasonable thinning management at an early stand age of a plantation might benefit forest biomass production, as it could reduce competition for water and other resources, especially for plantation forests in a semi-arid region. Eventually, appropriate management can improve both the production and quality of timber and the stand biomass.
Although we tried our best in site selection and biomass estimation, some uncertainties must be acknowledged in our study. First, the specific stand age was estimated based on the records of local afforestation history, which could result in some deviation between the actual stand age and the recorded stand age. Second, the Pinus tabulaeformis plantations were not actually continuously investigated in a plot. Instead, we used the stands at different ages to obtain a chronosequence of Pinus tabulaeformis plantations. Such a method is widely adopted in forest ecology studies, but it could induce uncertainties in the results. Third, as the three plots in each stand were sampled within a relatively small range, the representativeness of the plots might be limited. Therefore, a large-scale investigation with sufficient sample size and area are needed in further studies. In addition, the biomass of the trees was estimated with allometric equations as felling trees was not allowed, which could also cause some deviation from the real biomass [55].

5. Conclusions

In this study, we investigated and estimated the changes in tree individual growth and forest biomass along a chronosequence of 20-, 30-, 40-, and 50-year-old Chinese pine plantations under different thinning managements (thinned and unthinned) on the Loess Plateau. The results demonstrated that thinning promoted the growth of trees, especially radial growth, which compensated for the biomass loss caused by removing trees. Our results also indicated that different thinning strategies can be adopted in plantation forests according to the management goals. Furthermore, the overall stand biomass needs a certain number of years to recover, meaning that thinning can increase final stand biomass and carbon sequestration potential in the long term.

Supplementary Materials

The following supporting information can be downloaded at: https://www.mdpi.com/article/10.3390/f14081620/s1, Figure S1: Map of the studied site, stands and plots.

Author Contributions

Conceptualization, J.Z., Q.C. and Y.L.; methodology, J.Z., Q.C. and Y.L.; validation, J.Z. and Q.C.; formal analysis, Y.L. and Q.C.; investigation, J.Z., Q.C., Y.L., H.L., W.Z., B.C., L.Y. and M.L.; writing—original draft preparation, Y.L. and Q.C.; writing—review and editing, J.Z. and Q.C. All authors have read and agreed to the published version of the manuscript.

Funding

This work was funded by the National Key Research and Development Program of China (2022YFF1300402), the Key Talent Project of Gansu Province, and the Lanzhou City Chengguan District Science and Technology Planning Project (2022JSCX0003).

Data Availability Statement

Data are available upon reasonable request from the corresponding author.

Conflicts of Interest

The authors declare no conflict of interest.

References

  1. Li, Z.; Xiao, J.; Lu, G.; Sun, W.; Ma, C.; Jin, Y. Productivity and Profitability of Larix principis-rupprechtii and Pinus tabuliformis Plantation Forests in Northeast China. For. Policy Econ. 2020, 121, 102314. [Google Scholar] [CrossRef]
  2. Feng, Y.; Schmid, B.; Loreau, M.; Forrester, D.I.; Fei, S.; Zhu, J.; Tang, Z.; Zhu, J.; Hong, P.; Ji, C.; et al. Multispecies Forest Plantations Outyield Monocultures across a Broad Range of Conditions. Science 2022, 376, 865–868. [Google Scholar] [CrossRef] [PubMed]
  3. Fang, J.; Chen, A.; Peng, C.; Zhao, S.; Ci, L. Changes in Forest Biomass Carbon Storage in China between 1949 and 1998. Science 2001, 292, 2320–2322. [Google Scholar] [CrossRef] [PubMed]
  4. Sun, Z.; Peng, S.; Li, X.; Guo, Z.; Piao, S. Changes in Forest Biomass over China during the 2000s and Implications for Management. For. Ecol. Manag. 2015, 357, 76–83. [Google Scholar] [CrossRef]
  5. Loewe-Muñoz, V.; Balzarini, M.; Ortega González, M. Pure and Mixed Plantations of Persian Walnut (Juglans regia L.) for High Quality Timber Production in Chile, South America. J. Plant Ecol. 2020, 13, 12–19. [Google Scholar] [CrossRef]
  6. FAO. Global Forest Resources Assessment 2020; FAO: Rome, Italy, 2020.
  7. Zeng, W.; Tomppo, E.; Healey, S.P.; Gadow, K.V. The National Forest Inventory in China: History-Results-International Context. For. Ecosyst. 2015, 2, 23. [Google Scholar] [CrossRef] [Green Version]
  8. Wu, X.; Wei, Y.; Fu, B.; Wang, S.; Zhao, Y.; Moran, E.F. Evolution and Effects of the Social-Ecological System over a Millennium in China’s Loess Plateau. Sci. Adv. 2020, 6, eabc0276. [Google Scholar] [CrossRef]
  9. Wang, T.; Wu, J.; Kou, X.; Oliver, C.; Mou, P.; Ge, J. Ecologically Asynchronous Agricultural Practice Erodes Sustainability of the Loess Plateau of China. Ecol. Appl. 2010, 20, 1126–1135. [Google Scholar] [CrossRef]
  10. Zhao, G.; Mu, X.; Wen, Z.; Wang, F.; Gao, P. Soil Erosion and Eco-environment Changes in the Loess Plateau. Land Degrad. Dev. 2013, 24, 499–510. [Google Scholar] [CrossRef]
  11. Li, Y.; Piao, S.; Li, L.Z.X.; Chen, A.; Wang, X.; Ciais, P.; Huang, L.; Lian, X.; Peng, S.; Zeng, Z.; et al. Divergent Hydrological Response to Large-Scale Afforestation and Vegetation Greening in China. Sci. Adv. 2018, 4, eaar4182. [Google Scholar] [CrossRef] [Green Version]
  12. Fu, B.; Wang, S.; Liu, Y.; Liu, J.; Liang, W.; Miao, C. Hydrogeomorphic Ecosystem Responses to Natural and Anthropogenic Changes in the Loess Plateau of China. Annu. Rev. Earth Planet. Sci. 2017, 45, 223–243. [Google Scholar] [CrossRef]
  13. Augusto, L.; Boča, A. Tree Functional Traits, Forest Biomass, and Tree Species Diversity Interact with Site Properties to Drive Forest Soil Carbon. Nat. Commun. 2022, 13, 1097. [Google Scholar] [CrossRef]
  14. Li, Y.; Bao, W.; Bongers, F.; Chen, B.; Chen, G.; Guo, K.; Jiang, M.; Lai, J.; Lin, D.; Liu, C.; et al. Drivers of Tree Carbon Storage in Subtropical Forests. Sci. Total Environ. 2019, 654, 684–693. [Google Scholar] [CrossRef]
  15. Jucker, T.; Bongalov, B.; Burslem, D.F.R.P.; Nilus, R.; Dalponte, M.; Lewis, S.L.; Phillips, O.L.; Qie, L.; Coomes, D.A. Topography Shapes the Structure, Composition and Function of Tropical Forest Landscapes. Ecol. Lett. 2018, 21, 989–1000. [Google Scholar] [CrossRef] [Green Version]
  16. Hui, D.; Wang, J.; Le, X.; Shen, W.; Ren, H. Influences of Biotic and Abiotic Factors on the Relationship between Tree Productivity and Biomass in China. For. Ecol. Manag. 2012, 264, 72–80. [Google Scholar] [CrossRef]
  17. Liu, L.; Zeng, F.; Song, T.; Wang, K.; Du, H. Stand Structure and Abiotic Factors Modulate Karst Forest Biomass in Southwest China. Forests 2020, 11, 443. [Google Scholar] [CrossRef] [Green Version]
  18. Ali, A.; Yan, E.-R.; Chen, H.Y.H.; Chang, S.X.; Zhao, Y.-T.; Yang, X.-D.; Xu, M.-S. Stand Structural Diversity Rather than Species Diversity Enhances Aboveground Carbon Storage in Secondary Subtropical Forests in Eastern China. Biogeosciences 2016, 13, 4627–4635. [Google Scholar] [CrossRef] [Green Version]
  19. Dănescu, A.; Albrecht, A.T.; Bauhus, J. Structural Diversity Promotes Productivity of Mixed, Uneven-Aged Forests in Southwestern Germany. Oecologia 2016, 182, 319–333. [Google Scholar] [CrossRef]
  20. Ullah, F.; Gilani, H.; Sanaei, A.; Hussain, K.; Ali, A. Stand Structure Determines Aboveground Biomass across Temperate Forest Types and Species Mixture along a Local-Scale Elevational Gradient. For. Ecol. Manag. 2021, 486, 118984. [Google Scholar] [CrossRef]
  21. Noh, N.J.; Kim, C.; Bae, S.W.; Lee, W.K.; Yoon, T.K.; Muraoka, H.; Son, Y. Carbon and Nitrogen Dynamics in a Pinus Densiflora Forest with Low and High Stand Densities. J. Plant Ecol. 2013, 6, 368–379. [Google Scholar] [CrossRef] [Green Version]
  22. Ali, A. Forest Stand Structure and Functioning: Current Knowledge and Future Challenges. Ecol. Indic. 2019, 98, 665–677. [Google Scholar] [CrossRef]
  23. Yachi, S.; Loreau, M. Does Complementary Resource Use Enhance Ecosystem Functioning? A Model of Light Competition in Plant Communities. Ecol. Lett. 2007, 10, 54–62. [Google Scholar] [CrossRef] [PubMed]
  24. Waters, C.M.; Gonsalves, L.; Law, B.; Melville, G.; Toole, I.; Brassil, T.; Tap, P. The Effect of Thinning on Structural Attributes of a Low Rainfall Forest in Eastern Australia. For. Ecol. Manag. 2018, 409, 571–583. [Google Scholar] [CrossRef]
  25. Hu, J.; Herbohn, J.; Chazdon, R.L.; Baynes, J.; Vanclay, J.K. Above-Ground Biomass Recovery Following Logging and Thinning over 46 Years in an Australian Tropical Forest. Sci. Total Environ. 2020, 734, 139098. [Google Scholar] [CrossRef] [PubMed]
  26. Harrod, R.J.; Peterson, D.W.; Povak, N.A.; Dodson, E.K. Thinning and Prescribed Fire Effects on Overstory Tree and Snag Structure in Dry Coniferous Forests of the Interior Pacific Northwest. For. Ecol. Manag. 2009, 258, 712–721. [Google Scholar] [CrossRef]
  27. Duque Lazo, J.; Navarro-Cerrillo, R.; Sanchez-Salguero, R.; Rodriguez Vallejo, C. Is Thinning an Alternative When Trees Could Die in Response to Drought? The Case of Planted Pinus nigra and P. sylvestris Stands in Southern Spain. For. Ecol. Manag. 2019, 433, 313–324. [Google Scholar]
  28. Wertz, B.; Bembenek, M.; Karaszewski, Z.; Ochał, W.; Skorupski, M.; Strzeliński, P.; Węgiel, A.; Mederski, P.S. Impact of Stand Density and Tree Social Status on Aboveground Biomass Allocation of Scots Pine Pinus sylvestris L. Forests 2020, 11, 765. [Google Scholar] [CrossRef]
  29. McMahon, T. Size and Shape in Biology. Science 1973, 179, 1201–1204. [Google Scholar] [CrossRef]
  30. Bullock, S.H. Developmental Patterns of Tree Dimensions in a Neotropical Deciduous Forest. Biotropica 2000, 32, 42–52. [Google Scholar] [CrossRef]
  31. Deng, C.; Zhang, S.; Lu, Y.; Froese, R.E.; Ming, A.; Li, Q. Thinning Effects on the Tree Height-Diameter Allometry of Masson Pine (Pinus massoniana Lamb.). Forests 2019, 10, 1129. [Google Scholar] [CrossRef] [Green Version]
  32. Fedorová, B.; Kadavý, J.; Adamec, Z.; Kneifl, M.; Knott, R. Response of Diameter and Height Increment to Thinning in Oak–Hornbeam Coppice in the Southeastern Part of the Czech Republic. J. For. Sci. 2016, 62, 229–235. [Google Scholar] [CrossRef] [Green Version]
  33. Dwyer, J.M.; Fensham, R.; Buckley, Y.M. Restoration Thinning Accelerates Structural Development and Carbon Sequestration in an Endangered Australian Ecosystem. J. Appl. Ecol. 2010, 47, 681–691. [Google Scholar] [CrossRef]
  34. Moreno-Fernández, D.; Cañellas, I.; Calama, R.; Gordo, J.; Sánchez-González, M. Thinning Increases Cone Production of Stone Pine (Pinus pinea L.) Stands in the Northern Plateau (Spain). Ann. For. Sci. 2013, 70, 761–768. [Google Scholar] [CrossRef] [Green Version]
  35. Dobner, M.; Nicoletti, M.F.; Arce, J.E. Influence of Crown Thinning on Radial Growth Pattern of Pinus taeda in Southern Brazil. New For. 2019, 50, 437–454. [Google Scholar] [CrossRef]
  36. Valinger, E. Effects of Thinning and Nitrogen Fertilization on Stem Growth and Stem Form of Pinus sylvestris Trees. Scand. J. For. Res. 1992, 7, 219–228. [Google Scholar] [CrossRef]
  37. Pape, R. Influence of Thinning and Tree Diameter Class on the Development of Basic Density and Annual Ring Width in Picea abies. Scand. J. For. Res. 1999, 14, 27–37. [Google Scholar] [CrossRef]
  38. Duan, J.; Abduwali, D. Basic Theory and Methods of Afforestation. In Silviculture; Cristina Gonçalves, A., Ed.; IntechOpen: London, UK, 2021. [Google Scholar]
  39. Ara, M.; Barbeito, I.; Elfving, B.; Johansson, U.; Nilsson, U. Varying Rectangular Spacing Yields No Difference in Forest Growth and External Wood Quality in Coniferous Forest Plantations. For. Ecol. Manag. 2021, 489, 119040. [Google Scholar] [CrossRef]
  40. Zhou, G.; Yin, G.; Tang, X. Carbon Stocks of Forest Ecosystems in China: Biomass Equation; Science Press: Beijing, China, 2018. (In Chinese) [Google Scholar]
  41. Lai, J.; Zou, Y.; Zhang, J.; Peres-Neto, P.R. Generalizing Hierarchical and Variation Partitioning in Multiple Regression and Canonical Analyses Using the rdacca. hp R Package. Methods Ecol. Evol. 2022, 13, 782–788. [Google Scholar] [CrossRef]
  42. Niklas, K.J. The Scaling of Plant Height: A Comparison Among Major Plant Clades and Anatomical Grades. Ann. Bot. 1993, 72, 165–172. [Google Scholar] [CrossRef]
  43. Martínez-Vilalta, J.; Vanderklein, D.; Mencuccini, M. Tree Height and Age–Related Decline in Growth in Scots Pine (Pinus sylvestris L.). Oecologia 2006, 150, 529–544. [Google Scholar] [CrossRef]
  44. Kerr, G. The Effect of Heavy or “Free Growth” Thinning on Oak (Quercus petraea and Q. robur). Forestry 1996, 69, 303–317. [Google Scholar] [CrossRef] [Green Version]
  45. Makinen, H. Thinning Intensity and Growth of Norway Spruce Stands in Finland. Forestry 2004, 77, 349–364. [Google Scholar] [CrossRef] [Green Version]
  46. Missanjo, E.; Kamanga-Thole, G. Effect of First Thinning and Pruning on the Individual Growth of Pinus patula Tree Species. J. For. Res. 2015, 26, 827–831. [Google Scholar] [CrossRef]
  47. Wang, Z.; Yang, H.; Dong, B.; Zhou, M.; Ma, L.; Jia, Z.; Duan, J. Regeneration Response to Canopy Gap Size in a Chinese Pine Plantation: Species Diversity Patterns, Size Structures and Spatial Distributions. For. Ecol. Manag. 2017, 397, 97–107. [Google Scholar] [CrossRef]
  48. Moles, A.T.; Warton, D.I.; Warman, L.; Swenson, N.G.; Laffan, S.W.; Zanne, A.E.; Pitman, A.; Hemmings, F.A.; Leishman, M.R. Global Patterns in Plant Height. J. Ecol. 2009, 97, 923–932. [Google Scholar] [CrossRef]
  49. Botero, C.A.; Weissing, F.J.; Wright, J.; Rubenstein, D.R. Evolutionary Tipping Points in the Capacity to Adapt to Environmental Change. Proc. Natl. Acad. Sci. USA 2015, 112, 184–189. [Google Scholar] [CrossRef]
  50. Bosela, M.; Štefančík, I.; Marčiš, P.; Rubio-Cuadrado, Á.; Lukac, M. Thinning Decreases Above-Ground Biomass Increment in Central European Beech Forests but Does Not Change Individual Tree Resistance to Climate Events. Agric. For. Meteorol. 2021, 306, 108441. [Google Scholar] [CrossRef]
  51. Bouriaud, O.; Don, A.; Janssens, I.A.; Marin, G.; Schulze, E.D. Effects of forest management on biomass stocks in Romanian beech forests. For. Ecosyst. 2019, 6, 19. [Google Scholar] [CrossRef] [Green Version]
  52. Coletta, V.; Menguzzato, G.; Pellicone, G.; Veltri, A.; Marziliano, P.A. Effect of Thinning on Above-Ground Biomass Accumulation in a Douglas-Fir Plantation in Southern Italy. J. For. Res. 2016, 27, 1313–1320. [Google Scholar] [CrossRef]
  53. Eriksson, E. Thinning Operations and Their Impact on Biomass Production in Stands of Norway Spruce and Scots Pine. Biomass Bioenerg. 2006, 30, 848–854. [Google Scholar] [CrossRef]
  54. Węgiel, A.; Bembenek, M.; Łacka, A.; Mederski, P.S. Relationship between stand density and value of timber assortments: A case study for Scots pine stands in north-western Poland. N. Z. J. For. Sci. 2018, 48, 12. [Google Scholar] [CrossRef]
  55. Ma, S.-H.; Eziz, A.; Tian, D.; Yan, Z.-B.; Cai, Q.; Jiang, M.-W.; Ji, C.-J.; Fang, J.-Y. Size- and Age-Dependent Increases in Tree Stem Carbon Concentration: Implications for Forest Carbon Stock Estimations. J. Plant Ecol. 2020, 13, 233–240. [Google Scholar] [CrossRef]
Figure 1. Growth of diameter at breast height (DBH) (a) and height (b) of individual trees under different thinning managements (thinned and unthinned). The growth pattern of DBH and height of Pinus tabulaeformis were fitted with a logistic model. Grey dots represent the DBH and height of every individual tree in the plots. Thinned and unthinned stands are shown in light and dark green, respectively.
Forests 14 01620 g001
Figure 2. Individual tree biomass (a) and stand biomass (b) for the eight Pinus tabulaeformis plantation stands. Different letters indicate significant differences (p < 0.05) across different stands, via one-way analysis of variance. Thinned and unthinned stands are shown in light and dark green, respectively.
Forests 14 01620 g002
Figure 3. Relative effects of multiple predictors on stand biomass. The parameter estimates (standardized regression coefficients) of the model predictors are exhibited with 95% confidence intervals and the relative importance of each predictor. The relative effect of each of the four parts of predictors can be calculated as the percentage between the parameter estimate of the predictor and the sum of all parameter estimates. *** p < 0.001.
Forests 14 01620 g003
Figure 4. Structural equation model (SEM) of the effect of stand age, density, and individual tree growth on stand biomass. Solid black arrows indicate positive pathways, and solid red arrows indicate negative pathways. Arrow width is proportional to the standardized path coefficient. We marked path coefficients as standardized effect sizes near the arrow. DBH, diameter at breast height. **, p < 0.01; ***, p < 0.001. Model fit of the SEM was evaluated with a goodness of fit index (GFI), root mean square error of approximation (RMSEA), and chi-square (χ2) test.
Forests 14 01620 g004
Table 1. Stand characteristics of the eight types of Pinus tabulaeformis plantations (plot number = 24).
ManagementThinnedUnthinned
Stand (years)2030405020304050
Location36.08° N36.06° N36.11° N35.93° N36.08° N36.25° N36.11° N35.87° N
108.57° E108.10° E108.67° E108.29° E108.56° E108.57° E108.34° E108.30° E
Elevation (m)12251337125814261329142215981352
Slope (°, aspect)25 SE15 W20 NW10 N8 NW5 N5 NE20 SE
Mean DBH (cm)7.09.67.87.05.55.74.97.2
Max DBH (cm)11.613.813.313.211.510.610.611.4
Mean Height (m)7.69.611.611.36.39.89.611.3
Max Height (m)10.211.514.815.08.212.212.916.9
TBA (m2 ha−1)3.85.66.15.58.311.810.59.9
Stand Density17172258248323833575481648504008
(stems/ha−1)
Site index (m)9.279.7510.2210.697.248.6410.111.53
Stand area (ha)200200200200200200200200
Note: N, north; S, south; E, east; W, west; BA, basal area at breast height; Max DBH and Max Height, the maximum DBH and tree height, respectively. For each stand, the base age for site index was the corresponding stand age.
Table 2. Allometric equations for calculating aboveground biomass (AGB) and belowground biomass (BGB) of dominant tree species in this study.
SpeciesAGB (kg)BGB (kg)Species in This Study
Pinus tabulaeformis A G B = 0.0291 ( D 2 H ) 0.8932 + 0.0067 ( D 2 H ) 0.9870 + 0.0087 ( D 2 H ) 0.7947 B G B = 0.0091 ( D 2 H ) 0.9376 Pinus tabulaeformis
Quercus mongolica A G B = 0.0707 ( D 2 H ) 0.8490 + 0.0327 ( D 2 H ) 0.8520 + 0.0104 ( D 2 H ) 0.8545 B G B = 0.0592 ( D 2 H ) 0.8233 Quercus mongolica
Broad-leaved trees A G B = 0.0210 ( D 2 H ) 0.9642 + 0.0011 ( D 2 H ) 1.1909 + 0.0022 ( D 2 H ) 0.8595 B G B = 0.0530 ( D 2 H ) 0.7452 Acer pilosum, A. tataricum, Malus baccata
Note: AGB, aboveground biomass; BGB, belowground biomass; D, tree diameter at breast height (cm); H tree height (m).
Table 3. Comparisons among three models for the growth of DBH and height of trees. DBH, diameter at breast height; AIC, Akaike information criterion of each model.
Forest TypesVariablesModel NamedfAICR2p Value
ThinnedDBHlinear105161890.155<0.001
exponential105127780.121<0.001
logistic105120340.143<0.001
Heightlinear105148110.042<0.001
exponential105118510.028<0.001
logistic105134450.039<0.001
UnthinnedDBHlinear206011560.048<0.001
exponential206031140.0080.004
logistic206019010.036<0.001
Heightlinear206090710.334<0.001
exponential206040190.256<0.001
logistic206029780.328<0.001
Table 4. The impacts of thinning management and stand age on DBH, tree height, individual tree biomass, and stand biomass, based on one-way analysis of variance and paired t-test.
VariablesForest ManagementStand Age (Years)
20304050
DBH (cm)unthinned10.97 ± 0.32 b11.34 ± 0.88 b9.73 ± 1.12 b14.42 ± 0.38 a
thinned13.45 ± 0.51 b *14.06 ± 1.03 b15.53 ± 1.06 ab **18.88 ± 2.15 a
Height (m)unthinned6.25 ± 0.41 b9.81 ± 0.90 a9.76 ± 1.81 a11.32 ± 0.56 a
thinned7.47 ± 0.48 b *11.22 ± 0.65 a11.58 ± 0.92 a9.39 ± 0.95 ab *
Individual tree biomass
(kg)
unthinned27.38 ± 2.94 b38.78 ± 9.48 b39.87 ± 8.73 b67.47 ± 3.58 a
thinned42.75 ± 3.88 b *68.25 ± 11.23 ab82.77 ± 14.16 ab *91.96 ± 26.12 a
Stand biomass
(Mg ha−1)
unthinned97.69 ± 19.2 b186.76 ± 52.32 ab193.34 ± 75.56 ab268.70 ± 19.82 b
thinned72.52 ± 11.37 b151.63 ± 20.21 ab203.17 ± 33.15 a215.05 ± 53.55 a
Note: DBH, diameter at breast height. The data are presented as mean ± SD. Different letters indicate significant differences via one-way analysis of variance among different stand ages. A paired t-test was conducted between the thinned and unthinned stands (* p <0.05, ** p < 0.01).
Table 5. Direct, indirect, and total standardized effects of different variables on stand biomass based on the structural equation model (SEM) in Figure 4.
PredictorDirect EffectsIndirect EffectsTotal Effects
Stand biomass
Thinning−0.360.11−0.25
Stand age0.000.750.75
Density0.54−0.090.45
DBH0.850.000.85
Height0.500.000.50
Disclaimer/Publisher’s Note: The statements, opinions and data contained in all publications are solely those of the individual author(s) and contributor(s) and not of MDPI and/or the editor(s). MDPI and/or the editor(s) disclaim responsibility for any injury to people or property resulting from any ideas, methods, instructions or products referred to in the content.

