Alnus Airborne Pollen Trends during the Last 26 Years for Improving Machine Learning-Based Forecasting Methods

 , , , , ,
  , and
, and
Abstract
:1. Introduction
2. Materials and Methods
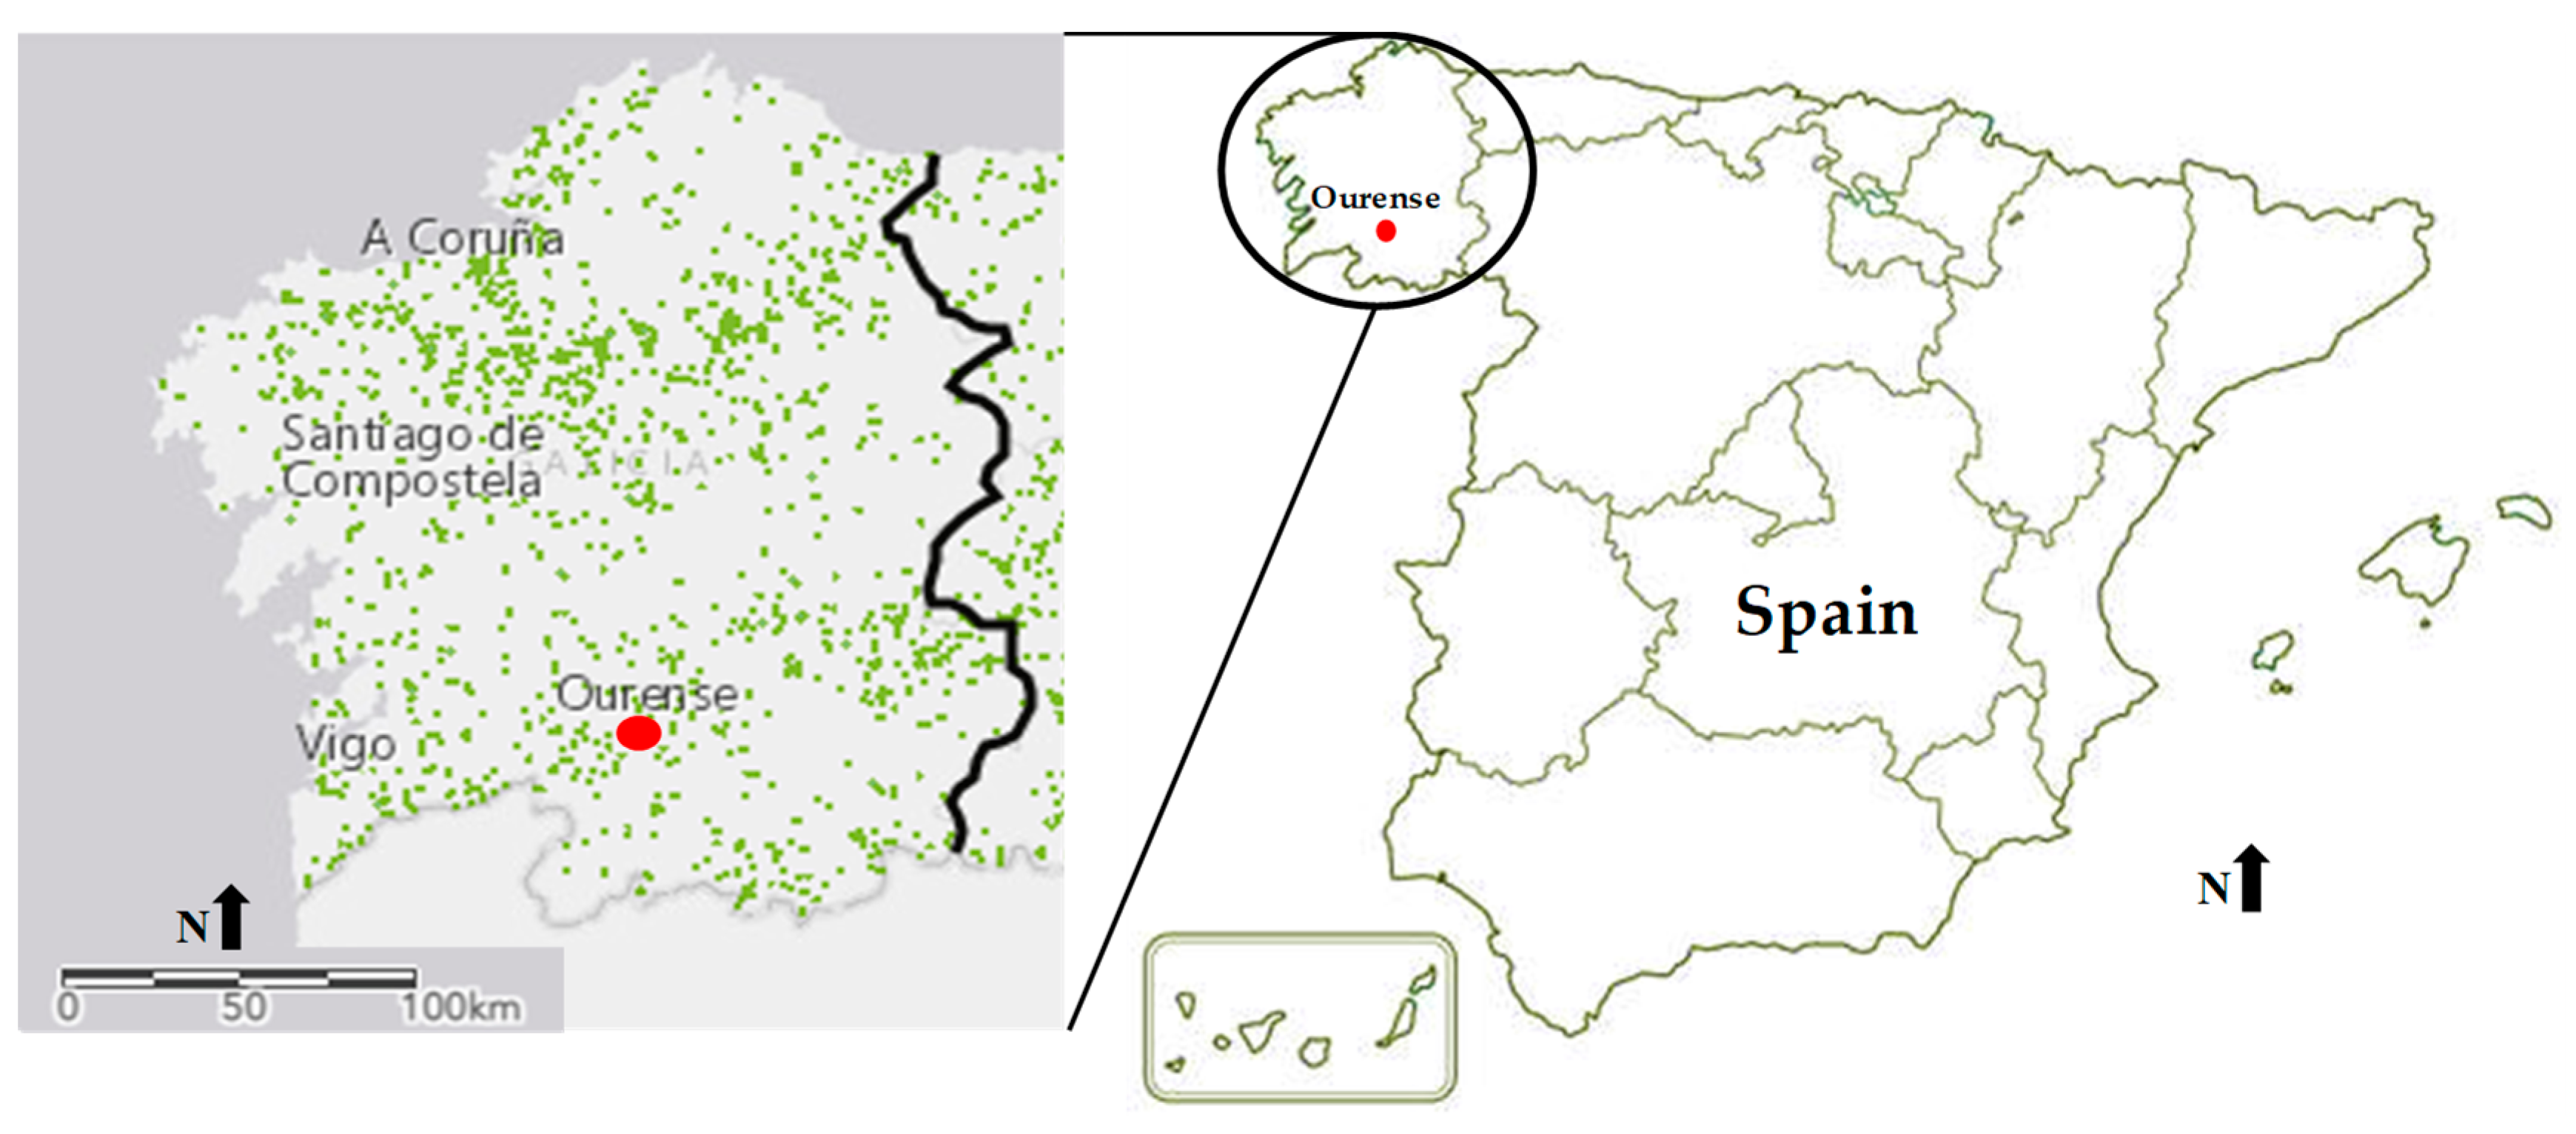
2.1. Characterization and Location of Study Area
2.2. Airborne Pollen
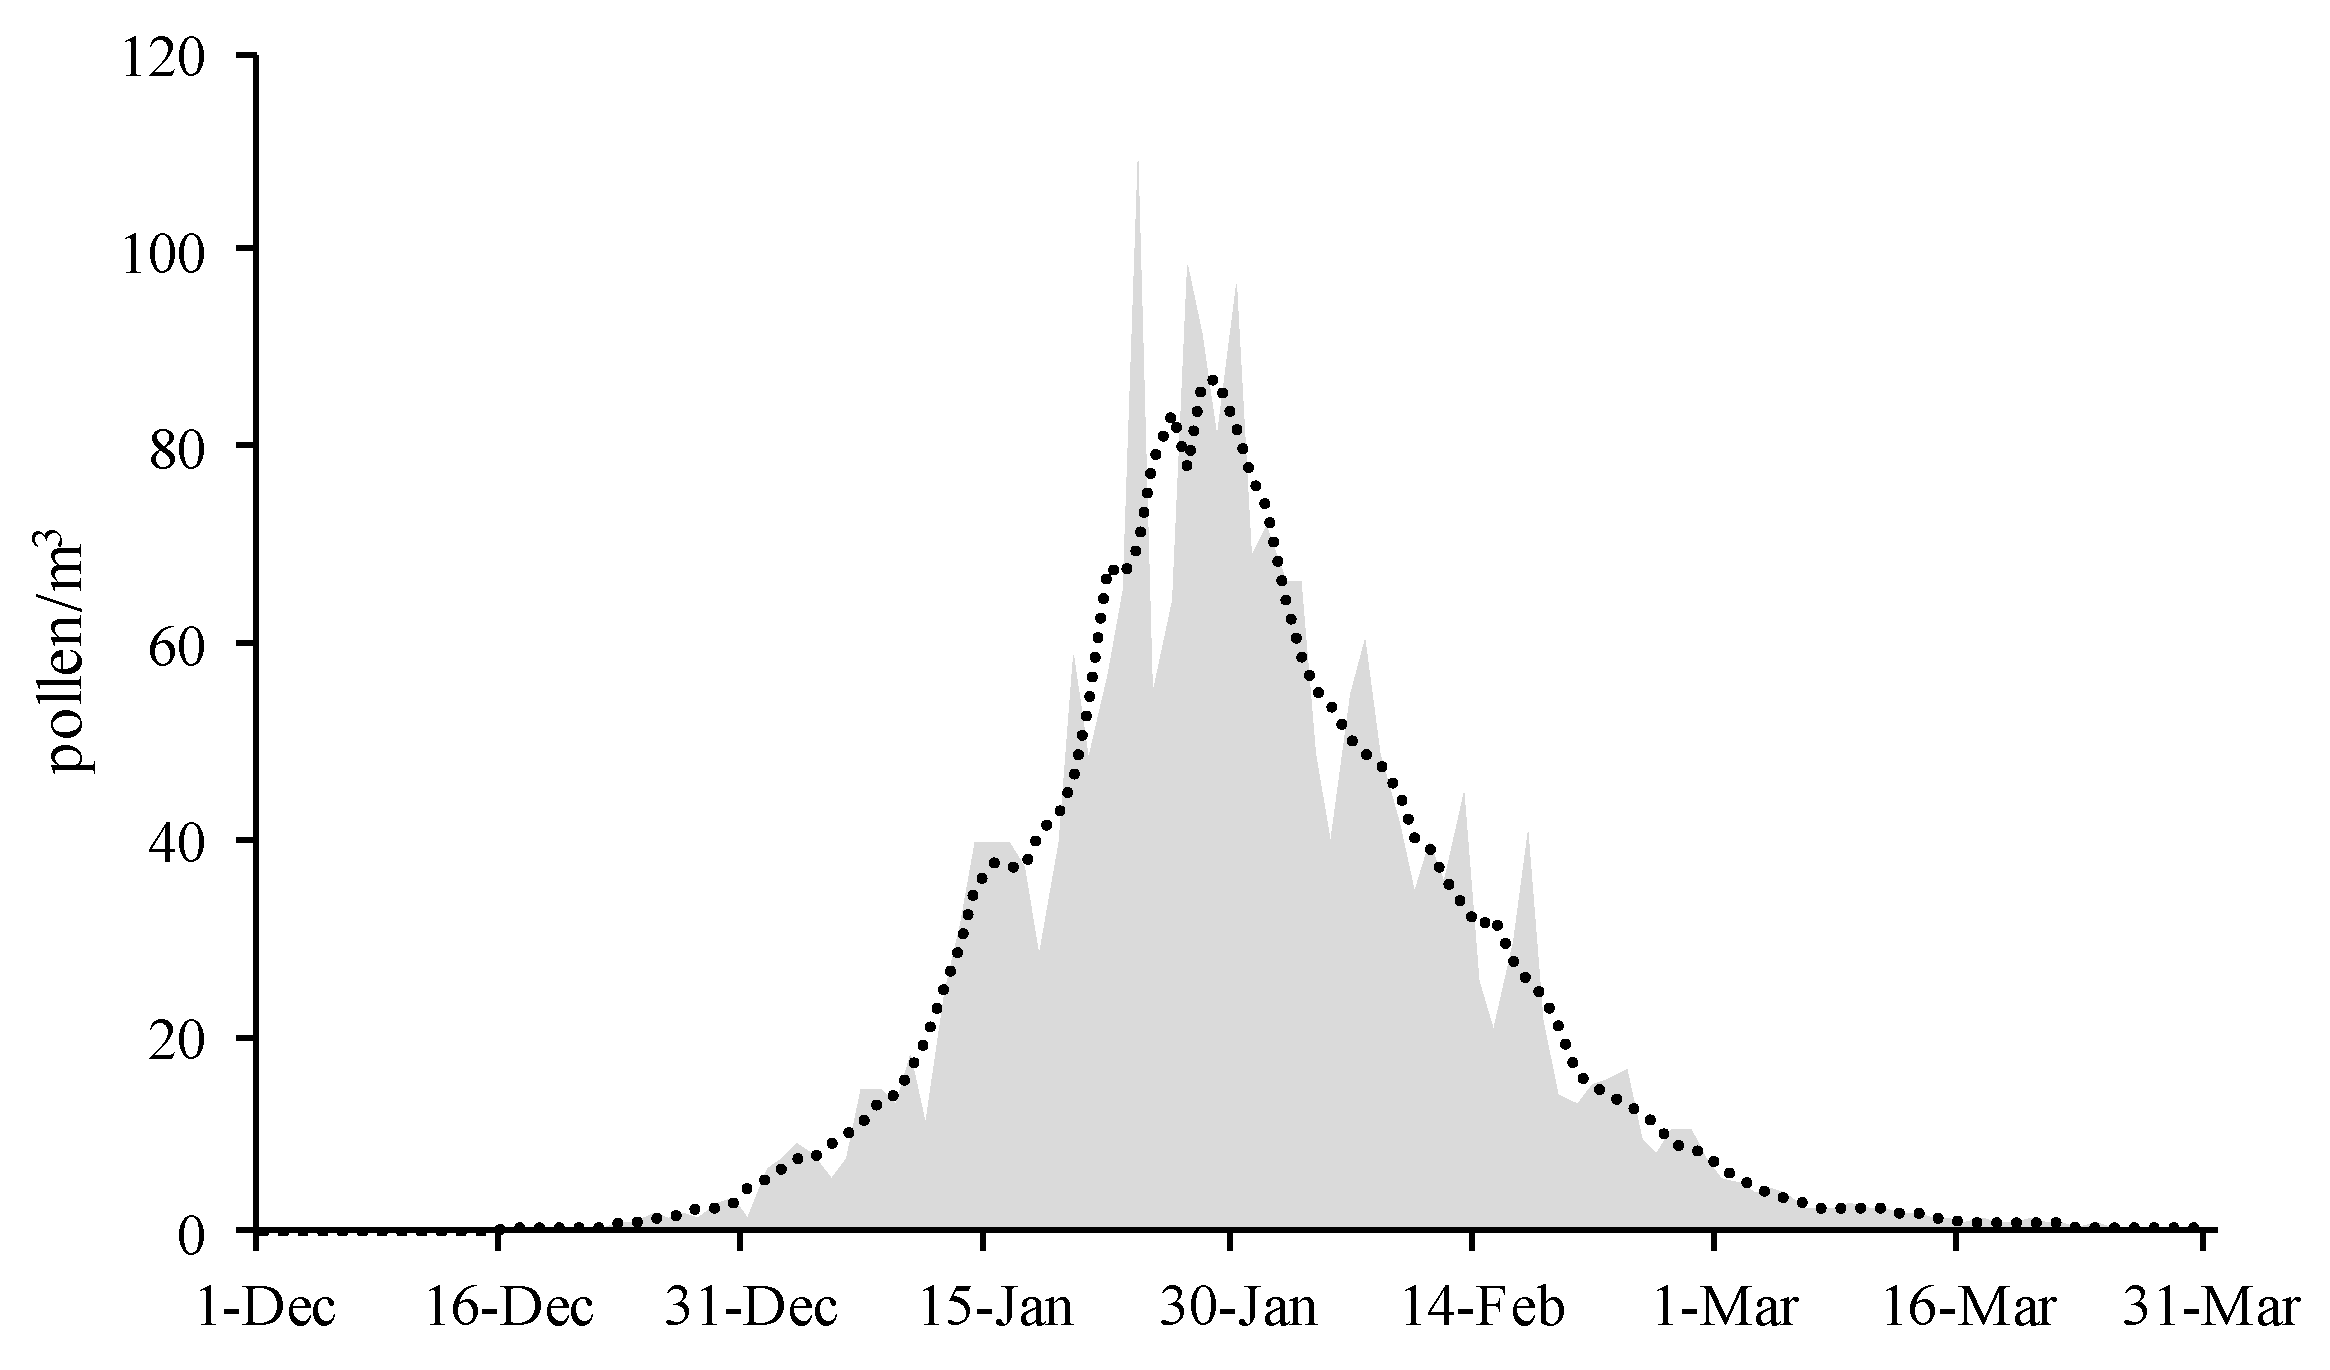
2.3. Main Pollen Season and ML Pollen Period
2.4. Meteorological Data
2.5. Statistical Analysis
2.5.1. Correlation Analysis
2.5.2. Machine Learning Models
3. Results
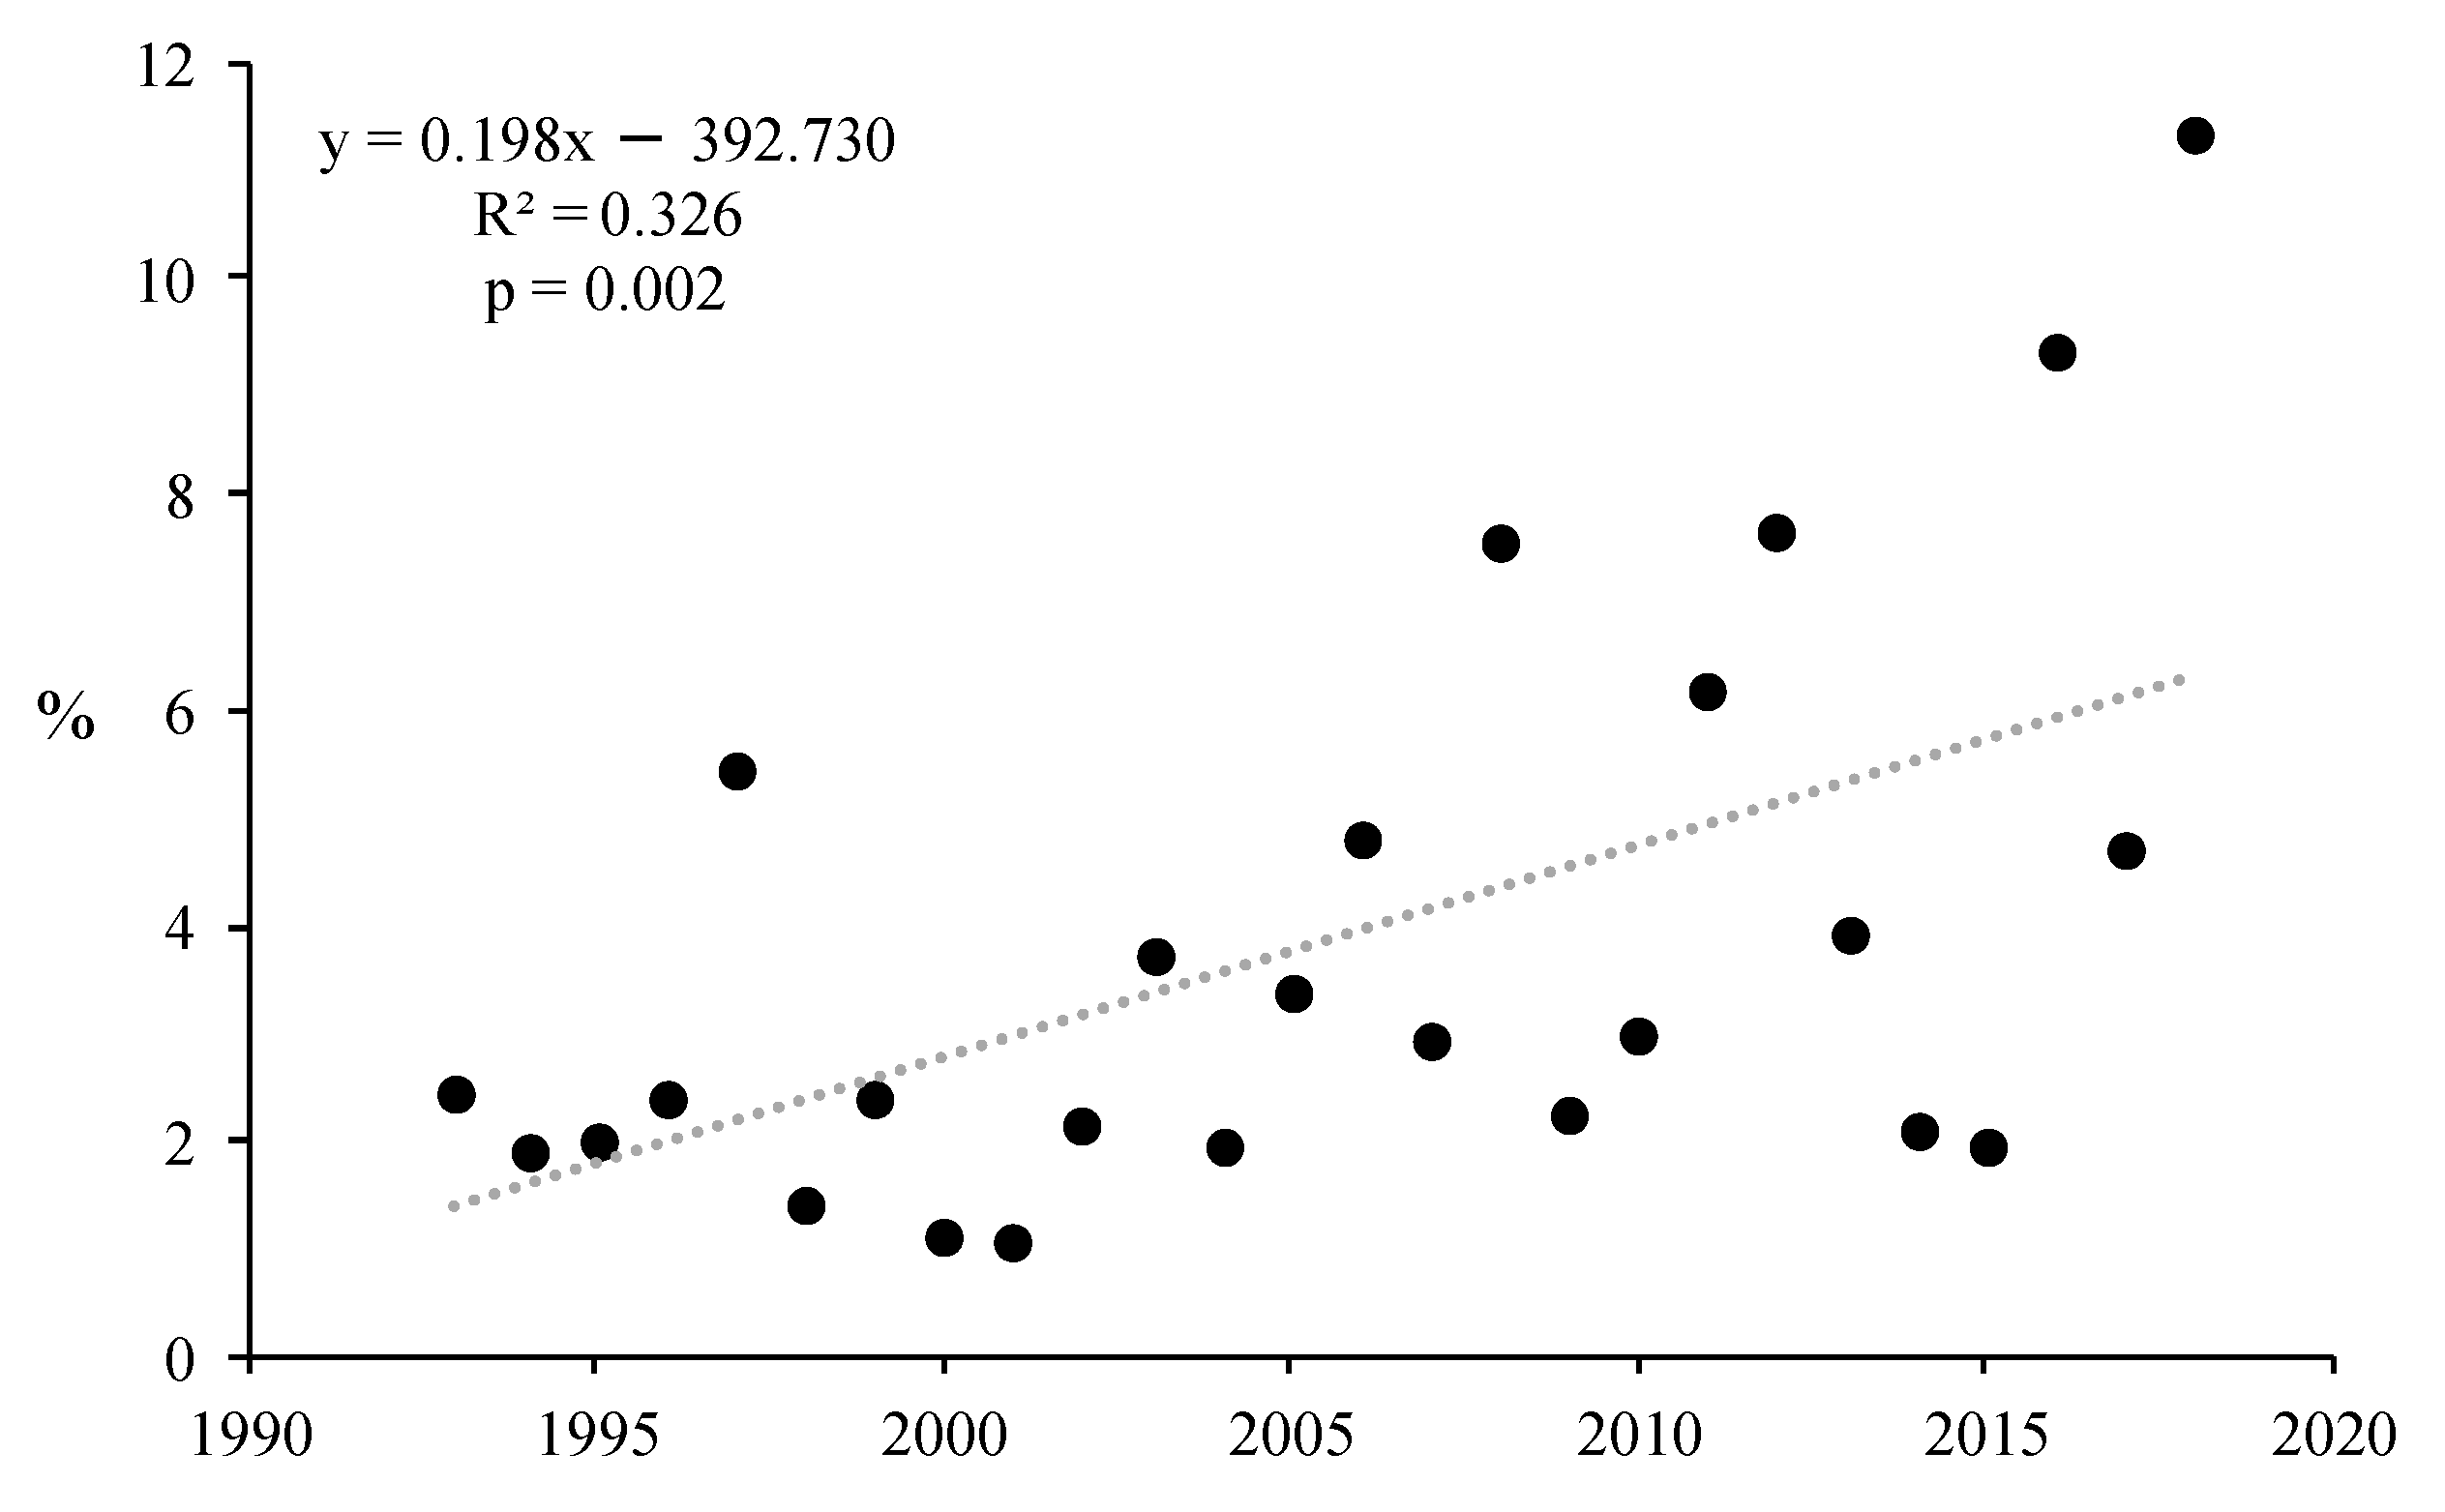
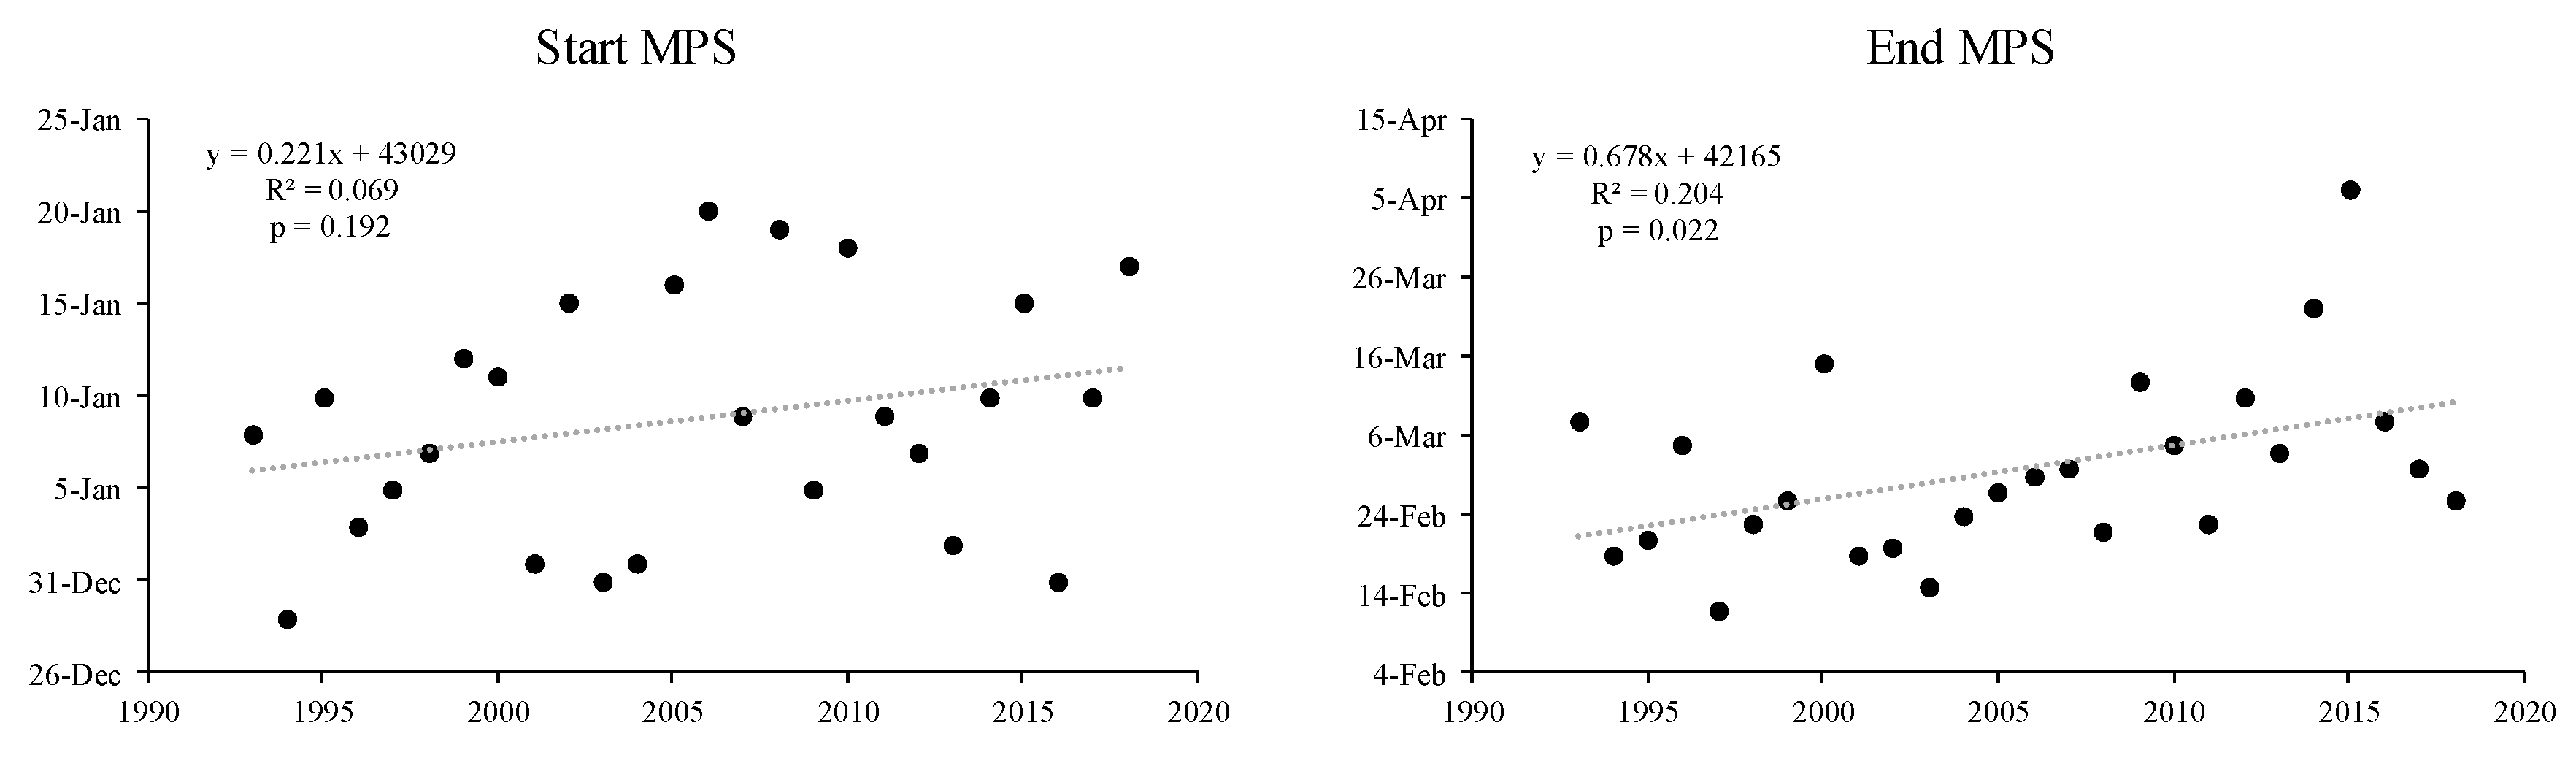
4. Discussion
5. Conclusions
Author Contributions
Funding
Data Availability Statement
Acknowledgments
Conflicts of Interest
References
- Claessens, H.; Oosterbaan, A.; Savill, P.; Rondeux, J. A Review of the Characteristics of Black Alder (Alnus glutinosa (L.) Gaertn.) and Their Implications for Silvicultural Practices. Forestry 2010, 83, 163–175. [Google Scholar] [CrossRef] [Green Version]
- Kajba, D.; Gračan, J. Technical Guidelines for Genetic Conservation and Use Black Alder (Alnus glutinosa); IPGRI: Rome, Italy, 2003; p. 4. [Google Scholar]
- Josef, T.; Gösta, E.; Jochen, K.; Sonja, C. Noble Hardwoods Network. Report of the First Meeting; European Forest Genetic Resources Programme (EUFORGEN): Rome, Italy, 1996; ISBN 92-9043-291-8. [Google Scholar]
- Lecomte, H.; Florkin, P.; Morimont, J.-P. La Forêt Wallonne: État de la Ressource à la fin du 20ème Siècle; Ministère de la Région wallonne. Direction Générale des Ressources Naturelles et de L’environnement: Jambes, Belgium, 2002.
- Debruxelles, N.; Chandelier, A.; Dufays, E.; Claessens, H.; Cavelier, M.; Rondeux, J. Le Dépérissement de l’aulne En Wallonie. Silva Belg. 2007, 114, 2–5. [Google Scholar]
- Damialis, A.; Traidl-Hoffmann, C.; Treudler, R. Climate Change and Pollen Allergies. In Biodiversity and Health in the Face of Climate Change; Marselle, M.R., Stadler, J., Korn, H., Irvine, K.N., Bonn, A., Eds.; Springer International Publishing: Cham, Switzerland, 2019; pp. 47–66. ISBN 978-3-030-02318-8. [Google Scholar]
- Traidl-Hoffmann, C. Allergie—Eine Umwelterkrankung! Bundesgesundheitsblatt Gesundheitsforsch. Gesundheitsschutz 2017, 60, 584–591. [Google Scholar] [CrossRef]
- Nicolaou, N.; Siddique, N.; Custovic, A. Allergic Disease in Urban and Rural Populations: Increasing Prevalence with Increasing Urbanization. Allergy 2005, 60, 1357–1360. [Google Scholar] [CrossRef]
- Bosch-Cano, F.; Bernard, N.; Sudre, B.; Gillet, F.; Thibaudon, M.; Richard, H.; Badot, P.-M.; Ruffaldi, P. Human Exposure to Allergenic Pollens: A Comparison between Urban and Rural Areas. Environ. Res. 2011, 111, 619–625. [Google Scholar] [CrossRef] [Green Version]
- D’Amato, G.; Chong-Neto, H.J.; Monge Ortega, O.P.; Vitale, C.; Ansotegui, I.; Rosario, N.; Haahtela, T.; Galan, C.; Pawankar, R.; Murrieta-Aguttes, M.; et al. The Effects of Climate Change on Respiratory Allergy and Asthma Induced by Pollen and Mold Allergens. Allergy 2020, 75, 2219–2228. [Google Scholar] [CrossRef] [PubMed]
- D’Amato, G.; Cecchi, L. Effects of Climate Change on Environmental Factors in Respiratory Allergic Diseases. Clin. Exp. Allergy 2008, 38, 1264–1274. [Google Scholar] [CrossRef]
- Weber, R.W. Meteorologic Variables in Aerobiology. Immunol. Allergy Clin. N. Am. 2003, 23, 411–422. [Google Scholar] [CrossRef]
- Frei, T.; Gassner, E. Climate Change and Its Impact on Birch Pollen Quantities and the Start of the Pollen Season an Example from Switzerland for the Period 1969–2006. Int. J. Biometeorol. 2008, 52, 667–674. [Google Scholar] [CrossRef]
- Adams-Groom, B.; Selby, K.; Derrett, S.; Frisk, C.A.; Pashley, C.H.; Satchwell, J.; King, D.; McKenzie, G.; Neilson, R. Pollen Season Trends as Markers of Climate Change Impact: Betula, Quercus and Poaceae. Sci. Total Environ. 2022, 831, 154882. [Google Scholar] [CrossRef]
- Ariano, R.; Canonica, G.W.; Passalacqua, G. Possible Role of Climate Changes in Variations in Pollen Seasons and Allergic Sensitizations during 27 Years. Ann. Allergy Asthma Immunol. 2010, 104, 215–222. [Google Scholar] [CrossRef] [PubMed]
- van Vliet, A.J.H.; Overeem, A.; De Groot, R.S.; Jacobs, A.F.G.; Spieksma, F.T.M. The Influence of Temperature and Climate Change on the Timing of Pollen Release in the Netherlands. Int. J. Climatol. 2002, 22, 1757–1767. [Google Scholar] [CrossRef]
- Ziska, L.H.; Makra, L.; Harry, S.K.; Bruffaerts, N.; Hendrickx, M.; Coates, F.; Saarto, A.; Thibaudon, M.; Oliver, G.; Damialis, A.; et al. Temperature-Related Changes in Airborne Allergenic Pollen Abundance and Seasonality across the Northern Hemisphere: A Retrospective Data Analysis. Lancet Planet. Health 2019, 3, e124–e131. [Google Scholar] [CrossRef] [Green Version]
- Bruffaerts, N.; De Smedt, T.; Delcloo, A.; Simons, K.; Hoebeke, L.; Verstraeten, C.; Van Nieuwenhuyse, A.; Packeu, A.; Hendrickx, M. Comparative Long-Term Trend Analysis of Daily Weather Conditions with Daily Pollen Concentrations in Brussels, Belgium. Int. J. Biometeorol. 2018, 62, 483–491. [Google Scholar] [CrossRef] [Green Version]
- de Weger, L.A.; Bruffaerts, N.; Koenders, M.M.J.F.; Verstraeten, W.W.; Delcloo, A.W.; Hentges, P.; Hentges, F. Long-Term Pollen Monitoring in the Benelux: Evaluation of Allergenic Pollen Levels and Temporal Variations of Pollen Seasons. Front. Allergy 2021, 2, 676176. [Google Scholar] [CrossRef] [PubMed]
- Frenguelli, G. Interactions between Climatic Changes and Allergenic Plants. Monaldi Arch. Chest Dis. = Arch. Monaldi Mal. Torace 2002, 57, 141–143. [Google Scholar]
- Gehrig, R.; Clot, B. 50 Years of Pollen Monitoring in Basel (Switzerland) Demonstrate the Influence of Climate Change on Airborne Pollen. Front. Allergy 2021, 2, 677159. [Google Scholar] [CrossRef]
- Glick, S.; Gehrig, R.; Eeftens, M. Multi-Decade Changes in Pollen Season Onset, Duration, and Intensity: A Concern for Public Health? Sci. Total Environ. 2021, 781, 146382. [Google Scholar] [CrossRef]
- Jochner-Oette, S.; Menzel, A.; Gehrig, R.; Clot, B. Decrease or Increase? Temporal Changes in Pollen Concentrations Assessed by Bayesian Statistics. Aerobiologia 2019, 35, 153–163. [Google Scholar] [CrossRef]
- Lind, T.; Ekebom, A.; Alm Kübler, K.; Östensson, P.; Bellander, T.; Lõhmus, M. Pollen Season Trends (1973–2013) in Stockholm Area, Sweden. PLoS ONE 2016, 11, e0166887. [Google Scholar] [CrossRef] [Green Version]
- Ruiz-Valenzuela, L.; Aguilera, F. Trends in Airborne Pollen and Pollen-Season-Related Features of Anemophilous Species in Jaen (South Spain): A 23-Year Perspective. Atmos. Environ. 2018, 180, 234–243. [Google Scholar] [CrossRef]
- D’Amato, G.; Cecchi, L.; D’Amato, M.; Liccardi, G. Urban Air Pollution and Climate Change as Environmental Risk Factors of Respiratory Allergy: An Update. J. Investig. Allergol. Clin. Immunol. 2010, 20, 95–102; quiz following 102. [Google Scholar]
- Buters, J.T.M.; Thibaudon, M.; Smith, M.; Kennedy, R.; Rantio-Lehtimäki, A.; Albertini, R.; Reese, G.; Weber, B.; Galan, C.; Brandao, R.; et al. Release of Bet v 1 from Birch Pollen from 5 European Countries. Results from the HIALINE Study. Atmos. Environ. 2012, 55, 496–505. [Google Scholar] [CrossRef] [Green Version]
- Buters, J.; Alberternst, B.; Nawrath, S.; Wimmer, M.; Traidl-Hoffmann, C.; Starfinger, U.; Behrendt, H.; Schmidt-Weber, C.; Bergmann, K.-C. Ambrosia Artemisiifolia (Ragweed) in Germany—Current Presence, Allergological Relevance and Containment Procedures. Allergo J. Int. 2015, 24, 108–120. [Google Scholar] [CrossRef] [PubMed] [Green Version]
- Bahbah, F.; Gentil, C.; Sousa-Pinto, B.; Canonica, G.W.; Devillier, P.; Pfaar, O.; Bousquet, J. Patient-reported Outcome Measures in Birch Pollen Allergic Patients Treated with Sublingual Immunotherapy Reflect Real Life. Allergy 2023, 78, 1113–1116. [Google Scholar] [CrossRef]
- Berge, M.; Bertilsson, L.; Hultgren, O.; Hugosson, S.; Saber, A. Qualitative and Quantitative Comparison of Allergen Component-Specific to Birch and Grass Analyzed by ImmunoCAP Assay and Euroline Immunoblot Test. Eur. Ann. Allergy Clin. Immunol. 2023, 55, 68. [Google Scholar] [CrossRef]
- Fernández-González, M.; Ribeiro, H.; Rodríguez-Rajo, F.J.; Cruz, A.; Abreu, I. Short-Term Exposure of Dactylis Glomerata Pollen to Atmospheric Gaseous Pollutants Is Related to an Increase in IgE Binding in Patients with Grass Pollen Allergies. Plants 2022, 12, 76. [Google Scholar] [CrossRef] [PubMed]
- Pfaar, O.; Karatzas, K.; Bastl, K.; Berger, U.; Buters, J.; Darsow, U.; Demoly, P.; Durham, S.R.; Galán, C.; Gehrig, R.; et al. Pollen Season Is Reflected on Symptom Load for Grass and Birch Pollen-induced Allergic Rhinitis in Different Geographic Areas—An EAACI Task Force Report. Allergy 2020, 75, 1099–1106. [Google Scholar] [CrossRef] [PubMed] [Green Version]
- de Weger, L.A.; Bergmann, K.C.; Rantio-Lehtimäki, A.; Dahl, Å.; Buters, J.; Déchamp, C.; Belmonte, J.; Thibaudon, M.; Cecchi, L.; Besancenot, J.-P.; et al. Impact of Pollen. In Allergenic Pollen; Springer: Dordrecht, The Netherlands, 2013; pp. 161–215. [Google Scholar]
- Steckling-Muschack, N.; Mertes, H.; Mittermeier, I.; Schutzmeier, P.; Becker, J.; Bergmann, K.-C.; Böse-O′Reilly, S.; Buters, J.; Damialis, A.; Heinrich, J.; et al. A Systematic Review of Threshold Values of Pollen Concentrations for Symptoms of Allergy. Aerobiologia 2021, 37, 395–424. [Google Scholar] [CrossRef]
- Kiotseridis, H.; Cilio, C.M.; Bjermer, L.; Tunsäter, A.; Jacobsson, H.; Dahl, Å. Grass Pollen Allergy in Children and Adolescents-symptoms, Health Related Quality of Life and the Value of Pollen Prognosis. Clin. Transl. Allergy 2013, 3, 19. [Google Scholar] [CrossRef] [Green Version]
- Lo, F.; Bitz, C.M.; Hess, J.J. Development of a Random Forest Model for Forecasting Allergenic Pollen in North America. Sci. Total Environ. 2021, 773, 145590. [Google Scholar] [CrossRef] [PubMed]
- Nowosad, J. Spatiotemporal Models for Predicting High Pollen Concentration Level of Corylus, Alnus, and Betula. Int. J. Biometeorol. 2016, 60, 843–855. [Google Scholar] [CrossRef] [PubMed] [Green Version]
- Scheifinger, H.; Belmonte, J.; Buters, J.; Celenk, S.; Damialis, A.; Dechamp, C.; García-Mozo, H.; Gehrig, R.; Grewling, L.; Halley, J.M.; et al. Monitoring, Modelling and Forecasting of the Pollen Season. In Allergenic Pollen; Springer: Dordrecht, The Netherlands, 2013; pp. 71–126. [Google Scholar]
- Zewdie, G.K.; Liu, X.; Wu, D.; Lary, D.J.; Levetin, E. Applying Machine Learning to Forecast Daily Ambrosia Pollen Using Environmental and NEXRAD Parameters. Environ. Monit. Assess. 2019, 191, 261. [Google Scholar] [CrossRef]
- Seka, D.; Bonny, B.S.; Yoboué, A.N.; Sié, S.R.; Adopo-Gourène, B.A. Identification of Maize (Zea mays L.) Progeny Genotypes Based on Two Probabilistic Approaches: Logistic Regression and Naïve Bayes. Artif. Intell. Agric. 2019, 1, 9–13. [Google Scholar] [CrossRef]
- Valencia, J.A.; Astray, G.; Fernández-González, M.; Aira, M.J.; Rodríguez-Rajo, F.J. Assessment of Neural Networks and Time Series Analysis to Forecast Airborne Parietaria Pollen Presence in the Atlantic Coastal Regions. Int. J. Biometeorol. 2019, 63, 735–745. [Google Scholar] [CrossRef]
- Astray, G.; Fernández-González, M.; Rodríguez-Rajo, F.J.; López, D.; Mejuto, J.C. Airborne Castanea Pollen Forecasting Model for Ecological and Allergological Implementation. Sci. Total Environ. 2016, 548–549, 110–121. [Google Scholar] [CrossRef]
- Suanno, C.; Aloisi, I.; Fernández-González, D.; Del Duca, S. Pollen Forecasting and Its Relevance in Pollen Allergen Avoidance. Environ. Res. 2021, 200, 111150. [Google Scholar] [CrossRef] [PubMed]
- Guía Resumida Del Clima En España (1981–2010); Agencia Estatal de Meterorología: Madrid, Spain, 2012; Available online: http://www.aemet.es/ (accessed on 1 June 2023).
- Hirst, J.M. An automatic volumetric spore trap. Ann. Appl. Biol. 1952, 39, 257–265. [Google Scholar] [CrossRef]
- Galán, C.; Cariñanos, P.; Alcázar, P.; Domínguez, E. Spanish Aerobiology Network: Management and Quality Manual; Servicio de publicaciones de la Universidad de Córdoba: Córdoba, Spain, 2007. [Google Scholar]
- Galán, C.; Ariatti, A.; Bonini, M.; Clot, B.; Crouzy, B.; Dahl, A.; Fernandez-González, D.; Frenguelli, G.; Gehrig, R.; Isard, S.; et al. Recommended Terminology for Aerobiological Studies. Aerobiologia 2017, 33, 293–295. [Google Scholar] [CrossRef]
- Rojo, J.; Picornell, A.; Oteros, J. AeRobiology: The Computational Tool for Biological Data in the Air. Methods Ecol. Evol. 2019, 10, 1371–1376. [Google Scholar] [CrossRef] [Green Version]
- Andersen, T.B. A Model to Predict the Beginning of the Pollen Season. Grana 1991, 30, 269–275. [Google Scholar] [CrossRef] [Green Version]
- Haibo, H.; Garcia, E.A. Learning from Imbalanced Data. IEEE Trans. Knowl. Data Eng. 2009, 21, 1263–1284. [Google Scholar] [CrossRef]
- Breiman, L. Classification and Regression Trees; Routledge: London, UK, 2017. [Google Scholar]
- Ramchoun, H.; Amine, M.; Idrissi, J.; Ghanou, Y.; Ettaouil, M. Multilayer Perceptron: Architecture Optimization and Training. Int. J. Interact. Multimed. Artif. Intell. 2016, 4, 26. [Google Scholar] [CrossRef] [Green Version]
- Szandała, T. Review and Comparison of Commonly Used Activation Functions for Deep Neural Networks. In Bio-inspired Neurocomputing; Springer: Berlin/Heidelberg, Germany, 2021; pp. 203–224. [Google Scholar]
- Zhang, Z. Improved Adam Optimizer for Deep Neural Networks. In Proceedings of the 2018 IEEE/ACM 26th International Symposium on Quality of Service (IWQoS), Banff, AB, Canada, 4–6 June 2018; IEEE: New York, NY, USA, 2018; pp. 1–2. [Google Scholar]
- Cohen, J. A Coefficient of Agreement for Nominal Scales. Educ. Psychol. Meas. 1960, 20, 37–46. [Google Scholar] [CrossRef]
- Heydarian, M.; Doyle, T.E.; Samavi, R. MLCM: Multi-Label Confusion Matrix. IEEE Access 2022, 10, 19083–19095. [Google Scholar] [CrossRef]
- Perez-Badia, R.; Rapp, A.; Morales, C.; Sardinero, S.; Galan, C.; Garcia-Mozo, H. Pollen Spectrum and Risk of Pollen Allergy in Central Spain. Ann. Agric. Environ. Med. 2010, 17, 139–151. [Google Scholar] [PubMed]
- Oteros, J.; Galán, C.; Alcázar, P.; Domínguez-Vilches, E. Quality Control in Bio-Monitoring Networks, Spanish Aerobiology Network. Sci. Total Environ. 2013, 443, 559–565. [Google Scholar] [CrossRef]
- De Linares, C.; Alcázar, P.; Valle, A.M.; Díaz de la Guardia, C.; Galán, C. Parietaria Major Allergens vs Pollen in the Air We Breathe. Environ. Res. 2019, 176, 108514. [Google Scholar] [CrossRef]
- Lara, B.; Rojo, J.; Costa, A.R.; Burgos-Montero, A.M.; Antunes, C.M.; Pérez-Badia, R. Atmospheric Pollen Allergen Load and Environmental Patterns in Central and Southwestern Iberian Peninsula. Sci. Total Environ. 2023, 858, 159630. [Google Scholar] [CrossRef] [PubMed]
- Jato, M.V.; Rodríguez-Rajo, F.J.; Aira, M.J.; Tedeschini, E.; Frenguelli, G. Differences in Atmospheric Trees Pollen Seasons in Winter, Spring and Summer in Two European Geographic Areas, Spain and Italy. Aerobiologia 2013, 29, 263–278. [Google Scholar] [CrossRef]
- Rojo, J.; Fernández-González, F.; Lara, B.; Bouso, V.; Crespo, G.; Hernández-Palacios, G.; Rodríguez-Rojo, M.P.; Rodríguez-Torres, A.; Smith, M.; Pérez-Badia, R. The Effects of Climate Change on the Flowering Phenology of Alder Trees in Southwestern Europe. Mediterr. Bot. 2021, 42, e67360. [Google Scholar] [CrossRef]
- Gassner, M.; Gehrig, R.; Schmid-Grendelmeier, P. Hay Fever as a Christmas Gift. N. Engl. J. Med. 2013, 368, 393–394. [Google Scholar] [CrossRef] [PubMed] [Green Version]
- Bastl, K.; Kmenta, M.; Berger, U. Unusually Early Flowering of Alder in Vienna: First Report of Alnus × Spaethii in Austria, Combined LM and SEM Study of Alder Species and Impact on Pollen Allergy Sufferers. Aerobiologia 2015, 31, 515–524. [Google Scholar] [CrossRef]
- Ślusarczyk, J.; Kopacz-Bednarska, A.; Posłowska, J. Influence of Meteorological Factors on the Dynamics of Hazel, Alder, Birch and Poplar Pollen in the 2021 Season in Kielce, Poland. Ann. Agric. Environ. Med. 2022, 29, 502–512. [Google Scholar] [CrossRef] [PubMed]
- Uğuz, U.; Güvensen, A.; Tort, N.Ş.; Dereboylu, A.E.; Baran, P. Volumetric Analysis of Airborne Pollen Grains in the City of Uşak, Turkey. Turk. J. Bot. 2018, 42, 57–72. [Google Scholar] [CrossRef]
- Kim, K.R.; Oh, J.-W.; Woo, S.-Y.; Seo, Y.A.; Choi, Y.-J.; Kim, H.S.; Lee, W.Y.; Kim, B.-J. Does the Increase in Ambient CO2 Concentration Elevate Allergy Risks Posed by Oak Pollen? Int. J. Biometeorol. 2018, 62, 1587–1594. [Google Scholar] [CrossRef]
- Ziska, L.H.; Caulfield, F.A. Rising CO2 and Pollen Production of Common Ragweed (Ambrosia artemisiifolia L.), a Known Allergy-Inducing Species: Implications for Public Health. Funct. Plant Biol. 2000, 27, 893. [Google Scholar] [CrossRef]
- Ščevková, J.; Dušička, J.; Hrabovský, M.; Vašková, Z. Trends in Pollen Season Characteristics of Alnus, Poaceae and Artemisia Allergenic Taxa in Bratislava, Central Europe. Aerobiologia 2021, 37, 707–717. [Google Scholar] [CrossRef]
- Anderegg, W.R.L.; Abatzoglou, J.T.; Anderegg, L.D.L.; Bielory, L.; Kinney, P.L.; Ziska, L. Anthropogenic Climate Change Is Worsening North American Pollen Seasons. Proc. Natl. Acad. Sci. USA 2021, 118, e2013284118. [Google Scholar] [CrossRef]
- Frenguelli, G.; Spieksma, F.T.M.; Bricchi, E.; Romano, B.; Mincigrucci, G.; Nikkels, A.H.; Dankaart, W.; Ferranti, F. The Influence of Air Temperature on the Starting Dates of the Pollen Season of Alnus and Populus. Grana 1991, 30, 196–200. [Google Scholar] [CrossRef]
- Myszkowska, D.; Jenner, B.; Puc, M.; Stach, A.; Nowak, M.; Malkiewicz, M.; Chłopek, K.; Uruska, A.; Rapiejko, P.; Majkowska-Wojciechowska, B.; et al. Spatial Variations in the Dynamics of the Alnus and Corylus Pollen Seasons in Poland. Aerobiologia 2010, 26, 209–221. [Google Scholar] [CrossRef]
- Puc, M.; Kasprzyk, I. The Patterns of Corylus and Alnus Pollen Seasons and Pollination Periods in Two Polish Cities Located in Different Climatic Regions. Aerobiologia 2013, 29, 495–511. [Google Scholar] [CrossRef] [Green Version]
- Picornell, A.; Recio, M.; Ruiz-Mata, R.; García-Sánchez, J.; Cabezudo, B.; Trigo, M.d.M. Medium- and Long-Range Transport Events of Alnus Pollen in Western Mediterranean. Int. J. Biometeorol. 2020, 64, 1637–1647. [Google Scholar] [CrossRef] [PubMed]
- Ziello, C.; Sparks, T.H.; Estrella, N.; Belmonte, J.; Bergmann, K.C.; Bucher, E.; Brighetti, M.A.; Damialis, A.; Detandt, M.; Galán, C.; et al. Changes to Airborne Pollen Counts across Europe. PLoS ONE 2012, 7, e34076. [Google Scholar] [CrossRef] [PubMed]
- Zhang, Y.; Bielory, L.; Mi, Z.; Cai, T.; Robock, A.; Georgopoulos, P. Allergenic Pollen Season Variations in the Past Two Decades under Changing Climate in the United States. Glob. Chang. Biol. 2015, 21, 1581–1589. [Google Scholar] [CrossRef] [PubMed] [Green Version]
- Mishra, A.; Jalaluddin, Z.M.; Mahamuni, C.V. Air Quality Analysis and Smog Detection in Smart Cities for Safer Transport Using Machine Learning (ML) Regression Models. In Proceedings of the 2022 IEEE 11th International Conference on Communication Systems and Network Technologies (CSNT), Indore, India, 23 April 2022; IEEE: New York, NY, USA, 2022; pp. 200–206. [Google Scholar]
- Mohammed, W.; Adamescu, A.; Neil, L.; Shantz, N.; Townend, T.; Lysy, M.; Al-Abadleh, H.A. Application of Machine Learning and Statistical Modeling to Identify Sources of Air Pollutant Levels in Kitchener, Ontario, Canada. Environ. Sci. Atmos. 2022, 2, 1389–1399. [Google Scholar] [CrossRef]
- Nowosad, J.; Stach, A.; Kasprzyk, I.; Chłopek, K.; Dąbrowska-Zapart, K.; Grewling, Ł.; Latałowa, M.; Pędziszewska, A.; Majkowska-Wojciechowska, B.; Myszkowska, D.; et al. Statistical Techniques for Modeling of Corylus, Alnus, and Betula Pollen Concentration in the Air. Aerobiologia 2018, 34, 301–313. [Google Scholar] [CrossRef]
- Muzalyova, A.; Brunner, J.O.; Traidl-Hoffmann, C.; Damialis, A. Forecasting Betula and Poaceae Airborne Pollen Concentrations on a 3-Hourly Resolution in Augsburg, Germany: Toward Automatically Generated, Real-Time Predictions. Aerobiologia 2021, 37, 425–446. [Google Scholar] [CrossRef]
- Stępalska, D.; Myszkowska, D.; Piotrowicz, K.; Kasprzyk, I. The Phenological Phases of Flowering and Pollen Seasons of Spring Flowering Tree Taxa against a Background of Meteorological Conditions in Kraków, Poland. Acta Agrobot. 2016, 69. [Google Scholar] [CrossRef] [Green Version]
- Garrido, A.; Fernández-González, M.; Álvarez-López, S.; González-Fernández, E.; Rodríguez-Rajo, F.J. First Phenological and Aerobiological Assessment of Olive Orchards at the Northern Limit of the Mediterranean Bioclimatic Area. Aerobiologia 2020, 36, 641–656. [Google Scholar] [CrossRef]


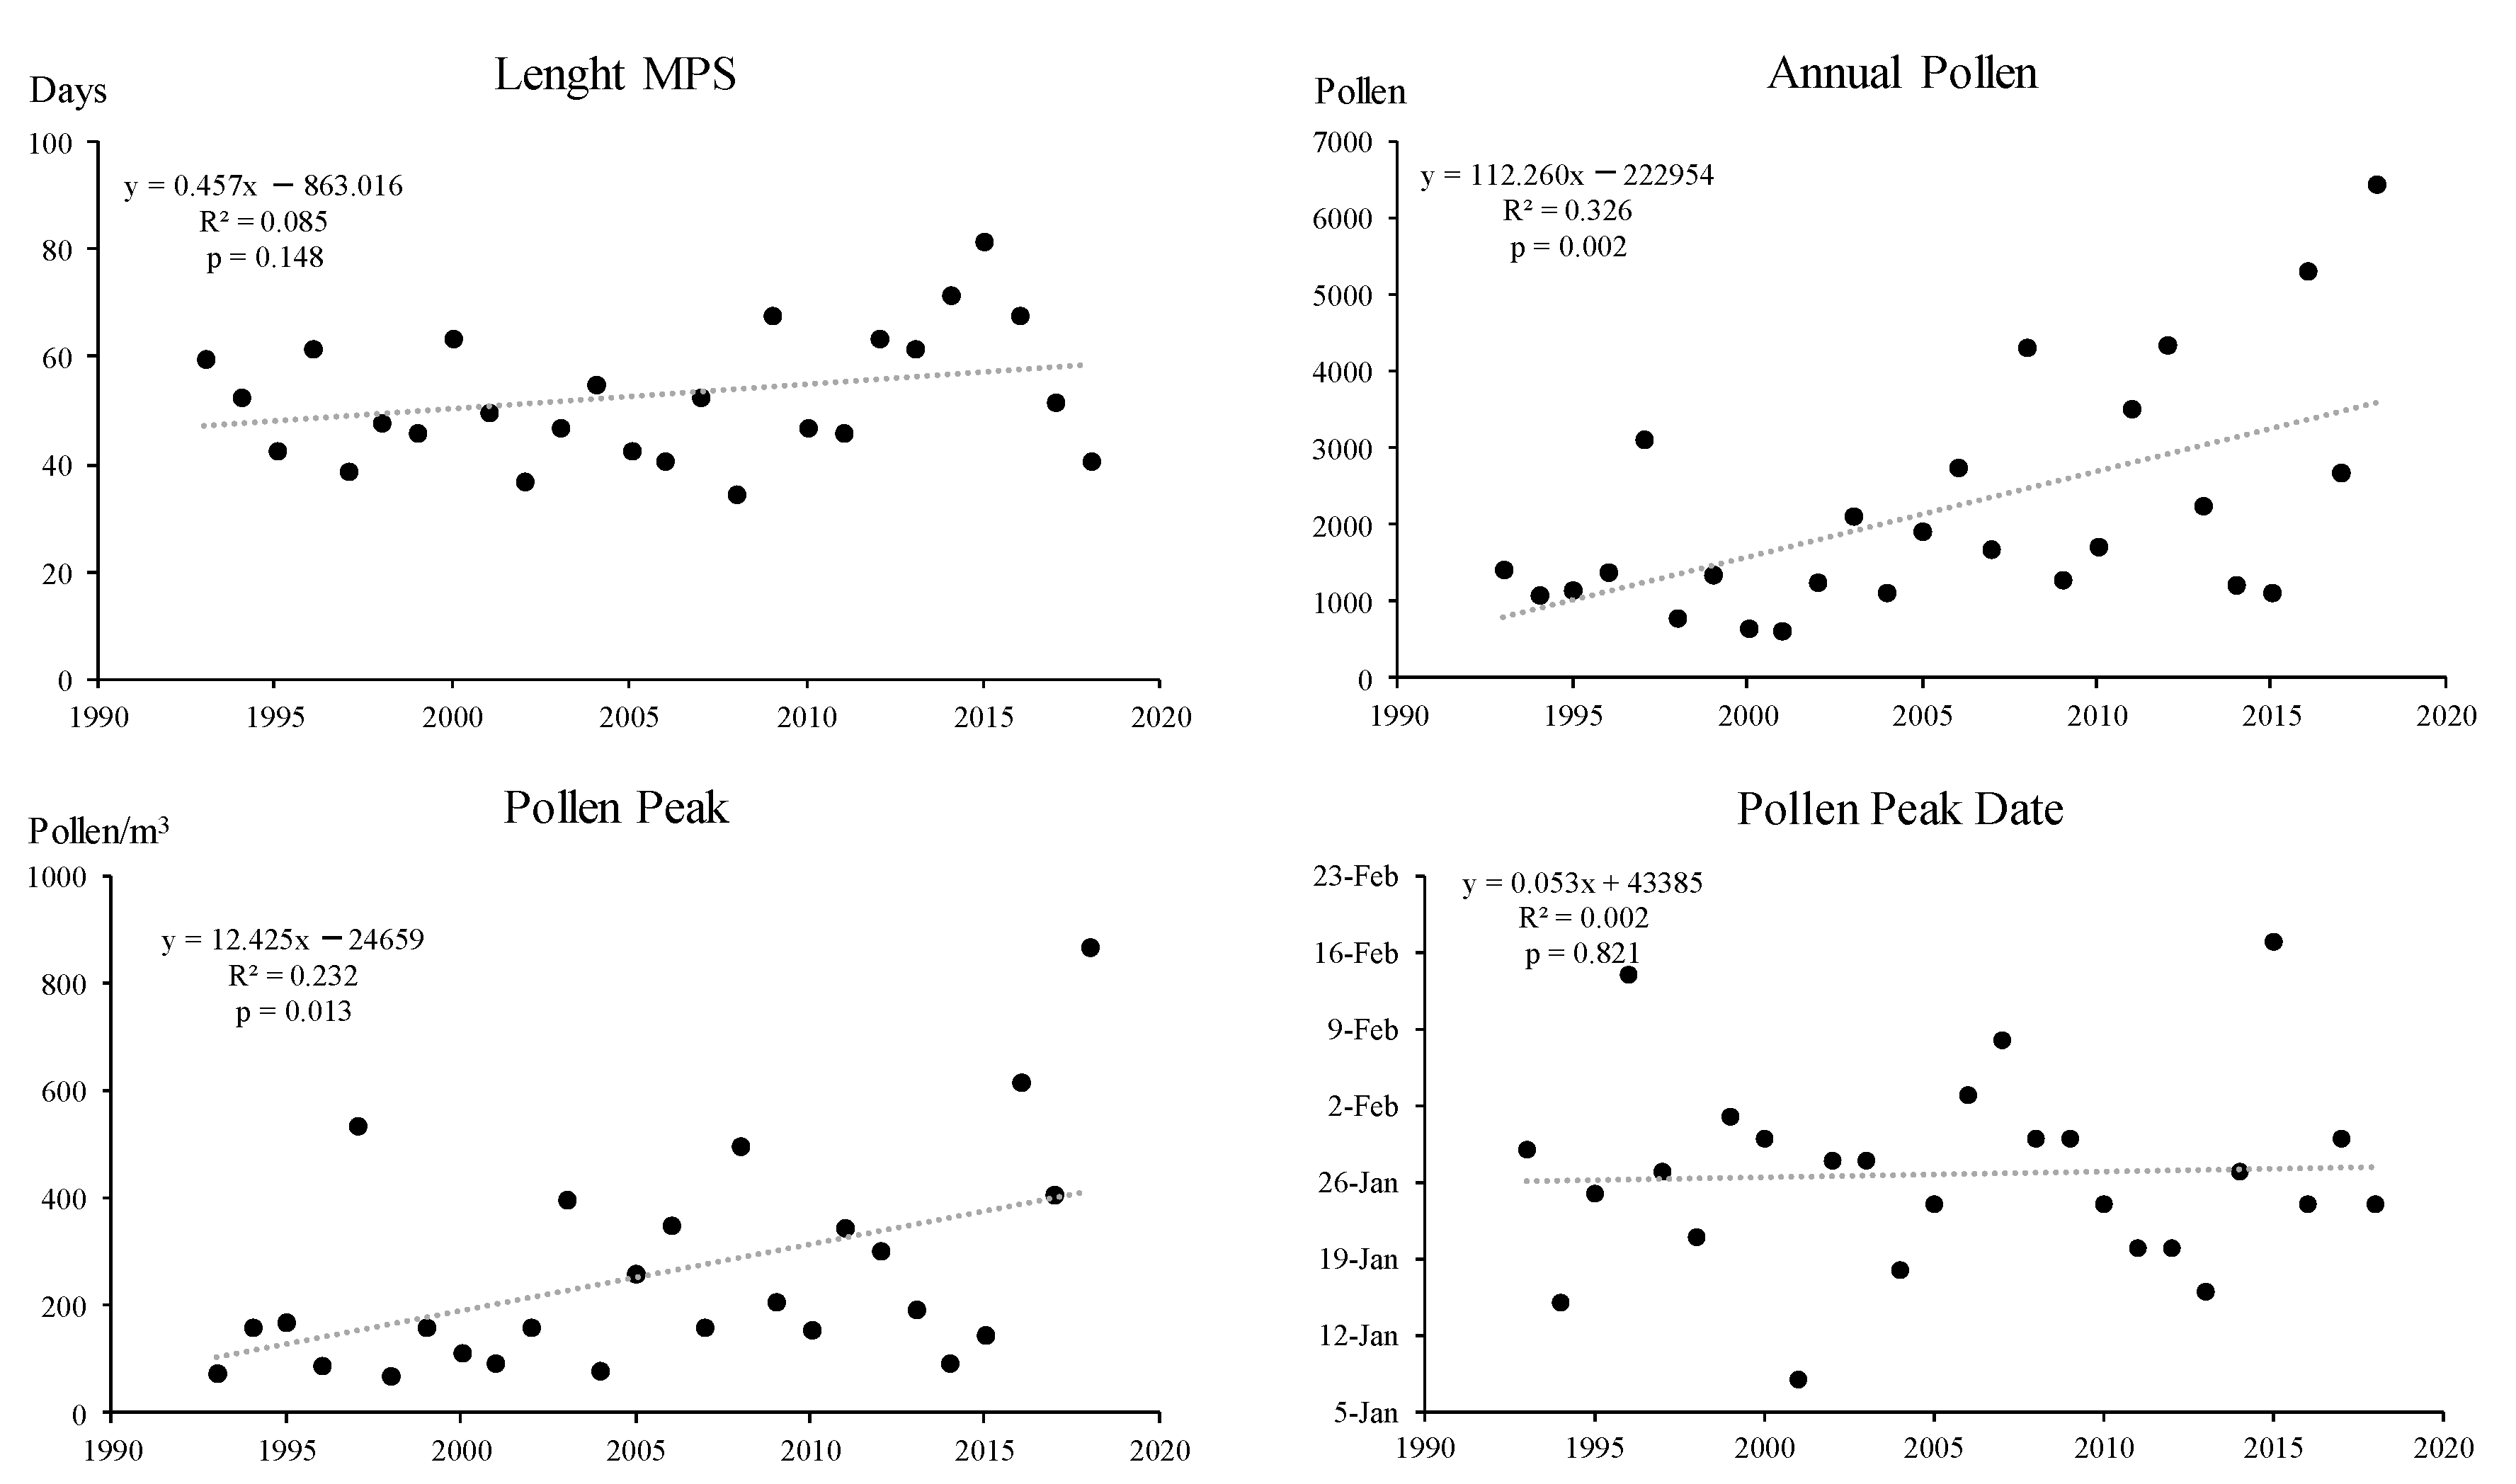
| Year | Start MPS | End MPS | Length MPS | Annual Pollen | Pollen Peak | Pollen Peak Date |
|---|---|---|---|---|---|---|
| 1993 | 8-Jan | 8-Mar | 60 | 1414 | 75 | 29-Jan |
| 1994 | 29-Dec | 19-Feb | 53 | 1098 | 163 | 15-Jan |
| 1995 | 10-Jan | 21-Feb | 43 | 1147 | 171 | 25-Jan |
| 1996 | 3-Jan | 5-Mar | 62 | 1387 | 91 | 14-Feb |
| 1997 | 5-Jan | 12-Feb | 39 | 3113 | 534 | 27-Jan |
| 1998 | 7-Jan | 23-Feb | 48 | 809 | 72 | 21-Jan |
| 1999 | 12-Jan | 26-Feb | 46 | 1369 | 161 | 1-Feb |
| 2000 | 11-Jan | 15-Mar | 64 | 666 | 113 | 30-Jan |
| 2001 | 1-Jan | 19-Feb | 50 | 630 | 94 | 8-Jan |
| 2002 | 15-Jan | 20-Feb | 37 | 1246 | 163 | 28-Jan |
| 2003 | 31-Dec | 15-Feb | 47 | 2132 | 400 | 28-Jan |
| 2004 | 1-Jan | 24-Feb | 55 | 1114 | 79 | 18-Jan |
| 2005 | 16-Jan | 27-Feb | 43 | 1937 | 261 | 24-Jan |
| 2006 | 20-Jan | 1-Mar | 41 | 2754 | 353 | 3-Feb |
| 2007 | 9-Jan | 2-Mar | 53 | 1695 | 159 | 8-Feb |
| 2008 | 19-Jan | 22-Feb | 35 | 4319 | 499 | 30-Jan |
| 2009 | 5-Jan | 13-Mar | 68 | 1294 | 208 | 30-Jan |
| 2010 | 18-Jan | 5-Mar | 47 | 1724 | 156 | 24-Jan |
| 2011 | 9-Jan | 23-Feb | 46 | 3516 | 345 | 20-Jan |
| 2012 | 7-Jan | 11-Mar | 64 | 4351 | 305 | 20-Jan |
| 2013 | 2-Jan | 4-Mar | 62 | 2253 | 192 | 16-Jan |
| 2014 | 10-Jan | 22-Mar | 72 | 1216 | 96 | 27-Jan |
| 2015 | 15-Jan | 6-Apr | 82 | 1137 | 147 | 17-Feb |
| 2016 | 31-Dec | 8-Mar | 68 | 5317 | 617 | 24-Jan |
| 2017 | 10-Jan | 2-Mar | 52 | 2692 | 408 | 30-Jan |
| 2018 | 17-Jan | 26-Feb | 41 | 6441 | 867 | 24-Jan |
| Mean | 8-Jan | 1-Mar | 53 | 2184 | 259 | 26-Jan |
| Max. | 20-Jan | 6-Apr | 82 | 6441 | 867 | 24-Jan |
| Min. | 29-Dec | 12-Feb | 35 | 630 | 72 | 21-Jan |
| SD | 6.45 | 11.49 | 11.96 | 1503.84 | 197.19 | 8.73 |
| RSD (%) | 0.01 | 0.03 | 22.57 | 68.87 | 76.19 | 0.02 |
| Alnus | R | p | Alnus | R | p | Alnus | R | p |
|---|---|---|---|---|---|---|---|---|
| cAp(d) | 1.000 | maxt(d − 6) | −0.276 ** | 0.000 | avgt(d − 4) | −0.275 ** | 0.000 | |
| cAp(d − 1) | 0.803 ** | 0.000 | maxt(d − 7) | −0.289 ** | 0.000 | avgt(d − 5) | −0.287 ** | 0.000 |
| cAp(d − 2) | 0.770 ** | 0.000 | mint(d) | −0.214 ** | 0.000 | avgt(d − 6) | −0.300 ** | 0.000 |
| cAp(d − 3) | 0.756 ** | 0.000 | mint(d − 1) | −0.193 ** | 0.000 | avgt(d − 7) | −0.315 ** | 0.000 |
| cAp(d − 4) | 0.740 ** | 0.000 | mint(d − 2) | −0.189 ** | 0.000 | rain(d) | −0.065 ** | 0.000 |
| cAp(d − 5) | 0.727 ** | 0.000 | mint(d − 3) | −0.186 ** | 0.000 | rain(d − 1) | −0.059 ** | 0.000 |
| cAp(d − 6) | 0.714 ** | 0.000 | mint(d − 4) | −0.189 ** | 0.000 | rain(d − 2) | −0.012 | 0.475 |
| cAp(d − 7) | 0.690 ** | 0.000 | mint(d − 5) | −0.184 ** | 0.000 | rain(d − 3) | 0.012 | 0.460 |
| maxt(d) | −0.146 ** | 0.000 | mint(d − 6) | −0.188 ** | 0.000 | rain(d − 4) | 0.032 | 0.051 |
| maxt(d − 1) | −0.168 ** | 0.000 | mint(d − 7) | −0.202 ** | 0.000 | rain(d − 5) | 0.030 | 0.062 |
| maxt(d − 2) | −0.200 ** | 0.000 | avgt(d) | −0.238 ** | 0.000 | rain(d − 6) | 0.031 | 0.060 |
| maxt(d − 3) | −0.221 ** | 0.000 | avgt(d − 1) | −0.239 ** | 0.000 | rain(d − 7) | 0.039 * | 0.017 |
| maxt(d − 4) | −0.237 ** | 0.000 | avgt(d − 2) | −0.253 ** | 0.000 | |||
| maxt(d − 5) | −0.257 ** | 0.000 | avgt(d − 3) | −0.265 ** | 0.000 |
| Classifier | RF | SVM | GNB | MLP | |
|---|---|---|---|---|---|
| Year | |||||
| 2019 | 0.680 | 0.668 | 0.592 | 0.749 | |
| 2020 | 0.570 | 0.586 | 0.551 | 0.569 | |
| 2021 | 0.571 | 0.426 | 0.312 | 0.479 | |
| Median/Difference | 0.607/±0.073 | 0.56/±0.134 | 0.485/±0.173 | 0.599/±0.150 | |
| Year | Predicted Labels | ||||
|---|---|---|---|---|---|
| 2019 | low | medium | high | ||
| low | 95.35 | 0.0 | 4.65 | ||
| Real labels | medium | 33.33 | 0.0 | 66.67 | |
| high | 6.25 | 0.0 | 93.75 | ||
| 2020 | low | medium | high | ||
| low | 90.22 | 0.0 | 9.78 | ||
| Real labels | medium | 0.0 | 0.0 | 100.0 | |
| high | 0.0 | 0.0 | 100.0 | ||
| 2021 | low | medium | high | ||
| low | 96.55 | 0.0 | 3.45 | ||
| Real labels | medium | 0.0 | 33.33 | 66.67 | |
| high | 0.0 | 0.0 | 100.0 | ||
Disclaimer/Publisher’s Note: The statements, opinions and data contained in all publications are solely those of the individual author(s) and contributor(s) and not of MDPI and/or the editor(s). MDPI and/or the editor(s) disclaim responsibility for any injury to people or property resulting from any ideas, methods, instructions or products referred to in the content. |
© 2023 by the authors. Licensee MDPI, Basel, Switzerland. This article is an open access article distributed under the terms and conditions of the Creative Commons Attribution (CC BY) license (https://creativecommons.org/licenses/by/4.0/).
Share and Cite
Novo-Lourés, M.; Fernández-González, M.; Pavón, R.; Espinosa, K.C.S.; Laza, R.; Guada, G.; Méndez, J.R.; Fdez-Riverola, F.; Rodríguez-Rajo, F.J. Alnus Airborne Pollen Trends during the Last 26 Years for Improving Machine Learning-Based Forecasting Methods. Forests 2023, 14, 1586. https://doi.org/10.3390/f14081586
Novo-Lourés M, Fernández-González M, Pavón R, Espinosa KCS, Laza R, Guada G, Méndez JR, Fdez-Riverola F, Rodríguez-Rajo FJ. Alnus Airborne Pollen Trends during the Last 26 Years for Improving Machine Learning-Based Forecasting Methods. Forests. 2023; 14(8):1586. https://doi.org/10.3390/f14081586
Chicago/Turabian StyleNovo-Lourés, María, María Fernández-González, Reyes Pavón, Kenia C. Sánchez Espinosa, Rosalía Laza, Guillermo Guada, José R. Méndez, Florentino Fdez-Riverola, and Francisco Javier Rodríguez-Rajo. 2023. "Alnus Airborne Pollen Trends during the Last 26 Years for Improving Machine Learning-Based Forecasting Methods" Forests 14, no. 8: 1586. https://doi.org/10.3390/f14081586