
Wildfire Susceptibility of Land Use and Topographic Features in the Western United States: Implications for the Landscape Management


1
College of Economics and Management, Nanjing Forestry University, Nanjing 210037, China
2
Wisconsin Department of Natural Resources, Madison, WI 53707, USA
3
School of Agricultural Sciences and Forestry, Louisiana Tech University, Ruston, LA 71272, USA
*
Author to whom correspondence should be addressed.
Forests 2023, 14(4), 807; https://doi.org/10.3390/f14040807
Submission received: 21 March 2023
/
Revised: 11 April 2023
/
Accepted: 12 April 2023
/
Published: 14 April 2023
(This article belongs to the Section Natural Hazards and Risk Management)
Abstract
:Understanding the role of land use type and topographic features in shaping wildfire regimes received much attention because of the intensification of wildfire activities. The intensifying wildfires in the western United States are a great concern both for the environment and society. We investigate the patterns of wildfire occurrence in the western United States at the landscape level by using 118 wildfires with areas greater than 405 ha in the study year of 2018. The selection ratios were calculated to measure fire preference with regard to land cover type, slope, and aspect. The results suggest that grasslands, steeper slopes, and south-facing aspects were more susceptible to wildfires in the western United States. Additionally, there were regional variations in wildfire susceptibility in Washington, Oregon, and California. The most wildfire-prone land cover type in Washington was mixed forests, whereas that in Oregon and California was grassland. The findings of this study improve the understanding of the role of land use changes and topographic features in shaping wildfire patterns in the western United States, providing insights for managing wildfire risks for forest management strategies at the landscape level.
1. Introduction
The number and total area of large wildfires (>405 hectares) increased significantly since the mid-1980s, making it a major disturbance to forests in the western United States [1,2,3,4,5,6]. The increasing frequency and severity of wildfires in the western United States exaggerated the interaction between wildfires and landscape characteristics [7,8,9,10,11,12]. For example, wildfires affect forest and non-forest landscape dynamics by stimulating vegetation regeneration and promoting the development of landscape dynamics [13,14,15]. As a result, young stands regenerated from wildfires are less flammable than older stands in boreal forests of North America [16,17,18].
Research on wildfires in the western United States focused on the relationship between climate and wildfires [19,20,21,22,23]. For example, Sierra Nevada in California experienced several catastrophic wildfires owing to the early warming in spring and summer in recent years [24,25,26,27]. Although climate is the dominant factor in the occurrence of large wildfires, other factors such as land cover and topographic features also play an important role [28,29,30,31,32]. Land use types influence forest wildfire regimes (particularly fire size, interval, and intensity) through differences in fuel accumulation and vegetation structure [33,34,35,36]. Topographical features, such as slopes, determine the spread of wildfires, whereas elevation and aspect affect vegetation distribution [37,38].
Previous studies investigated the impact of the land cover type and topographic features on the temporal and spatial patterns of wildfires in southern European countries [37,39,40,41,42]. The concept of “fire selection” was introduced by Manly et al. (1993) [43] to study the resource selection patterns by animals, and it was widely adopted to study the wildfire patterns of different land use types and topographic features [33,39,43,44,45,46,47]. Wildfires are believed to behave selectively for different land use types or topographic features, which indicates that some land use types or features are more prone to wildfires than others. When wildfires have no preference in terms of incidence, fires burn in proportion to the availability of each land cover type.
Land cover, such as shrublands and conifer forests, are found to be more susceptible to wildfires than others, such as wetlands, agricultural areas, and recently burned areas in the Mediterranean areas [33,39,41,45,48,49,50,51]. Land use types, such as grasslands, also have a greater propensity for large wildfires in the United States, whereas land use types, such as croplands, pasture, and developed land, have less propensity [52,53,54]. North-facing areas have higher propensities in northern Portugal [33,45], whereas these areas are less prone to wildfires in southern European countries [37]. Steep slopes are more frequently selected for wildfires in Portugal [33], whereas they are less frequently selected in southern European countries [36,37]. Therefore, wildfire selection patterns exist in relation to land use type, slope, aspect, and there are regional variations among geographic regions.
Fire proneness patterns with regard to land use types and topographic features in Mediterranean countries were thoroughly studied; however, those in the western United States were seldom studied. In contrast, existing research on wildfire risk predictions in the western United States is on a large scale, which provides limited information for firefighters and forest managers at finer scales. This research fills these research gaps and provides useful information by predicting wildfire selection patterns to land cover and topographic features at the landscape scale in the western United States. Therefore, the objective of this study is to explore wildfire selection patterns in relation to land cover types and topographic features in the western United States in 2018 and reveal the regional variations in the three states at the landscape level. The fire selection patterns towards land cover, slope, and aspect were assessed, and the propensities of these factors to fires for the states of Washington, Oregon, and California were quantified and compared. The findings of this research could provide useful information to forestland managers and federal and state agencies regarding the changing wildfire regimes and would enhance firefighters’ awareness of the wildfire and make the right decisions in advance.
2. Materials and Methods
2.1. Study Area
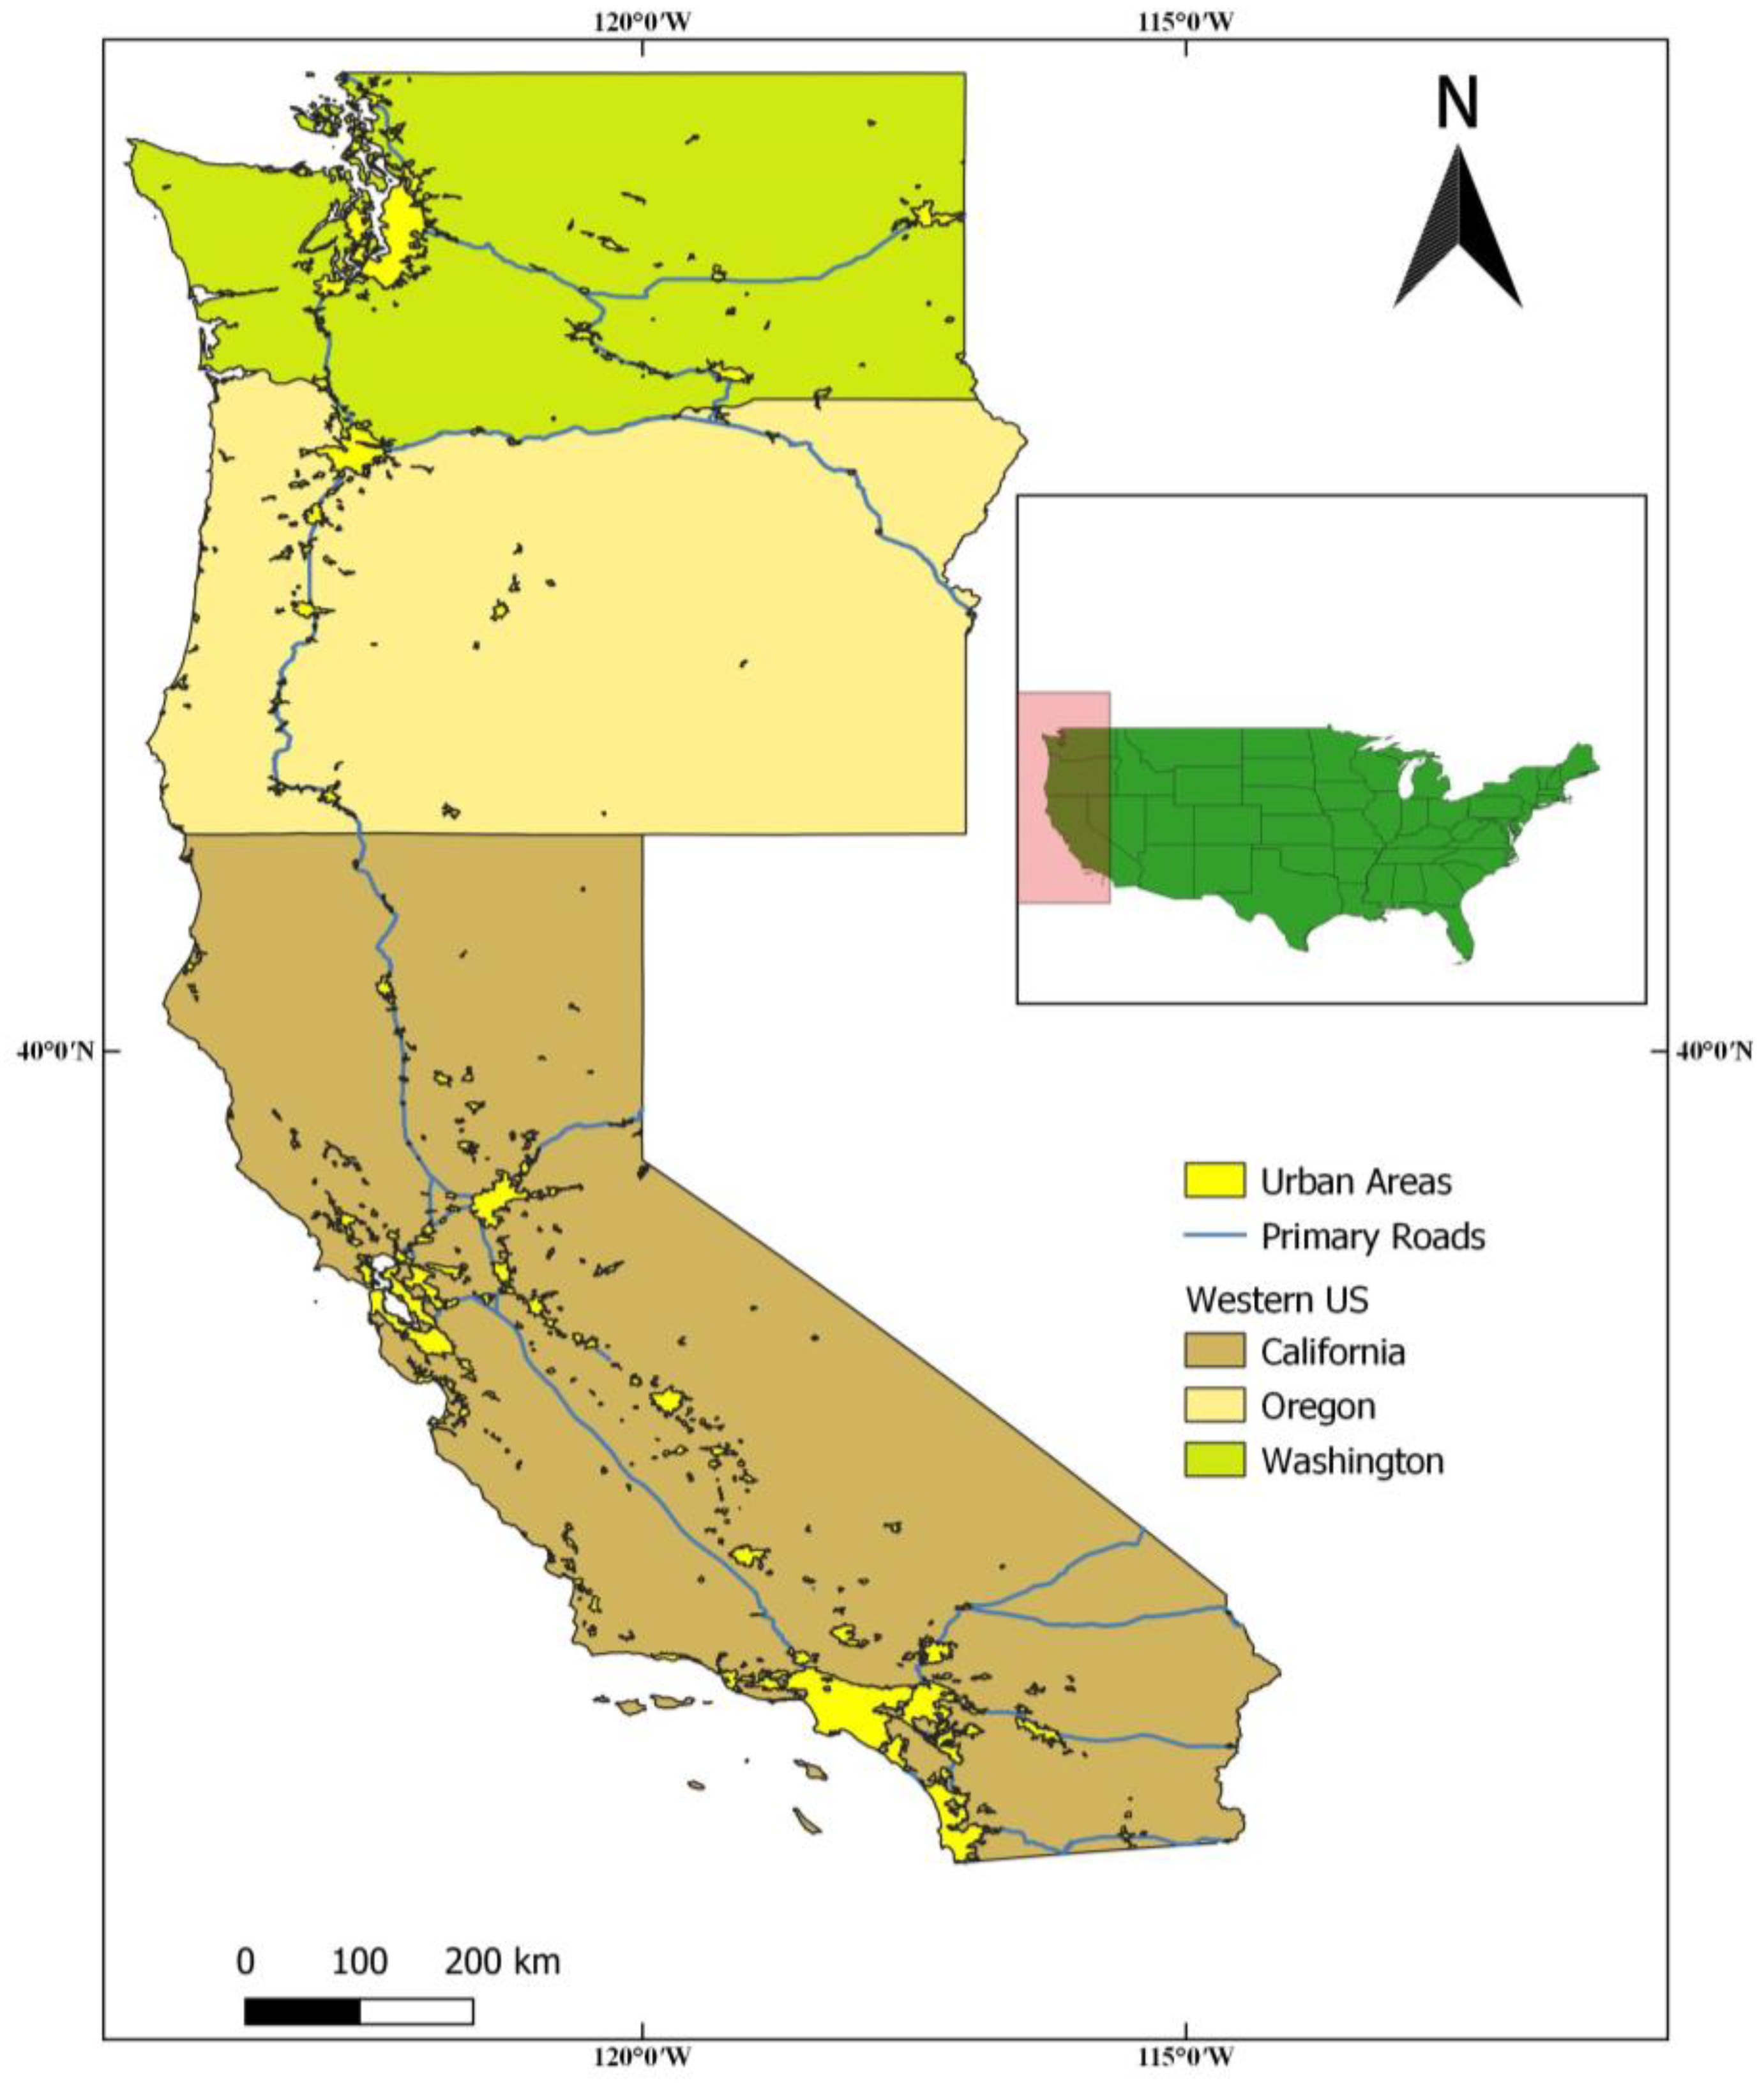
The study area includes three states in the western United States: Washington, Oregon, and California (Figure 1). The state of Washington covers the area of 18.48 million hectares with the population of approximately 7.9 million in 2021 [55]. The majority of Washington resides in the Seattle metropolitan area. The state of Oregon covers an area of 25.48 million hectares with the population of 4.2 million in 2021 [55]. Portland is the largest city in Oregon. California covers an area of 42.40 million hectares, with a population of more than 39 million in 2021 [55]. The Greater Los Angeles area and San Francisco Bay Area are the second and fifth most populated regions in the United States, respectively.
Most of California and southwestern Oregon has a Mediterranean climate, which is characterized by hot and dry summers (July and August) and 50%−80% of the precipitation occurring from October to March [56]. Western Washington and northwestern Oregon have a temperate climate, whereas eastern Washington and eastern Oregon fall into the semi−arid climate with drier weather. Monsoonal lightning strikes start numerous wildfires in June and July before the monsoon rains wet fuel in the fall [57]. Approximately 94% of wildfires in the western United States are seasonal wildfires, and 98% of the burned area is burned between May and October [56]. The start of wildfire season spread north and west, with fire season peaks in August in California but starts in August in western Montana. In addition, the vegetation in southwest and eastern Oregon are grasslands and shrublands, which could contribute to the intensified fire season because of fuel accumulation for 10–18 months before the fire season.
2.2. Wildfire, Land Cover, Slope, and Aspect Maps
2.2.1. Wildfire Map
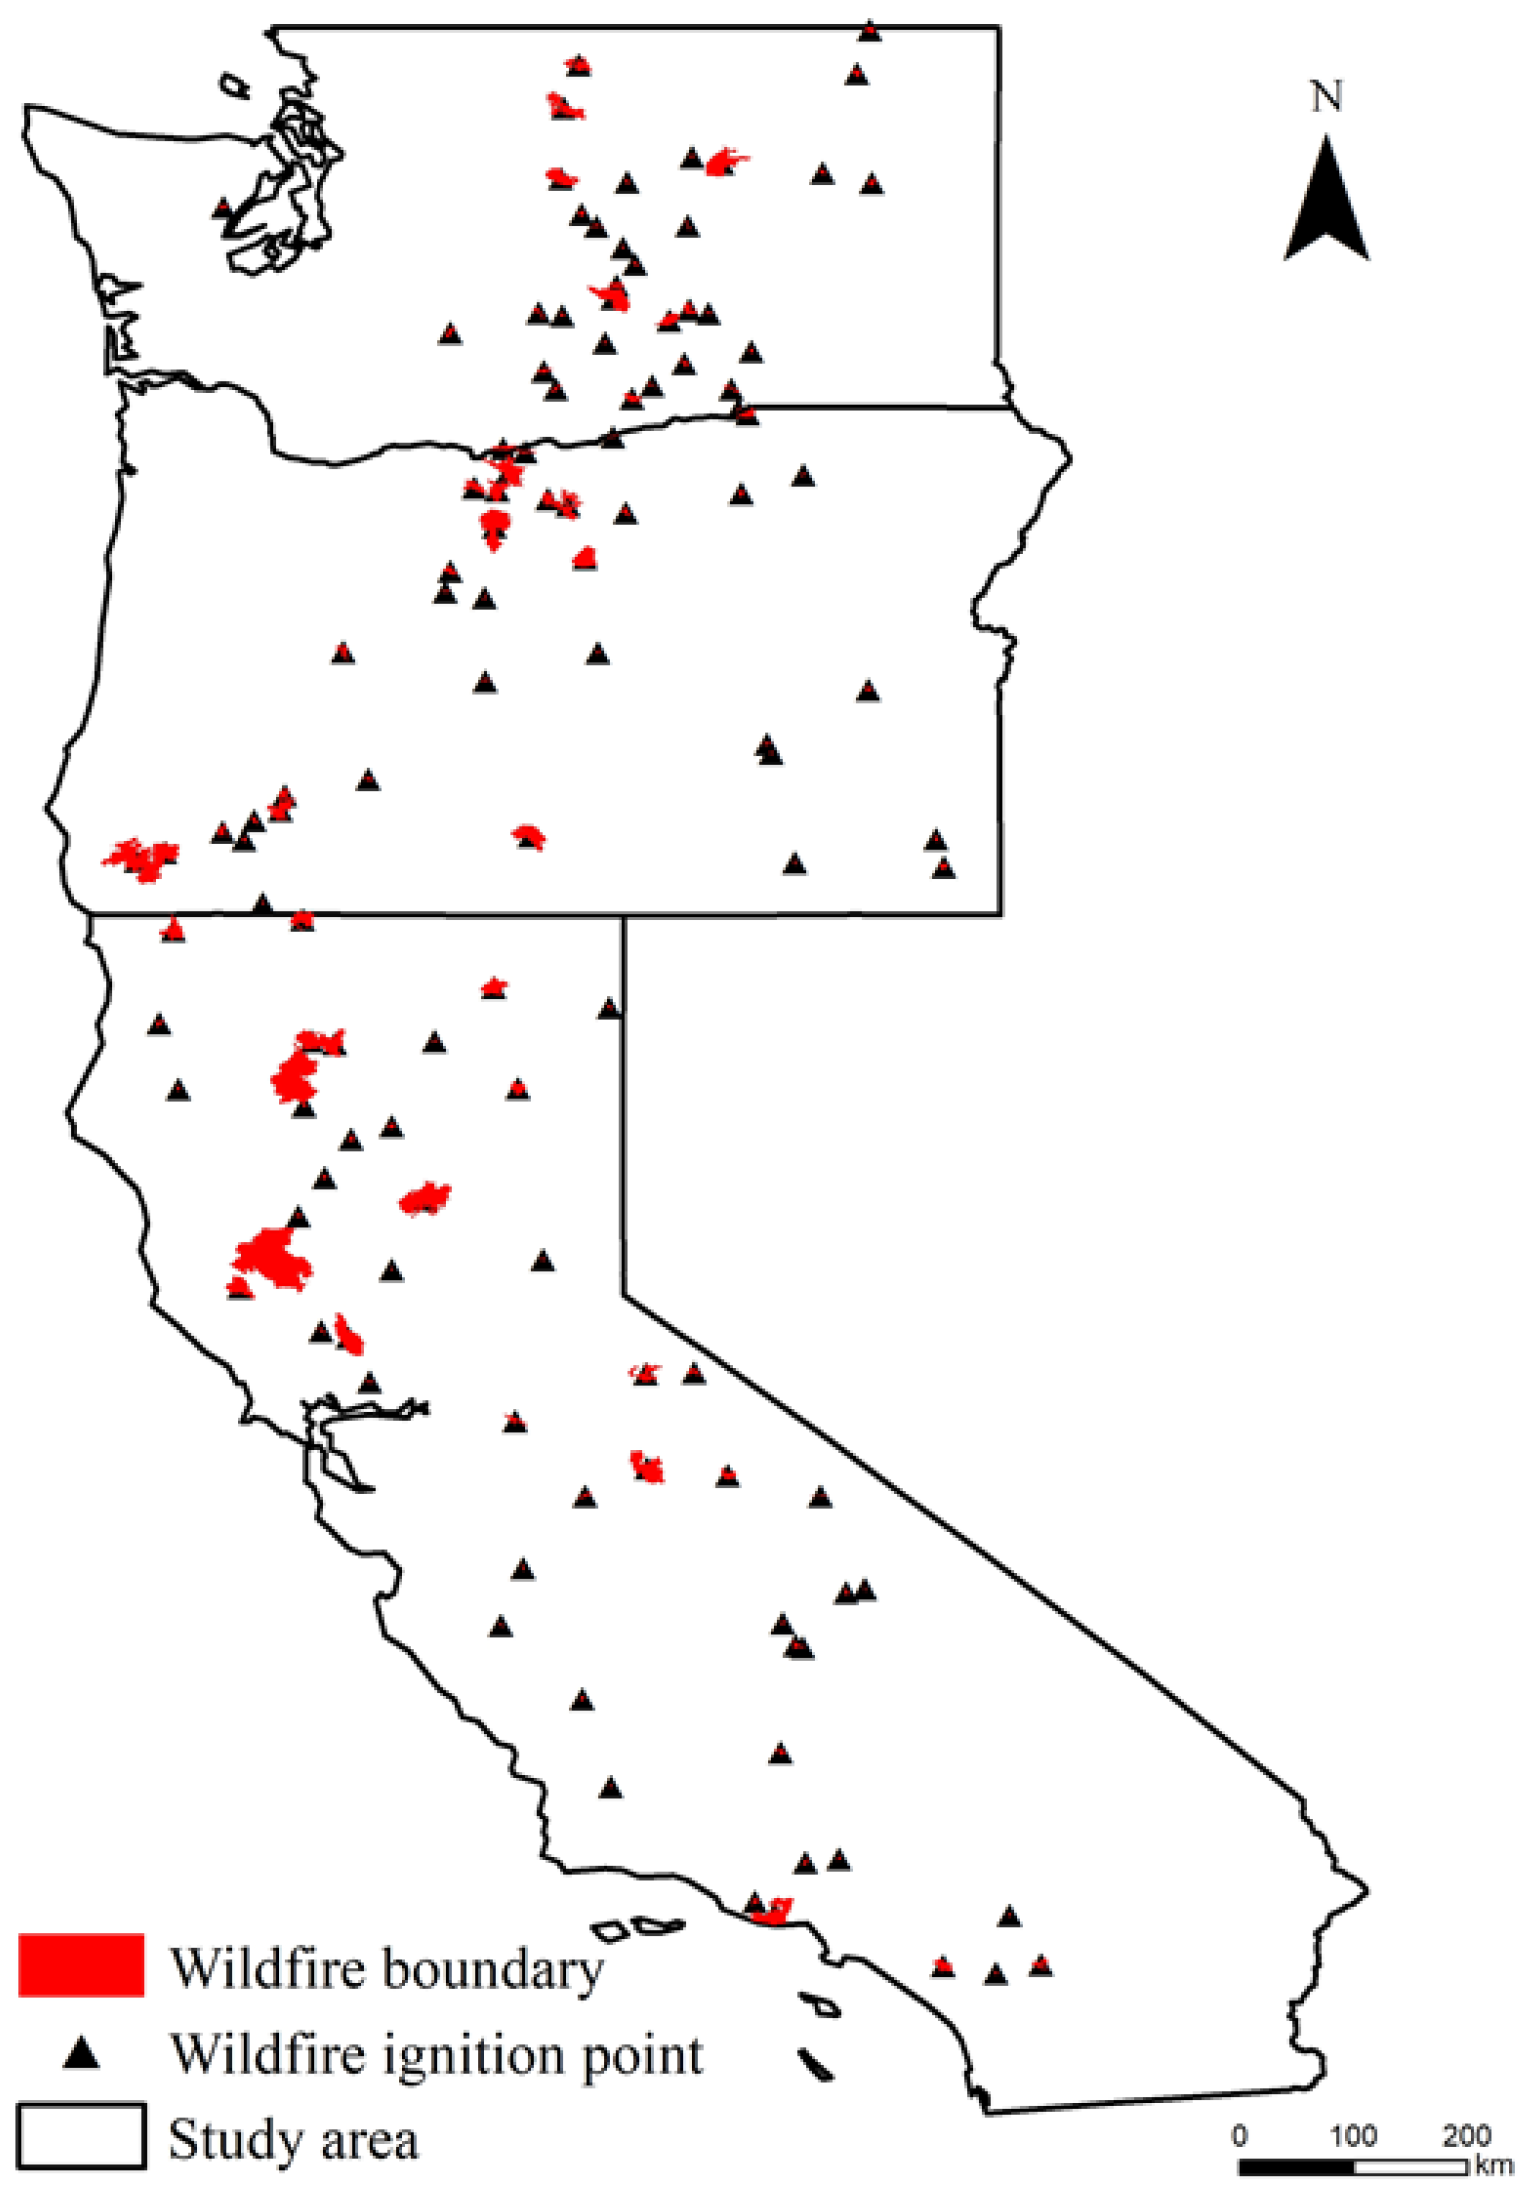
The fire ignition points and burn area boundaries for wildfires in the western United States were obtained from the United States Department of Agriculture (USDA) Forest Service (2022) [58]. In the database, fires greater than 405 hectares in the western United States between the calendar years of 1984 and 2018 were recorded. To obtain the latest information, the most recent year, 2018, was selected as the target year for wildfires. The ignition points and boundaries for large wildfires in 2018 across the three states of western United States are presented in Figure 2. In total, 118 wildfires occurred with a total burned area of more than 1.5 million hectares.
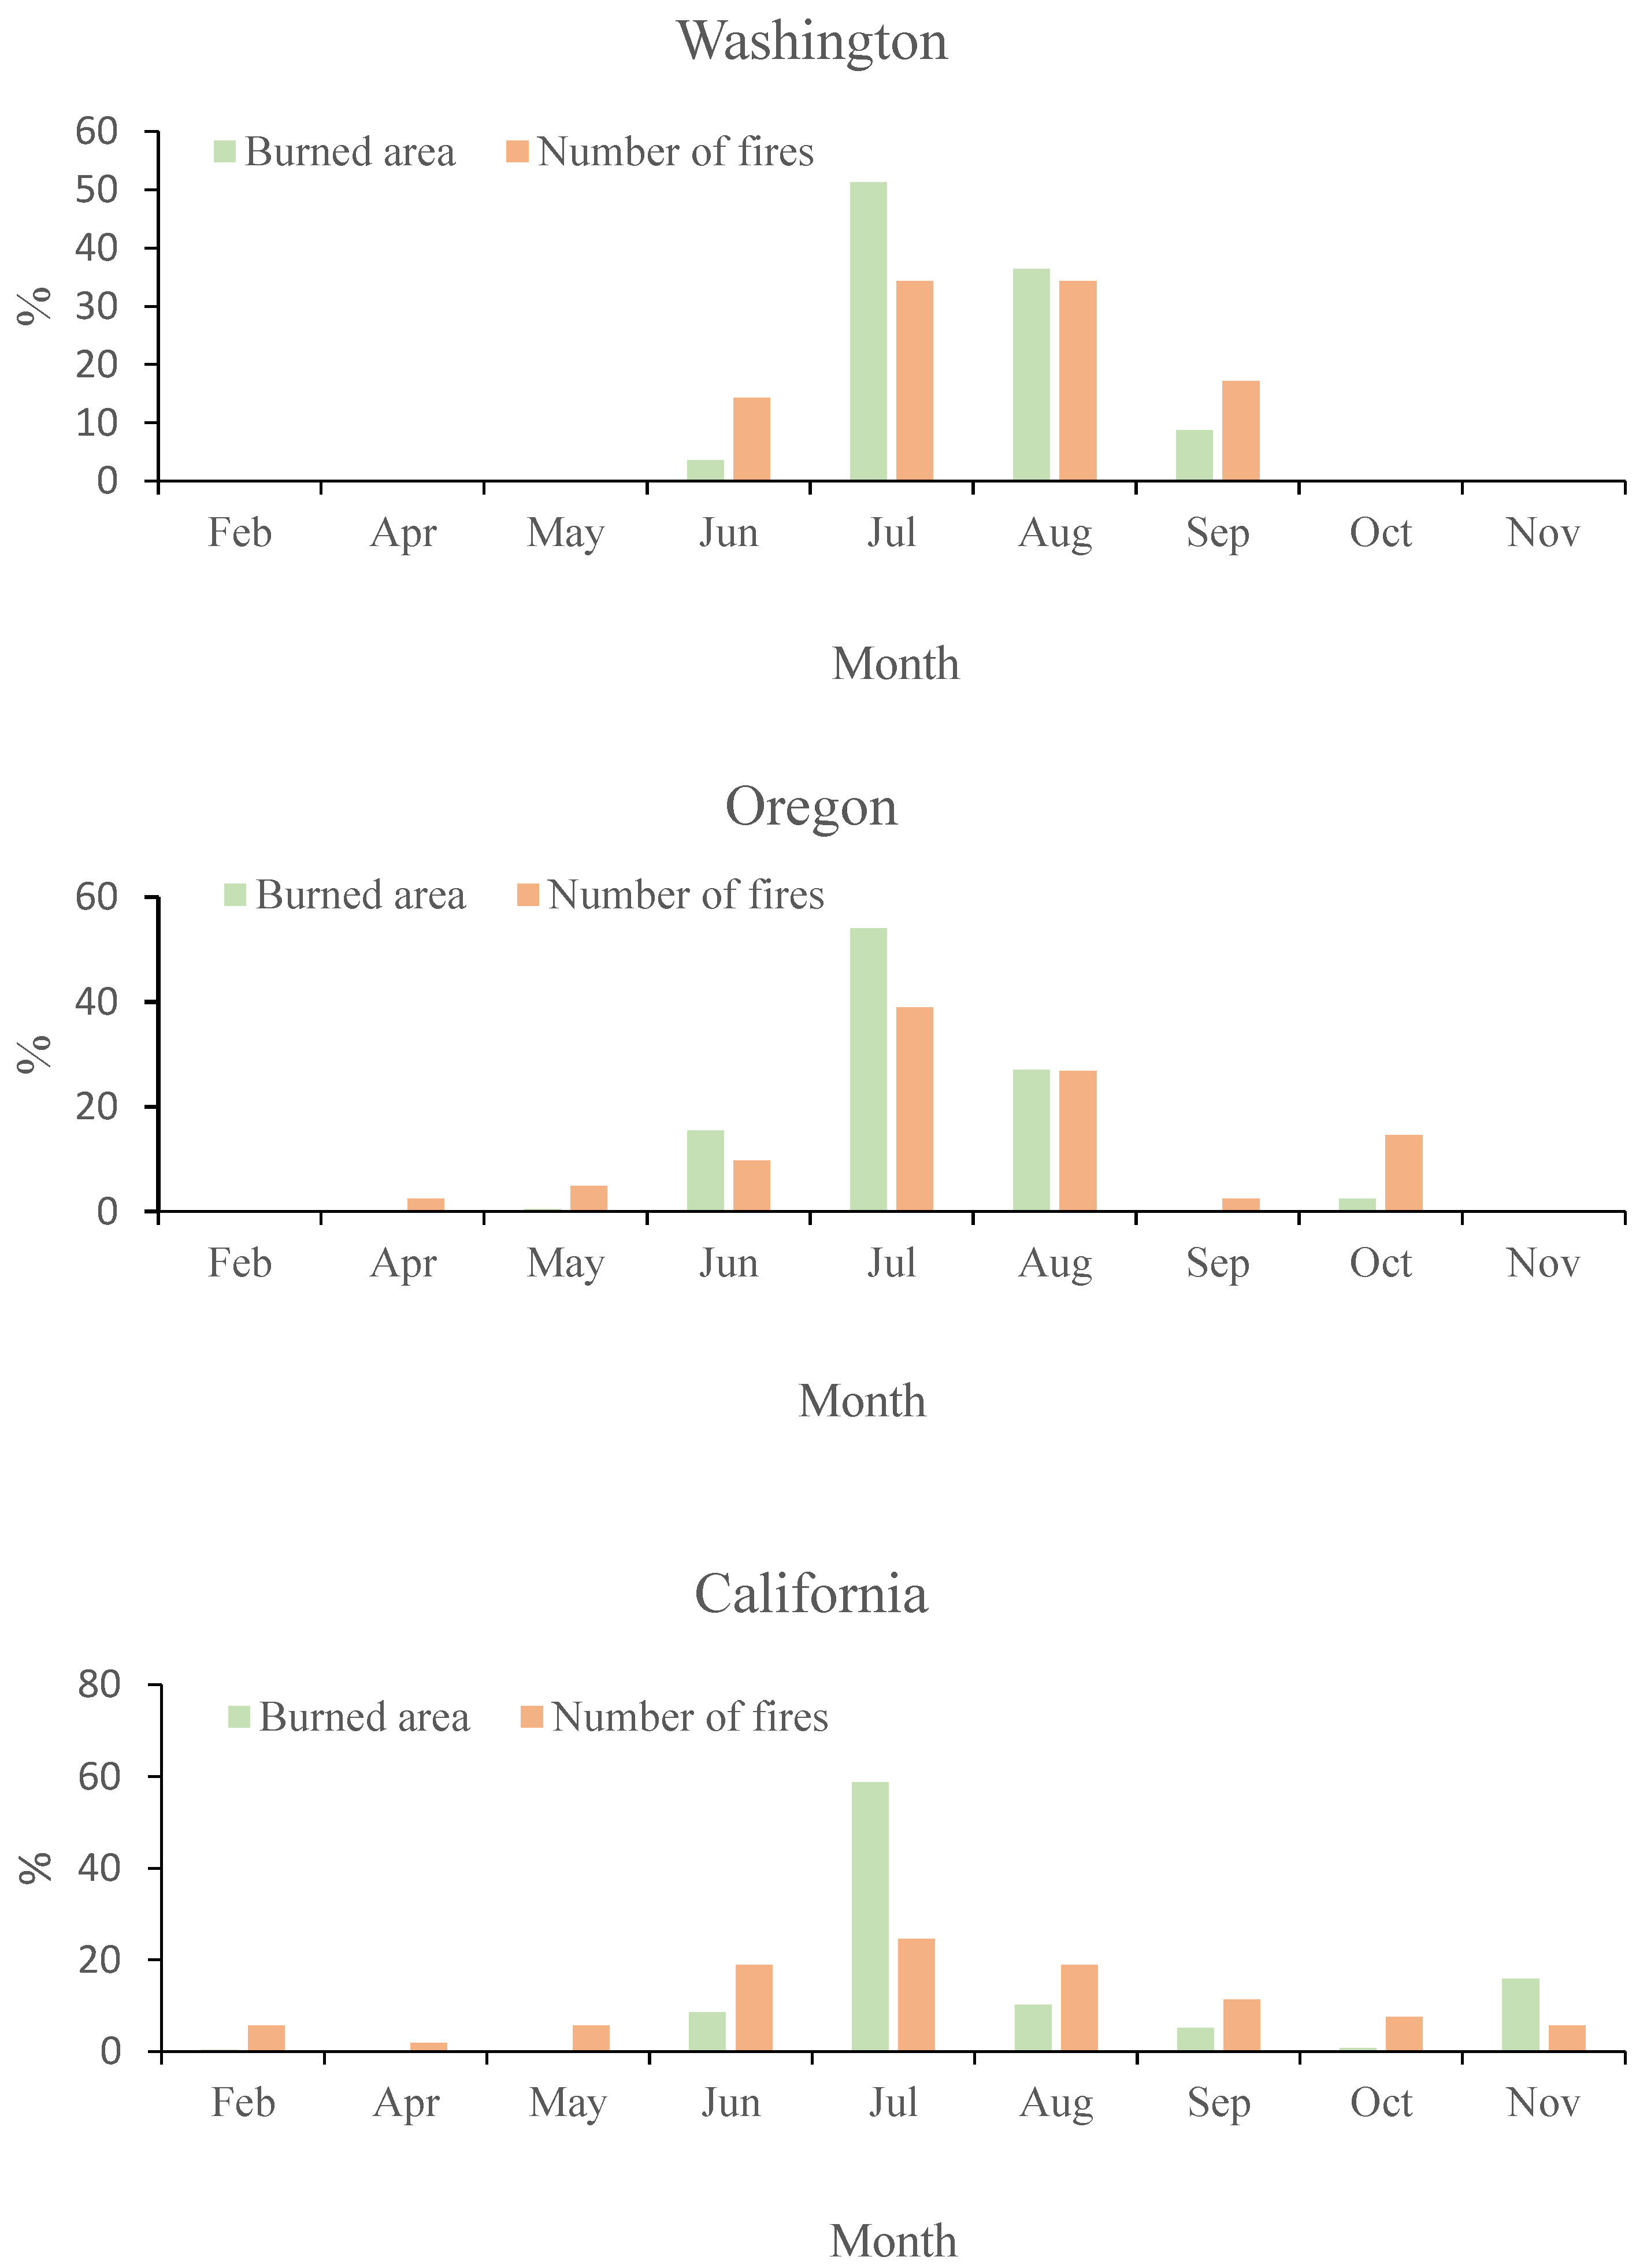
The percentage of the monthly number of fires and hectares burned in 2018 is presented in Figure 3. Most wildfires in Washington occurred in July and August. Similarly, wildfires in Oregon were also concentrated in July and August. In California, wildfires occur mostly in July. Among these three states, in 2018, California ranked first in terms of area burned (828,703 hectares), followed by Oregon (445,635 hectares) and Washington (241,797 hectares).
2.2.2. Land Cover Map
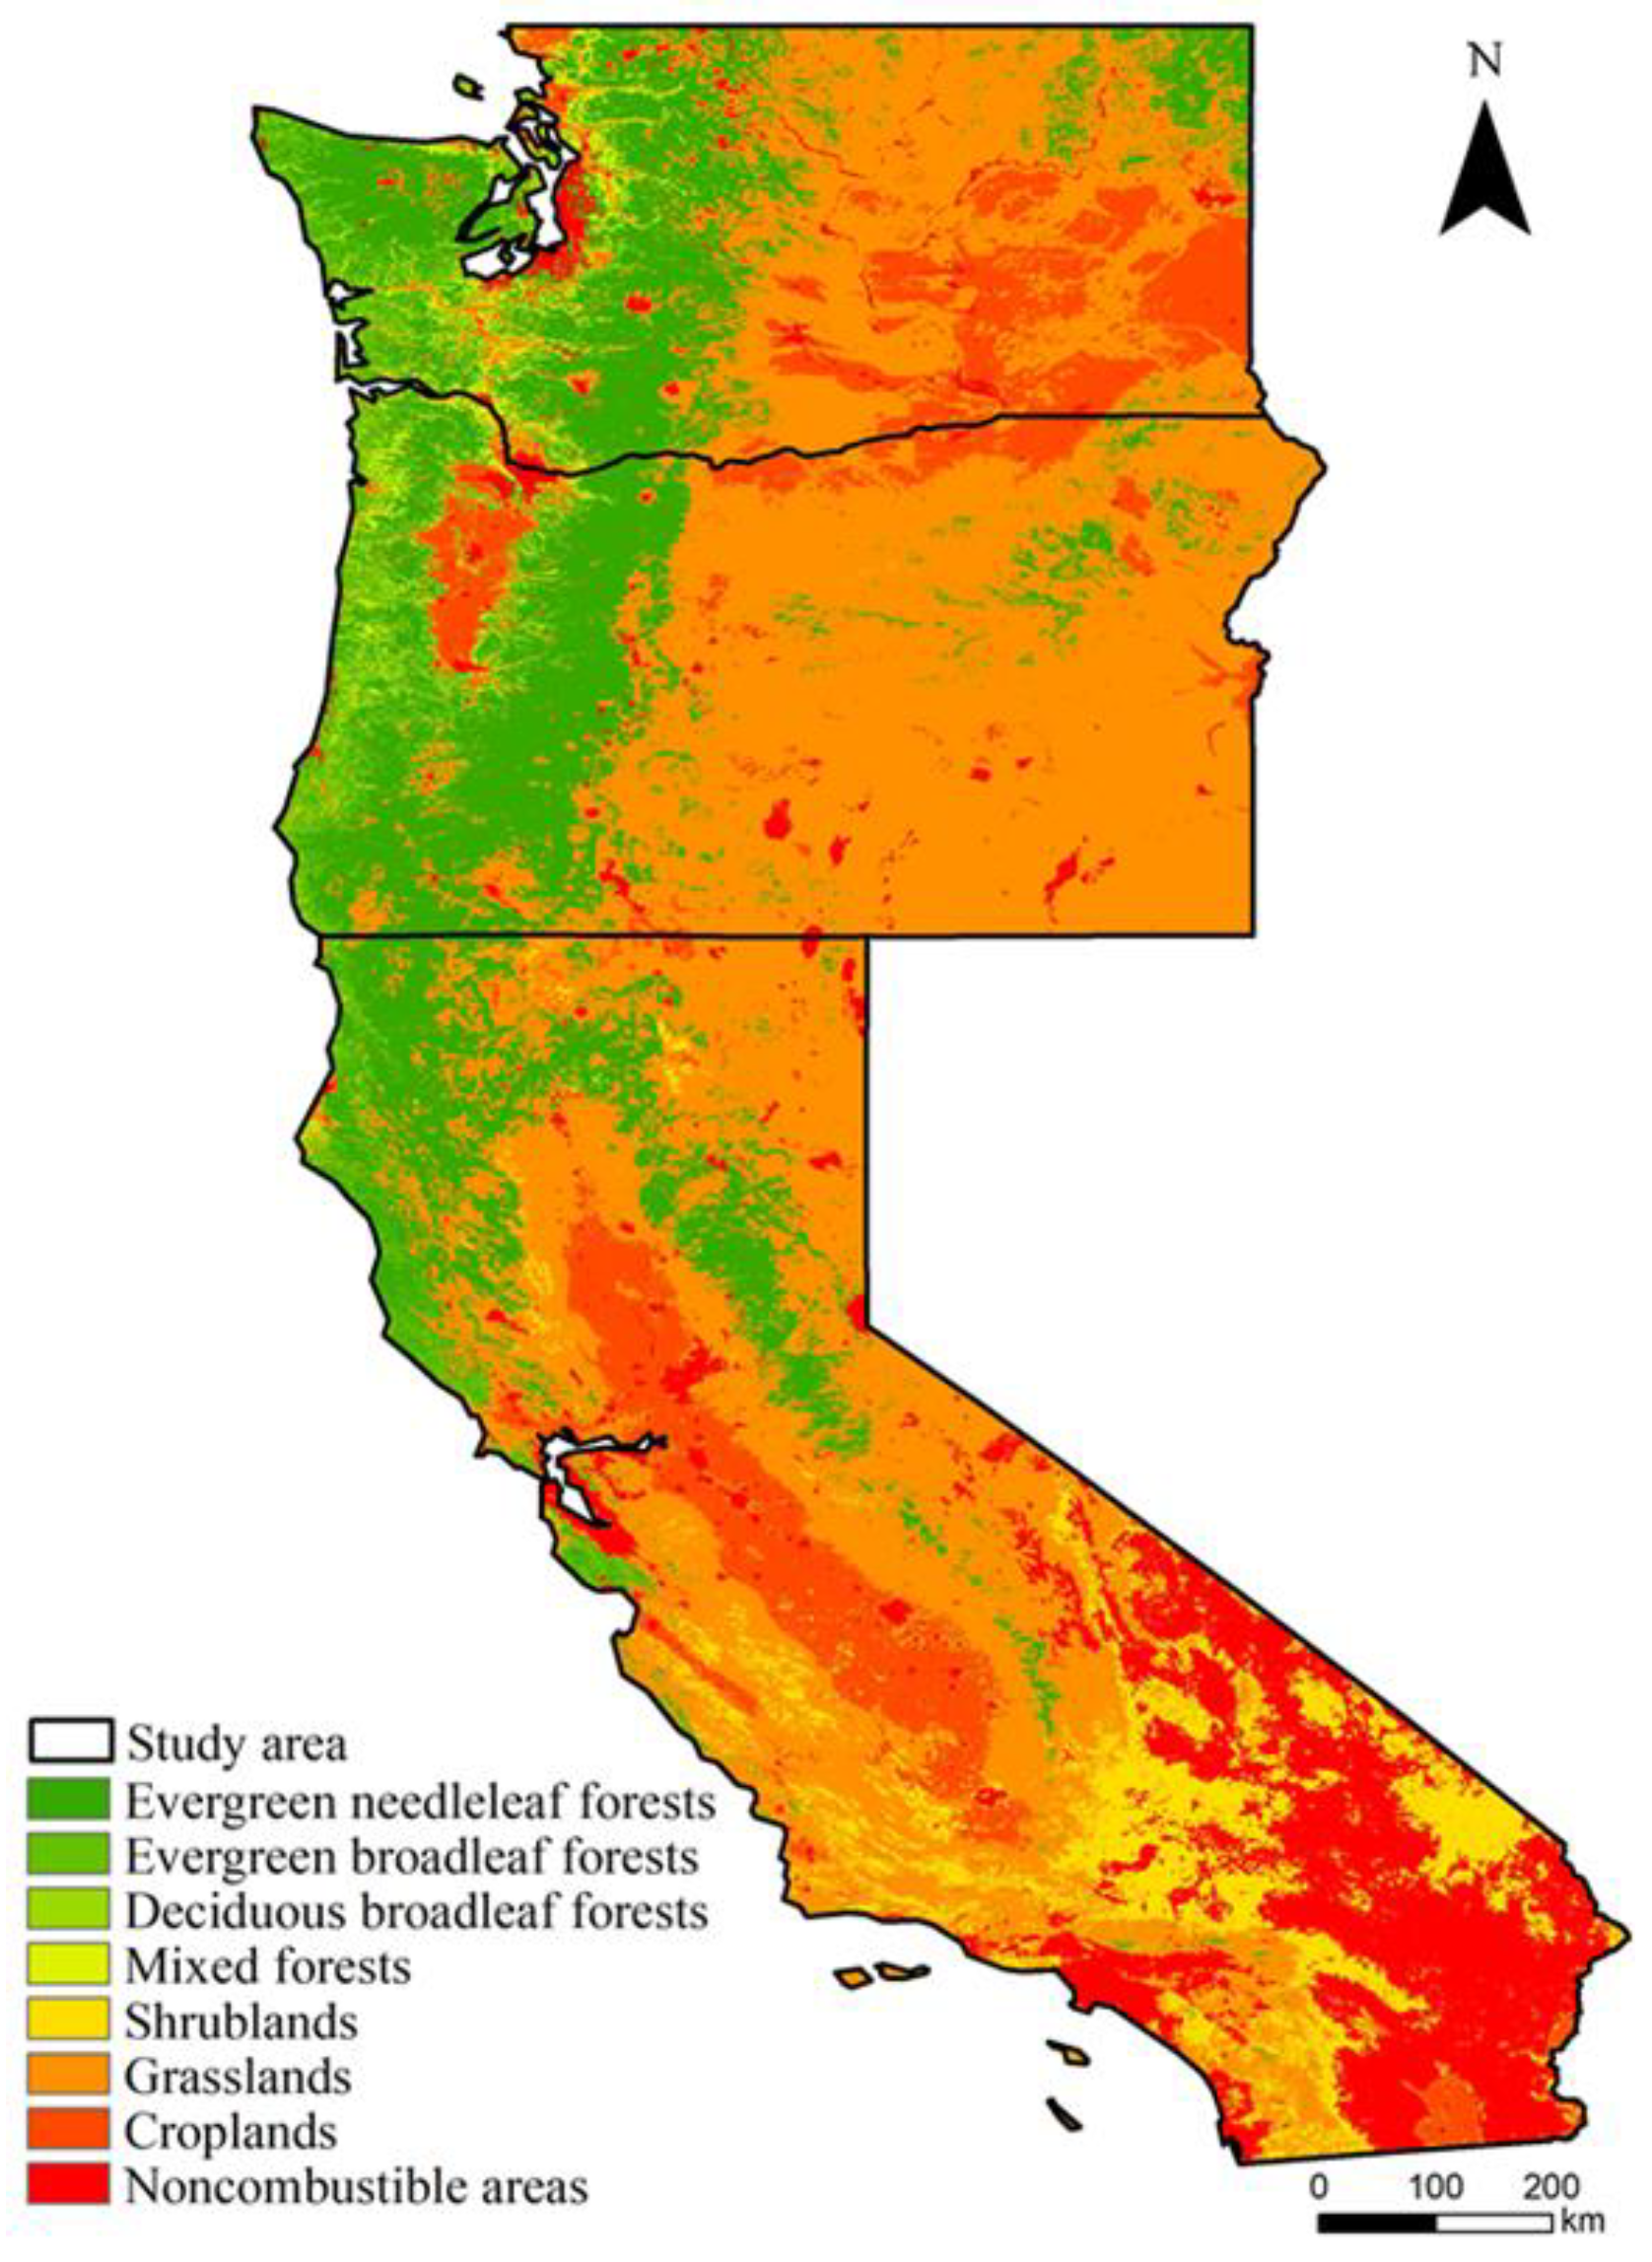
A land cover map was obtained from Google Developers (2022) for 2018 [59]. There were seventeen land cover types in the database, and these were reaggregated into eight land cover types based on the MODIS Land Cover Type Product (MCD12Q1) user guide. The eight land cover types, along with their percentages in this study, were as follows:
- Evergreen needleleaf forests (19.6%);
- Evergreen broadleaf forests (2.18%);
- Deciduous broadleaf forests (0.06%);
- Mixed forests (1.97%);
- Shrublands: closed shrublands, open shrublands (6.08%);
- Grasslands: woody savannas, savannas, grasslands, and permanent wetlands (49.83%);
- Croplands: croplands, cropland/natural vegetation mosaics (9.34%);
- Non-combustible areas: water bodies, barren, permanent snow and ice, and urban and built-up lands (10.94%).
As shown in Figure 4, the dominant forest types in western Washington and Oregon were deciduous broadleaf, evergreen broadleaf, and evergreen needleleaf forests, whereas eastern Washington and Oregon were mainly covered by grasslands. The major forest type in northwest California was evergreen forest, and the rest of California was mainly covered by grasslands and shrublands. Non-combustible areas were excluded from analysis.
2.2.3. Slope and Aspect Maps
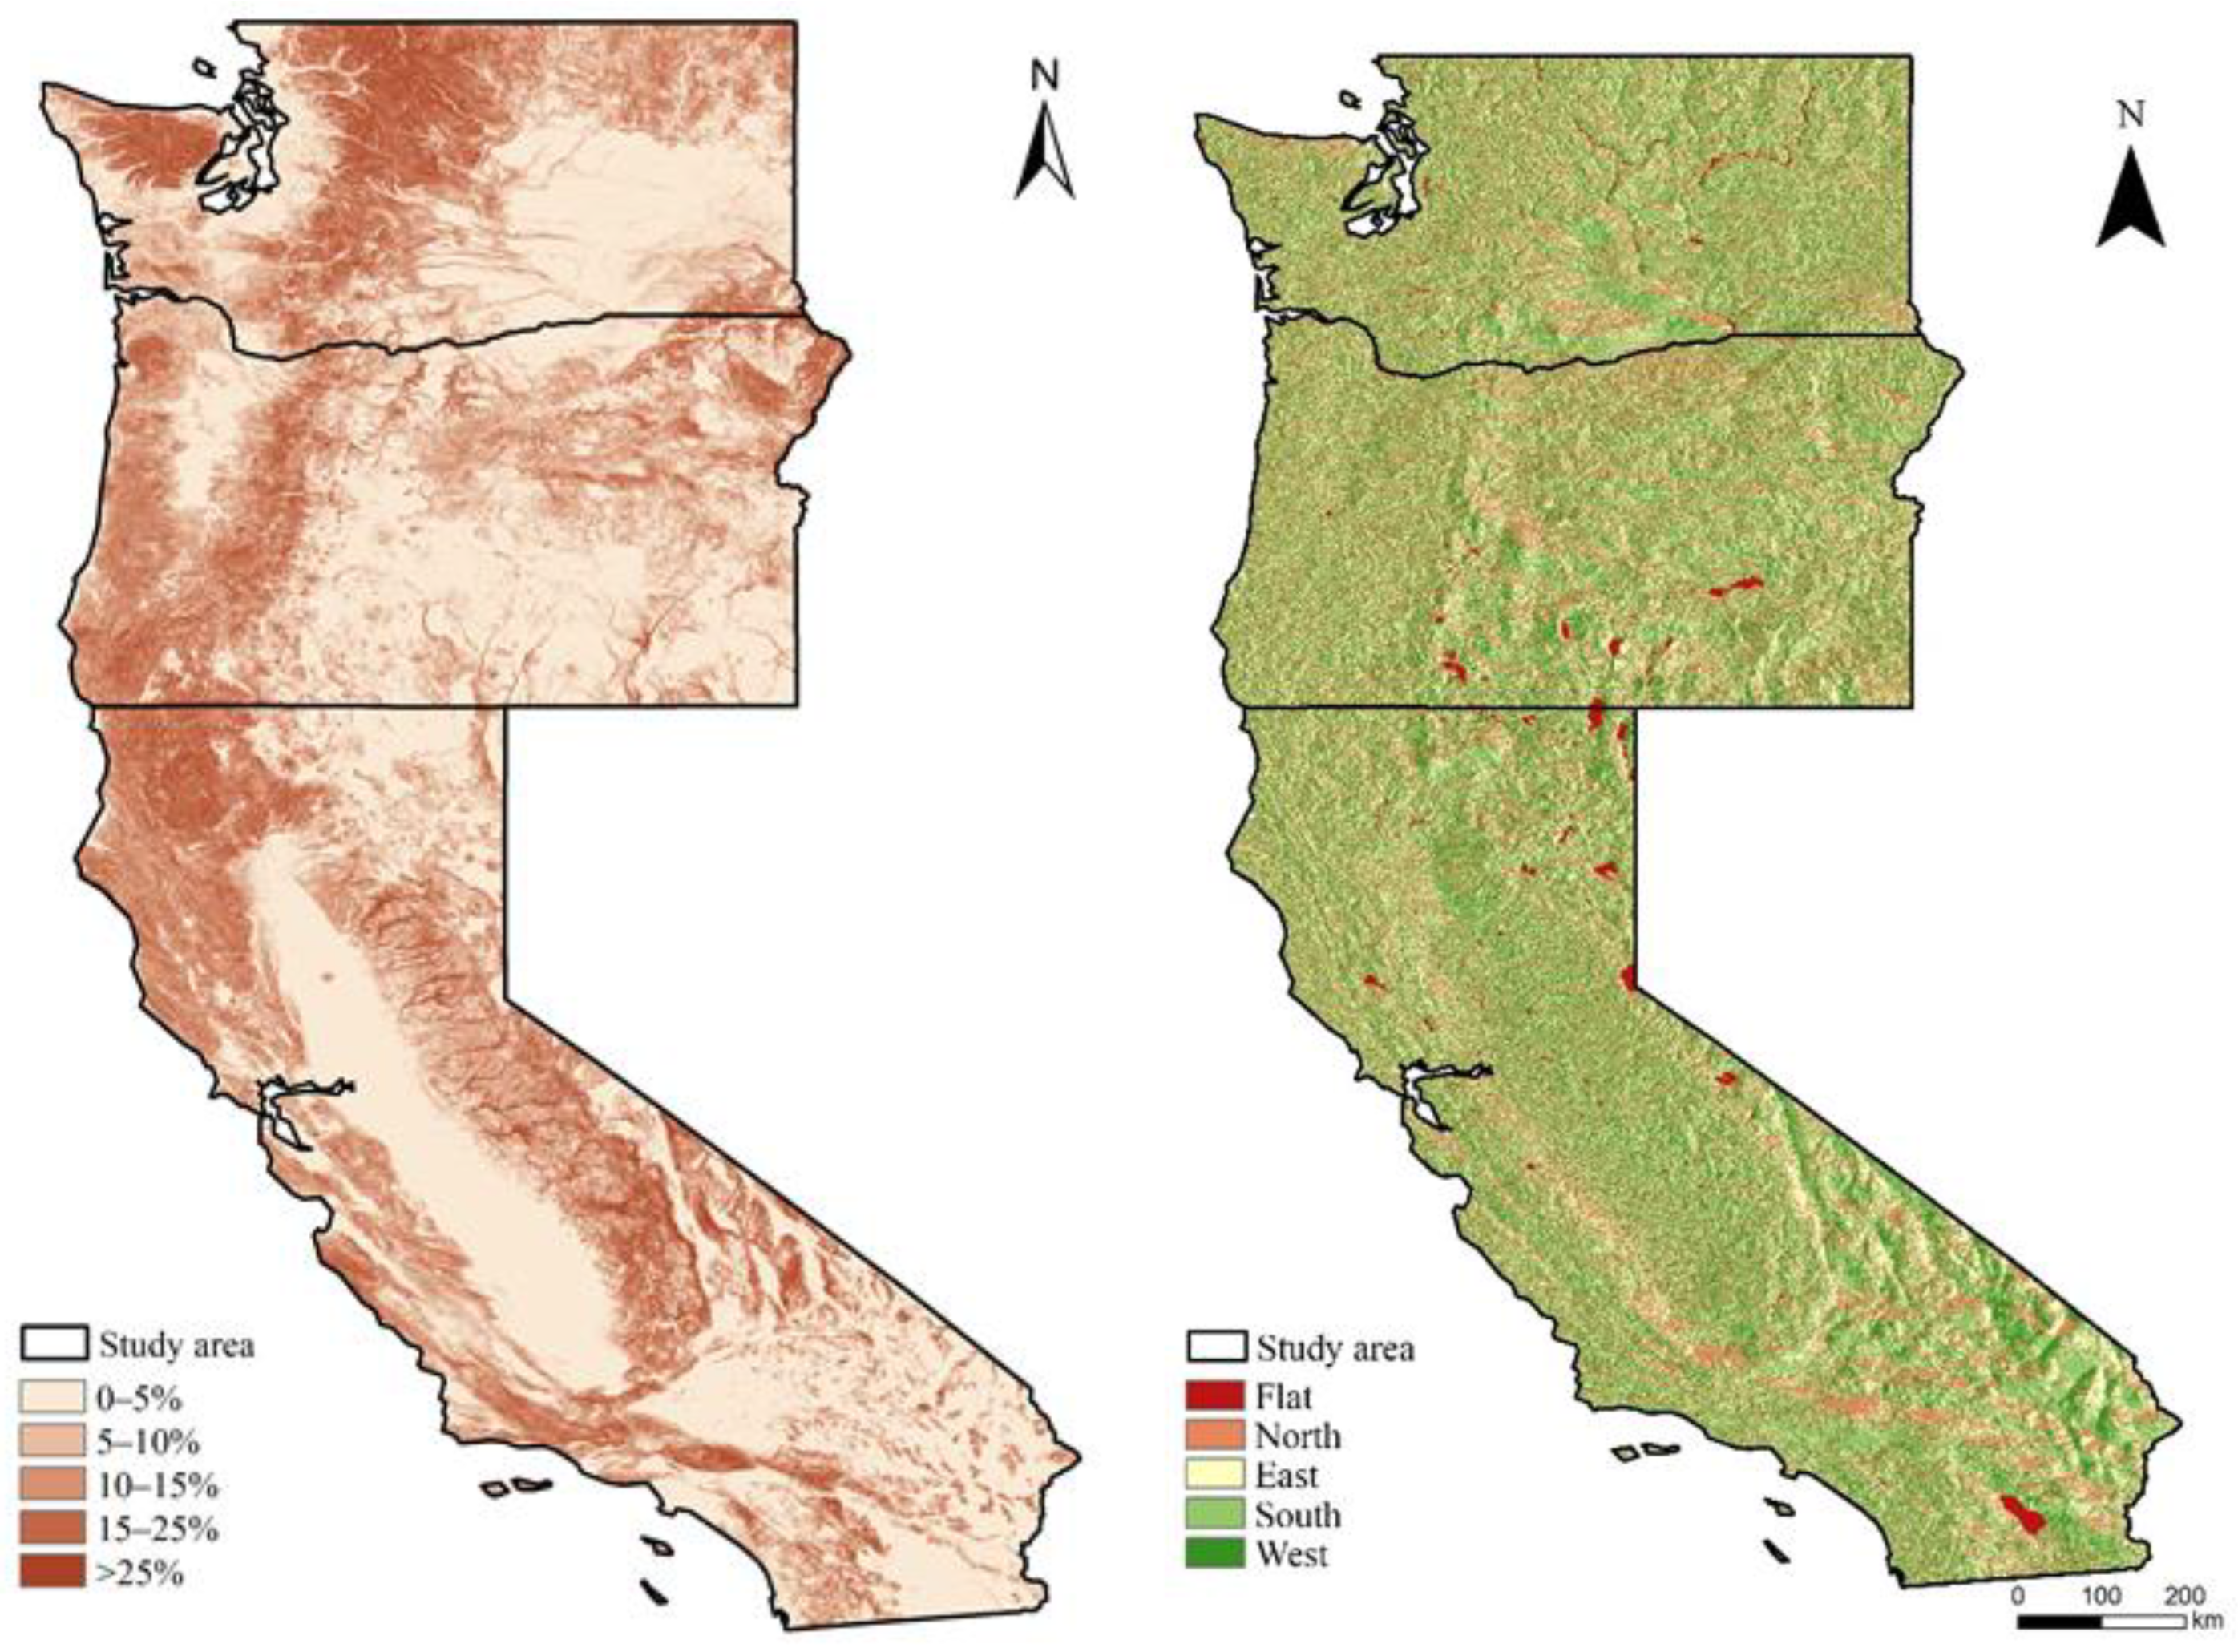
The slope and aspect maps were obtained from Google Developers (2022) NASA NASADEM Digital Elevation 30 m database [60]. The slope was divided into five categories: 0%–5%, 5%–10%, 10%–15%, 15%–25%, and >25%. The aspect was classified into five categories: flat, north (315–45°), east (45–135°), south (135–225°), and west (225–315°). The slope and aspect maps are shown in Figure 5.
2.3. Wildfire Proneness
The wildfire proneness is indexed by the computation of selection ratios. The selection ratios were originally proposed by Manly et al. (1993) [43] for the study of resource selection by animals and then first applied to wildfire proneness by Moreira et al. (2001) [39]. The selection ratio is expressed as:
where is the given land cover type or topographic class, is the proportion of burned land cover type or topographic class in the wildfire polygon, and is the proportion of available land cover type or topographic class in the circular surrounding buffer. By assuming the polygon of wildfires as a circle when there is no land cover or topography effects [61], the circular buffer centers at the ignition point and has an area equal to the size of the wildfire polygon. When , the given land cover type or topography class is burned in proportion to its availability. When , the given land cover type or topography class was less prone to wildfires. When , the given land cover type or topography class would burn more than expected if the fires occurred randomly in the landscape. In addition, the class is significantly more or less prone to wildfires when the confidence intervals do not include the selection ratio of one.
To identify the fire selection pattern, the selection ratios for each land cover category, slope level, and aspect category in the western United States were calculated. The selection ratios with regard to land cover, slope, and aspect in the three separate states were then calculated to compare the potential differences throughout the study area.
2.4. Assessment of the Relationship between Topographic Effects and Land Cover Types
The assessment of interdependence is twofold, including the assessment of the role of land cover types in explaining the fire proneness of topographic features and the assessment of the role of topographic features in the fire proneness of land cover types. Spearman’s rank correlation test was used to test the former dependence, and Friedman’s test was applied to test the latter dependence.
2.4.1. Land Cover Types on the Fire Proneness of Topographic Features
For this assessment, it was assumed that a certain topographic feature was more prone to wildfires if a more fire-prone land cover type was available. To test this hypothesis, the weighted fire-proneness index for each topographic feature, based on the average selection ratio for each land cover, was calculated. The Spearman rank correlation test was used to test the correlation between the obtained index and the direct selection ratio for each topographic feature class [62]. The Spearman rank correlation test measures the statistical monotonic dependence (whether linear or not) between the rankings of two variables and is computed as:
where and are the two variables; and are the means of the two variables; the numerator is the covariance of the rank variables; and the denominator is the standard deviation of the rank variables.
2.4.2. Topographic Features on the Fire Proneness of Land Cover Types
For this assessment, it was assumed that a certain topographic feature systematically had a higher or lower proportion of burned land cover [63]. The frequency of burned land cover types across all topographic features was calculated, and the G-test was used to test the null hypothesis that the proportion of burned forest cover types is independent of topographic features. Friedman’s test and Kendall’s W test could then be used to test the tendency assumption. Friedman’s test is a nonparametric statistical test developed by Milton Friedman to detect treatment differences.
3. Results
3.1. Fire Selection Patterns
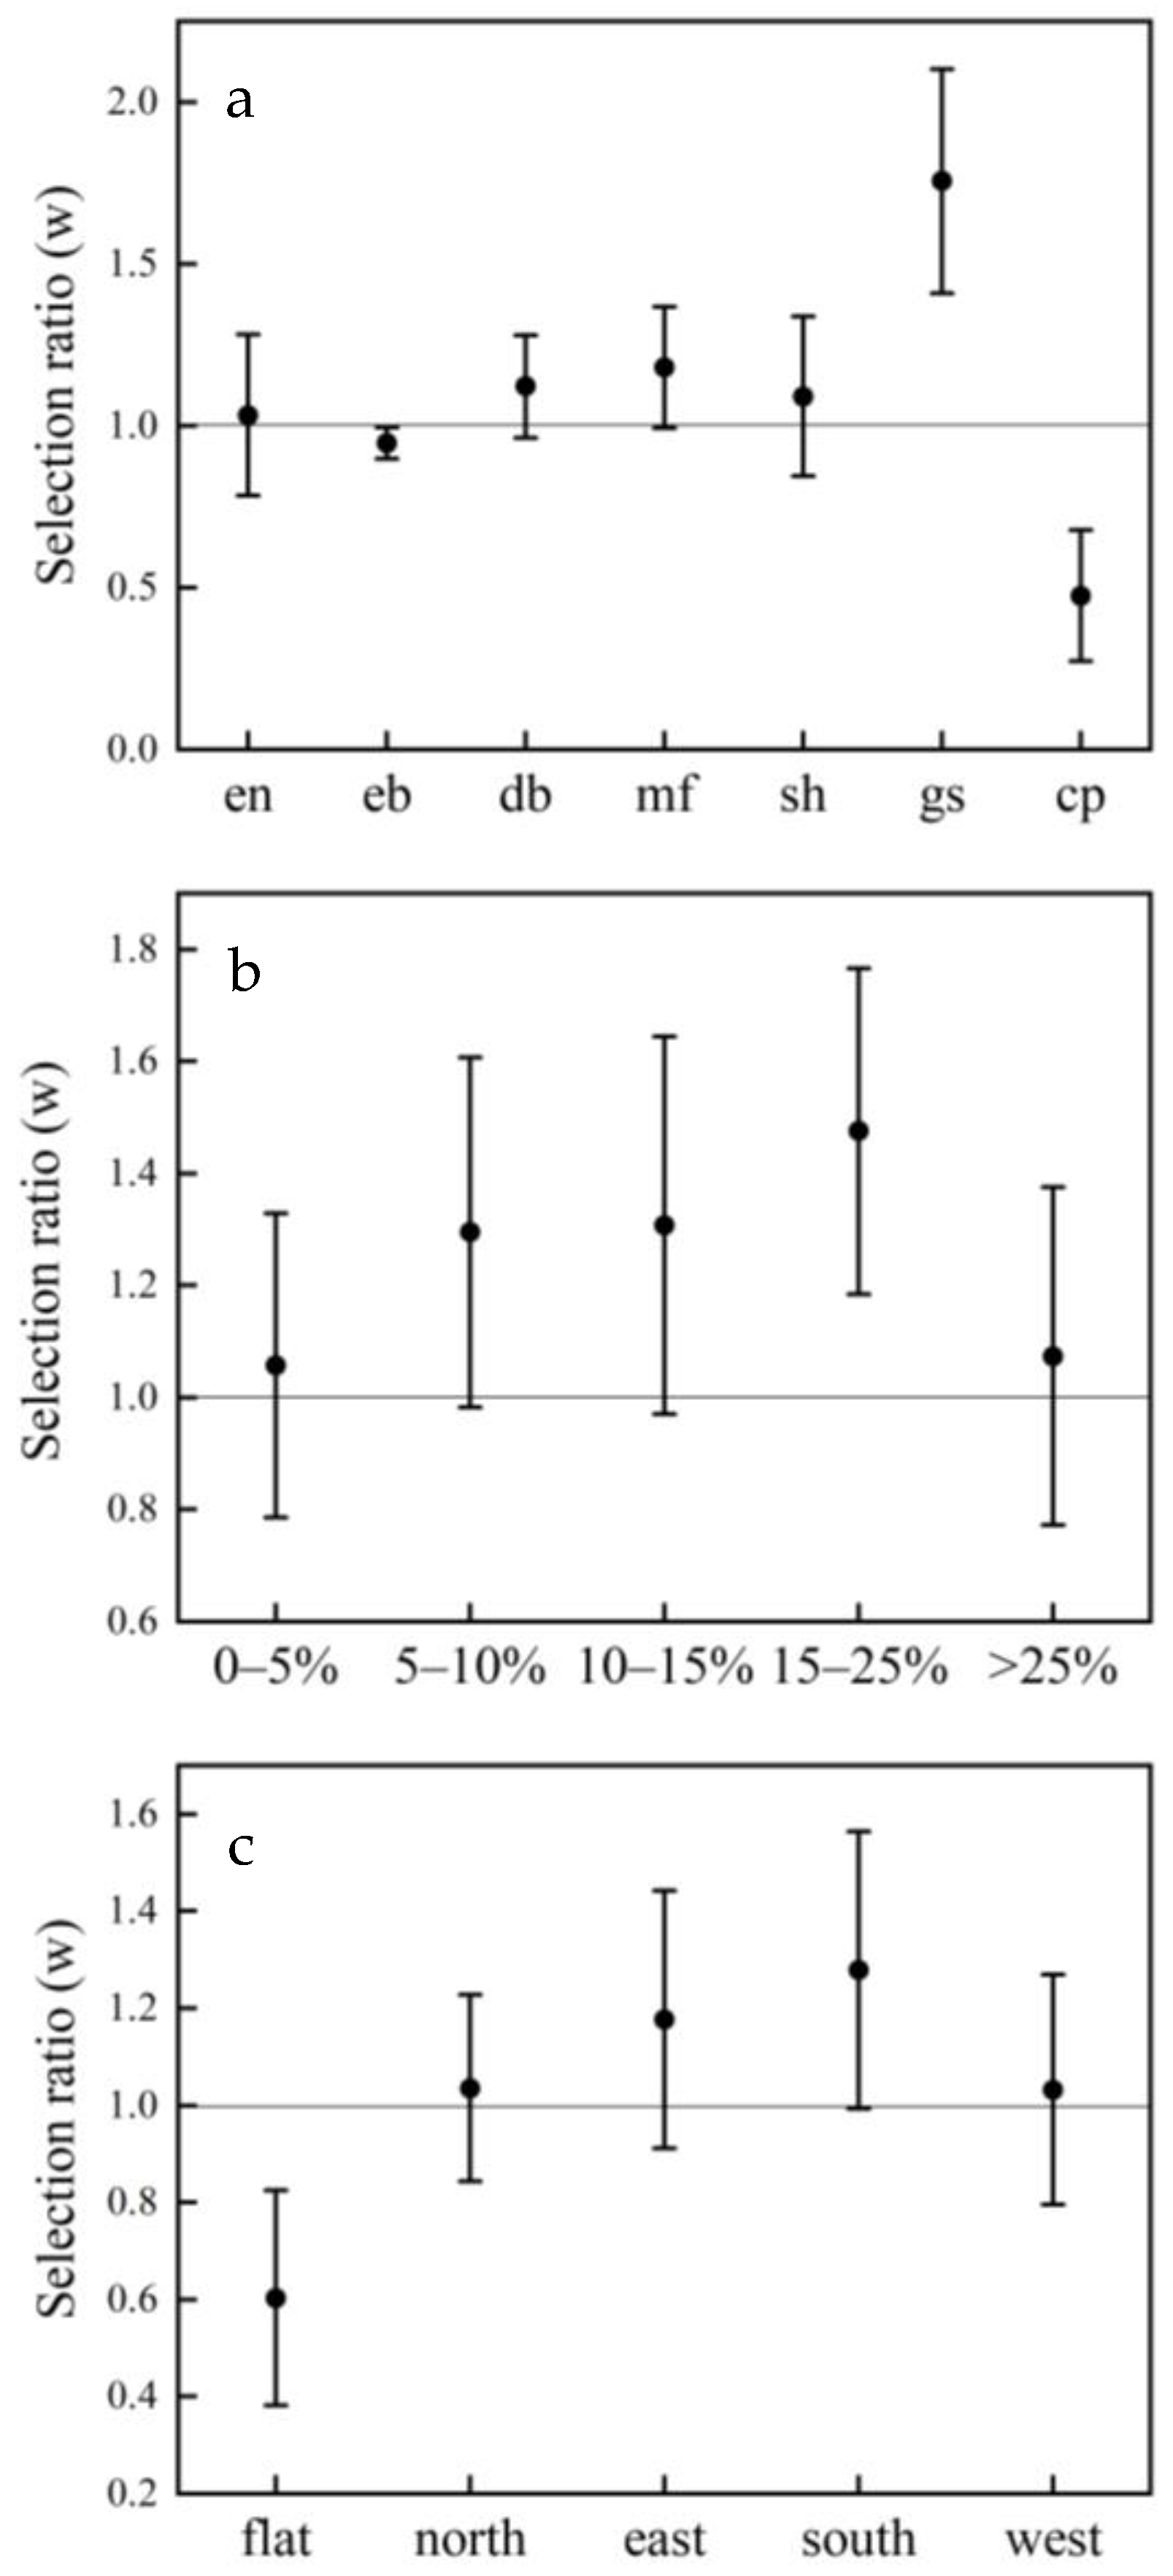
The average selection ratios with 95% confidence intervals for land cover, slope, and aspect for the western United States are presented in Figure 6. Within the land cover categories, the selection ratio for grasslands was the highest, with a value of 1.76 and the selection ratio of one is excluded from the confidence intervals (Figure 6a). Therefore, grasslands were significantly most susceptible to wildfires, with a ratio of 1.76 times more than expected if fires occurred randomly in the landscape. The selection ratios for evergreen needleleaf forests, deciduous broadleaf forests, mixed forests, and shrublands were slightly greater or less than 1, but they are insignificant (Figure 6a). In contrast, it is only just significant for mixed forests and evergreen broadleaf forests.
As can be seen from Figure 6b, the selection ratios for slopes of 0%–5%, 5%–10%, 10%–15%, 15%–25%, and above 25% were 0.79, 1.29, 1.31, 1.48, and 1.07, respectively. Among the five slope categories, only slopes of 15%–25% are significantly more prone to wildfires. Although insignificant for other slopes, the results show an upward trend with steeper slopes, except for the steepest slope (>25%). The results indicate that steeper slopes would burn in a larger proportion than the available proportion, but the steepest slopes (slope > 25%) would burn nearly proportionally to their availability.
The selection ratio for flat land was 0.54 with a confidence interval of 0.22, which makes it the significantly least fire-prone aspect (Figure 6c). Other aspects are insignificantly more or less prone to wildfires. The south-facing aspect had the highest selection ratio of 1.28, and as a result, wildfires on the south-facing aspect would burn 1.28 times the proportion of the abundance on the landscape.
3.2. Regional Variations
The average selection ratios with 95% confidence intervals for land cover, slope, and aspect for Washington, Oregon, and California are presented in Table 1. In Washington, evergreen needleleaf forests, mixed forests, and grasslands had selection ratios greater than one, which indicates that these land cover types would burn more than expected if fires occurred randomly in the landscape. Among these three land cover types, mixed forests had the highest selection ratio of 1.50 and the confidence interval of 0.14, indicating that mixed forests in Washington are significantly more prone to wildfires. In Oregon, evergreen broadleaf forests and grasslands had selection ratios of 1.14 and 2.24 and their confidence intervals did not include the selection ratio of 1, making these two land cover types burn significantly more than expected. Deciduous broadleaf forests, mixed forests, and croplands in Oregon would burn significantly less than expected, because the selection ratios for these types were less than one. In California, the deciduous broadleaf forests (), mixed forests (), and grasslands () had the selection ratio greater than one, which indicates that grasslands burn in an average proportion of 1.53, 1.35, and 1.97 times significantly more than the available proportion. Other land cover types in California would burn less than expected if fires occurred randomly within the landscape, although insignificantly.
The selection ratios for slopes in Washington, Oregon, and California showed some similarities, with larger selection ratios for steeper slopes and lower selection ratios for the flattest or steepest slopes. The results show that slopes of 15%–25% were the most prone to wildfires across the three states. Among the three states, slopes of 15%–25% had the selection ratios of 1.95 in Oregon and 1.42 in Washington and the 95% significance levels did not include the section ratio of 1. The results suggest that slopes of 15%–25% in Oregon would burn significantly in an average proportion of 1.95 times more than the available proportion, and in Washington would burn in an average proportion of 1.42, significantly. The selection ratios for aspect in Washington, Oregon, and California also showed similar trends, with the highest selection ratio for the south-facing aspect and the lowest selection ratio for flat lands. Among the three states, the south-facing aspect in Oregon had the highest selection ratio of 1.75, and that in Washington and California had a similar selection ratio of 1.04. The results suggest that the south-facing aspects in Oregon would burn 1.75 times significantly in proportion to their abundance in the landscape.
3.3. Relationships between Topographic Features and Land Cover Types
3.3.1. Land Cover Types on the Fire Proneness of Topographic Features
The Spearman rank test revealed no significant correlation () between the weighted fire proneness index estimated from land cover and the average selection ratio for the five slope categories. There was also no correlation () between the weighted index and average selection ratio. Therefore, the results suggest that land cover could not explain the fire proneness of the slope and aspect categories.
3.3.2. Topographic Features on the Fire Proneness of Land Cover Types
The G-test statistics for slope () indicated that the proportion of burned area for a given land cover class was not independent of the slope. In addition, the Friedman test () indicated that the proportion of burned areas increased significantly with slopes across land cover types. The G-test statistics for aspect () indicated that the proportion of burned area for a given land cover class was not independent of aspect. In addition, the Friedman test () suggested that the proportion of burned area was smaller in flat lands and larger in the southern aspect.
4. Discussion
This study applied the selection ratio approach to study wildfire proneness with regard to land cover types and topographic features in the western United States. This study confirmed the selection of wildfires with regard to land cover type, slope, and aspect, consistent with previous studies [33,37,45]. Among the land cover types, grasslands were the most wildfire-prone land cover type. Although other forest types were less susceptible to wildfires, they would burn in a slightly larger proportion than their abundance in the landscape, except for evergreen broadleaf forests and croplands. Land use influences fire occurrence directly through fuel accumulation (e.g., dead, standing, or lying trees) and fuel continuity as well as vegetation composition and structure and indirectly through the seasonal bioclimatic characteristics of the landscape. It is possible that fuels accumulate more easily on grasslands, and the dry bioclimate on this land cover type is more suitable for wildfire occurrence.
Consistent with Oliveira et al. (2014) [37], our research found that lands with slopes greater than 25% were significantly less fire-prone than those with lower slopes. Previous research explained that steeper areas are less accessible, and as a result, human beings are less likely to ignite wildfires. In addition, there is less vegetation and accumulated fuel on steeper slopes, so the vegetation structure is less flammable [64,65]. However, Mermoz et al. (2005) [64] and Carmo et al. (2011) [33] found that wildfires are more likely to occur on steep slopes, and explained that land cover types on steep slopes were most likely to burn [24,66]. In this study, the western United States is less populated, and steep slopes are less covered by vegetation and less accessible to human beings. As a result, natural and human-caused ignitions are less likely to occur on steep slopes, and the vegetation is not dense enough to initiate a wildfire. In contrast, slopes of 5%–25% are found to have higher fire proneness. It could be explained that wildfires spread more rapidly on less steep but vegetation-abundant slopes [24,65].
The south-facing aspects throughout the study area were the most fire-prone, whereas flat lands were the least fire-prone. The north-facing aspects were found to be the second-least fire-prone. The role of north-facing aspects in wildfire proneness is controversial in the published literature. In the study by Oliveira et al. (2014) [37], north-facing lands were less selectively preferred by fires because less solar exposure in the north-facing lands increased moisture and decreased flammability. In contrast, studies by Nunes (2004) [45] and Carmo et al. (2011) [33] found higher propensities on the north-facing lands in northern Portugal because heavier fuel loads were accumulated in the higher moisturized aspect. The results from our study are consistent with the findings of Oliveira et al. (2014) [37] and support the explanation that less solar exposure in the north-facing aspects decreases wildfire occurrence.
Regional variations in fire selection patterns were obvious for land cover type but not for slope and aspect, which indicated that land cover might be the primary factor in determining fire occurrence in the western United States. Mixed forests in Washington were most prone to wildfires, whereas grasslands in Oregon and California were highly susceptible to wildfire occurrence. This difference could be caused by the different proportions of land cover types in these three states, which could be determined by precipitation and other topographical characteristics. The average total yearly precipitation for Washington was 38.4 inches in 2018, for Oregon was 27.4 inches, and for California was 22.2 inches [66]. Therefore, California was the driest of the three states.
We also found that topographic features could explain the fire proneness of land cover categories in the three states of the western United States. This supports the assumption that topographic features have certain tendencies for burned land cover categories [63]. The proportion of burned area of a given land cover depends on the slope and aspect. The burned land cover type was more susceptible to steeper slopes and south aspects but less prone to flat aspects. This could be explained by the fact that the southern aspects are usually drier and more susceptible to wildfires.
This research only considered land cover type, slope, and aspect as factors in fire selection patterns. Future research could improve the selection ratio approach by trying to include human activities and climate factors because they contribute to wildfire regimes through ignitions, prescribed fires, fire suppressions, and cultivation [67,68,69], and wildland urban interfaces have a higher probability of wildfires [70,71,72,73]. In addition, this research did not distinguish between human-induced wildfires and lightning-induced wildfires. Human activities, such as wildland–urban interface, could be a key driver of forest wildfires in the western United States [74]. Future research could examine the wildfire occurrence probabilities with regard to various factors for these two types of induced wildfires.
5. Conclusions
This study showed how fire proneness varies across land cover type, slope, and aspect. There are four key findings from this research. First, our findings suggest that grasslands were the most wildfire-prone land cover types in the western United States, and croplands were the least. Second, this study also found that steeper slopes were more prone to wildfires, with the exception of the steepest slope (>25%). Third, for aspect, the south-facing aspects would burn more than the availability on the landscape, whereas the flat lands would burn less than the availability. Fourth, the findings revealed that there were regional variations in the fire selection patterns in terms of land cover types in the states of Washington, Oregon, and California, but similar trends in terms of slope and aspect. Specifically, the most wildfire-prone land cover type in Washington was mixed forests, and that in Oregon and California was grasslands. In Oregon and California, fires burnt more than expected if they occurred randomly in the landscape.
This study attempted to characterize the fire proneness pattern in the western United States, with the aim of revealing common but differentiated features of land cover type, slope, and aspect in the states of Washington, Oregon, and California. These results have important implications in landscape planning and management. From a practical perspective, detailed knowledge of wildfire occurrence selection patterns for different land cover types and topographic features could provide an effective tool for fire risk management, which is especially important in rapidly evolving climatic scenarios and landscapes. The revealing of regional differences in fire selection in the three states suggested that forestry departments could apply common fire management strategies but with a different emphasis at the landscape level.
Author Contributions
Conceptualization, J.Z.; methodology, J.Z.; validation, Z.N.; investigation, J.Z.; writing—original draft preparation, J.Z.; writing—review and editing, S.Y.; supervision, R.D. All authors have read and agreed to the published version of the manuscript.
Funding
The study was supported by the National Natural Science Foundation of China (Program No. 72203095), and the Social Science Foundation of Jiangsu Province (Program No. 22EYC007).
Data Availability Statement
Not applicable.
Acknowledgments
We would like to thank all the authors and reviewers for their great guidance and help in writing this manuscript.
Conflicts of Interest
The authors declare no conflict of interest.
References
- Westerling, A.L.; Hidalgo, H.G.; Cayan, D.R.; Swetnam, T.W. Warming and earlier spring increase western US forest wildfire activity. Science 2006, 313, 940–943. [Google Scholar] [CrossRef] [PubMed] [Green Version]
- Miller, J.D.; Safford, H.D.; Crimmins, M.; Thode, A.E. Quantitative evidence for increasing forest fire severity in the Sierra Nevada and southern Cascade Mountains, California and Nevada, USA. Ecosystems 2009, 12, 16–32. [Google Scholar] [CrossRef]
- Dennison, P.E.; Brewer, S.C.; Arnold, J.D.; Moritz, M.A. Large wildfire trends in the western United States, 1984–2011. Geophys. Res. Lett. 2014, 41, 2928–2933. [Google Scholar] [CrossRef]
- Keyser, A.R.; Westerling, A.L. Predicting increasing high severity area burned for three forested regions in the western United States using extreme value theory. For. Ecol. Manag. 2019, 432, 694–706. [Google Scholar] [CrossRef]
- Podschwit, H.; Cullen, A. Patterns and trends in simultaneous wildfire activity in the United States from 1984 to 2015. Int. J. Wildland Fire 2020, 29, 1057–1071. [Google Scholar] [CrossRef]
- Zhai, J.; Ning, Z. Models for the Economic Impacts of Forest Disturbances: A Systematic Review. Land 2022, 11, 1608. [Google Scholar] [CrossRef]
- Calkin, D.E.; Gebert, K.M.; Jones, J.G.; Neilson, R.P. Forest Service large fire area burned and suppression expenditure trends, 1970–2002. J. For. 2005, 103, 179–183. [Google Scholar] [CrossRef]
- Abt, K.L.; Prestemon, J.P.; Gebert, K.M. Wildfire suppression cost forecasts for the US Forest Service. J. For. 2009, 107, 173–178. [Google Scholar]
- Lee, S.W.; Lee, M.B.; Lee, Y.G.; Won, M.S.; Kim, J.J.; Hong, S.K. Relationship between landscape structure and burn severity at the landscape and class levels in Samchuck, South Korea. For. Ecol. Manag. 2009, 258, 1594–1604. [Google Scholar] [CrossRef]
- Restaino, J.C.; Peterson, D.L. Wildfire and fuel treatment effects on forest carbon dynamics in the western United States. For. Ecol. Manag. 2013, 303, 46–60. [Google Scholar] [CrossRef]
- Westerling, A.L. Increasing western US forest wildfire activity: Sensitivity to changes in the timing of spring. Philos. Trans. R. Soc. 2016, 371, 20150178. [Google Scholar] [CrossRef] [Green Version]
- Fernández-Guisuraga, J.M.; Suárez-Seoane, S.; García-Llamas, P.; Calvo, L. Vegetation structure parameters determine high burn severity likelihood in different ecosystem types: A case study in a burned Mediterranean landscape. J. Environ. Manag. 2021, 288, 112462. [Google Scholar] [CrossRef] [PubMed]
- Malamud, B.D.; Millington, J.D.; Perry, G.L. Characterizing wildfire regimes in the United States. Proc. Natl. Acad. Sci. USA 2005, 102, 4694–4699. [Google Scholar] [CrossRef] [PubMed] [Green Version]
- Noss, R.F.; Franklin, J.F.; Baker, W.L.; Schoennagel, T.; Moyle, P.B. Managing fire-prone forests in the western United States. Front. Ecol. Environ. 2006, 4, 481–487. [Google Scholar] [CrossRef] [Green Version]
- Korb, J.E.; Fornwalt, P.J.; Stevens-Rumann, C.S. What drives ponderosa pine regeneration following wildfire in the western United States? For. Ecol. Manag. 2019, 454, 117663. [Google Scholar] [CrossRef]
- Thompson, D.K.; Parisien, M.A.; Morin, J.; Millard, K.; Larsen, C.P.; Simpson, B.N. Fuel accumulation in a high-frequency boreal wildfire regime: From wetland to upland. Can. J. For. Res. 2017, 47, 957–964. [Google Scholar] [CrossRef] [Green Version]
- Stralberg, D.; Wang, X.; Parisien, M.A.; Robinne, F.N.; Sólymos, P.; Mahon, C.L.; Nielsen, S.E.; Bayne, E.M. Wildfire-mediated vegetation change in boreal forests of Alberta, Canada. Ecosphere 2018, 9, e02156. [Google Scholar] [CrossRef]
- Whitman, E.; Parisien, M.A.; Thompson, D.K.; Flannigan, M.D. Short-interval wildfire and drought overwhelm boreal forest resilience. Sci. Rep. 2019, 9, 18796. [Google Scholar] [CrossRef] [Green Version]
- McKenzie, D.; Gedalof, Z.E.; Peterson, D.L.; Mote, P. Climatic change, wildfire, and conservation. Conserv. Biol. 2004, 18, 890–902. [Google Scholar] [CrossRef]
- Littell, J.S.; McKenzie, D.; Peterson, D.L.; Westerling, A.L. Climate and wildfire area burned in western US ecoprovinces, 1916–2003. Ecol. Appl. 2009, 19, 1003–1021. [Google Scholar] [CrossRef]
- Abatzoglou, J.T.; Williams, A.P. Impact of anthropogenic climate change on wildfire across western US forests. Proc. Natl. Acad. Sci. USA 2016, 113, 11770–11775. [Google Scholar] [CrossRef] [PubMed] [Green Version]
- Le Page, Y.; Morton, D.; Hartin, C.; Bond-Lamberty, B.; Pereira, J.M.C.; Hurtt, G.; Asrar, G. Synergy between land use and climate change increases future fire risk in Amazon forests. Earth Syst. Dyn. 2017, 8, 1237–1246. [Google Scholar] [CrossRef] [Green Version]
- Holden, Z.A.; Swanson, A.; Luce, C.H.; Jolly, W.M.; Maneta, M.; Oyler, J.W.; Warren, D.A.; Parsons, R.; Affleck, D. Decreasing fire season precipitation increased recent western US forest wildfire activity. Proc. Natl. Acad. Sci. USA 2018, 115, E8349–E8357. [Google Scholar] [CrossRef] [PubMed] [Green Version]
- Peterson, D.A.; Hyer, E.J.; Campbell, J.R.; Fromm, M.D.; Hair, J.W.; Butler, C.F.; Fenn, M.A. The 2013 Rim Fire: Implications for predicting extreme fire spread, pyroconvection, and smoke emissions. Bull. Am. Meteorol. 2015, 96, 229–247. [Google Scholar] [CrossRef]
- Chen, B.; Jin, Y.; Scaduto, E.; Moritz, M.A.; Goulden, M.L.; Randerson, J.T. Climate, fuel, and land use shaped the spatial pattern of wildfire in California’s Sierra Nevada. J. Geophys. Res. Biogeosci. 2021, 126, e2020JG005786. [Google Scholar] [CrossRef]
- Touma, D.; Stevenson, S.; Swain, D.L.; Singh, D.; Kalashnikov, D.A.; Huang, X. Climate change increases risk of extreme rainfall following wildfire in the western United States. Sci. Adv. 2022, 8, eabm0320. [Google Scholar] [CrossRef] [PubMed]
- Chen, B.; Jin, Y. Spatial patterns and drivers for wildfire ignitions in California. Environ. Res. Lett. 2022, 17, 055004. [Google Scholar] [CrossRef]
- Varela, V.; Vlachogiannis, D.; Sfetsos, A.; Karozis, S.; Politi, N.; Giroud, F. Projection of forest fire danger due to climate change in the French Mediterranean region. Sustainability 2019, 11, 4284. [Google Scholar] [CrossRef] [Green Version]
- Yankovich, K.S.; Yankovich, E.P.; Baranovskiy, N.V. Classification of vegetation to estimate forest fire danger using landsat 8 images: Case study. Math. Probl. Eng. 2019, 2019, 6296417. [Google Scholar] [CrossRef]
- Canturk, U.; Kulaç, Ş. The effects of climate change scenarios on Tilia ssp. in Turkey. Environ. Monit. Assess. 2021, 193, 771. [Google Scholar] [CrossRef]
- Ertugrul, M.; Varol, T.; Ozel, H.B.; Cetin, M.; Sevik, H. Influence of climatic factor of changes in forest fire danger and fire season length in Turkey. Environ. Monit. Assess. 2021, 193, 28. [Google Scholar] [CrossRef] [PubMed]
- Varol, T.; Cetin, M.; Ozel, H.B.; Sevik, H.; Zeren Cetin, I. The effects of climate change scenarios on Carpinus betulus and Carpinus orientalis in Europe. Water Air Soil Pollut. 2022, 233, 45. [Google Scholar] [CrossRef]
- Carmo, M.; Moreira, F.; Casimiro, P.; Vaz, P. Land use and topography influences on wildfire occurrence in northern Portugal. Landsc. Urban Plan. 2011, 100, 169–176. [Google Scholar] [CrossRef] [Green Version]
- Butsic, V.; Kelly, M.; Moritz, M.A. Land use and wildfire: A review of local interactions and teleconnections. Land 2015, 4, 140–156. [Google Scholar] [CrossRef]
- Zhang, H.; Zhang, R.; Qi, F.; Liu, X.; Niu, Y.; Fan, Z.; Zhang, Q.; Li, J.; Yuan, L.; Song, Y.; et al. The CSLE model based soil erosion prediction: Comparisons of sampling density and extrapolation method at the county level. Catena 2018, 165, 465–472. [Google Scholar] [CrossRef]
- Eskandari, S.; Pourghasemi, H.R.; Tiefenbacher, J.P. Relations of land cover, topography, and climate to fire occurrence in natural regions of Iran: Applying new data mining techniques for modeling and mapping fire danger. For. Ecol. Manag. 2020, 473, 118338. [Google Scholar] [CrossRef]
- Oliveira, S.; Moreira, F.; Boca, R.; San-Miguel-Ayanz, J.; Pereira, J.M. Assessment of fire selectivity in relation to land cover and topography: A comparison between Southern European countries. Int. J. Wildland Fire 2013, 23, 620–630. [Google Scholar] [CrossRef]
- Linn, R.R.; Winterkamp, J.L.; Weise, D.R.; Edminster, C. A numerical study of slope and fuel structure effects on coupled wildfire behaviour. Int. J. Wildland Fire 2010, 19, 179–201. [Google Scholar] [CrossRef]
- Moreira, F.; Rego, F.C.; Ferreira, P.G. Temporal (1958–1995) pattern of change in a cultural landscape of northwestern Portugal: Implications for fire occurrence. Landsc. Ecol. 2001, 16, 557–567. [Google Scholar] [CrossRef]
- Erten, E.; Kurgun, V.; Musaoglu, N. Forest fire risk zone mapping from satellite imagery and GIS: A case study. In Proceedings of the XXth Congress of the International Society for Photogrammetry and Remote Sensing, Istanbul, Turkey, 12–23 July 2004; pp. 222–230. [Google Scholar]
- Moreira, F.; Vaz, P.; Catry, F.; Silva, J.S. Regional variations in wildfire susceptibility of land-cover types in Portugal: Implications for landscape management to minimize fire hazard. Int. J. Wildland Fire 2009, 18, 563–574. [Google Scholar] [CrossRef]
- Feurdean, A.; Vannière, B.; Finsinger, W.; Warren, D.; Connor, S.C.; Forrest, M.; Liakka, J.; Panait, A.; Werner, C.; Andrič, M.; et al. Fire hazard modulation by long-term dynamics in land cover and dominant forest type in eastern and central Europe. Biogeosciences 2020, 17, 1213–1230. [Google Scholar] [CrossRef] [Green Version]
- Manly, B.F.L.; McDonald, L.; Thomas, D.L.; McDonald, T.L.; Erickson, W.P. Resource Selection by Animals: Statistical Design and Analysis for Field Studies; Springer Science & Business Media: Berlin/Heidelberg, Germany, 2007. [Google Scholar]
- Cumming, S.G. Forest type and wildfire in the Alberta boreal mixedwood: What do fires burn? Ecol. Appl. 2001, 11, 97–110. [Google Scholar] [CrossRef]
- Nunes, A.N. Regional variability and driving forces behind forest fires in Portugal an overview of the last three decades (1980–2009). Appl Geogr. 2012, 34, 576–586. [Google Scholar] [CrossRef]
- Bajocco, S.; Pezzatti, G.B.; Mazzoleni, S.; Ricotta, C. Wildfire seasonality and land use: When do wildfires prefer to burn? Environ. Monit. Assess. 2010, 164, 445–452. [Google Scholar] [CrossRef] [PubMed]
- Moreira, F.; Arianoutsou, M.; Corona, P.; De las Heras, J. Post-Fire Management and Restoration of Southern European Forests; Springer Science & Business Media: Berlin/Heidelberg, Germany, 2011. [Google Scholar]
- Van Etten, E.J.; Davis, R.A.; Doherty, T.S. Fire in Semi-Arid Shrublands and Woodlands: Spatial and Temporal Patterns in an Australian Landscape. Front. Ecol. Evol. 2021, 9, 382. [Google Scholar] [CrossRef]
- Mouillot, F.; Ratte, J.P.; Joffre, R.; Moreno, J.M.; Rambal, S. Some determinants of the spatio-temporal fire cycle in a Mediterranean landscape (Corsica, France). Landsc. Ecol. 2003, 18, 665–674. [Google Scholar] [CrossRef]
- Leone, V.; Lovreglio, R.; Martín, M.P.; Martínez, J.; Vilar, L. Human factors of fire occurrence in the Mediterranean. In Earth Observation of Wildland Fires in Mediterranean Ecosystems; Springer: Berlin/Heidelberg, Germany, 2009; pp. 149–170. [Google Scholar]
- Ganteaume, A.; Camia, A.; Jappiot, M.; San-Miguel-Ayanz, J.; Long-Fournel, M.; Lampin, C. A review of the main driving factors of forest fire ignition over Europe. Environ. Manag. 2013, 51, 651–662. [Google Scholar] [CrossRef] [Green Version]
- Donovan, V.M.; Wonkka, C.L.; Twidwell, D. Surging wildfire activity in a grassland biome. Geophys. Res. Lett. 2017, 44, 5986–5993. [Google Scholar] [CrossRef]
- Qi, F.; Zhang, R.; Liu, X.; Niu, Y.; Zhang, H.; Li, H.; Li, J.; Wang, B.; Zhang, G. Soil particle size distribution characteristics of different land-use types in the Funiu mountainous region. Soil Tillage Res. 2018, 184, 45–51. [Google Scholar] [CrossRef]
- Donovan, V.M.; Wonkka, C.L.; Wedin, D.A.; Twidwell, D. Land-use type as a driver of large wildfire occurrence in the US Great Plains. Remote Sens. 2020, 12, 1869. [Google Scholar] [CrossRef]
- United States Census Bureau. US Census Quickfacts, Population Estimates, 1 July 2021. Available online: https://www.census.gov/quickfacts/geo/chart/ID/PST045221 (accessed on 8 June 2022).
- Westerling, A.L.; Gershunov, A.; Brown, T.J.; Cayan, D.R.; Dettinger, M.D. Climate and wildfire in the western United States. Bull. Am. Meteorol. Soc. 2003, 84, 595–604. [Google Scholar] [CrossRef] [Green Version]
- Swetnam, T.W.; Betancourt, J.L. Fire-southern oscillation relations in the southwestern United States. Science 1990, 249, 1017–1020. [Google Scholar] [CrossRef]
- USDA Forest Service Geodata Clearinghouse. Monitoring Trends in Burn Severity (MTBS). Available online: https://data.fs.usda.gov/geodata/edw/datasets.php (accessed on 8 June 2022).
- Google Developers. MCD12Q1.006 MODIS Land Cover Type Yearly Global 500 m. Available online: https://developers.google.com/earth-engine/datasets/catalog/MODIS_006_MCD12Q1 (accessed on 8 June 2022).
- Google Developers. Nasadem: NASA Nasadem Digital Elevation 30M|Earth Engine Data Catalog|Google Developers. Available online: https://developers.google.com/earth-engine/datasets/catalog/NASA_NASADEM_HGT_00 (accessed on 8 June 2022).
- Ventura, J.; Vasconcelos, M.J. O fogo como processo físico-químico e ecológico. In Incêndios Florestais em Portugal; Pereira, J.S., Pereira, J.M.C., Rego, F.C., Silva, J.M.N., Silva, T.P., Eds.; ISA Press: Lisboa, Portugal, 2006; pp. 93–113. [Google Scholar]
- Sokal, R.R.; Rohalf, F.J. Biometry: The Principles and Practice of Statistics in Biological Research, 3rd ed.; W. H. Freeman: New York, NY, USA, 1994. [Google Scholar]
- Siegel, S.; Castellan, N.J. Nonparametric Statistics for the Behavioral Sciences; McGraw-Hill, Inc.: New York, NY, USA, 1988. [Google Scholar]
- Mermoz, M.; Kitzberger, T.; Veblen, T.T. Landscape influences on occurrence and spread of wildfires in Patagonian forestrs and shrublands. Ecology 2005, 86, 2705–2715. [Google Scholar] [CrossRef] [Green Version]
- Liu, Z.; Ye, L.; Wei, Z.; Jiang, J.; Zhang, Q.; Lv, X. Water use by trees is linked to precipitation: A case study of a mixed forest in a hilly area in southern China. Ecol. Indic. 2022, 143, 109343. [Google Scholar] [CrossRef]
- GIS Geography. US Precipitation Map. Available online: https://gisgeography.com/us-precipitation-map/ (accessed on 8 June 2022).
- Radeloff, V.C.; Hammer, R.B.; Stewart, S.I.; Fried, J.S.; Holcomb, S.S.; McKeefry, J.F. The wildland–urban interface in the United States. Ecol. Appl. 2005, 15, 799–805. [Google Scholar] [CrossRef] [Green Version]
- Balch, J.K.; Bradley, B.A.; Abatzoglou, J.T.; Nagy, R.C.; Fusco, E.J.; Mahood, A.L. Human-started wildfires expand the fire niche across the United States. Proc. Natl. Acad. Sci. USA 2017, 114, 2946–2951. [Google Scholar] [CrossRef] [Green Version]
- Syphard, A.D.; Rustigian-Romsos, H.; Mann, M.; Conlisk, E.; Moritz, M.A.; Ackerly, D. The relative influence of climate and housing development on current and projected future fire patterns and structure loss across three California landscapes. Glob. Environ. Chang. 2019, 56, 41–55. [Google Scholar] [CrossRef]
- Haight, R.G.; Cleland, D.T.; Hammer, R.B.; Radeloff, V.C.; Rupp, T.S. Assessing fire risk in the wildland-urban interface. J. For. 2004, 102, 41–48. [Google Scholar]
- Syphard, A.D.; Radeloff, V.C.; Keeley, J.E.; Hawbaker, T.J.; Clayton, M.K.; Stewart, S.I.; Hammer, R.B. Human influence on California fire regimes. Ecol. Appl. 2007, 17, 1388–1402. [Google Scholar] [CrossRef]
- Calviño-Cancela, M.; Chas-Amil, M.L.; García-Martínez, E.D.; Touza, J. Interacting effects of topography, vegetation, human activities and wildland-urban interfaces on wildfire ignition risk. For. Ecol. Manag. 2017, 397, 10–17. [Google Scholar] [CrossRef] [Green Version]
- Radeloff, V.C.; Helmers, D.P.; Kramer, H.A.; Mockrin, M.H.; Alexandre, P.M.; Bar-Massada, A.; Butsic, V.; Hawbaker, T.J.; Martinuzzi, S.; Syphard, A.D.; et al. Rapid growth of the US wildland-urban interface raises wildfire risk. Proc. Natl. Acad. Sci. USA 2018, 115, 3314–3319. [Google Scholar] [CrossRef] [PubMed] [Green Version]
- Harvey, B.J. Human-caused climate change is now a key driver of forest fire activity in the western United States. Proc. Natl. Acad. Sci. USA 2016, 113, 11649–11650. [Google Scholar] [CrossRef] [PubMed] [Green Version]
Figure 1.
Map of the study area in the western United States.

Figure 2.
The ignition points and burn boundaries for large wildfires in the western United States.

Figure 3.
Percentage of monthly number of fires and hectares burned for the state of Washington, Oregon, and California in the year of 2018. Note: the ignition sources are not considered in this research.
Figure 3.
Percentage of monthly number of fires and hectares burned for the state of Washington, Oregon, and California in the year of 2018. Note: the ignition sources are not considered in this research.

Figure 4.
Map of the land cover types in the study area.

Figure 5.
Maps of the slope (left) and aspect (right) in the study area.

Figure 6.
Average selection ratios with 95% confidence intervals for land cover (a), slope (b), and aspect (c) for the western United States. Note: en—evergreen needleleaf forests; eb—evergreen broadleaf forests; db—deciduous broadleaf forests; mf—mixed forests; sh—shrublands; gs—grasslands; and cp—croplands.


Table 1.
Average selection ratios with 95% confidence intervals in the parenthesis for land cover, slope, and aspect for Washington, Oregon, and California.
Table 1.
Average selection ratios with 95% confidence intervals in the parenthesis for land cover, slope, and aspect for Washington, Oregon, and California.
| Category | Classification | Washington | Oregon | California |
|---|---|---|---|---|
| Land cover type | Evergreen needleleaf forests | 1.18 (0.32) | 0.89 (0.25) | 1.03 (0.17) |
| Evergreen broadleaf forests | 1.14 (0.10) | 0.75 (0.09) | ||
| Deciduous broadleaf forests | 0.71 (0.07) | 1.53 (0.25) | ||
| Mixed Forests | 1.50 (0.14) | 0.69 (0.18) | 1.35 (0.24) | |
| Shrublands | 1.15 (0.28) | 1.03 (0.21) | ||
| Grasslands | 1.06 (0.27) | 2.24 (0.45) | 1.97 (0.32) | |
| Croplands | 0.29 (0.15) | 0.58 (0.27) | 0.55 (0.19) | |
| Slope | 0%–5% | 0.72 (0.28) | 0.79 (0.34) | 0.86 (0.20) |
| 5%–10% | 1.28 (0.22) | 1.20 (0.27) | 1.11 (0.46) | |
| 10%–15% | 1.36 (0.58) | 1.41 (0.27) | 1.15 (0.16) | |
| 15%–25% | 1.42 (0.20) | 1.95 (0.39) | 1.25 (0.28) | |
| >25% | 1.19 (0.31) | 0.80 (0.17) | 1.24 (0.42) | |
| Aspect | Flat | 0.37 (0.11) | 0.81 (0.38) | 0.43 (0.18) |
| North | 0.98 (0.29) | 1.19 (0.11) | 0.94 (0.17) | |
| East | 0.98 (0.32) | 1.57 (0.35) | 0.98 (0.13) | |
| South | 1.04 (0.28) | 1.75 (0.41) | 1.04 (0.17) | |
| West | 0.93 (0.37) | 1.16 (0.18) | 1.00 (0.16) |
Disclaimer/Publisher’s Note: The statements, opinions and data contained in all publications are solely those of the individual author(s) and contributor(s) and not of MDPI and/or the editor(s). MDPI and/or the editor(s) disclaim responsibility for any injury to people or property resulting from any ideas, methods, instructions or products referred to in the content. |
© 2023 by the authors. Licensee MDPI, Basel, Switzerland. This article is an open access article distributed under the terms and conditions of the Creative Commons Attribution (CC BY) license (https://creativecommons.org/licenses/by/4.0/).
Share and Cite
MDPI and ACS Style
Zhai, J.; Ning, Z.; Dahal, R.; Yang, S. Wildfire Susceptibility of Land Use and Topographic Features in the Western United States: Implications for the Landscape Management. Forests 2023, 14, 807. https://doi.org/10.3390/f14040807
AMA Style
Zhai J, Ning Z, Dahal R, Yang S. Wildfire Susceptibility of Land Use and Topographic Features in the Western United States: Implications for the Landscape Management. Forests. 2023; 14(4):807. https://doi.org/10.3390/f14040807
Chicago/Turabian StyleZhai, Jun, Zhuo Ning, Ram Dahal, and Shaoyang Yang. 2023. "Wildfire Susceptibility of Land Use and Topographic Features in the Western United States: Implications for the Landscape Management" Forests 14, no. 4: 807. https://doi.org/10.3390/f14040807
Note that from the first issue of 2016, this journal uses article numbers instead of page numbers. See further details here.