Article

Assessment of the Forest Fire Risk and Its Indicating Significances in Zhaoqing City Based on Landsat Time-Series Images

1
Key Lab of Guangdong for Utilization of Remote Sensing and Geographical Information System, Guangdong Open Laboratory of Geospatial Information Technology and Application, Guangdong Engineering Technology Center for Remote Sensing Big Data Application, Guangzhou Institute of Geography, Guangdong Academy of Sciences, Guangzhou 510070, China
2
Southern Marine Science and Engineering Guangdong Laboratory (Guangzhou), Guangzhou 511458, China
3
School of Geography and Remote Sensing, Guangzhou University, Guangzhou 510006, China
4
Guangdong Xijiang Forest Farm, Zhaoqing 526020, China
5
Guangdong Climate Center, Guangzhou 510080, China
*
Author to whom correspondence should be addressed.
Forests 2023, 14(2), 327; https://doi.org/10.3390/f14020327
Submission received: 29 November 2022 / Revised: 20 January 2023 / Accepted: 28 January 2023 / Published: 7 February 2023
(This article belongs to the Section Forest Inventory, Modeling and Remote Sensing)

Abstract

:
An efficient monitoring of forest fire risk and its dynamic changes is an important way to prevent and reduce forest fire hazards. This study integrated the ignition effect of fire sources and the impact of landform into the calculation of forest fire risk using digital-terrain-slope factor, and developed an optimized forest fire risk model (fire-potential-index slope, FPIS). Combined with Landsat 8 satellite images, the study retrieved and analyzed the variations of forest fire risk in Zhaoqing City, Guangdong province, for four consecutive periods in the dry season, 2019. It was found that the high forest fire risk area was mainly distributed in the valley plains of Huaiji district, Fengkai district and Guangning district, the depressions of the Sihui district, and mountain-edge areas of Dinghu district and Gaoyao district, and accounted for 8.9% on 20 October but expanded to 19.89% on 7 December 2019. However, the further trend analysis indicated that the forest fire risk with significant increasing trend only accounted for 6.42% in Zhaoqing. Compared to the single high forest fire risk results, the changing trend results effectively narrowed the key areas for forest fire prevention (2.48%–12.47%) given the actual forest fires in the city. For the four forest fire events (Lingshan mountain, Hukeng industrial area, Xiangang county and Huangniuling ridge forest fires), it was found that the forest fire risk with significant increasing trend in these regions accounted for 26.63%, 35.84%, 54.6% and 73.47%, respectively, which further proved that the forest fire risk changing trend had a better indicated significance for real forest fire events than the high forest fire risk results itself (1.89%–71.69%). This study suggested that the forest fire risk increasing trend could be well used to reduce the probability of misjudgment and improve the accuracy of the early-warning areas when predicting forest fires.

1. Introduction

Forests are complexes consisting of trees, associated plants, habitat animals and the surrounding environment [1]. Not only are they indispensable resources and environments for production and human life [2,3,4], but they also play an extremely important role in the natural environment and ecological system [5,6,7]; they are often described as “the lungs of the earth”. Forest fires are among the major disasters faced by forest resources [2,8]. Trees and vegetation-community structures can be destroyed directly when forest fires occur. It also significantly threatens people’s lives and property [9,10,11,12]. With global warming and increasingly extreme weather, forest fires have occurred more frequently around the world in recent years [13,14,15], which has had a wide impact on regional and global climates and ecological environments [16,17,18,19,20]. Examples include the Muli forest fires (30 March 2019) and Xichang forest fires (30 March 2020) in Sichuan Provence, China, the California forest fires (8 November 2018), in the USA and the months of mountain fires in Australia from 31 December 2019.
Due to the complex topography and environment and the shortcoming of current monitoring methods, a forest fire (ignition point) is easy to ignore when it begins [21]. However, forest fires spread quickly even in normal conditions and create significant danger [16,22,23]. Therefore, the accurate monitoring of forest fire risk and its changing trend, as well as the provision of early warnings and forecasting, is at the core of the prevention of forest fires, which could significantly reduce its major hazards [11,24,25]. Traditional ways of monitoring of forest fires, such as field investigation, observation towers and video surveillance, have the advantages on detailed information, high accuracy and good continuity. However, these methods also have some shortcomings (such as time-consuming, laborious, high cost and narrow coverage) due to the complex environmental conditions and actual operating costs, especially in large regional forest areas [26,27]. Satellite remote sensing has the unique advantages of large spatial coverage, relatively high spatial resolution, high revisit frequency, abundant information and low cost compared to traditional methods [28,29,30,31]. Thus, it is found that remote sensing has been more widely applied in the observation, early prediction, disaster monitoring and post-disaster assessment of forest fire hazard [32,33,34].
The monitoring of forest fire risk and the provision of early warnings in a city scale requires relatively high-spatial-resolution remote sensing data [35,36]. In terms of various kinds of remote sensing data sources, the Landsat series of images (USA), Sentinel data (Europe) and the GF- and HJ-satellite imageries (China) could meet the demands of forest fire prevention well through the spatial details, coverage area and frequency of supervision that they provide. It is beneficial for achieving the primary goal of forest fire prevention, which is to extinguish the fire as early as possible [11,37].
Forest fire is affected by the types and states of dry (wet) combustible materials, meteorological elements, topography and fire sources [6,14,38]. However, it is found that large numbers of remote sensing forest fire risk computation methods mainly concentrate on combustible materials and weather conditions; few contain topography and fire source factors [39]. Therefore, previous forest fire risk retrieval models have potential for further optimization and improvement.
Based on the above analysis, the objective of this study was to (1) develop an optimized forest fire risk inversion model by integrating topographic factors, (2) retrieve and analyze the spatiotemporal variations of forest fire risk and its changing trend in Zhaoqing city during the dry season of 2019 based on Landsat time series of images, (3) further assess and validate the early-warning effect and indicated significance of the remote sensing results on the four subsequent real forest fire events in 2020 and 2021.

2. Study Area and Materials
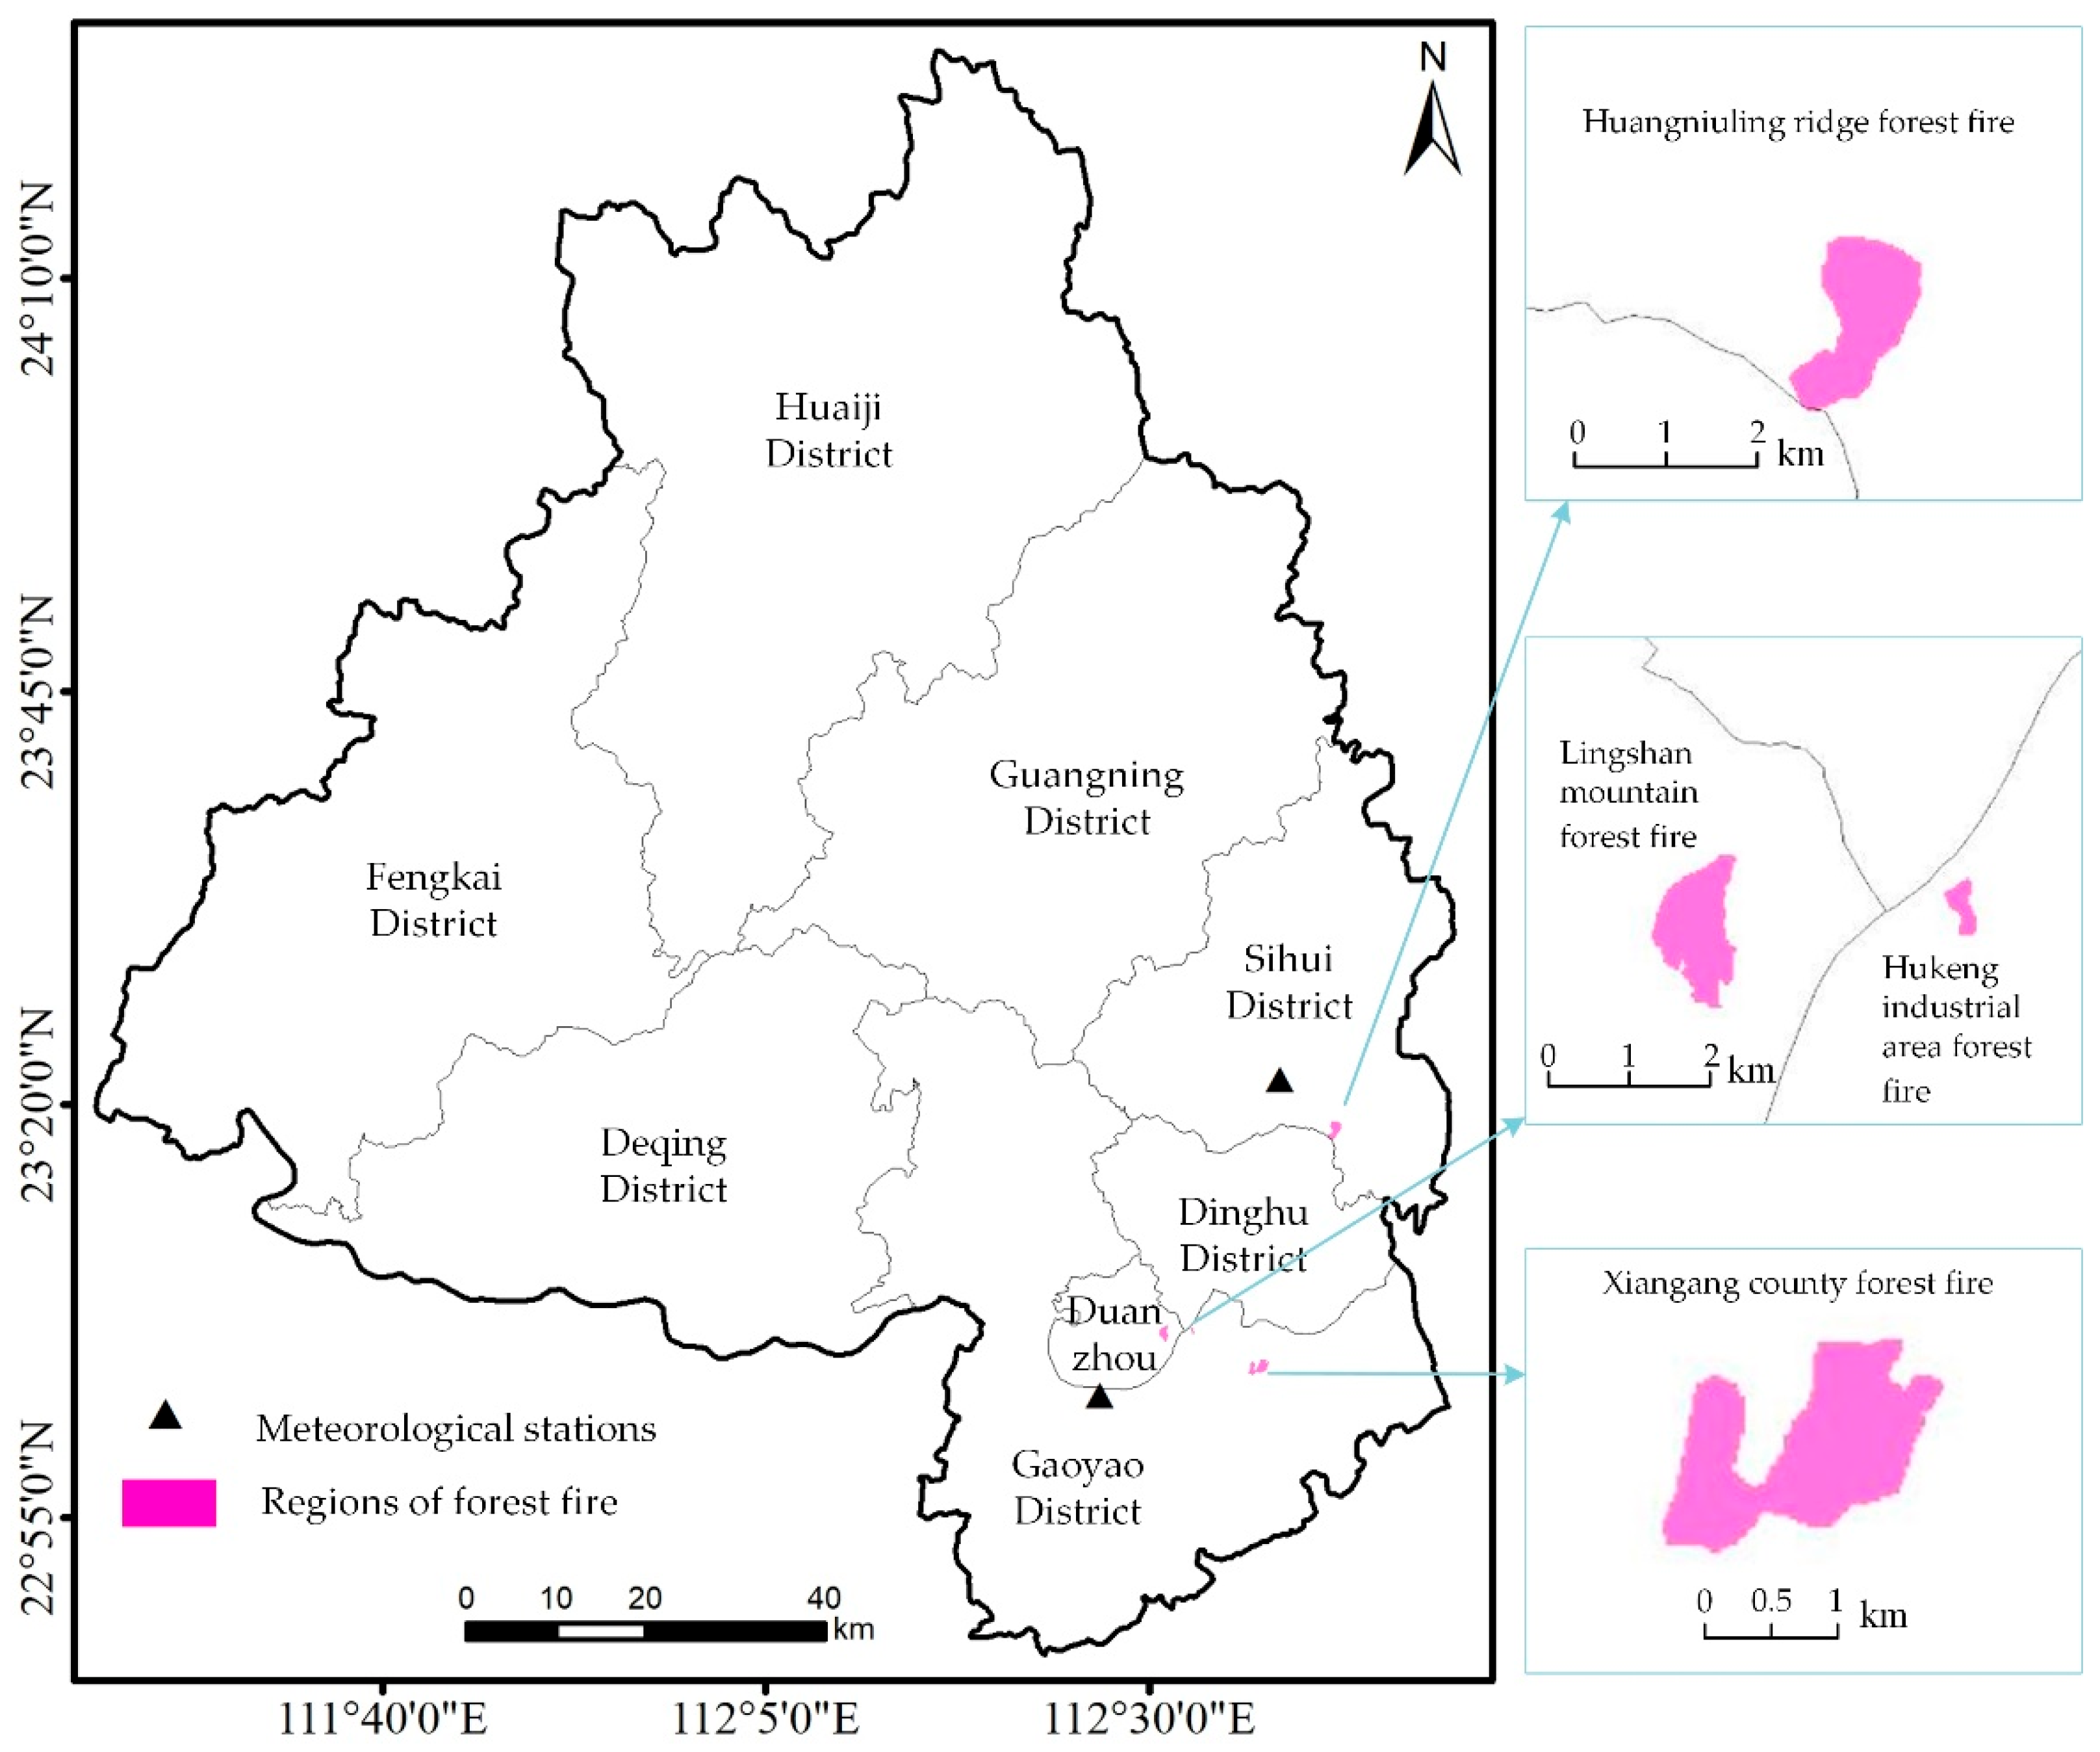
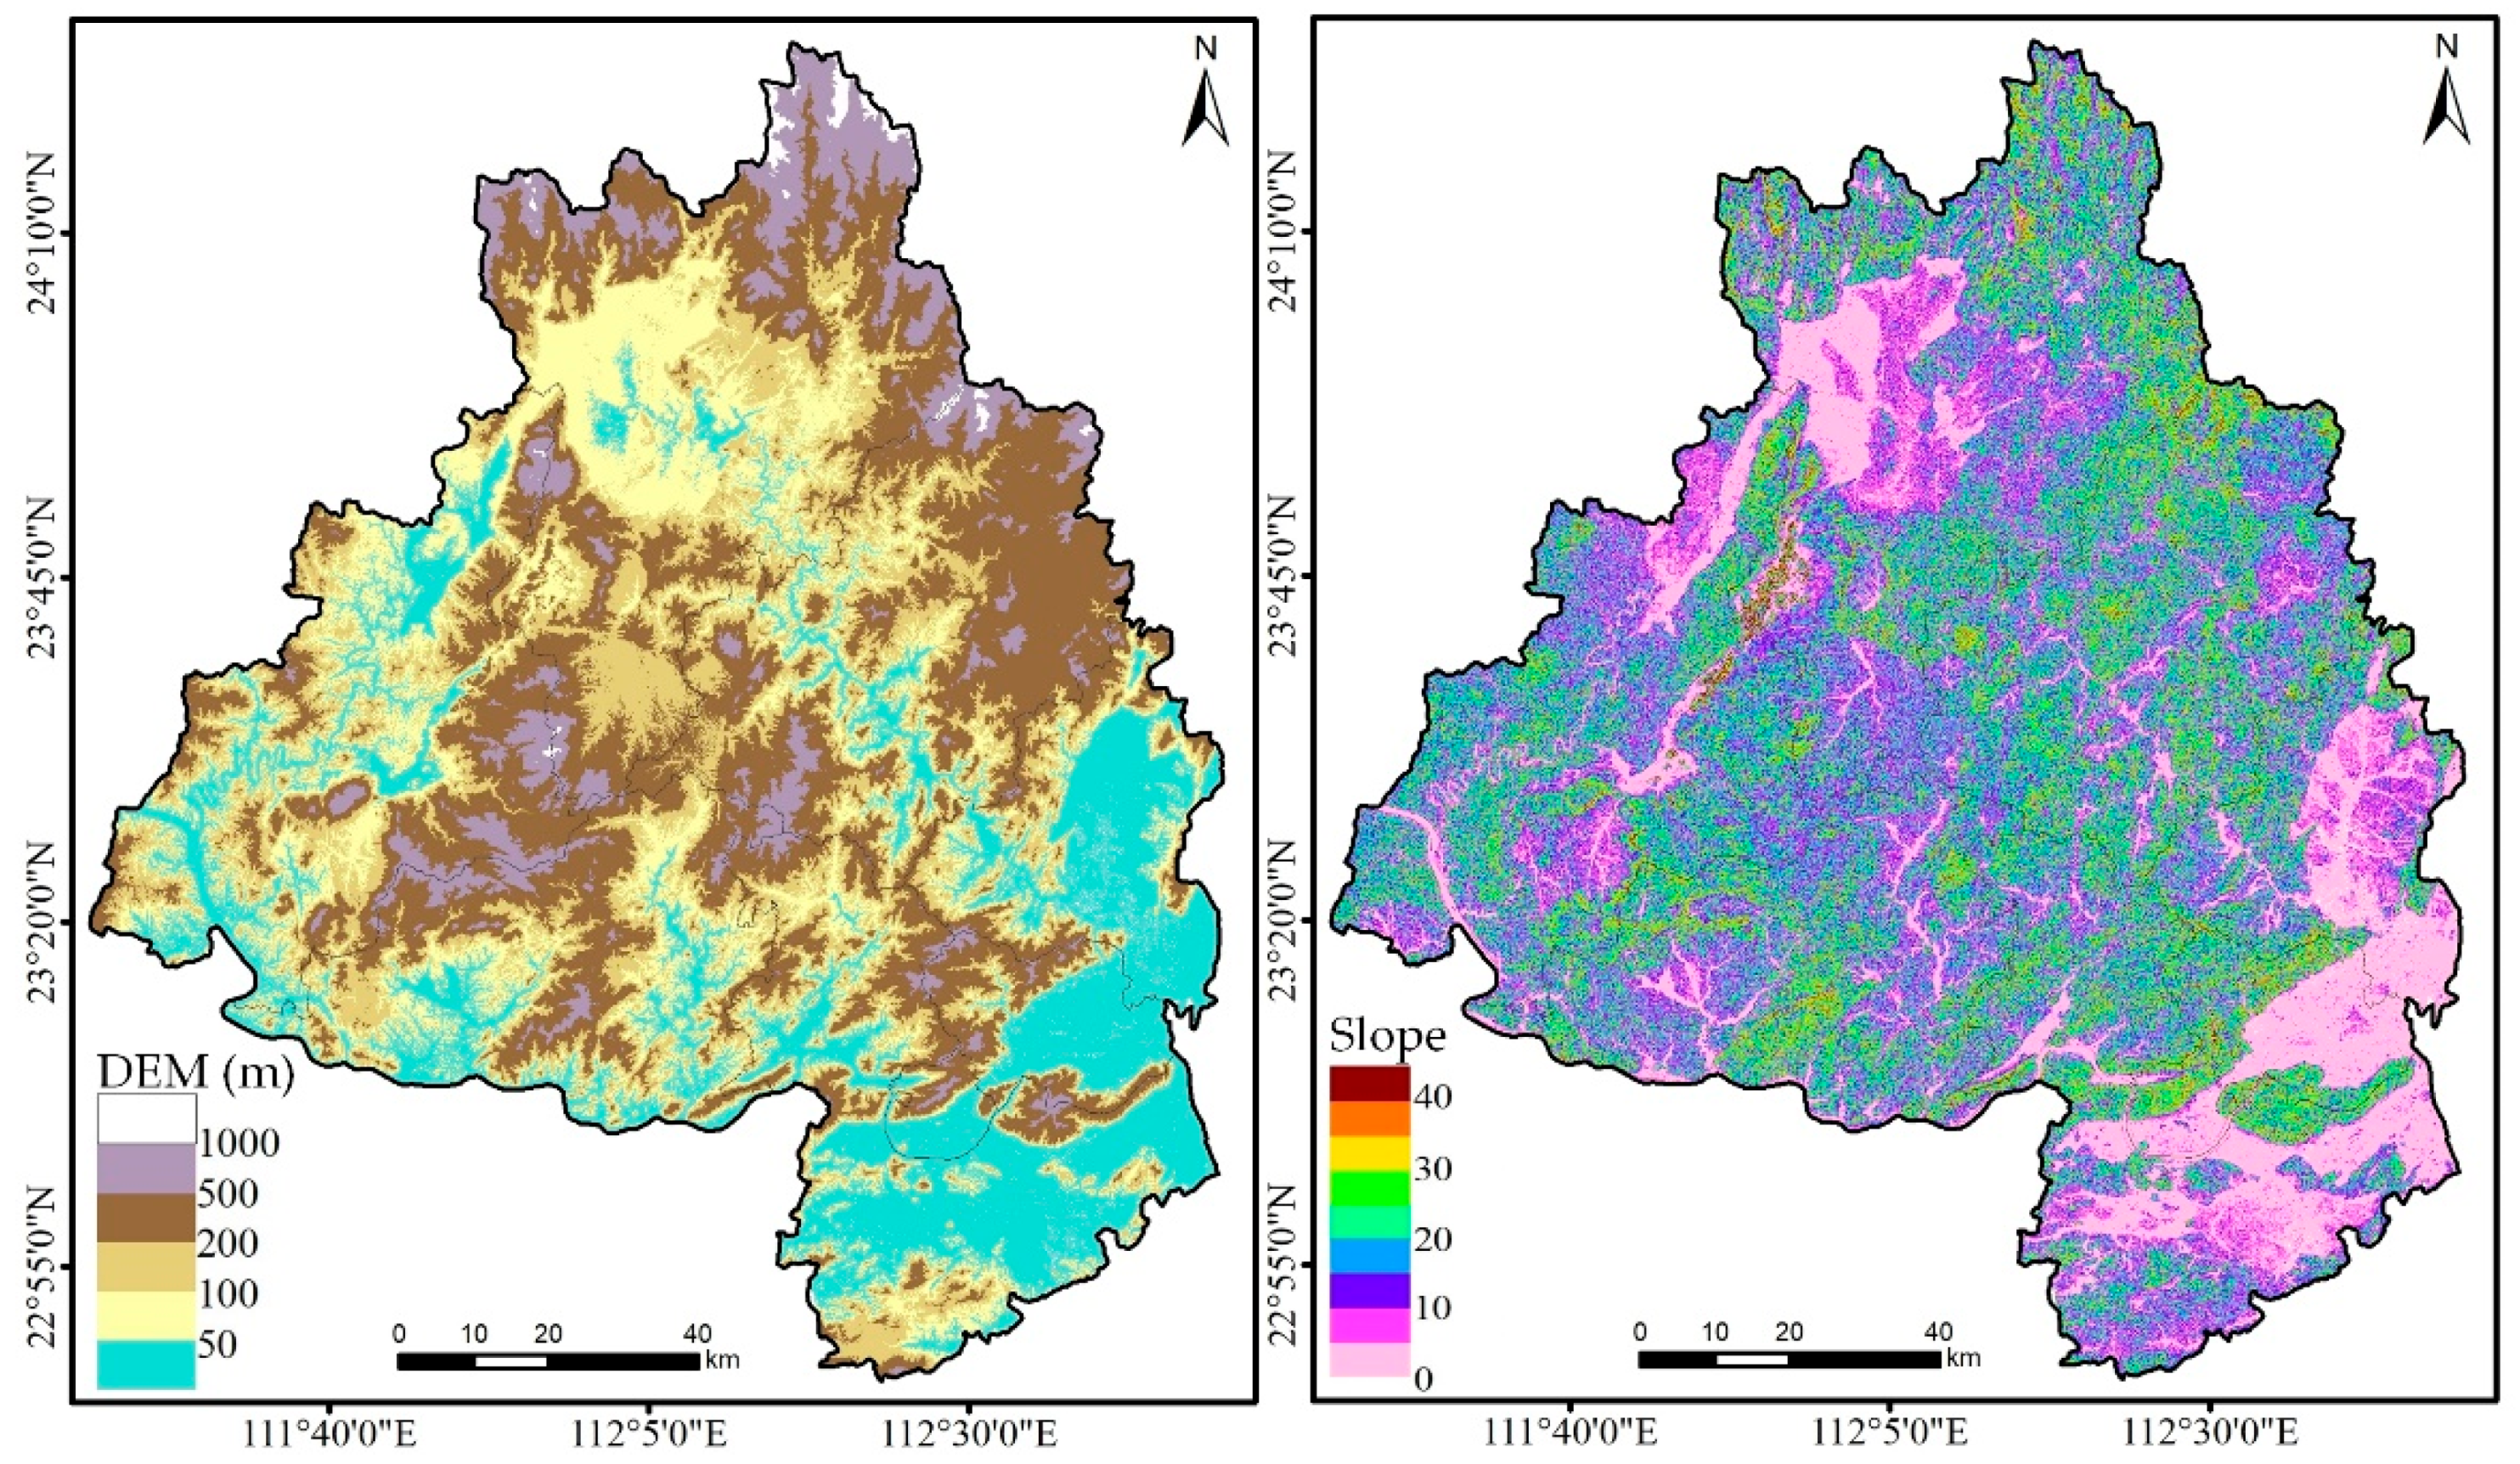
2.1. Study Area

Zhaoqing city is located between longitudes 111.3–112.9° E and latitudes 22.45–24.6° N, in middle and western part of Guangdong Province, and covers a total area of about 14,891 square kilometers (Figure 1). It is also one of the important node cities of the Guangdong–Hong Kong–Macao Greater Bay Area.
Zhaoqing city is a typical mountainous city. The highland and lowland areas of the city account for about 81% of its total area. The topography is high in the northwest and low in the southeast. Mountains and hills are mainly distributed from northeast of Huaiji district to north of Guangning district and from northeast of Fengkai district to Deqing district. Valley plains and depressions are concentrated from west of Huaiji district to northwest of Fengkai district, east of Sihui district and Dinghu district, and from south of Duanzhou district to central Gaoyao district (Figure 2).
Zhaoqing features a subtropical monsoon climate. It is warm, and it rains often in the spring season as well as in summer, while less rain and relatively high temperatures occur in autumn and winter. The annual mean precipitation is about 1650 mm, mainly concentrated between April and September. According to the data from government review in 2019, the forest-coverage rate of Zhaoqing reached 70.83% (about 10,547 square kilometers), and the forest volume was 57.78 million cubic meters. The natural vegetation of Zhaoqing forest is mainly south subtropical evergreen monsoon forest [40]. In addition, it should be noted that forest fires occur frequently in Zhaoqing city, especially in autumn and winter. It was found that the need for forest fire prevention become extremely acute due to the influence of human-activity factors.
Figure 1. Study area and the four forest fire events in 2020 and 2021.
Forests 14 00327 g001
Figure 2. Topographic map of Zhaoqing city.
Forests 14 00327 g002

2.2. Materials

(1) The information about the forest fires in Zhaoqing city
In recent years (2019–2022), four forest fire events have occurred in Zhaoqing city, according to the government reviews. They are Lingshan mountain forest fire, Huangniuling ridge forest fire, Xiangang county forest fire and Hukeng industrial area forest fire, respectively (Table 1, Figure 1). This study further acquired the detailed conditions of the fire events based on the survey information and visual interpretation of higher-resolution remote sensing data.
Among the four forest fire events, Lingshan mountain forest fire (13 November 2020) in Duanzhou district and Huangniuling ridge forest fire (28 December 2020) in Sihui district, were general forest fires. By contrast, the trees in Xiangang county forest fire (18 January 2021) in Gaoyao district, were completely burnt, indicating that this was a more serious forest fire. Although the forest fire that occurred in Hukeng industrial area (27 September 2021), Gaoyao district, was similar to Xiangang county forest fire, the burned areas were much smaller. Thus, it was also classed as a general forest fire. In addition, the forest structure of all the four forest fire events was dominated by Pinus massoniana forests.
The total burned area of the four forest fire events was about 5.199 square kilometers, accounting for 0.0493% of the forest area of Zhaoqing city only (Figure 1, Table 1). The distributions of them were used for the accuracy assessment and verification of the forest fire risk remote sensing results in the study.
Table 1. Overview of the four forest fire events in Zhaoqing.
DateForest Fire EventsAreas (km2)
13 November 2020Lingshan mountain forest fire1.186
28 December 2020Huangniuling ridge forest fire1.767
18 January 2021Xiangang county forest fire2.103
27 September 2021Hukeng industrial area forest fire0.143
(2) Landsat time series of remote sensing images
The Landsat series of satellites was first launched in 1972 and has accumulated more than 50 years of long-term historical data to date, which have provided a massive amount of valuable remote sensing images for global resource development and utilization, natural-disaster monitoring, ecological and environmental protection and social and economic development [41,42]. The Landsat 8 satellite, carrying two main sensors (Operational Land Imager, OLI and Thermal Infrared Sensor, TIRS), was launched in 2013. Landsat 8 OLI and TIRS sensors contain a total of 11 bands (OLI: Bands 1–9, TIRS: Bands 10–11), from visible spectrum to near-infrared spectrum, short-wave infrared spectrum and thermal infrared spectrum. The sensors provide base data for the monitoring of forest fire conditions.
This study has obtained data for four consecutive periods, a total of eight scans of Landsat 8 high-quality images (paths/rows, 123/43 and 123/44) covering Zhaoqing city in the dry season in 2019. All the remote sensing data is available for free download from United States Geological Survey (https://glovis.usgs.gov (accessed on 5 February 2023)) as well as Geospatial Data Cloud site, Computer Network Information Center, Chinese Academy of Sciences (http://www.gscloud.cn (accessed on 5 February 2023)). It should be noted that the spatial resolution of these imageries was unified to 30 m by the data download platform (Table 2).
In this study, the forest fire risk and its changing trend in Zhaoqing were firstly retrieved based on these images from 2019. Next, the inversion results were applied to the assessment of the early-warning effect and indicating significance to the four forest fire events in 2020 and 2021.
Table 2. Landsat 8 OLI series of imageries.
Image DateID of Imageries
20 October 2019LC81230432019293LGN00, LC81230442019293LGN00
5 November 2019LC81230432019309LGN00, LC81230442019309LGN00
21 November 2019LC81230432019325LGN00, LC81230442019325LGN00
7 December 2019LC81230432019341LGN00, LC81230442019341LGN00
(3) Topographical and meteorological data
The topographic data used in the study is the Global Digital Elevation Model (GDEMV3) digital elevation data product (Figure 2). The data were developed by the Ministry of Economy Trade and Industry (METI) of Japan and the National Aeronautics and Space Administration (NASA) of the USA, based on the Advanced Spaceborne Thermal Emission and Reflection Radiometer (ASTER) data. It has the same spatial resolution as the Landsat data in this study (30 m), and is a very widely used high-resolution elevation data source covering the global land surface [28].
The air humidity was obtained from the records of Sihui and Gaoyao provincial meteorological stations (Figure 1), which provided by Guangdong Meteorological Service (http://gd.cma.gov.cn/ (accessed on 5 February 2023)). In the study, it was found that records in the two stations have little spatial variability. Therefore, the average humidity was calculated firstly. Then, the mean value was used to the calculation of forest fire risk corresponding to each pixel of Landsat images and topographic data.

3. Methods

3.1. Fire-Potential-Index

The fuel-moisture content (FMC) is a crucial factor in forest fires [34,38,43]. It is found that many forest fire risk models focus on the estimation of live and dead fuel moisture content [21,28,44]. Among them, the fire-potential-index (FPI) is a common used model. The calculation of FPI is shown as Equations (1)–(3).
F P I = 100 ( 1 F M C ) ( 1 V c )
F M C = 1.28 E M C
E M C = { 0.03229 + 0.281073 H r 0.000578 H r T         H r < 10 % 2.22749 + 0.160107 H r 0.014784 T         10 % H r 50 % 21.0606 + 0.005565 H r 2 0.00035 H r T 0.483199 H r 50 % < H r
where FMC is the ratio between the ten-hour-time-lag fine-fuel moisture and the extinction moisture; EMC is the equilibrium moisture content (the moisture content which the fuel attains after prolonged exposure to an atmosphere of constant relative humidity and temperature); Vc is the percentage of vegetation cover; T is the land-surface temperature; Hr is the relative humidity. The Vc and T parameters were retrieved from Landsat images pixel by pixel in the study, while Hr parameter directly used the average of the two weather-stations records.
However, the FPI model does not contain the ignition effect of fire source on the probability of forest fires, nor the impact of terrain and landform on forest fire rate of spread and damage degree [39,45]. The improved model should provide higher accuracy and better assessment if the fire source and terrain factors can be integrated into FPI.

3.2. The Calibration of the Optimized Forest-Potential-Index Model

The investigation of historical forest fire events show that human activities are the predominant causes of forest fires [28,35,46,47], which indicates that human activities represent the major ignition effect. On the other hand, most human activities (such as work activities, camping and expedition) are usually within areas with slopes of less than 10 degrees in daily life, especially around forest area. It suggest that the slope factor has the potential to be used to evaluate quantitatively the ignition effect.
At the early stage of a forest fire, the fire’s rate of spread increases in line with the increase in slope in the forest area, with slopes of 10–30 degrees, which is an essential factor affecting the burning area. The fire’s rate of spread is significantly faster and the fire’s time of spread is shortened in forest areas with slopes greater than 30 degrees, and the damage degree of the forests decreases first and then increases in line with the increasing slope [17,48]. For slopes of 30–50 degrees, the fire’s rate of spread is increasingly faster, and the damage degree is gradually reduced [45]. For slopes greater than 50 degrees, the damage degree is significantly increased because of poor growth conditions, fragile forest-community structures and poor disaster resistance.
Therefore, this study proposes an optimized forest-potential-index model based on the digital-terrain slope factor (forest-potential-index slope, FPIS), which integrates the ignition effect of a fire source, along with the impact of terrain and landform. A function for slope factor (Equation (5)) was mainly calibrated via trial-error method and the practical experience of forest fire prevention (Guangdong Xijiang Forest Farm and Guangdong Climate Center), and then the function was added to the FPI model as a correction factor. The optimized model (FPIS) was finally established in the study, as shown in Equations (4) and (5). Accordingly, the forest fire risk classification based on FPIS is shown in Table 3.
F P I S = 100 ( 1 F M C ) ( 1 V c ) f ( s l o p e )
f ( s l o p e ) = { 1 + 0.5 ( 10 S ) / 10    S < 10 1 + 0.3 ( S 10 ) / 20    10 S 30 0.8 + 0.5 | ( 50 S ) / 20 | S > 30
where f(slope) represents the mapping function of the slope factor; S represents the slope; and the other parameters are the same as those in the FPI model.

3.3. Changing-Trend-Analysis Method

In general, forest fires involve effects of energy accumulation and release. In areas with distinct dry and wet seasons, it is found that forest fires can be significantly inhibited in wet season. Forest fire risk increases gradually in the dry season [49,50]. Considering the periodicity of forest fires in regions with distinct dry and wet seasons, it is believed that the increasing trend in forest fire risk is an important reference and indicator of whether forest fires will occur in these areas.
For this study, the changing trend in forest fire risk was simulated by the least-squares method (see Equation (6)).
Y = k x + b
where Y is the forest fire risk in different time sequences; x is the four consecutive time sequences (the dates of the Landsat images used in the study); k represents the changing degree of the forest fire risk; and b represents the intercept in the equation, which indicates a basic state in the changing trend of forest fire risk. The larger the k, the faster the change in forest fire risk from low to high level (k is positive) and, therefore, the more likely the occurrence of a forest fire. For k, there is a significant change only when the simulation results pass the test of significance (at the confidence level of 99%).

4. Results and Discussion

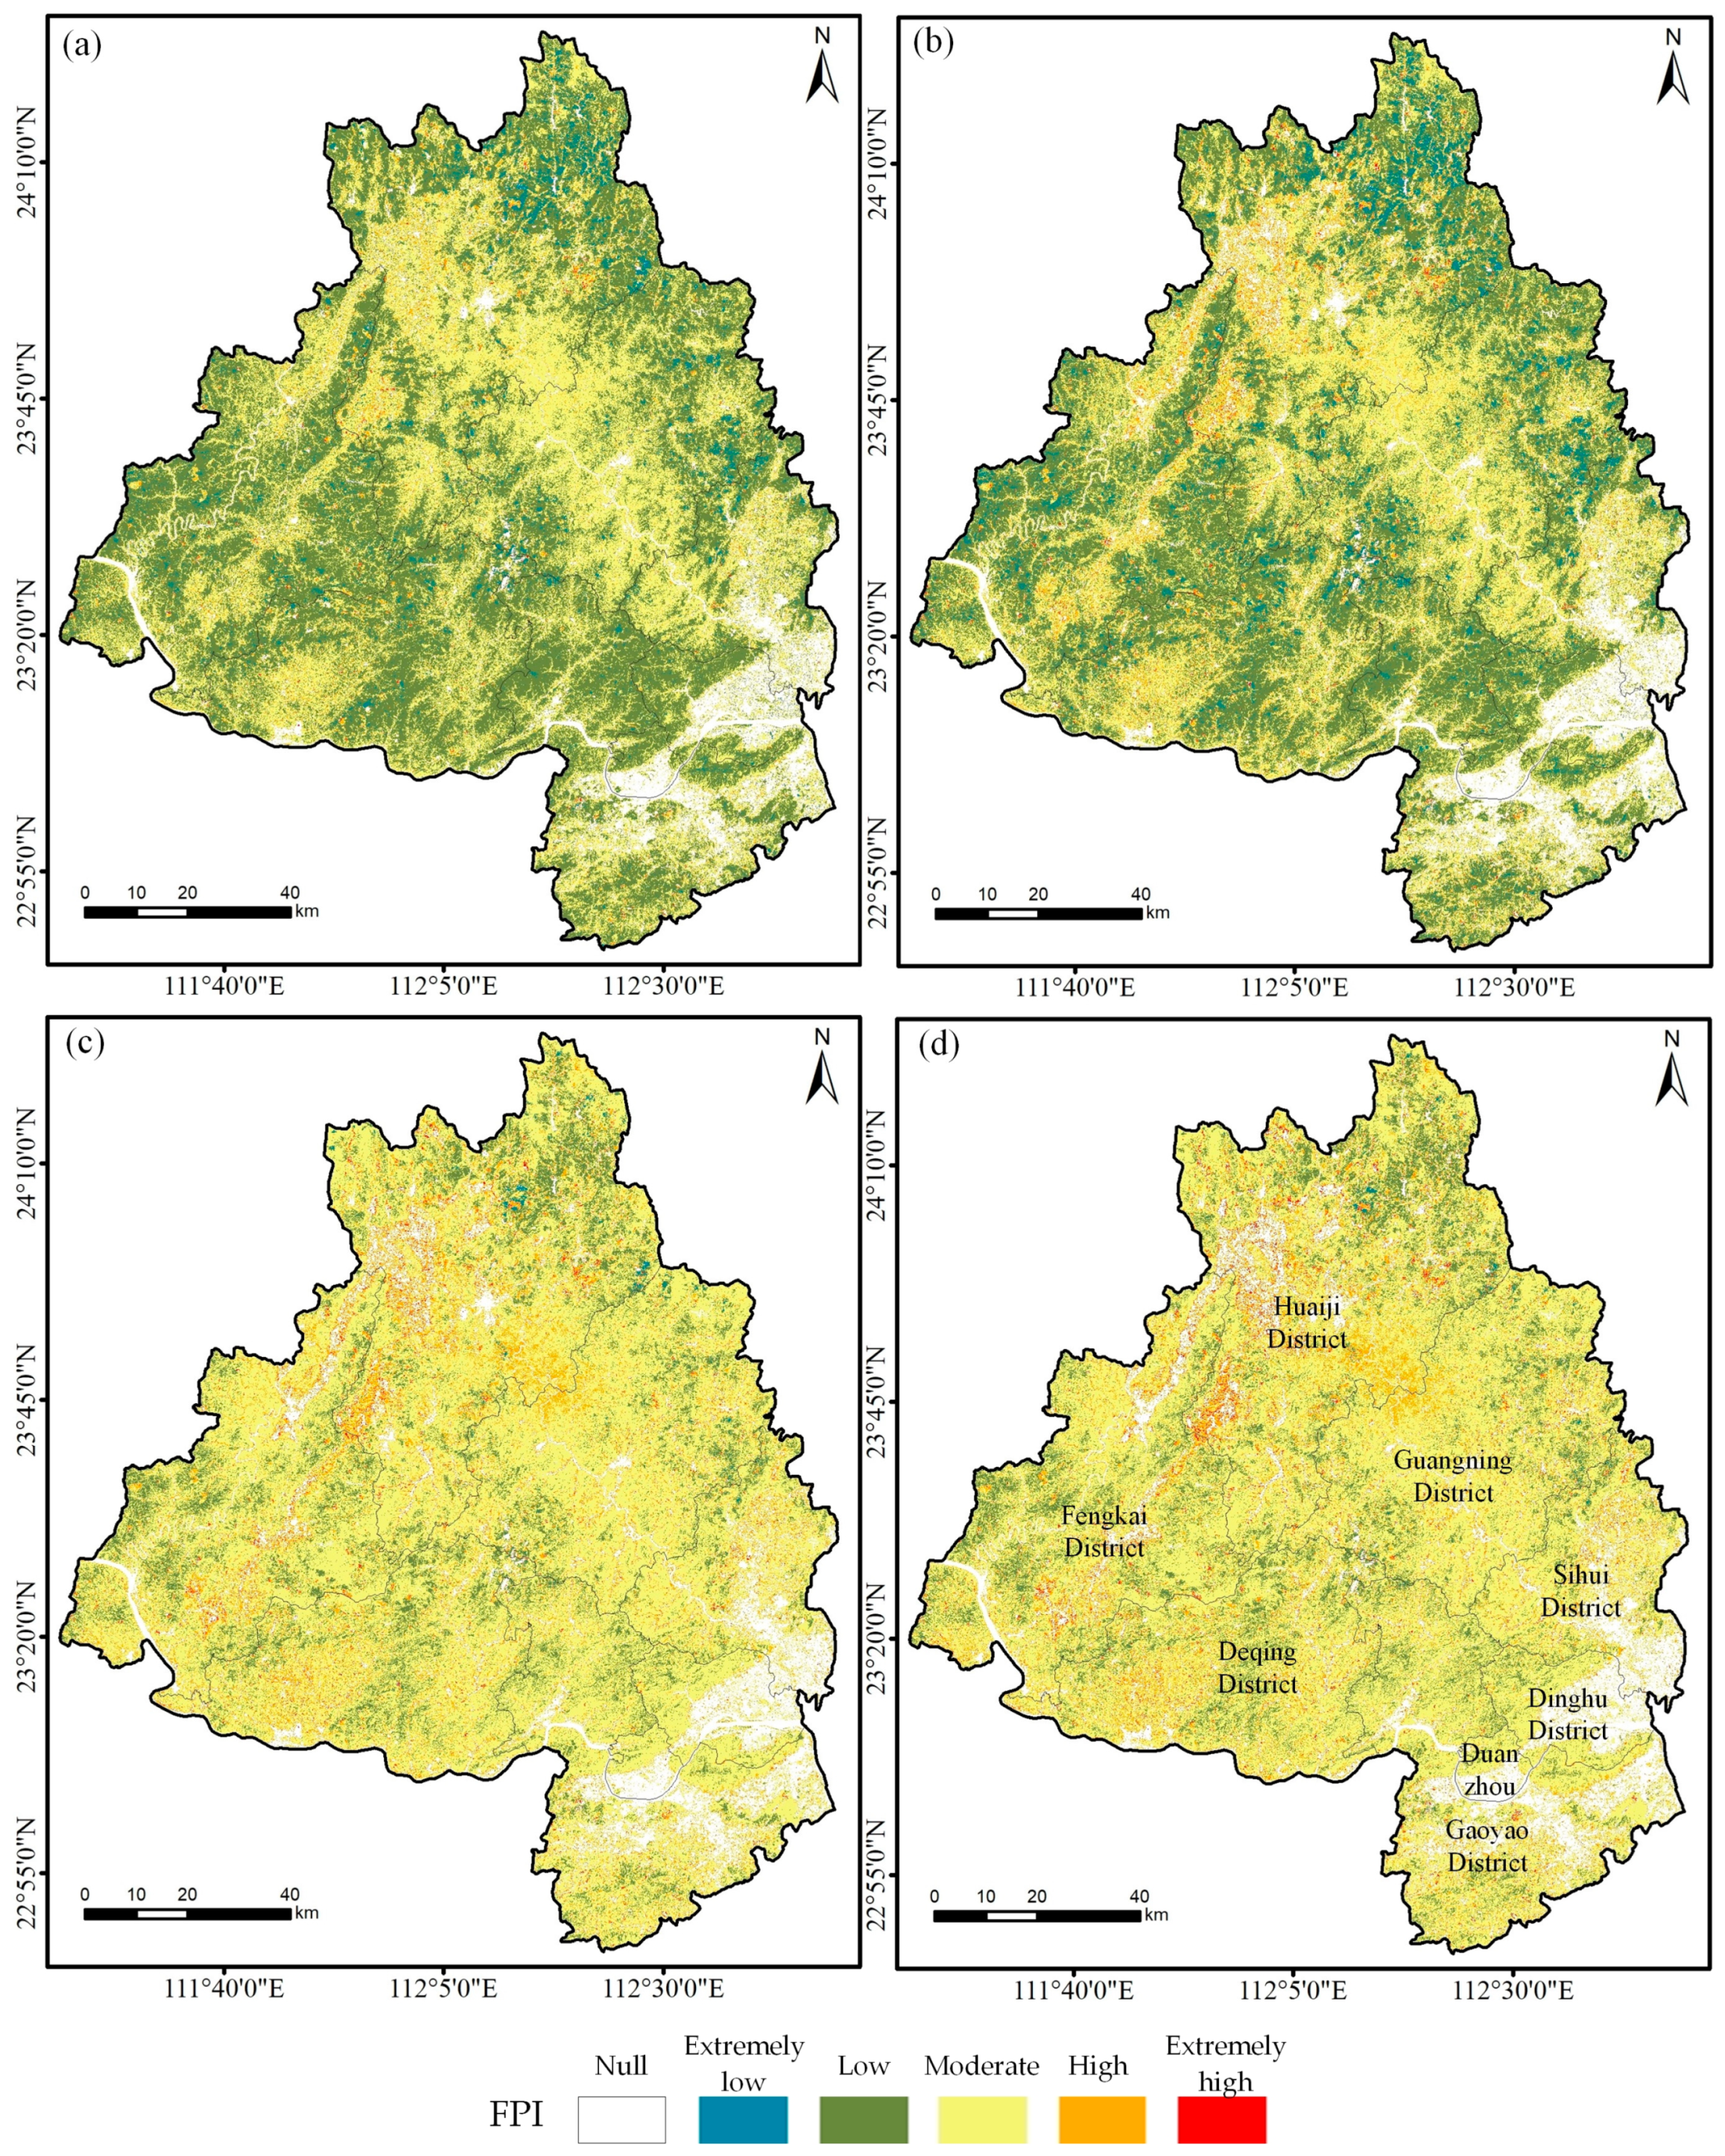
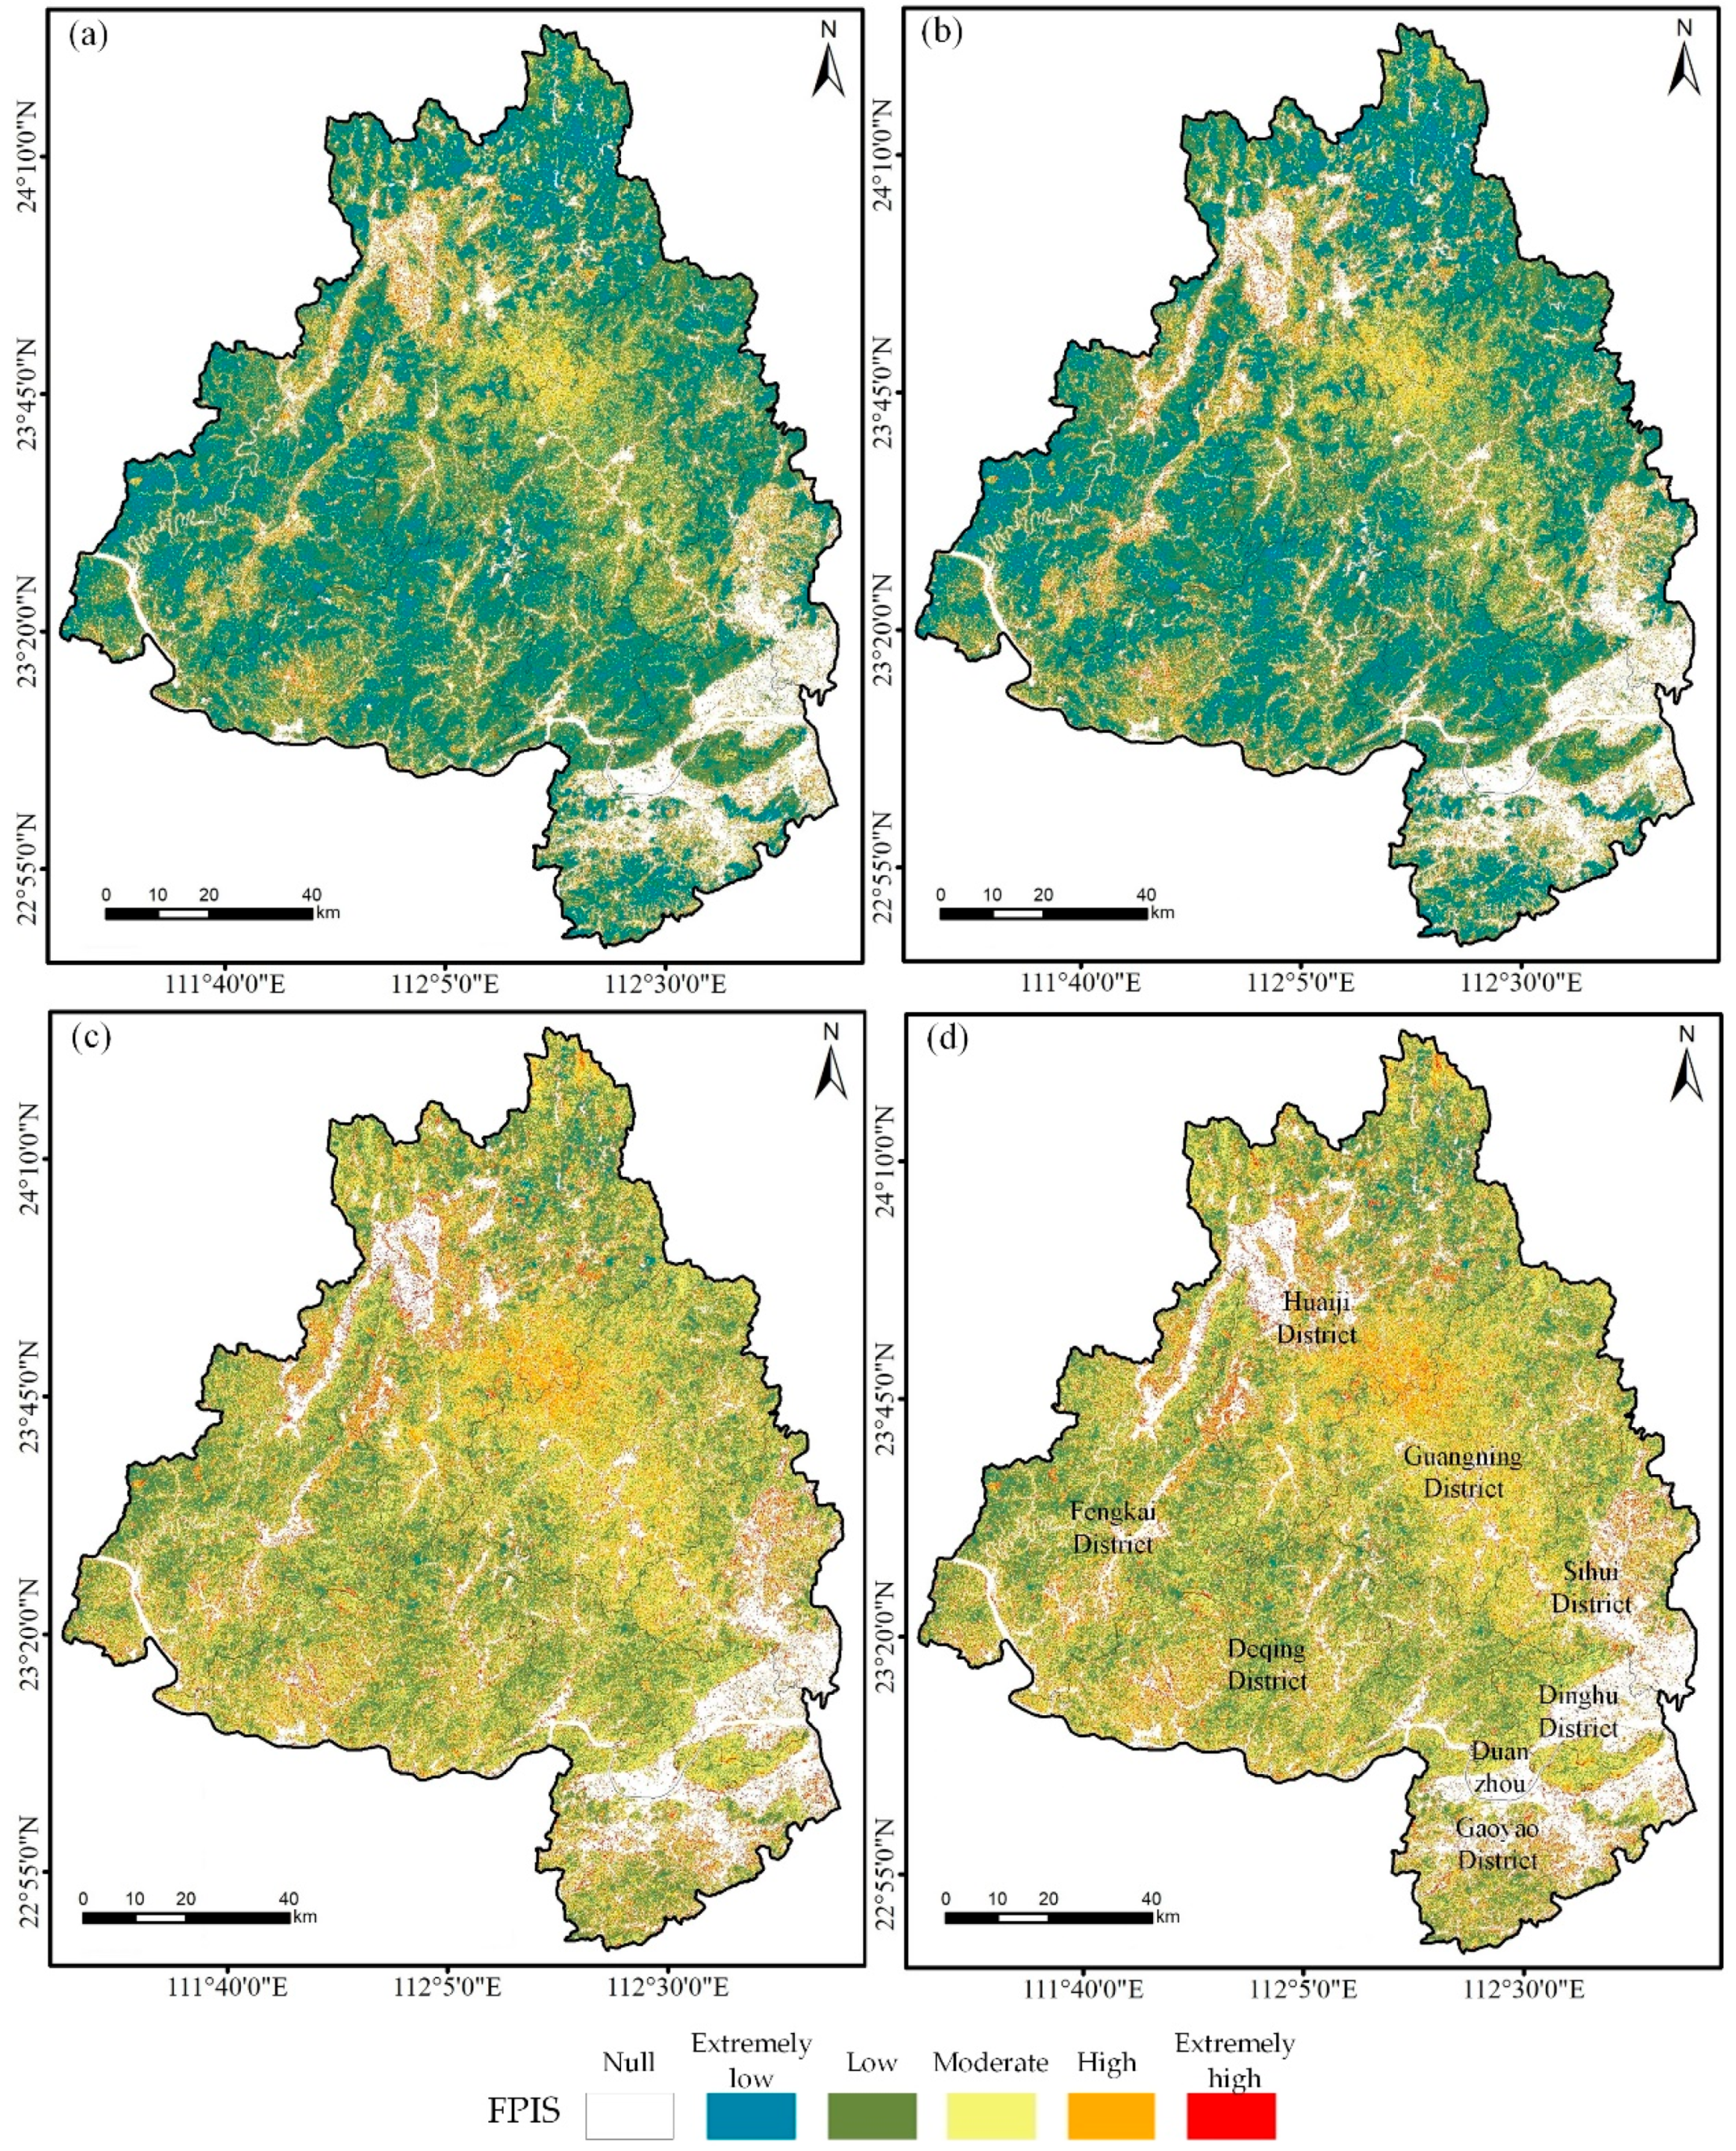
4.1. The Forest Fire Risk Inversion Results Based on FPI and FPIS

Using the Landsat-satellite time series of images, slope data, meteorological data and the two different models (FPI and FPIS), this study retrieved the forest fire risk in Zhaoqing city in the dry season, 2019. The results are shown in Figure 3 and Figure 4, respectively.
For the inversion results based on the FPI model (Figure 3), it was found that there are some unreasonable aspects. The main problem of the result is that the forest fire risk in Zhaoqing city was mainly at the moderate level in different time (~42.63%), especially on 21 November (55.69%; Figure 3c and Figure 6) and 7 December (52.84%; Figure 3d and Figure 6), 2019, which is opposite to actual conditions. In view of the fact that the regional climate condition and forest structure, the low (extremely low) forest fire risk should dominant in Zhaoqing city. This situation has also been proved by the local forestry administrative departments. In contrast, the forest fire risk results based on the optimized FPIS model are more reasonable than that by the FPI model (the average proportion of low and extremely low forest fire risk: 57.46% vs. 39.92%; Figure 3, Figure 4 and Figure 6).
Figure 3. Forest fire risk in Zhaoqing, based on the FPI model. 20 October (a), 5 November (b), 21 November (c) and 7 December (d), 2019.
Forests 14 00327 g003
Figure 4. Forest fire risk in Zhaoqing, based on the optimized FPIS model. 20 October (a), 5 November (b), 21 November (c) and 7 December (d), 2019.
Forests 14 00327 g004

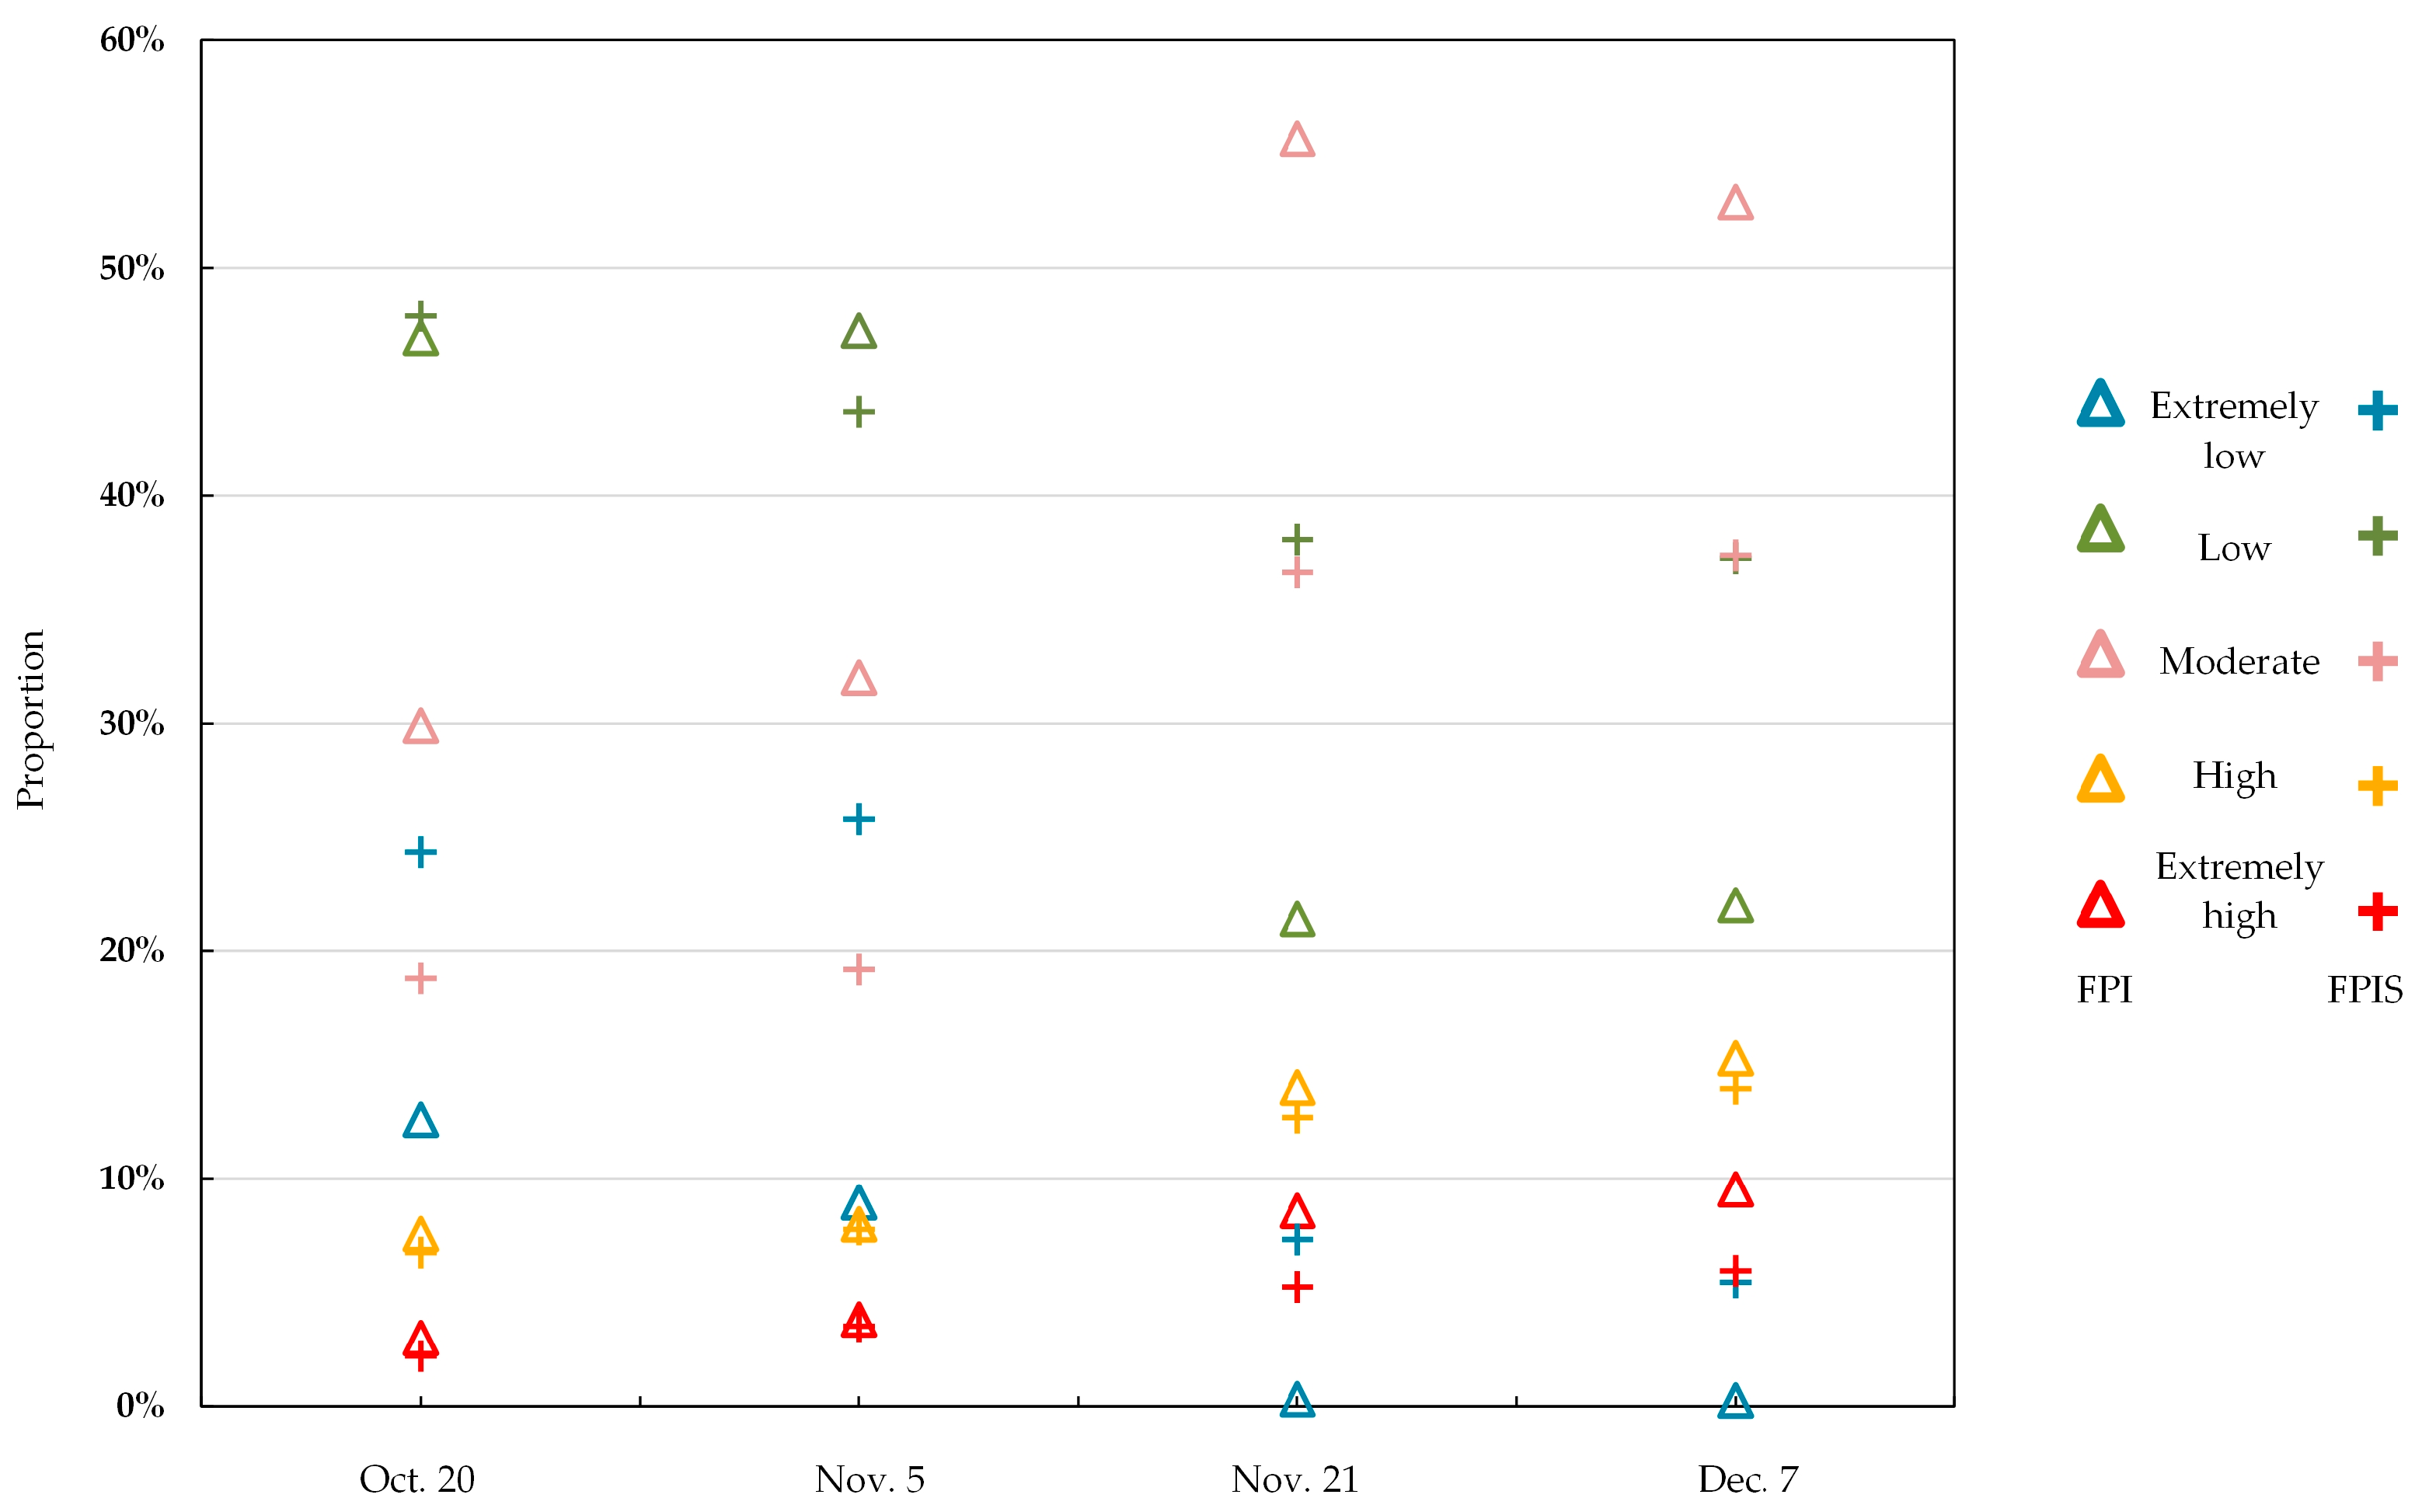
4.2. The Spatial and Temporal Variations of Forest Fire Risk in Zhaoqing City

According to the statistical-analysis results, it was found that the forest fire risk in Zhaoqing city was at a low level on 20 October 2019 (Figure 4a). The forest fire risk in most of the forest areas of the city was at a low (extremely low) grade, accounting for a total of 72.23% (Figure 6). The moderate forest fire risk areas (accounting for 18.8%) were mainly distributed from the southeast of Huaiji district to the northwest of Guangning district, as well as comprising most of the low-altitude forest areas in Sihui district and the edge of Dinghushan National Nature Reserve. The high (extremely high) forest fire risk areas (accounting for 8.9%) were mainly distributed in the depression area from the west of Huaiji district to the northwest of Fengkai District and the local areas in the west of Deqing district (Figure 4a).
It was found that the other high forest fire risk areas were very scattered mainly due to the relatively significant mixed-pixel situation. These pixels usually represent trees, farmland, ridges and roads based on field investigations and the higher-resolution remote sensing data. Since that human and agricultural activities had a major impact on the ignition point, the forest fire risk in these areas was generally high, but the corresponding pixel map spots were relatively broken.
On 5 November 2019, the forest fire risk in Zhaoqing city was higher than that in the middle of October (Figure 4b and Figure 6). The moderate and high (extremely high) forest fire risk areas in the city expanded in the shape of an “embedded triangle”. The high (extremely high) forest fire risk regions were mainly distributed in the depression areas from the west of Huaiji district to the northwest of Fengkai district, the middle and south of Fengkai district, the valley plain in the north of Sihui district, and the southwest of Deqing district. The high (extremely high) forest fire risk areas in Zhaoqing accounted for 11.3%, an increase of 2.33% compared with the previous period. It was found that the most obvious increase in forest fire risk was in the middle and south of Fengkai district. The areas in the southeast of Huaiji district and the middle of Guangning district, close to the west of Sihui district, were still the main distribution areas with moderate forest fire risk grades (Figure 4b). The distribution areas of low (extremely low) forest fire risk grade accounted for 69.49%, and showed a decrease of 2.74% compared with the previous period (Figure 6).
On 21 November 2019, the continuous dry-weather conditions led to a significant increase in the forest fire risk in Zhaoqing city (Figure 4c and Figure 6). The high (extremely high) forest fire risk areas expanded greatly compared with the previous areas. The southeast of Huaiji district and the northwest of Guangning district were the most significant areas with high forest fire risk grades, accounting for about 17.94%, an increase of 7% compared with the previous period (5 November 2019). The moderate forest fire risk areas in the city were widely distributed, accounting for 36.65%, which was nearly double that of the previous two periods (Figure 6). The low (extremely low) forest fire risk areas were mainly distributed in the northeast of Huaiji district and Guangning district, as well as at the junction of Fengkai district, Deqing district, Guangning district and Gaoyao district, accounting for about 45% of the area of Zhaoqing city (Figure 4c).
On early December 2019, the forest fire risk in Zhaoqing city intensified. The proportion of the total areas with moderate and high (extremely high) forest fire risk grades was close to 60%, an increase of 4% compared with the previous period (Figure 4d and Figure 6). It was found that the high forest fire risk areas were still mainly distributed in the depression area from the west of Huaiji district to the northwest of Fengkai district, the areas from the southeast of Huaiji district to the northwest of Guangning district, the middle north of Sihui district, the east of Dinghu district, the valley plain from the south of Duanzhou district to the middle of Gaoyao district, and the southwest of Deqing District (Figure 4d). The high (extremely high) forest fire risk areas accounted for nearly 20% (Figure 6), an increase of 2% compared to late November 2019. During this period, the low (extremely low) forest fire risk areas were concentrated in the northeast of Huaiji district and some areas at the junction of Fengkai district, Deqing district and Gaoyao district (Figure 4d).

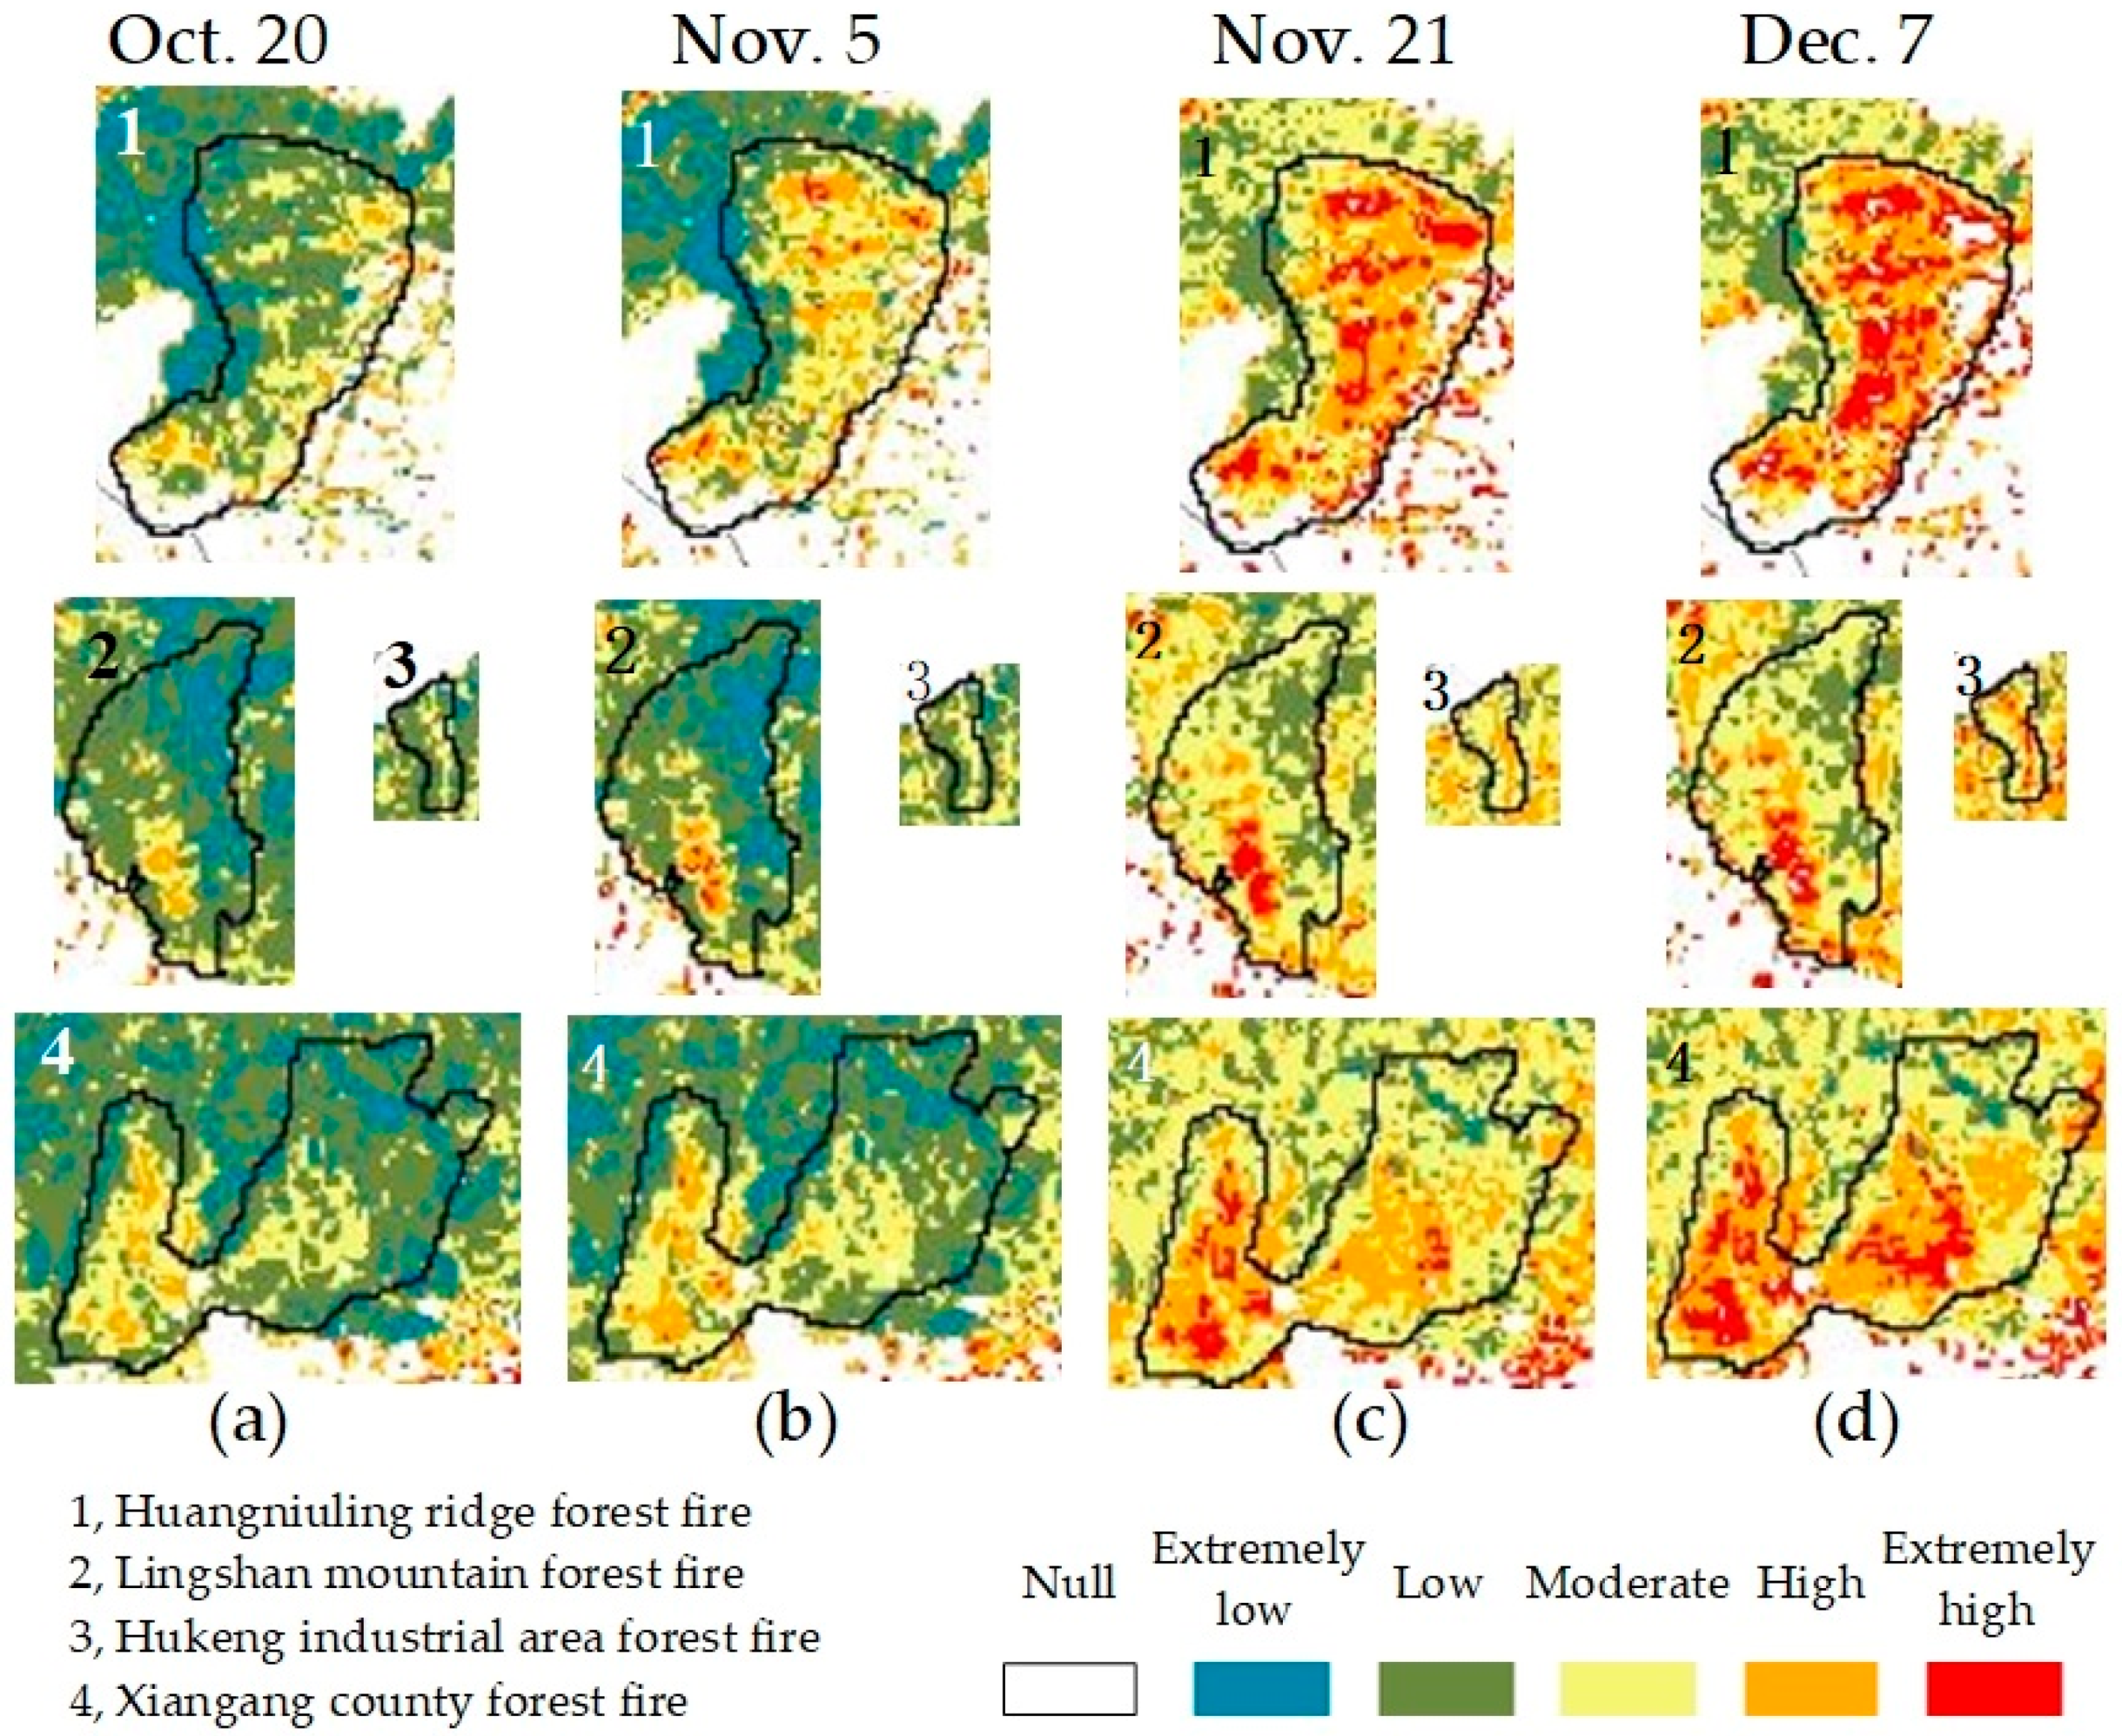
4.3. The Dynamic Change and Indication of Forest Fire Risk in the Regions of Forest Fire Events

Based on the four forest fire events in Zhaoqing city from 2020 to 2021, the temporal- and spatial-variation characteristics of the forest fire risk in the corresponding burned areas were analyzed before the occurrence of the forest fires.
In the first phase (20 October 2019), the forest fire risk in the region of the Huangniuling ridge forest fire event was mainly of low and moderate grade, accounting for 59.26% and 22.65%, respectively (Figure 5(a1) and Figure 8). The forest fire risk in the region of the Lingshan mountain forest fire was of a lower grade. Low (extremely low) forest fire risk areas accounted for about 85%, moderate forest fire risk areas accounted for about 10%, and a few of the areas were of high (extremely high) forest fire risk grade (Figure 5(a2) and Figure 8). The forest fire risk in the regions of the Xiangang county forest fire and Hukeng industrial area forest fire were similar to that of the Huangniuling ridge forest fire, which was predominantly moderate and low risk grade, accounting for 89.55% and 98.11% of the corresponding fireground, respectively (Figure 5(a3,a4) and Figure 8).
Figure 5. The spatial and temporal variations of forest fire risk in the ranges of the four fire events (zoom in the Figure 4). 20 October (a), 5 November (b), 21 November (c) and 7 December (d), 2019.
Forests 14 00327 g005
In the second phase (5 November 2019), the forest fire risk in the regions of the Lingshan mountain forest fire and Hukeng industrial area forest fire did not change significantly compared with the previous period. It was found that most of the areas were still at the moderate and low (extremely low) forest fire risk grade, accounting for more than 80% (Figure 5(b2,b3) and Figure 8). However, the high (extremely high) forest fire risk areas in the regions of the Huangniuling ridge forest fire and Xiangang county forest fire increased significantly, accounting for 23.32% and 18.7%, respectively (Figure 5(b1,b4) and Figure 8).
The forest fire risk in the regions of the four forest fires in the third phase (21 November 2019) all showed a marked increasing trend. The proportion of high (extremely high) forest fire risk areas in the regions of the Lingshan mountain forest fire and Hukeng industrial area forest fire increased to more than 20%, reaching 22.98% and 23.89%, respectively (Figure 5(c2,c3) and Figure 8). In the region of the Xiangang county forest fire, the proportion of high (extremely high) forest fire risk areas increased to 41.42% (Figure 5(c4) and Figure 8). The increasing trend in the high (extremely high) forest fire risk areas in the region of the Huangniuling ridge forest fire was the most obvious. It was found that more than half of the areas were of a high forest fire risk grade, accounting for 66.59% (Figure 5(c1) and Figure 8).
In the last phase (7 December 2019), the forest fire risk in the regions of the four forest fires showed a rapid increase compared with the previous three periods. It was found that the extremely-high- and high forest fire risk areas in the region of the Huangniuling ridge forest fire accounted for about 36.51% and 35.18%, respectively (Figure 8). The other regions were mainly of moderate forest fire risk grade (Figure 5(d1)). In the regions of the Xiangang county forest fire and the Hukeng industrial area forest fire, the proportions of high (extremely high) forest fire risk areas were 51.47% and 42.38%, while the proportions of moderate forest fire risk areas were 36.49% and 41.51%, respectively. There were a few low (extremely low) forest fire risk areas (Figure 5(d3,d4) and Figure 8). In the region of the Lingshan mountain forest fire, the extent of the high (extremely high) forest fire risk areas was slightly lower than that of the other three forest fires, accounting for about 31.63%. Furthermore, the proportions of moderate and low (extremely low) forest fire risk areas were about 40.74% and less than 30%, respectively (Figure 5(d2) and Figure 8).
Based on the above analysis and the forest fire risk remote sensing results, it was found that high (extremely high) forest fire risk areas (the key prevention areas of forest fires) in Zhaoqing accounted for 8.9%–19.89% (Figure 4 and Figure 6). For the regions of the four forest fire events, the distribution areas in which forest fires were likely to occur (high and extremely high forest fire risk grade) displayed significant spatial and temporal heterogeneity. The minimum was 1.89% only (the region of the Hukeng industrial area forest fire, 20 October 2019; Figure 5(a3) and Figure 8), but the maximum was as high as 71.69% (the region of the Huangniuling ridge forest fire, 7 December 2019; Figure 5(d1) and Figure 8). These results indicated that there was great uncertainty in the prediction of real forest fire events using the single results of forest fire risk grade.
Figure 6. The dynamic changes of forest fire risk in Zhaoqing, based on the FPI and FPIS model.
Forests 14 00327 g006

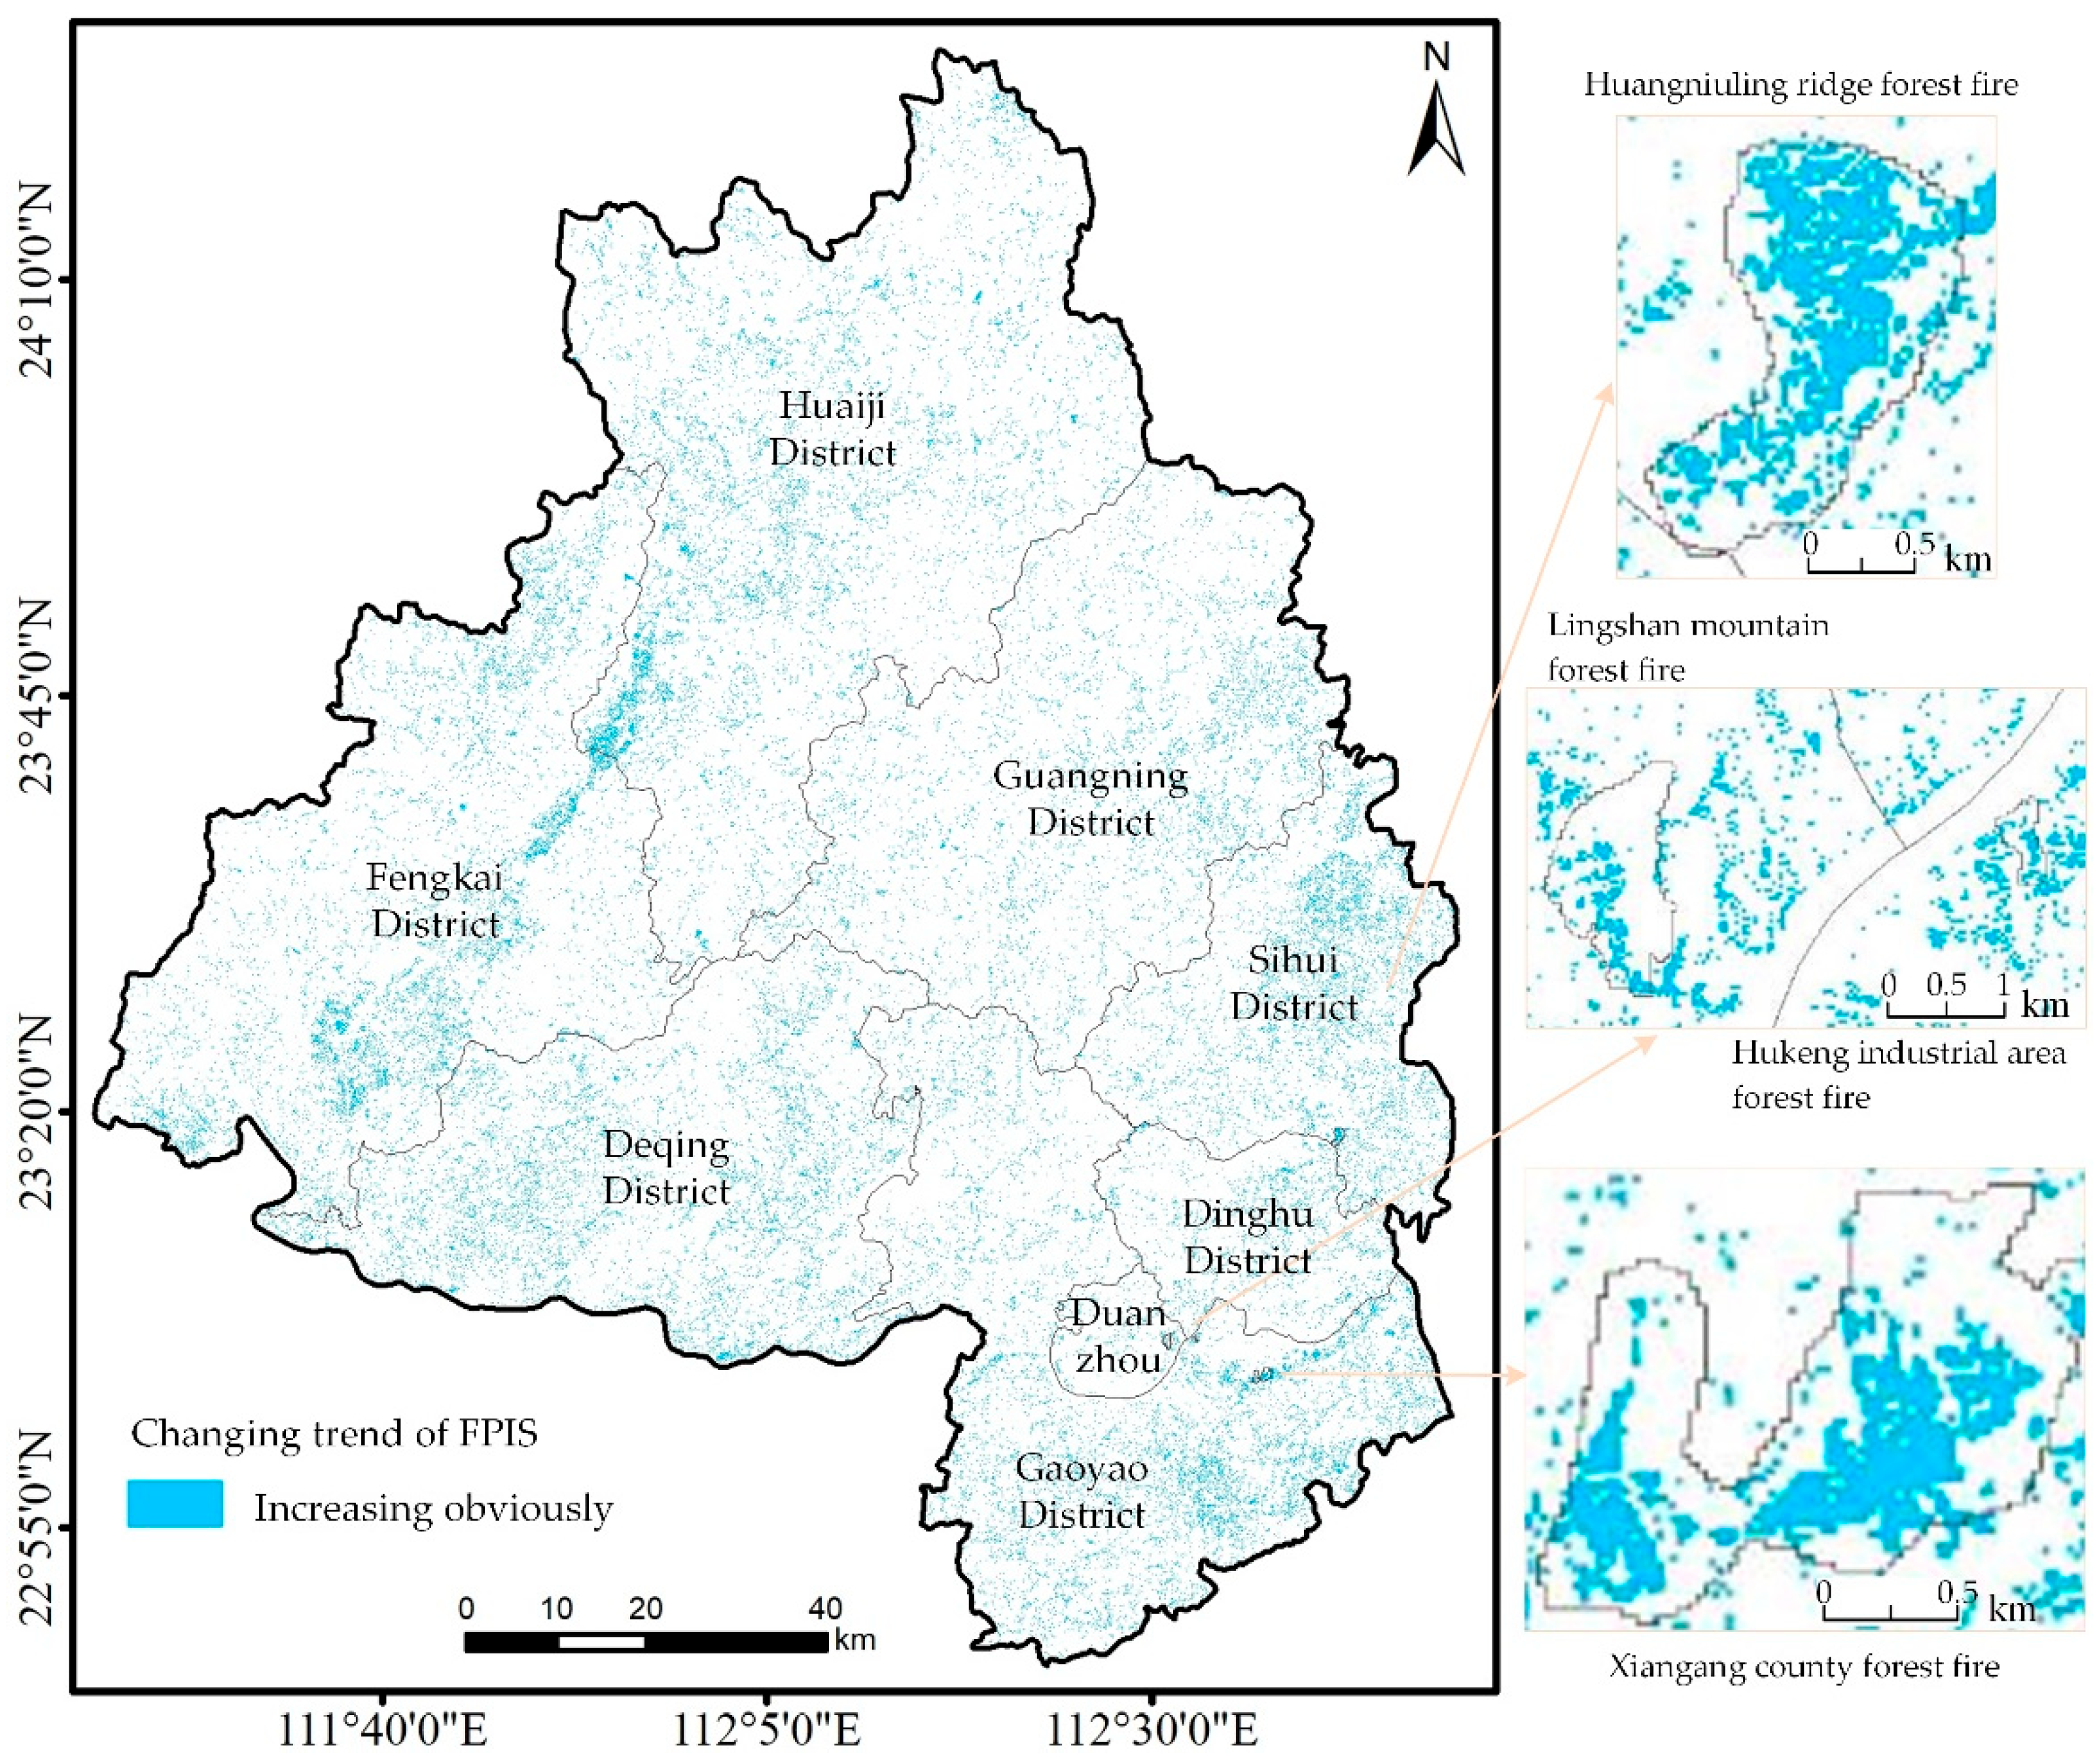
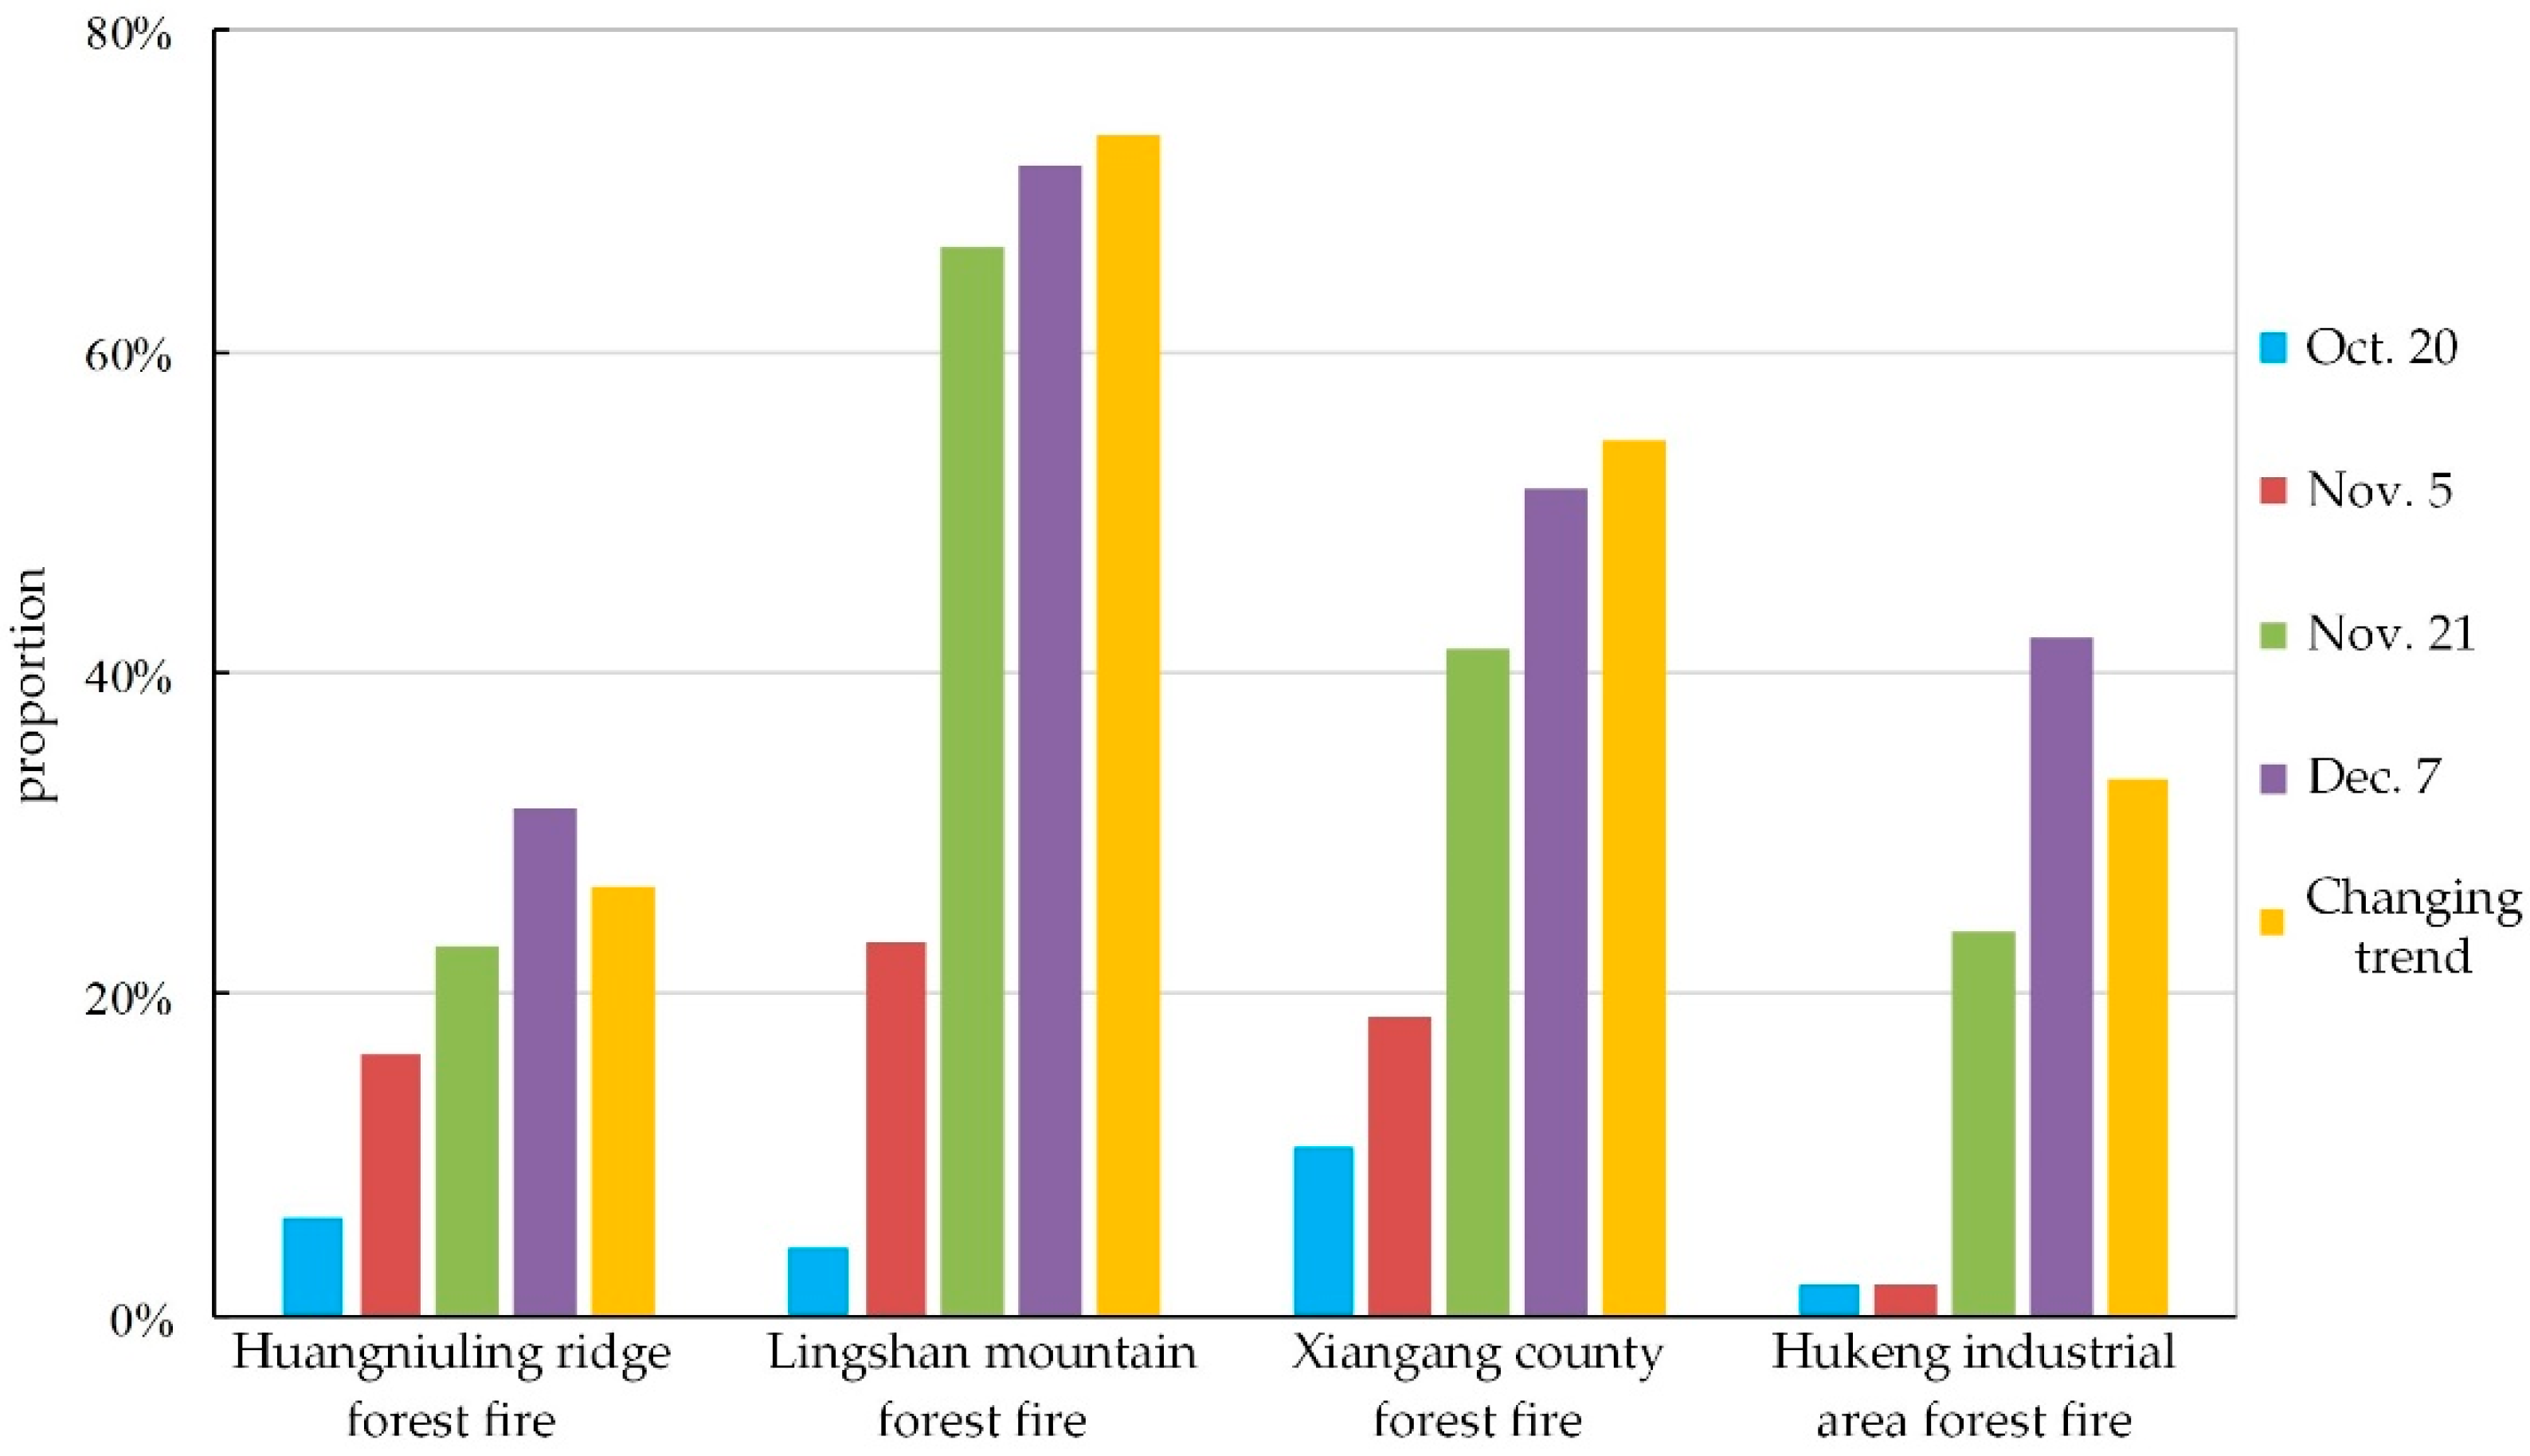
4.4. The Changing Trend and Indicated Significance of Forest Fire Risk in Zhaoqing City

Based on the forest fire risk remote sensing inversion results (Figure 4) in the four consecutive periods of the dry season (October to December) of 2019 in Zhaoqing city, the changing trend in the forest fire risk was further calculated in the study (Figure 7 and Figure 8). In addition, the indicative role and the significance of the changing trend of the forest fire risk in the four forest fire events in 2020 and 2021 were also analyzed.
The results showed that the changing trend in the forest fire risk in most of the areas of Zhaoqing in the dry season of 2019 was not significant (not passing the significance test). It was found that the forest fire risk areas with a significant increasing trend (the risk changes from low to high grade) accounted for only 6.42% in Zhaoqing city (Figure 7 and Figure 8), which implied that forest fires were likely to occur. On the other hand, the distribution was relatively scattered. The west of Huaiji district close to the east of Fengkai district and the southern edge of Dinghushan National Nature Reserve were the main distribution areas (Figure 7). Considering the actual forest fire events in Zhaoqing city (0.0493%) in recent years (2019–2022), there are reasons to believe that the analysis results of the forest fire risk changing trend more effectively highlighted the areas of focus for forest fire prevention (6.42% vs. 8.9%–19.89%) than the single high (extremely high) forest fire risk grade results.
In the four forest fire events, a significant increasing trend in the forest fire risk was found in most areas of the Huangniuling ridge forest fire. The pixels accounted for 73.47% in this region (Figure 7 and Figure 8). An obvious increasing trend in the forest fire risk in the region of the Xiangang county forest fire was also found, accounting for 54.6% (Figure 7 and Figure 8). In the regions of the Lingshan mountain forest fire and the Hukeng industrial area forest fire, the proportions of the increasing trend in the forest fire risk were 26.63% and 35.84%, respectively (Figure 7 and Figure 8). Compared with the single high (extremely high) forest fire risk-grade results in these regions, the uncertainty of the prediction was significantly reduced when using the forest fire risk increasing trend to warn of a forest fire (26.63–73.47% vs. 1.89–71.69%; Figure 8). There is no doubt that the significance was indicated more clearly by the changing trend method.
Figure 7. The changing trend of forest fire risk in Zhaoqing city in dry season, 2019.
Forests 14 00327 g007
Figure 8. The proportions of high forest fire risk and increasing trend in forest fire risk in the areas of four fire events.
Forests 14 00327 g008

5. Conclusions

The monitoring of the spatial and temporal variations in forest fire risk is of great significance for forest fire prevention, fighting and emergency management. Based on the optimized fire-potential index model (FPIS), Landsat 8 time-series images, digital-terrain-slope and air humidity data, this study assessed the dynamic forest fire risk for Zhaoqing city in the dry season of 2019 and further validated the indicative effect of the forest fire risk change trend on the subsequent real forest fire events.
The remote sensing results showed that the high forest fire risk area of Zhaoqing city accounted for 8.9%–18.89% in the dry season, which also indicated the key prevention areas of forest fires in Zhaoqing. Although the projected forest fire risk was significantly different from October to December 2019, the increasing trend in the forest fire risk in the whole city was obvious (Figure 4 and Figure 6). The main distribution areas of high forest fire risk in Zhaoqing city included the depressions of the western parts of Huaiji, Fengkai and Guangning district, the valley plains of Sihui district and the mountain-edge areas of Dinghu and Gaoyao districts (Figure 4).
Moreover, it was found that the significant increasing changing trend of forest fire risk in Zhaoqing accounted for 6.42% only, which was remarkably less than the single results of high forest fire risk areas (Figure 4, Figure 6 and Figure 7). The key prevention areas of forest fires could be narrowed 2.48%–12.47% based on the changing-trend results, given the actual forest fires in the city in recent years (0.0493%).
In the regions of the four forest fire events in 2020 and 2021, it was found that the areas with high forest fire risk and the significant increasing changing trend of forest fire risk accounted for 1.89%–71.69% and 26.63%–73.47%, respectively (Figure 5, Figure 7 and Figure 8). These results further implied that the significant increasing changing trend of forest fire risk could be used to reduce the probability of misjudgment and improve the accuracy of early-warning-area identification to predict forest fires more effectively.

Author Contributions

The individual contributions and responsibilities of the authors are listed as follows: X.Z. and C.W. designed the research and wrote the paper; B.Z. and J.Y. guided the research process; K.N., M.L. and J.W. collected and analyzed the data; W.L., H.H. and C.Y. revised the manuscript, provided some comments and helped edit the manuscript. All authors have read and agreed to the published version of the manuscript.

Funding

This research was supported by Guangdong Forestry Science and Technology Innovation Project (2021KJCX020), Key Special Project for Introduced Talents Team of Southern Marine Science and Engineering Guangdong Laboratory (Guangzhou) (GML2019ZD0301), GDAS’ Project of Science and Technology Development (2020GDASYL-20200302001 and 2020GDASYL-20200104006), Guangzhou Basic and Applied Basic Research Foundation (SL2023A04J01252).

Data Availability Statement

Not applicable.

Acknowledgments

Thanks are given to Dinghushan Forest Ecosystem Research Station, CAS, for help with the field surveys.

Conflicts of Interest

The authors declare no conflict of interest.

References

  1. Fazeli-Varzaneh, M.; Bettinger, P.; Ghaderi-Azad, E.; Kozak, M.; Mafi-Gholami, D.; Jaafari, A. Forestry Research in the Middle East: A Bibliometric Analysis. Sustainability 2021, 13, 8261. [Google Scholar] [CrossRef]
  2. Bhadoria, R.S.; Pandey, M.K.; Kundu, P. Random vector forest regression model for integrated & enhanced approach in forest fires predictions. Ecol. Inform. 2021, 66, 101471. [Google Scholar]
  3. Xu, Y.; Li, D.; Ma, H.; Lin, R.; Zhang, F. Modeling Forest Fire Spread Using Machine Learning-Based Cellular Automata in a GIS Environment. Forests 2022, 13, 1974. [Google Scholar] [CrossRef]
  4. Jaafari, A.; Pazhouhan, I.; Bettinger, P. Machine Learning Modeling of Forest Road Construction Costs. Forests 2021, 12, 1169. [Google Scholar] [CrossRef]
  5. Li, X.; Wang, J.; Song, W.; Ma, J.; Luciano, T.; Zhang, Y. Automatic Smoke Detection in MODIS Satellite Data based on K-means Clustering and Fisher Linear Discrimination. Photogramm. Eng. Remote Sens. 2014, 80, 971–982. [Google Scholar] [CrossRef]
  6. Li, X.; Jin, H.; Wang, H.; Wu, X.; Huang, Y.; He, R.; Luo, D.; Jin, X. Distributive features of soil carbon and nutrients in permafrost regions affected by forest fires in northern Da Xing’anling (Hinggan) Mountains, NE China. Catena 2020, 185, 104304. [Google Scholar] [CrossRef]
  7. Ren, H.; Zhang, L.; Yan, M.; Chen, B.; Yang, Z.; Ruan, L. Spatiotemporal Assessment of Forest Fire Vulnerability in China Using Automated Machine Learning. Remote Sens. 2022, 14, 5965. [Google Scholar] [CrossRef]
  8. Wang, Z.; Fang, K.; Yao, Q. Fire history and its forcing in Northeastern Asia boreal forests. Nat. Hazards Res. 2022, 2, 166–171. [Google Scholar] [CrossRef]
  9. Xiong, Y.; Xu, W.; Huang, S.; Liu, M.; Lei, J.; Wu, C.; Xu, H.; Wang, H. Fine Extraction of Forest Burned Area by Using Fusion Visible Light UAV Image with Sentinel−2A image. J. Southwest For. Univ. 2021, 41, 103–110. [Google Scholar]
  10. Shin, J.-I.; Seo, W.-W.; Kim, T.; Park, J.; Woo, C.-S. Using UAV Multispectral Images for Classification of Forest Burn Severity—A Case Study of the 2019 Gangneung Forest Fire. Forests 2019, 10, 1025. [Google Scholar] [CrossRef]
  11. Sun, F.; Li, X.; Li, Z.; Qin, X. Near-real-time forest fire monitoring system with medium and high spatial resolutions. J. Remote Sens. 2020, 24, 543–549. [Google Scholar]
  12. Abdul Kadir, E.; Listia Rosa, S.; Syukur, A.; Othman, M.; Daud, H. Forest fire spreading and carbon concentration identification in tropical region Indonesia. Alex. Eng. J. 2022, 61, 1551–1561. [Google Scholar] [CrossRef]
  13. Denham, M.M.; Waidelich, S.; Laneri, K. Visualization and modeling of forest fire propagation in Patagonia. Environ. Model. Softw. 2022, 158, 105526. [Google Scholar] [CrossRef]
  14. Sun, Y.; Zhang, Q.; Li, K.; Huo, Y.; Zhang, Y. Trace gas emissions from laboratory combustion of leaves typically consumed in forest fires in Southwest China. Sci. Total Environ. 2022, 846, 157282. [Google Scholar] [CrossRef]
  15. Wiggins, E.B.; Andrews, A.; Sweeney, C.; Miller, J.B.; Miller, C.E.; Veraverbeke, S.; Commane, R.; Wofsy, S.; Henderson, J.M.; Randerson, J.T. Boreal forest fire CO and CH4 emission factors derived from tower observations in Alaska during the extreme fire season of 2015. Atmos. Chem. Phys. 2021, 21, 8557–8574. [Google Scholar] [CrossRef]
  16. Ding, H.; Wu, Y. Fire Information Detection of the Bilahe Forest Based on Moderate Resolution Imaging Spectroradiometer Data. J. Univ. Jinan (Sci. Technol.) 2020, 34, 230–237, 246. [Google Scholar]
  17. Li, M.; Kang, X.; Fan, W. Burned Area Extraction in Huzhong Forests Based on Remote Sensing and the Spatial Analysis of the Burned Severity. Sci. Silvae Sin. 2017, 53, 163–174. [Google Scholar]
  18. Liu, S.; Zheng, Y.; Dalponte, M.; Tong, X. A novel fire index-based burned area change detection approach using Landsat-8 OLI data. Eur. J. Remote Sens. 2020, 53, 104–112. [Google Scholar] [CrossRef]
  19. Vega, S.G.-D.; Heras, J.D.L.; Moya, D. Resilience of Mediterranean terrestrial ecosystems and fire severity in semiarid areas: Responses of Aleppo pine forests in the short, mid and long term. Sci. Total Environ. 2016, 573, 1171–1177. [Google Scholar] [CrossRef]
  20. Song, R.; Wang, T.; Han, J.; Xu, B.; Ma, D.; Zhang, M.; Li, S.; Zhuang, B.; Li, M.; Xie, M. Spatial and temporal variation of air pollutant emissions from forest fires in China. Atmos. Environ. 2022, 281, 119156. [Google Scholar] [CrossRef]
  21. Liu, Z.; Zhang, K.; Wang, C.; Huang, S. Research on the identification method for the forest fire based on deep learning. Optik 2020, 223, 165491. [Google Scholar] [CrossRef]
  22. Badmaev, N.; Bazarov, A. Correlation analysis of terrestrial and satellite meteodata in the territory of the Republic of Buryatia (Eastern Siberia, Russian Federation) with forest fire statistics. Agric. For. Meteorol. 2021, 297, 108245. [Google Scholar] [CrossRef]
  23. Liu, X.; He, B.; Quan, X.; Yebra, M.; Qiu, S.; Yin, C.; Liao, Z.; Zhang, H. Near Real-Time ExtractingWildfire Spread Rate from Himawari-8 Satellite Data. Remote Sens. 2018, 10, 1654. [Google Scholar] [CrossRef]
  24. Zhou, L.; Gao, G.; Qiu, D.; Huang, B. Fire-monitoring method of FPI-NDVI based on MODIS data. Fire Saf. Sci. 2008, 17, 77–82. [Google Scholar]
  25. Zheng, Z.; Gao, Y.; Yang, Q.; Zou, B.; Xu, Y.; Chen, Y.; Yang, S.; Wang, Y.; Wang, Z. Predicting forest fire risk based on mining rules with ant-miner algorithm in cloud-rich areas. Ecol. Indic. 2020, 118, 106772. [Google Scholar] [CrossRef]
  26. Giglio, L.; Werf, G.R.v.d.; Randerson, J.T.; Collatz, G.J.; Kasibhatla, P. Global estimation of burned area using MODIS active fire observations. Atmos. Chem. Phys. 2006, 6, 957–974. [Google Scholar] [CrossRef] [Green Version]
  27. Pham, B.T.; Jaafari, A.; Avand, M.; Al-Ansari, N.; Du, T.D.; Yen, H.P.H.; Phong, T.V.; Nguyen, D.H.; Le, H.V.; Mafi-Gholami, D.; et al. Performance Evaluation of Machine Learning Methods for Forest Fire Modeling and Prediction. Symmetry 2020, 12, 1022. [Google Scholar] [CrossRef]
  28. Enoh, M.A.; Okeke, U.C.; Narinua, N.Y. Identification and modelling of forest fire severity and risk zones in the Cross–Niger transition forest with remotely sensed satellite data. Egypt. J. Remote Sens. Space Sci. 2021, 24 Pt 2, 879–887. [Google Scholar] [CrossRef]
  29. Maffei, C.; Lindenbergh, R.; Menenti, M. Combining multi-spectral and thermal remote sensing to predict forest fire characteristics. ISPRS J. Photogramm. Remote Sens. 2021, 181, 400–412. [Google Scholar] [CrossRef]
  30. Singh, S.; Singh, H.; Sharma, V.; Shrivastava, V.; Kumar, P.; Kanga, S.; Sahu, N.; Meraj, G.; Farooq, M.; Singh, S.K. Impact of Forest Fires on Air Quality inWolgan Valley, New SouthWales, Australia—A Mapping and Monitoring Study Using Google Earth Engine. Forests 2022, 13, 4. [Google Scholar] [CrossRef]
  31. Yin, C.; He, B.; Quan, X.; Yebra, M.; Lai, G. Remote Sensing of Burn Severity Using Coupled Radiative Transfer Model: A Case Study on Chinese Qinyuan Pine Fires. Remote Sens. 2020, 12, 3590. [Google Scholar] [CrossRef]
  32. Sannigrahi, S.; Pilla, F.; Basu, B.; Basu, A.S.; Sarkar, K.; Chakraborti, S.; Joshi, P.K.; Zhang, Q.; Wang, Y.; Bhatt, S.; et al. Examining the effects of forest fire on terrestrial carbon emission and ecosystem production in India using remote sensing approaches. Sci. Total Environ. 2020, 725, 138331. [Google Scholar] [CrossRef] [PubMed]
  33. Zheng, Y.; Zhao, Y.; Liu, W.; Liu, S.; Yao, R. An Intelligent Wireless System for Field Ecology Monitoring and Forest Fire Warning. Sensors 2018, 18, 4457. [Google Scholar] [CrossRef] [PubMed]
  34. Quan, X.; He, B.; Liu, X.; Liao, Z.; Qiu, S.; Yin, C. Retrieval of fuel moisture content by using radiative transfer models from optical remote sensing data. J. Remote Sens. 2019, 23, 62–77. [Google Scholar]
  35. Weiser, F.; Sauer, A.; Gettueva, D.; Field, R.; Irl, S.D.H.; Vetaas, O.; Chiarucci, A.; Hoffmann, S.; Fernández-Palacios, J.M.; Otto, R.; et al. Impacts of Forest Fire on Understory Species Diversity in Canary Pine Ecosystems on the Island of La Palma. Forests 2021, 12, 1638. [Google Scholar] [CrossRef]
  36. Schroeder, W.; Oliva, P.; Giglio, L.; Quayle, B.; Lorenz, E.; Morelli, F. Active fire detection using Landsat-8/OLI data. Remote Sens. Environ. 2016, 185, 210–220. [Google Scholar] [CrossRef]
  37. Drusch, M.; Bello, U.; Carlier, S.; Colin, O.; Fernandez, V.; Gascon, F.; Hoersch, B.; Isola, C.; Laberinti, P.; Martimort, P. Sentinel-2 optical high resolution mission for GMES land operational services. Remote Sens. Environ. 2012, 120, 25–36. [Google Scholar] [CrossRef]
  38. Biasi, R.; Colantoni, A.; Ferrara, C.; Ranalli, F.; Salvati, L. In-between sprawl and fires: Long-term forest expansion and settlement dynamics at the wildland–urban interface in Rome, Italy. Int. J. Sustain. Dev. World Ecol. 2015, 22, 467–475. [Google Scholar] [CrossRef]
  39. Zhao, P.; Liu, L. Prediction of forest fire danger rating based on meteorological and space-time factors. J. For. Eng. 2018, 3, 102–110. [Google Scholar]
  40. Fang, X.; He, C. Present Situation, Influencing Factors and Potential analysis of Forestry Carbon Sequestration Project in Zhaoqing City. J. Agric. Catastropholgy 2021, 11, 188–190. [Google Scholar]
  41. Wang, C.; Zhou, C.; Chen, S.; Xie, Y.; Li, D.; Yang, J.; Zhou, X.; Li, Y.; Wang, D.; Liu, Y. Retrospect and perspective of the estuarine turbidity maximum zone researches. Chin. Sci. Bull. 2021, 66, 2328–2342. [Google Scholar] [CrossRef]
  42. Wang, C.; Wang, L.; Wang, D.; Li, D.; Zhou, C.; Jiang, H.; Zheng, Q.; Chen, S.; Jia, K.; Liu, Y.; et al. Turbidity maximum zone index: A novel model for remote extraction of the turbidity maximum zone in different estuaries. Geosci. Model Dev. 2021, 14, 6833–6846. [Google Scholar] [CrossRef]
  43. Li, Y.; Quan, X.; Liao, Z.; He, B. Forest Fuel Loads Estimation from Landsat ETM+ and ALOS PALSAR Data. Remote Sens. 2021, 13, 1189. [Google Scholar] [CrossRef]
  44. Luo, K.; Quan, X.; He, B.; Yebra, M. Eects of Live Fuel Moisture Content on Wildfire Occurrence in Fire-Prone Regions over Southwest China. Forests 2019, 10, 887. [Google Scholar] [CrossRef] [Green Version]
  45. Wang, W. Study on Forest Fire Risk Zone Based on Forest Fire Risk Index. For. Resour. Manag. 2015, 4, 79–83. [Google Scholar]
  46. He, Y. Occurrence Regularity of Forest Fire in Guangxi and Its Correlation with Meteorological Factors. Master’s Thesis, Central South University of Forestry and Technology, Changsha, China, 2018. [Google Scholar]
  47. Wu, L. Study on ArcGIS forest fire risk zoning based on forest resource data. Anhui Agric. Sci. Bull. 2018, 24, 93–96, 121. [Google Scholar]
  48. Duan, J.; Li, X.; Wu, B.; Jiang, Y.; Ma, F.; Qi, J. Study on Forest Fire Risk Regionalization in Tai Shan Mountain Based on Landsat 8. Sens. World 2020, 26, 17–21. [Google Scholar]
  49. Huang, B.; Tian, L.; Zhou, L.; Shi, C. The fire potential index (FPI) based on MODIS data and its application. Remote Sens. Land Resour. 2008, 20, 56–60 and 111. [Google Scholar]
  50. Cai, J.; Qiu, J.; Wang, D.; Lin, K.; Yang, K.; Zeng, Q. Forest fire prediction based on soil moisture and meteorological factors: Taking Guangdong Province as an example. Sci. Geogr. Sin. 2021, 41, 1676–1686. [Google Scholar]
Table 3. Forest fire risk level based on FPIS results.
LevelsDescription
FPIS < 40Extremely lowextremely unfavorable for forest fires
40 ≤ FPIS < 50Lowunfavorable for forest fires
50 ≤ FPIS < 60Moderatenormal
60 ≤ FPIS < 70Highfavorable for forest fires
70 ≤ FPIS Extremely highextremely favorable for forest fires
Disclaimer/Publisher’s Note: The statements, opinions and data contained in all publications are solely those of the individual author(s) and contributor(s) and not of MDPI and/or the editor(s). MDPI and/or the editor(s) disclaim responsibility for any injury to people or property resulting from any ideas, methods, instructions or products referred to in the content.

