
Changes in Slope Stability over the Growth and Decay of Japanese Cedar Tree Roots

1
Forestry and Forest Products Research Institute, Forest Research and Management Organization, 1 Matsunosato, Tsukuba 305-8687, Ibaraki, Japan
2
Department of Environmental Engineering Science, Gunma University, Tenjin 1-5-1, Kiryu 376-8515, Gunma, Japan
3
Kyushu Research Center, Forestry and Forest Products Research Institute, Forest Research and Management Organization, Kurokami 4-11-16, Chuo, Kumamoto 860-0862, Kumamoto, Japan
*
Author to whom correspondence should be addressed.
Forests 2023, 14(2), 256; https://doi.org/10.3390/f14020256
Submission received: 14 December 2022
/
Revised: 21 January 2023
/
Accepted: 22 January 2023
/
Published: 29 January 2023
(This article belongs to the Special Issue Landslides in Forests around the World: Causes and Mitigation)
Abstract
:In Japan, repeated driftwood landslide disasters have become a major issue; thus, studies are required to better understand forest function to implement appropriate forest management and prevent such disasters. We investigated the effect of Japanese cedar tree roots on shallow landslide initiation. To incorporate the effect of roots on the two side-flanks of the shallow landslide, we propose a new slope-stability analysis method in which the sliding block is simplified as a three-prism model. The root reinforcement was approximated by the sum of the root pullout forces over a unit area, incorporating changes in the root strength with the growth of the trees after planting and the decay of the stumps after cutting. The reinforced root strength after the stump-cutting decreased linearly with time, with no strength remaining at 9 years. In contrast, the reinforced root strength of the new plants increased according to a logistic curve with time; thus, the root strength increased only slightly up to 9 years after planting, and the minimum total reinforced root strength was observed at this time. The safety factor of the slopes in a forest basin in Ibaraki Prefecture was calculated using the proposed three-prism method at intervals of 5 years on a 1-metre-resolution digital elevation model. The number of unstable grids peaked at 10 years, and a higher risk of slope instability was observed at 5–15 years. Therefore, implementing forest operations for lowering slope instability during this period should be important to prevent landslide disasters.
1. Introduction
In Japan, driftwood landslide disasters are a major concern, owing to the regional development of residences in mountainous areas and an increase in the number of severe rainfall events, probably influenced by climate change [1]. In the last quarter century, debris flows mobilised from shallow landslides or complex earth slides–earth flows [2] have hit some residential areas, extending to alluvial fans in many places [3,4,5]. Notably, in Hiroshima Prefecture, debris flows have severely damaged areas within a short period, causing 31 and 74 deaths in 1999 and 2014, respectively [6,7,8,9].
In July 2018, a large amount of driftwood was observed in landslides induced by heavy rainfall events over the western part of the main island and Shikoku Island [10]. The relationship between forests and landslide disasters has received substantial attention from researchers, engineers, and administrative officers. In particular, the differences in landslide susceptibility between natural and artificial forests and between coniferous and broadleaf forests have been examined [11,12]. After an extended period of afforestation from around the 1950s to the 1970s, the trees have grown large and are ready for harvest [13]; therefore, the strategies for controlling and managing forests must be carefully considered. Trees are hazardous once they are engulfed and become driftwood, but they reinforce slopes through networking root systems within the subsoil that prevent shallow landslides. In some cases, trees can capture flows of driftwood and debris to decrease downslope damage [14,15]. Regarding the multifunctional role of forests, the public has been aware of their disaster prevention function against landslides and erosion for 40 years and now understands that they help prevent climate change by absorbing greenhouse gases [16]. As of 31 March 2021, the Forestry Agency of the Ministry of Agriculture, Forestry and Fisheries has designated areas in the national forest as forest reserves (1.3 × 10⁵ km2) [17]; these forest areas are expected to prevent soil run-off (2.6 × 10⁴ km2) and landslides (6.0 × 10² km2), thereby acting as countermeasures against forest disasters.
The ability of tree roots to prevent shallow landslides has been investigated intensively. For example, the mechanical behaviour of roots crossing a sliding surface during shearing has been closely examined, and reinforced root strength is known to act as the root cohesion component (cr) in the Mohr–Coulomb failure equation [18,19,20,21,22]. In addition, root pullout experiments have revealed that the summation of root pullout strength over a unit area acts as cr [23,24]. Accordingly, the root bundle model was proposed, in which the root length, maximum tensile force, and average Young’s modulus were approximated using a function of the root diameter [25]. The effects of the root distribution, root angles across the sliding surface, and root diameter have also been examined in triaxial compression tests [26]. Large-scale, in situ direct shear experiments have been conducted, in which specimens (about 1 m in both width and length) holding a tree stump were excavated for direct shearing [27,28,29], with one such experiment conducted on a steep slope of 32° [30].
Analyses of slope stability have been conducted considering cr [31,32,33]. In this regard, the two-dimensional (2-D) infinite slope model is commonly employed, given its simplicity, i.e., the reinforced strength of roots is given only over the bottom surface of an oblique quadrangular prism; therefore, only the vertical roots penetrating to the bottom of a sliding surface contribute to reinforcing the slope stability. Considering the importance of lateral roots, slope models that enable the evaluation of their effects have been developed. The effects of lateral roots have been considered in the 2-D infinite slope model [34]; however, only one vertical surface of the oblique quadrangular prism at the upslope side in the longitudinal direction was considered, and the effects of lateral roots on the vertical surface at the downslope side and two side-flanks of the prism were not examined. Regarding the transverse direction, Ueno [35] investigated the effect of widths on landslide initiation using an infinite slope model in the longitudinal direction but with a transverse trapezium section; however, the transverse slope of the side-flanks of the trapezium section was assumed to be constant and equal to 45°, and cr was not considered.
To evaluate the effects of lateral roots across the side-flanks, a three-dimensional (3-D) slope model should be used. Indeed, 3-D slope stability has commonly been analysed to calculate the safety factors related to relatively large, deep-seated landslides for which the whole sliding surface of the landslide mass could be approximated before the final failure [36,37,38,39]. General and rigorous limit equilibrium methods have been proposed for performing a 3-D slope-stability analysis [40,41], and recent advances in such analyses were reviewed by Kumar [42]. However, for most shallow landslides, the length is much greater than the transverse width, and the side-flanks of the sliding surface cannot be determined before the failure initiation, making it difficult to apply a 3-D analysis method to shallow landslides. Thus, changes in the slope stability associated with shallow landslides in forest basins have been investigated using digital elevation models with the 2-D infinite slope model [21,43,44,45]. In such studies, the main focus was the changes in triggering conditions, such as rainfall infiltration, determined through saturated and unsaturated seepage flow analysis, which is investigated because rainfall-induced shallow landslides are frequent disasters.
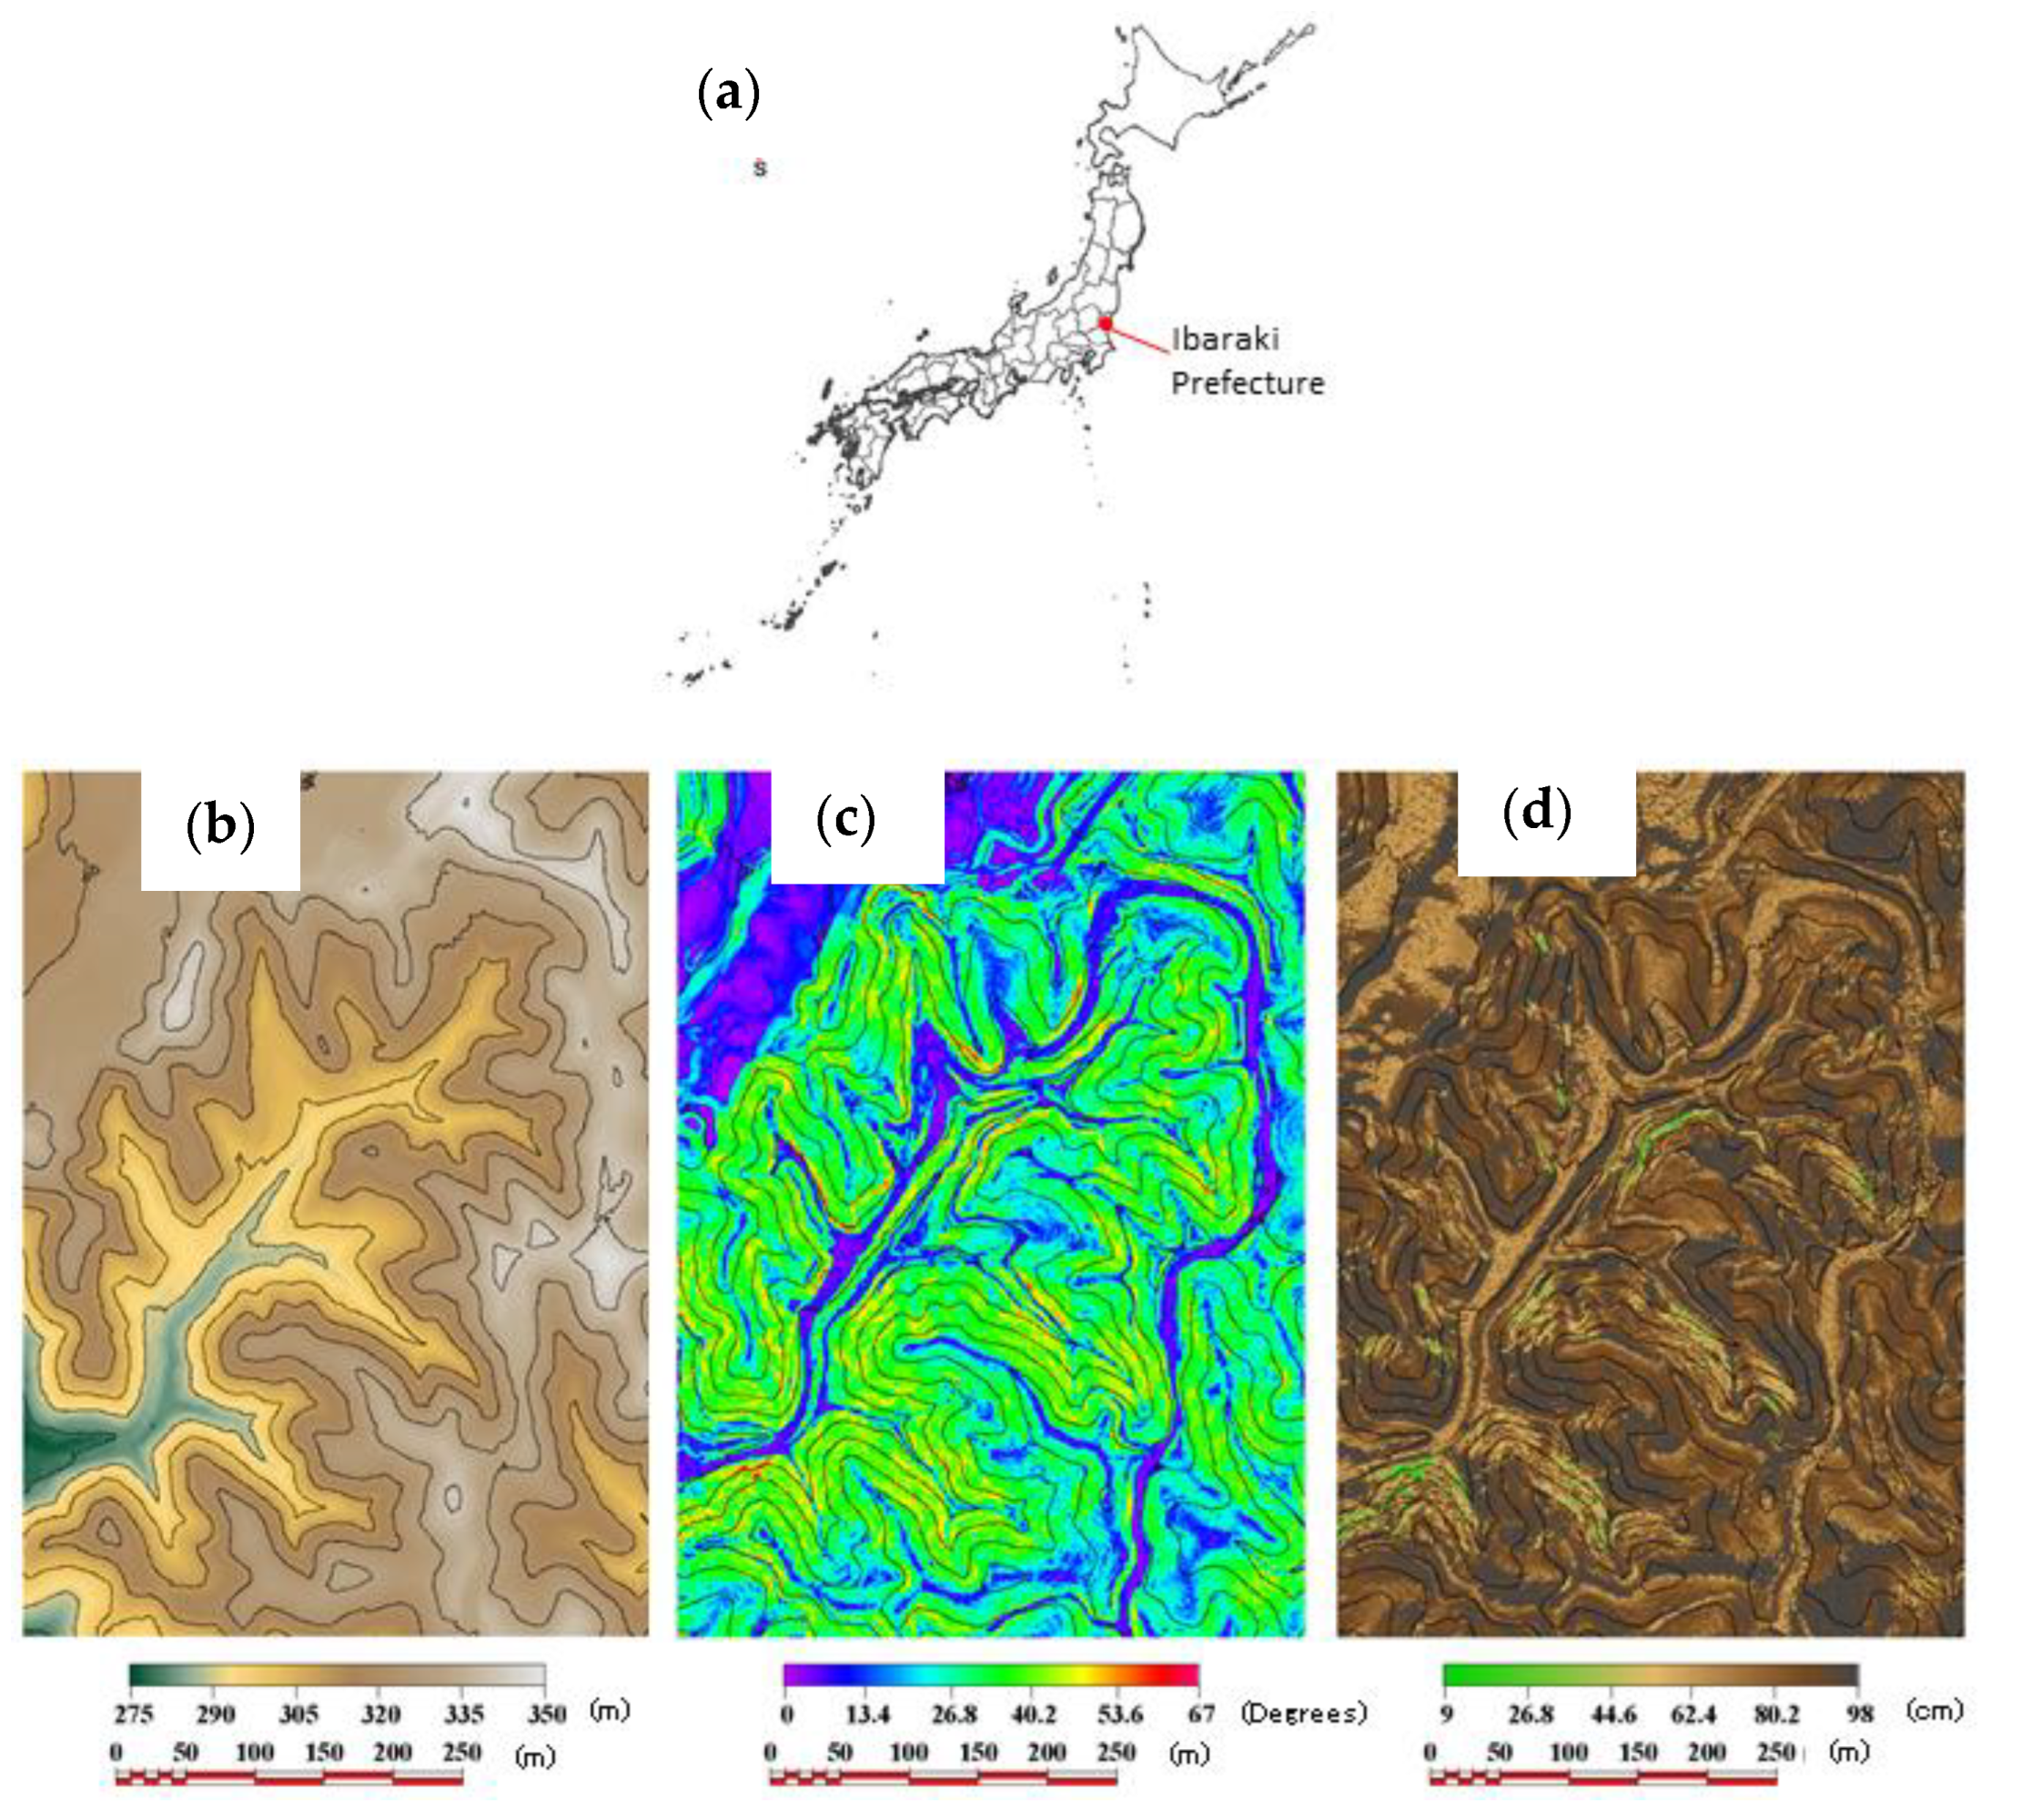
The focus of the present study was the stability changes in forest slopes over the years as an important factor in the induction of shallow landslides. The forest growth over time improves the ability of a forest to prevent shallow landslides, but a forest loses this ability after a certain level of cutting is conducted. Accordingly, the yearly changes in the ability of a forest to prevent shallow landslides are complex. Because yearly changes affect the induction of shallow landslides, a slope stability evaluation should include the growth and decay of the trees. Japanese cedars are the most planted trees in Japan, occupying about 18% of all Japanese forests, as of 31 March 2018 [46]; hence, Japanese cedars were examined in the present study. We propose a method for assessing slope stability using three prisms to analyse the effects of the lateral roots. The proposed method was applied to a forest basin in Ibaraki Prefecture, northeast of Tokyo, Japan, for which the topography was represented by a 1-metre-resolution digital elevation model. The change in the slope stability of the forest basin was evaluated over a 50-year period after the stump cutting and immediate planting of Japanese cedar trees.
2. Materials and Methods
2.1. Root Pullout Experiments
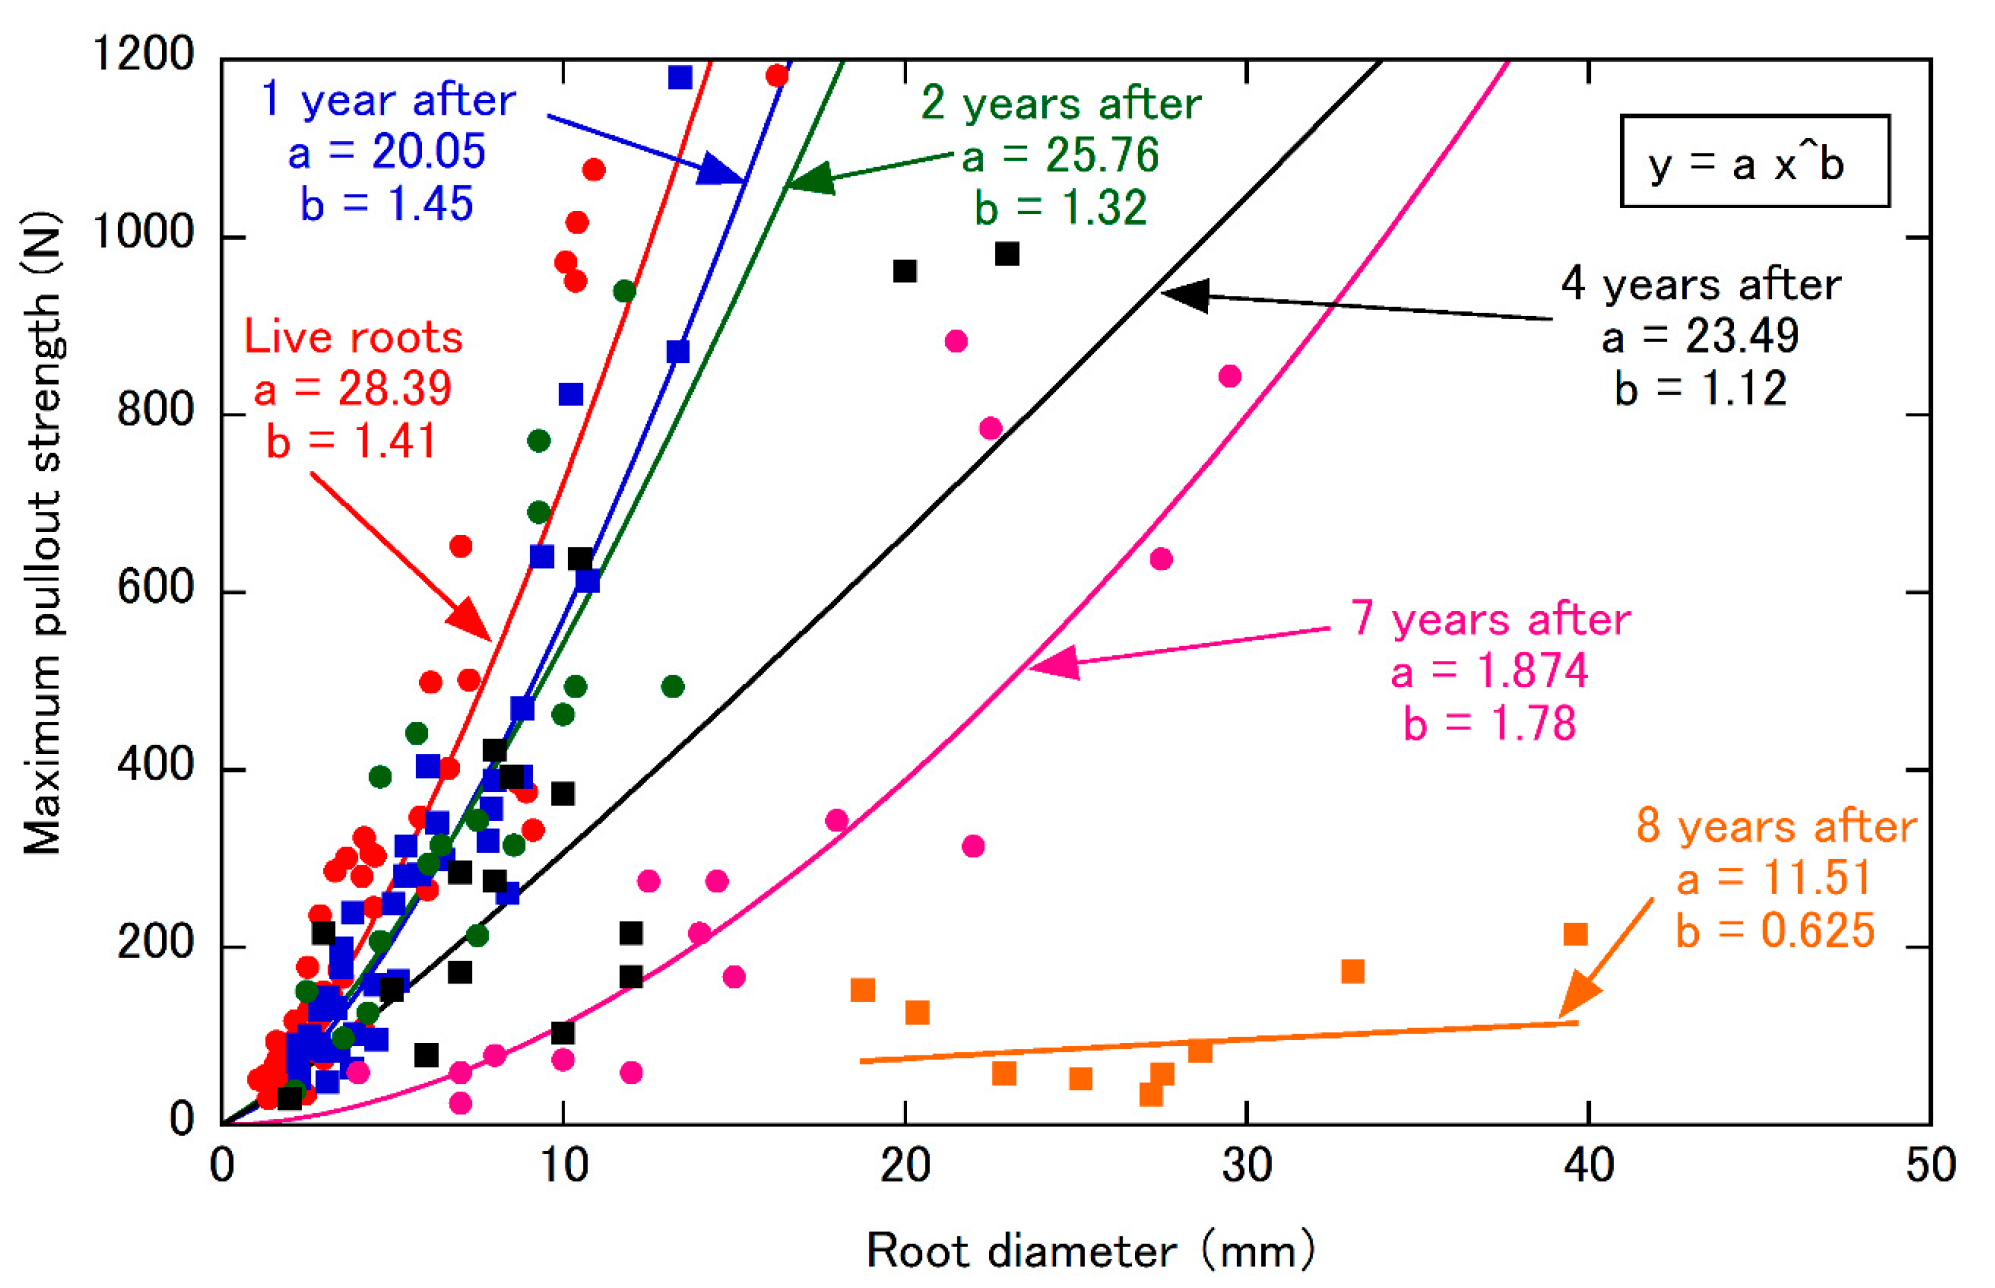
A series of pullout experiments was conducted to investigate the reinforced strength of Japanese cedar roots, i.e., the root cohesion component (cr) in the Mohr–Coulomb failure criterion. Half-sphere-shaped trenches with a diameter of 0.3–0.5 m centred in the test tree trunk were excavated below the trunks. A pullout experiment was conducted on each root exposed on the trench surface following diameter measurements. In the pullout experiment, the roots were pinched with a pliers-like tool and pulled manually to measure the maximum pullout force, using a force gauge (Digital Force Gauge, ZTS-1000N, IMADA Limited, Aichi, Japan) connected to the pliers-like tool. The diameter of the pulled-out roots was 2–40 mm. Although broken and unbroken roots were observed during the experiment, we did not distinguish the measured maximum forces of the broken roots from those without ruptures. We selected uncut tree trunks to investigate live roots, and those cut 1, 2, 4, 7, and 8 years ago to examine changes following decay. At least two trunks were examined for each condition.
2.2. Roots on the Sliding Surface
To calculate cr, the number and diameter of roots on a potential sliding surface must be obtained. Although tree root distributions are generally not simple, we used the root distribution model for Japanese cedar trees proposed by Abe [22], who excavated a layer of soil below the test trees to a depth of 10 cm and measured the number and diameter of all the exposed roots; this excavation process was repeated at 10 cm intervals until no roots were found. Abe surveyed four locations in Japan, one of which was in Ibaraki Prefecture [22], where the changes in the slope stability in a forest basin were investigated in the present study.
Abe [22] proposed a root volume depth-wise distribution of 10 cm, as follows:
where V(z) is the root volume in a 10-centimetre-thick layer (cm3), Vr is the total root volume (cm3), z is the depth (cm), Zmax is the maximum root depth (cm), and zc is the depth parameter varying by 10 cm (zc = 10, 20, …, zcmax, e.g., in Equation (1), at zc = 10, the root volume in the soil layer 0–10 cm deep would be calculated, whereas that at zc = 20 would be calculated in the soil layer 10–20 cm deep, and so on; zcmax is the upper limit of a 10-centimetre-deep class containing Zmax, e.g., at Zmax = 97 cm; zcmax would be 100 cm); f(z) is a Weibull probability density function; and m and α0 are the Weibull parameters. The total root volume, Vr, was calculated using an equation for the total weight [47]:
where H is the height of the tree (cm), DBH is the diameter at breast height (cm), Wr is the total weight of the roots (gf), and Gs is the unit weight of the roots, set at 0.973 gf/cm3 in the present study [48].
The soil was divided into three zones: shallow, middle, and deep. The roots were then classified into 0.5-centimetre-wide classes, and the relative frequencies were calculated for the shallow, middle, and deep zones before they were expressed using the diameter class:
where Di is the class mark for the 0.5-centimetre-wide diameter of roots (Di = 0.25, 0.75, 1.25 cm, and so on), and Yt(Di), Ym(Di), and Yb(Di) are the relative frequencies in the topsoil, middle, and bottom zones, respectively. In addition, the average volume of a root in each class [Va(Di)] was measured and expressed using the diameter class:
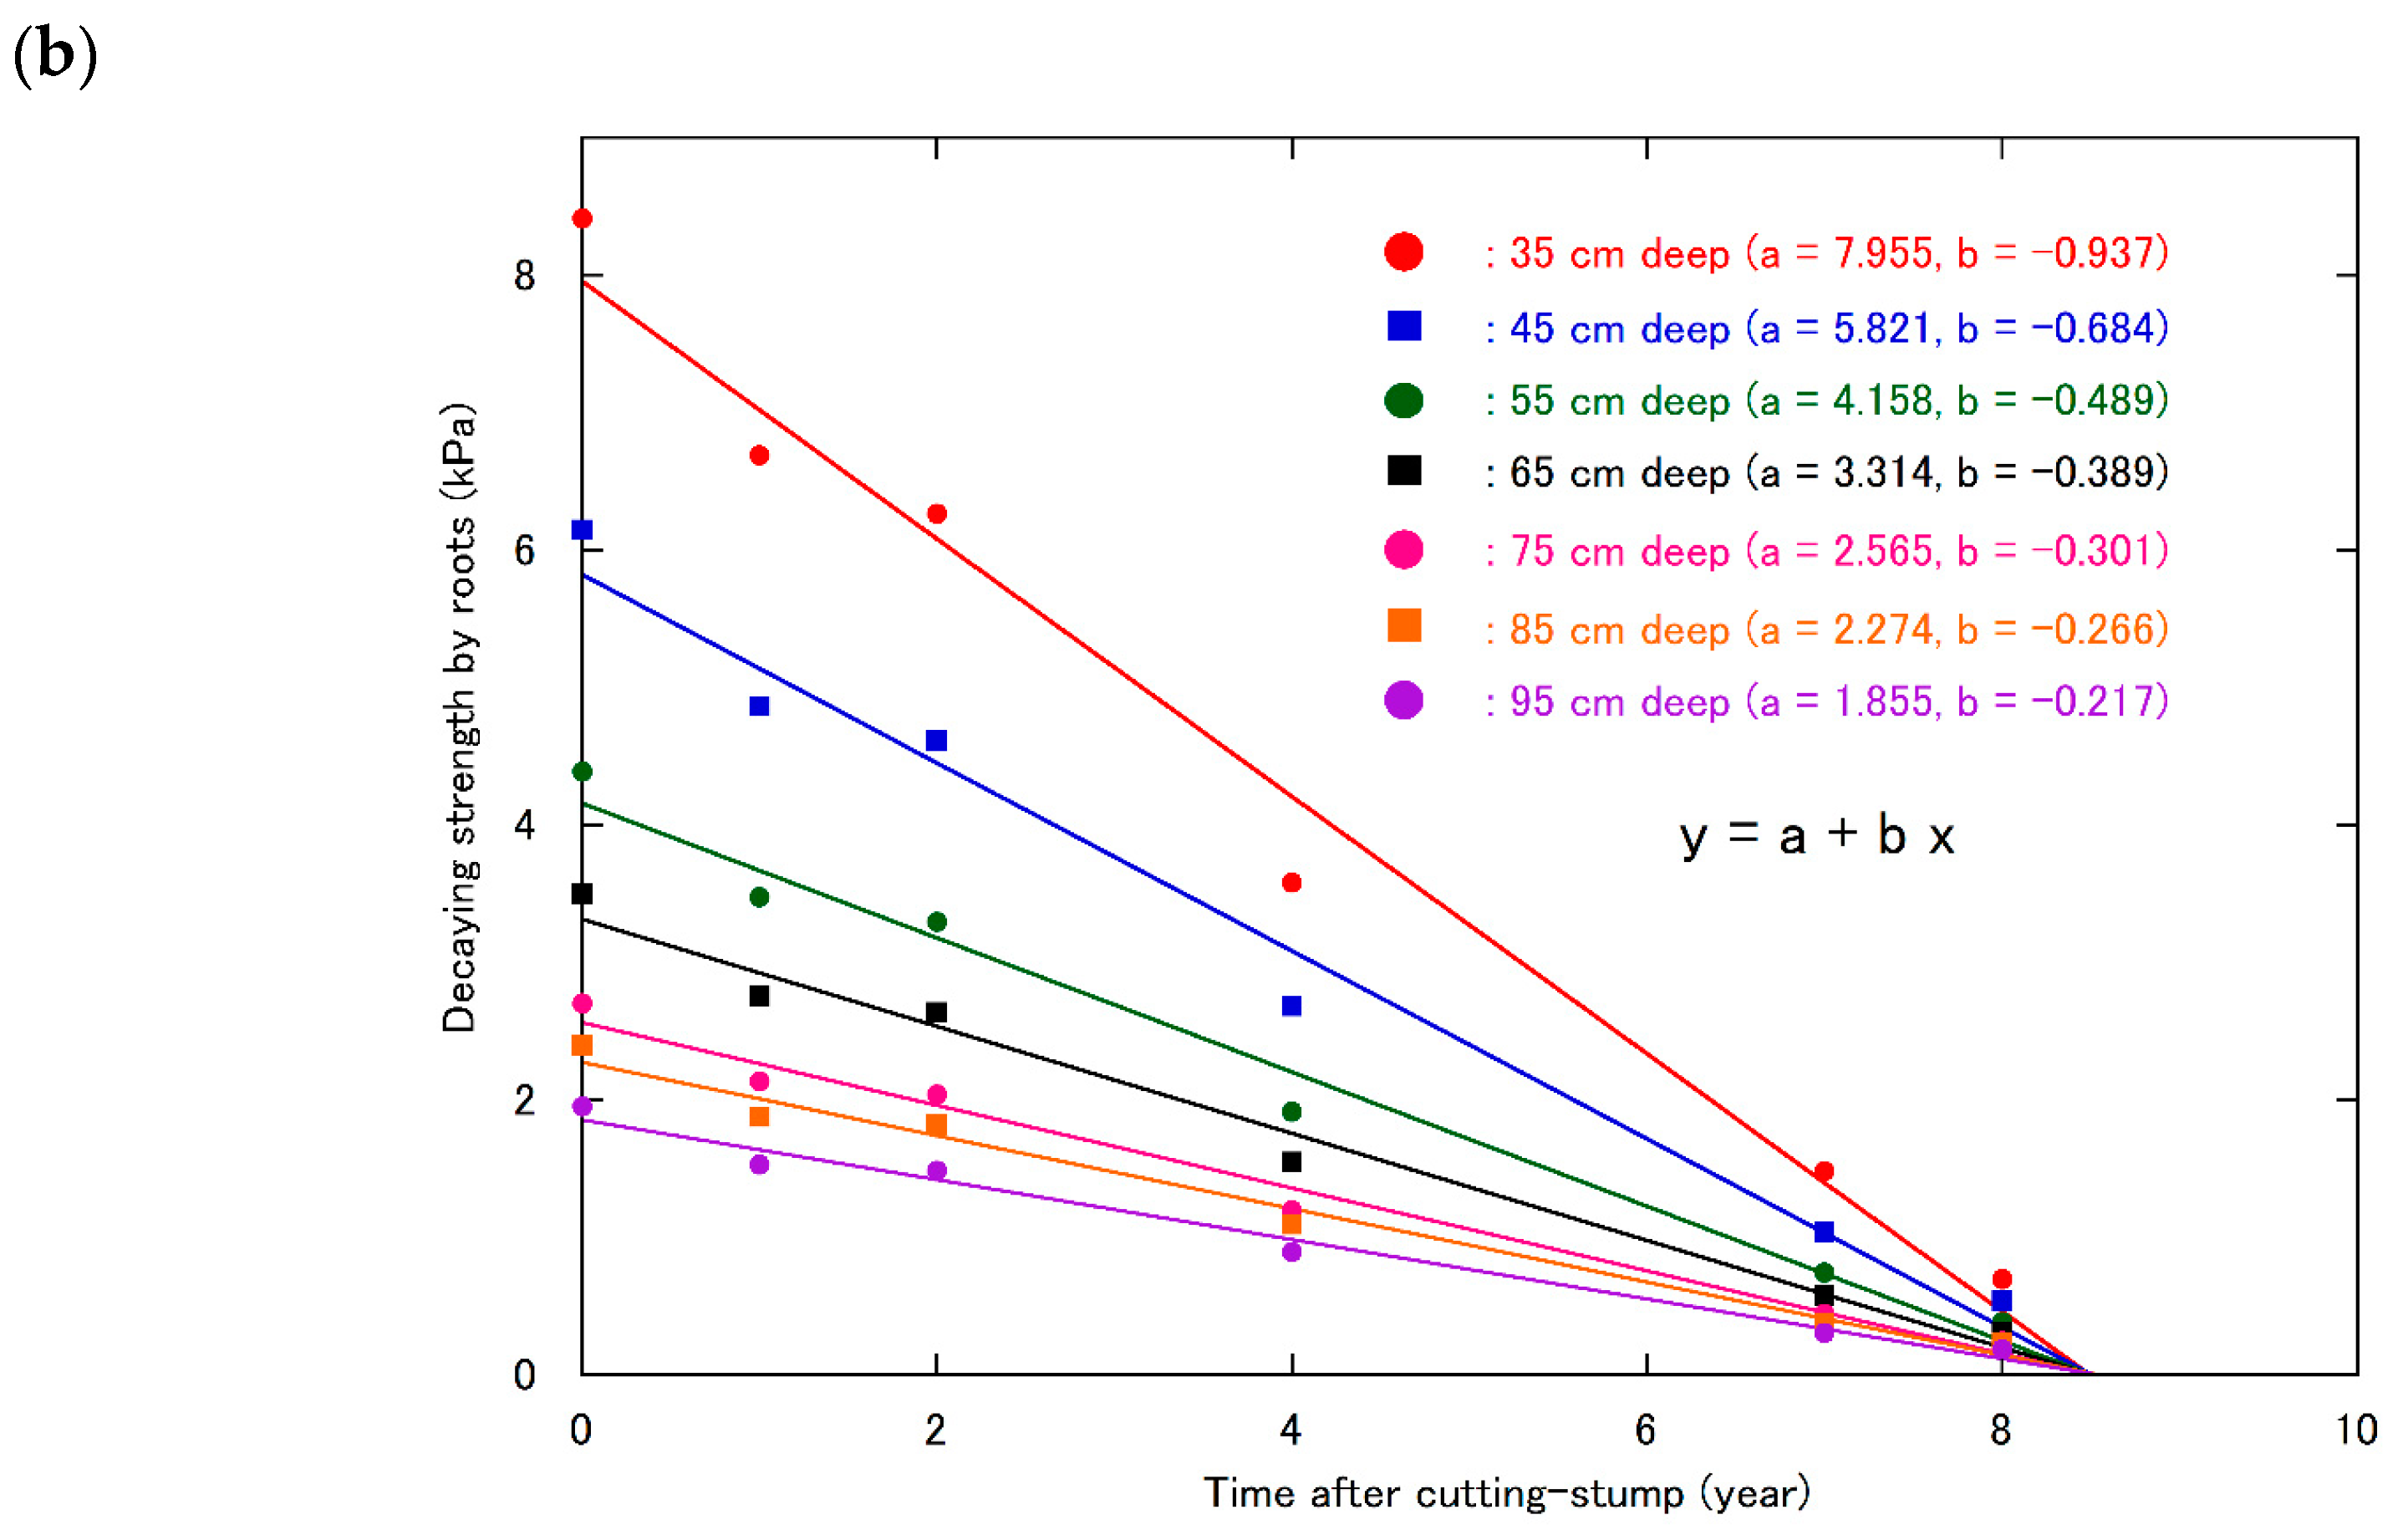
Based on these equations, we calculated the number of roots in each diameter class (0.5-centimetre-wide) on a potential sliding surface in a certain 10-centimetre-thick soil layer after incorporating DBH, H, and Zmax as the input parameters. The reinforced strength of the roots was estimated by summing the pullout strengths over a unit area, according to the calculated number of roots in each diameter class on a potential sliding surface [23,24,49], a method that has been widely used in other studies [32,50,51,52,53]. We calculated the reinforced strength of the roots in a soil layer at depths of >30 cm (i.e., 30–40 cm, 40–50 cm, etc.), which were labelled as 35, 45, 55, 65, 75, 85, and 95 cm deep.
2.3. Slope-Stability Analysis
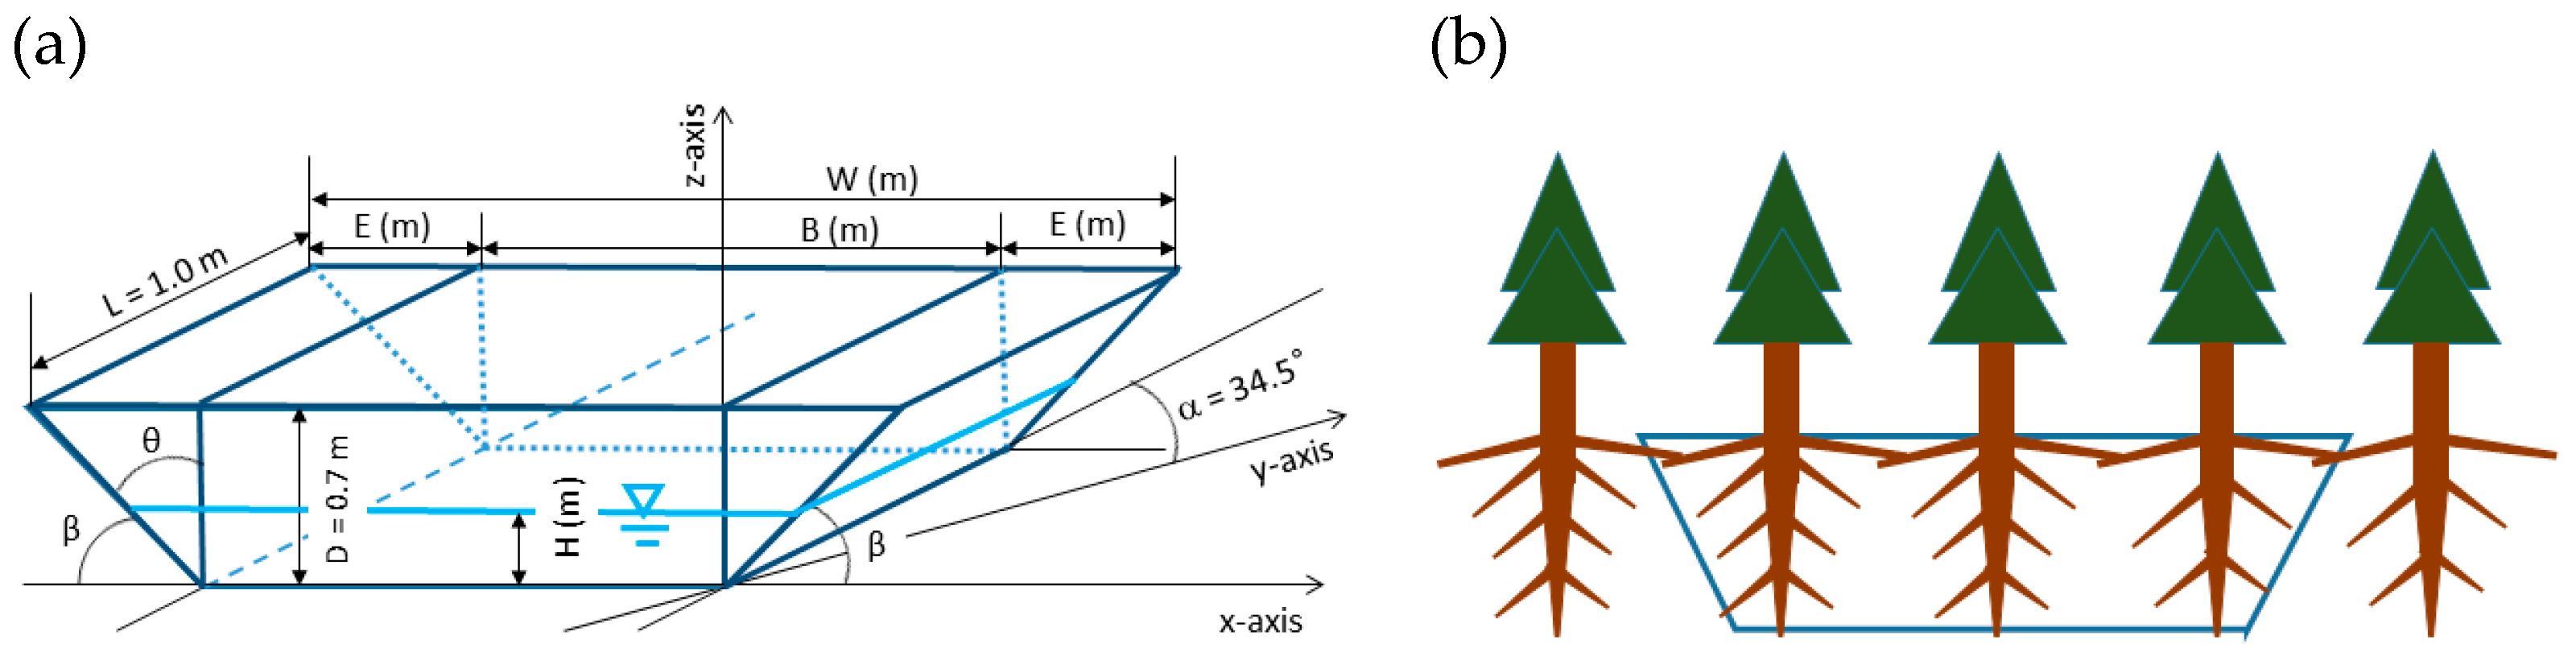
The reinforced strength of the roots (i.e., cr) should be considered when evaluating slope stability. The 2-D infinite slope model is usually employed, where the reinforced strength of the roots is assigned on the bottom surface. However, a 2-D infinite slope model does not consider the reinforcement of the roots on the two transverse sides of the sliding block, which ought to increase the safety factor of shallow landslide blocks, to some extent, especially for sliding blocks with smaller widths. Thus, a 3-D slope model should be used to consider the reinforcement effect of the roots across the flanks on the safety factor of the sliding blocks. Because the length of shallow landslides is usually much larger than the transverse width, we assumed an infinite slope in the longitudinal direction to maintain the simplicity of our slope-stability analysis. Thus, we propose a three-prism model consisting of an oblique quadrangular prism sandwiched between two oblique triangular prisms (Figure 1) to evaluate the reinforcement effect of the roots on the flanks of shallow landslides. In this model, a constant reinforced root strength is assigned to the bottom surfaces of the central prism and the two side triangular prisms. The variable transverse slope, β, is determined as the safety factor of the three-prism model, which takes its lowest value under unsaturated conditions without a water table in the soil. The results of the three-prism method were compared with those of Hovland’s method [36] and simplified Janbu’s method [37] because these have generally been employed in Japan for 3-D examinations. In this fundamental analysis of the grid calculation on a 1-metre-resolution digital elevation model, the soil depth, D, and longitudinal slope, α, were kept constant at 0.7 m and 34.5°, respectively. The wet soil unit weight was 11.12 kN/m3, the saturated soil unit weight was 15.09 kN/m3, the angle of internal friction was 34.5°, and the soil cohesion was 0 kPa. These parameter values were determined according to the results of soil tests performed on soil samples taken from a scarp, underlain by biotite gneiss, in a forest basin in Ibaraki Prefecture. These soil parameters were later incorporated in the grid calculations on a digital elevation model obtained via airborne laser surveys, in which four laser points per m2 were measured. Both the cr and the total width of the three-prism model at the ground surface were changed to investigate their influence on the slope stability.
For the three-prism model shown in Figure 1, the safety factor can be expressed by Equation (8) for Hovland’s method (Fh) and Equation (9) for the 3-D simplified Janbu’s method (Fj):
where W1, W3, and W2 are the soil weights of the two oblique triangular quadrangular prisms and the central oblique quadrangular prism, respectively; U1, U3, and U2 are the total water pressures on the bottom of the two oblique triangular quadrangular prisms and oblique quadrangular prism, respectively; q1, q3, and q2 are the tree surcharges on the two oblique triangular quadrangular prisms and oblique quadrangular prism, respectively; A1, A3, and A2 are the bottom areas of the two oblique triangular quadrangular prisms and oblique quadrangular prism, respectively, on which a constant reinforced root strength is mobilised; ϕ’ is the effective angle of internal friction; cr is the root cohesion component; γt is the unit weight of wet soil (11.12 kN/m3); γsat is the unit weight of saturated soil (15.09 kN/m3); and γw is the unit weight of water (9.81 kN/m3). As shown in Figure 1, α and β are the longitudinal and transverse slopes, respectively, θ is the complementary angle of β (= 90° − β), and E, B, H, L, and D define the sizes of the sliding block.
However, both Hovland’s method and the 3-D simplified Janbu’s method have some weaknesses when applied to the three-prism model, as described in Section 3.3. To resolve these issues, we proposed a slope-stability analysis method applying the three-prism model as follows: the self-weight component was calculated using the self-weight of the oblique triangular prisms to act as the oblique quadrangular prism with the same volume; hence, the self-weight component was obtained through the one assumed oblique quadrangular prism. Meanwhile, the reinforced root strength acted on the flank-surfaces of the oblique triangular prisms. The safety factor of this proposed three-prism method is given by Equation (15):
Using the forest basin in Ibaraki Prefecture as a case study, the slope stability was examined using the three-prism method (described in detail in Section 3.3), assuming that the whole basin was covered with 50-year-old Japanese cedar trees. The changes in slope stability on a 1-metre-resolution digital elevation model (Figure 2) were analysed, as 50-year-old trees were clear-cut and new seedlings were immediately planted. The assumed changes in the number, height, and diameter at breast height of Japanese cedar trees over 50 years (the second rank of the site index) were determined using the yield tables of Japanese cedar trees, developed for regions in and around Ibaraki Prefecture [54]. To perform the slope-stability analysis, the soil depth at each grid in the target area must be obtained. Ideally, several simplified cone penetration tests should be conducted to obtain the soil depth at Nc = 10 (Nc indicates the number of attempts required for a 5 kg weight dropped from a height of 0.50 m to drive the cone 0.10 m into the soil; it is generally assumed that slopes are subject to failure under certain triggering conditions involving Nc values of <10) [55]. However, conducting such tests in large areas is difficult, owing to time and cost limitations. In the last decade, some soil depth estimations have been generated using machine learning [56,57,58,59]; however, soil depth data will likely be acquired using this method in the near future. In the present study, we instead used a soil depth estimation method in which the slope and transverse angle on each grid were incorporated in the following equations [60]:
where D is the soil depth (cm), Dbr is the depth above the bedrock surface of Nc = 40 (cm), α is the slope (degrees), and δ is the transverse angle (degrees). The transverse angle was obtained following the survey guide for investigations on forest disasters [61], as follows:
A circle (with C set at the centre point) was inscribed in a square grid on a contour map.
Two intersection points of the contour line passing through point C and the inscribed circle (S1 and S2) were obtained.
The transverse angle, S1CS2, was measured on the downslope side (for the upslope direction, the angle is smaller on a valley topography and larger on a ridge).
Notably, some grids had soil depths of <30 cm in the area. For these grids, the reinforced strength of roots (the root cohesion component) calculated on a potential sliding surface at 35 cm was instead applied. For each grid with a slope and soil depth, the three-prism slope model was applied to evaluate the slope stability by calculating the safety factor. The stability analysis was conducted under fully saturated conditions with two different tree weight conditions, i.e., with and without the aboveground weight of trees.
3. Results
3.1. Pullout Strength of Roots
The obtained maximum pullout strength of the roots is shown in Figure 3 in relation to the diameter at a point where the root was pinched with the pliers-like tool. The maximum pullout strength of the live roots of uncut trunks exhibited the exponent function of the diameter, as reported in a previous study [24]. Notably, the maximum pullout strength of the roots of cut trunks had similar characteristics, exhibiting the exponent function of the diameter, regardless of the time after cutting. The roots of trunks cut 8 years previously were vulnerable to breakage; thus, we could not conduct pullout experiments on roots with diameters of about <20 mm because they broke when pinched. Given the same diameter, the maximum pullout strength was the highest for the living roots of uncut trunks and decreased as more time elapsed after the trunks were cut.
3.2. Root Strength on the Sliding Surface at Different Depths
In shallow landslides, a sliding surface forms within a soil layer above the bedrock. The number of tree roots in each diameter class across the sliding surface at different soil depths was calculated using the root distribution model [22] and is summarized for Japanese cedar stands at different ages (10–50 years) in Table A1 in Appendix A.
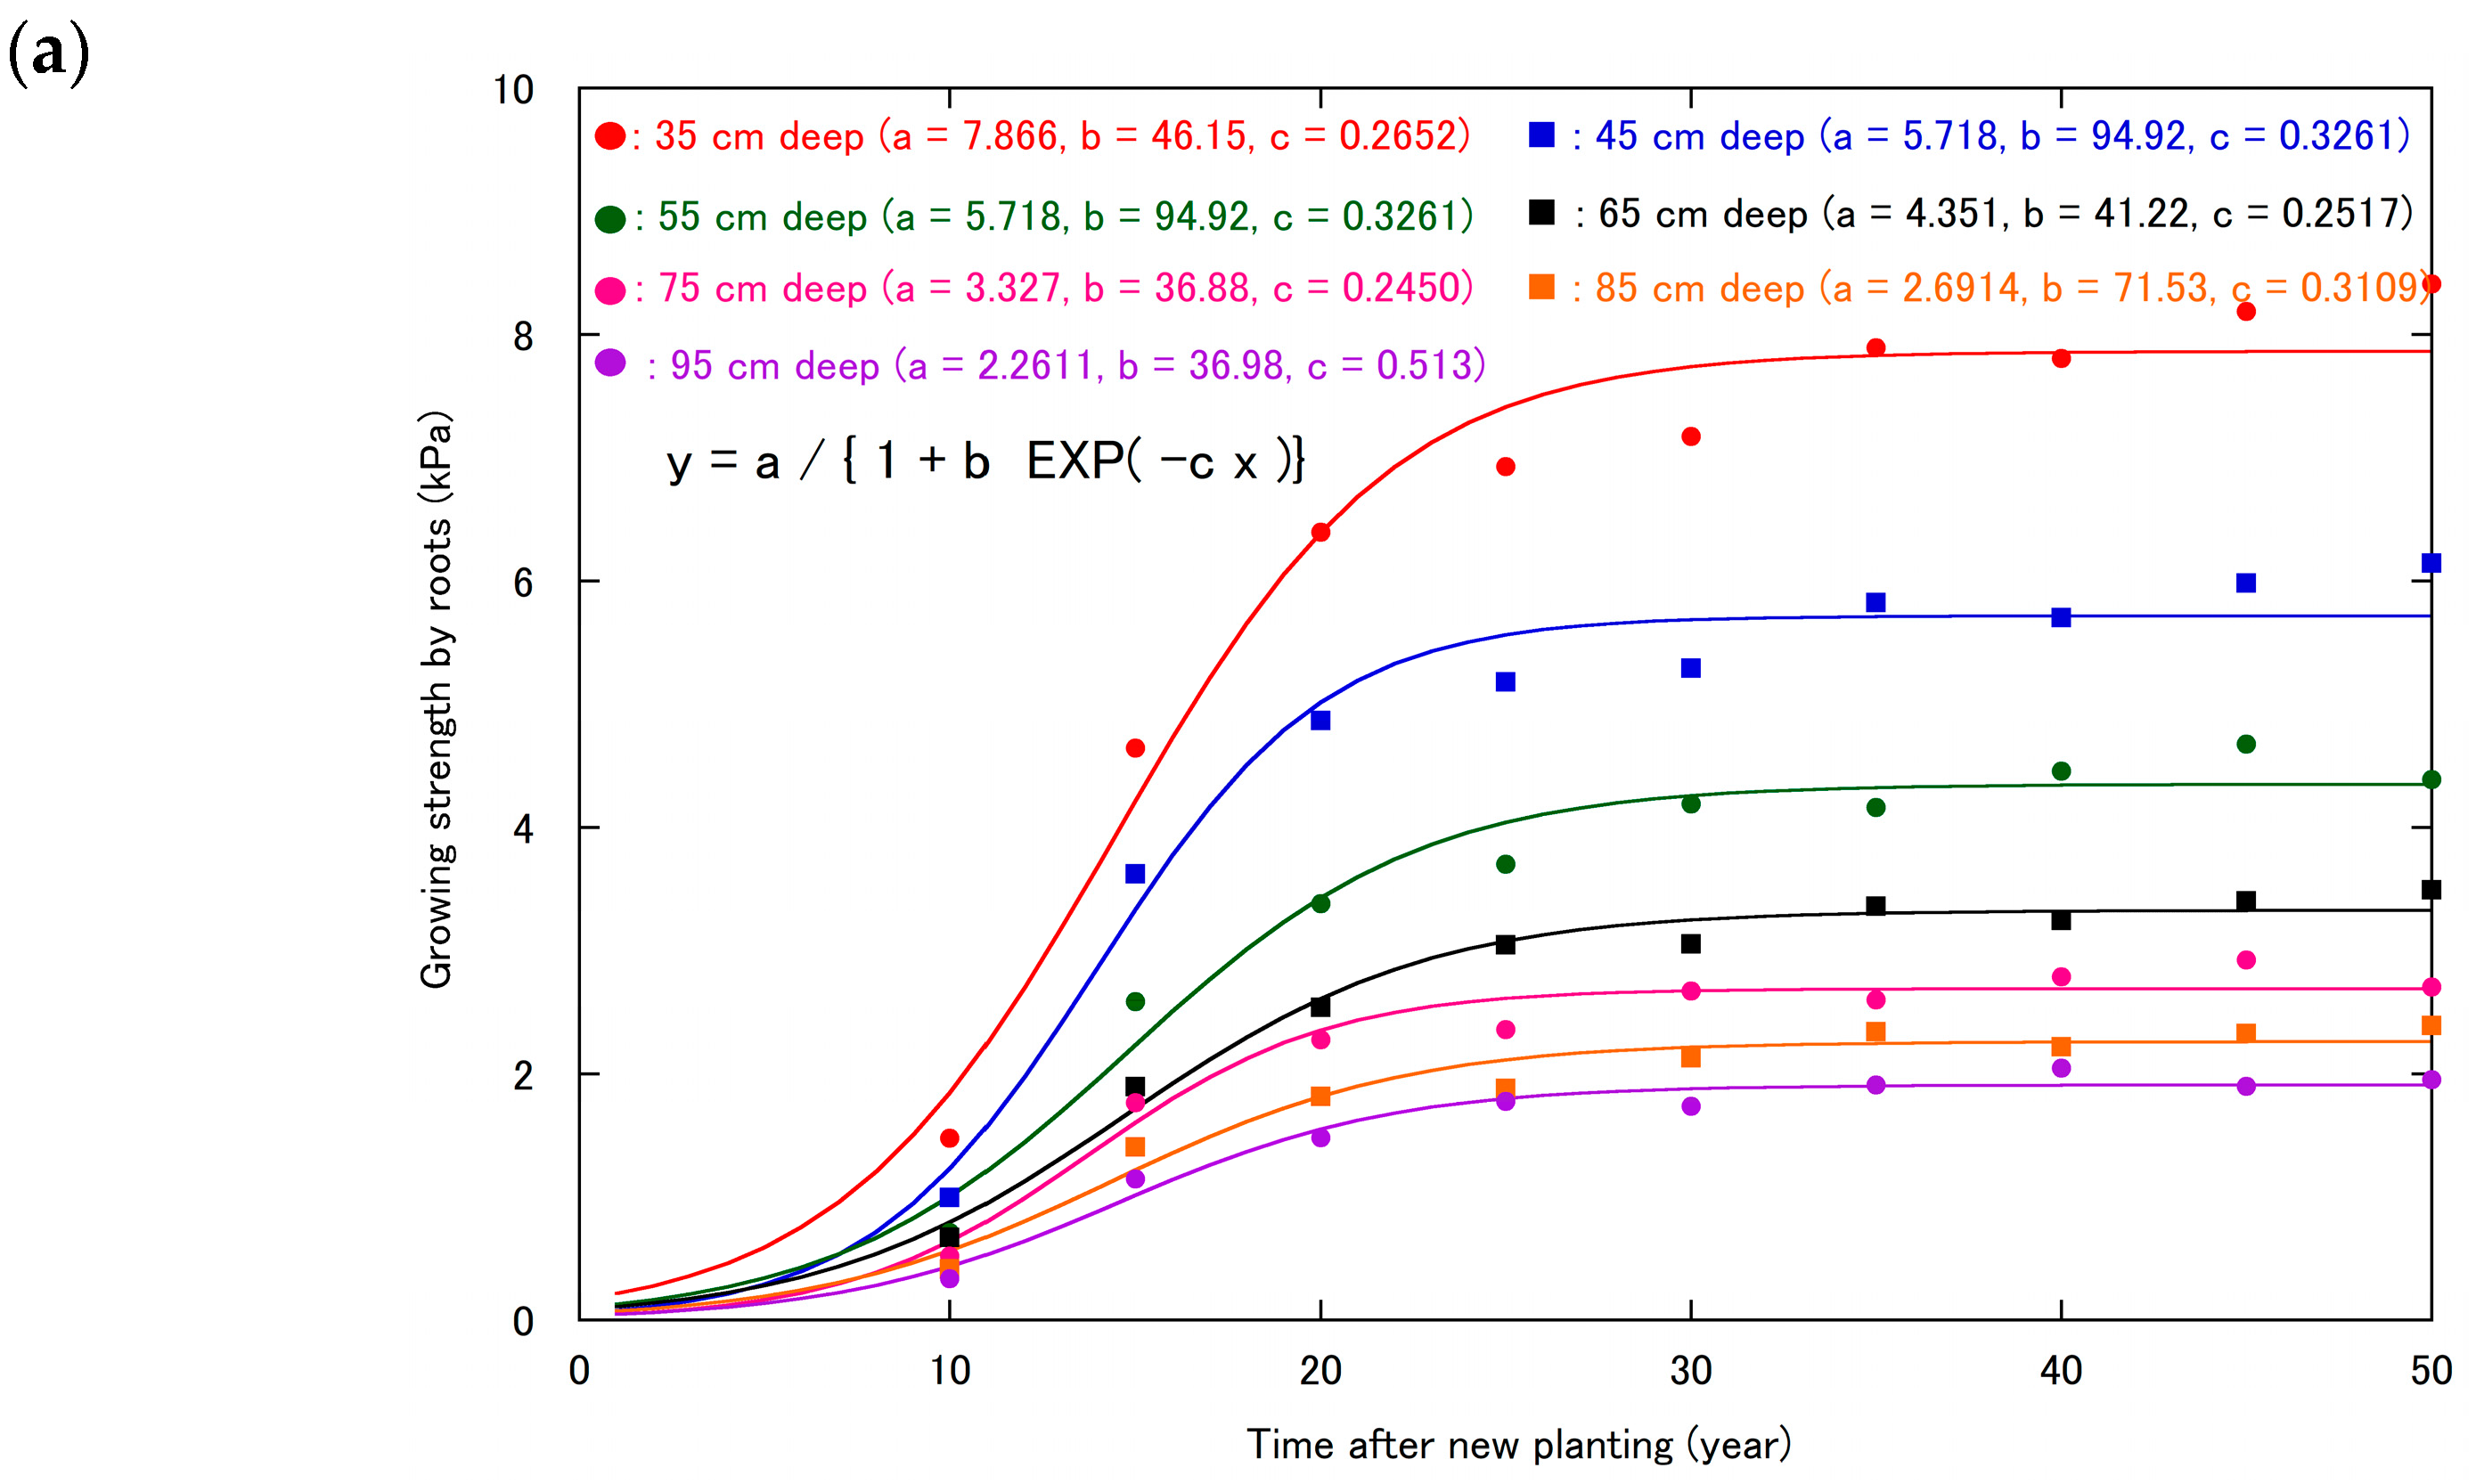
The reinforced strengths of tree roots, calculated as the summation of the maximum pullout forces of the roots across a unit area sliding surface, are shown in relation to the elapsed time after new planting in Figure 4a. At each depth of the sliding surface, the reinforced strength had increased markedly by about 25 years after planting, after which it remained relatively constant. Although some scatter was observed, the reinforced strength of the tree roots was approximated using a logistic function of the elapsed time after planting. Along the curve, the reinforced strength of the roots gradually increased up to about 5 years, followed by a rapid increase, with the maximum acceleration of strength at about 7 years. However, from around 13 years, the rate of reinforcement appeared to decelerate.
After clear-cutting, the roots of trees begin to decay, reducing the reinforced strength. Given that the trees were cut at the age of 50 years, the decreased reinforced strength is shown according to the elapsed time after cutting in Figure 4b. The reinforced strength of the roots linearly decreased with the elapsed time after cutting, and no strength appeared to remain at around 9 years.
3.3. Changes in Slope Stability in the Three-Prism Model
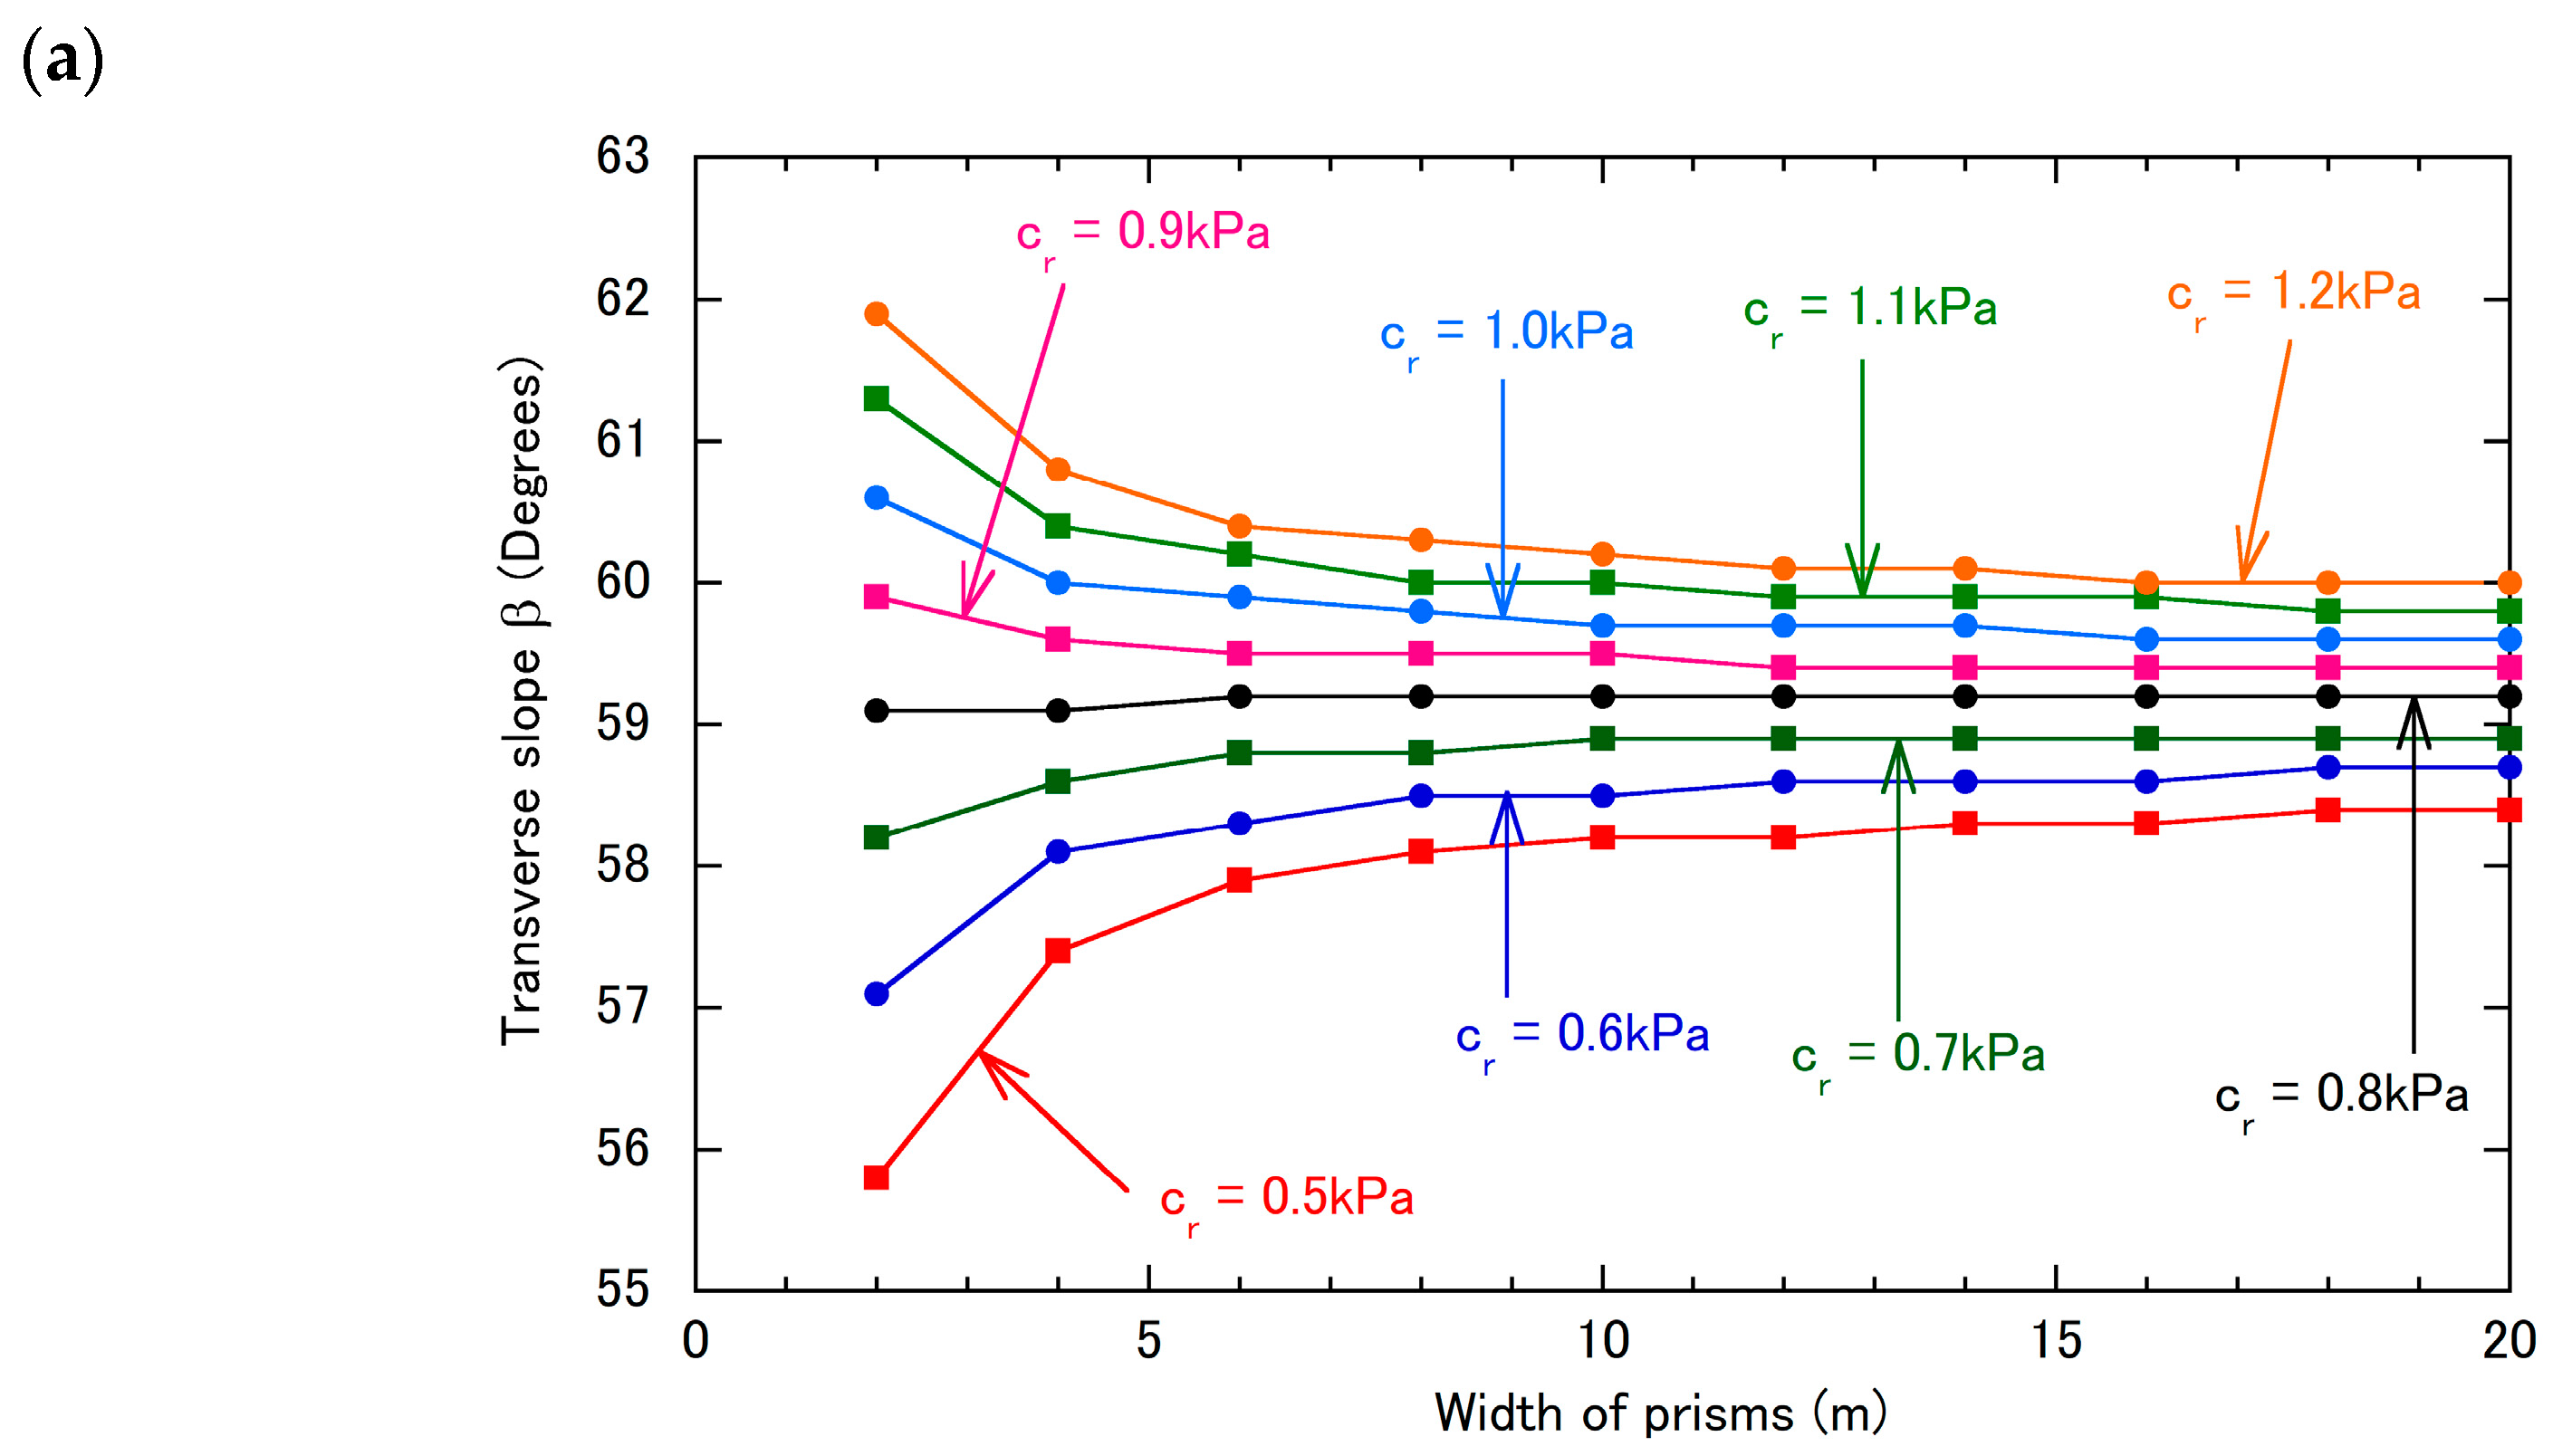
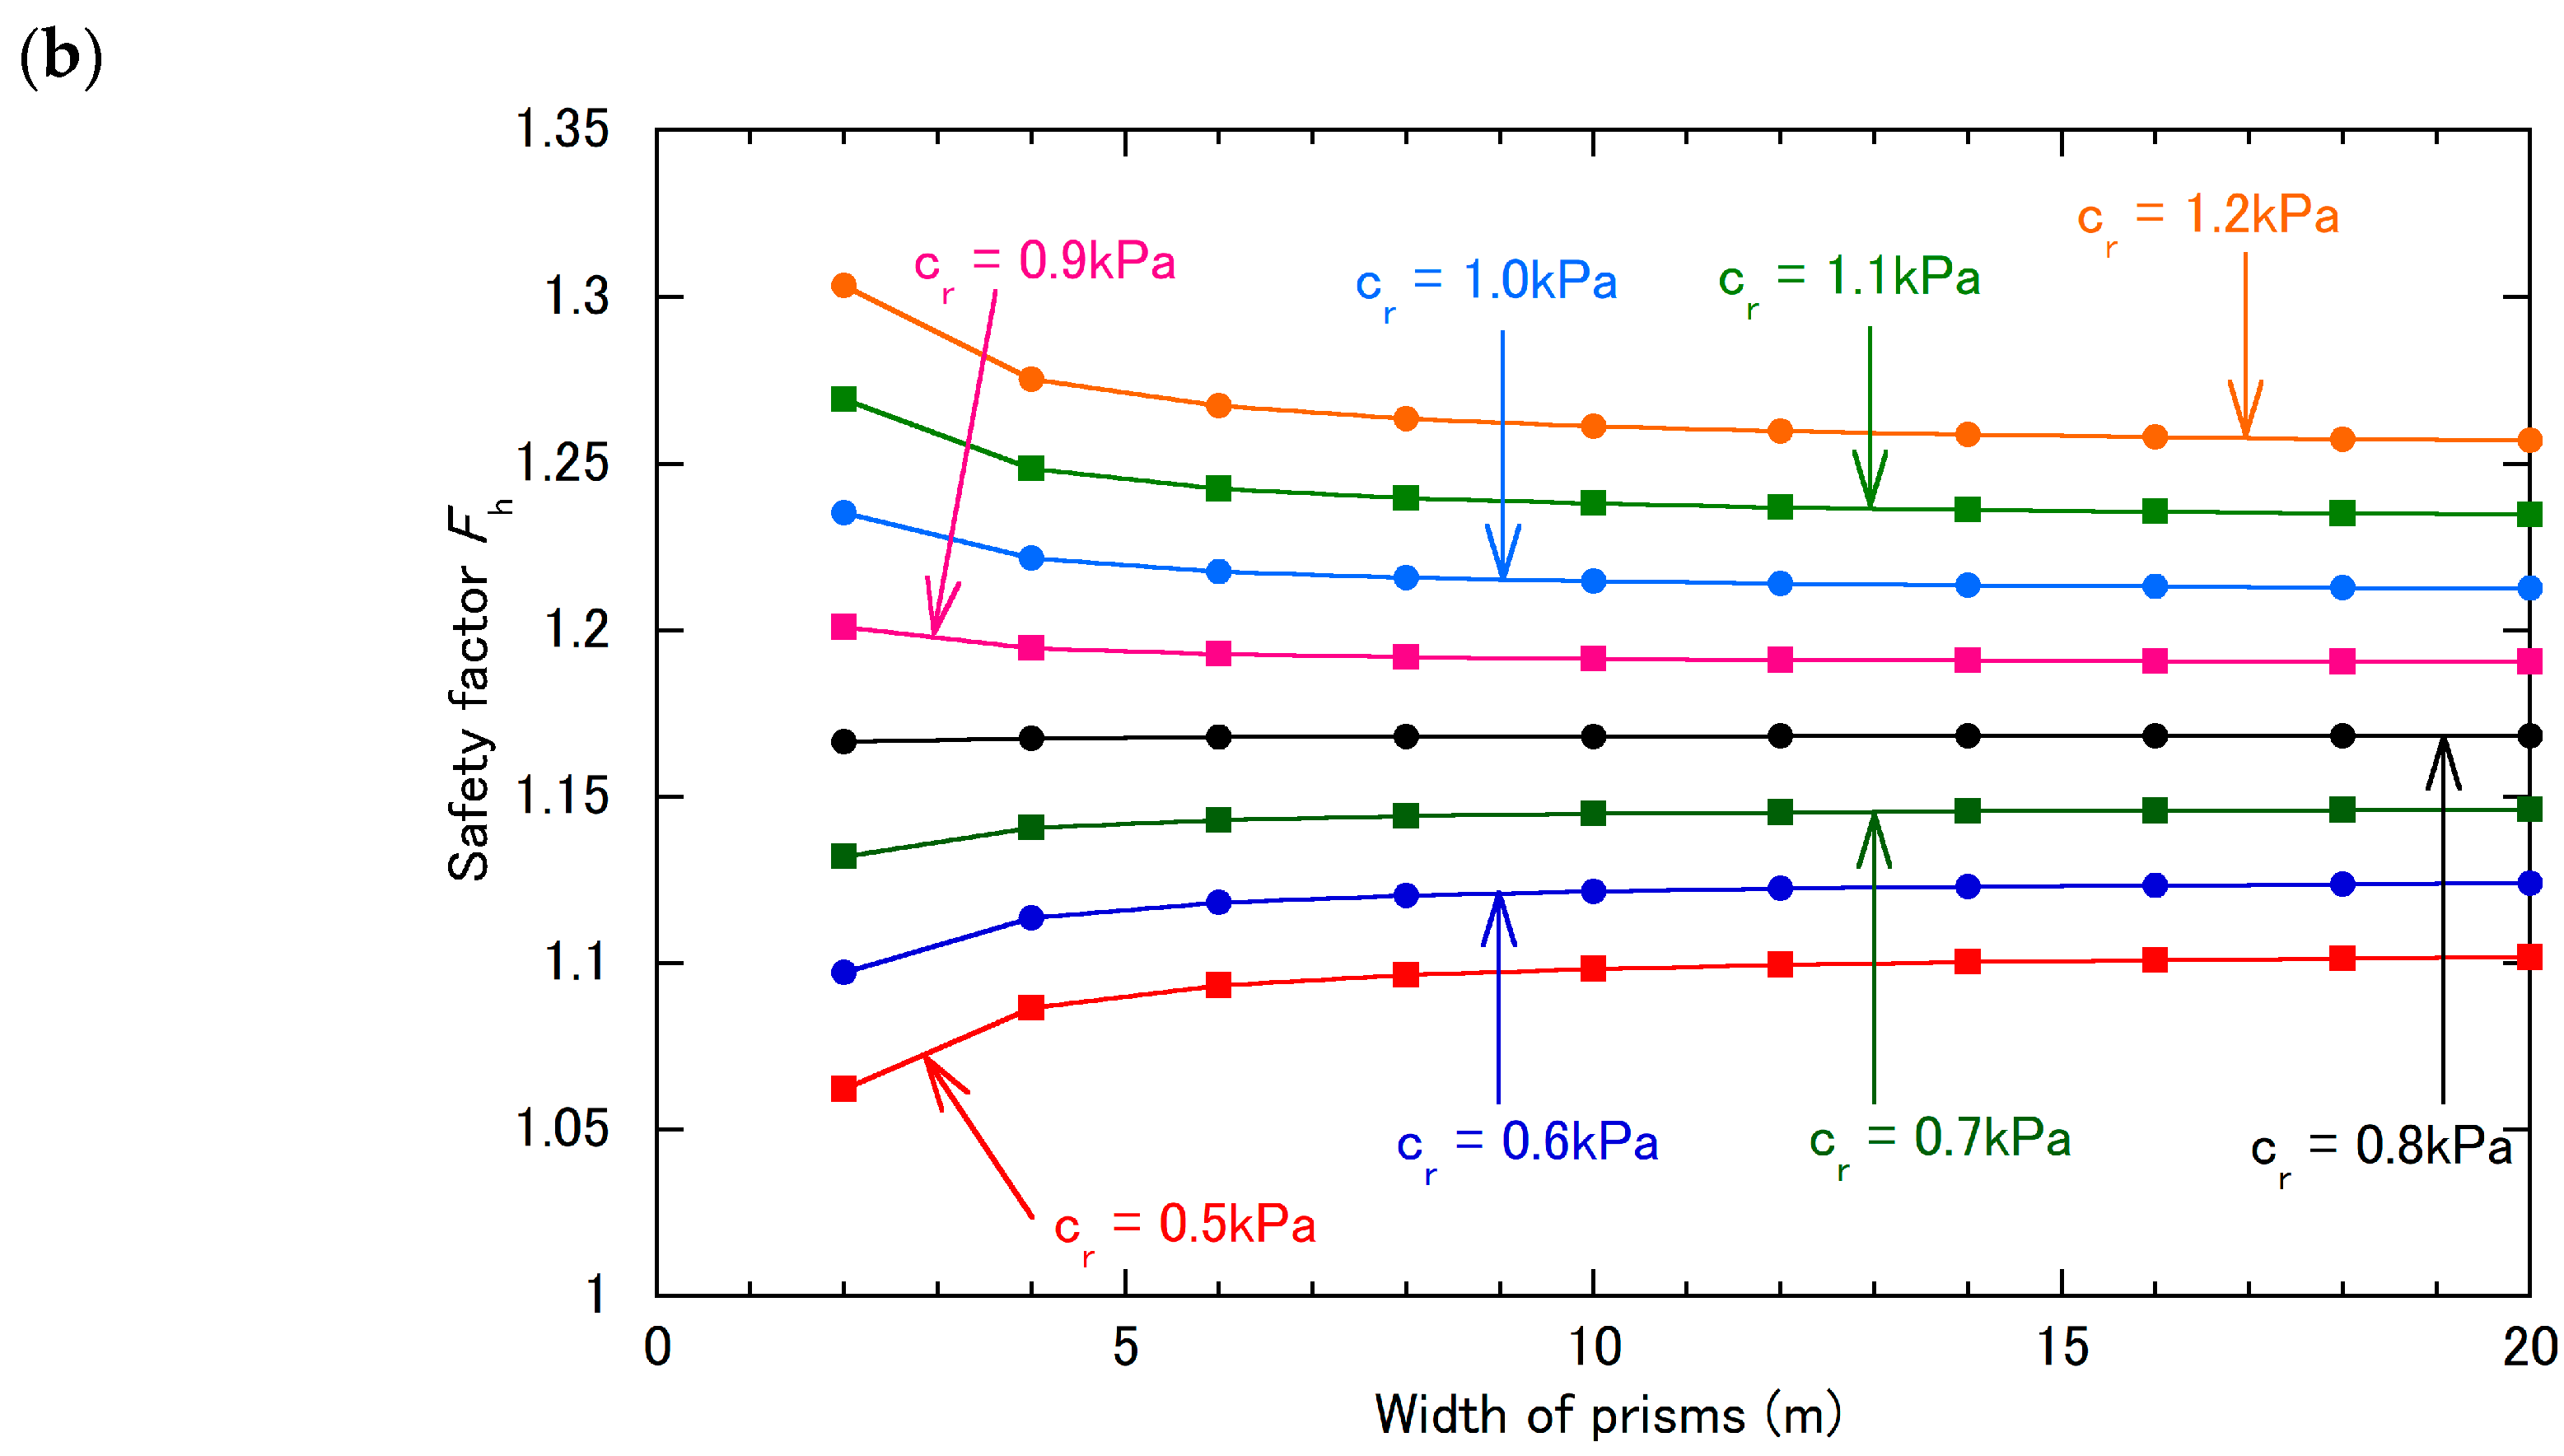
The changes in the risk of shallow landslides were examined using the proposed three-prism model for slope-stability analysis. Figure 5 shows the relationship between the transverse slope, β, of the side-oblique triangular prisms and the prism width, and that between the safety factor, Fh, and the prism width, both determined using Hovland’s method [36]. Both the β and Fh decreased when the cr was of <0.8 kPa, with smaller prism widths. This was likely because, in Hovland’s method, the inter-prism force is approximated to zero, and the total balance of the force and the moment of force are not satisfied. In this regard, previous studies have revealed that smaller safety factors are obtained using Hovland’s method for 3-D analyses of sandy soils [62,63,64].
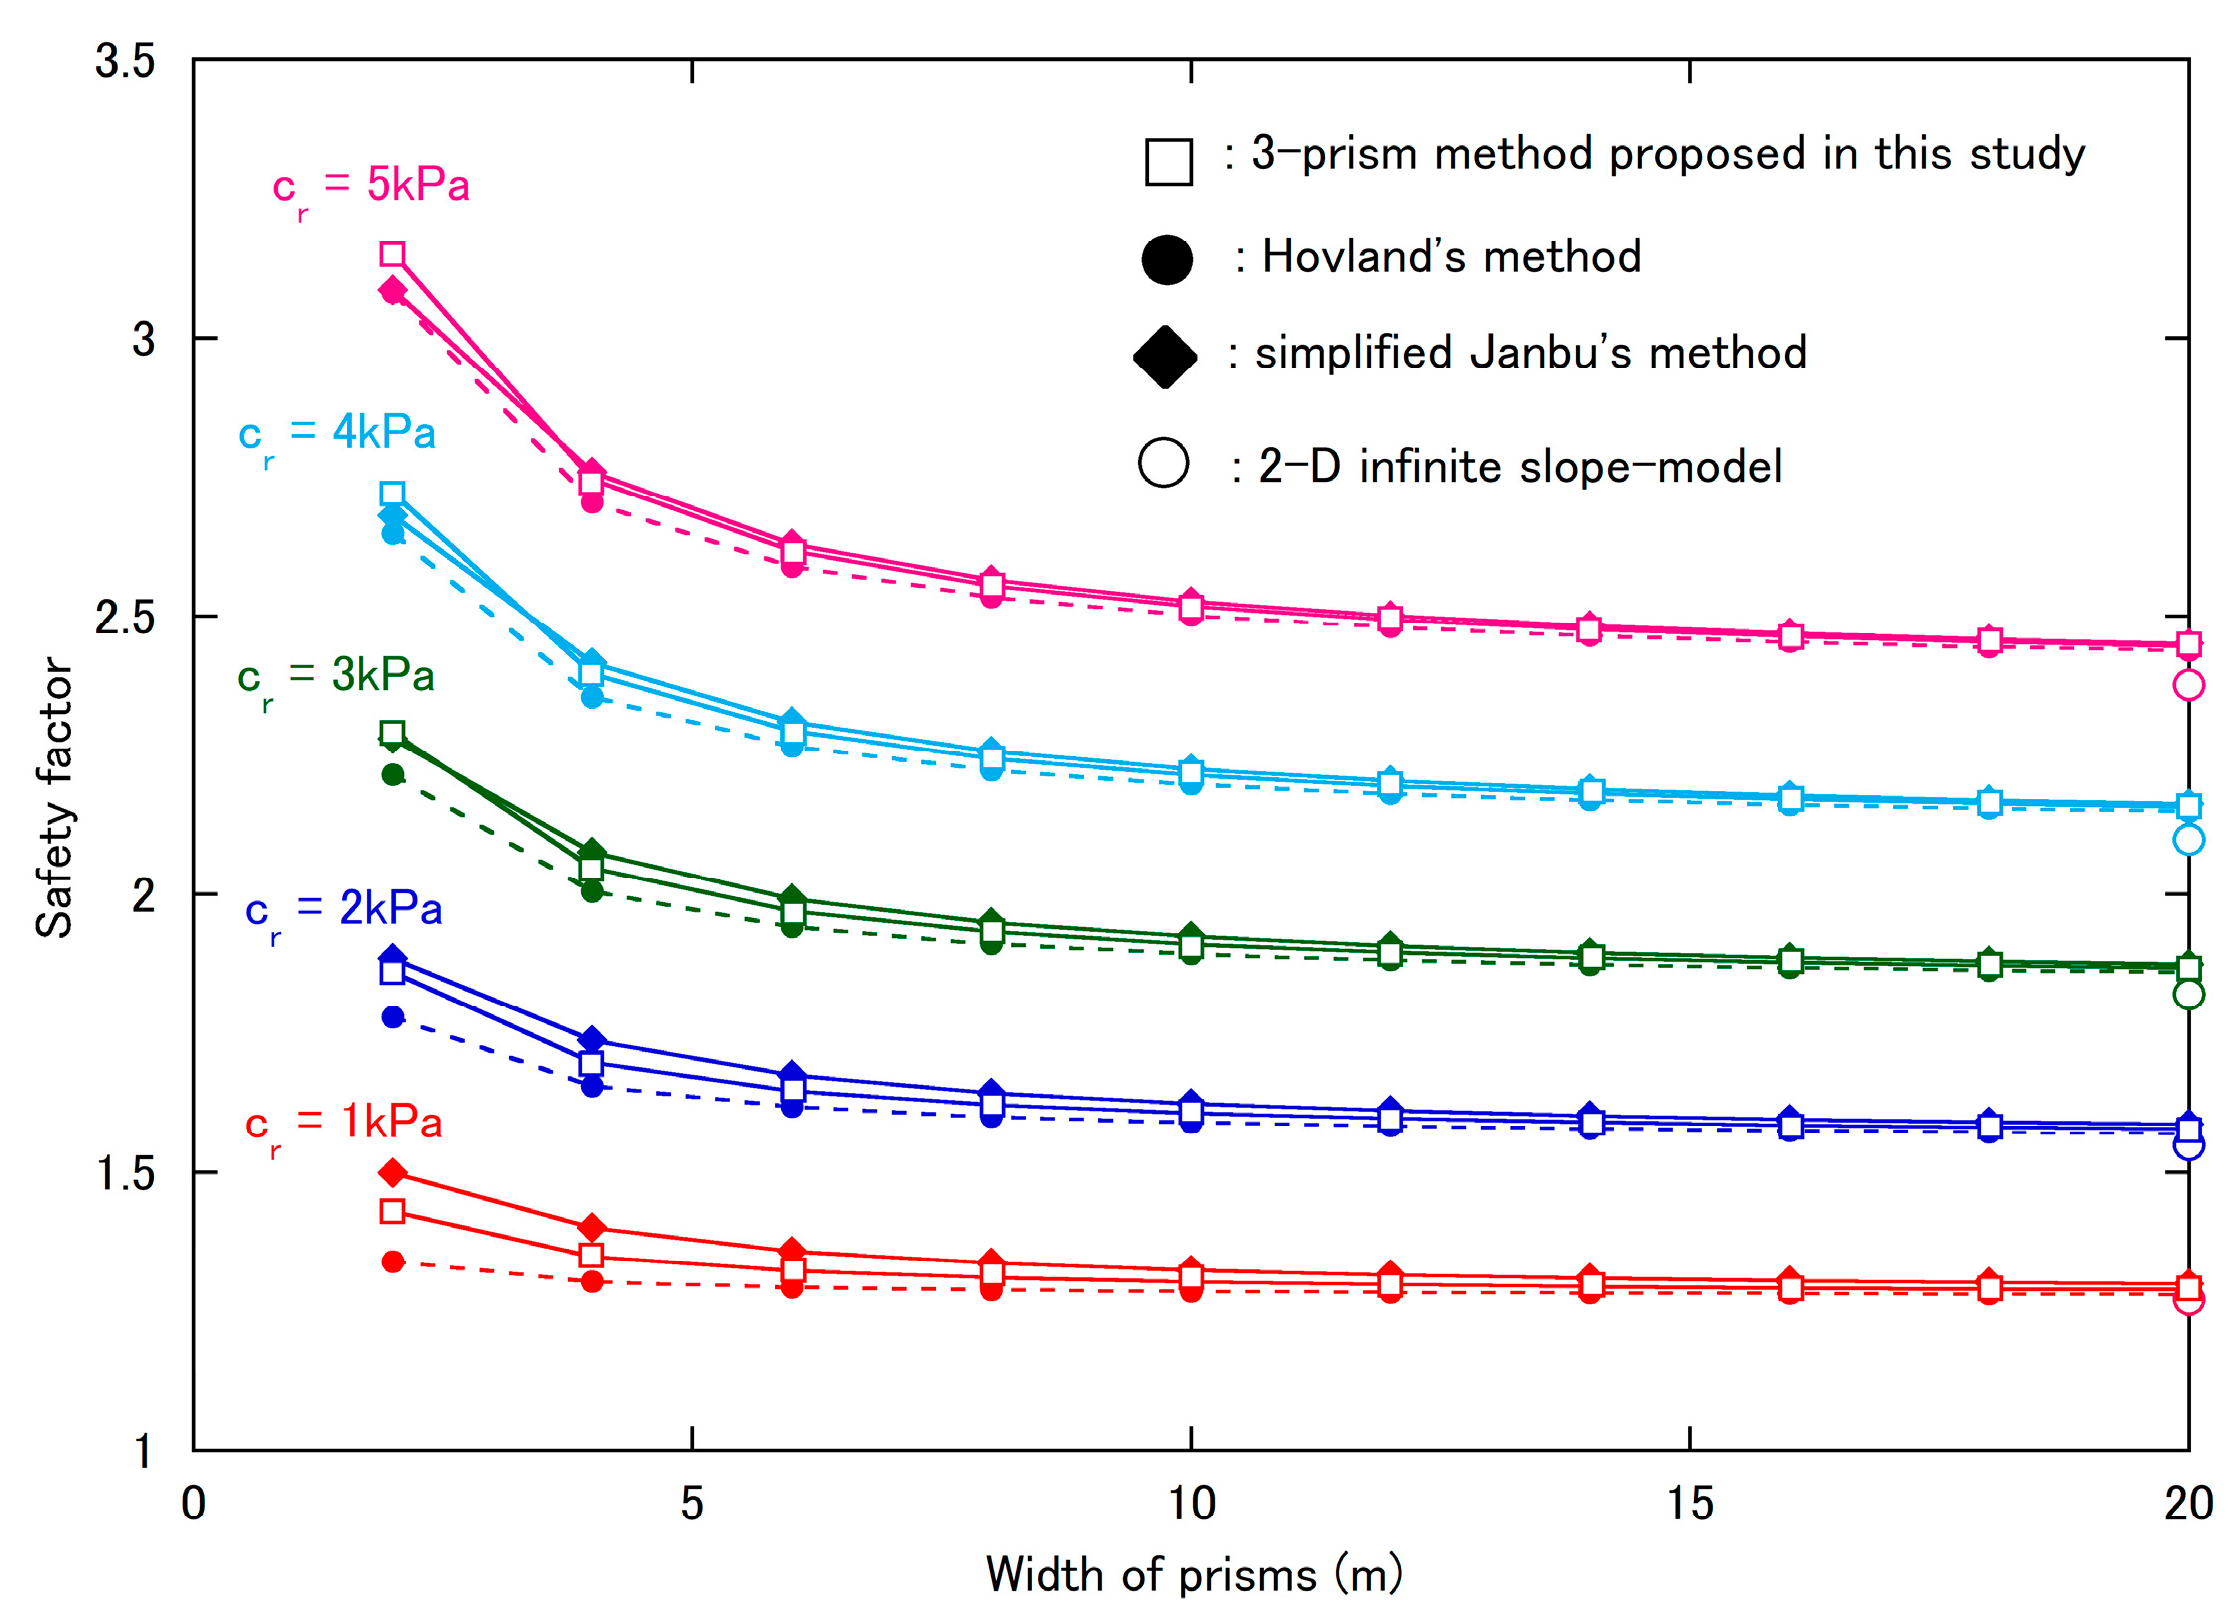
The safety factor determined using the proposed three-prism method (F3p) was compared with those determined using Hovland’s method and the 3-D simplified Janbu’s method (Figure 6). Notably, the 3-D simplified Janbu’s method [37,38,39] obtained the smallest safety factor when the side-oblique triangular prisms disappeared (i.e., when the transverse angle β was 90°), because the method does not consider the shear strength on the vertical sides in the 3-D slope-stability analysis [65]. Thus, in the calculation for the 3-D simplified Janbu’s method, we also used the values of the transverse slope obtained using the proposed three-prism method.
The safety factors obtained using Hovland’s method were generally lower than those obtained using the proposed three-prism method or the 3-D simplified Janbu’s method when the prism widths were about <10 m. However, the safety factors of the proposed method and the 3-D simplified Janbu’s method were generally consistent over the range of prism widths. Notably, the safety factors of the three methods converged when the prism width was about >15 m. For reference, the results of the simplest 2-D infinite slope model method are also shown in Figure 6. In this method, the prism width did not affect the safety factor (expediently plotted at a prism width of 20 m). At a block width of 20 m, a small difference was observed in the safety factors between the proposed three-prism method and the 2-D infinite slope model method, in which the difference was up to about 0.07 when the reinforced root strength was 5 kPa.
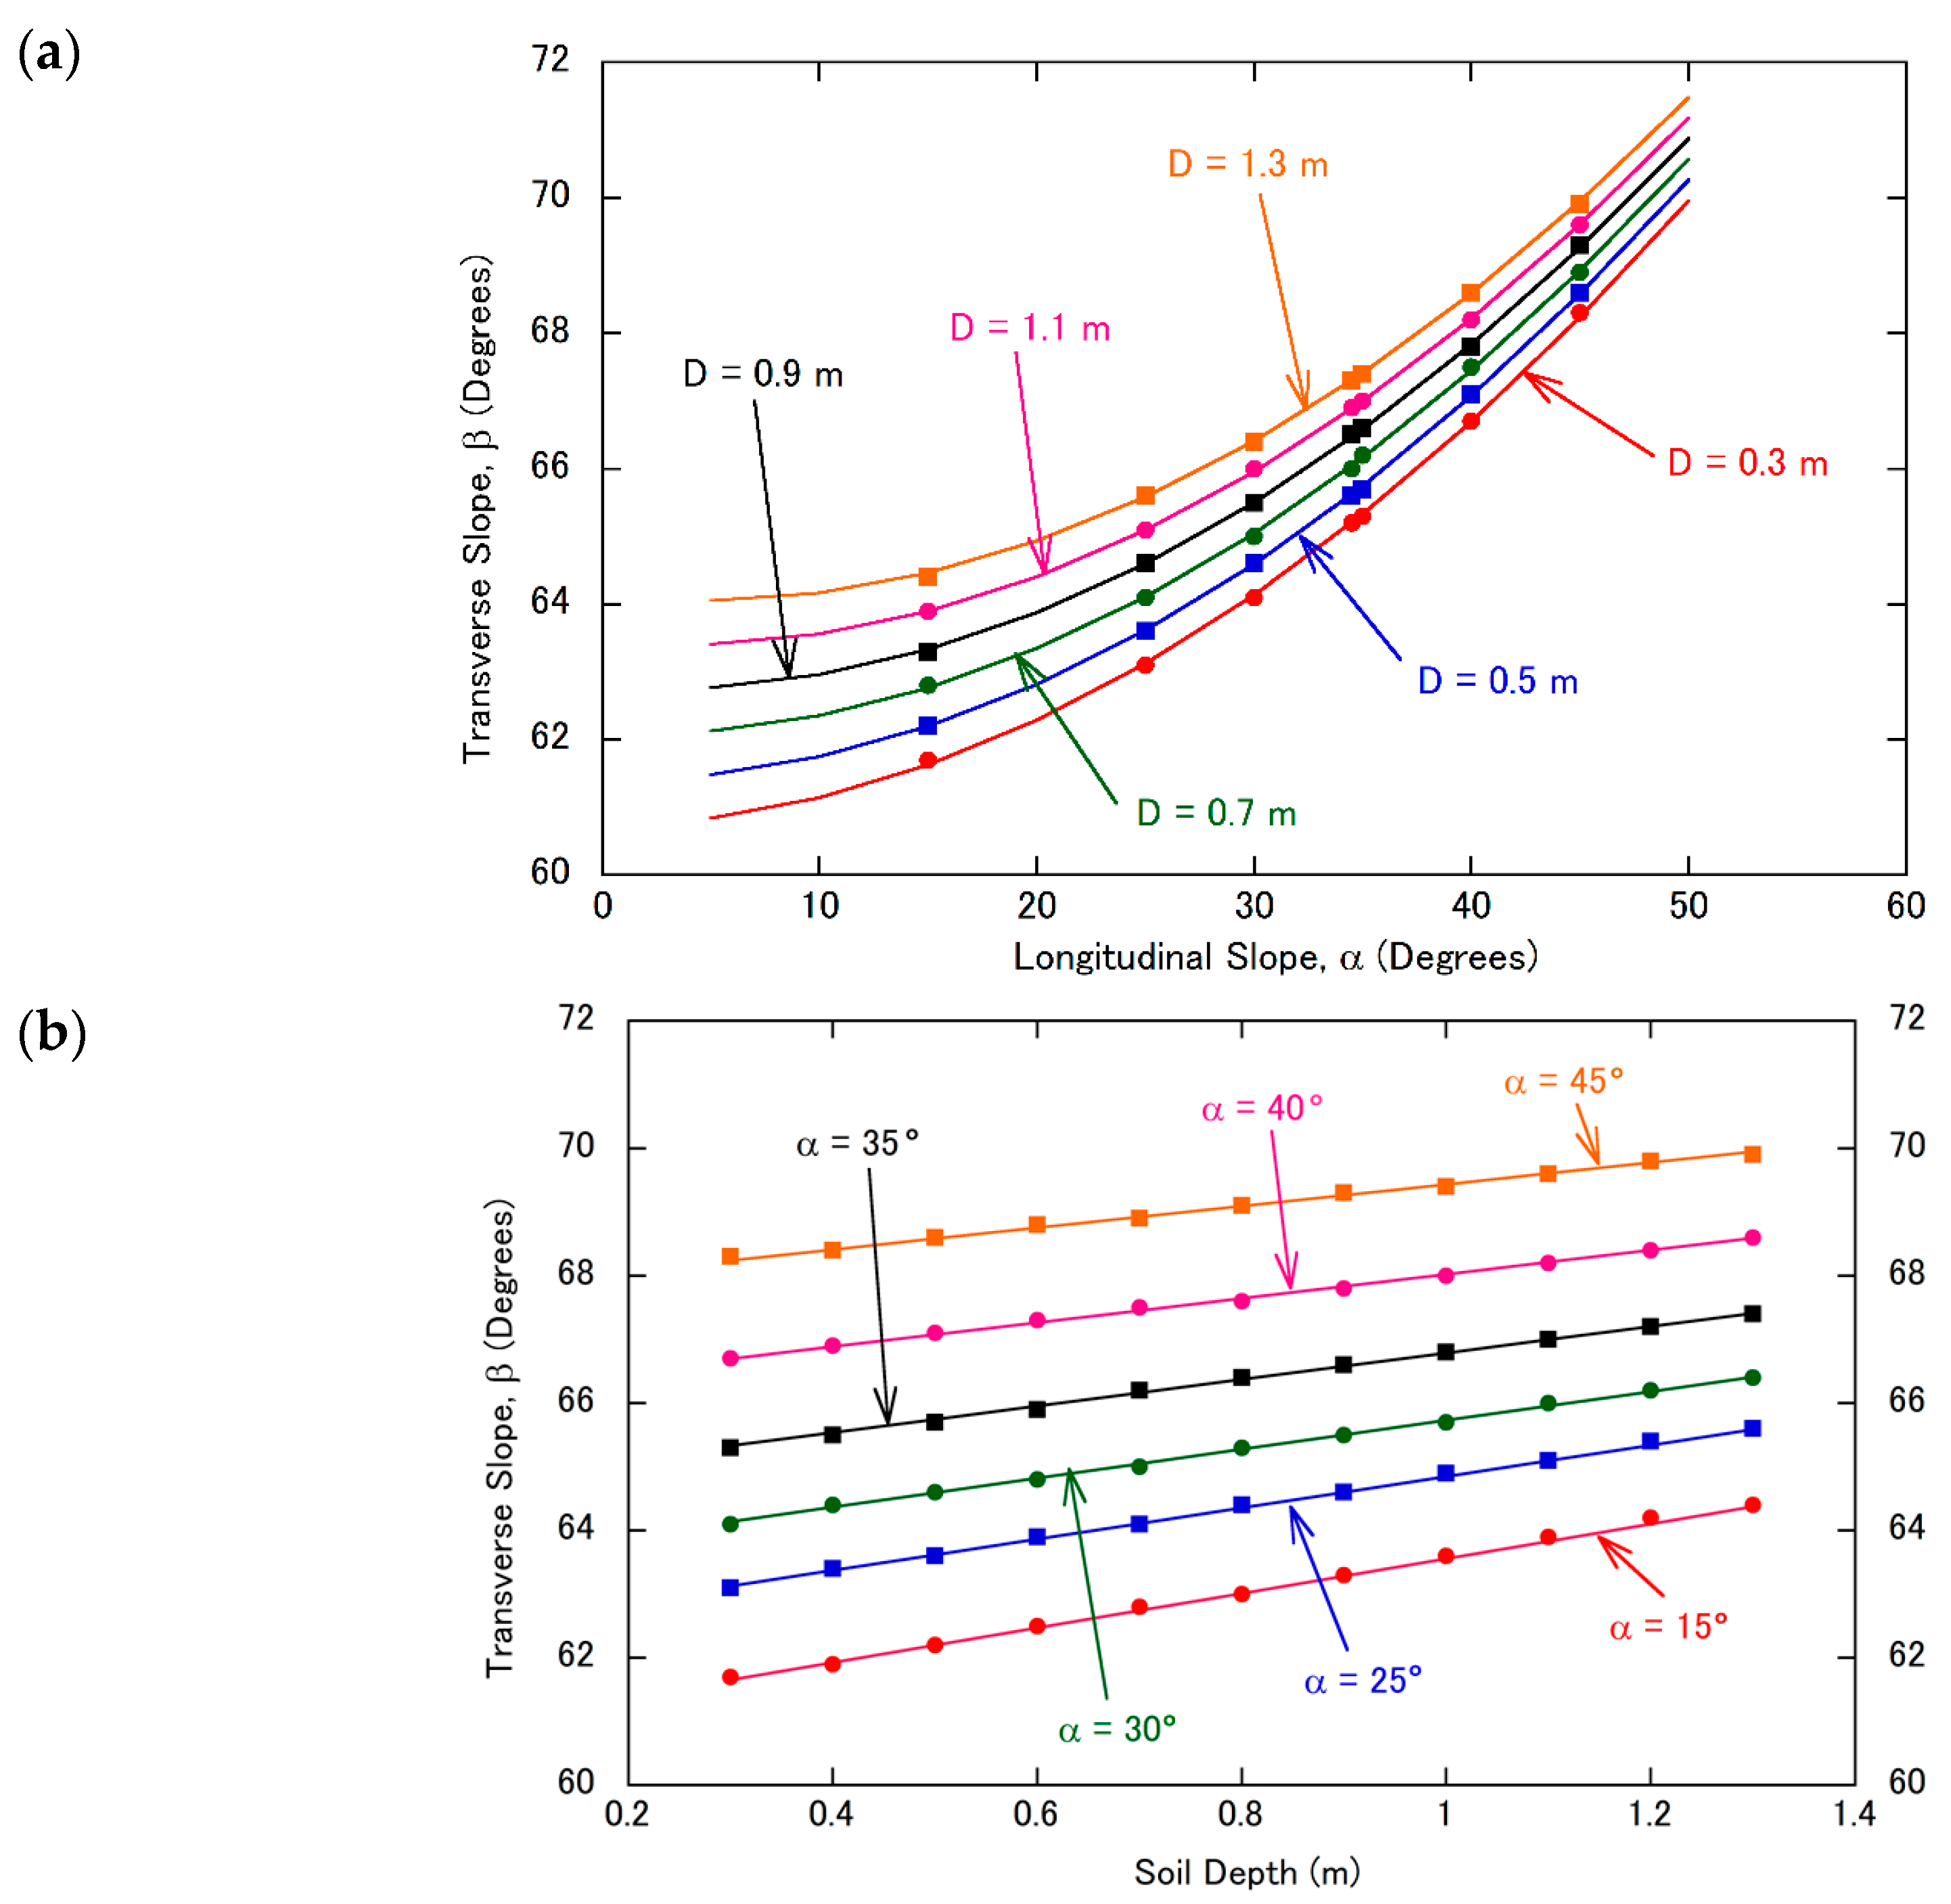
The widths of most shallow landslides are about 10–15 m according to Kosugi [66] and 5–20 m according to Okimura [67]. According to these findings and avoiding the overestimation of tree root effects, the shallow landslide risk was demonstratively evaluated on a 1-metre-resolution digital elevation model over the forest basin using the newly proposed three-prism method with a block width of 20 m. For each grid, the longitudinal slope, α, and soil depth, D, were the inputs, whereas β was estimated. For this estimation, the value of β with a minimum 3-D safety factor was calculated for various values of α (15.0°, 25.0°, 30.0°, 34.5°, 35.0°, 40.0°, and 45.0°) and D (0.3–1.3 m at intervals of 0.1 m). A multiple regression analysis indicated that β can be estimated using the following regression equation, where α and D are the two independent variables:
Because the interpretation of 3-D illustrations can be difficult, changes in β versus α with a constant D and β versus D with a constant α are shown in Figure 7, in which the curves are plotted using the regression Equation (18).
4. Discussion
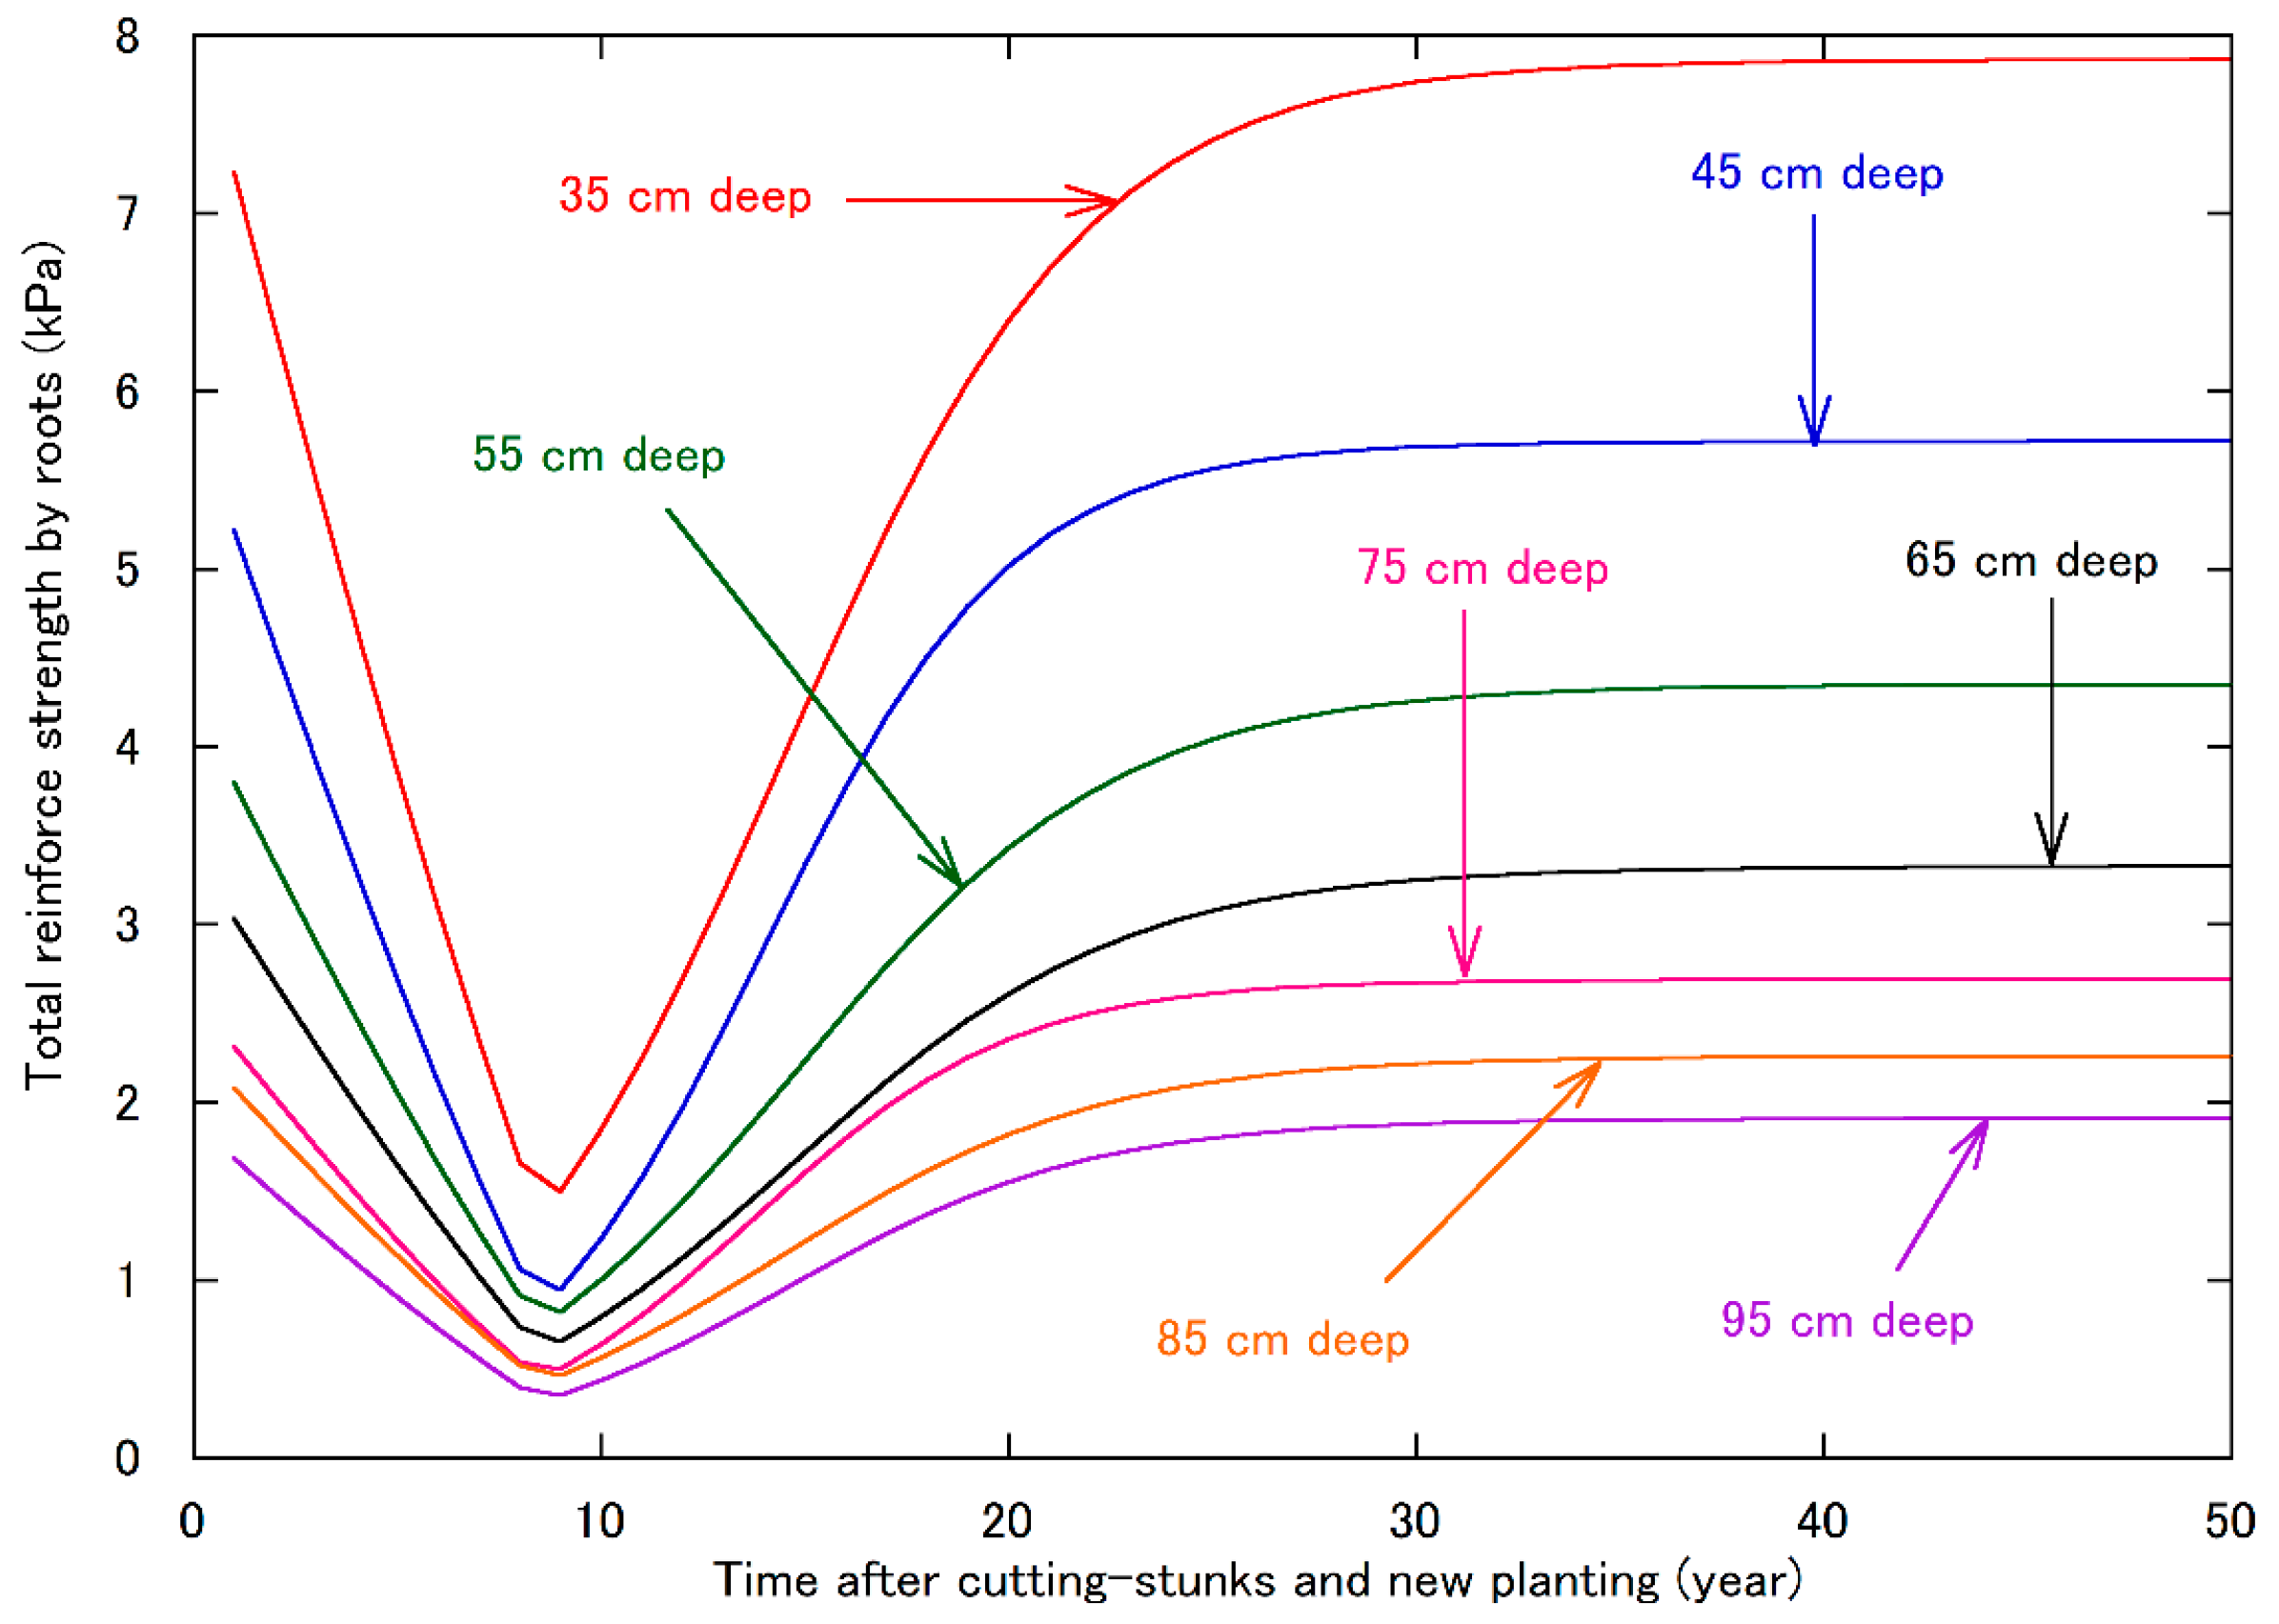
The reinforced root strength is expected to increase and decrease after new planting and stump cutting, respectively. Given that whole stands of Japanese cedar trees are harvested at the age of 50 years, and that seedlings are newly planted at the same time, the total reinforced root strength should be the sum of that of the decaying roots of the old stumps and the growing roots of the new stumps. Figure 8 shows the change in the total reinforced root strength at different depths according to the elapsed time up to 50 years. In the early stage, the decrease in the reinforced strength of decaying roots plays a more important role than that of the increase in the reinforced strength of growing roots, resulting in a rapid decrease in the total reinforced root strength, with a minimum strength observed at about 9 years. Thus, even with prompt planting just after clear-cutting, a considerable loss of reinforced root strength can occur, reducing the total reinforced root strength to a fraction of its maximum value. However, total root strength increases from 9 years to about 25 years, after which it remains almost constant up to 50 years.
Uprooting experiments have revealed changes in the strength of tree stumps [68], which have been discussed in relation to the effects of forests on shallow landslides in Japan [69]. In such experiments, the cut stumps of Japanese cedar trees were towed horizontally using a wire rope attached to a hand winch, and the mobilised maximum pullout forces when the cut stumps were removed from the ground were evaluated in relation to the stem volume. Because the sum of the uprooting strength of the decaying stumps and growing stumps was lowest at about 10 years after clear-cutting and new planting, these previous results were considered to explain why shallow landslides occur mostly during 10–15 years after clear-cutting and new planting [68]. Notably, these previous results are similar to the present findings. However, in these previous studies, the observed decrease in the uprooting strength of the cut stumps was not linear but rather negatively exponential according to the time after cutting. Regarding the decrease of strength under decay, 30% of the initial strength that remained at 10 years after cutting was finally lost at about 38 years. In addition, the rate of acceleration of the total strength after 10 years increased more slowly and gradually, continuing to increase up to 50 years. The minimum total strength at 10 years was about 60% of the initial strength, which was a lower reduction relative to that observed in our study. These results likely arose because the strength from the uprooting experiments was mostly related to the stump itself, rather than the roots in relatively deeper soil layers in which a probable sliding surface could form. Furthermore, Tsukamoto [70] indicated that the results of uprooting experiments explained the resistance strength against the uprooting of stumps but did not clarify how that strength was related to the resistance against sliding as a key factor of shallow landslide prevention. Therefore, a merit of our study is that the reinforced root strength on a sliding surface was determined yearly as a factor for preventing shallow landslides.
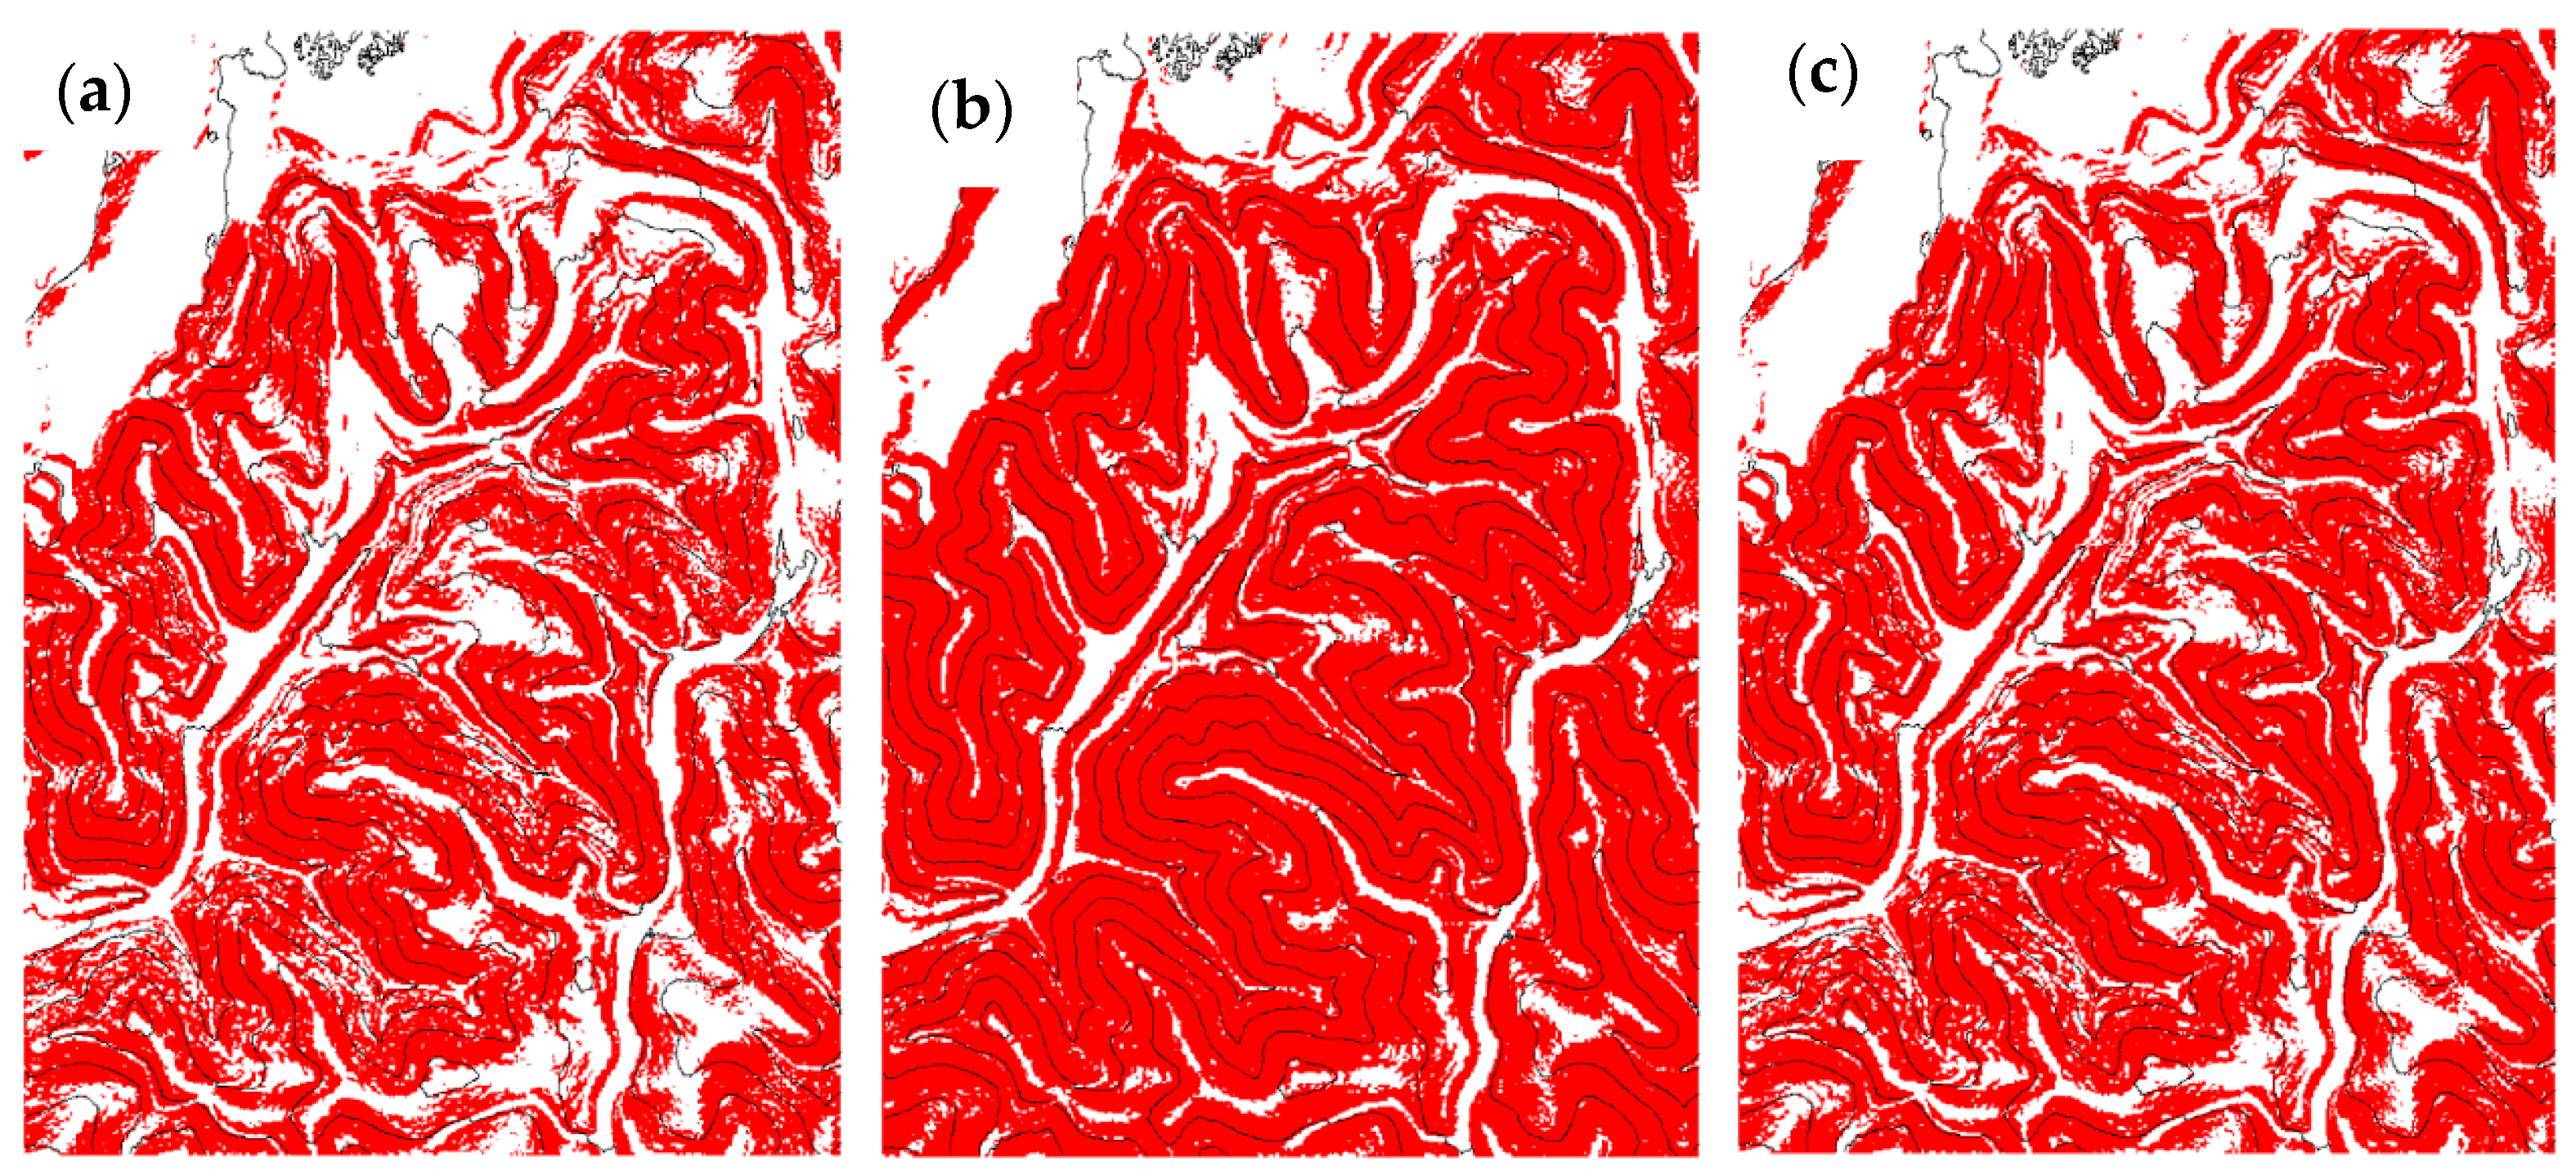
The newly proposed method for slope-stability analysis using three prisms (with a central quadrangular prism sandwiched between side triangular prisms) was applied to a 1-metre-resolution digital elevation model in a forest basin in Ibaraki Prefecture (Figure 2). Specifically, a three-prism model with a width of 20 m was assumed for each grid on the map to calculate the safety factor, and the effects of Japanese cedar forest dynamics were examined at intervals of 5 years up to 50 years. The results of the slope-stability analysis, considering the aboveground weight of the trees, is shown in Figure 9 for three different times: (a) just after clear-cutting, when the roots of cut trunks are not rotten, (b) 10 years after clear-cutting and new planting, when the reinforced root strength is almost at its lowest value, and (c) 20 years after clear-cutting and new planting, when the reinforced root strength has recovered to a certain degree. As shown in Figure 9, the distribution of red grids, indicating a safety factor of <1.0, just after clear-cutting (a), is similar to that o20 years after clear-cutting and immediate new planting (c), whereas markedly more red grids appear 10 years after clear-cutting and new planting (b), i.e., when the total reinforced root strength has almost reached its lowest value.
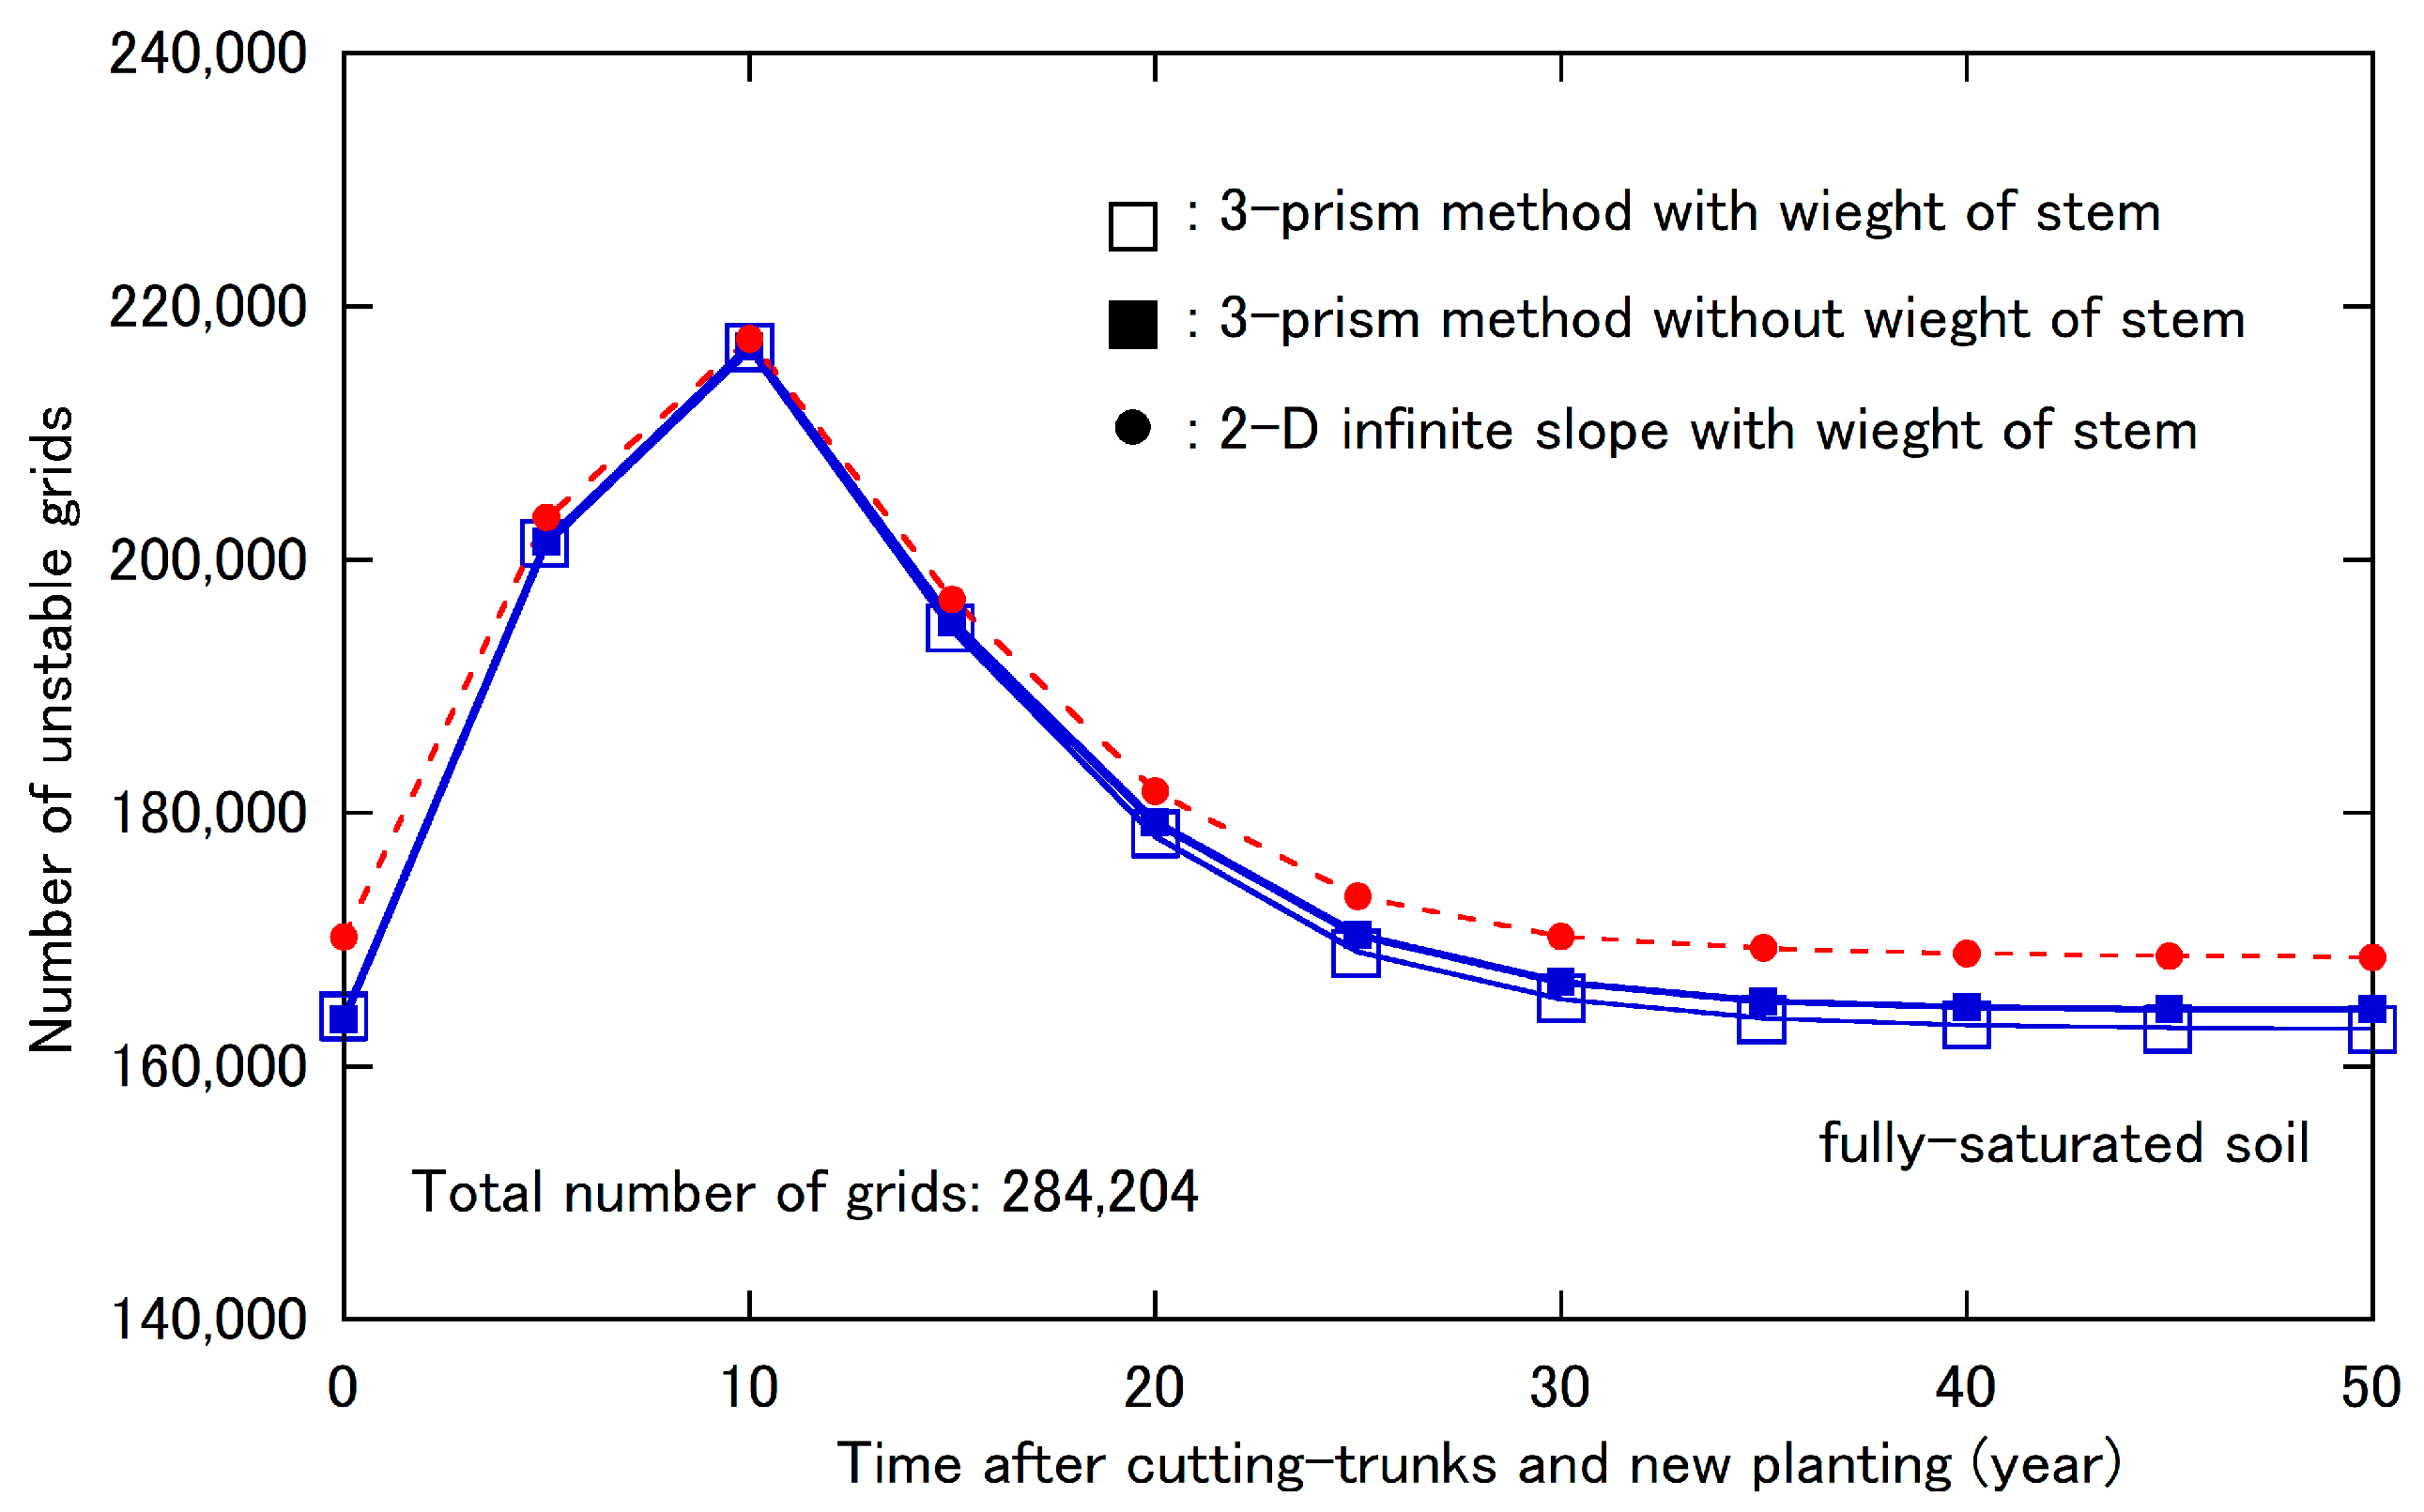
In Figure 10, the number of grids with a safety factor of <1.0 is shown according to the elapsed time after both clear-cutting and new planting. We found little difference between the safety factors with and without the aboveground weight of trees. The aboveground weight of trees is usually obtained by measuring the stem volume directly in situ; however, new methods incorporating high-density point-cloud data obtained with airborne or terrestrial laser scanners have been developed to construct 3-D tree models [71,72]. Nevertheless, as the aboveground weight of trees exerted little effect on the safety factor, we ignored these data in our stability analysis. Notably, in our stability analysis, the effect of the aboveground weight was investigated using the same ground water table conditions, i.e., the rainfall interception effect of trees, which diminishes the rainfall input [73], and the swaying of trees in the wind were not considered. These factors affect water table formation and groundwater infiltration and are driving forces in the initiation of sliding. We found that unstable grids rapidly increased for the first 5 years, peaked at 10 years, and then rapidly decreased from 10 to 20 years. After 30 years, the number of unstable grids remained almost constant.
The results of this study indicate that the reinforced strength of Japanese cedar tree roots decreases considerably between 5 and 15 years after clear-cutting and new planting, resulting in a rapid increase in slope instability. Thus, implementing forestry practices for lowering slope instability during this period should be considered important for preventing shallow landslides.
5. Conclusions
By approximating the sum of the pullout forces of roots over a unit area on a possible sliding surface, the changes in the reinforcement of roots during the growth of trees after planting and decay of stumps after cutting were simulated. Our results indicated that the root reinforcement decreased linearly after clear-cutting, with the minimum resistance strength against shallow landslides observed at around 9 years. Subsequently, by about 25 years, the root reinforcement increased to a relatively constant value. We proposed a three-prism method to examine the effect of lateral roots across the side-flanks of shallow landslides on slope stability. Using this method on a 1-metre-resolution digital elevation model, a large number of unstable slopes were observed between 5 and 15 years after clear-cutting and new planting, indicating that appropriate forestry operations should be implemented during this period to prevent landslide disasters in forests.
Author Contributions
All the authors contributed to the study’s conception and design. Material preparation, data collection, and data analysis were performed by Y.O., F.C. and U.K. The first draft of the manuscript was written by Y.O. and all the authors commented on previous versions of the manuscript. All authors have read and agreed to the published version of the manuscript.
Funding
This research work was funded by the Agriculture, Forestry and Fisheries Research Council (MAFF Commissioned project study, Grant Number JPJ009840) and the Japan Society for the Promotion of Science (Grant-in-Aid for Scientific Research (c), Grant Number JP21K04601).
Data Availability Statement
Not applicable.
Acknowledgments
The authors should like to thank ABE Kazutoki of Nihon University for his valuable suggestions and advice. Our sincere appreciation goes to TSUBOYAMA Yoshio and KUBOTA Tayoko of the Forest Research and Management Organization for providing the DEM data. We are indebted to FURUYA Naoyuki and MURAKAMI Wataru of the Forest Research and Management Organization for the useful discussions. The experiments were conducted in national forests, and we express our sincere gratitude to ISHIGURI Hideto of the Forestry Agency.
Conflicts of Interest
The authors declare no conflict of interest.
Appendix A

Table A1.
Number of roots in each root-diameter class on a sliding surface at different depths and stand ages.
Table A1.
Number of roots in each root-diameter class on a sliding surface at different depths and stand ages.
| Depth (cm) | Stand Age (Years) | Root-Diameter Class Value (cm) | ||||||||
|---|---|---|---|---|---|---|---|---|---|---|
| 0.25 | 0.75 | 1.25 | 1.75 | 2.25 | 2.75 | 3.25 | 3.75 | 4.25 | ||
| 35 | 10 | 20.0 | 2.6 | 1.0 | ||||||
| 15 | 47.0 | 6.1 | 2.4 | 1.3 | 0.8 | |||||
| 20 | 85.5 | 11.1 | 4.3 | 2.3 | 1.4 | 1.0 | ||||
| 25 | 116.1 | 15.0 | 5.8 | 3.1 | 2.0 | 1.3 | 1.0 | |||
| 30 | 135.7 | 17.6 | 6.8 | 3.6 | 2.3 | 1.6 | 1.2 | 0.9 | ||
| 35 | 173.2 | 22.4 | 8.7 | 4.6 | 2.9 | 2.0 | 1.5 | 1.1 | ||
| 40 | 179.9 | 23.3 | 9.0 | 4.8 | 3.0 | 2.1 | 1.5 | 1.2 | 0.9 | |
| 45 | 205.6 | 26.6 | 10.3 | 5.5 | 3.5 | 2.4 | 1.7 | 1.3 | 1.1 | |
| 50 | 225.5 | 29.2 | 11.3 | 6.0 | 3.8 | 2.6 | 1.9 | 1.5 | 1.2 | |
| 45 | 10 | 13.5 | 1.7 | 0.7 | ||||||
| 15 | 42.0 | 5.4 | 2.1 | 1.1 | ||||||
| 20 | 72.6 | 9.4 | 3.6 | 1.9 | 1.2 | |||||
| 25 | 95.3 | 12.3 | 4.8 | 2.6 | 1.6 | 1.1 | ||||
| 30 | 108.5 | 14.1 | 5.4 | 2.9 | 1.8 | 1.3 | 0.9 | |||
| 35 | 138.4 | 17.9 | 6.9 | 3.7 | 2.3 | 1.6 | 1.2 | |||
| 40 | 140.9 | 18.3 | 7.1 | 3.8 | 2.4 | 1.6 | 1.2 | 0.9 | ||
| 45 | 161.1 | 20.9 | 8.1 | 4.3 | 2.7 | 1.9 | 1.4 | 1.0 | ||
| 50 | 176.7 | 22.9 | 8.9 | 4.7 | 3.0 | 2.0 | 1.5 | 1.1 | ||
| 55 | 10 | 9.6 | 1.2 | 0.5 | ||||||
| 15 | 30.0 | 3.9 | 1.5 | 0.8 | ||||||
| 20 | 50.5 | 6.5 | 2.5 | 1.4 | 0.8 | |||||
| 25 | 68.0 | 8.8 | 3.4 | 1.8 | 1.1 | 0.8 | ||||
| 30 | 94.3 | 12.2 | 4.7 | 2.5 | 1.6 | 1.1 | ||||
| 35 | 98.9 | 12.8 | 5.0 | 2.6 | 1.7 | 1.1 | 0.8 | |||
| 40 | 119.3 | 15.5 | 6.0 | 3.2 | 2.0 | 1.4 | 1.0 | |||
| 45 | 136.4 | 17.7 | 6.8 | 3.7 | 2.3 | 1.6 | 1.2 | |||
| 50 | 126.2 | 16.4 | 6.3 | 3.4 | 2.1 | 1.5 | 1.1 | 0.8 | ||
| 65 | 10 | 11.6 | 1.6 | |||||||
| 15 | 21.0 | 2.9 | 1.1 | 0.6 | ||||||
| 20 | 35.9 | 4.9 | 1.9 | 1.1 | 0.7 | |||||
| 25 | 59.3 | 8.1 | 3.2 | 1.8 | 1.1 | |||||
| 30 | 64.6 | 8.8 | 3.5 | 1.9 | 1.2 | 0.8 | ||||
| 35 | 82.4 | 11.3 | 4.5 | 2.4 | 1.5 | 1.1 | ||||
| 40 | 81.1 | 11.1 | 4.4 | 2.4 | 1.5 | 1.1 | 0.8 | |||
| 45 | 92.8 | 12.7 | 5.0 | 2.7 | 1.7 | 1.2 | 0.9 | |||
| 50 | 101.7 | 13.9 | 5.5 | 3.0 | 1.9 | 1.3 | 1.0 | |||
| 75 | 10 | 9.0 | 1.2 | |||||||
| 15 | 23.7 | 3.2 | 1.3 | |||||||
| 20 | 37.3 | 5.1 | 2.0 | 1.1 | ||||||
| 25 | 45.9 | 6.3 | 2.5 | 1.4 | 0.9 | |||||
| 30 | 63.6 | 8.7 | 3.5 | 1.9 | 1.2 | |||||
| 35 | 63.8 | 8.7 | 3.5 | 1.9 | 1.2 | 0.8 | ||||
| 40 | 77.0 | 10.5 | 4.2 | 2.3 | 1.4 | 1.0 | ||||
| 45 | 88.0 | 12.0 | 4.8 | 2.6 | 1.6 | 1.1 | ||||
| 50 | 78.7 | 10.8 | 4.3 | 2.3 | 1.5 | 1.0 | 0.8 | |||
| 85 | 10 | 7.1 | 1.0 | |||||||
| 15 | 18.9 | 2.6 | 1.0 | |||||||
| 20 | 29.7 | 4.1 | 1.6 | 0.9 | ||||||
| 25 | 35.6 | 5.0 | 2.0 | 1.1 | 0.7 | |||||
| 30 | 50.7 | 6.9 | 2.8 | 1.5 | 0.9 | |||||
| 35 | 64.6 | 8.9 | 3.5 | 1.9 | 1.2 | |||||
| 40 | 61.3 | 8.4 | 3.3 | 1.8 | 1.1 | 0.8 | ||||
| 45 | 70.1 | 9.6 | 3.8 | 2.1 | 1.3 | 0.9 | ||||
| 50 | 76.9 | 10.5 | 4.2 | 2.3 | 1.4 | 1.0 | ||||
| 95 | 10 | 5.8 | 0.8 | |||||||
| 15 | 15.4 | 2.1 | 0.8 | |||||||
| 20 | 24.2 | 3.3 | 1.3 | 0.7 | ||||||
| 25 | 40.0 | 5.5 | 2.2 | 1.2 | ||||||
| 30 | 41.3 | 5.7 | 2.2 | 1.2 | 0.8 | |||||
| 35 | 52.7 | 7.2 | 2.9 | 1.6 | 1.0 | |||||
| 40 | 63.6 | 8.7 | 3.5 | 1.9 | 1.2 | |||||
| 45 | 57.2 | 7.8 | 3.1 | 1.7 | 1.1 | 0.7 | ||||
| 50 | 62.7 | 8.6 | 3.4 | 1.9 | 1.2 | 0.8 | ||||
References
- Miyasaka, T.; Kawase, H.; Nakaegawa, T.; Imada, Y.; Takayabu, I. Future projections of heavy precipitation in Kanto and associated weather patterns using large ensemble high-resolution simulations. SOLA 2020, 16, 125–131. [Google Scholar] [CrossRef]
- Cruden, D.M.; Varnes, D.J. Landslide types and processes. In Landslides, Investigation and Mitigation: Special Report 247; Turner, A.K., Schuster, R.L., Eds.; Transportation Research Board, National Research Council: Washington, DC, USA, 1996; pp. 501–516. [Google Scholar]
- Okada, Y.; Ochiai, H.; Okamoto, T.; Sassa, K.; Fukuoka, H.; Igwe, O. A complex earth slide–earth flow induction by the heavy rainfall in July 2006, Okaya City, Nagano Prefecture, Japan. Landslides 2007, 4, 197–203. [Google Scholar] [CrossRef]
- Duan, W.; He, B.; Takara, K.; Luo, P.; Nover, D.; Yamashiki, Y.; Huang, W. Anomalous atmospheric events leading to Kyushu’s flash floods, July 11–14, 2012. Nat. Hazards 2014, 73, 1255–1267. [Google Scholar] [CrossRef]
- Yang, H.; Wang, F.; Miyajima, M. Investigation of shallow landslides triggered by heavy rainfall during Typhoon Wipha (2013), Izu Oshima Island, Japan. Geoenviron. Disasters. 2015, 2, 15. [Google Scholar] [CrossRef] [Green Version]
- Wang, G.; Sassa, K.; Fukuoka, H. Downslope volume enlargement of a debris slide–debris flow in the 1999 Hiroshima, Japan, rainstorm. Eng. Geol. 2003, 69, 309–330. [Google Scholar] [CrossRef]
- Wang, F.; Wu, Y.H.; Yang, H.; Tanida, Y.; Kamei, A. Preliminary investigation of the 20 August 2014 debris flows triggered by a severe rainstorm in Hiroshima City, Japan. Geoenviron. Disasters. 2015, 2, 17. [Google Scholar] [CrossRef] [Green Version]
- Chigira, M.; Ling, S.; Matsushi, Y. Landslide disaster induced by the 2017 northern Kyushu rainstorm. Disaster Prev. Res. Inst. Ann. A 2018, 61a, 28–35. [Google Scholar]
- Moriya, H.; Nihei, H.; Hasebe, Y.; Mine, K.; Sushimoto, K.; Yano, S.; Watanabe, Y.; Fukuda, N. Study on driftwood disaster in Kita River, Fukuoka Prefecture, due to 2017 northern Kyushu flood. Annu. J. Hydraul. Eng. 2018, 74, I1195–I1200. [Google Scholar] [CrossRef]
- Mori, S.; Ono, K. Landslide disasters in Ehime Prefecture resulting from the July 2018 heavy rain event in Japan. Soils Found 2019, 59, 2396–2409. [Google Scholar] [CrossRef]
- Akiya, K. Shallow landslides and forests. Landslide prevention and slope stability. In Landslide Prevention and Slope Stability; Sougou Doboku Kenkyusho. Co., Ltd.: Tokyo, Japan, 1979; Volume 3, pp. 43–52. [Google Scholar]
- Zhang, Y.; Shen, C.; Zhou, S.; Luo, X. Analysis of the influence of forests on landslides in the Bijie area of Guizhou. Forests 2022, 13, 1136. [Google Scholar] [CrossRef]
- Annual Report on Forest and Forestry in Japan 2022. Available online: http://www.rinya.maff.go.jp/j/kikaku/hakusyo/r3hakusyo/attach/pdf/zenbun-26.pdf (accessed on 28 October 2022).
- Okada, Y.; Konishi, C. Geophysical features of shallow landslides induced by the 2015 Kanto-Tohoku heavy rain in Kanuma city, Tochigi Prefecture, Japan. Landslides 2019, 16, 2469–2483. [Google Scholar] [CrossRef]
- Okada, Y. Measuring critical turning moment of the Japanese cedar (Cryptomeria japonica) in situ. J. For. Res. 2019, 24, 162–167. [Google Scholar] [CrossRef]
- Outline of Public Opinion Survey on Forests and Lives 2019. Available online: https://survey.gov-online.go.jp/r01/r01-shinrin/gairyaku.pdf (accessed on 28 October 2022).
- The Type and Area of Forest Reserve. Available online: https://www.rinya.maff.go.jp/j/tisan/tisan/con_2_2_1.html (accessed on 28 October 2022).
- Waldron, L.J. The shear resistance of root-permeated homogeneous and stratified soil. Soil Sci. Soc. Am. J. 1977, 41, 843–849. [Google Scholar] [CrossRef]
- Waldron, L.J.; Dakessian, S. Soil reinforcement by roots: Calculation of increased soil shear resistance from root properties. Soil Sci. 1981, 132, 427–435. [Google Scholar] [CrossRef]
- Waldron, L.J.; Dakessian, S.; Nemson, J.A. Shear resistance enhancement of 1.22-meter diameter soil cross sections by pine and alfalfa roots. Soil Sci. Soc. Am. J. 1983, 47, 9–14. [Google Scholar] [CrossRef]
- Abe, K.; Ziemer, R.R. Effect of tree roots on a shear zone: Modeling reinforced shear stress. Can. J. Forest. Res. 1991, 21, 1012–1019. [Google Scholar] [CrossRef]
- Abe, K. A method for evaluating the effect of tree roots on preventing shallow-seated landslides. Bull. For. Forest. Prod. Res. Inst. 1997, 373, 105–181. [Google Scholar]
- Wu, T.H.; McKinnell, W.P.; Swanston, D.N. Strength of tree roots and landslides on Prince of Wales Island, Alaska. Can. Geotech. J. 1979, 16, 19–33. [Google Scholar] [CrossRef]
- Kitahara, H. Effect of tree root systems on slope stability. Water Sci. 2010, 53, 11–37. [Google Scholar]
- Schwarz, M.; Giadrossich, F.; Cohen, D. Modeling root reinforcement using a root-failure Weibull survival function. Hydrol. Earth Syst. Sci. 2013, 17, 4367–4377. [Google Scholar] [CrossRef] [Green Version]
- Li, P.; Xiao, X.; Wu, L.; Li, X.; Zhang, H.; Zhou, J. Study on the shear strength of root-soil composite and root reinforcement mechanism. Forests 2022, 13, 898. [Google Scholar] [CrossRef]
- Wu, T.H.; Beal, P.E.; Lan, C. In-situ shear test of soil-root systems. J. Geotech. Eng. 1988, 114, 1376–1394. [Google Scholar] [CrossRef]
- Abe, K.; Kurokawa, U.; Takeuchi, Y. Method for evaluating thinning influence on a forest’s stability to prevent shallow landslides. J. Jpn. Landslide Soc. 2004, 41, 9–19. [Google Scholar] [CrossRef]
- Sato, H.; Otani, K.; Kanbara, T.; Torita, H. The comparison between the resistance of tree roots to shallow landslide by in-situ direct shear test and the pullout resistance of tree roots. J. Soil Erosion Control Eng. 2013, 66, 15–20. [Google Scholar] [CrossRef]
- Okada, Y.; Kurokawa, U. An experimental examination on a reinforcement of shear resistance due to tree-roots of a Japanese cypress. Kanto J. Forest Res. 2012, 63, 141–144. [Google Scholar]
- Okimura, T.; Ichikawa, R. A prediction method for surface failures by movements of infiltrated water in a surface soil layer. J. Nat. Disaster Sci. 1985, 7, 41–51. [Google Scholar]
- Okada, Y.; Kurokawa, U. Examining tree roots on shearing resistance in shallow landslides triggered by heavy rainfall in Shobara in 2010. J. For. Res. 2015, 20, 230–235. [Google Scholar] [CrossRef]
- Torii, N.; Masumoto, S.; Nonami, S. Proposal of infinite stability analysis considering effects of additional cohesion from roots. Mem. Constr. Eng. Res. Inst. Found. 2021, 63, 75–85. [Google Scholar]
- Kagamihara, S.; Todo, C.; Okazaki, K.; Nishiwaki, H.; Kataoka, S.; Shibuya, S. Case study on evaluating the stability of natural slope by considering the effects of forest roots. Mem. Constr. Eng. Res. Inst. Found 2018, 60, 131–142. [Google Scholar]
- Ueno, S. Influence of geological factors on configuration and scale of landslides. J. Jpn. Landslide Soc. 2001, 38, 105–114. [Google Scholar] [CrossRef] [Green Version]
- Hovland, H.J. Three-dimensional slope stability analysis method. J. Geotech. Eng. Div. 1977, 103, 971–986. [Google Scholar] [CrossRef]
- Ugai, K. Three-dimensional slope stability analysis by simplified Janbu method. J. Jpn. Landslide Soc. 1987, 24, 8–14. [Google Scholar] [CrossRef] [PubMed] [Green Version]
- Hungr, O. An extension of Bishop’s simplified method of slope stability analysis to three dimensions. Géotechnique 1987, 37, 113–117. [Google Scholar] [CrossRef]
- Hungr, O.; Salgado, F.M.; Byrne, P.M. Evaluation of a three-dimensional method of slope stability analysis. Can. Geotech. J. 1989, 26, 679–686. [Google Scholar] [CrossRef]
- Lam, L.; Fredlund, D.G. A general limit equilibrium model for three-dimensional slope stability analysis. Can. Geotech. J. 1993, 30, 905–919. [Google Scholar] [CrossRef]
- Zhou, X.P.; Cheng, H. Analysis of stability of three-dimensional slopes using the rigorous limit equilibrium method. Eng. Geol. 2013, 160, 21–33. [Google Scholar] [CrossRef]
- Kumar, S.; Choudhary, S.S.; Burman, A. Recent advances in 3D slope stability analysis: A detailed review. Model Earth Syst. Environ. 2022. [CrossRef]
- Roering, J.J.; Schmidt, K.M.; Stock, J.D.; Dietrich, W.E.; Montgomery, D.R. Shallow landsliding, root reinforcement, and the spatial distribution of trees in the Oregon Coast Range. Can. Geotech. J. 2003, 40, 237–253. [Google Scholar] [CrossRef] [Green Version]
- Tosi, M. Root tensile strength relationships and their slope stability implications of three shrub species in the Northern Apennines (Italy). Geomorphology 2007, 87, 268–283. [Google Scholar] [CrossRef]
- Ni, J.J.; Leung, A.K.; Ng, C.W.W.; Shao, W. Modelling hydro-mechanical reinforcements of plants to slope stability. Comput. Geotech. 2018, 95, 99–109. [Google Scholar] [CrossRef]
- Area Tables of Japanese Cedar Forests and Japanese Cypress Forests in Each Prefecture. Available online: https://www.rinya.maff.go.jp/j/sin_riyou/kafun/pdf/sugihinoki_menseki.pdf (accessed on 28 October 2022).
- Karizumi, N. Root biomass. In Primary Productivity of Japanese Forests—Productivity of Terrestrial Communities; Shidei, T., Kira, T., Eds.; University of Tokyo Press: Tokyo, Japan, 1977; Volume 16, pp. 45–52. [Google Scholar]
- Yazawa, K. Heterogeneity in specific gravity, tree rings, and water content. Mater. Trans. 1963, 12, 678–682. [Google Scholar] [CrossRef]
- Wu, T.H. Root reinforcement of soil: Review of analytical models, test results, and applications to design. Can. Geotech. J. 2013, 50, 259–274. [Google Scholar] [CrossRef]
- Danjon, F.; Barker, D.H.; Drexhage, M.; Stokes, A. Using three-dimensional plant root architecture in models of shallow-slope stability. Ann. Bot. 2008, 101, 1281–1293. [Google Scholar] [CrossRef] [Green Version]
- Genet, M.; Kokutse, N.; Stokes, A.; Fourcaud, T.; Cai, X.; Ji, J.; Mickovski, S. Root reinforcement in plantations of Cryptomeria japonica D. Don: Effect of tree age and stand structure on slope stability. Forest. Ecol. Manag. 2008, 256, 1517–1526. [Google Scholar] [CrossRef]
- Abdi, E.; Majnounian, B.; Genet, M.; Rahimi, H. Quantifying the effects of root reinforcement of Persian ironwood (Parrotia persica) on slope stability; a case study: Hillslope of Hyrcanian forests, northern Iran. Ecol. Eng. 2010, 36, 1409–1416. [Google Scholar] [CrossRef]
- Schwarz, M.; Preti, F.; Giadrossich, F.; Lehmann, P.; Or, D. Quantifying the role of vegetation in slope stability: A case study in Tuscany (Italy). Ecol. Eng. 2010, 36, 285–291. [Google Scholar] [CrossRef]
- Forestry Agency. Yield Tables of the Japanese Cedar Developed for Regions in and around Ibaraki Prefecture, 1st ed.; Tokyo Forestry Bureau: Tokyo, Japan, 1959; pp. 5–6. [Google Scholar]
- Osanai, N. Site prediction of shallow landslides by means of simplified cone penetration tests. Found Eng. Equip Mon. 2007, 35, 19–22. [Google Scholar]
- Pelletier, J.; Broxton, P.; Hazenberg, P.; Zeng, X.; Troch, P.; Niu, G.; Williams, Z.; Brunke, M.; Gochis, D. A gridded global data set of soil, intact regolith, and sedimentary deposit thicknesses for regional and global land surface modelling. J. Adv. Model Earth Syst. 2015, 8, 41–65. [Google Scholar] [CrossRef]
- Scarpone, C.; Schmidt, M.G.; Bulmer, C.E.; Knudby, A. Modelling soil thickness in the critical zone for Southern British Columbia. Geoderma 2016, 282, 59–69. [Google Scholar] [CrossRef]
- Chen, S.; Mulder, V.L.; Martin, M.P.; Walter, C.; Lacoste, M.; Richer-de-Forges, A.C.; Saby, N.P.A.; Loiseau, T.; Hu, B.; Arrouays, D. Probability mapping of soil thickness by random survival forest at a national scale. Geoderma 2019, 344, 184–194. [Google Scholar] [CrossRef]
- Malone, B.; Searle, R. Improvements to the Australian national soil thickness map using an integrated data mining approach. Geoderma 2020, 377, 114579. [Google Scholar] [CrossRef]
- Abe, K.; Kurokawa, U.; Watanabe, E.; Kubota, H.; Chang, H. A study on soil depth distribution in high elevation slopes (II). Kanto J. Forest. Res. 2004, 55, 267–270. [Google Scholar]
- Survey Guide for Investigations on Forests Disasters. Available online: https://www.rinya.maff.go.jp/j/saigai/saigai/attach/pdf/con_1-3.pdf (accessed on 13 November 2002).
- Azzouz, A.S.; Baligh, M.M. Discussion of three-dimensional slope stability analysis method. J. Geotech. Eng. Div. 1978, 104, 1206–1208. [Google Scholar] [CrossRef]
- Ugai, K.; Wakai, A.; Cai, F. Examination of preciseness of 3D slope stability analysis methods using several idealized sliding masses: Comparisons of Hovland method and 3D simplified Janbu method. J. Jpn. Landslide Soc. 2005, 42, 63–68. [Google Scholar] [CrossRef] [Green Version]
- Jiang, J.-C.; Yamagami, T. Three-dimensional limit equilibrium slope stability analysis: Simplified methods vs rigorous methods. J. Jpn. Landslide Soc. 2005, 42, 129–135. [Google Scholar] [CrossRef] [Green Version]
- Stark, T.D.; Eid, H.T. Performance of three-dimensional slope stability methods in practice. J. Geotech. Geoenviron. Eng. 1998, 124, 1049–1060. [Google Scholar] [CrossRef]
- Kosugi, K. Evaluation of slope failure vulnerability based on antecedent precipitation index. Tech. Note Natl. Res. Inst. Earth Sci. Disaster Prev. 2016, 405, 75–82. [Google Scholar]
- Okimura, T.; Torii, N.; Nakagawa, W.; Haraguchi, K.; Kasahara, T.; Yamauchi, M.; Sagane, T.; Ito, M. Some problems and measures appeared during the construction of the real-time hazard system for slope disasters at a heavy rainfall (5). Mem. Constr. Eng. Res. Inst. Found. 2014, 56, 45–66. [Google Scholar]
- Kitamura, Y.; Namba, S. Tree roots upon landslide prevention presumed through the uprooting test. Bull. For. Forest. Prod. Res. Inst. 1981, 313, 175–208. [Google Scholar]
- Shuin, Y. Effects of vegetation on shallow landslide prevention. Erosion. Control. Eng. 2002, 55, 71–78. [Google Scholar]
- Tsukamoto, Y. Evaluation of the effect of tree roots on slope stability. Bull. Exp. For. Tokyo Univ. Agric. Technol. 1987, 23, 65–124. [Google Scholar]
- Awaya, Y.; Takahashi, T. Evaluating the differences in modelling biophysical attributes between deciduous broadleaved and evergreen conifer forests using low-density small-footprint LiDAR data. Remote Sens. 2017, 9, 572. [Google Scholar] [CrossRef] [Green Version]
- Kumazaki, R. Application of 3D tree modelling using point cloud data by terrestrial laser scanner. J. Jpn. Inst. Landsc. Archit. 2021, 84, 527–530. [Google Scholar] [CrossRef]
- Sheng, H.; Cai, T. Influence of rainfall on canopy interception in mixed broad-leaved—Korean pine forest in Xiaoxing’an Mountains, Northeastern China. Forests 2019, 10, 248. [Google Scholar] [CrossRef]
Figure 1.
Schematic of the three-prism model used for slope-stability analysis. (a) Three prisms. (b) Reinforcement by roots on a potential sliding surface.
Figure 1.
Schematic of the three-prism model used for slope-stability analysis. (a) Three prisms. (b) Reinforcement by roots on a potential sliding surface.

Figure 2.
Topography maps of the studied forest basin. (a) Location of Ibaraki Prefecture. (b) Elevation, (c) slope (calculated by TNTmips (Version 2019, Redmond, DC, USA)), and (d) soil depth.
Figure 2.
Topography maps of the studied forest basin. (a) Location of Ibaraki Prefecture. (b) Elevation, (c) slope (calculated by TNTmips (Version 2019, Redmond, DC, USA)), and (d) soil depth.

Figure 3.
Maximum pullout strengths of the Japanese cedar roots of live trees and stumps cut at different times (labelled on the graph).
Figure 3.
Maximum pullout strengths of the Japanese cedar roots of live trees and stumps cut at different times (labelled on the graph).

Figure 4.
Changes in the reinforced strength of Japanese cedar roots over time. (a) Increased strength caused by roots growing after new planning. (b) Decreased strength caused by roots decaying after stump-cutting.
Figure 4.
Changes in the reinforced strength of Japanese cedar roots over time. (a) Increased strength caused by roots growing after new planning. (b) Decreased strength caused by roots decaying after stump-cutting.


Figure 5.
Results of slope-stability analysis obtained using Hovland’s method. Changes in (a) the transverse slope (β) and (b) safety factor, according to prism width.
Figure 5.
Results of slope-stability analysis obtained using Hovland’s method. Changes in (a) the transverse slope (β) and (b) safety factor, according to prism width.


Figure 6.
Comparison of safety factors according to prism width evaluated using different analysis methods.
Figure 6.
Comparison of safety factors according to prism width evaluated using different analysis methods.

Figure 7.
Changes in the transverse slope (β) according to (a) the longitudinal slope (α) and (b) soil depth (D).
Figure 7.
Changes in the transverse slope (β) according to (a) the longitudinal slope (α) and (b) soil depth (D).

Figure 8.
Changes in the total reinforced root strength of Japanese cedar according to the time after stump-cutting and new planting.
Figure 8.
Changes in the total reinforced root strength of Japanese cedar according to the time after stump-cutting and new planting.

Figure 9.
Changes in unstable grids calculated for the forest basin with 284,204 grids in total under fully saturated conditions with the weight of stems (a) just after clear-cutting (number of unstable grids: 163,720), (b) 10 years after clear-cutting and new planting (number of unstable grids: 216,606), and (c) 20 years after new planting (number of unstable grids: 178,157).

Figure 10.
Changes in the number of unstable grids according to slope-stability analysis over time (after Japanese cedar stump-cutting and new planting up to 50 years).
Figure 10.
Changes in the number of unstable grids according to slope-stability analysis over time (after Japanese cedar stump-cutting and new planting up to 50 years).

Disclaimer/Publisher’s Note: The statements, opinions and data contained in all publications are solely those of the individual author(s) and contributor(s) and not of MDPI and/or the editor(s). MDPI and/or the editor(s) disclaim responsibility for any injury to people or property resulting from any ideas, methods, instructions or products referred to in the content. |
© 2023 by the authors. Licensee MDPI, Basel, Switzerland. This article is an open access article distributed under the terms and conditions of the Creative Commons Attribution (CC BY) license (https://creativecommons.org/licenses/by/4.0/).
Share and Cite
MDPI and ACS Style
Okada, Y.; Cai, F.; Kurokawa, U. Changes in Slope Stability over the Growth and Decay of Japanese Cedar Tree Roots. Forests 2023, 14, 256. https://doi.org/10.3390/f14020256
AMA Style
Okada Y, Cai F, Kurokawa U. Changes in Slope Stability over the Growth and Decay of Japanese Cedar Tree Roots. Forests. 2023; 14(2):256. https://doi.org/10.3390/f14020256
Chicago/Turabian StyleOkada, Yasuhiko, Fei Cai, and Ushio Kurokawa. 2023. "Changes in Slope Stability over the Growth and Decay of Japanese Cedar Tree Roots" Forests 14, no. 2: 256. https://doi.org/10.3390/f14020256
Note that from the first issue of 2016, this journal uses article numbers instead of page numbers. See further details here.